1. Introduction
Understanding hydrological systems at the scale of large watersheds and river basins is critically important to society when faced with concerns about the availability and quality of water resources or with extreme weather events (e.g., flood or drought). Climate change, together with human activities such as deforestation, urban development, and unregulated sewage discharge, are further complicating the prediction of watershed-scale processes by placing additional uncertainty on future water resource conditions. In an attempt to answer the numerous important questions posed by the hydrological community, a large number hydrological models have been devised to simulate the hydrological cycle, investigate cause–effect relationships at various spatial and temporal scales, and help in decision-making to find solutions for better watershed protection and management [
1,
2,
3,
4]. However, it is considered that these models have not yet been applied to their full potential in terms of watershed management and policy-making [
5,
6]. There are many factors that could contribute to this lack of use. For example, most of these hydrological models were originally developed as research tools and usually involve complex structures and interfaces and sophisticated operative procedures. Therefore, applications of these models may require tremendous efforts.
To address above issues, it is common practice to create watershed management systems that substantially simplify the sophisticated interfaces and operative procedures of existing models through an encapsulating process. Based on well-established hydrological models, such systems can effectively relieve watershed managers and/or policy makers from tedious and complex modeling tasks. Web-based modeling environments are especially desirable for integrated water resource research and management, as they provide an interactive, fast, flexible, and platform-independent technique that is easy for users to access and operate from anywhere with an Internet connection and web browser. Therefore, many concurrent efforts related to hydrological modeling reflect a trend of cyber-enabled solutions [
7]. These include the development of web-based decision support systems for use in integrated water resource management [
8]; the development of sensor observation management system for flood protection [
9], the assessment of environmental quality [
10]; analyzing the consequences of various policy alternatives for a large international river [
11]; supporting decision-making regarding the hydrological impacts of water quantity and quality resulting from land use change [
12]; the development of web services to support high-performance parallel computing for model execution, optimization, and output visualization [
13,
14]; the development of web-based tools for accessing and processing geospatial and remote-sensing datasets to feed into hydrological models [
15,
16]; and the development of web-based infrastructure to model simulation results and provide sophisticated scenario testing capabilities for research and water-quality planning [
16,
17]. While these efforts greatly enhance the abilities of watershed managers and policy-makers to achieve better watershed management, they possess some inadequacies which need to be resolved. For example, some of these solutions incorporate relatively simple environmental models; while some are built upon commercial software. However, most importantly, these systems are designed for dedicated applications, and do not extend to free or open-source solutions; therefore, it is less possible to apply these systems to other regions. In addition, there are no web-based watershed management tools that can be used to simultaneously investigate individual and combined impacts of climate change, land use change, and point-source pollutants using SWAT model (to the best of our knowledge).
Besides such individual and dedicated-purpose efforts, many generic web-based or web-service-based platforms and scientific gateways have been developed for the sharing and publishing of data, tools, and models. In contrast to dedicated-purpose works, these platforms and scientific gateways usually provide functionalities and cyber infrastructure to share data, tools, and models, both amongst collaborators on a project and with the broader research community [
18]. For example, the Consortium of Universities for the Advancement of Hydrologic Science, Inc. (CUAHSI) established the Hydrologic Information System (CUAHSI-HIS; [
19,
20]) for publishing time-series data on the Internet in a standard format called Water Markup Language. Tarboton et al. [
20] implemented a web-based hydrological information system, called HydroShare, for collaborative data collection, management, analysis, publication, and searching. Additionally, Jin et al. [
21] developed a prototype web-based platform that enables researchers to archive and upload agent-based model output data and analysis methods to perform reproducible and reparametrizable data analysis. Wen et al. [
22] proposed a model-service deployment strategy, which allows modeling participants to conveniently work together and make full use of geo-analysis models and computational resources across an open web environment. Furthermore, extending the Dublin Core metadata framework, Morsy et al. [
23] proposed a general approach for representing metadata from environmental models within the HydroShare system to assist in the sharing, publication, reuse, and reproducibility of models. Rajib et al. [
24] developed a prototype cyber infrastructure, called SWATShare, for the sharing, execution, and visualization of the Soil and Water Assessment Tool (SWAT) in a web-based environment. While publishing and sharing models through a web-based interface are common features of these projects, only a few of them support the cyber-enabled execution of distributed hydrological models; additionally, they generally do not allow the user to set up scenarios or perform model simulation, nor do they assist in decision making.
Developing any of the aforementioned systems or platforms would require considerable time, effort, and resources. An open-source framework that the user can employ and adjust to cater to their own demands for watershed management and decision making would greatly assist in reducing the amount of duplicated efforts. For example, in 2016, the central government of China launched an initiative urging local authorities to establish river basin management information systems to protect environmental degradation. Since then, many parallel efforts have been started in response to this initiative. Most of the ongoing projects share some common user requirements for water management and decision making. Thus, we believe that an open-source web-based framework that is able to link with hydrological models will be of great help in reducing task duplication during the establishment of such systems. Additionally, this framework may also provide some useful information (e.g., the use of SWAT editor to set up climate change scenarios) for these generic platforms to further enhance the ability of watershed managers and policy-makers to achieve better watershed management.
In this study, we implemented a web-based open-source framework that links with SWAT, named WOF-SWAT (web-based open-source framework for SWAT). WOF-SWAT characterizes on following aspects: (1) it provides an open-source platform that the users can directly use as or extend to comprehensive watershed management tool; and to the best of the authors’ knowledge, (2) it is the first web-based watershed management tool for investigating individual and combined impacts of climate change, land use change, and point-source pollutants using SWAT model. We describe and discuss details of the workflow, interfaces, and key processes of the proposed WOF-SWAT framework. Then, using a previously developed and well-calibrated hydrological model of the Jinjiang River basin, four scenarios were simulated in WOF-SWAT and other traditional desktop-based tools (i.e., ArcSWAT [
25] and SWAT-CUP [
26]) to examine the credibility, efficiency, and functionality of WOF-SWAT.
2. Materials and Methods
2.1. Soil and Water Assessment Tool (SWAT)
SWAT is an open-source, distributed, physical-based hydrological model developed by the Agricultural Research Service of the US Department of Agriculture to simulate water, sediment, and agricultural chemical transport at river-basin scale. In SWAT model, the spatial heterogeneity of the important physical properties of the watershed is delineated by first partitioning a basin or watershed into sub-basins; then further partitioning each sub-basin into hydrologic response units (HRUs) based on the land use map, soil type map, and topography map. The hydrology processes simulated by SWAT can be divided into two major divisions: land phase and routing phase. The land phase first calculates fluxes of water, sediment, nutrients, and pesticides to the main channel in each sub-basin. Major hydrology processes of this phase include evapotranspiration, canopy storage, infiltration, surface runoff, and sub-surface runoff. The routing phase estimates the movement of such as water and sediment, through the main channel to the sub-basin outlet.
2.2. WOF-SWAT Architecture
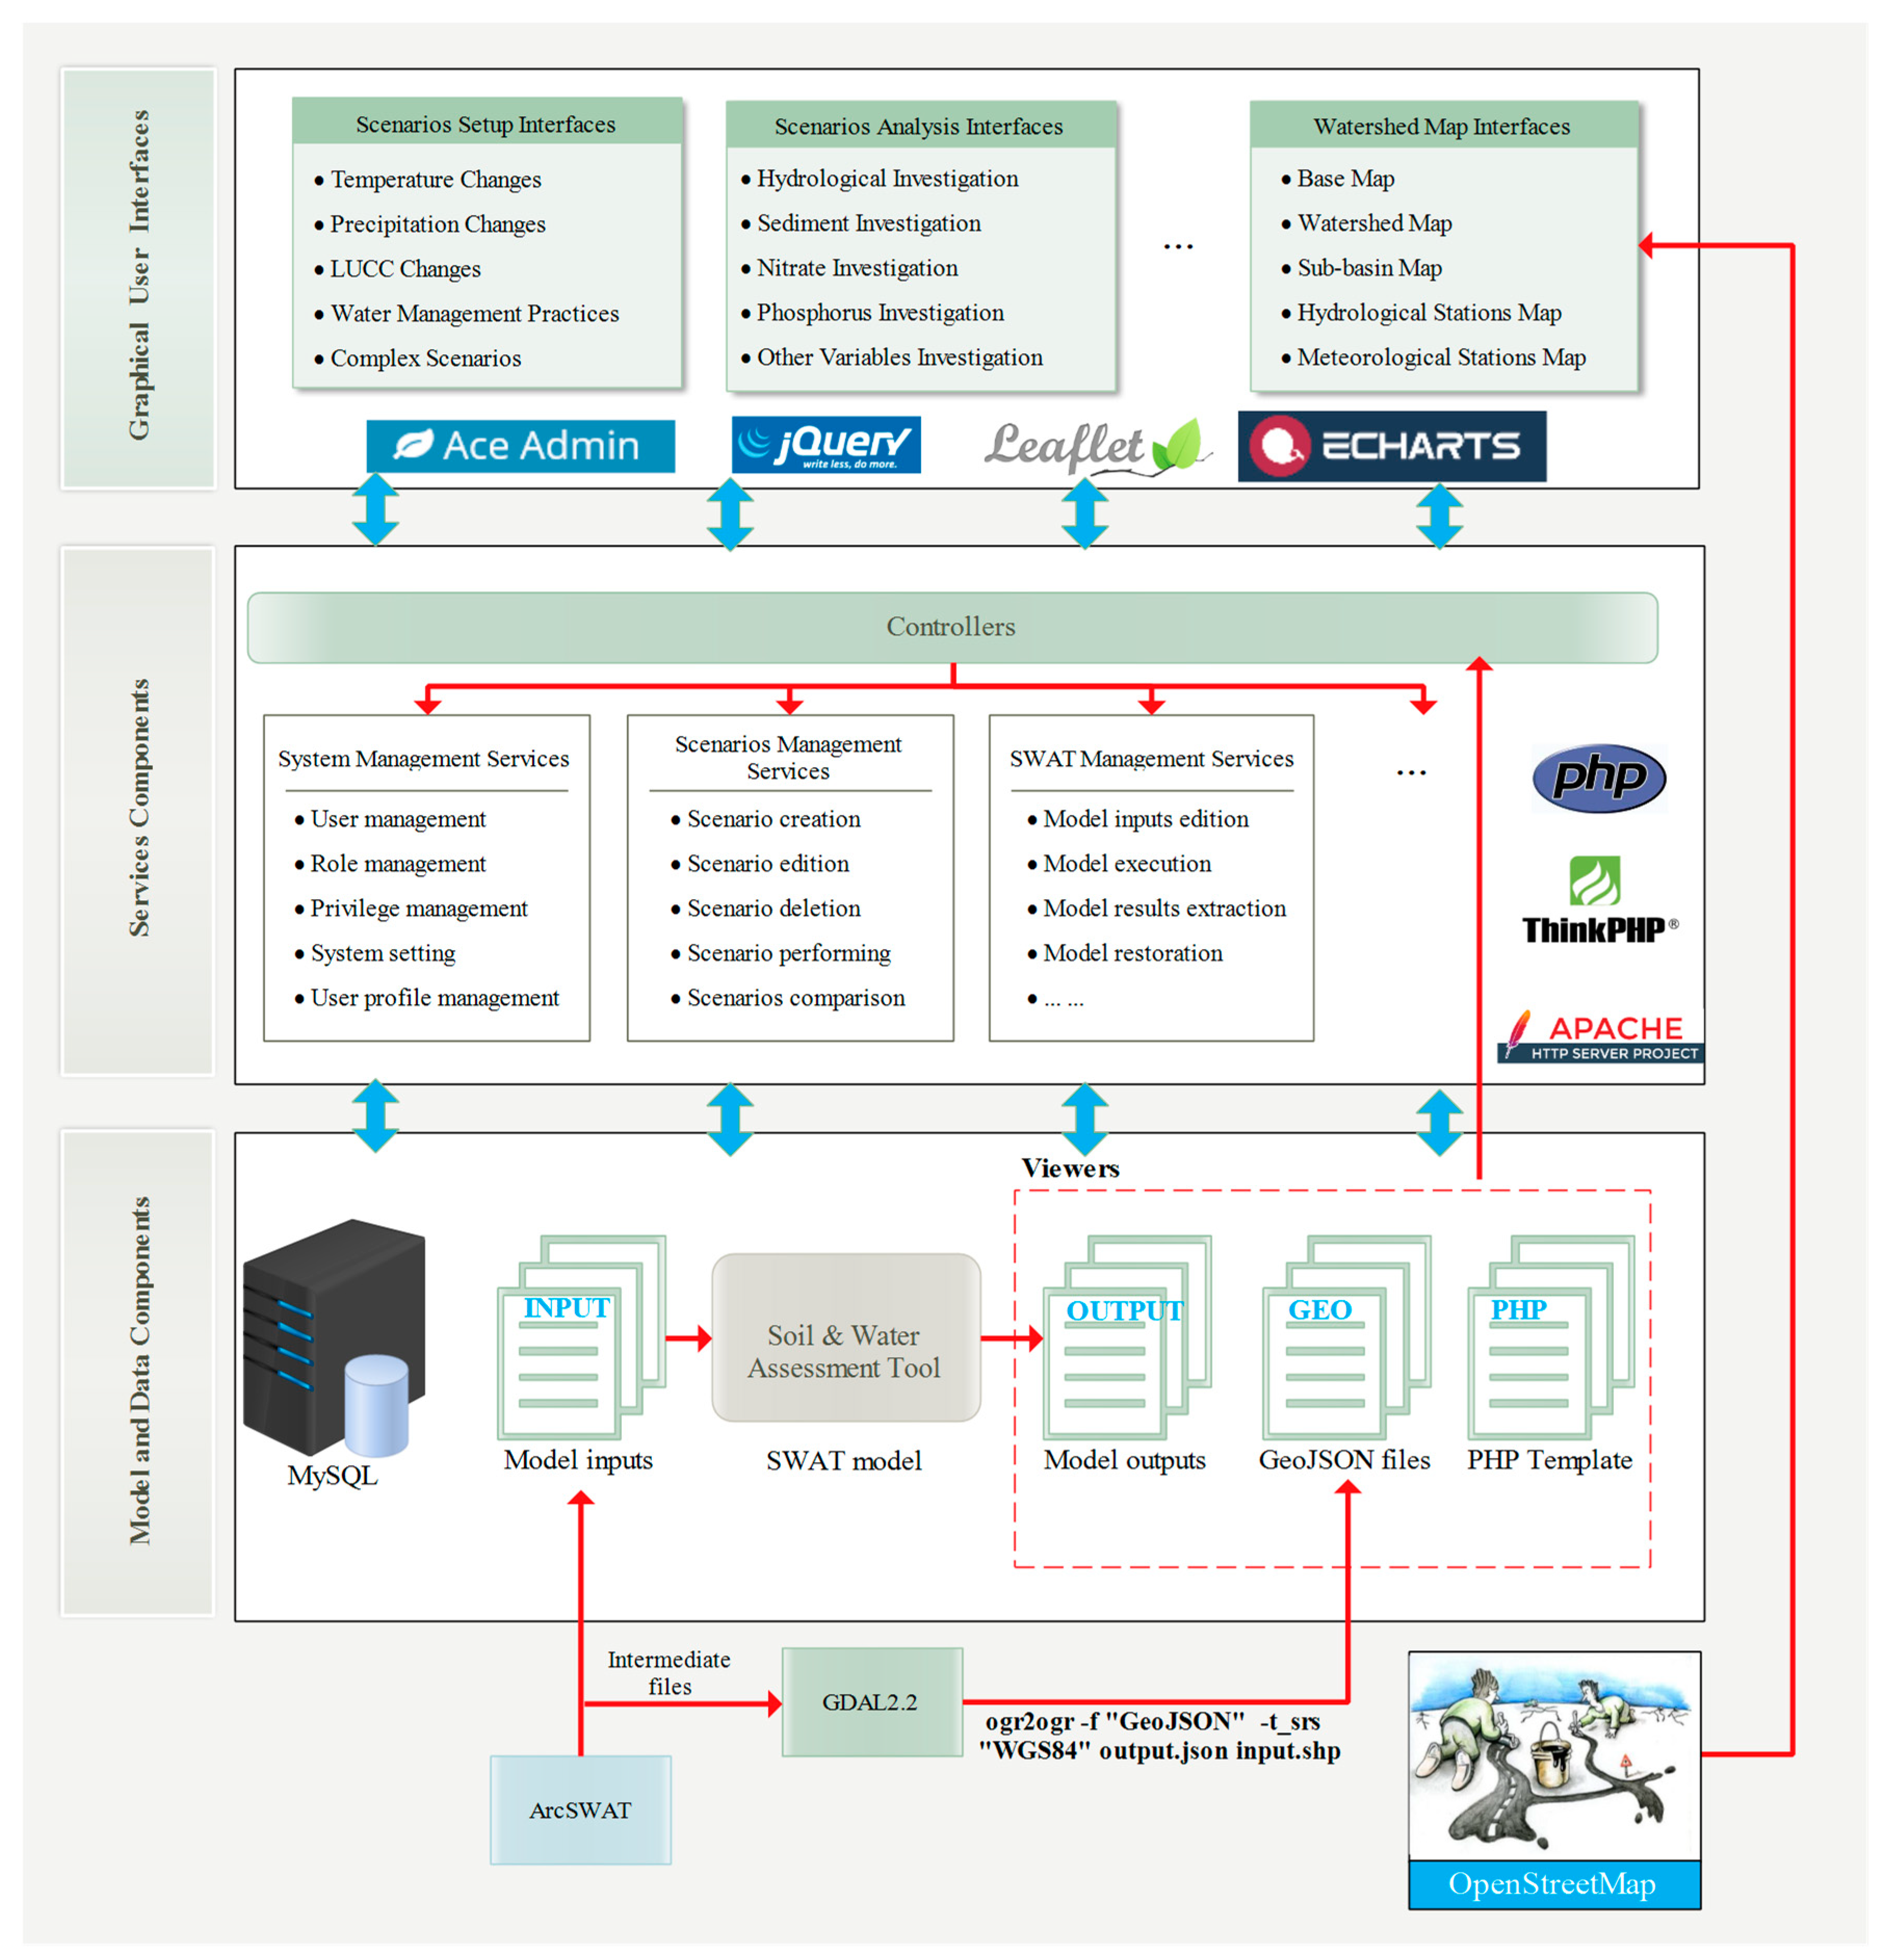
Ease of use is the most essential requirement for a watershed management system. Additionally, being open source and lightweight are also basic requirements to assist the user community of such systems. The system architecture of the WOF-SWAT framework is outlined in
Figure 1. The workflow for this framework can be separated into three tiers. The first is the presentation tier, which provides interactive graphical user interfaces (GUIs) for users to simulate watershed management practices (e.g., create and execute management scenarios and visualize the results of the scenario execution). The second tier is the services tier. In this tier, information output from the first tier is entered into a database, and services such as editing model inputs and invoking models are also provided. The final tier is the database and model tier, in which information related to watershed management practices and hydrological models are stored. Details of these tiers will be elucidated in the next three sections.
The first tier provides GUIs for the user to manage scenarios, visualize scenario execution results, and perform other system management routines (e.g., user and privilege managements). This tier is a conglomeration of multiple open-sources libraries, resources, and technologies, including Ace Admin, jQuery, Leaflet, and Apache ECharts [
27]. The Ace Admin and jQuery libraries, which provide lightweight, feature-rich, and easy-to-use templates and widgets, are used to create the overall layout of the watershed management system. Leaflet is an open-source lightweight JavaScript map library (about 38 KB) and possesses all of the mapping features that most developers need for creating mobile-friendly interactive maps. In this tier, a map viewer is implemented via Leaflet to present watershed maps, which include a base map, watershed boundaries, sub-basins, streams, and meteorological and hydrological gauges. The base map is obtained from OpenStreetMap (OSM), a volunteered geographical information service that provides free editable maps from all over the world. Other maps are all in GeoJSON format, which are converted from Shapefiles via the Geospatial Data Abstraction Library (GDAL) tool. Compared with traditional mapping solutions, which usually rely on a web-based map server (e.g., GeoServer and MapServer for open-source solutions and ArcGIS Server for commercial solutions), the combination of Leaflet and these map resources is a more lightweight solution. Apache ECharts is a charting and data visualization JavaScript library which provides a powerful, interactive charting and data visualization library and framework for web browsers, mobile apps, and backend usage. In the first tier, Apache ECharts is used to visualize time-series of scenario execution results.
The second tier provides services for users to perform tasks such as creating scenarios, projecting scenario settings into model inputs, invoking models, and retrieving model results. This tier acts somewhat like a translator or coordinator. For example, when the user wishes to create or edit a scenario, they submit the scenario information to the second tier via the HyperText Transfer Protocol (HTTP), and once the scenario service provided in the second tier receives the request, it properly organizes the scenario information and saves this information to the database in the third tier. Hypertext Preprocessor (PHP), a popular general-purpose scripting language that is especially suited to web development, was selected to implement these services since it is an efficient program language yet is also easy to learn. This tier also adopts the model–view–controller (MVC) design pattern provided by the ThinkPHP framework to allow for efficient code reuse, code maintenance, and parallel code development. This tier is served via the Apache HTTP Server and PHP Interpreter.
The third tier serves as a data storage tier, where structural information, model inputs and outputs, and other files are stored. MySQL, an open-source relational management system (RDBMS), was employed to manage structural data (e.g., the scenario, users, roles, and privilege records). A watershed model (with inputs) is also provided in this tier. When a scenario is modeled, the scenario setting is projected into the model inputs in this tier, and model outputs are generated via a model run. Other files, such as Cascading Style Sheets (CSS), JavaScript, PHP, and GeoJSON—which consist of the GUIs—are directly saved in the file system. This tier also resides on the Apache HTTP Server.
2.3. WOF-SWAT Implementation
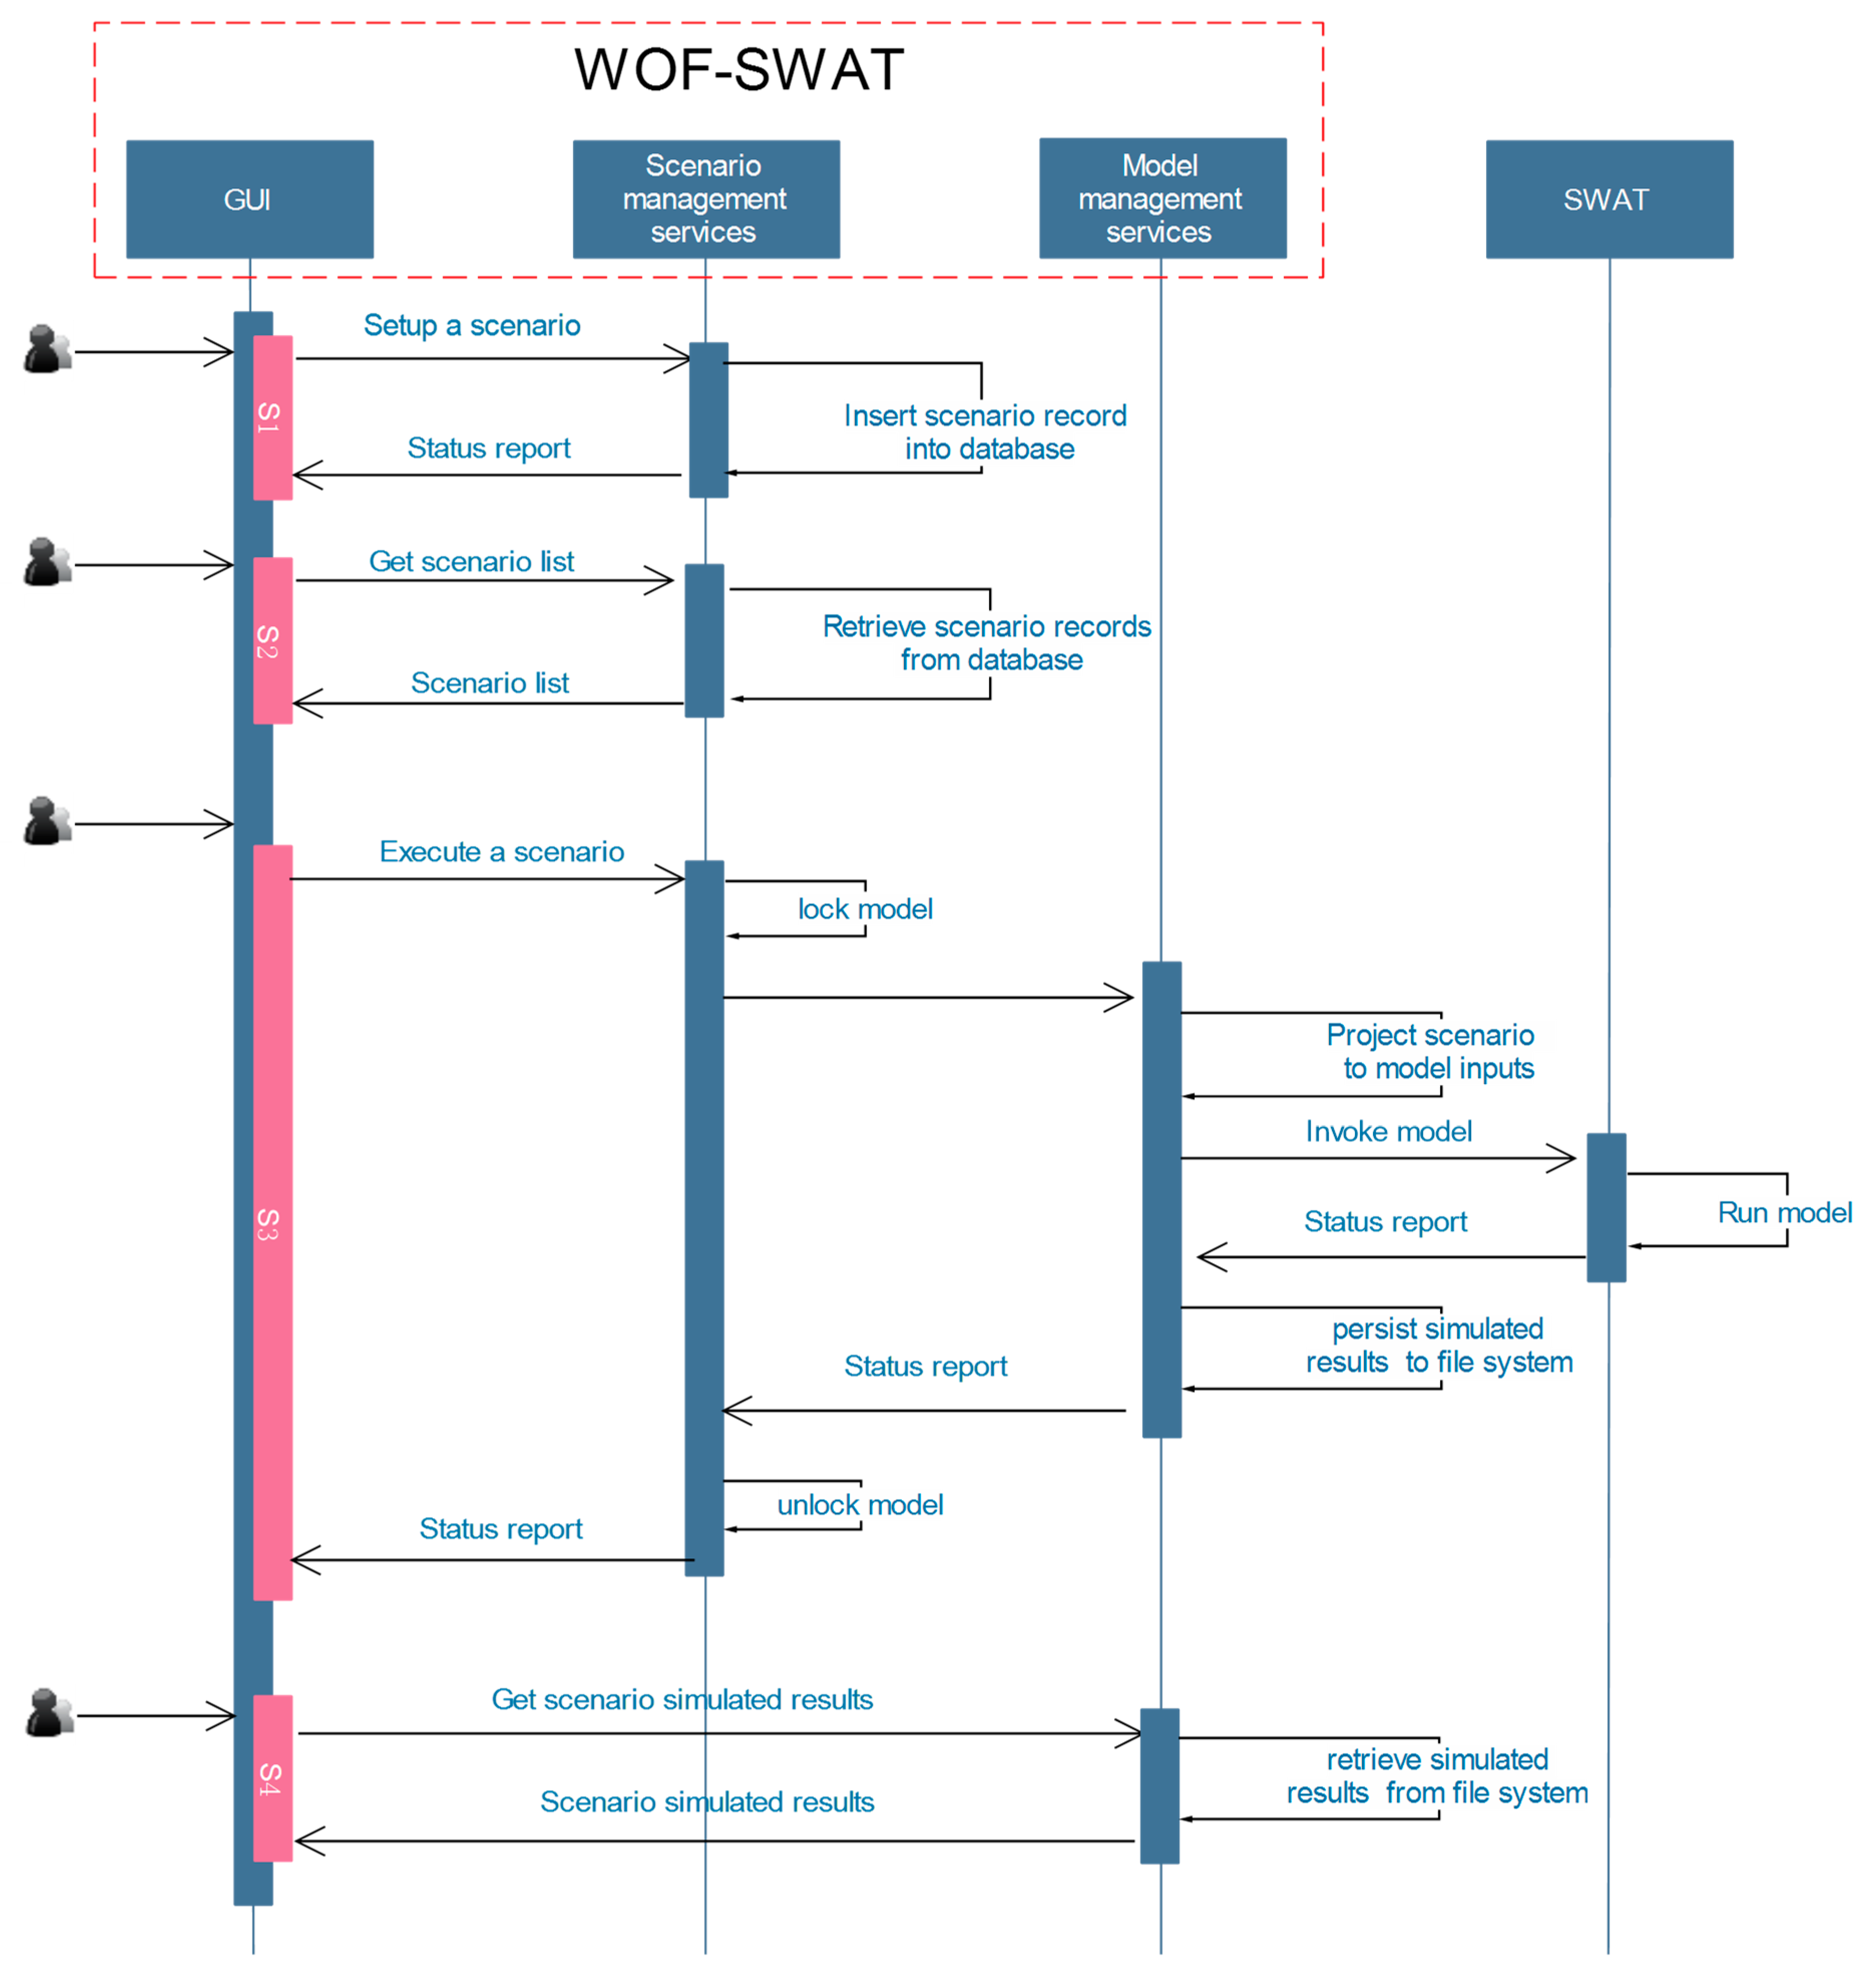
A typical workflow for scenario execution in WOF-SWAT is shown in
Figure 2. This workflow is composed of four phases: scenario creation, listing, execution, and visualization. In the first phase (S1), the user fills in the scenario setting form and submits the scenario creation request to server; the scenario management service residing in the second tier receives the request and then enters the scenario setting into the database in the third tier. In the second phase (S2), the user issues a request to retrieve all available scenarios; once the scenario management service receives this request, it retrieve all scenario records and returns these records to the client. In the third phase (S3), the user selects a scenario and issues a scenario execution request to the server; when the scenario management service receives this request, it requests a model execution lock from the database. The subsequent processes are allowed to proceed only when this lock is secured so as to prevent simultaneous model execution (the later simulation can overwrite the results of former one); otherwise, the scenario management service waits one second before it issues another request to obtain the model execution lock. These processes will continue until the model execution lock is obtained. Once the model execution lock is acquired, the Model Management Service is invoked to project the scenario setting into the model inputs (details of the processes will be discussed later) and execute the hydrological model. When the scenario management service receives the signal indicating the completion of the model execution, it releases the model execution lock. In the fourth phase (S4), the scenario execution results (time-series of model variables) are visualized with Apache ECharts.
WOF-SWAT is licensed under GNU General Public License, version 2, which means that users are allowed to change the software or use pieces of it in new free software. It is currently available at
https://github.com/djzhang80/WOF-SWAT. Currently, WOF-SWAT is only operational on Microsoft Windows Operating System. WOF-SWAT can be easily applied to other watershed. To apply this framework, a pre-built model should first be put in a directory in the same host of WOF-SWAT where WOF-SWAT can access; and then users are required to enter some meta-data about the pre-built model, such as the directory path of the model, number of sub-basins, hydrological stations. Details of the key processes in the workflow will be elaborated through
Section 2.3.1,
Section 2.3.2 and
Section 2.3.3.
2.3.1. Scenario Setup Interfaces
As WOF-SWAT was designed to be easy to use, in the interfaces, almost all of the SWAT-related complexity is isolated from the user. Currently, WOF-SWAT allows the user to create scenarios of climate change (temperature and precipitation changes), point-source pollutants, land use change, and combinations of any two or three of the basic scenarios.
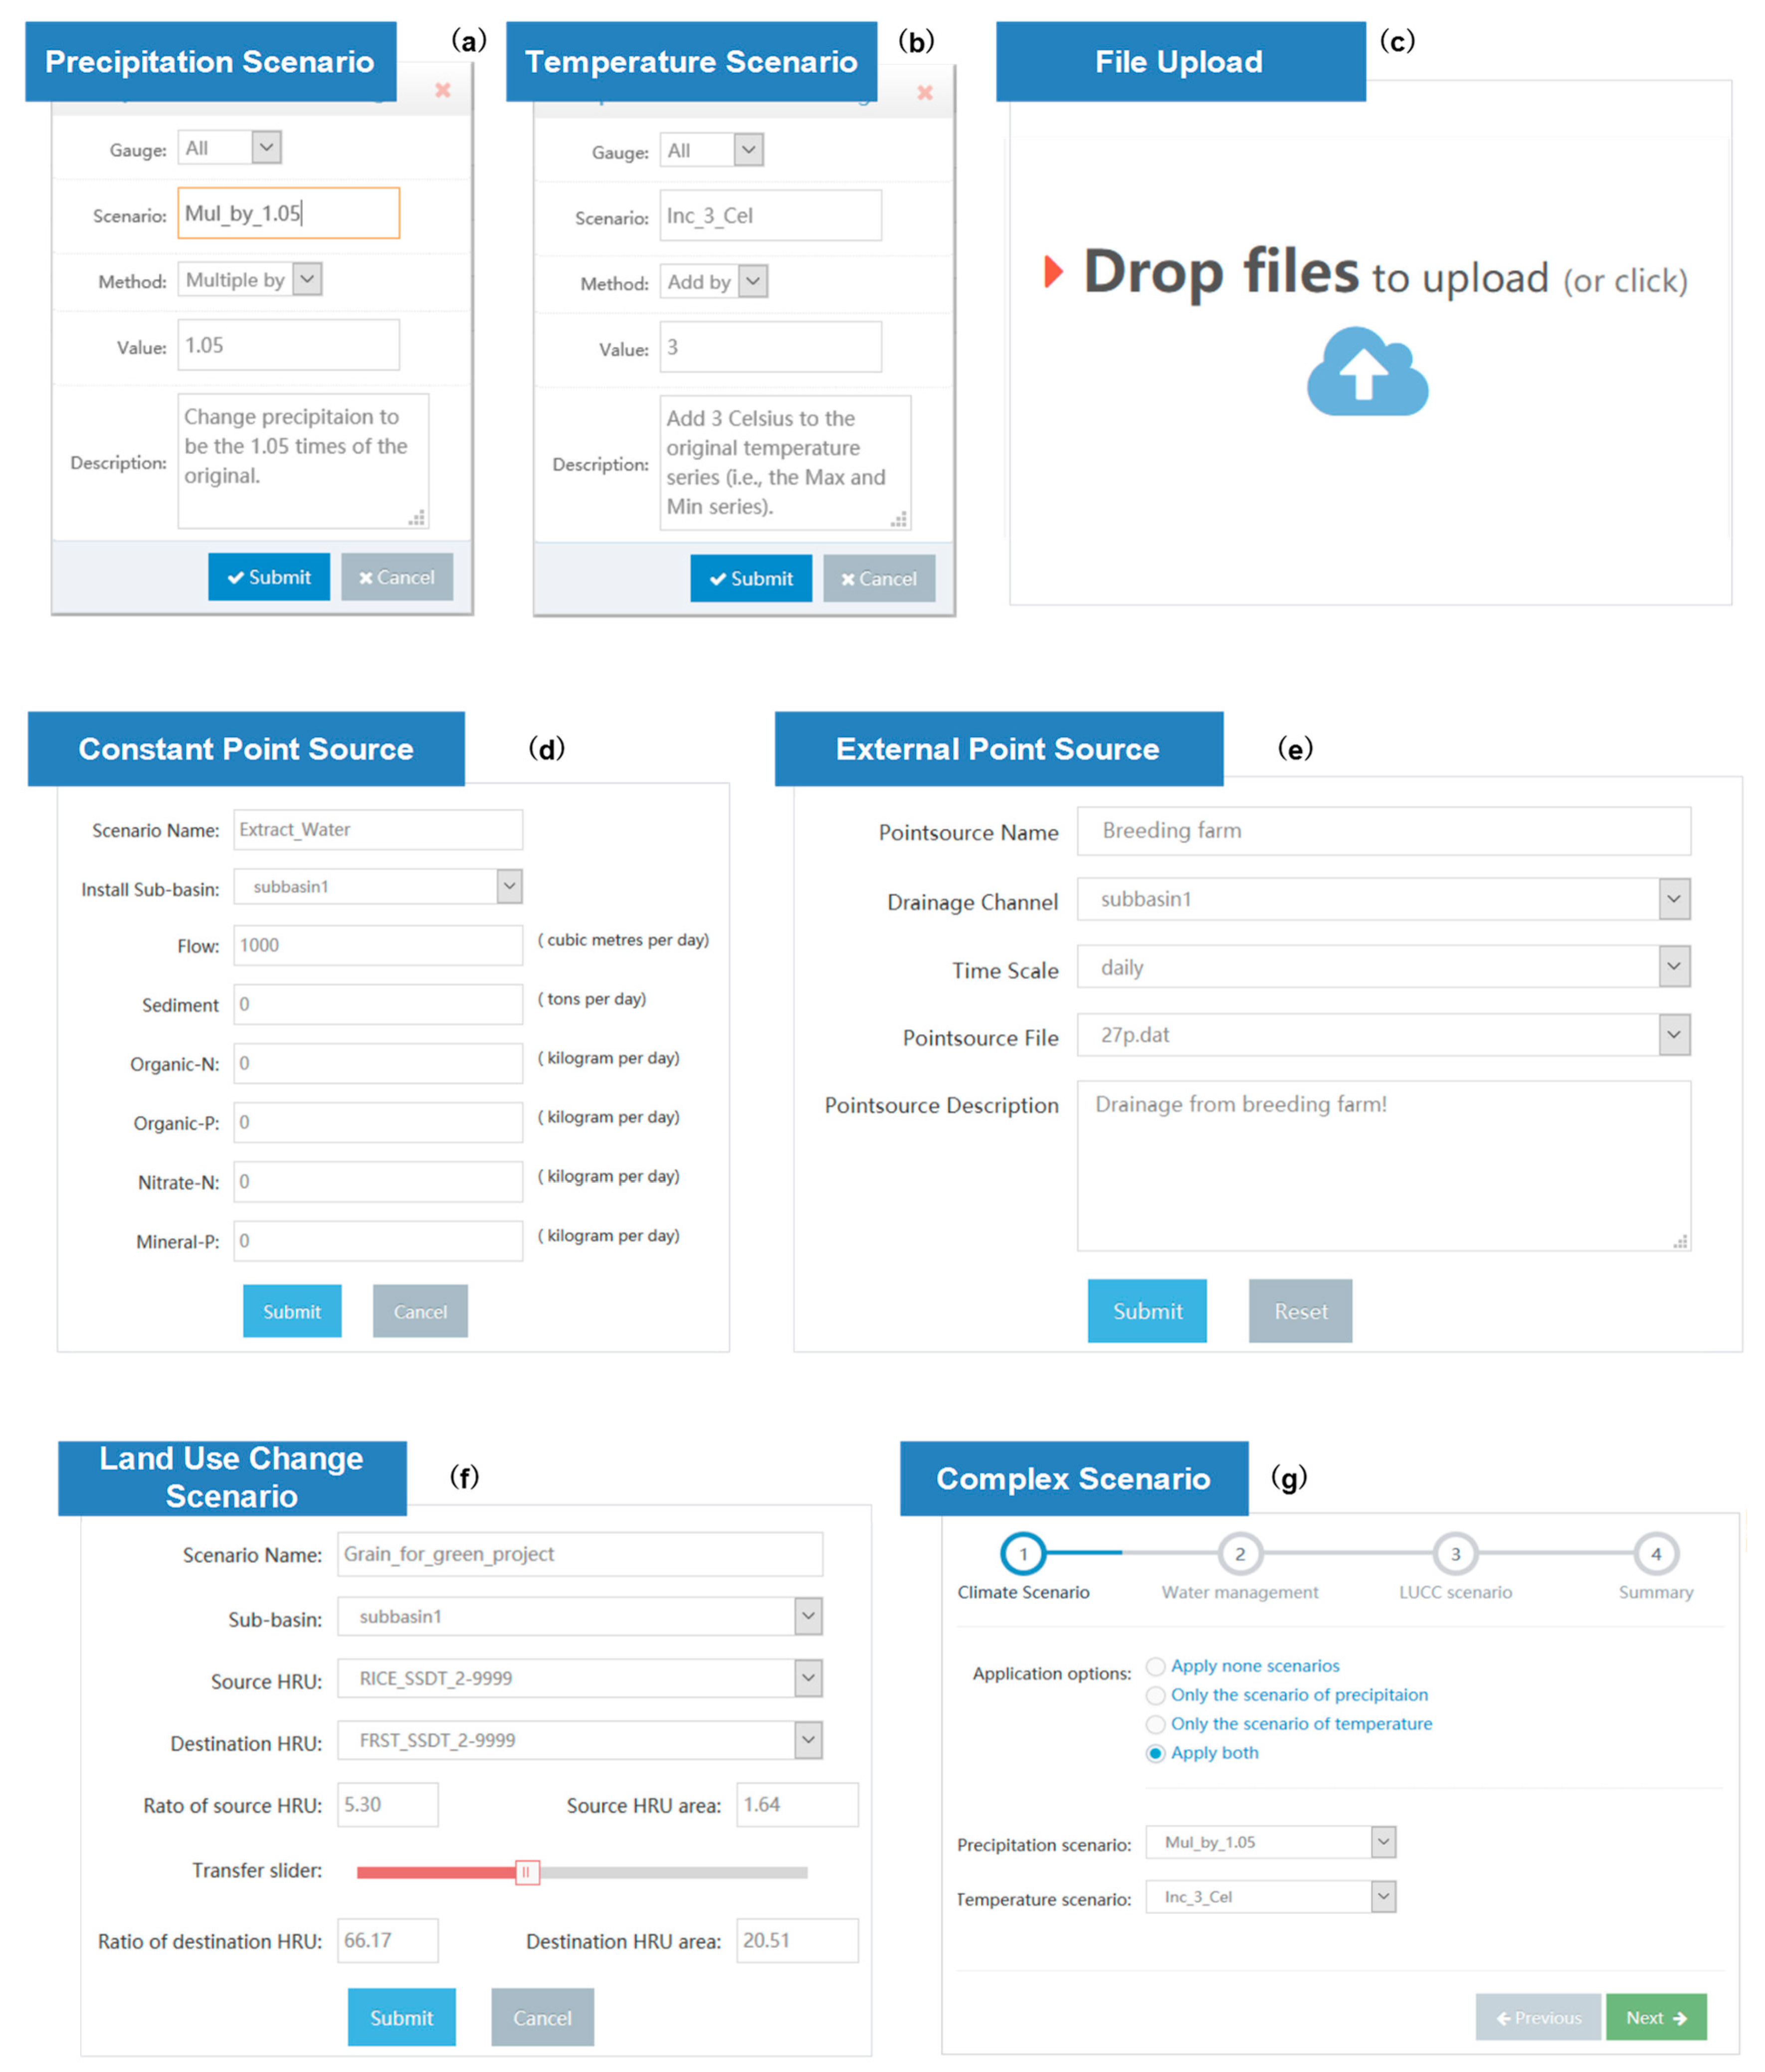
Figure 3a,b shows the interfaces for setting up precipitation and temperature change, respectively. The interface for precipitation change scenarios is similar to that for temperature change scenarios; both have options for selecting meteorological station(s) and for changing the method. The variable (i.e., precipitation or temperature) is simulated by either adding a constant or multiplying by a factor.
Figure 3c shows the interface for creating a constant point-source pollutant. This interface gives the user the option to select the drainage channel and input fields to determine the amounts of water and pollutants (e.g., organic and mineral nitrogen) that are drained into the selected channel. For circumstances in which users may wish to create more complex precipitation, temperature, and point-source pollutant scenarios (e.g., users may wish to create a point-source pollutant that varies on a daily basis or simulate precipitation that varies disproportionately in different seasons), WOF-SWAT provides the user with file templates to download as well as an interface for users to upload complex scenario settings (
Figure 3d) that can be created and edited with external tools based on the templates. These uploaded files then can be linked to certain scenarios (e.g., a point-source pollutant can be created based on the uploaded point-source file “27p.dat”, as shown in
Figure 3e).
The land-use and land-cover change (LUCC) scenarios are simulated by converting the area of one HRU to another HRU within a sub-basin. WOF-SWAT provides an interface (
Figure 3f) for the user to perform this task. In this interface, users are prompted to select a source and target HRU for the conversion. The conversion area from one HRU to the other is automatically calculated when the user drags the transfer slider. WOF-SWAT also allows the user to investigate more sophisticated and comprehensive scenarios, which are usually created based on the aforementioned basic scenarios. Furthermore, WOF-SWAT provides a step-by-step wizard which allows the user to choose whether or not to apply certain types of scenario and which basis scenarios to use (see
Figure 3g).
2.3.2. Scenario Execution
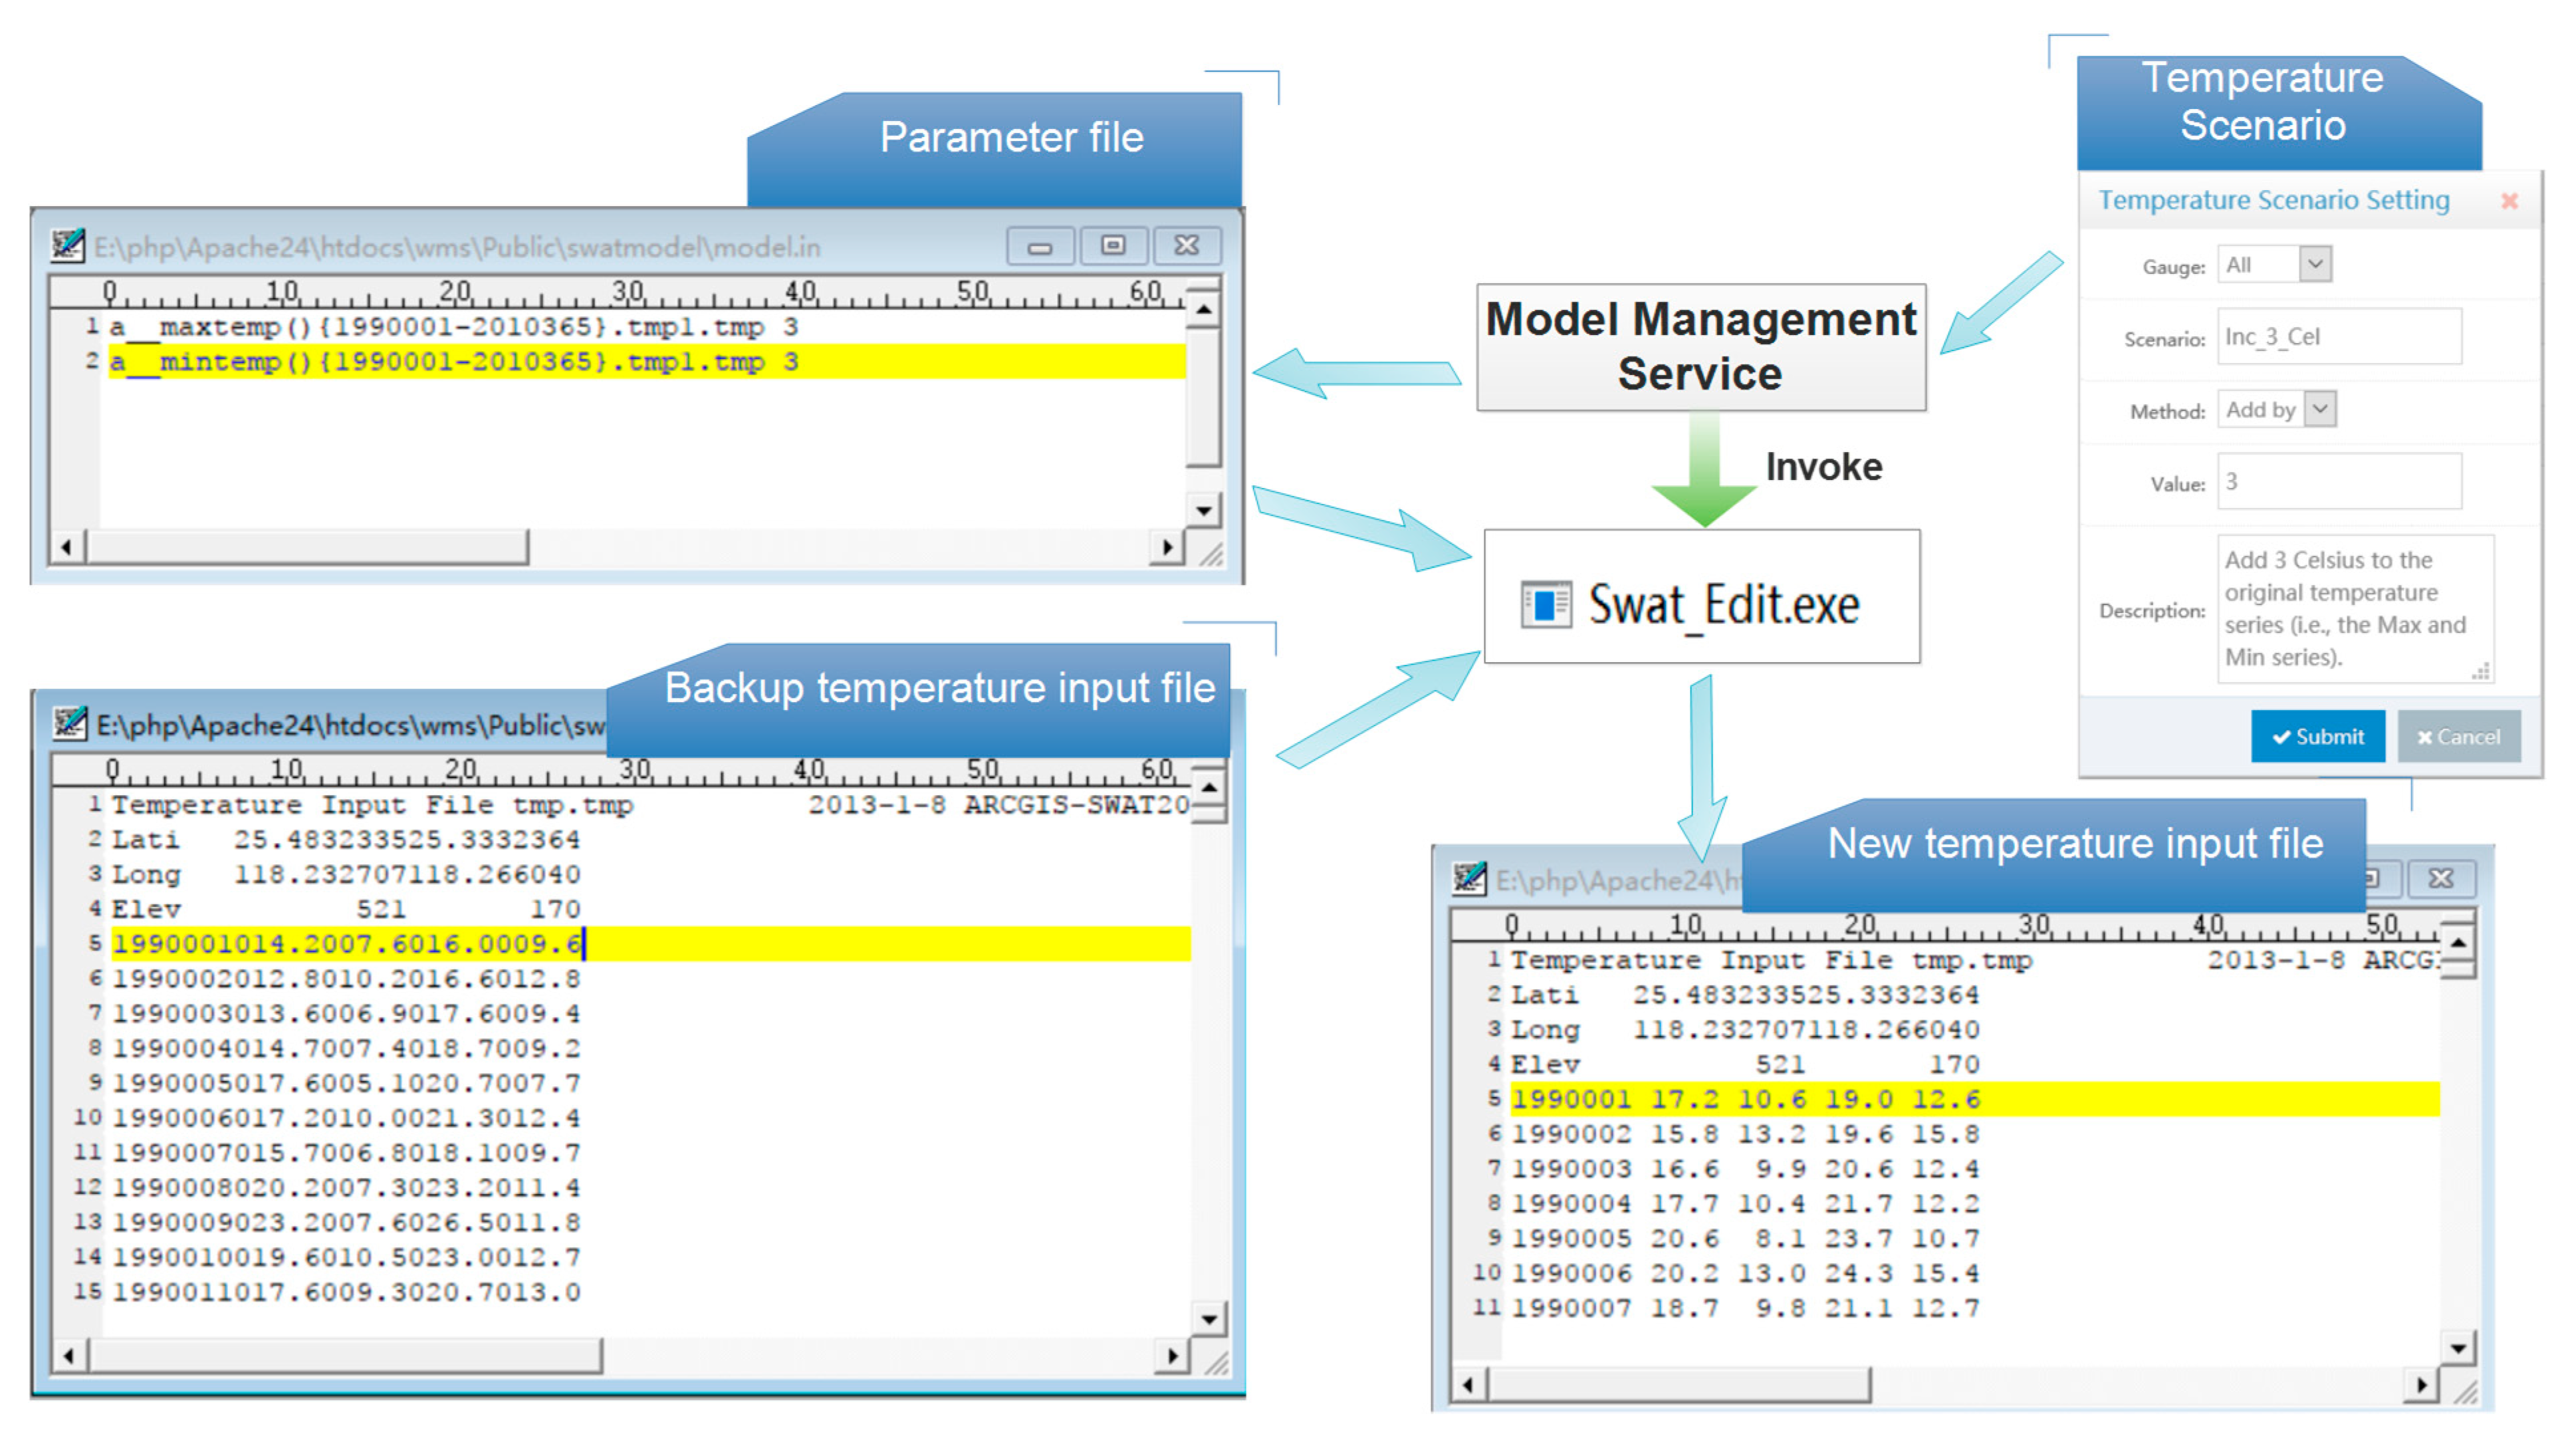
The scenario execution processes begin with projecting the scenario into model inputs. This process employs different methods depending on the type of scenario. For example, climate scenarios are projected into model inputs through a modified SWAT_edit.exe file, which is originally shipped with the SWAT-CUP and SWAT Editor [
28] to edit model parameters. SWAT_edit.exe was originally designed for execution in a desktop environment, however in the modified SWAT_edit.exe this constraint is removed, which allows it to be executed as a background process so that it can be used in a web-based environment.
Figure 4 shows how a climate change scenario (temperature increase of 3°C) is projected into model inputs using the modified SWAT_edit.exe. In the first stage, a parameterization file of SWAT_edit.exe is generated by the Model Management Service according to the climate change setting. Each line in this parameterization file consists of two parts: the parameter identifier and its value. For example, the parameter identifier in the first line of the parameterization file can be interpreted as follows: “.tmp1.tmp” specifies which file the changes are applied to, “1990001-2010365” means that the change is applied from day 1 of 1990 to day 365 of 2010, “()” means that these changes are applied to all meteorological gauges (without specifying any meteorological station numbers in the parentheses, which implies that changes are applied to all meteorological gauges), “maxtemp” means the maximum temperature, and “a__” indicates that the given value is added to the original values. For more details of the parameterization schema that is employed by SWAT_edit.exe, readers are referred to the SWAT-CUP document. Next, SWAT_edit.exe is invoked by the Model Management Service to project the climate change setting into model inputs. In this process, SWAT_edit.exe refers to the SWAT input backup to obtain the original values in case the model inputs have been changed.
The point-source pollutant and LUCC scenarios are projected into model inputs by directly editing the model inputs in the Model Management Service.
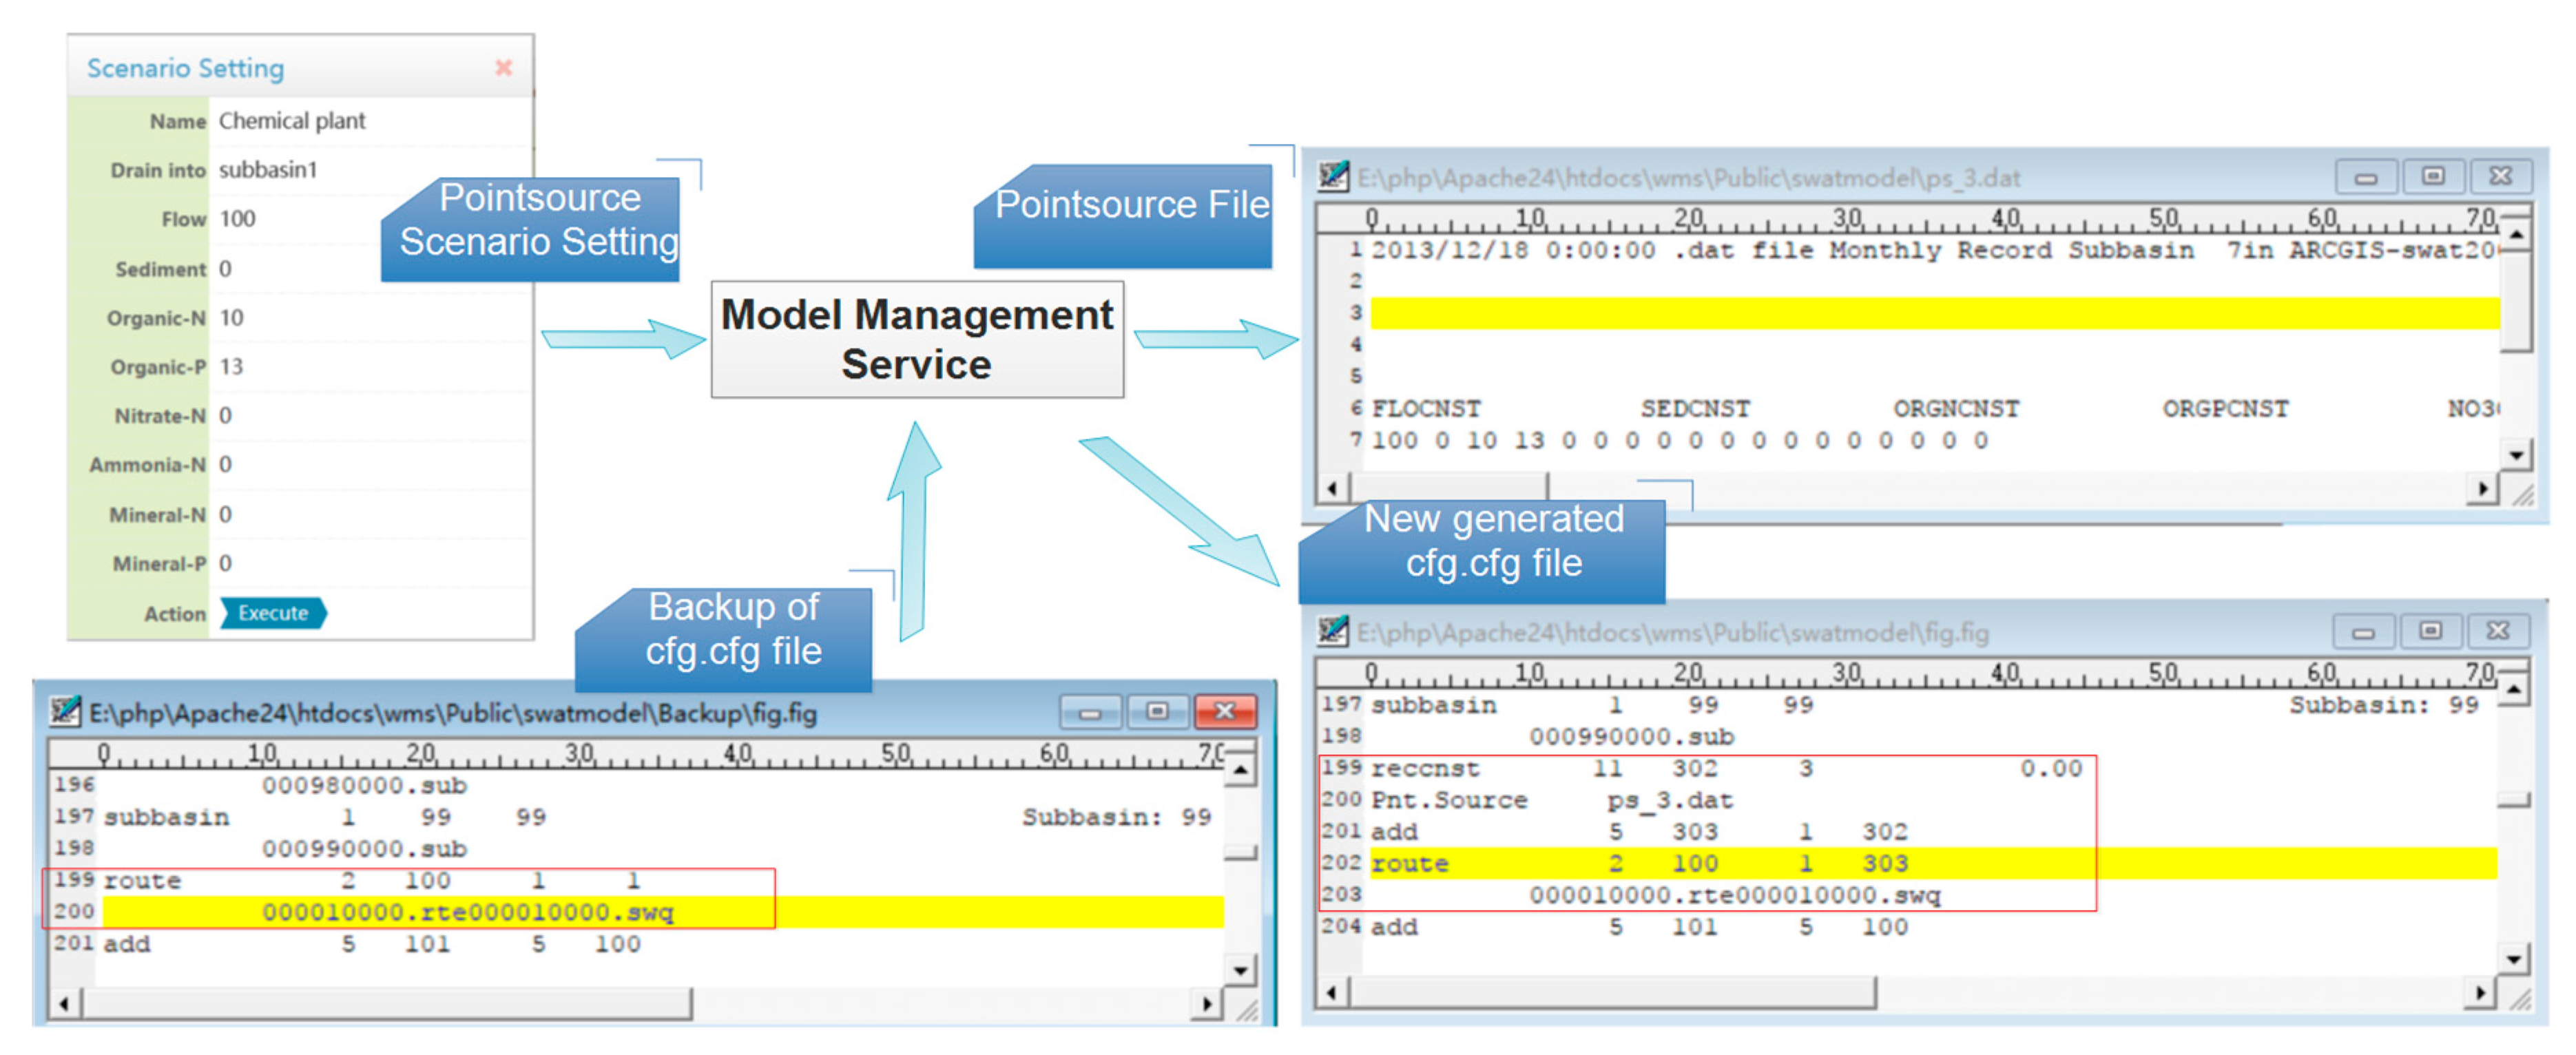
Figure 5 shows the underlying processes for creating a constant point-source pollutant. According to its setting, the Model Management Service first generates a constant point-source file and ensures that this file conforms to the specification of the constant point-source pollutant (see the SWAT input–output document for more information [
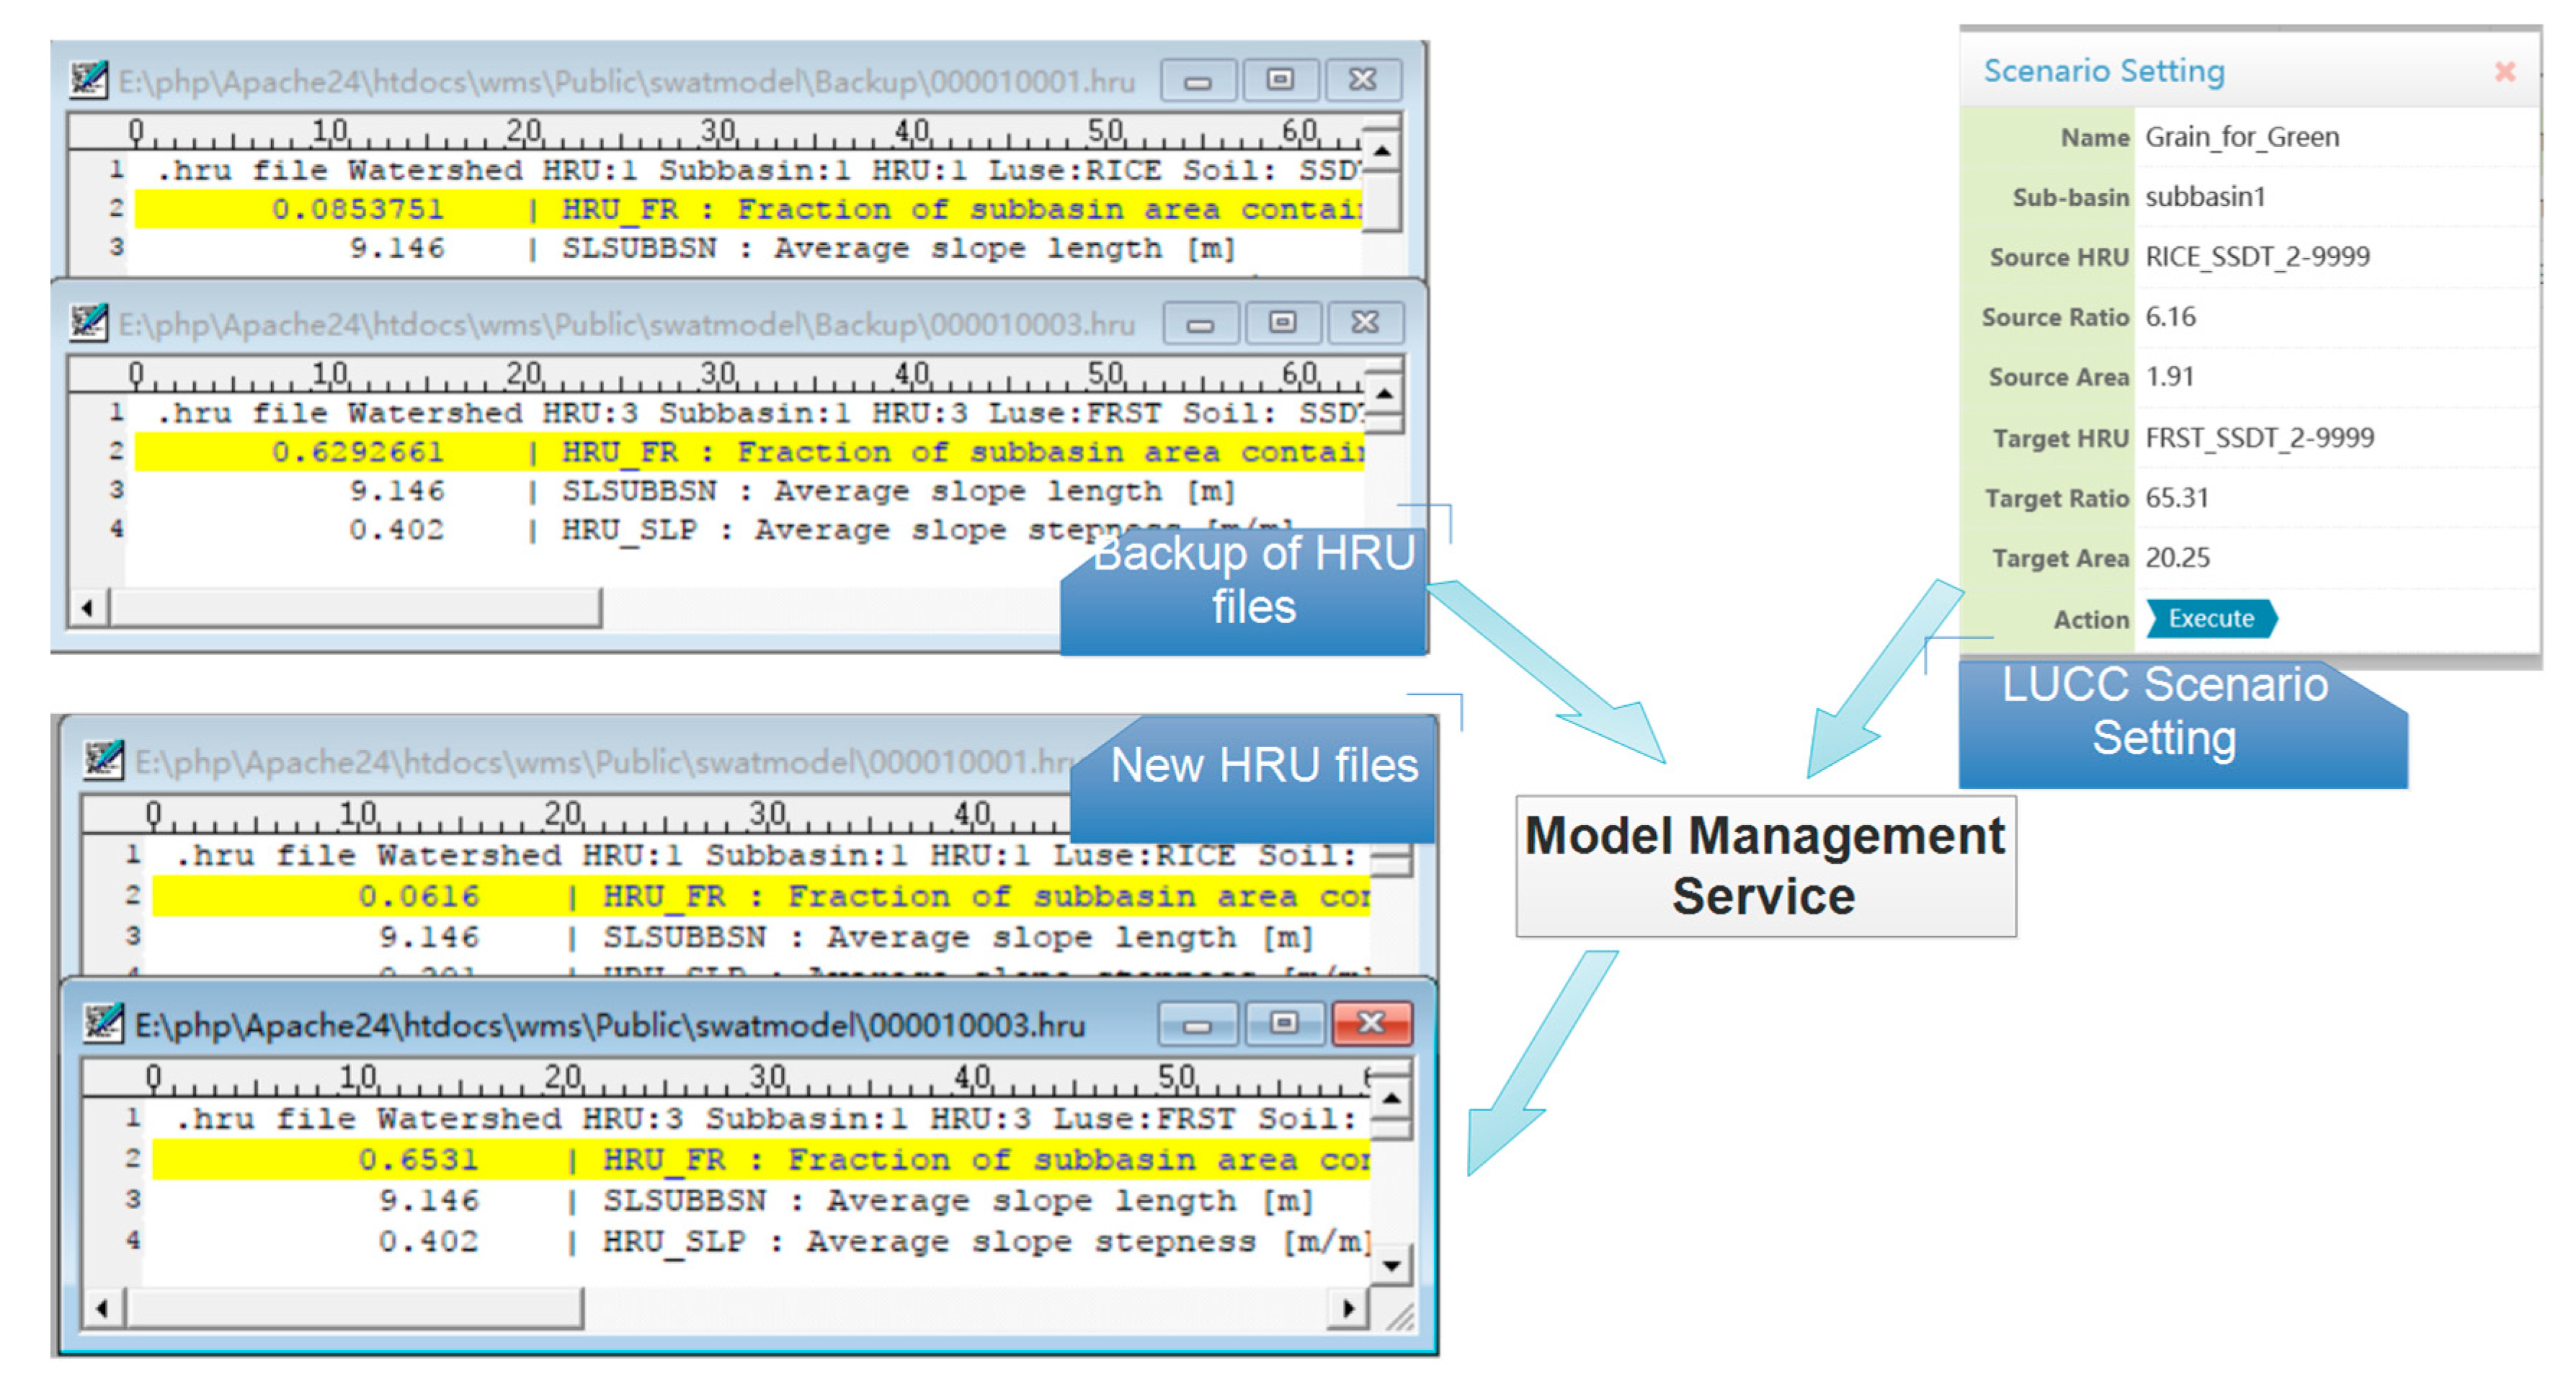
29]). Next, the Model Management Service edits the cfg.cfg file in order to incorporate this point-source pollutant into the existing model. Modifications include introducing a “reccnst” and “add” command to the existing cfg.cfg file. The “reccnst” command reads in flow, sediment, and chemical loading records from the point-source file. The “add” command is used to sum the water, sediment, and chemical loadings of any two hydrographs (in this case, the “add” command is used to sum the water, sediment, and chemical loadings of the point-source pollutant and the stream into which the point-source pollutant drains). Moreover, the Model Management Service also contains a processing mechanism to confirm that the command-line parameters or variables are consistent with the specifications of these commands. For example, the first parameter of the “reccnst” command is the hydrograph storage location number (HYD-STOR), which indicates where the computed results are stored. The Model Management Service has to confirm that this parameter should not be overlayed with any of the existing ones in the cfg.cfg file. LUCC scenarios are projected into the model input in a similar way to point-source pollutant scenarios (see
Figure 6). Taking model input backup as a reference, the source and target HRU files (*.hru) are edited according to the scenario setting—specifically, the parameter HRU_FR, which indicates the fraction of the sub-basin area contained in this HRU, is assigned a new value. The LUCC scenario can only simulate land use change between two HRUs within a sub-basin. More sophisticated LUCC scenarios are currently not supported in this version of WOF-SWAT, as this would require an extensive rebuilding of the model. Nevertheless, the current version of WOF-SWAT allows the user to upload and compare different versions of hydrological models, and it is therefore possible for the user to create more sophisticated LUCC scenarios outside of WOF-SWAT and import these scenarios into WOF-SWAT for further study.
When the model inputs are ready, SWAT is invoked by the Model Management Service through a batch file (.bat). The original outputs of the SWAT model are unstructured text files, which are not user-friendly and efficient enough to be transferred in a web-based environment and presented in browsers. SWAT calibration tools and other SWAT-related systems usually involve an additional process to extract the desired time-series from the original model outputs (e.g., SWAT-CUT). In our case, the SWAT model was tailored to generate model outputs in the JavaScript Object Notation (JSON) format, an open-standard file format. Compared with XML, JSON has more advantages as it is native to JavaScript and thus is easier to interface with JavaScript-based technologies (for example, the charting library we adopted in this study). The model results are transferred to browsers using Asynchronous JavaScript and XML (AJAX) technology. Using AJAX, WOF-SWAT allows data to be transferred from and to a server asynchronously without interfering with the display and behavior of the existing page, and also allows content to be dynamically updated without reloading the entire page.
2.3.3. Visualization of Results
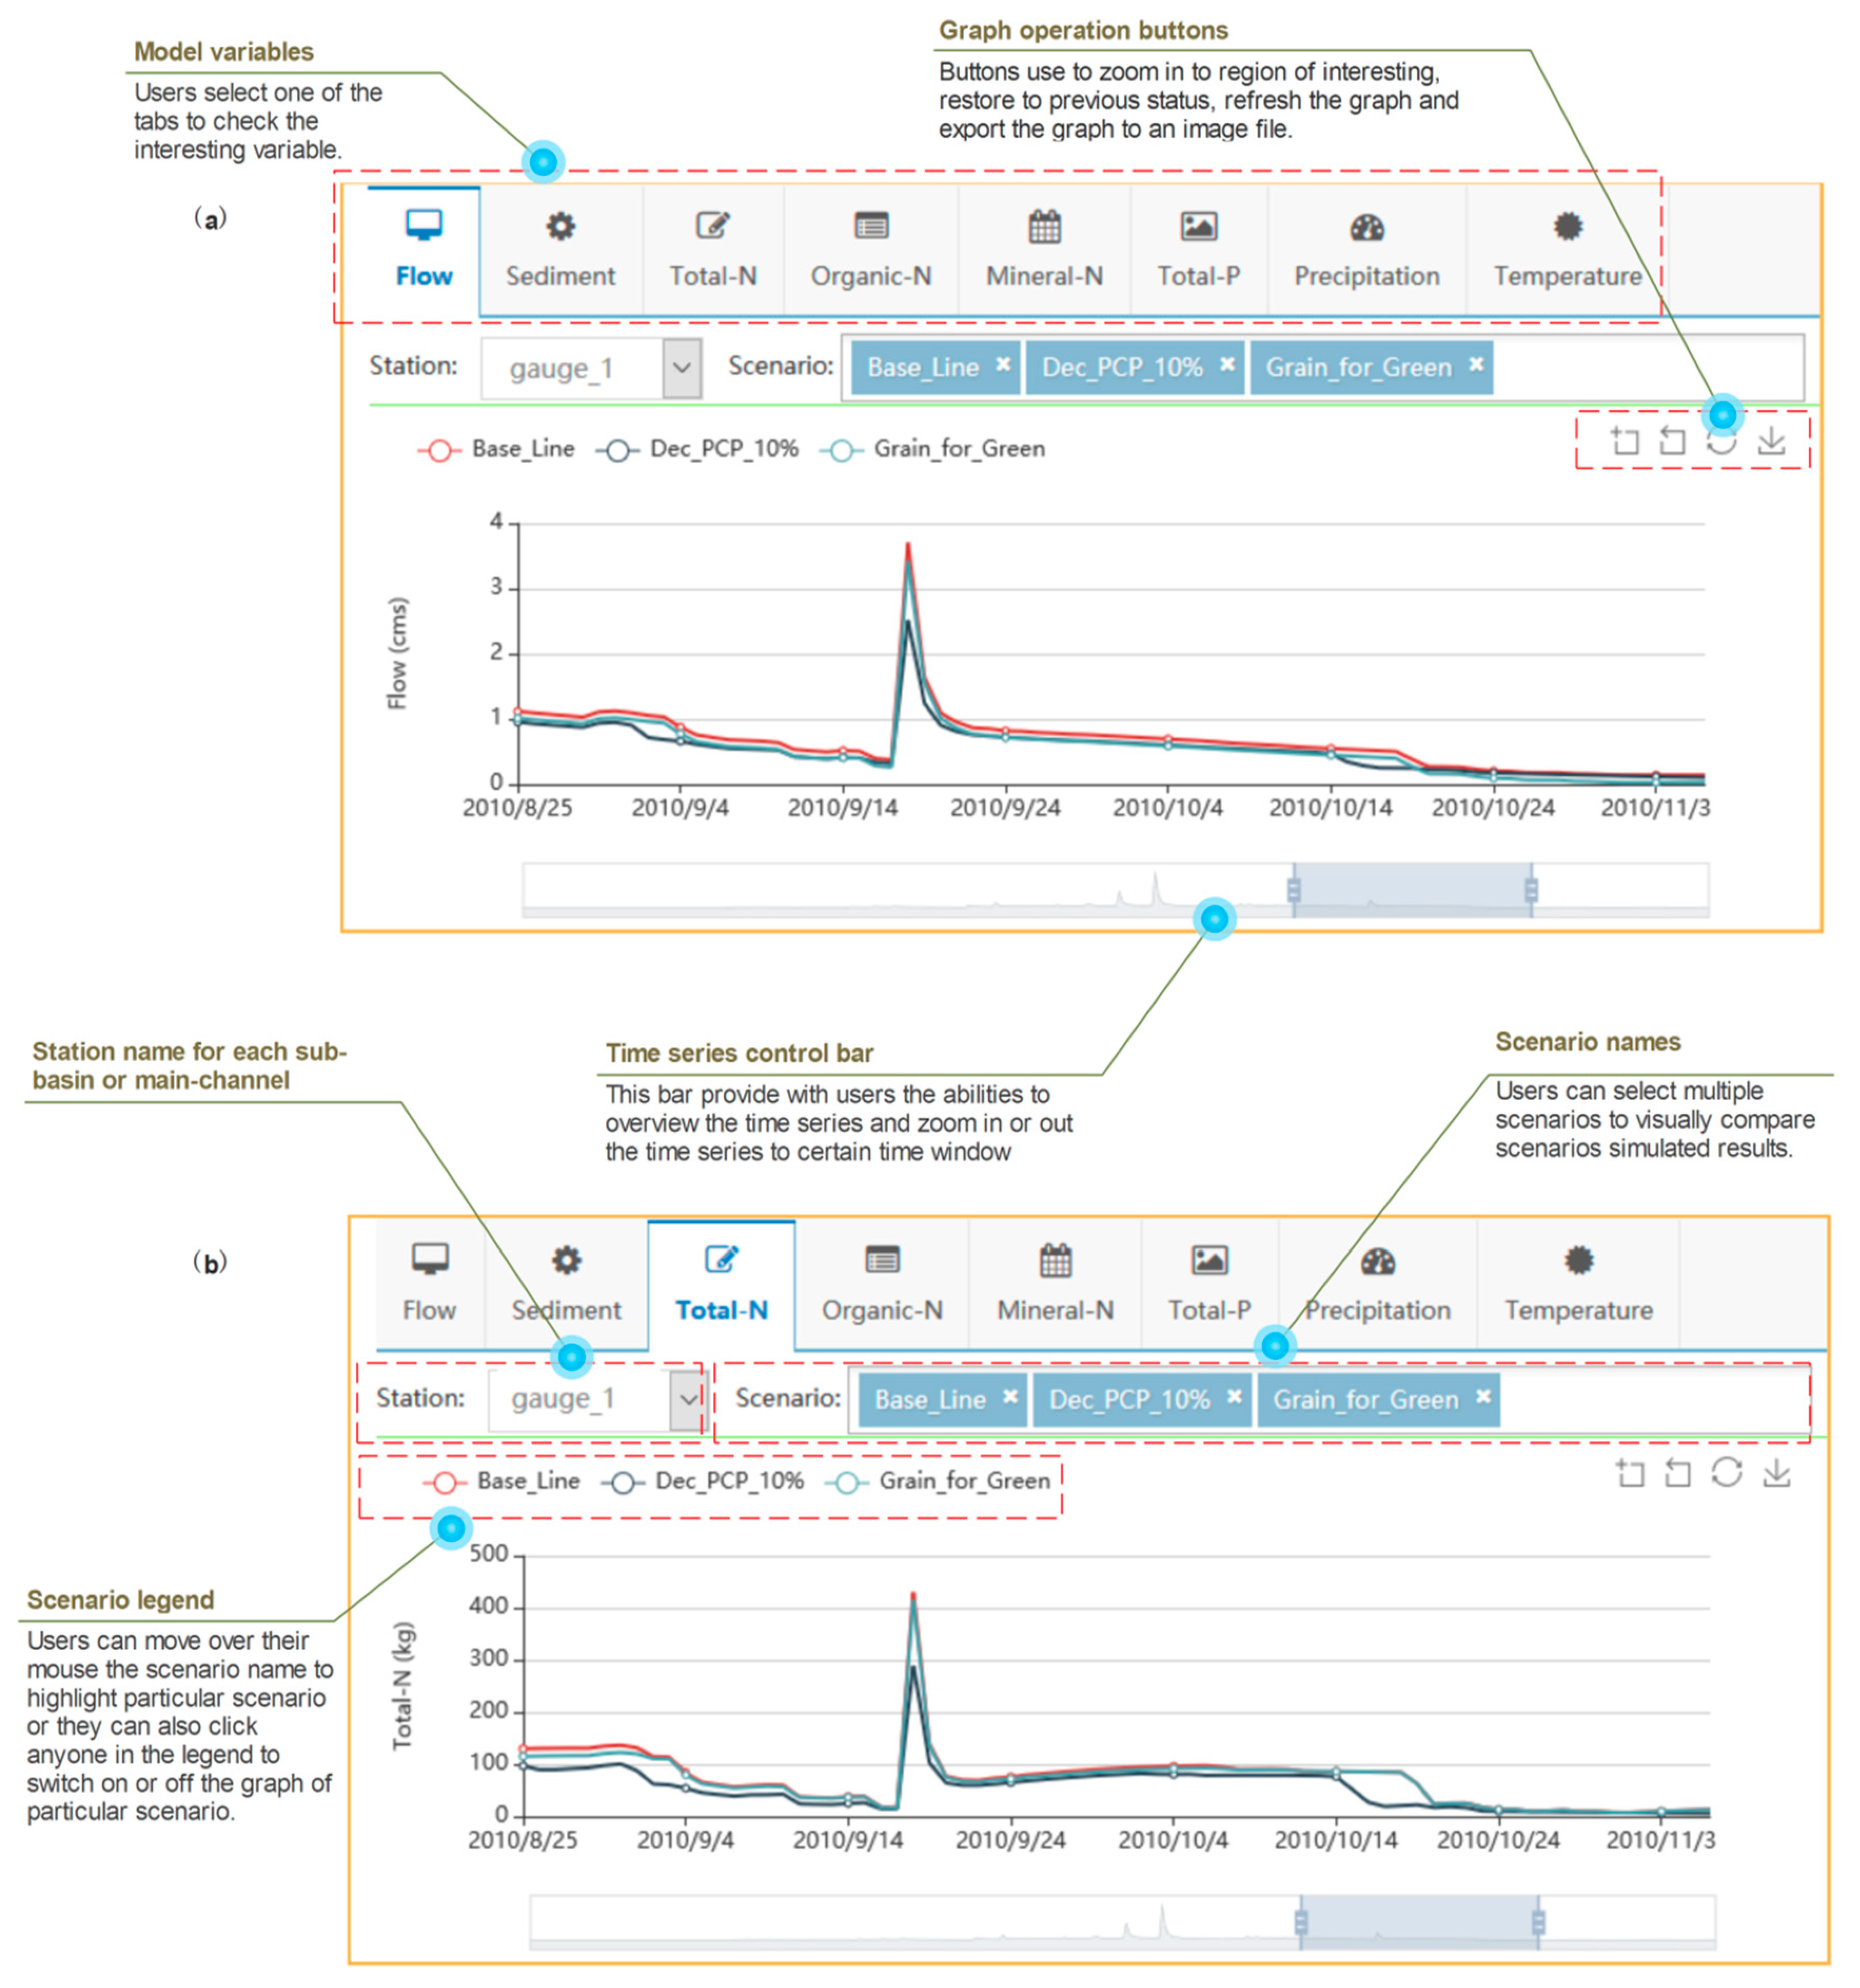
Figure 7 shows the interface for visualizing the results of the scenario execution. This interface includes multiple tab-panels to visualize variable dynamics of model driving forces (i.e., precipitation and temperature) and scenario execution results (flow, sediment, total nitrogen, etc.). Users can select any tab to investigate the variable of interest. For example,
Figure 7a,b shows the temporal dynamics for flow and total nitrogen, respectively. Inside each panel, there are two sub-panels: the upper and lower sub-panel. The upper sub-panel consists of two selection boxes with which the user can choose the desired hydrological station (or meteorological station, when the precipitation or temperature tab is selected) and scenarios, respectively. The lower sub-panel is a chart that is dynamically generated based on the user choices (i.e., based on the station and scenarios that the user wishes to investigate). Using the Apache ECharts library, this chart is dynamically generated based on the results of the scenario execution, which are retrieved from the WOF-SWAT server using AJAX technology. Legends for the selected scenarios are shown in the top left corner of the chart. Users can move their mouse over these legends to highlight a particular scenario or they can click on any legend to switch the graph of a certain scenario on or off. In the top right corner of the chart there are four graph operation buttons with which the user can zoom into a region of interest, restore the previous status, refresh the graph, or export the graph to an image file. At the bottom of the chart, there is a time-series control bar. This control bar allows the user to obtain an overview of the whole time-series and to move around and zoom in and out of the time window to review the graph in detail.
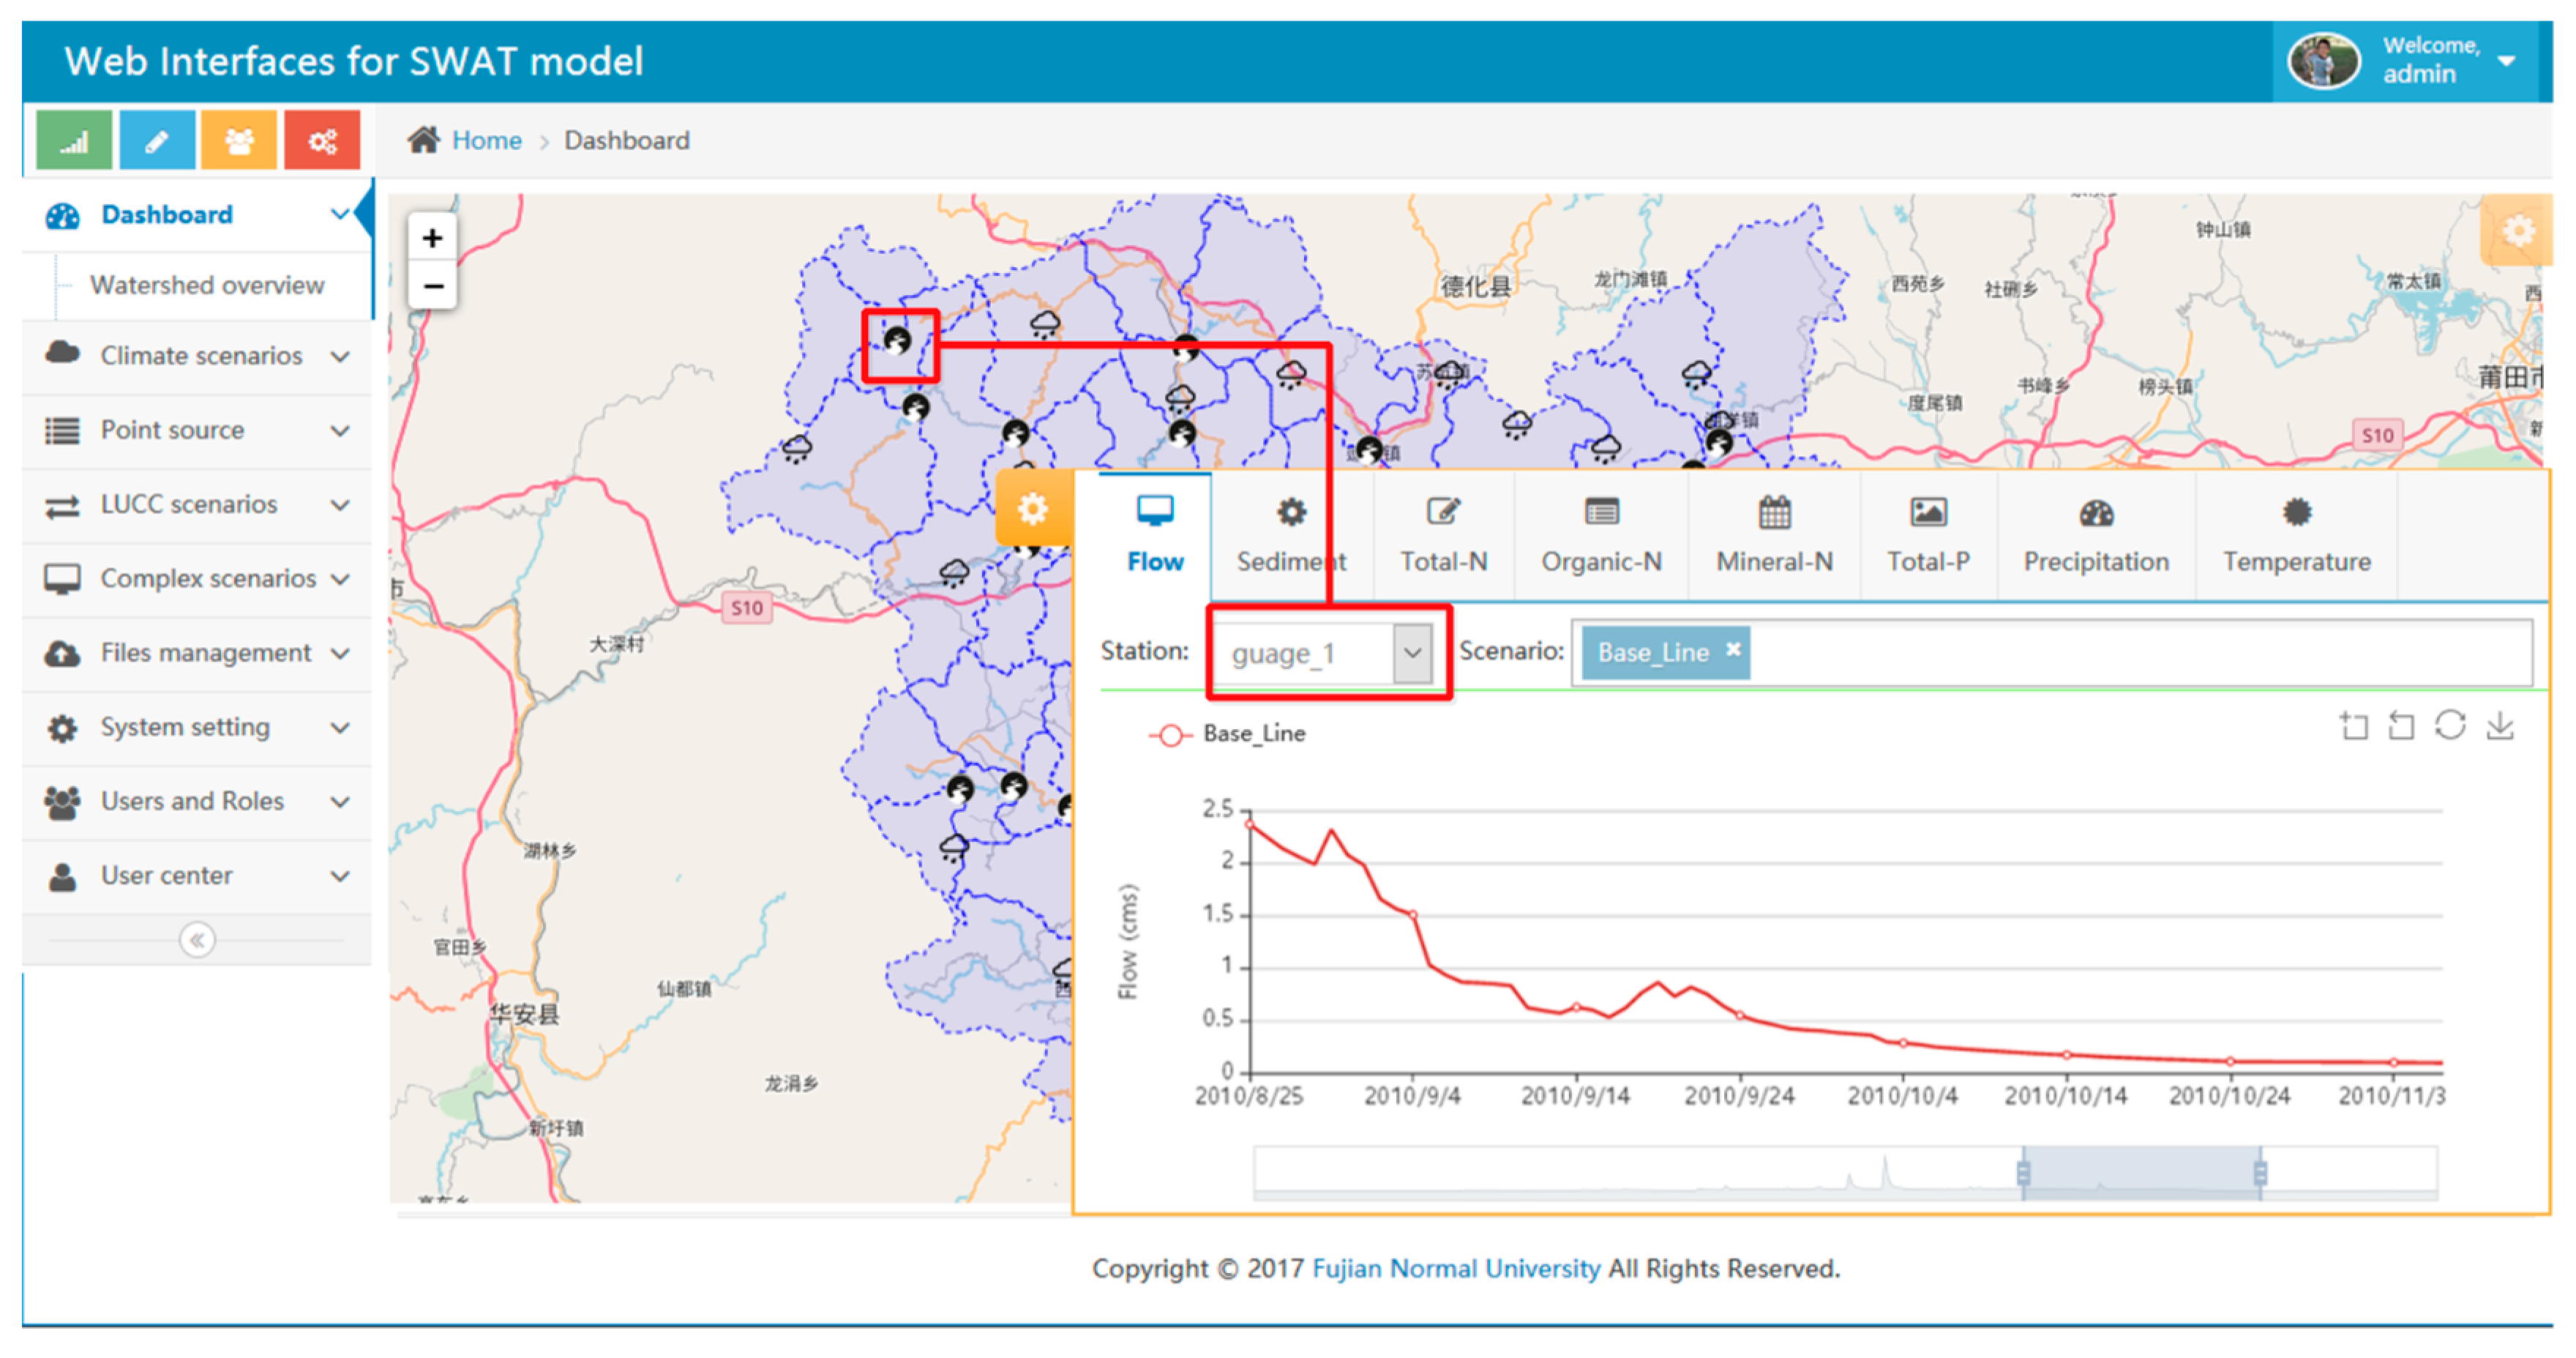
A map viewer is implemented using Leaflet to present watershed maps, including the base map, watershed boundaries, sub-basins, streams, and meteorological and hydrological gauges. In this study, model driving forces and model results were linked to their associated meteorological and hydrological gauges, respectively, to allow the user to spatially investigate the scenario results. This was implemented by passing an event handle, which automatically generates a chart when a marker is clicked, to the constructor for the meteorological and hydrological gauge layer.
Figure 8 shows an example of the linkage between a marker (meteorological or hydrological gauge) and the interface for visualizing the results of the scenario execution. If the user clicks a marker in the map viewer, the interface for visualizing scenario execution results appears in the bottom right of the browser. Depending on the type of marker or gauge that is clicked, this interface will activate different tab panels, coordinate the gauge selection box with the selected (or clicked) gauge, and finally generate a chart based on the selected scenarios (by default, only the baseline scenario is selected). For example, if the user clicks the meteorological gauge named “gauge 1” then the flow panel is activated (by default, the precipitation and flow panels are activated for meteorological and hydrological gauges, respectively), the value of the gauge selection box is assigned to “gauge 1”, and finally the flow time-series for the selected scenarios is plotted in the chart panel.
4. Ongoing and Future Works
The current version of WOF-SWAT has the ability to simulate the impacts of climate change, land use change, point-source pollutants, and their combinations on hydrology, sediments, and pollutants in a web-based environment. More efforts are underway to enrich the watershed management functionality of WOF-SWAT in order to provide a fully-fledged open-source watershed management framework. For example, watershed management practices such as the use of filter strips, water transfer, consumptive water use, and irrigation are being developed. As a web application, WOF-SWAT allows simultaneous user access. However, in the current version, it is only possible to execute one scenario at a time in order to avoid interplay between simultaneously simulating scenarios. The fact that WOF-SWAT uses an execution lock to ensure that only one scenario is executed at a time can become a problem when WOF-SWAT is applied to a relatively large user group, and also in circumstances when the user may wish to perform complex scenarios that involve many model executions. For example, the user may wish to investigate a complex climate change scenario in which the temperature varies between 1 and 3 °C at an interval of 0.1 °C. Such a scenario requires a total of 21 model executions and would thus take a long time if performed sequentially. Therefore, the capacity for simultaneous model execution is essential for implementing complex scenarios in WOF-SWAT. Parallel or simultaneous scenarios are executed by adopting a special version of SWAT, MA-SWAT, which was initially developed to parallel and accelerate model execution by using an in-memory NoSQL database (the Redis database). There are two reasons that scenarios can be simultaneously and independently executed with MA-SWAT. First, the scenario settings are projected into model inputs and these inputs are stored in databases; second, MA-SWAT was programmed to be able to read the model inputs of certain scenarios and execute the scenario via an identifier.
Drought and flood disasters are the most important factors that restrict the development of a sustainable society. The evaluation and prediction of droughts and floods are vital for decision-making related to disaster mitigation and prevention. Therefore, it is planned to expand the ability of WOF-SWAT for such evaluation and prediction. Additionally, in the future, we will combine SWAT, the Standardized Streamflow Index, and Run Theory to achieve hydrological drought evaluation and prediction. Moreover, the HEC-HMS model and a parameter identification method for HEC-HMS proposed by [
32] can be combined to allow flood evaluation and prediction. We also plan to provide a data transfer interface to allow linking with climate models and/or weather forecasting systems in order to derive necessary forecast information.
5. Summary and Conclusions
In this study, we outlined a web-based open-source framework based on the SWAT model, called WOF-SWAT, that is designed to provide a user-friendly interface for the user to investigate the impacts of climate change, land use change, point-source pollutants, and combinations of these factors on hydrology, sediments, and pollutants. Next, details of the workflow, interfaces, and key processes of the WOF-SWAT framework were described and discussed. Based on a hydrological model of the Jinjiang River basin, a prototype system of WOF-SWAT was implemented, and four scenarios representing climate change, land use change, point-source pollutant, and a comprehensive scenario that consists of both climate change and land use change were set up to evaluate the functionality of WOF-SWAT. The performance and the results of the scenarios obtained using WOF-SWAT and other desktop-based tools were compared to verify the validity, rationality, and efficiency of WOF-SWAT. The following conclusions are drawn based on these results:
WOF-SWAT is able to generate identical or similar results to those of desktop-based tools and can thus be substituted for these tools to carry out similar watershed management-related tasks in a web-based environment.
With a well-calibrated watershed model, WOF-SWAT is sufficiently sound and reasonable to be used to investigate the individual and combined impacts of climate change, land use change, and point-source pollutants.
More efforts are required to allow parallel model running and parallel scenario execution in WOF-SWAT in order to provide more watershed management functionality and allow disaster evaluation and prediction. This would develop WOF-SWAT into a fully-fledged watershed management framework.


