1. Introduction
Global economic crises alongside the increasing anthropogenic environmental impact, population growth, climatic changes etc. boosted the elaboration of the “green economy” development model to mitigate these processes. The international community adopted several important documents fostering the transition to “green economy.” Among them are the European program “20:20:20” directed at industry and power production “greening,” UNEP “Green Course,” “Rio+20” Declaration, etc. According to these documents, the main target of “green economy” is stabilization of economy development based on harmonization of “nature-population-economy” interrelations. This issue is of special importance for regions of pioneer economic development and territories with low environmental resistance to anthropogenic load. One of such regions is the Arctic zone, which nowadays attracts interests of many states due to its richness in natural resources and climatic warming facilitating their extraction, as well as the possibility for a cheap transportation by sea.
Russian Arctic zone with an area of 3.7 mln km2 (which is half of the circumpolar Arctic) and about 2.3 mln people living there, represents one of the focal regions in the development of Russian economy.
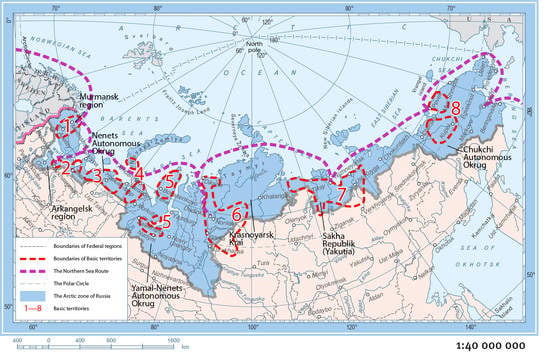
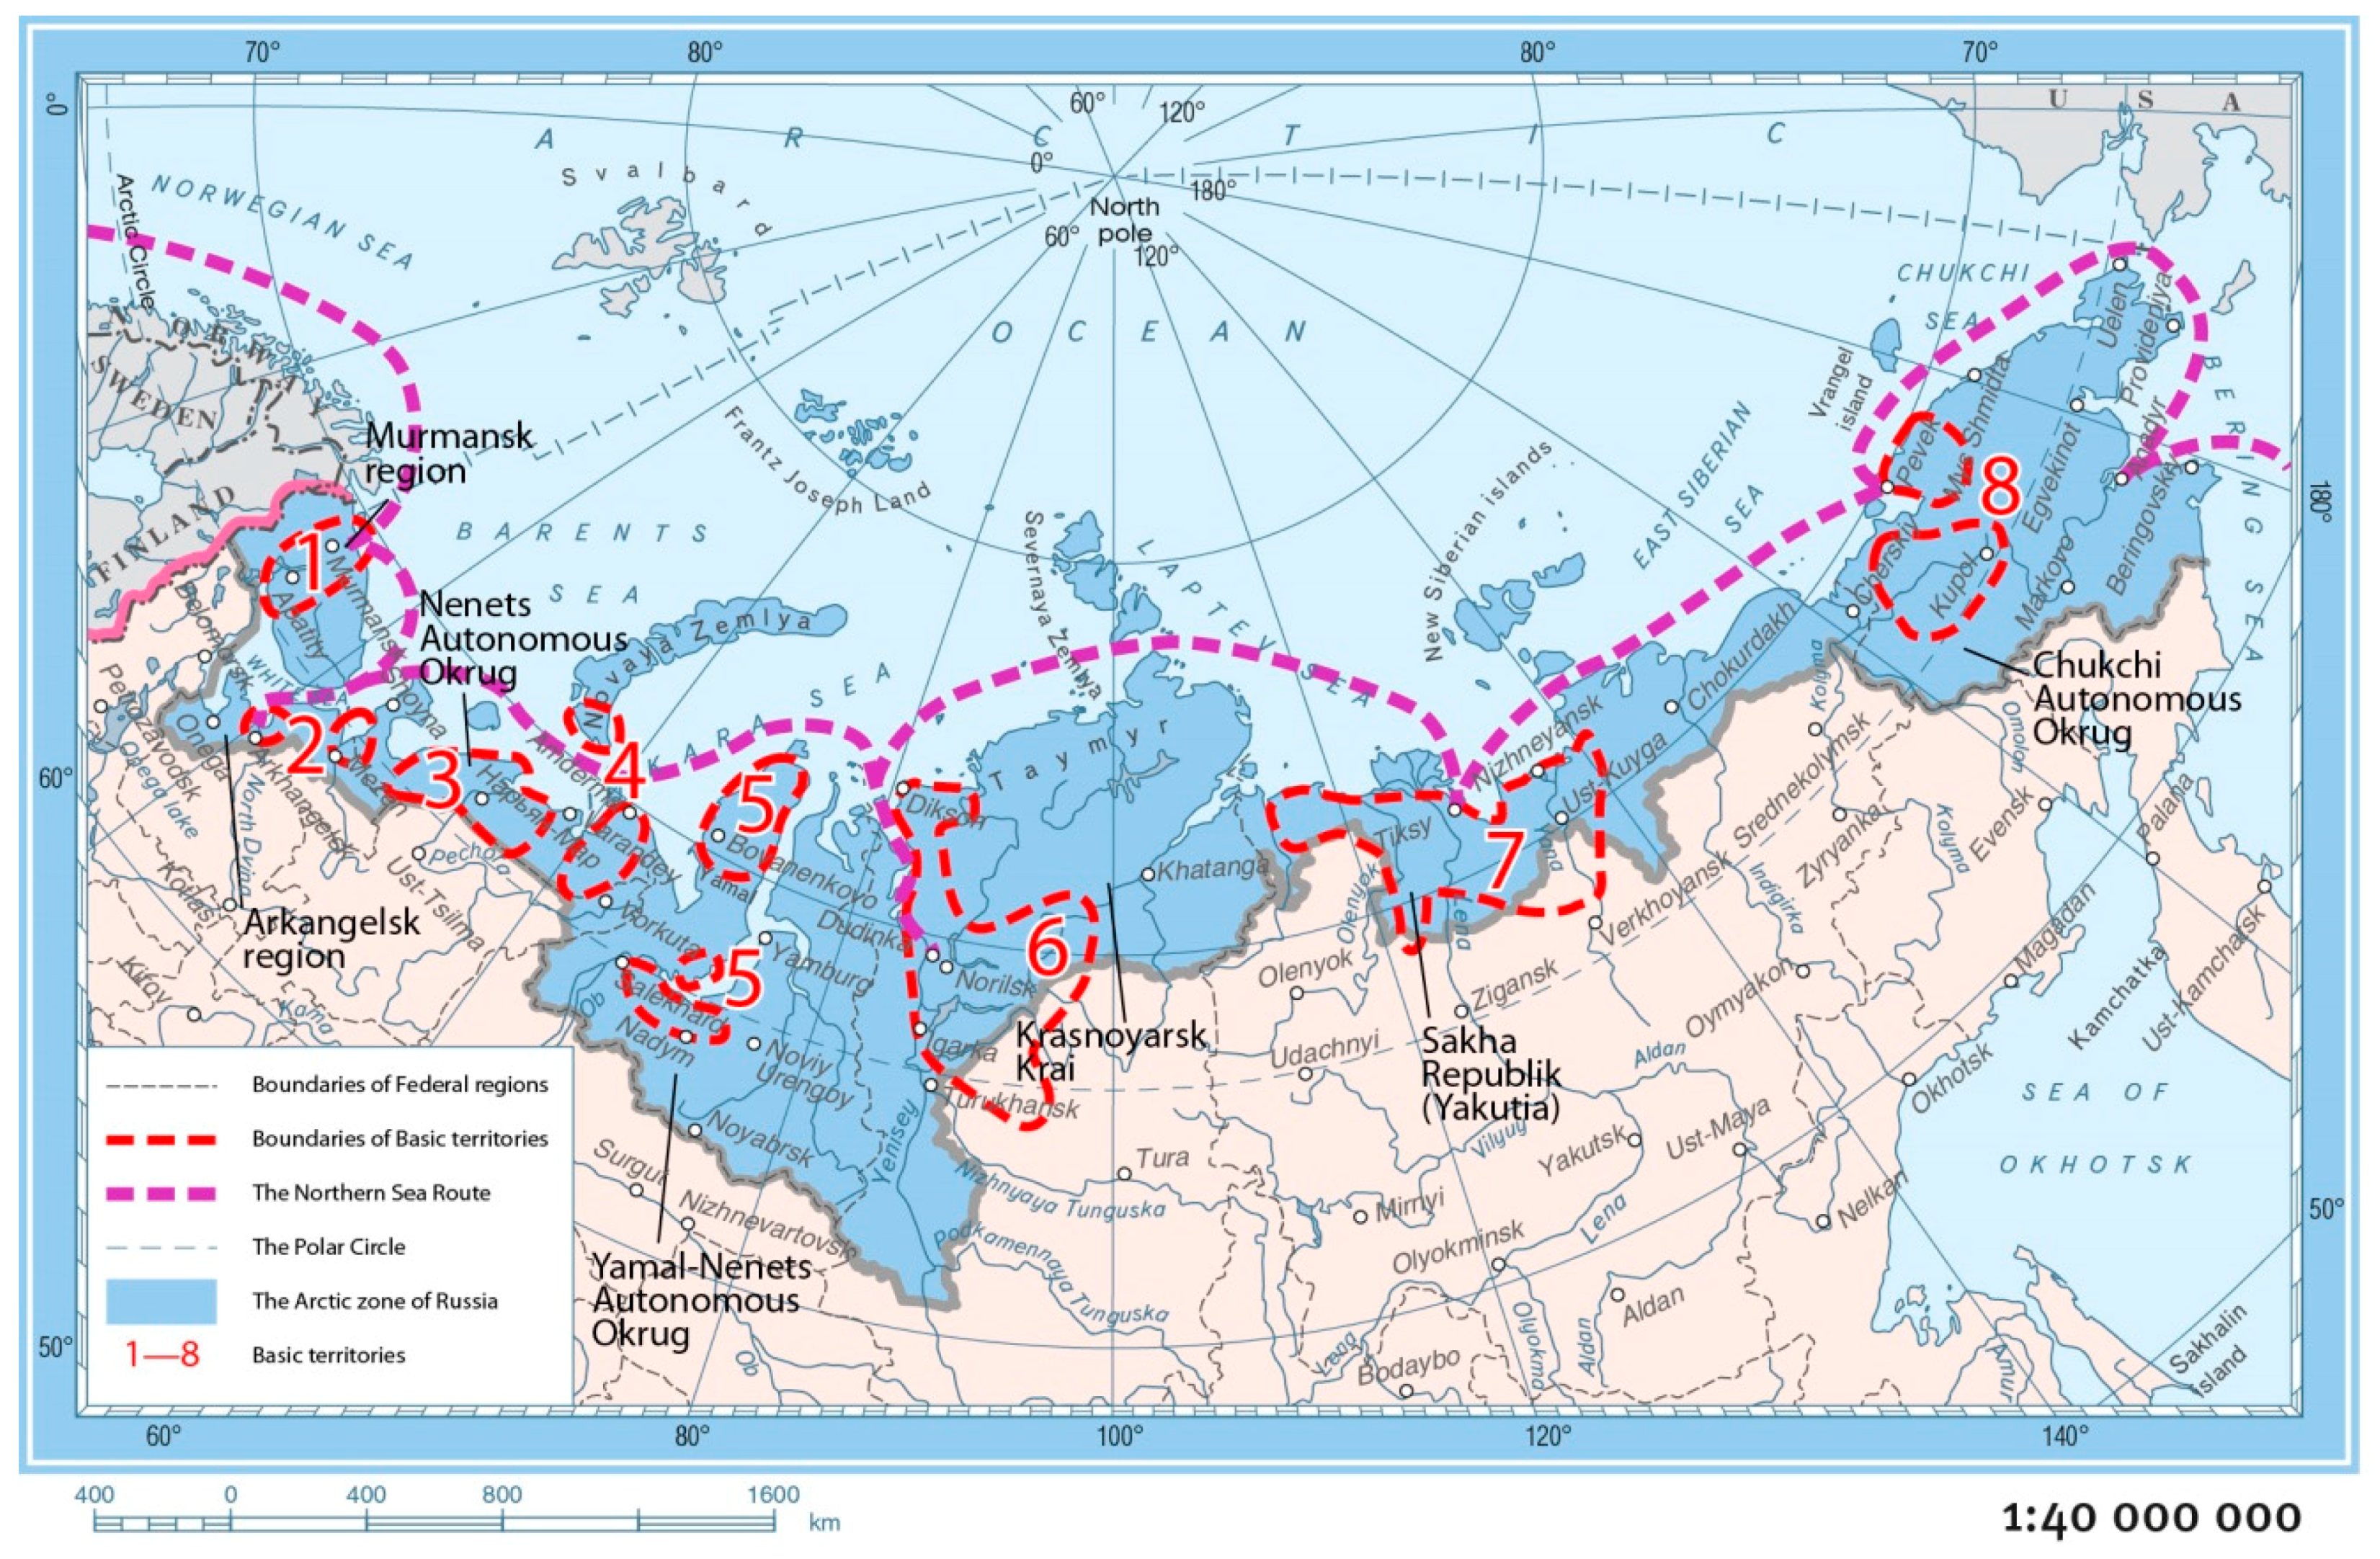
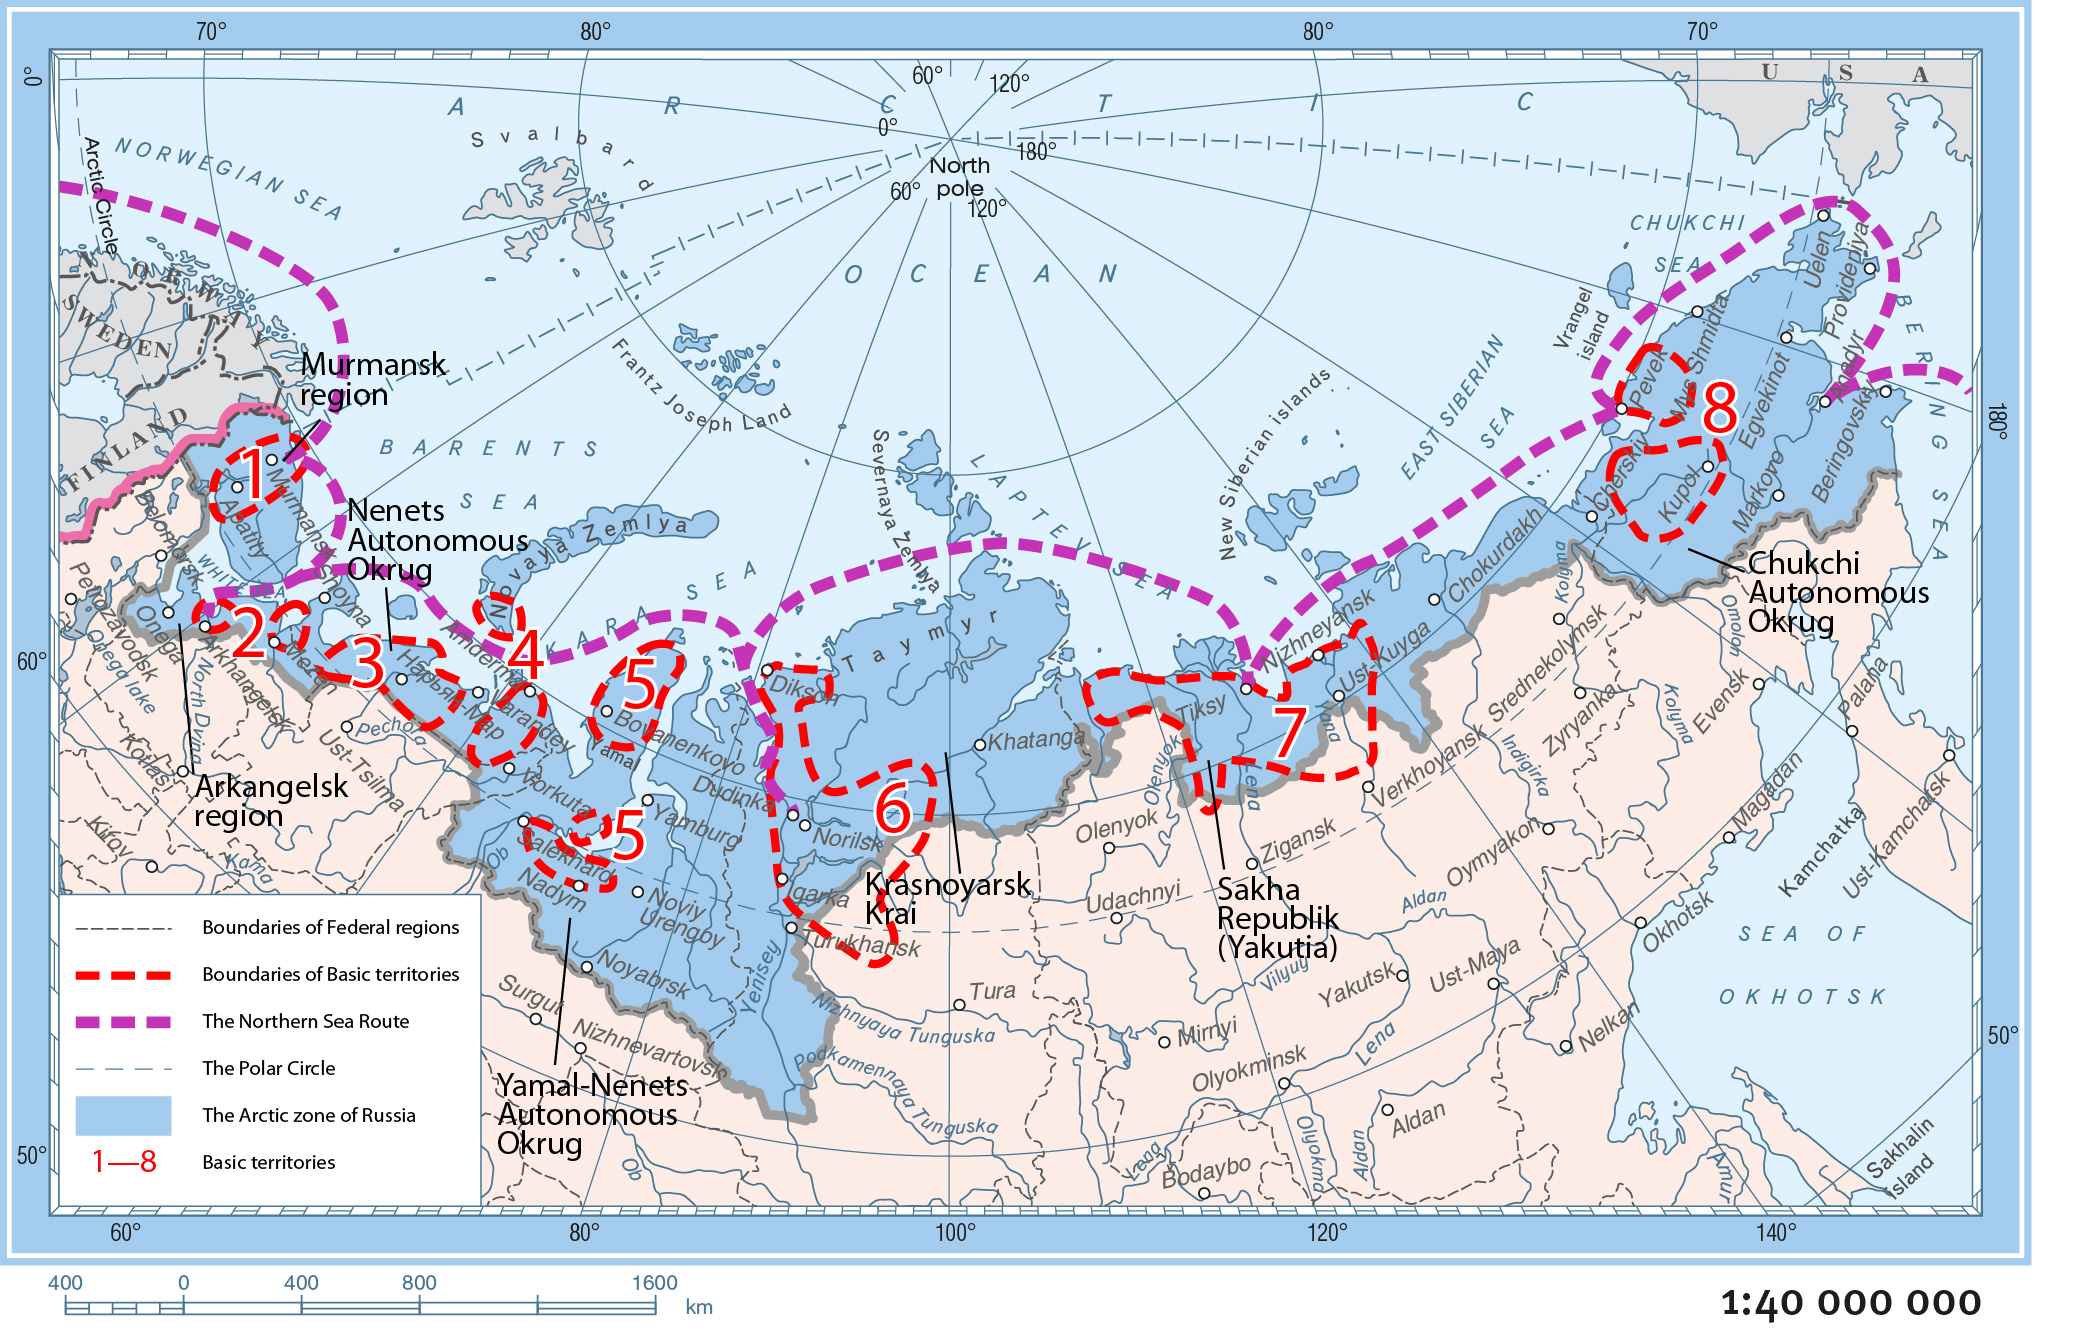
This region contributes to 12% of Russian GDP (2017). A number of important documents concerning economic and social development of the Russian Arctic zone up to 2030 were adopted in 2008–2017. Among the priority targets mentioned there are economic development/revival of eight territories (
Figure 1), which would form innovative centers of regional development as well as an activization of the commercial use of the Northern Sea Route. These territories will receive Federal support to promote economic activities. Totally 150 investment projects are planned by 2030, where 48% are designated for mineral resources extraction, 16%—for transport development, 7%—for geological survey, 2%—for environment safety protection etc.
At the same time these ambitious plans should meet green economy goals. This means that territorial planning will have to consider at least three spatially differentiated issues: Social-economic, ecological and environmental (nature hazards, climatic changes etc.). Nowadays the common practice is the following: Each of these issues are studied separately and the results are presented to local authorities in the same way, visualization is often poor. This complicates the development management practice and sometimes, even provoke nature management conflicts [
1,
2]. Thus, the initial stage of territorial planning for economic development needs evaluation of different spatial combinations of these issues at the territories mentioned earlier. Despite the recognition of such approach [
3,
4], very few examples of its practical implementation exist, mainly due to the lack of adequate methods [
5,
6]. Difficulties connected with transdisciplinary assessments of cross-scale resilience of ecosystems to human impact were described in [
7].
Sharp differences in natural environment, resources, demographic and economic characteristics in Russia require regional models of transition to “green economy” development. The aim of this research is to present an algorithm for evaluation of joint impact of basic regional components characterizing “nature-population-economy” interrelations in order to reveal their spatial differences and demonstrate options and risks for future sustainable development of the Russian Arctic.
2. Study Area
The study area belongs mainly to the Subarctic and adjacent northern regions of the Temperate and Arctic zones. Its present boundaries were administrative, established by the President’s Decree in 2014. Economic development programs concern a number of administrative units and yet have uncertain boundaries. Natural environment is represented by tundra, polar deserts (oceanic islands) and northern taiga. The landscape structure is very diverse as a result of relief differences, oceanic coast proximity, permafrost development, unfavorable natural events occurrence, climate severity etc. All these factors stipulate different natural background for economic development. Social-economic differentiating factors include: Population density (local labor power availability), GRP (Gross Regional Product) values (2017), transport infrastructure development, presence of indigenous population territories (alternative land use pattern) etc. Diversity of social-economic factors implies options as well as obstacles for implementation of economic development programs. Previous economic activities at the study area caused many unfavorable changes in ecosystems limiting available territorial pools of their regulating services. This is mainly connected with environment pollution and ecosystems degradation. This fact is of primary importance for future sustainable ecological development of the region.
3. Materials and Methods
This study is based on a system analysis of regional ecological, economic, environmental statistical and spatial data stored in three data bases (Excel format) for the territories of advanced economic development, institutional documents and publications, personal field work experiences.
Basic research methods included system analysis with GIS tools [
8]. Accumulated data, i.e., principle characteristics for sustainable development regarding regional factors [
9]: Economical, ecological and social. Other important characteristics such as ethical, technological, cultural heritage were not included into our database for the following reasons: First two of them are common for all regions according to the adopted documents for economic and social development of the Russian Arctic zone up to 2030; cultural heritage characteristics are impossible to analyze in a small-scale research.
3.1. Database
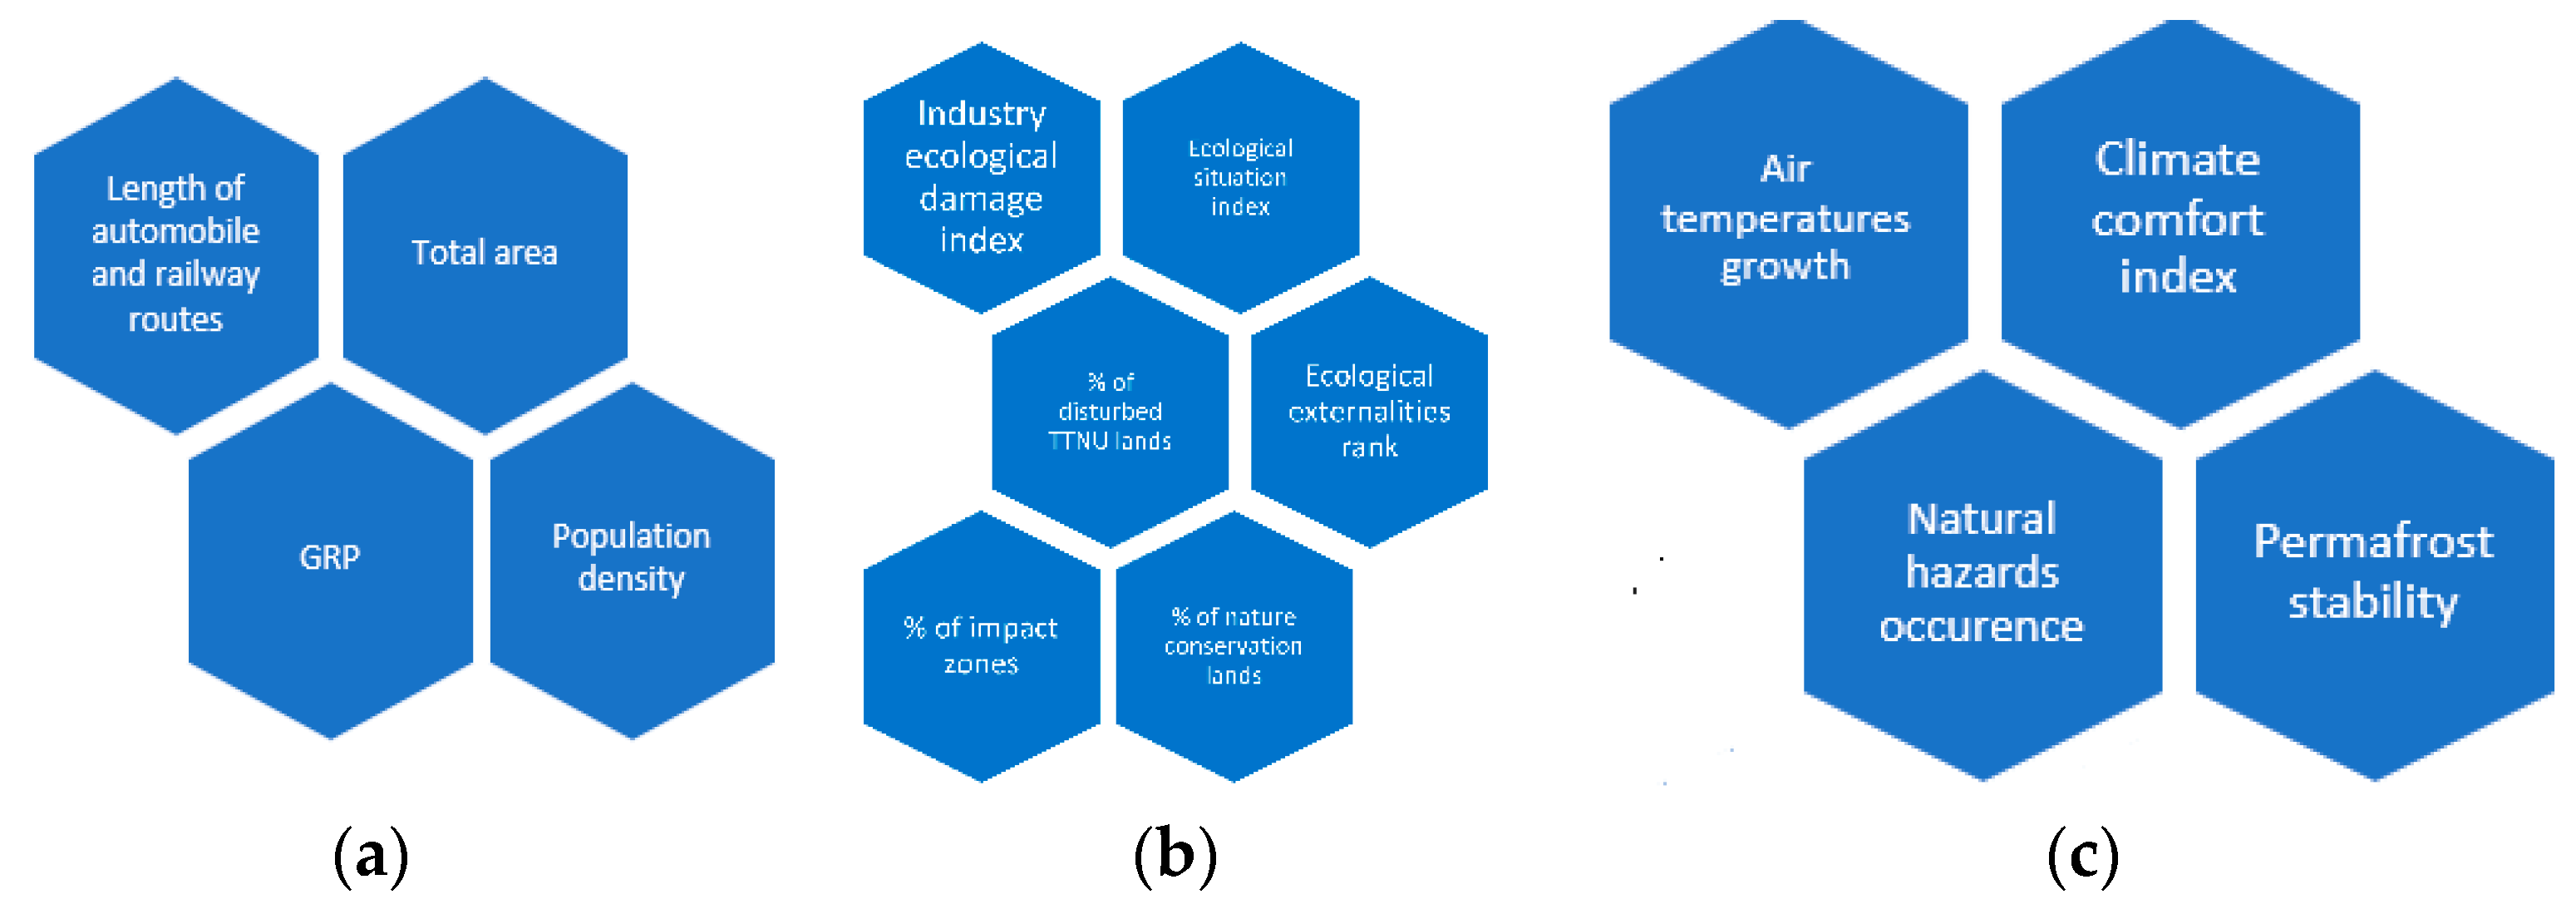
Database for each block was limited to principle regional characteristics relevant to sustainable development (
Figure 2a–c.)
The socioeconomic block included principle characteristics controlling economic development obtained from open access regional statistical reference books and official regional governments sites [
10,
11,
12,
13] and included: Total area, GRP, population density and length of transport routes for each region. Ecological block included traditionally used characteristics (ex.-%of nature conservation lands), as well as some new characteristics: Industry ecological damage and ecological situation indexes, ecological externalities rank. Industry ecological damage index reflected unfavorable ecologic impact of different branches of industry in Russia [
14]. Ecological externalities rank showed percentage of involved impact territories (local, regional, global). Ecological situation index was obtained by aggregating various indicators that characterize factors that were responsible for ecological situation pattern, primarily with respect to life quality [
15]. Marking a presence of TTNU (territories of traditional nature use of indigenous population) as an alternative land management pattern, was necessary to avoid risks of socio-ecological conflicts in case of replacement.
Environmental block contained data reflecting modern and the nearest future temperature rise according to Voeikov Main Geophysical Observatory (°C) [
16], permafrost stability (four commonly used gradations: No degradation; low degradation; degradation and permafrost disappearance), climate comfort index [
17], occurrence of natural hazards (earthquakes, avalanches, wind loads on constructions, kPa) [
12,
18]
3.2. Assessment Methodology
Keeping in mind the final goal of future economic development, we assume that principle factors contributing to it are economic and ecological development with a background of a certain environment. In order to find different patterns of sustainability provided by these factors we performed pair assessments of ecological/economic, environmental/economic and ecological/environmental blocks. Weighting procedure of the assessed factors appeared to be useless in this case: No significant differences were received. Independent variable-environmental factors offered different spatial natural patterns either promoting or hampering economic development and also influencing ecological situation variations. It was impossible toassess jointly all blocks data because the discussed framework of regional sustainability factors attributed to spatial regional system, which demonstrated its panarchy character [
19] (see below).
Integral indexes’ calculations were based on algorithm elaborated by one of the authors [
20]. This algorithm included normalization of the initial parameters using the following formula:
—the worst values (for each parameter) among the whole set regarding their impact on economic development level, ecological situation etc.;
max/minx—values to the maximal extent different from values;
n—number of the studied territorial units;
m—number of the parameters.
Ranking was done based on comparing all parameters’ values attributed to territorial units with conditional
values. Euclidean distances (
d°) were used for the ranking procedure. (
d°) is the measure of closeness of all territorial units’ values to the worst values of conditional (
) regarding the whole set of parameters.
The algorithm required the preliminary processing of the data array using the method of the Principal Component Analysis in order to orthogonalize and convolute the system of parameters. The received data of column vector
do presenting assessment characteristics was additionally normalized for convenience using the following formula:
The
d° varies from zero to one. “Zero”—corresponds to the worst integrated assessment and “one”—to the best.
The used algorithm also enabled to detect homogeneous territorial groups in the assessment. This was done via partition of corresponding ranked values of Euclidean distances into homogenous groups.
The procedure of these groups allocation was multi variant and enabled to receive a spectrum number of homogeneous groups of territorial allocation variants. Allocation quality was assessed using canonical correlation coefficients [
21] as well as absolute (
) and relative
) coefficients of heterogeneity [
21]:
where K—the number of identified groups; P—the number of the orthogonalized coefficients to calculate distances; n—the number of TUs; tmax—the maximal number of groups; tmin—the minimal number of groups; I—indicator (binary), pointing to the presence (1) or absence (0) of TUi in group k.
Where K—the number of identified groups; P—the number of the orthogonalized coefficients to calculate distances; n—the number of TUs; tmax—the maximal number of groups; tmin—the minimal number of groups; I—indicator (binary), pointing to the presence (1) or absence (0) of TU i in group k.
A sharp increase in the absolute or relative coefficients of heterogeneity with a decrease in the number of the identifiable clusters indicates the increase in heterogeneity within the identified clusters, while a smooth increase in the coefficients is a sign of its uniform increase. The threshold followed by a sharp increase in heterogeneity can be optimally taken as the final number of clusters.
The suggested method enabled to receive integrated spatial characteristics are helpful for further sustainable development territorial planning.
4. Results and Discussion
Perspectives of sustainable development assessment were based on successive processing of information from databases describing economic, ecological and nature systems, the development of which was controlled by different driving forces. Different driving forces made joint assessment very difficult, if possible. Mathematical ecologists found that they were unable to demonstrate a connection between the two phenomena—stability and diversity in mathematical terms [
22]. We deal with panarchy framework demonstrating demand for differentiated management mechanisms to achieve sustainable development goals. Thus, spatial nature management structure may have different priorities. This seems to be of great importance for the sustainable development planning. The recently adopted development program is missing this issue, which is necessary to elaborate reasonable management practice patterns.
Panarchy is a complex and controversial framework for describing eco—and human interactions necessary to reveal the twin dynamics of change and stability. It imposes analyzing of frameworks of spatial complex factors in non-linear terms [
2,
19,
23]. Different scale levels of assessments concentrate resources and potential of panarchy complex in different ways. It is also obvious that different regional patterns may exist. In our study, we deal with a small-scale assessment involving processing of a great number of various factors attributed to a very large territory: Five for economic as well as for ecological characteristics; six for environmental (
Figure 2). Joint assessment of heterogeneous and highly differentiated regional factors influencing sustainable development is quite new. Non-linear interlinks in our panarchy framework may be demonstrated on environmental factors impact on economic development. We assessed various environmental factors, both beneficial and creating obstacles for economic development of a certain territory. For example, climatic warming increased climatic comfort index favorable for socioeconomic development. At the same time, it launched processes of permafrost degradation with an opposite effect. High wind speeds promoted atmosphere purification from air-born pollutants thus improving ecological situation but at the same time, posed excessive loads on industrial constructions making economic development more difficult and expensive. With respect to economic/ecological characteristics, non-linear interlinks may be less noticeable but still exist: High GRP level may be achieved at the background of big impact zones. Panarchy type of matter-energy fluxes links explains our choice of pair assessments to reveal different regional perspectives to meet sustainable development goals of the State programs mentioned earlier.
4.1. Assessment Results
Pair assessments were carried out for the following factor couples: Ecological/economic, environmental/economic and ecological/environmental. The results enabled to rank eight basic territories of advanced economic development according to their correspondence to sustainable development goals (
Table 1).
Ranking results demonstrated better chances to reach sustainable development goals in the European part of the Arctic zone (rank 1–3) compared to Siberian and the Far East. At the same time, environmental background may hamper this process in Nenets basic territory (rapid temperatures rise, permafrost stability destruction),while ecological situation may be unfavorable to reach the goal—in Yamal-Nenets and Nenets territories(% of disturbed TTNU lands, ecological situation index, etc.). Spatial ranking of the territory based on the complicated combinations of different factors for the sake of optimal management of its economic development was done for the first time.
4.2. Mapping
Ranking results were visualized in a map where the selected pair groups were shown for each basic territory of advanced development. A forecast of potential nature management conflicts is of special importance in regions where possible economic development meets natural (environmental) and ecological obstacles. Territorial planning procedure supported by cartographic data may help to develop measures mitigating unfavorable changes. Traditional thematic cartographic methodological approaches and practical experiences are advisable for this purpose. The accumulated and generalized data enabled elaborating methods of nature management conflicts mapping for different scale levels.
We analyzed and generalized experiences of the Arctic zone ecological mapping, particularly—Nenets Autonomous Okrug (Federal region). The appearance of nature management conflicts with respect to economic development perspectives were systemized and mapped for the whole Arctic zone territory and Nenets Autonomous Okrug [
1]. Nature management conflicts there had different localization: Areal, linear and spot. That is why variants of color and dashed scales for different types of conflicts, linear and spot-signs for infrastructure presentation were suggested. Perception support was the obvious advantage of this variant. This approach also helped to avoid map congestion where different types of conflicts overlap each other. The map presented integrated “conflict potential” connected with territorial economic development.
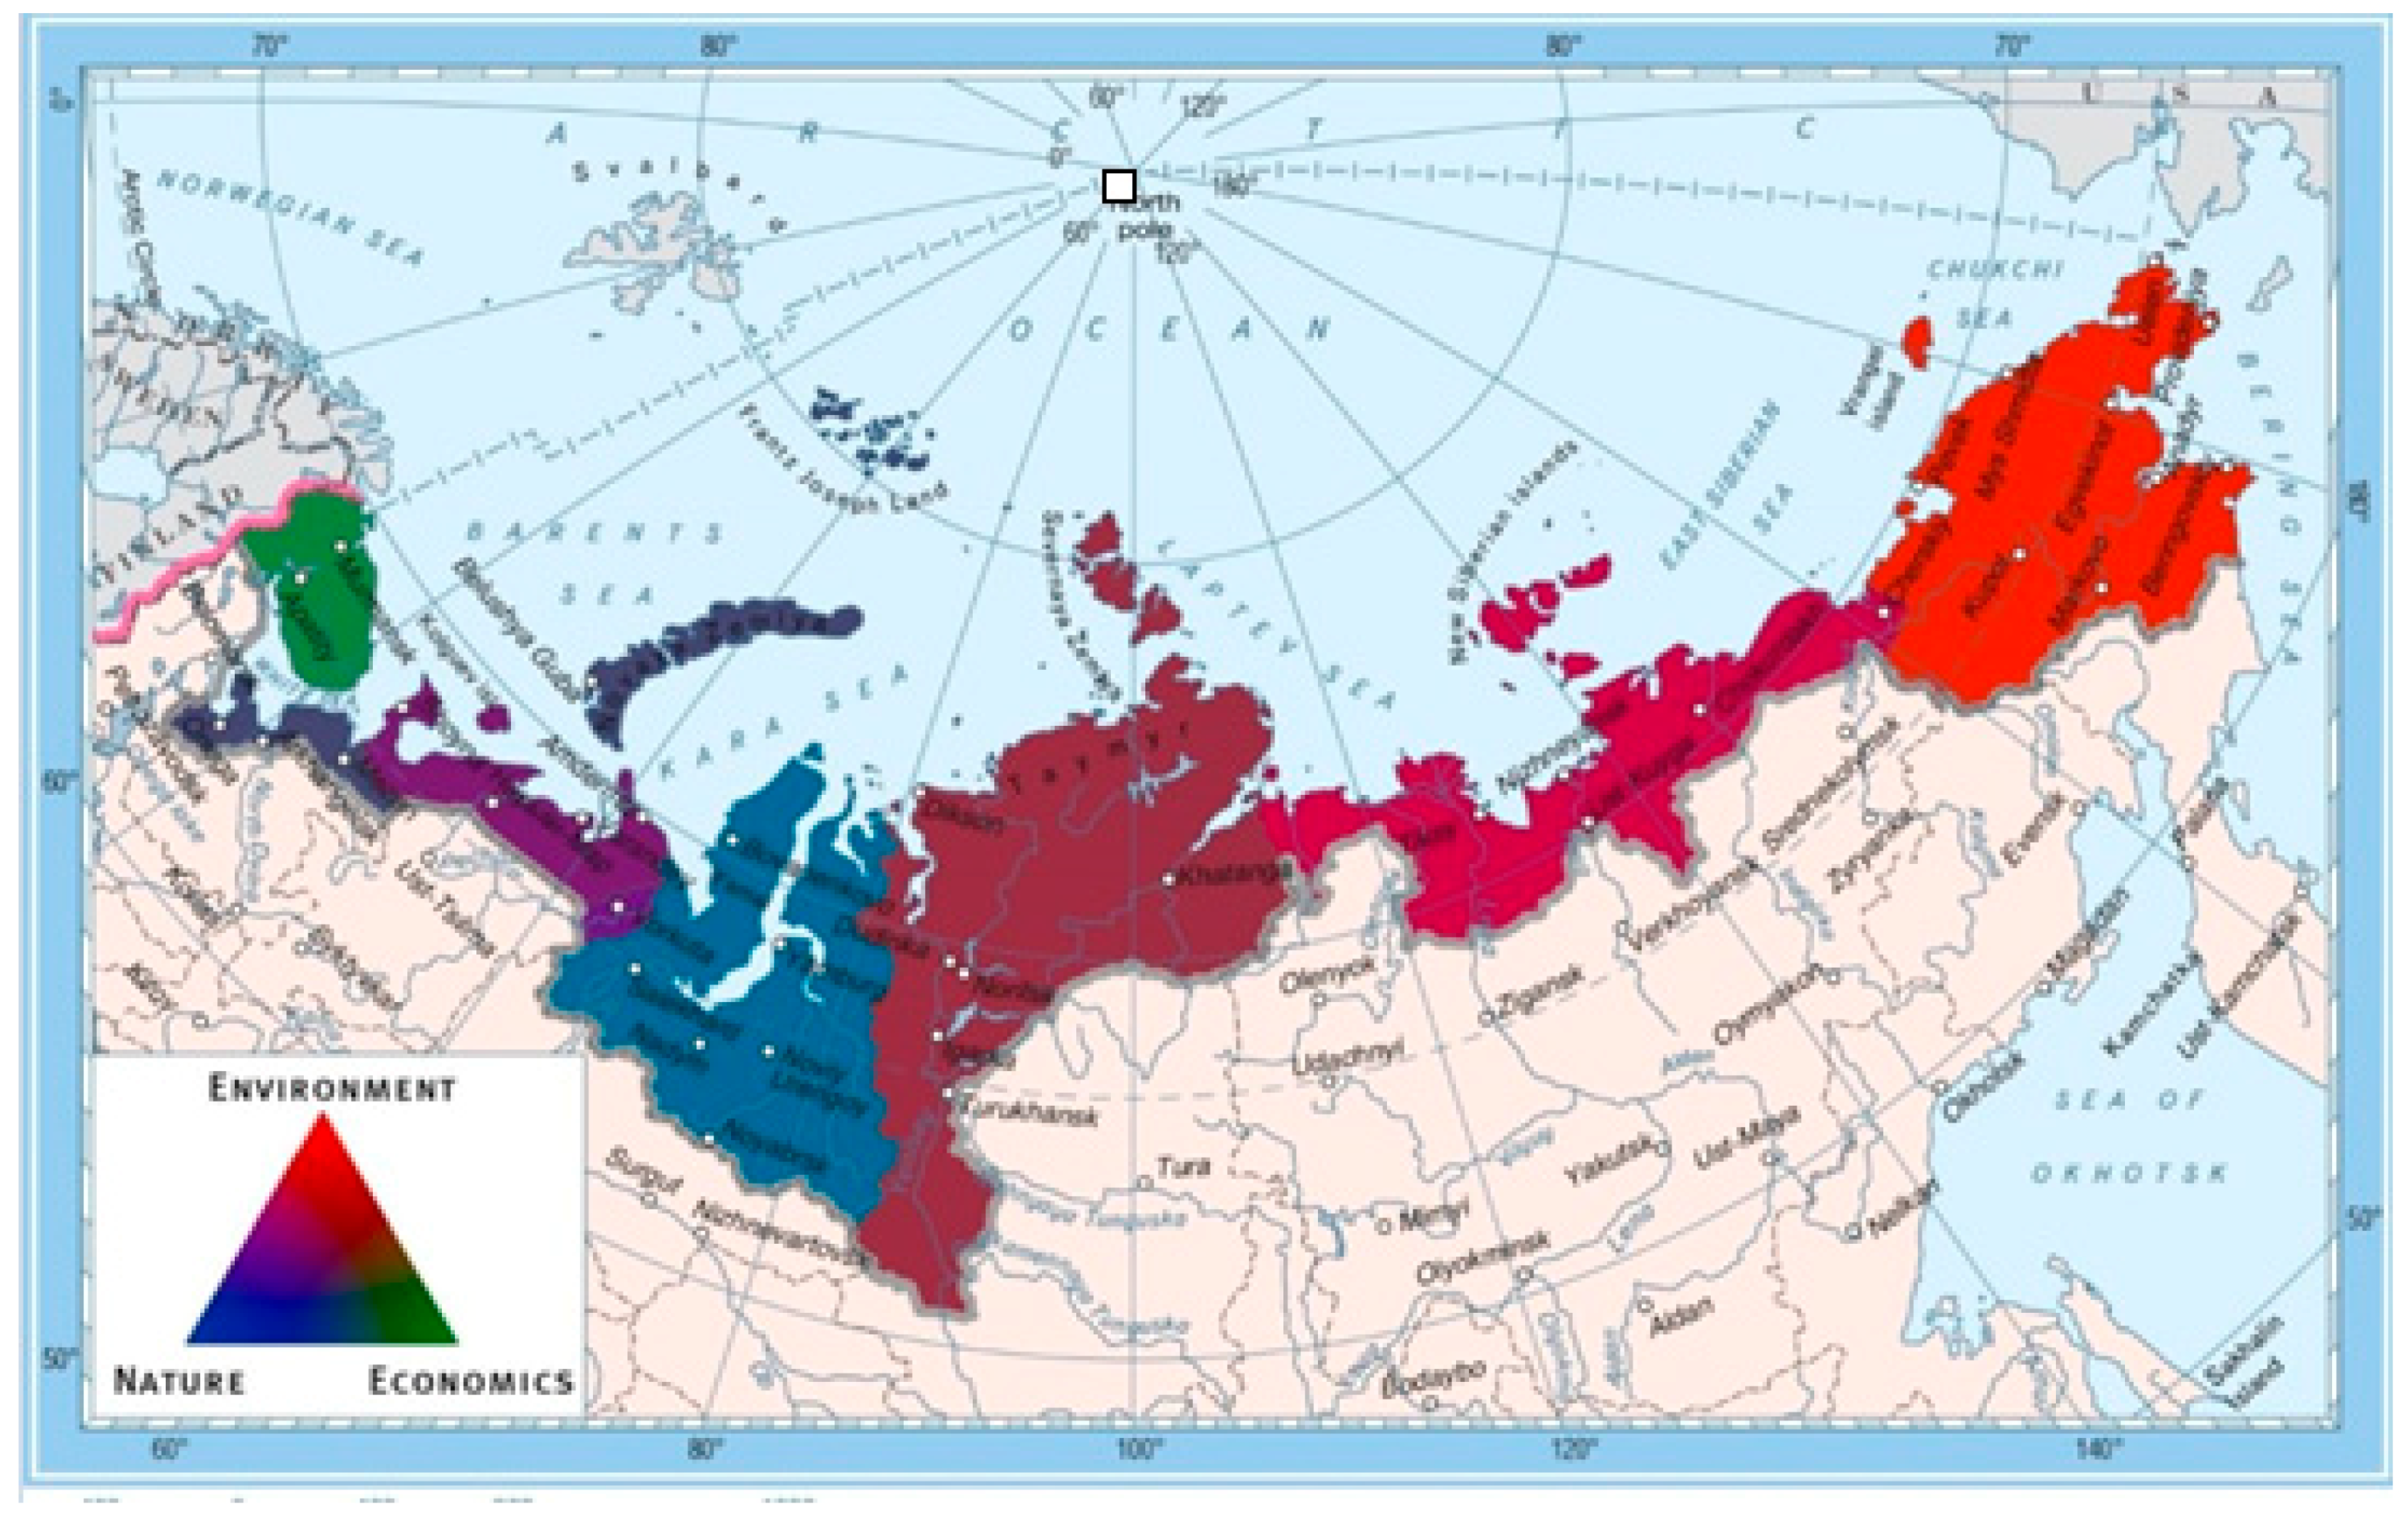
This mapping method was completed by RGB (red, green, blue) mapping method (
Figure 3) to present the ranking results. Color at the compiled map presents a separate “weight” of analyzed data blocks in aggregated pattern thus enabling visualization of components’ balance for different territories with spatial variants of sustainable development prospects.
Visualization of proportional correlation of social, economic and ecological factors groups by a joint index of potential regional sustainable development was achieved using color triangle method (RGB) [
24]. Each factor group received its color: Social—red; economic—green; ecological—blue (
Figure 3) Similar potential considering all three groups was shown by colors mixture producing grey color.
5. Conclusions
The suggested methodology enabled to consider the joint effect of spatial regional differences connected with present day economic and ecological situation, as well as environmental features influencing sustainable socioeconomic development. It enabled to rank eight territories of the advanced economic development in the Russian Arctic. The investigation results revealed:
Major regional factors contributing to sustainable economic development;
panarchy character of their interlinks making territorial planning procedure very complicated;
spatial options and risks for future sustainable development;
potential hot-spots for each area considering its development risks related to economic, ecological or environmental factors in different combinations;
spatial ranks of territories of the advanced economic development which are necessary for future modeling of different management variants.
The results may be used for elaboration of adequate nature management programs and investments planning. Spatial ranks visualization is helpful for regional economic development management. The future research direction relates to a large-scale analysis following the suggested methodology but it needs the adopted spatial economic development programs for each territory.


