Article

The Distribution Pattern of the Railway Network in China at the County Level

1
Guangdong Key Laboratory of Urban Informatics & Shenzhen Key Laboratory of Spatial Smart Sensing and Services & Research Institute for Smart Cities, School of Architecture and Urban Planning, Shenzhen University, Nanhai Ave 3688, Shenzhen 518060, China
2
Polytechnic Center for Territory Spatial Big-Data, MNR of China, Lotus Pond West Road 28, Beijing 100036, China
*
Author to whom correspondence should be addressed.
ISPRS Int. J. Geo-Inf. 2019, 8(8), 336; https://doi.org/10.3390/ijgi8080336
Submission received: 13 May 2019 / Revised: 24 July 2019 / Accepted: 28 July 2019 / Published: 30 July 2019

Abstract

:
Evaluation of the railway network distribution and its impacts on social and economic development has great significance for building an efficient and comprehensive railway system. To address the lack of evaluation indicators to assess the railway network distribution pattern at the macro scale, this study selects eight indicators—railway network density, railway network proximity, the shortest travel time, train frequency, population, Gross Domestic Product (GDP), the gross industrial value above designated size, and fixed asset investment—as the basis of an integrated railway network distribution index which is used to characterize China’s railway network distribution using geographical information system (GIS) technology. The research shows that, in 2015, the railway network distribution was low in almost half of China’s counties and that there were obvious differences in distribution between counties in the east and west. In addition, multiple dense areas of railway network distribution were identified. The results suggest that it might be advisable to strengthen the connections between large and small cities in the eastern region and that the major urban agglomerations in the midwest could focus on strengthening the construction of railway facilities to increase the urban vitality of the western region. This study can be used to guide the optimization of railway network structures and provide a macro decision-making reference for the planning and evaluation of major railway projects in China.

1. Introduction

Railways are a basic element of transportation systems and have played a key role in social and economic development in many countries since the 19th century. With the recent rapid development of urbanization in China, by the end of 2016, the length of the railway network had reached 1.24 × 10⁵ km, and the length of China’s high-speed rail (HSR) network was nearly 66 times that of the United States (United States: 362 km) [1]. China’s first HSR route (Shenyang–Qinhuangdao), on which trains operate at a speed of 200 km/h, opened in 2003, almost 50 years after the world’s first HSR route in Japan in 1964. By July 2013, however, China had the largest HSR network in the world (at 9760 km), accounting for 46% of the world’s total [2]. At the same time, China’s GDP (USD 11.20 trillion) is only three-fifths that of the United States (USD 18.62 trillion) [1], which implies a potential mismatch between railway investment and economic development and highlights the significance of having an efficient and comprehensive railway system. Evaluating the railway network distribution and its impact on social and economic development is an important area of research in economic geography and regional economics [3,4]. Accessibility has long been a central issue in transport geography and is a commonly used indicator in the field of transportation network analysis, transport planning, and land use [5,6].
Accessibility is a popular measure for assessing the overall spatial structure of a transportation network [7]. In 1959, Hansen was the first to define accessibility as the size of the interactions between nodes in a transportation network, and he suggested a method to measure it in metropolitan areas [8]. In 1979, Morris stated that accessibility is the means to reach a given activity site from a certain place by a specific transportation system [9]. Since the formation of these definitions, accessibility has been a central theme in transportation studies, and its measurement can be divided into three groups based on function: spatial separation, cumulative opportunity, and spatial interaction measures [10]. The first group involves calculating the topological length, the shortest distance, time, or cost between two nodes [11,12], and only measures the connectivity of the transportation network. The second group focuses on the proximity of cities to development opportunities and involves estimating the size of the population or the scale of the economic activities that can be reached from a node within a certain period of time [13,14]. The third group comprises what are called potential values [15,16].
The advantages and disadvantages of the three groups are as follows. The methods of the first group take the cost of the individual flows in the transportation network into account, but do not consider the distance attenuation and the magnitude of the force at each point. The methods of the second group essentially measure accessibility by evaluating the convenience of a certain point of travel, without considering the interaction between the measurement point and the attraction point and the attenuation of its spatial effect with distance. The methods of the third group combine the spatial effect, distance, and gravitational scale of each attraction point in space to measure the accessibility—the larger the force between an attraction point and the measurement point, the smaller the distance between them and the higher the accessibility level.
In summary, scholars have developed research methods and applications for railway accessibility, laying a methodological foundation for the study of railway network distribution. The above methods are used to analyze the spatial effects of transportation accessibility or transportation conditions from different perspectives. However, although many scholars have macroscopically analyzed railway distribution, a method that systematically and comprehensively evaluates the railway network distribution combined with the social economy is still lacking. This is need to further refine the system mechanism of the railway network and shape the regional spatial structure.
Therefore, based on the passenger railway networks, this study constructs a railway network distribution index including assessment of the railway network density, railway network proximity, the shortest travel time, train frequency, and social‒economic indicators, to explore the characteristics of China’s railway network distribution in 2015. This method could be used to optimize railway network structure and as a macro-level decision-making reference for evaluating major railway projects.

2. Materials and Methods

2.1. Research Area and Data Sources
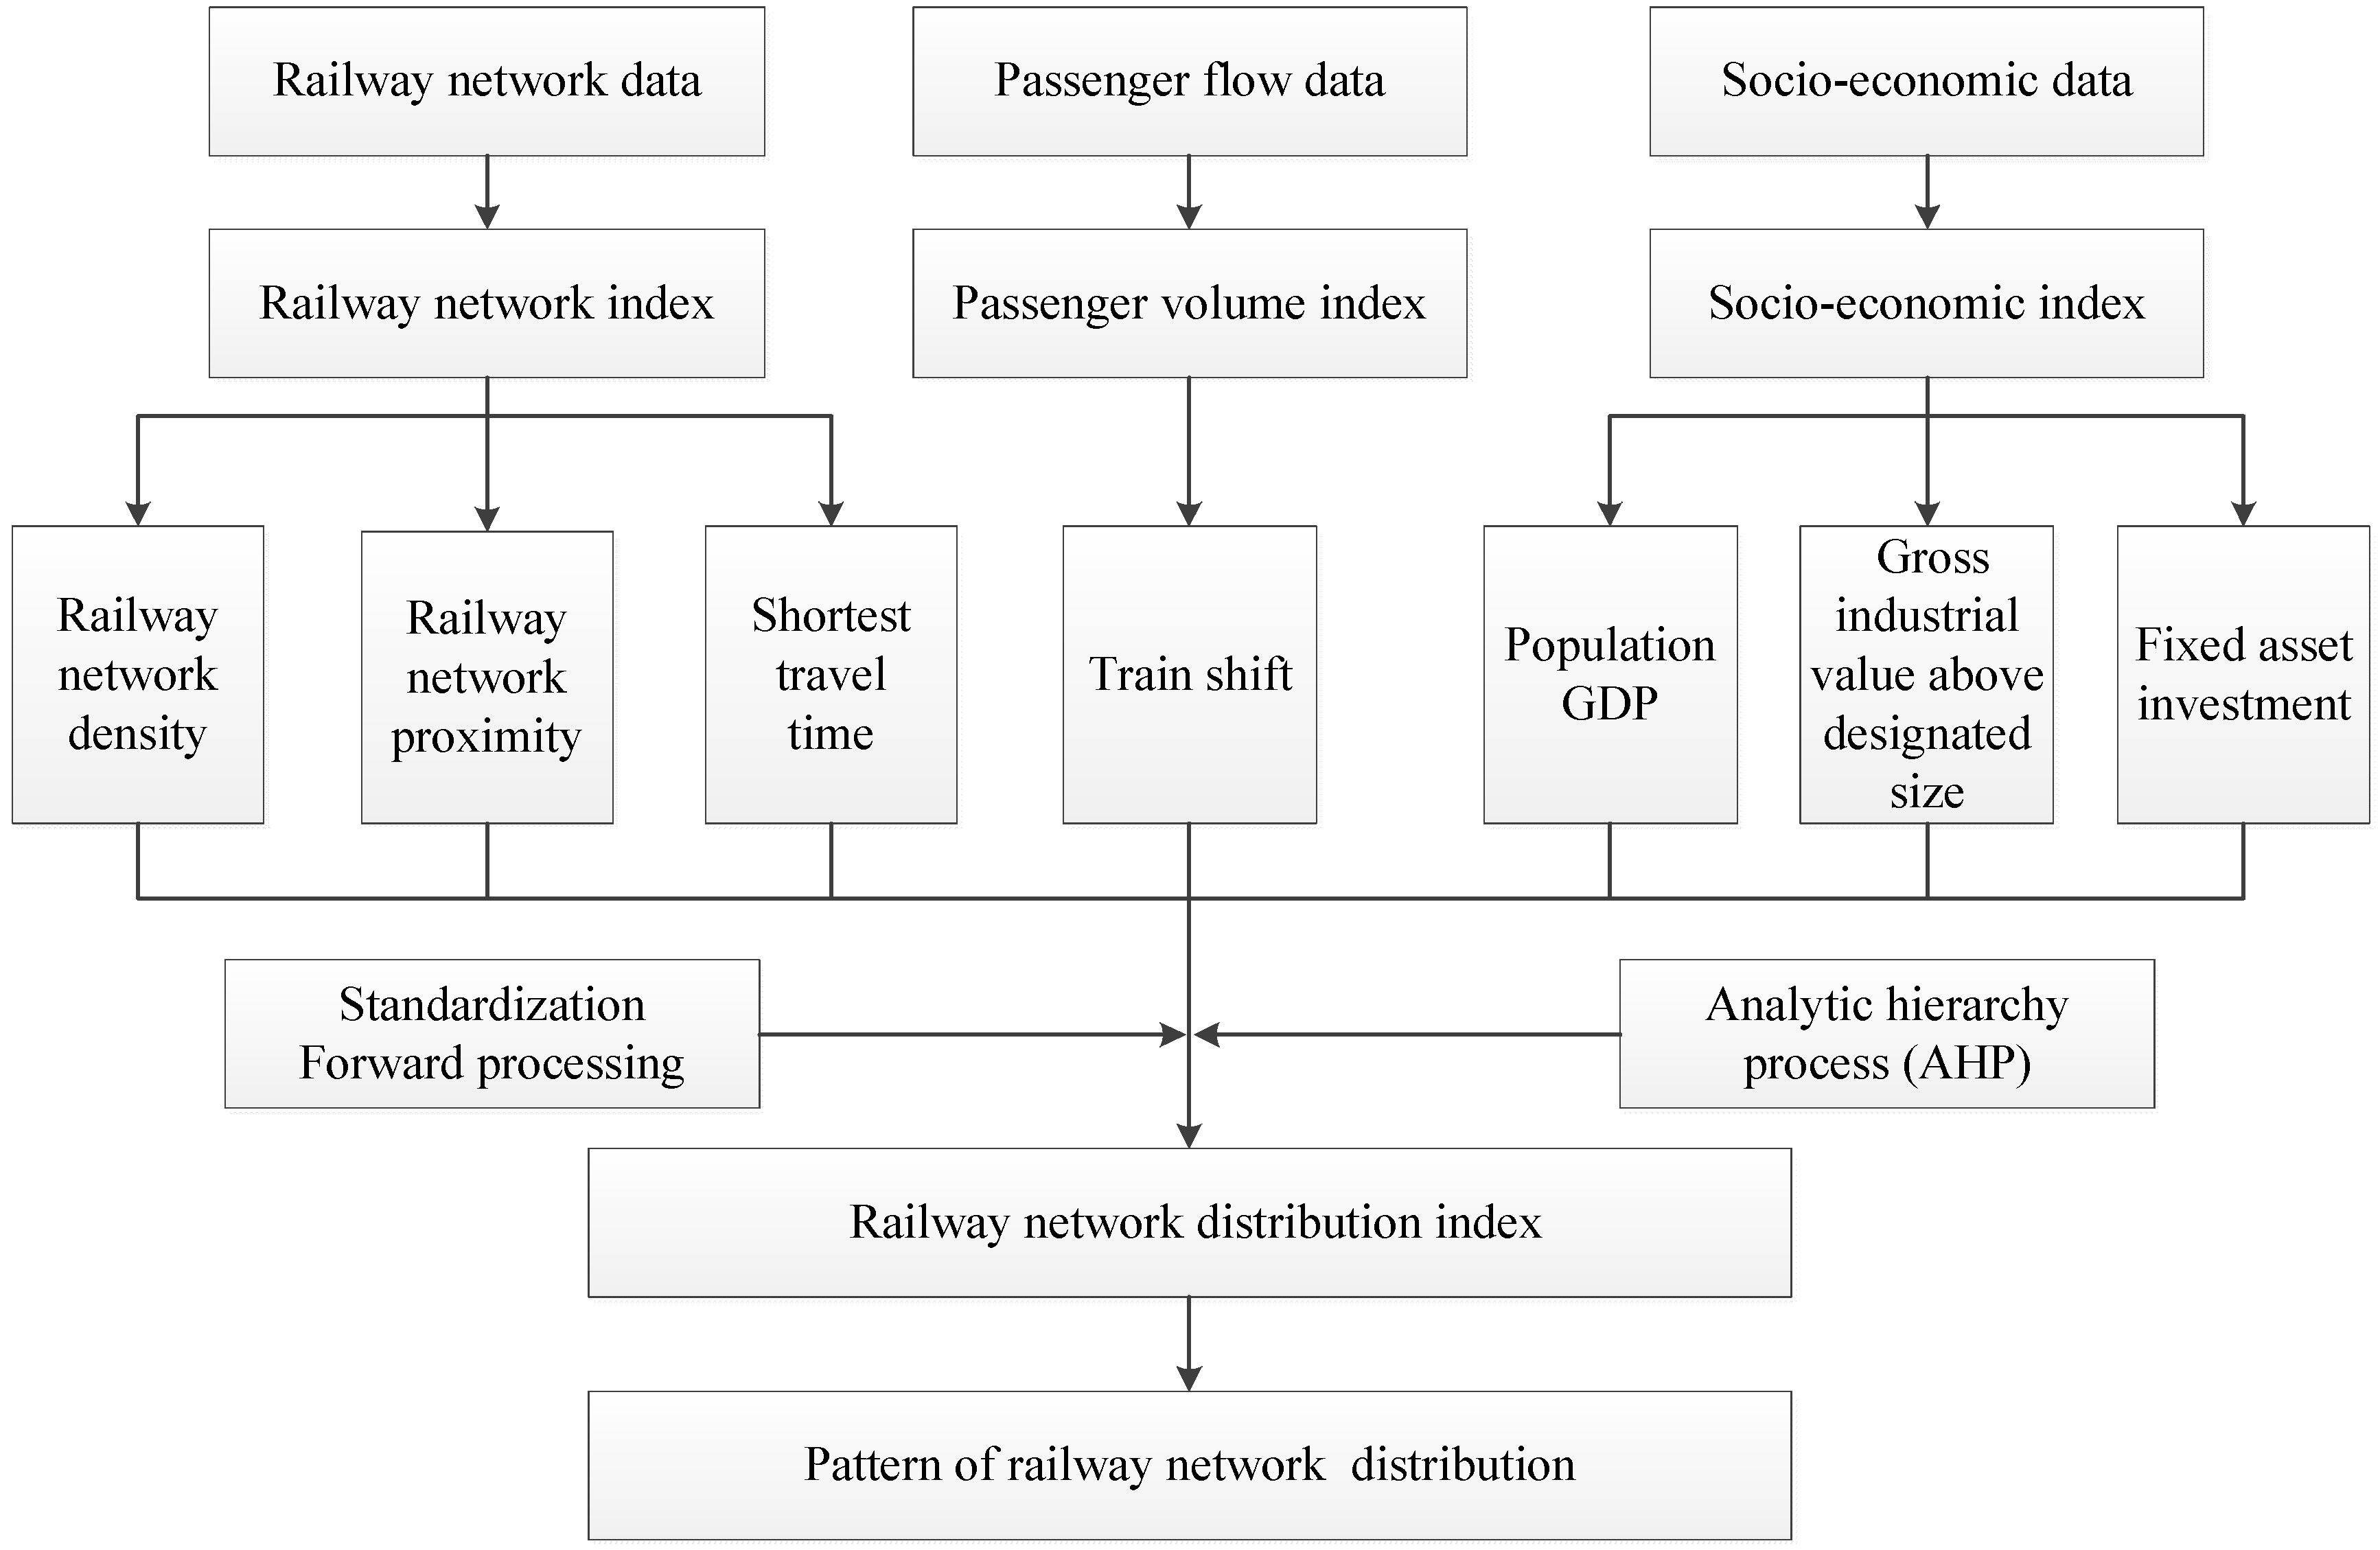
In China, the administrative divisions are divided into provincial administrative districts, prefecture-level administrative districts, county-level administrative districts, and the town-level administrative districts. The county-level administrative districts include city-governed districts, county-level cities, counties, autonomous counties, flags, autonomous flags, special zones, and forest areas [17]. In this study, county-level administrative districts are used as the basic statistical unit, and city-governed districts are merged into one.
There are many distribution structures of urban agglomerations according to different criteria and principles. In China, the main urban agglomerations structures are Shimou Yao’s “6 + 7” plan [18], Chaolin Gu’s “3 + 3 + 7 + 17” plan [19], and Chuanglin Fang’s “5 + 9 + 6” plan [20]. In this paper, Chuanglin Fang’s “5 + 9 + 6” plan is used to discuss the railway network distribution with regard to urban agglomeration, because this plan takes China’s major function-oriented zoning [21] and national urban system planning for 2006–2020 into account [22] and can describe urban agglomeration comprehensively. Focused on the new urbanization policy, this plan scientifically cultivates large, medium and small scale and gradient urban agglomerations, building five national-level urban agglomerations (Yangtze River Delta, Pearl River Delta, Beijing-Tianjin-Hebei, Triangle of Central China, and Chengyu), nine regional-level urban agglomerations (Harbin-Changchun, Shandong Peninsula, Liaozhongnan, West side of the Straits, Central Plains, Guanzhong Plain, Jianghuai, Beibu Gulf, and Tianshan North Slop), and six local-level urban agglomerations (Hubaoeyu, Jinzhong, Ningxia along the Yellow River, Lanxi, Dianzhong, and Qianzhong), promotes the coordinated development of urban agglomerations at different levels, and forms a new system of “5 + 9 + 6” spatial structure of China’s urban agglomerations. This plan provides a scientific prescription for rational construction of urban agglomerations, plays the high-end think tank of the development of the national urban agglomerations, promotes the urban agglomerations as the main body for the new urbanization, and also makes an important decision-making support for the construction of the urban agglomerations.
Due to China’s accelerated economic and social development, the country is divided into four major economic regions: the eastern region, which includes Beijing City, Tianjin City, Hebei Province, Shanghai City, Jiangsu Province, Zhejiang Province, Fujian Province, Shandong Province, Guangdong Province, and Hainan Province; the northeast region, which includes Liaoning Province, Jilin Province, and Heilongjiang Province; the central region, which includes Shanxi Province, Anhui Province, Jiangxi Province, Henan Province, Hubei Province, and Hunan Province; and the western region, which includes Inner Mongolia, Guangxi, Chongqing City, Sichuan Province, Guizhou Province, Yunnan Province, Tibet, Shanxi Province, Gansu Province, Qinghai Province, Ningxia, and Xinjiang [23]. The main features of economic and social development in the various regions are the development of the western region, the revitalization of the northeast region, the rise of the central region, and the leading development in the eastern region.
The specific data sources, shown in Table 1, included (1) land area, population, GDP, gross industrial value above designated size, and fixed asset investment by county-level administrative districts of China for 2015, obtained from the China County Statistical Yearbook and the China City Statistical Yearbook [24,25]; and (2) 2015 vector data of the railway line network, railway stations, and train frequency, acquired from the website of https://www.amap.com/ and the Railway Customer Service Center of China using web crawler technology. Specifically, land area, population, GDP, gross industrial value above designated size, fixed asset investment, and train frequency data are spatialized and divided into each county-level administrative districts of China; the railway line network and railway station data have gone through error analysis and correction, format conversion, projection conversion, scale consistency and other processing, being prepared for the subsequent county-level data overlay analysis.

2.2. Methods

Based on the above data, the aim of this study was to examine the distribution pattern of the railway network at the county level using a new railway network distribution index. In this study, the distribution pattern of the railway network was assessed by the railway network density; railway network proximity; the shortest travel time; train frequency, which reflect the railway frequency of each county; the population; GDP; the gross industrial value above designated size; and fixed asset investments, which provide an indication of the social economic index. These indicators comprehensively reflect the characteristics of railway network distribution from the aspects of regional support ability, external convenience degree, external accessibility, service ability, and coordination with the population and economy [20,26,27].
Based on these indicators, the railway network distribution index reflects the characteristics of railway network distribution. We have selected the analytic hierarchy process (AHP) method to assign the weight of each indicator. The main steps of the method procedure are: (1) the qualitative method is used firstly to select the indicators related to the railway network distribution, then the correlations between these indicators are analyzed, and finally eight indicators with less correlations are selected; (2) we construct the judgment matrix by Delphi expert investigation method, then solve for the weight of each indicator and judge the rationality of the weight vector. AHP provides a new, concise and practical decision-making method for the study of complex system which is composed of interrelated and mutually constrained factors [28].
This study mainly referred to the method proposed by Jin [4] with adaptations to local conditions. In his study, the concept of transportation superiority is presented from three aspects—quality, quantity, and field—to reflect the scale, technical level, and relative advantage of transport infrastructure in China. Then, the transport network density, degree of influence of the transport trunk line, and transport superiority degree of locations are used as basic indicators to express transport superiority by utilizing Geographical Information System (GIS) technology. Based on the concept of transportation superiority, we used eight indicators to indicate the railway network density, railway network proximity, the shortest travel time, train frequency, and also social‒economic indicators, which are better able to describe the characteristics of railway network distribution.
The specific technical process is shown in Figure 1. The main research steps are as follows: (1) based on railway vector data, the railway network density was used to evaluate the supporting capacity of railway network facilities, and it is mainly applicable to linear transportation facilities [29,30]; (2) based on the location of the county center and railway station, the railway network proximity was used to reflect the convenience of the county with respect to other counties, the higher the proximity, the better the traffic conditions, the higher the support for regional development, and the greater the potential for external connection [31,32]; (3) based on the train frequency data, the shortest travel time was used to reflect the accessibility of the railway network, and the train frequency data also reflected the external service capacity of each railway station. In China, the railway is the main mode of transportation for medium—and long-distance passenger transportation, and the shortest travel time directly reflects the importance and connectivity of the county in the national railway network [33,34]; (4) the above indicators combine social and economic factors, such as population, GDP, gross industrial value above designated size, and fixed asset investment, to depict the pattern of the overall railway network distribution.
The specific methods for determining the distribution pattern of the railway network in China at the county level were as follows:
(1) Railway network density, C 1 i
The railway network density can be used to evaluate the supporting ability of railway infrastructure to regional development. Railway network density is a positive indicator: the larger its value, the denser the railway network and the better the regional railway conditions. Let the railway network density of county i be C 1 i , the length of the railway network of county i be L i , and the area of county i be A i ; then the county railway network density can be calculated as follows:
C 1 i = L i A i i = ( 1 , 2 , 3 , , n ) .
(2) Railway network proximity, C 2 i
This reflects the ease of traveling from a county to other counties via the proximity of its railway network. In general, proximity is used to describe the reachability of two features in geographical space. In this study, proximity was used to characterize the impact of railways on regional transportation advantages. Based on the distance from the nearest railway station to the county center, qualitative indicators were quantified using expert scoring, and then a proximity value was assigned and classified. Table 2 presents the proximity of the railway network infrastructure in county i, and the distance from the nearest railway station to the center of county i is used to determine the weight; i represents a county in China. The expression of the proximity is as follows:
C 2 i = P i i = ( 1 , 2 , 3 , , n ) .
(3) The shortest travel time, C 3 i
The shortest travel time reflects the accessibility of the railway network in a region and is an important indicator to measure the external connections of a railway network. The shortest travel time is an hour, and the higher this value is, the worse the accessibility is.
This study used the train frequency data to calculate the overall shortest time in each county. T i j is the shortest railway time in county i and county j, and when there was no railway connection between the two counties, it was assumed that the shortest travel time was the maximum time for the railway service that can connect county i and county j. N is the number of counties in the region. The expression of the shortest travel time is as follows:
C 3 i = j = 1 n T i j n i = ( 1 , 2 , 3 , , n ) .
(4) Train frequency, C 4 i
Train frequency data can reflect the railway’s service to the county area. i represents the county of China, while m i is the number of train frequency through county i:
C 4 i = m i i = ( 1 , 2 , 3 , , n ) .
(5) Railway network distribution index, C
We integrated the railway network density C 1 i , railway network proximity C 2 i , the shortest travel time C 3 i , the train frequency C 4 i , socioeconomic indicators of the population C 5 i , the GDP C 6 i , the gross industrial value above designated size C 7 i , and fixed asset investment C 8 i , through the analytic hierarchy process (AHP) method and, combined with the existing research results [4], a railway network distribution index model was constructed. First, as an intermediate step, the eight indicators were standardized; as shown in Equation (5). C j i is the normalized value of index j in county i, E j i is the original value of index j in county i, M a x ( E j i ) is the maximum value of index j in county i, and M i n ( E j i ) is the minimum value of index j in county i (j = 1, 2, 3, 4, 5, 6, 7, 8, i ( 1 , 2 , 3 , , n ) ).
C j i = E j i M i n ( E j i ) M a x ( E j i ) M i n ( E j i ) .
Secondly, the inverse indicator, such as the shortest travel time of the railway, was used to forward the reverse index. Thirdly, according to the degree of action of each indicator in the railway network distribution, the judgment matrix was constructed, and the weight of each indicator a j was calculated by AHP.
Hence, the railway network distribution index, C , of each county i can then be expressed as
C = j = 1 8 a j × C j i ( j = 1 , 2 , 3 )
where a j is the weight of each indicator, determined using the AHP.

3. Results

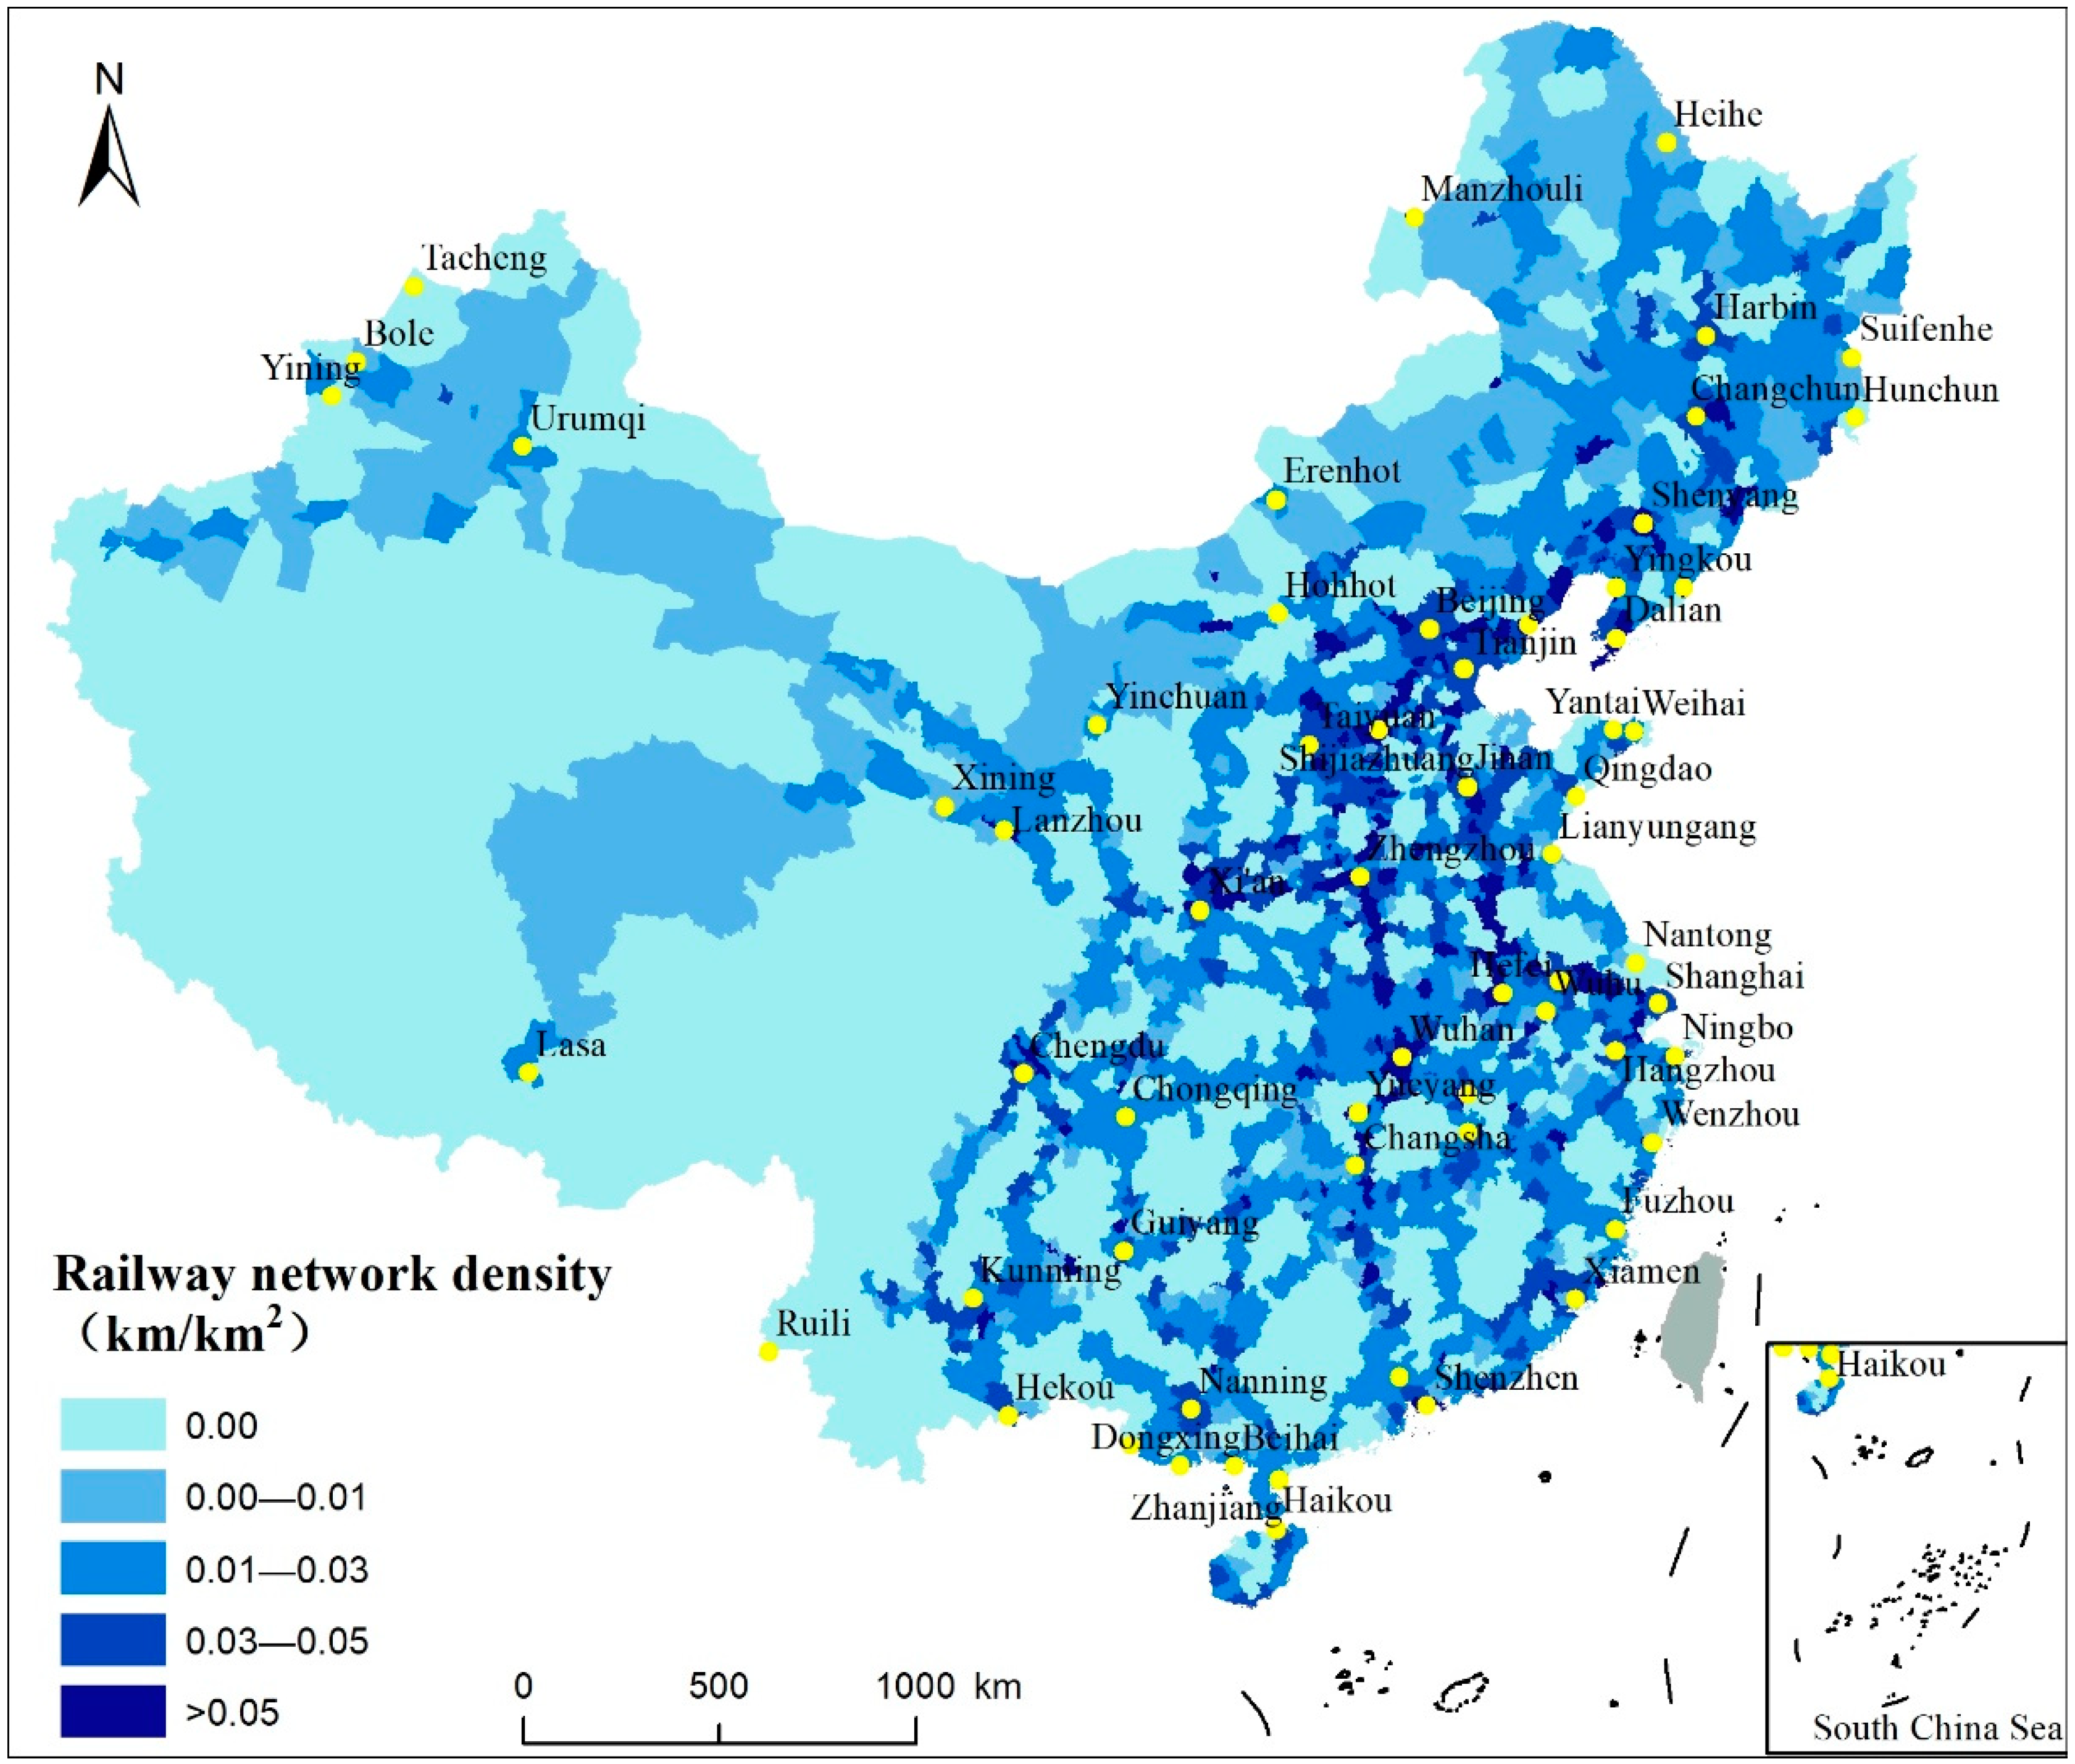
3.1. Spatial Pattern of Railway Network Density

China’s railways, which are divided into ordinary and high-speed railways, currently provide important support for regional external relations. Figure 2 shows the distribution pattern of the railway network density based on the county-level administrative regions of China and reflect the ability of railway facilities to support the development of a county.
The following features of the distribution pattern of the railway network density are noteworthy: (1) The total length of railways in China is 77,800 km, and the total railway network density is 0.0082 km/km2. According to medium- and long-term railway network planning (2016‒2030), by 2025, the railway network needs to reach about 175,000 km, of which the high-speed railway will account for about 38,000 km. (2) Railway connections are not found in 44.79% of counties. The lengths of railways are relatively short in some counties, so their densities are also low. For example, the railway network density between 0 and 0.01 km/km2 in 195 counties (8.83% of all counties), and such counties have low support capacity for development. The railway network density is between 0.01 and 0.03 km/km2 in 617 counties (27.94% of total counties); between 0.03 and 0.05 km/km2 in 253 counties (11.46%). Only 6.97% of counties have railway network densities higher than 0.05 km/km2, and the railway contributes significantly to the development of these counties. (3) Railway network density is high in the central and eastern parts of China, while it is relatively low in the western part of China. In eastern China, in particular, the railway network density of the south is lower than that of the north. (4) Some regions of the railway network are particularly dense, including the Beijing‒Tianjin region, the Yangtze River Delta region, and the Zhengzhou, Wuhan, and Chengdu Economic Zone. These areas have high spatial coupling with economic agglomeration and an urban system [36]; thus, railway networks have a significant ability to support the socioeconomic development of China’s dense urban areas.
Generally speaking, the development of China’s railway network has supported the rapid urbanization process to a certain extent, but based on the considerable population and economic scale, the construction of the railway network needs to be strengthened further to realize national railway connectivity, high-speed railways between provincial capitals, the rapid arrival of intercity railways, and the distribution of basic coverage to all counties by 2030 [37].

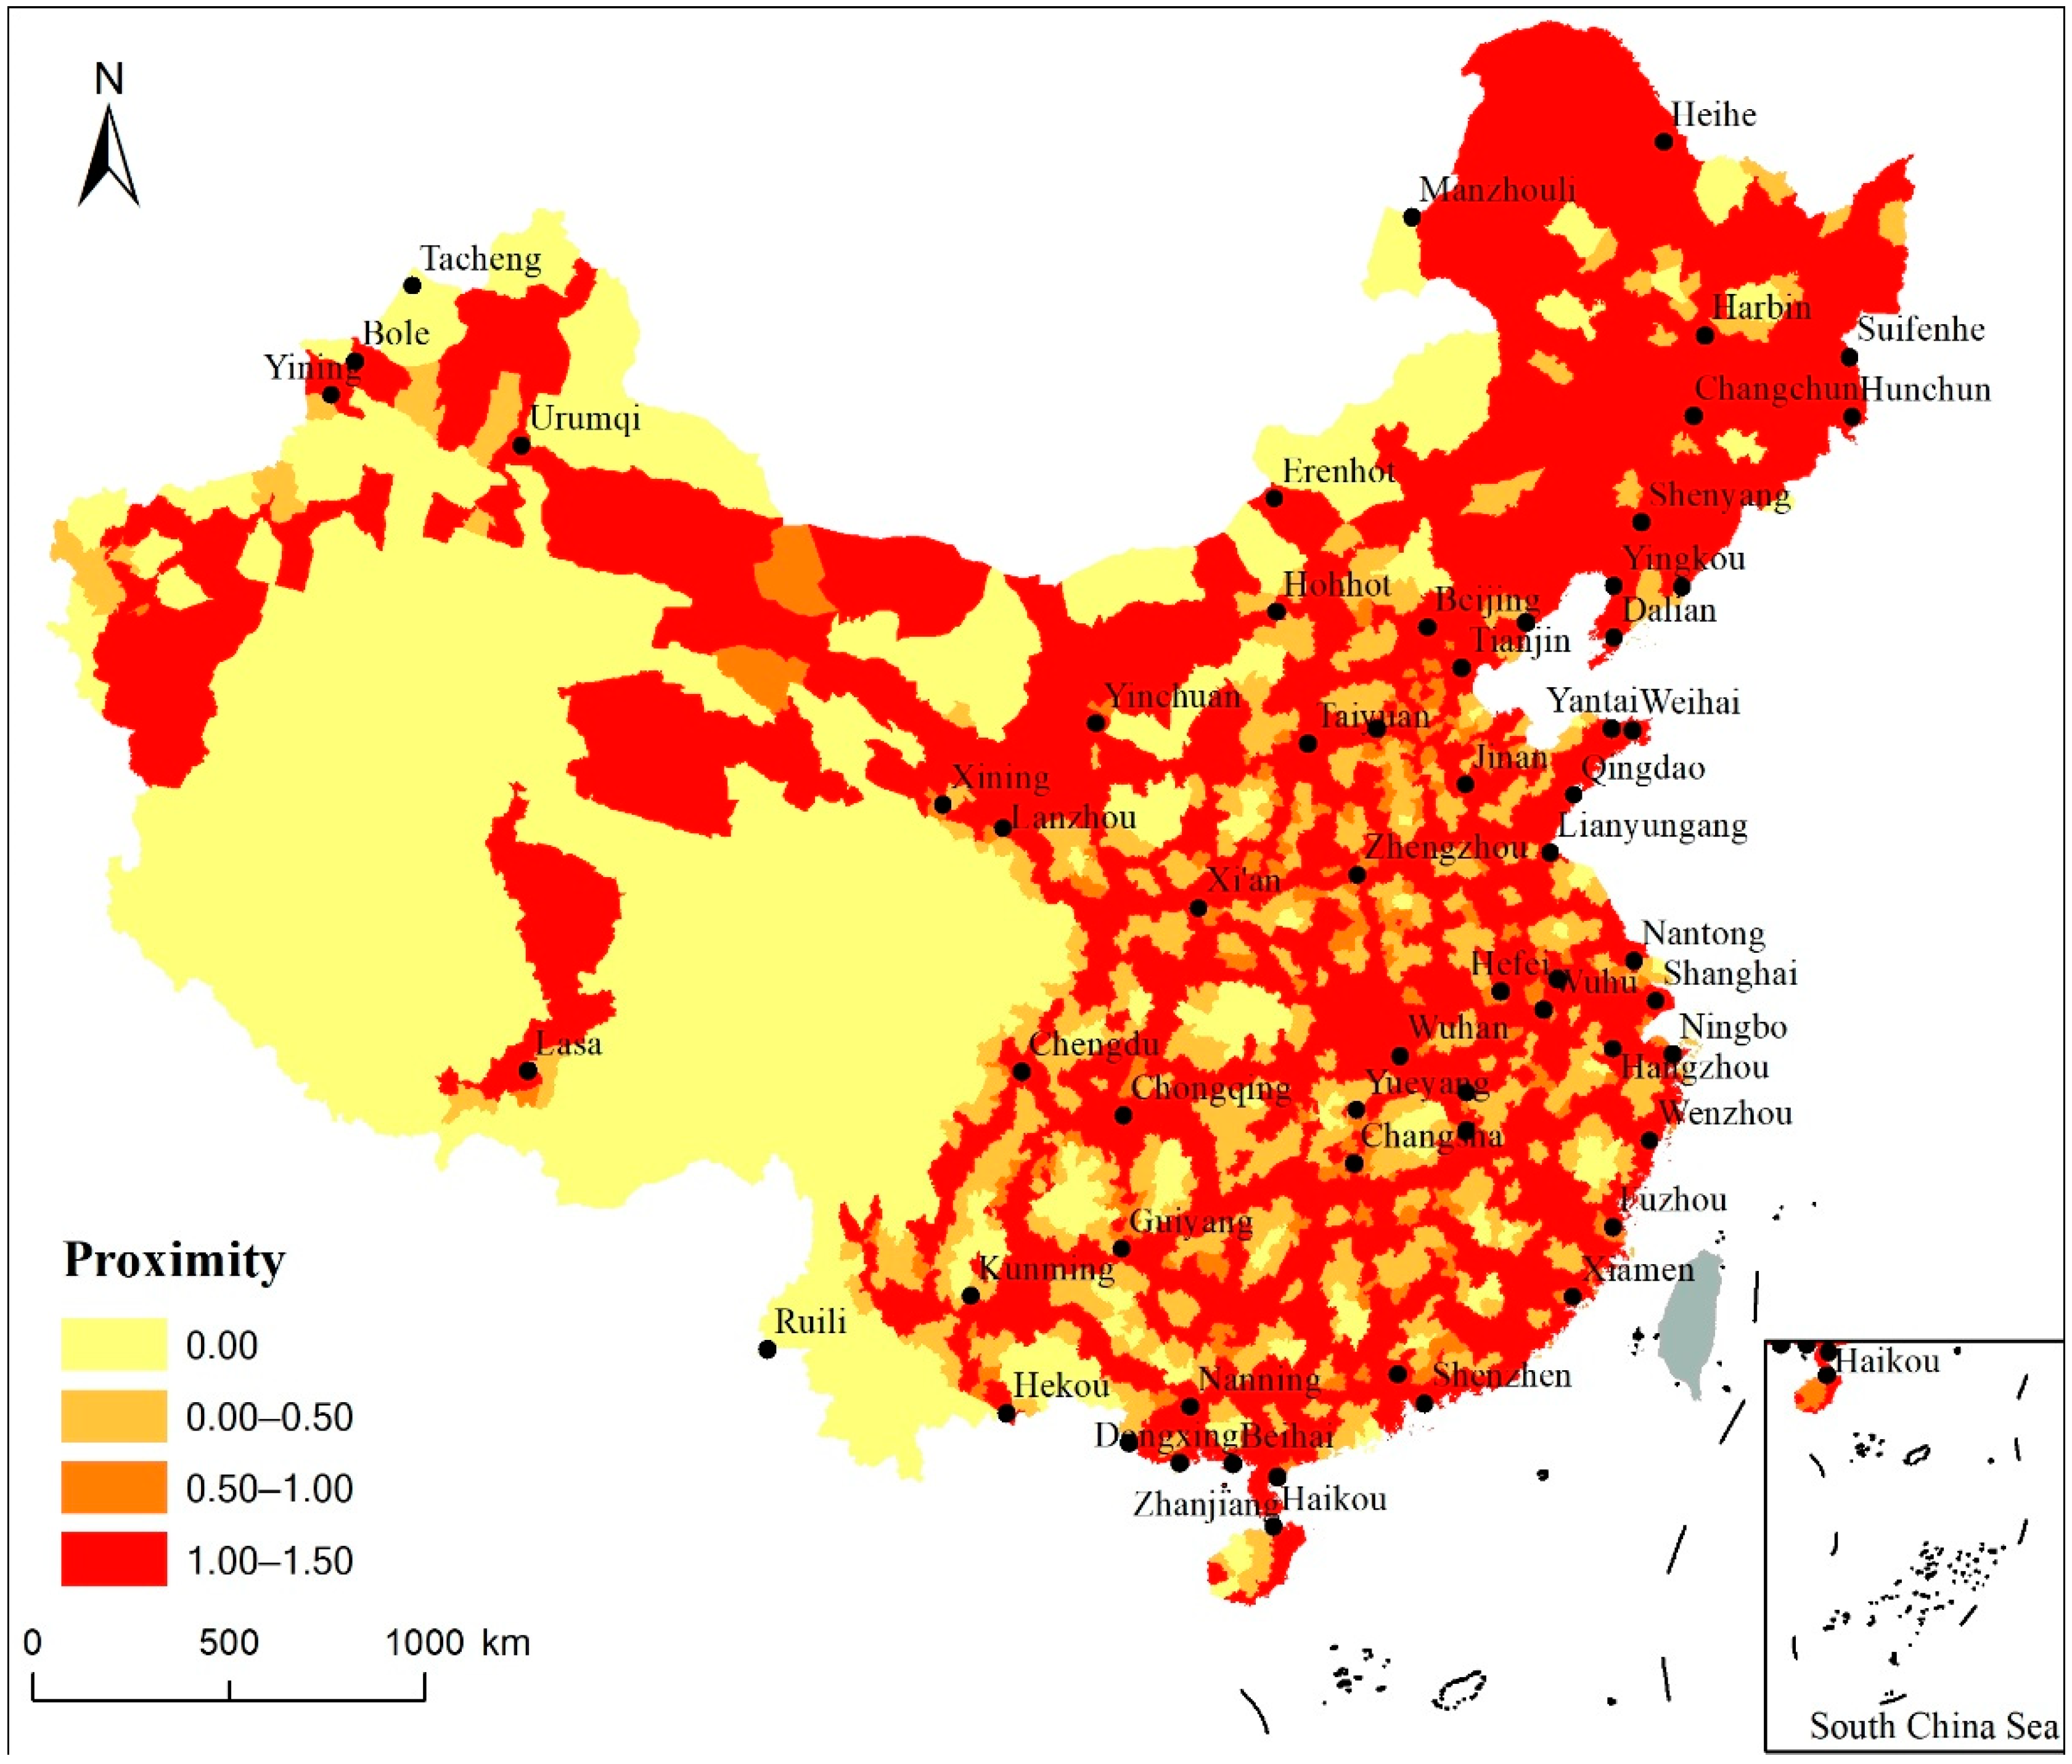
3.2. Spatial Pattern of Railway Network Proximity

The railway network proximity can reflect the external accessibility and convenience of travel of a county. The spatial pattern of railway network proximity at the county level is shown in Figure 3, and has the following main characteristics: (1) The railway network proximity is 0 in 369 counties (16.71% of all counties), indicating a lack of accessibility. The number of counties with a railway network proximity of 0–0.5, and thus a lower supporting capacity for development, is 486 (22.01% of the total). The railway network proximity of 168 counties is in the range 0.5–1.0 (7.61% of all counties), suggesting a positive effect of the railway network on the development of these counties. The highest railway network proximity is found in 53.67% of the counties in China, which indicates that the railway network plays an important role in the development of these counties. (2) The railway network proximity is high in the central and eastern parts of China, but relatively low in western China, which indicates that railway network proximity has a stronger supporting capacity in eastern counties than in western counties. (3) In eastern China, there is a clear spatial difference in railway network proximity between the north and the south. For example, the northeastern region, Inner Mongolia, the capitals of Ningxia and Qinghai provinces, Beijing‒Tianjin‒Hebei, the Yangtze River Delta, Wuhan, and Chongqing have a high railway network proximity, while the southern region has a low railway network proximity and presents a strip distribution.

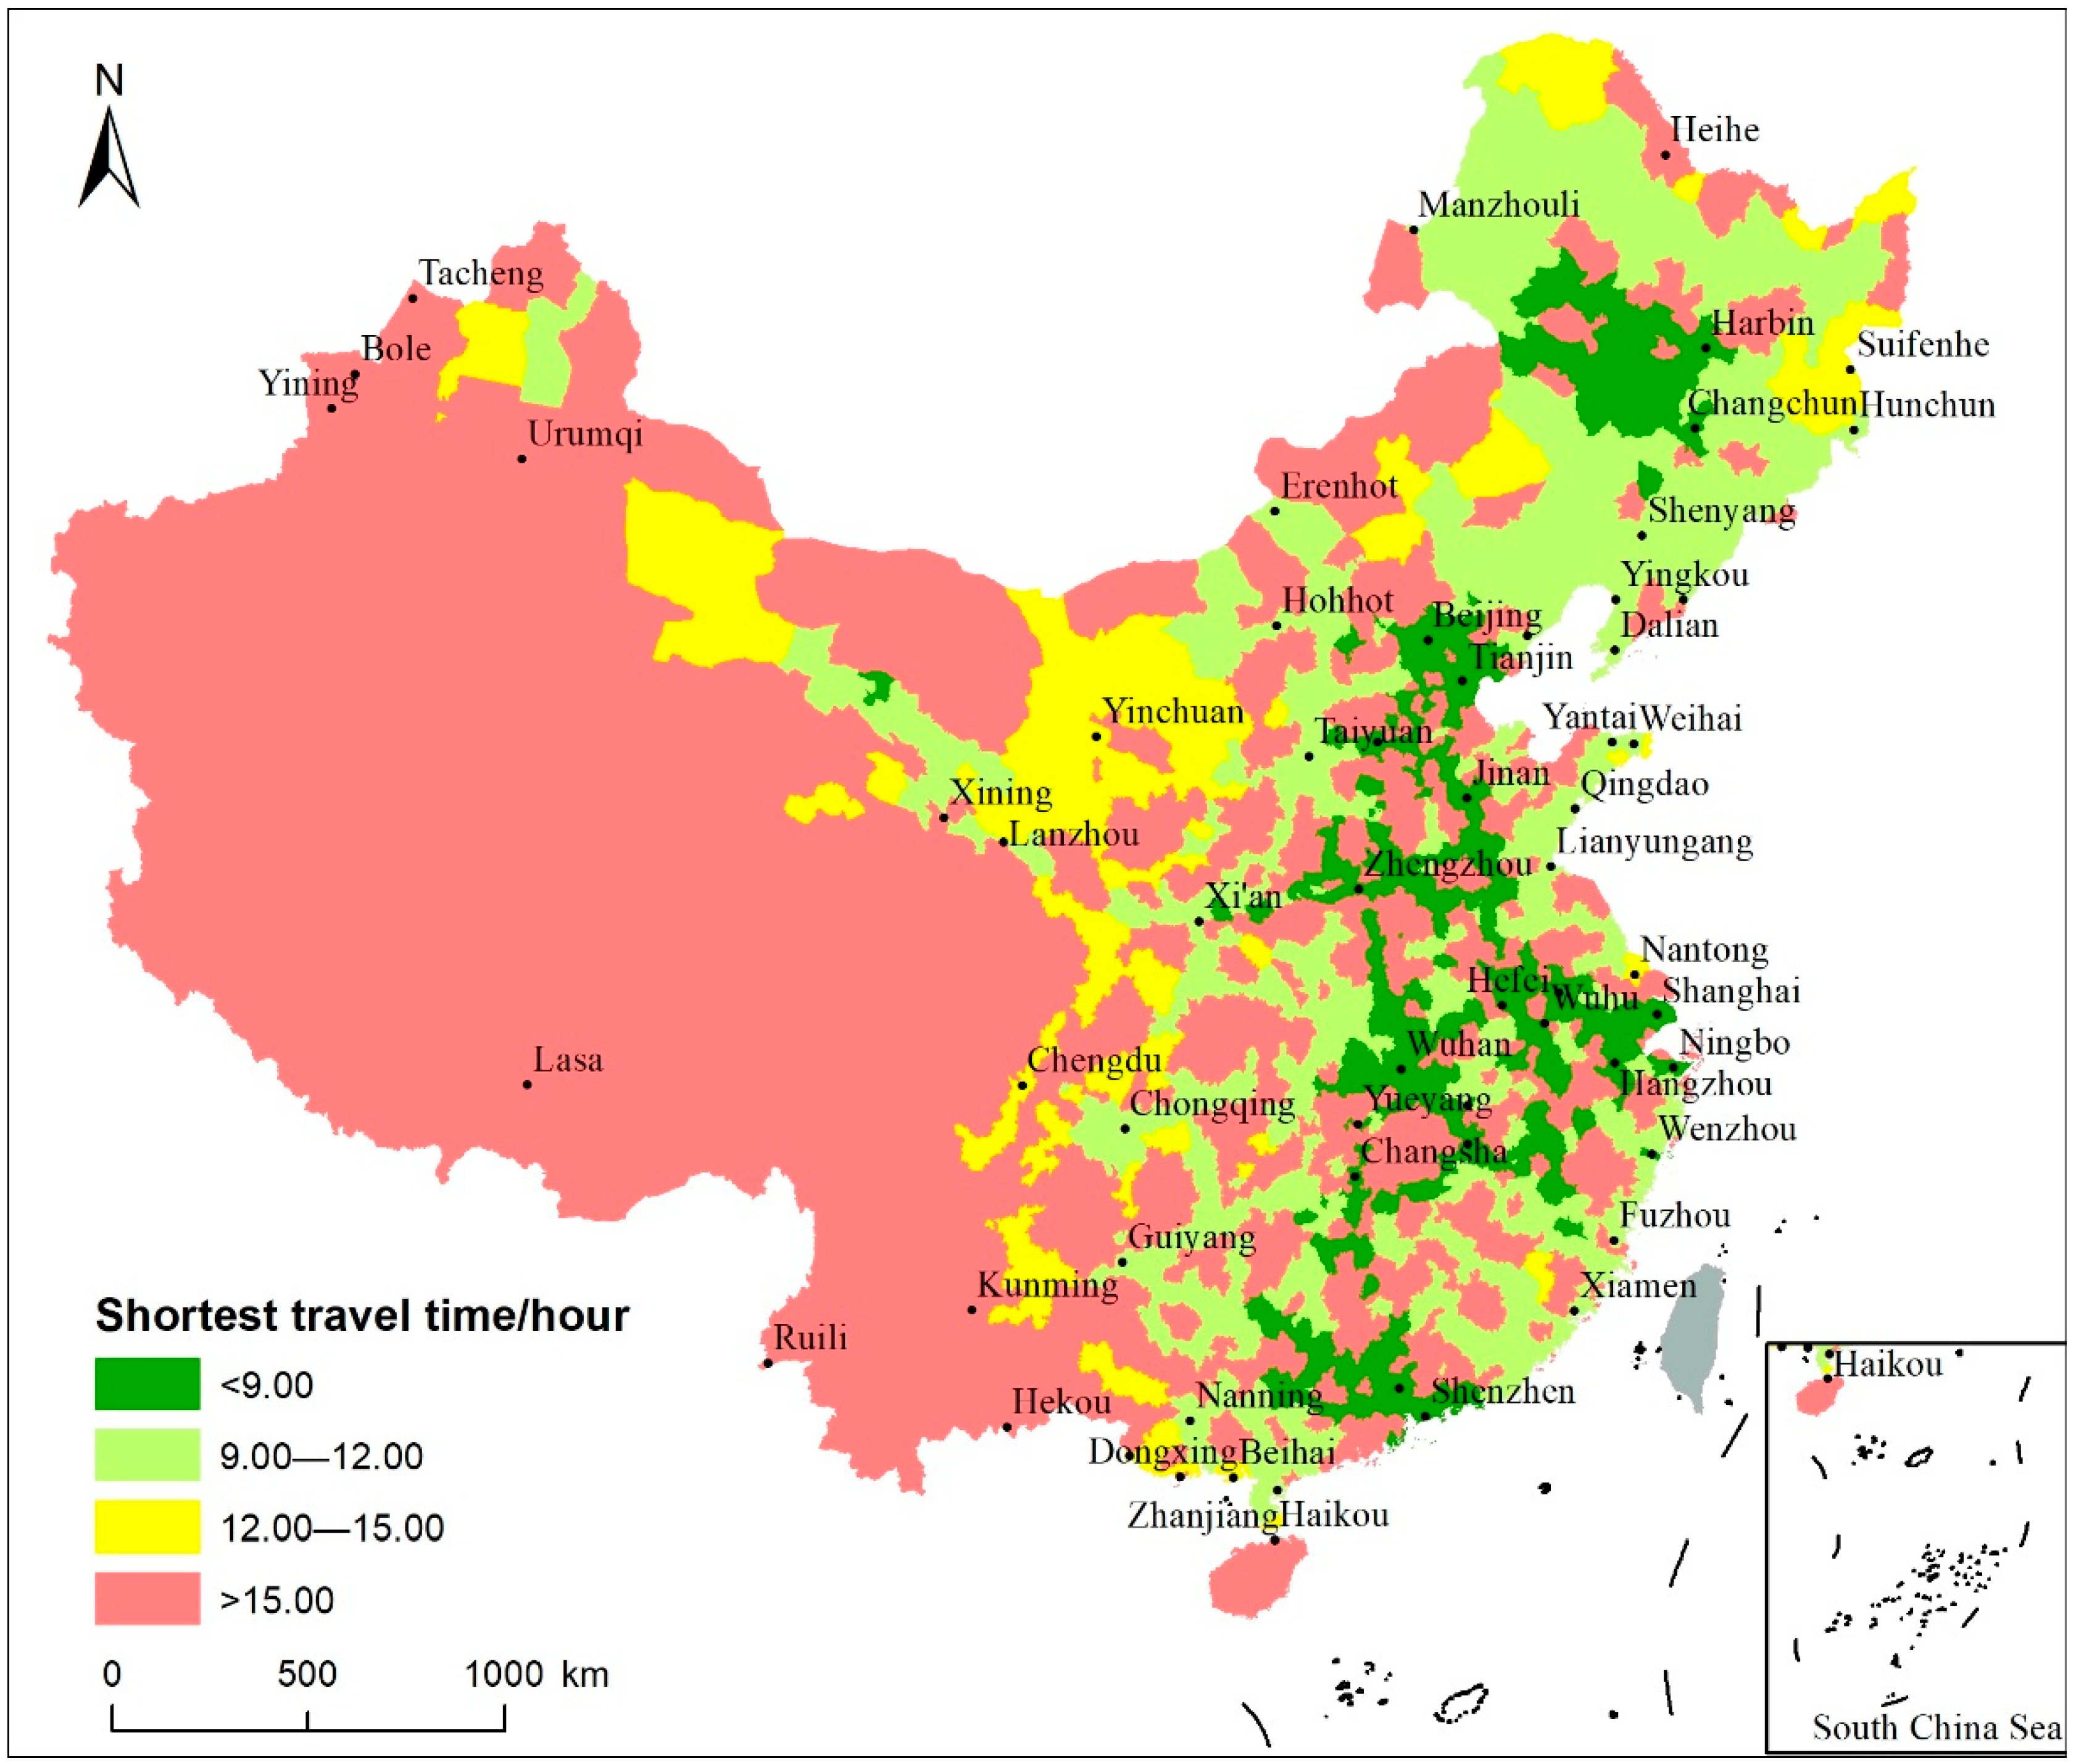
3.3. Spatial Pattern of the Shortest Travel Time

The shortest travel time shows the external connectivity of the railway network and is an important indicator to measure the regional railway network structure and external geographical connections. The spatial pattern of the shortest travel time at the county level is shown in Figure 4, and has the following main characteristics: (1) The shortest travel time is less than 9 h in 304 counties (13.77%), indicating that these counties have the highest degree of ease of external connection. The shortest travel time is 9–12 h in 594 counties (26.90%; higher degree of ease of external connection); 12–15 h in 166 counties (7.52%; lower degree of ease of external connection); and greater than 15 h in 1144 counties (51.81%; lowest degree of ease of external connection). (2) The shortest travel time has significant spatial differences throughout the country, characterized by a gradual rise from the coast to inland, and a concentration of areas with the shortest travel time in the eastern region. (3) Hachang agglomeration, Beijing‒Tianjin‒Hebei, the Yangtze River Delta (Shanghai, Nanjing, Hefei, and Hangzhou), the Pearl River Delta, Wuhan, Nanchang, and Changsha have the shortest travel time, and cover a wide area.
Generally speaking, based on the shortest travel time, the convenience of the railway network in China is generally low. On the one hand, this is due to restrictions placed on the construction of railways by the natural terrain; on the other hand, because the national railway system is not perfect, it is still necessary to strengthen the railway links and exchanges within the inter-regional and urban agglomerations.

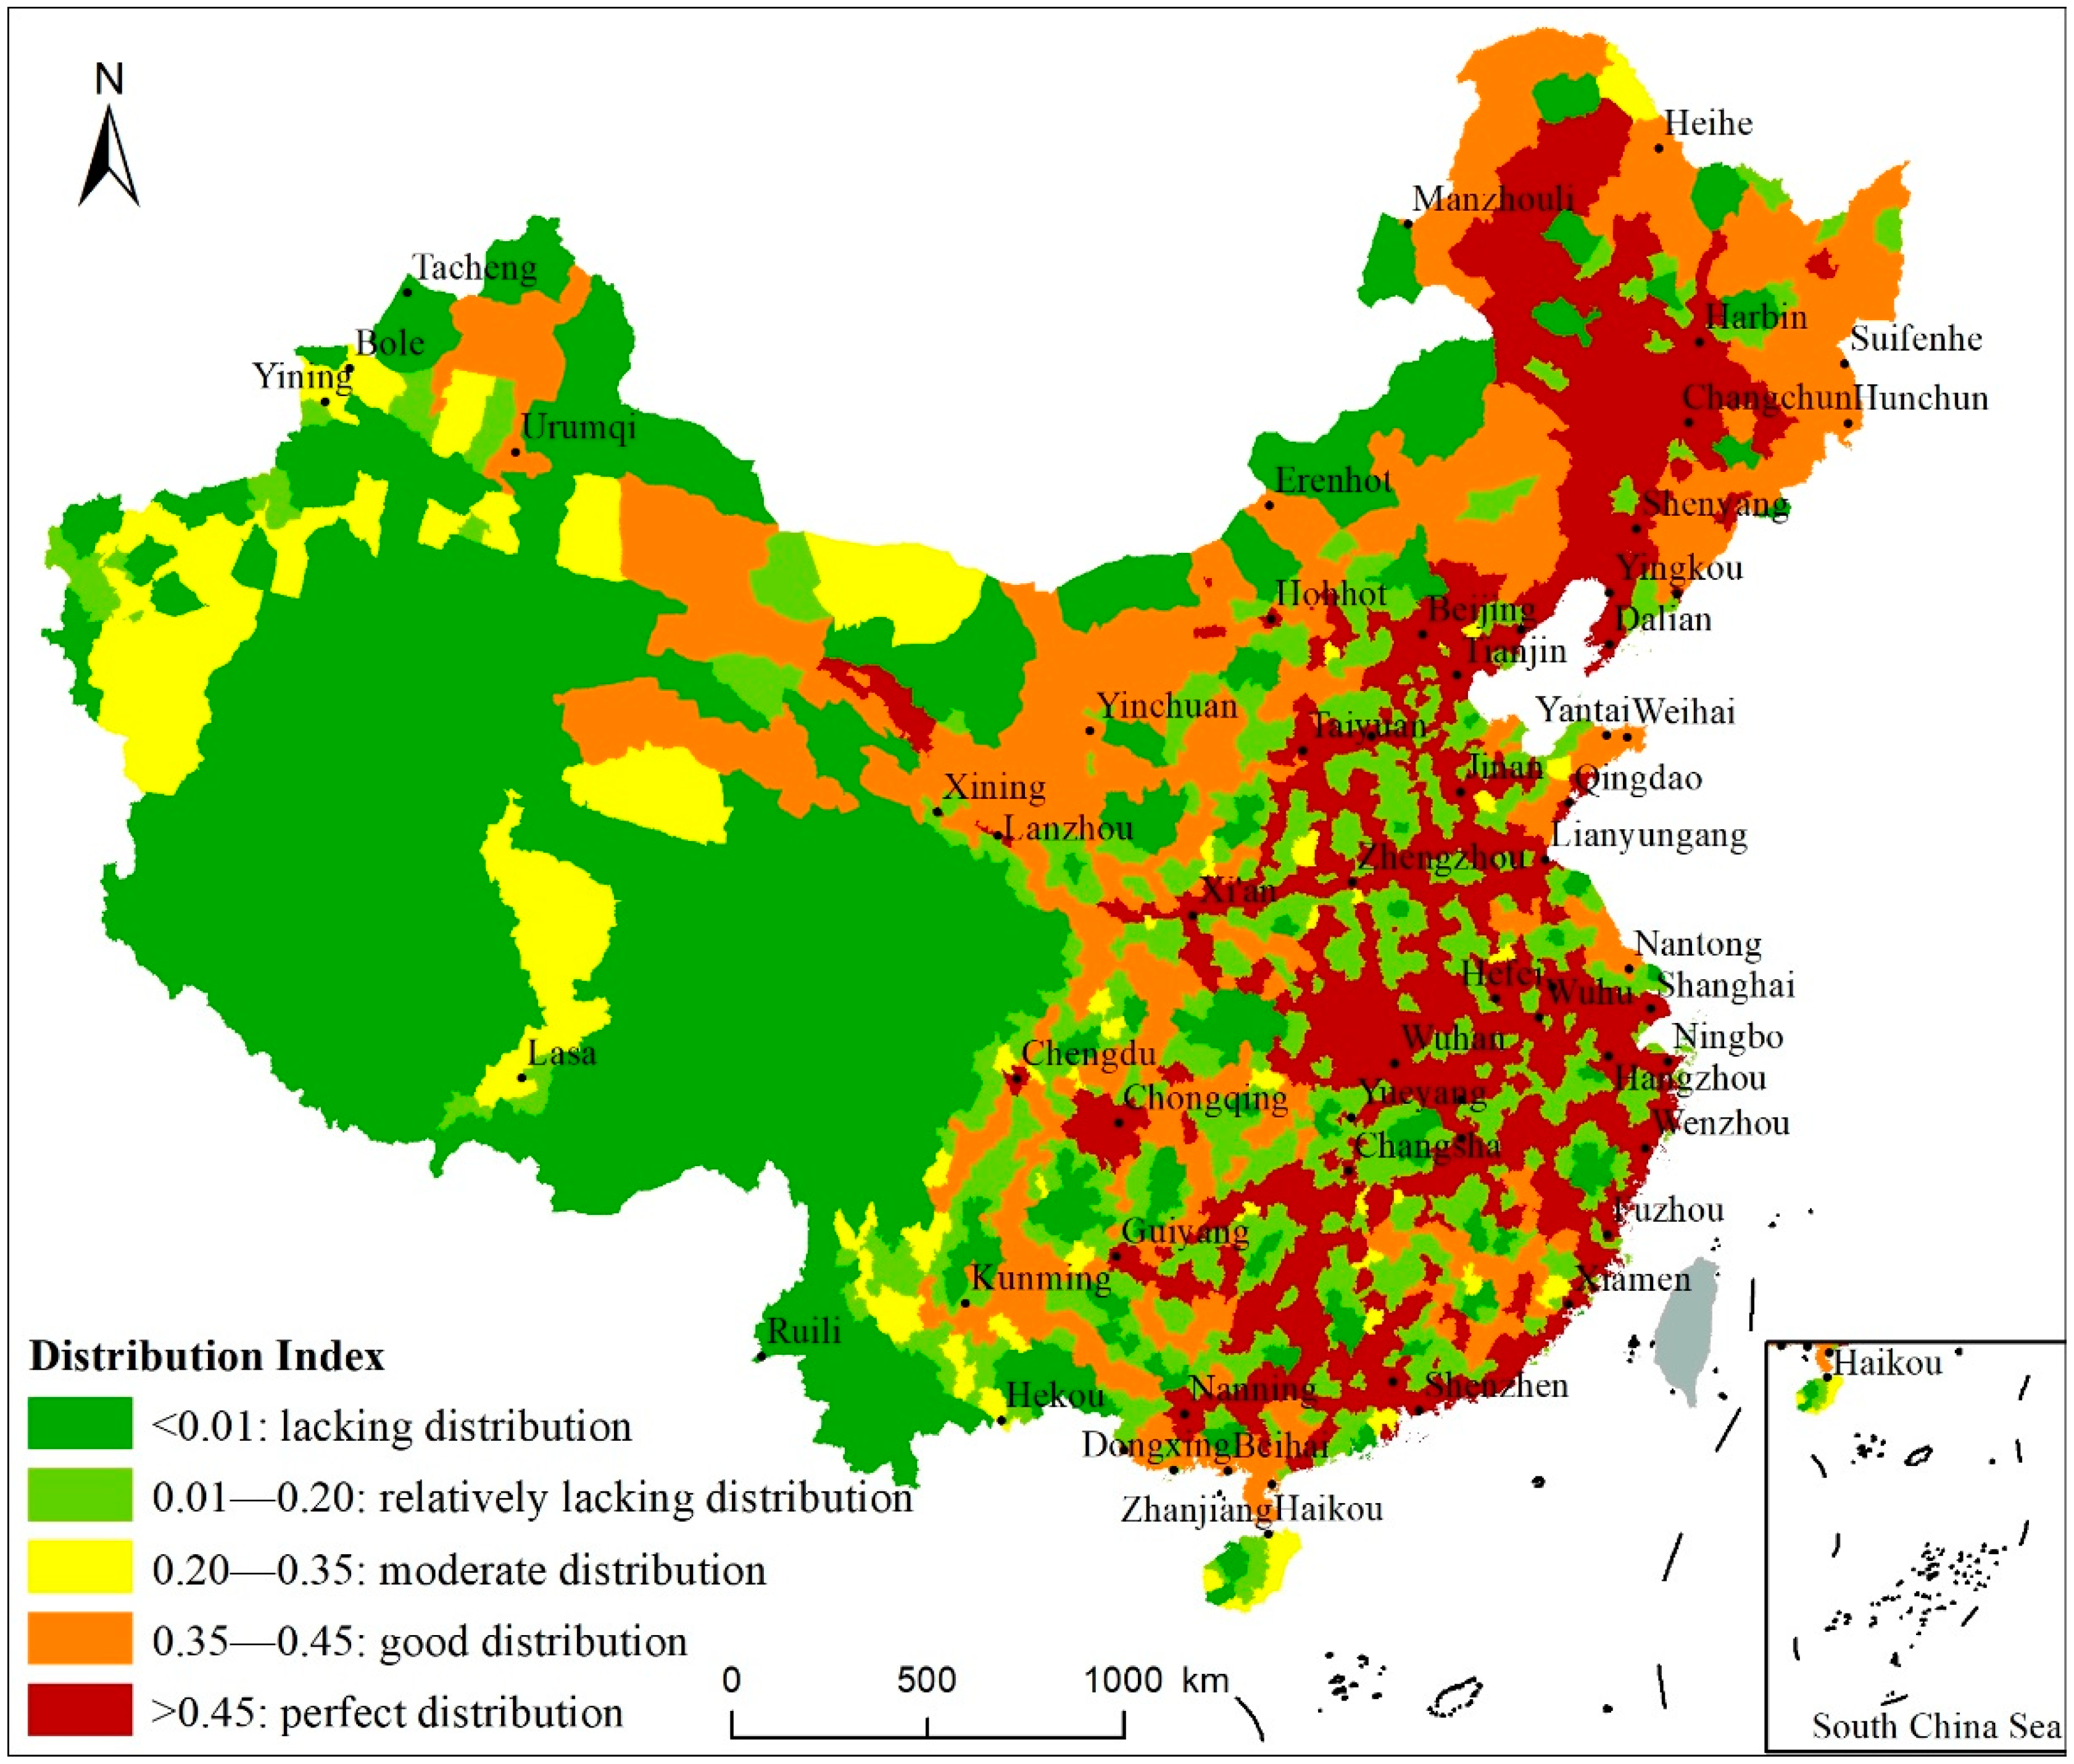
3.4. Spatial Pattern of Railway Network Distribution

The railway network density, railway network proximity, and the shortest travel time reflect the contribution of the railway network to each county’s development, and demonstrate the counties’ future development potential. Integrating these three indicators and combining train frequency, population, GDP, gross industrial value above designated size, and fixed asset investment, the spatial pattern of the railway network in China was determined by setting the weight of each factor using the AHP method, as shown in Figure 5. The weights of each indicator obtained by the AHP method were 0.1569, 0.2273, 0.3268, 0.1077, 0.0242, 0.0734, 0.0498, and 0.0340, respectively, and the consistency ratio was found to be CR = 0.03 < 0.1 which was through the consistency test. Hence, the normalized eigenvectors can be used as weight vectors.
The railway network distribution index is divided into five levels, namely, 0–0.01, lacking railway network distribution; 0.01–0.20, relatively lacking in railway network distribution; 0.20–0.35, moderate railway network distribution; 0.35–0.45, good railway network distribution; and >0.45, perfect railway network distribution. The following are the main observations of the railway network distribution in China: (1) 660 counties (29.89%) have a perfect railway network distribution, which provides the strongest support for future development; 423 counties (19.16%) have a good railway network distribution, indicating strong support for future development; 99 counties (4.48%) have moderate railway network distribution, and railway facilities in these areas have general support capacity but have strong development potential and opportunities; and 1026 counties (46.47%) lack railway network distribution and do not provide enough support for future development. (2) The railway network distribution index shows a pattern of decline from coastal counties toward the interior of the country, with the highest railway network distribution indices in coastal counties and the lowest indices in western counties and parts of central counties. (3) The railway network distribution index is significantly higher in central and eastern counties than in western counties, for example, Beijing‒Tianjin‒Hebei, the Yangtze River Delta, the Pearl River Delta, Chengdu‒Chongqing, the Wuhan metropolitan area, the North Gulf Area, Shandong Peninsula, and Hachang District have higher railway network distributions than other areas of China, and also have strong development support.
Generally speaking, the railway network distribution of China is relatively effective, especially in the eastern region, where a relatively complete railway connection network exists, while the western region has a relatively inadequate network distribution. In the future, it might be advisable to strengthen the connections between large cities and small cities in the eastern region, so that large cities can drive the development of small cities around them. The major urban agglomerations in the central and western areas also could focus on strengthening the construction of railway facilities to promote the movement of people and industries between the east and west regions, thereby increasing the urban vitality of the western region.
The distribution of railway network and economic development are mutually influential. The construction of railway infrastructure would promote the economic development of the region. Similarly, the economic development would also affect the operation and development of the railway infrastructure of the region. In this study, it is reasonable to take population and economic factors as indicators that reflect the characteristics of railway network distribution. Many scholars have studied the relationship between transportation infrastructure network and economic development, which was the ’chicken and egg’ problem. For example, Xie and Levinson (2009) provided an overview of transportation networks following five main streams: network growth in transport geography; traffic flow, transportation planning, and network growth; statistical analyses of network growth; economics of network growth; and network science [38]. The review pointed out the positive interaction between economic development and transportation network construction. Levinson (2007) examined the changes that occurred in the rail network and density of population in London during the 19th and 20th centuries, and the research found that there was a positive feedback effect between population density and network density [39].

4. Discussion

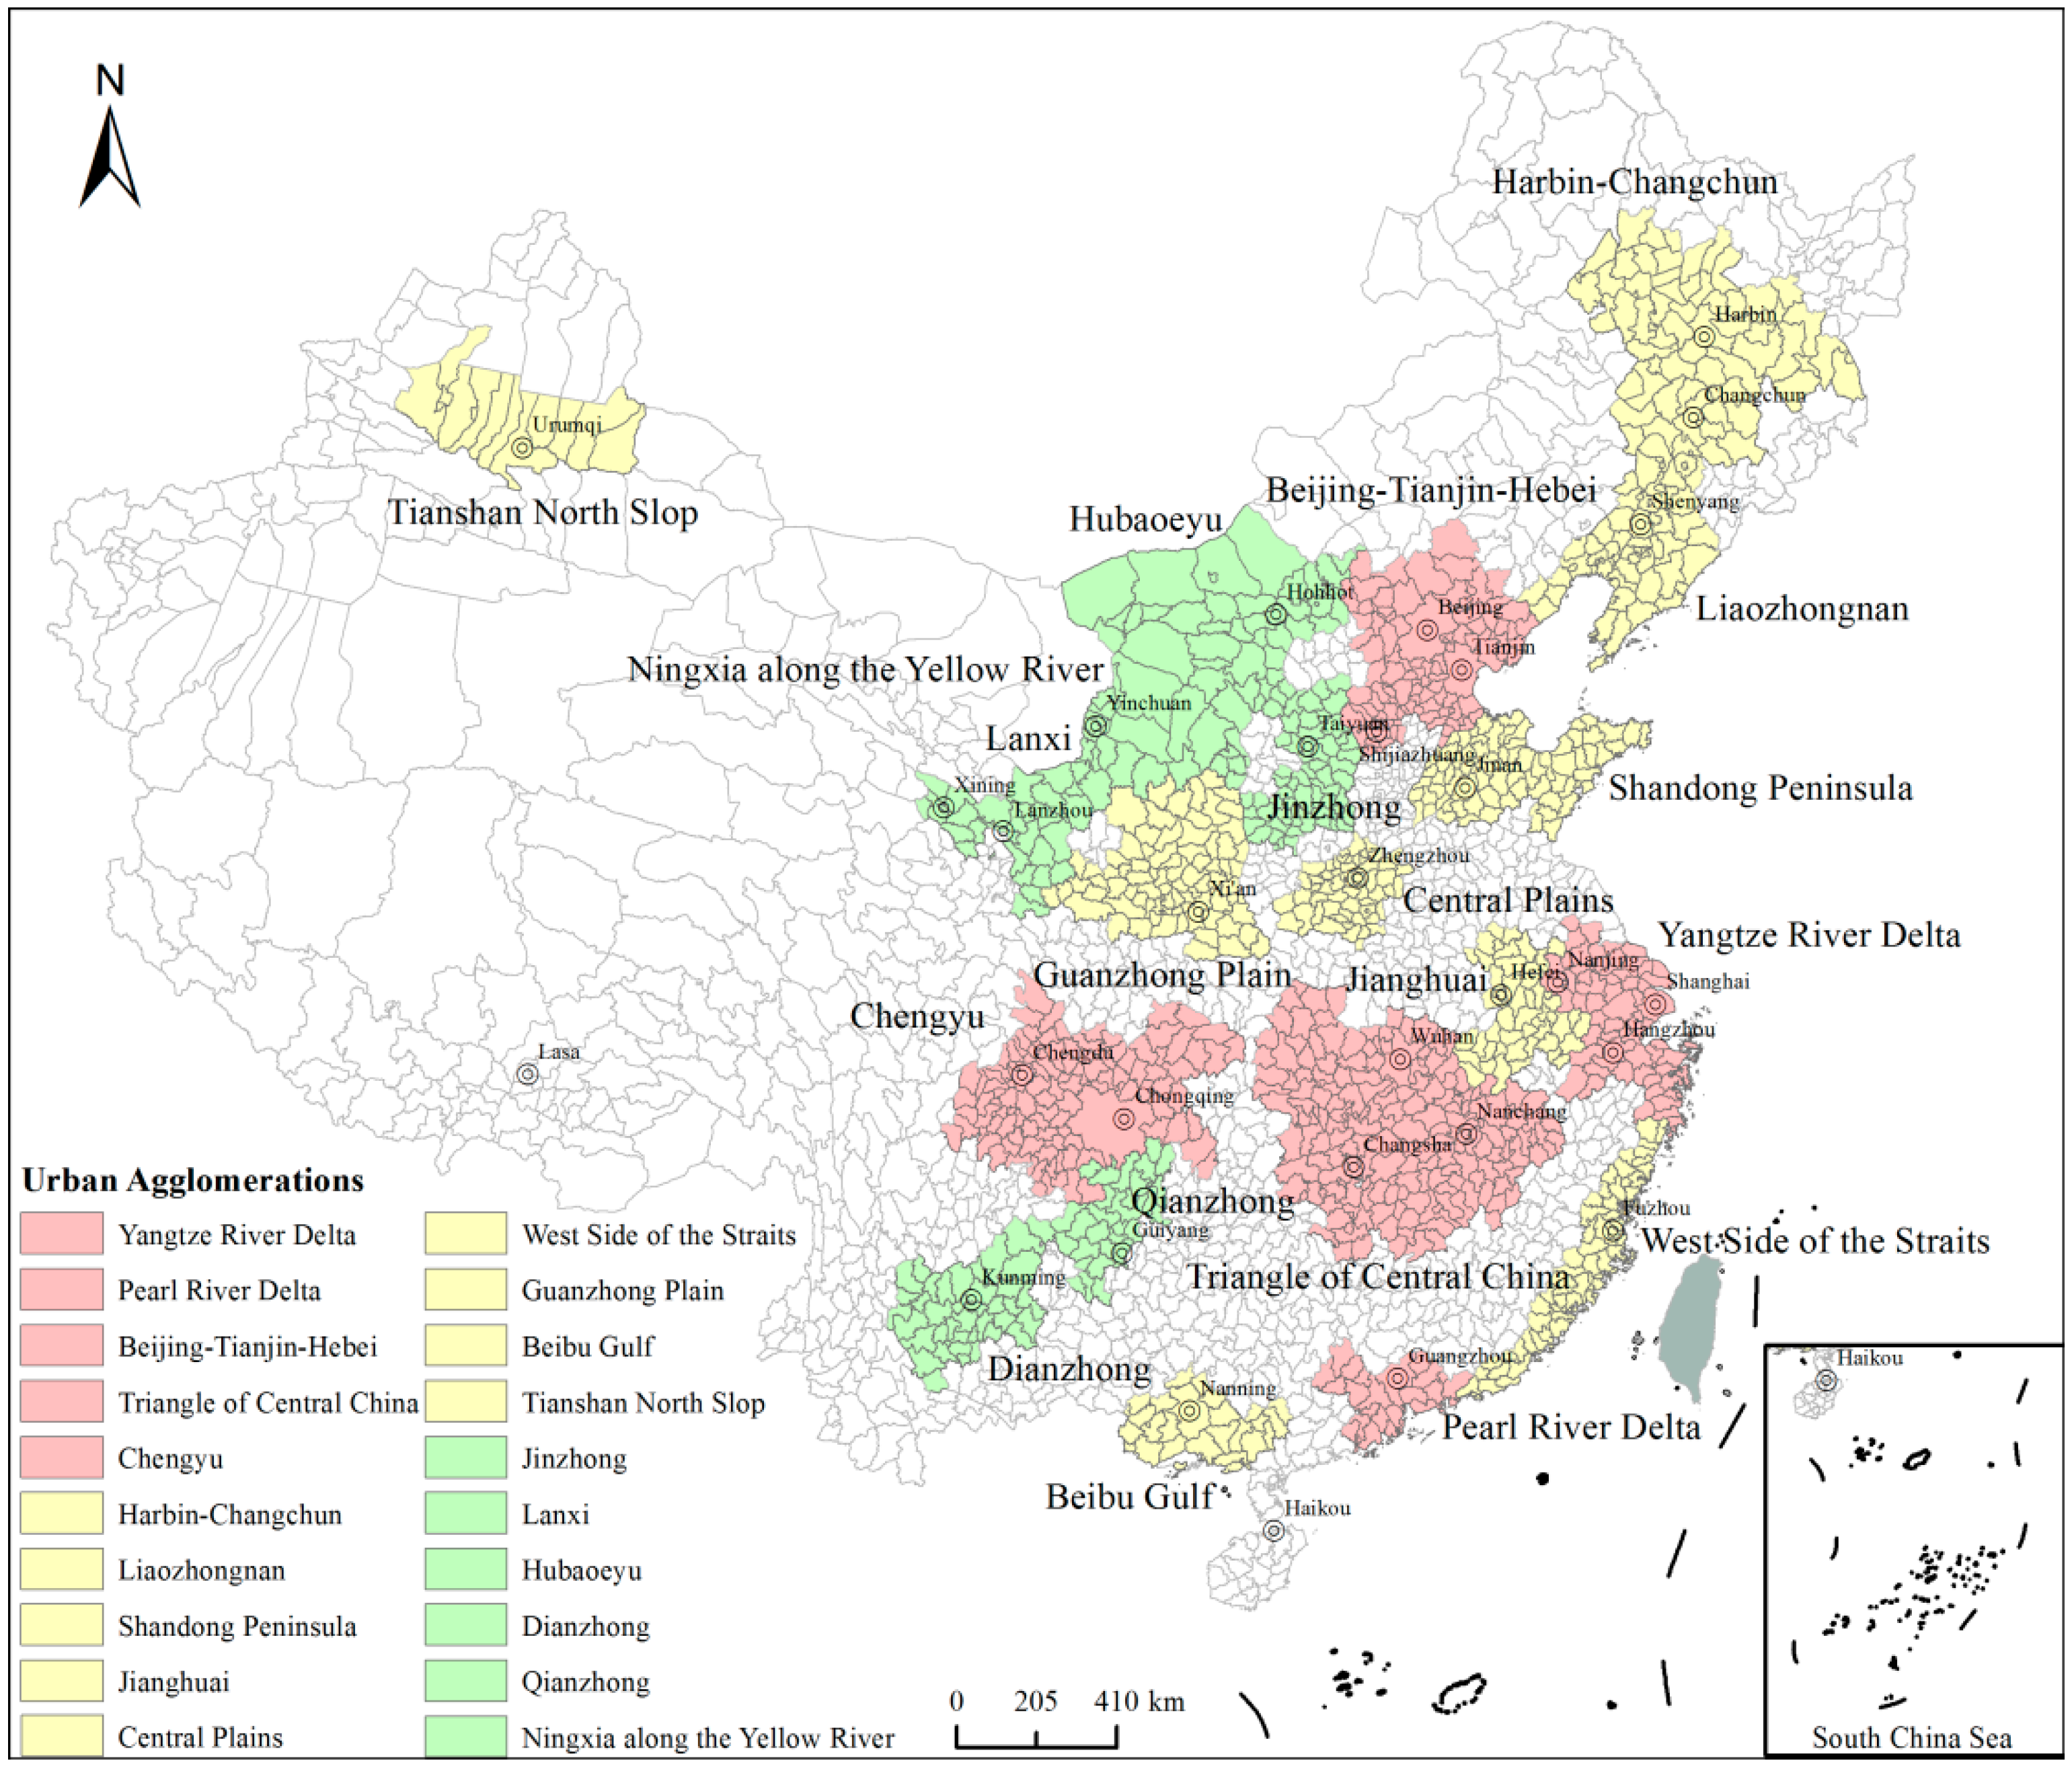
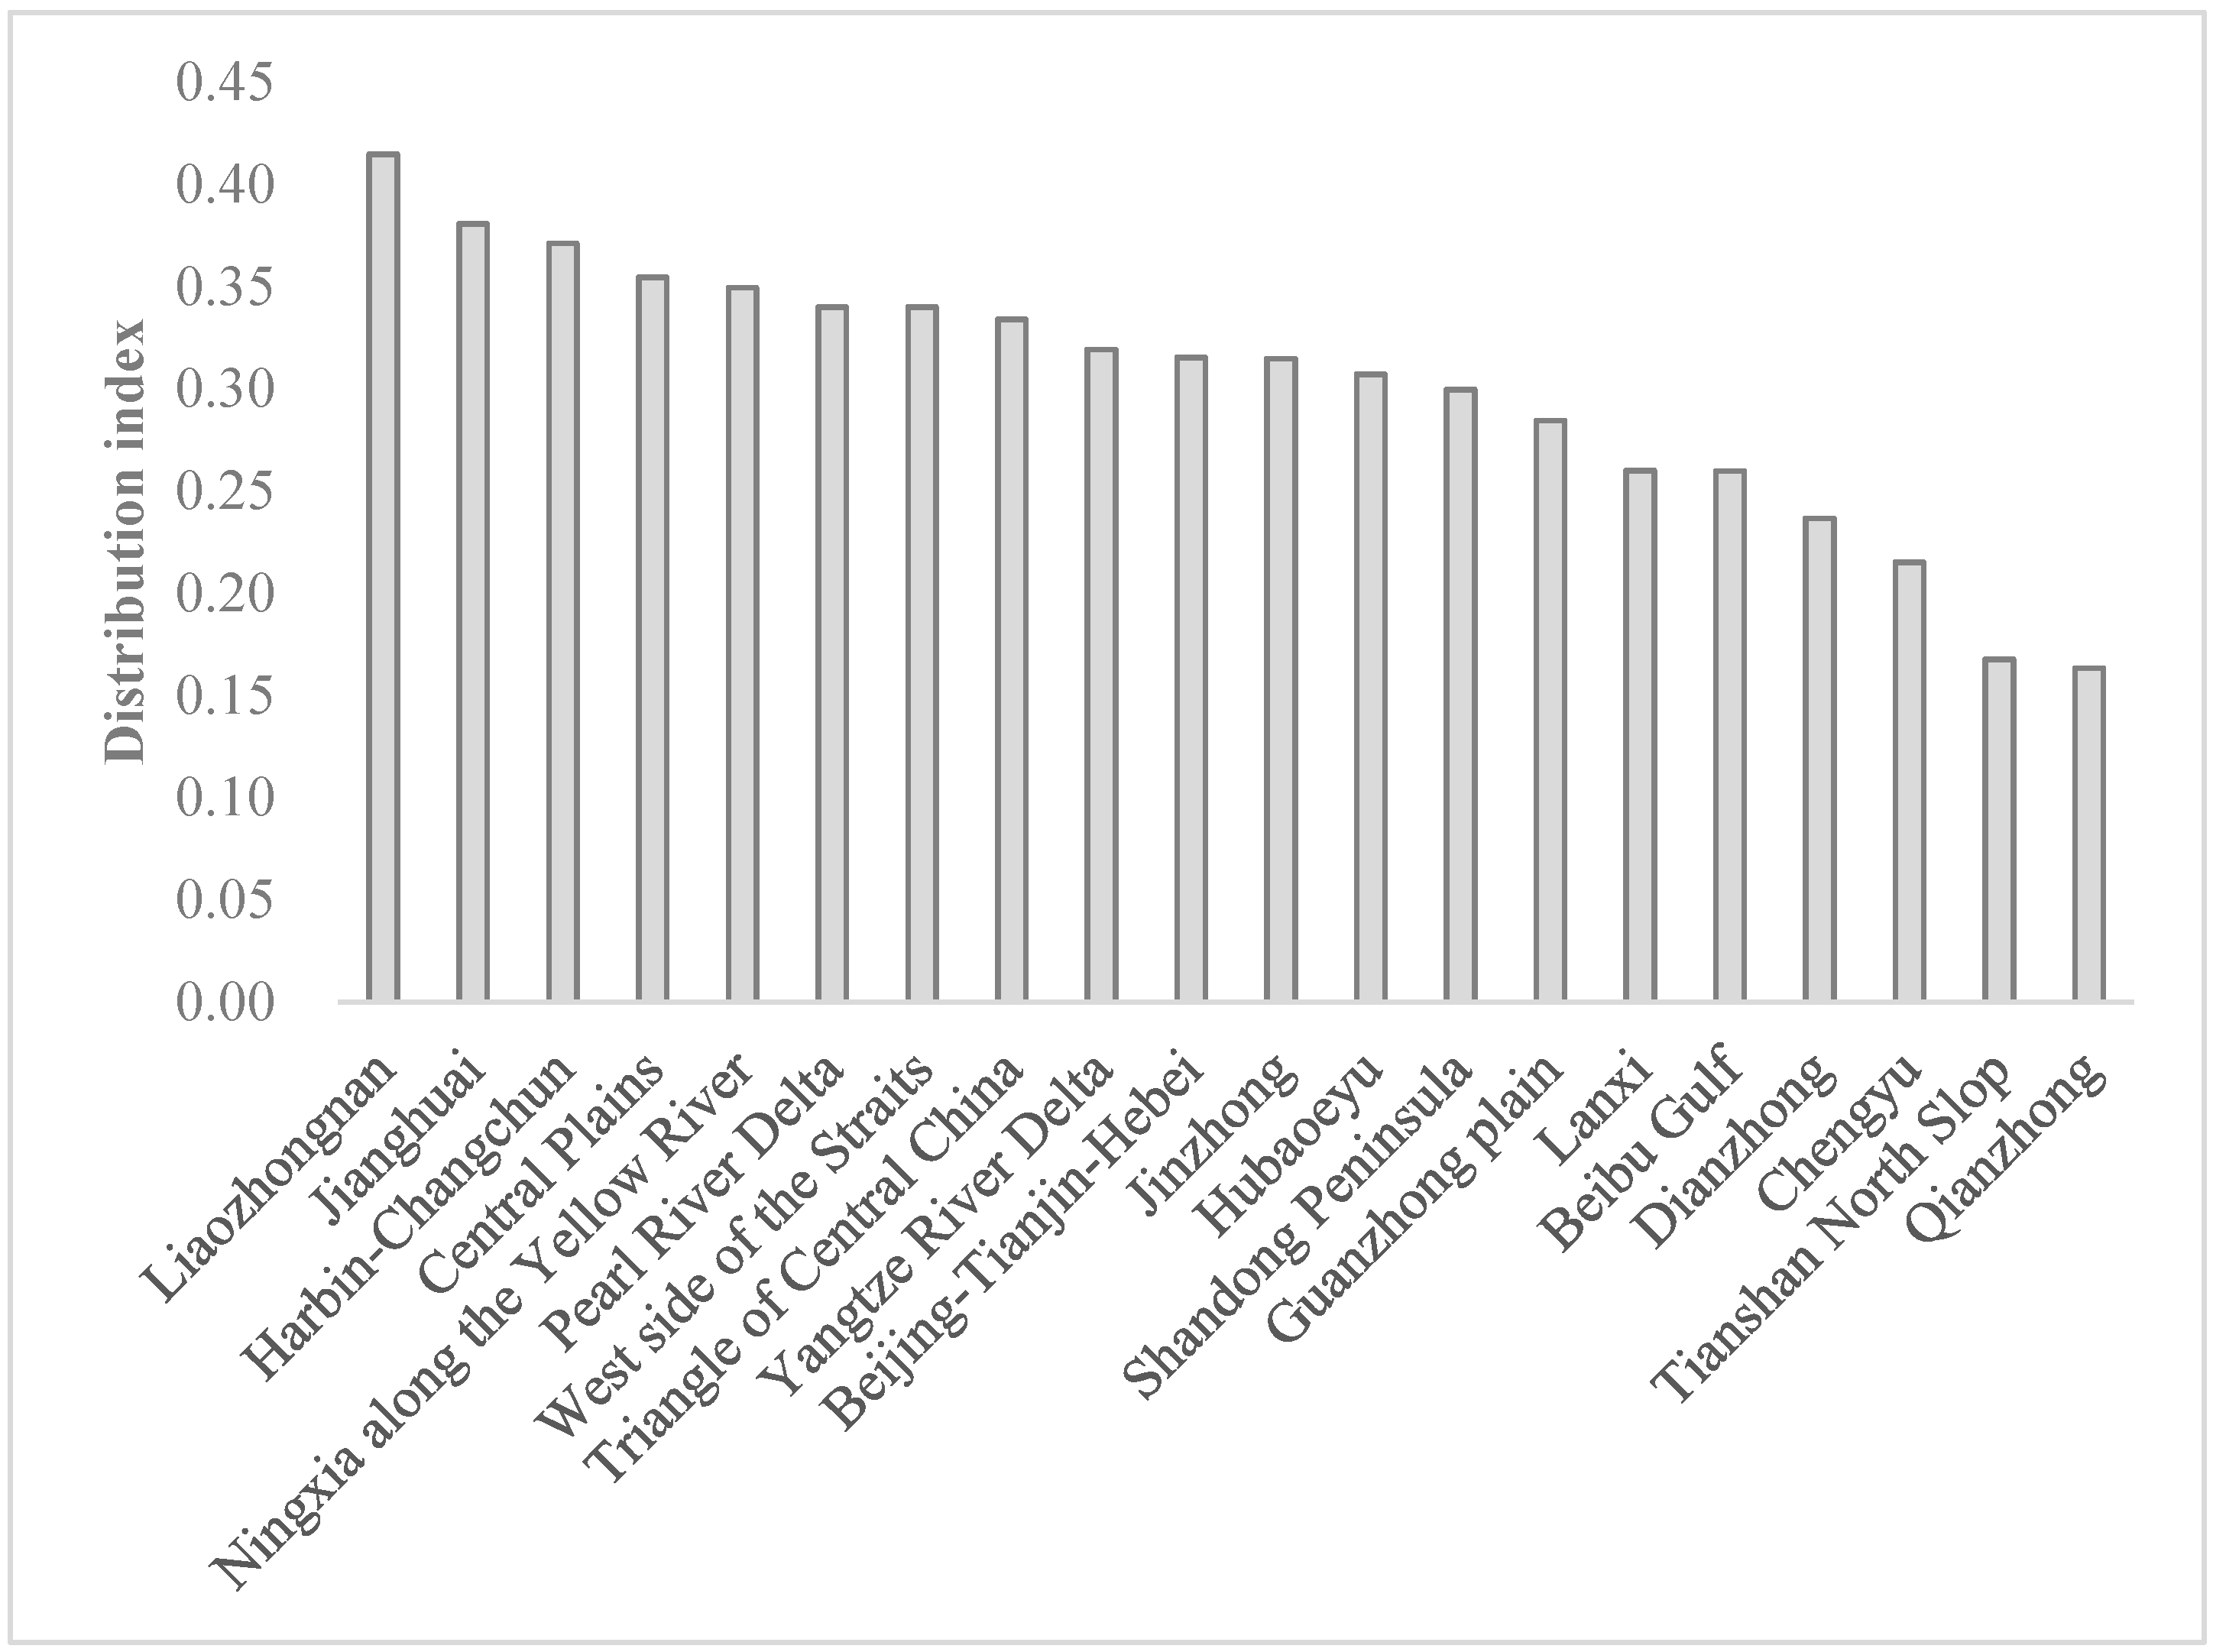
4.1. Railway Network Distribution in Urban Agglomerations

The distribution structure of urban agglomerations according to the “5 + 9 + 6” plan is shown in Figure 6, in which pink areas represent five national-level urban agglomerations, yellow areas represent nine regional-level urban agglomerations, and green areas represent six local-level urban agglomerations.
Based on this distribution structure, the railway network distribution index in each urban agglomeration can be calculated (see Figure 7). The railway network distribution indices range from 0.16 to 0.41 for all urban agglomerations, indicating relatively lacking, moderate, and good distributions according to the spatial patterns of railway network distribution discussed in Section 3.4. The five national-level urban agglomerations all have moderate railway network distributions, which indicates that a moderate network distribution should continue to be a focus for supporting the fastest urbanization in national-level urban agglomerations [40,41]. Of the nine regional-level urban agglomerations, Liaozhongnan, Jianghuai, Harbin‒Changchun, and the Central Plains have good railway network distributions; the west side of the Straits, Shandong Peninsula, Guanzhong Plain, and Beibu Gulf have moderate railway network distributions; and Tianshan North Slope has a relatively insufficient railway network distribution. The construction of railway network facilities should be increased as an important driving force for urbanization in these areas [42]. Of the six local-level urban agglomerations, only Qianzhong has a relatively insufficient railway network distribution, and the others have a moderate railway network distribution. These local-level urban agglomerations are mainly located in western China, with relatively low urbanization levels and a moderate railway infrastructure that could support the economic development in these areas [43].
Overall, the railway network distribution in internal urban agglomerations is not perfect; only four regional-level urban agglomerations have good railway network distributions, while the rest have medium or relatively insufficient railway network distributions. Therefore, in order to meet China’s urbanization needs, as well as match the development of the population and economy, it is better to focus on strengthening the construction of railway network within the national-level urban agglomerations.

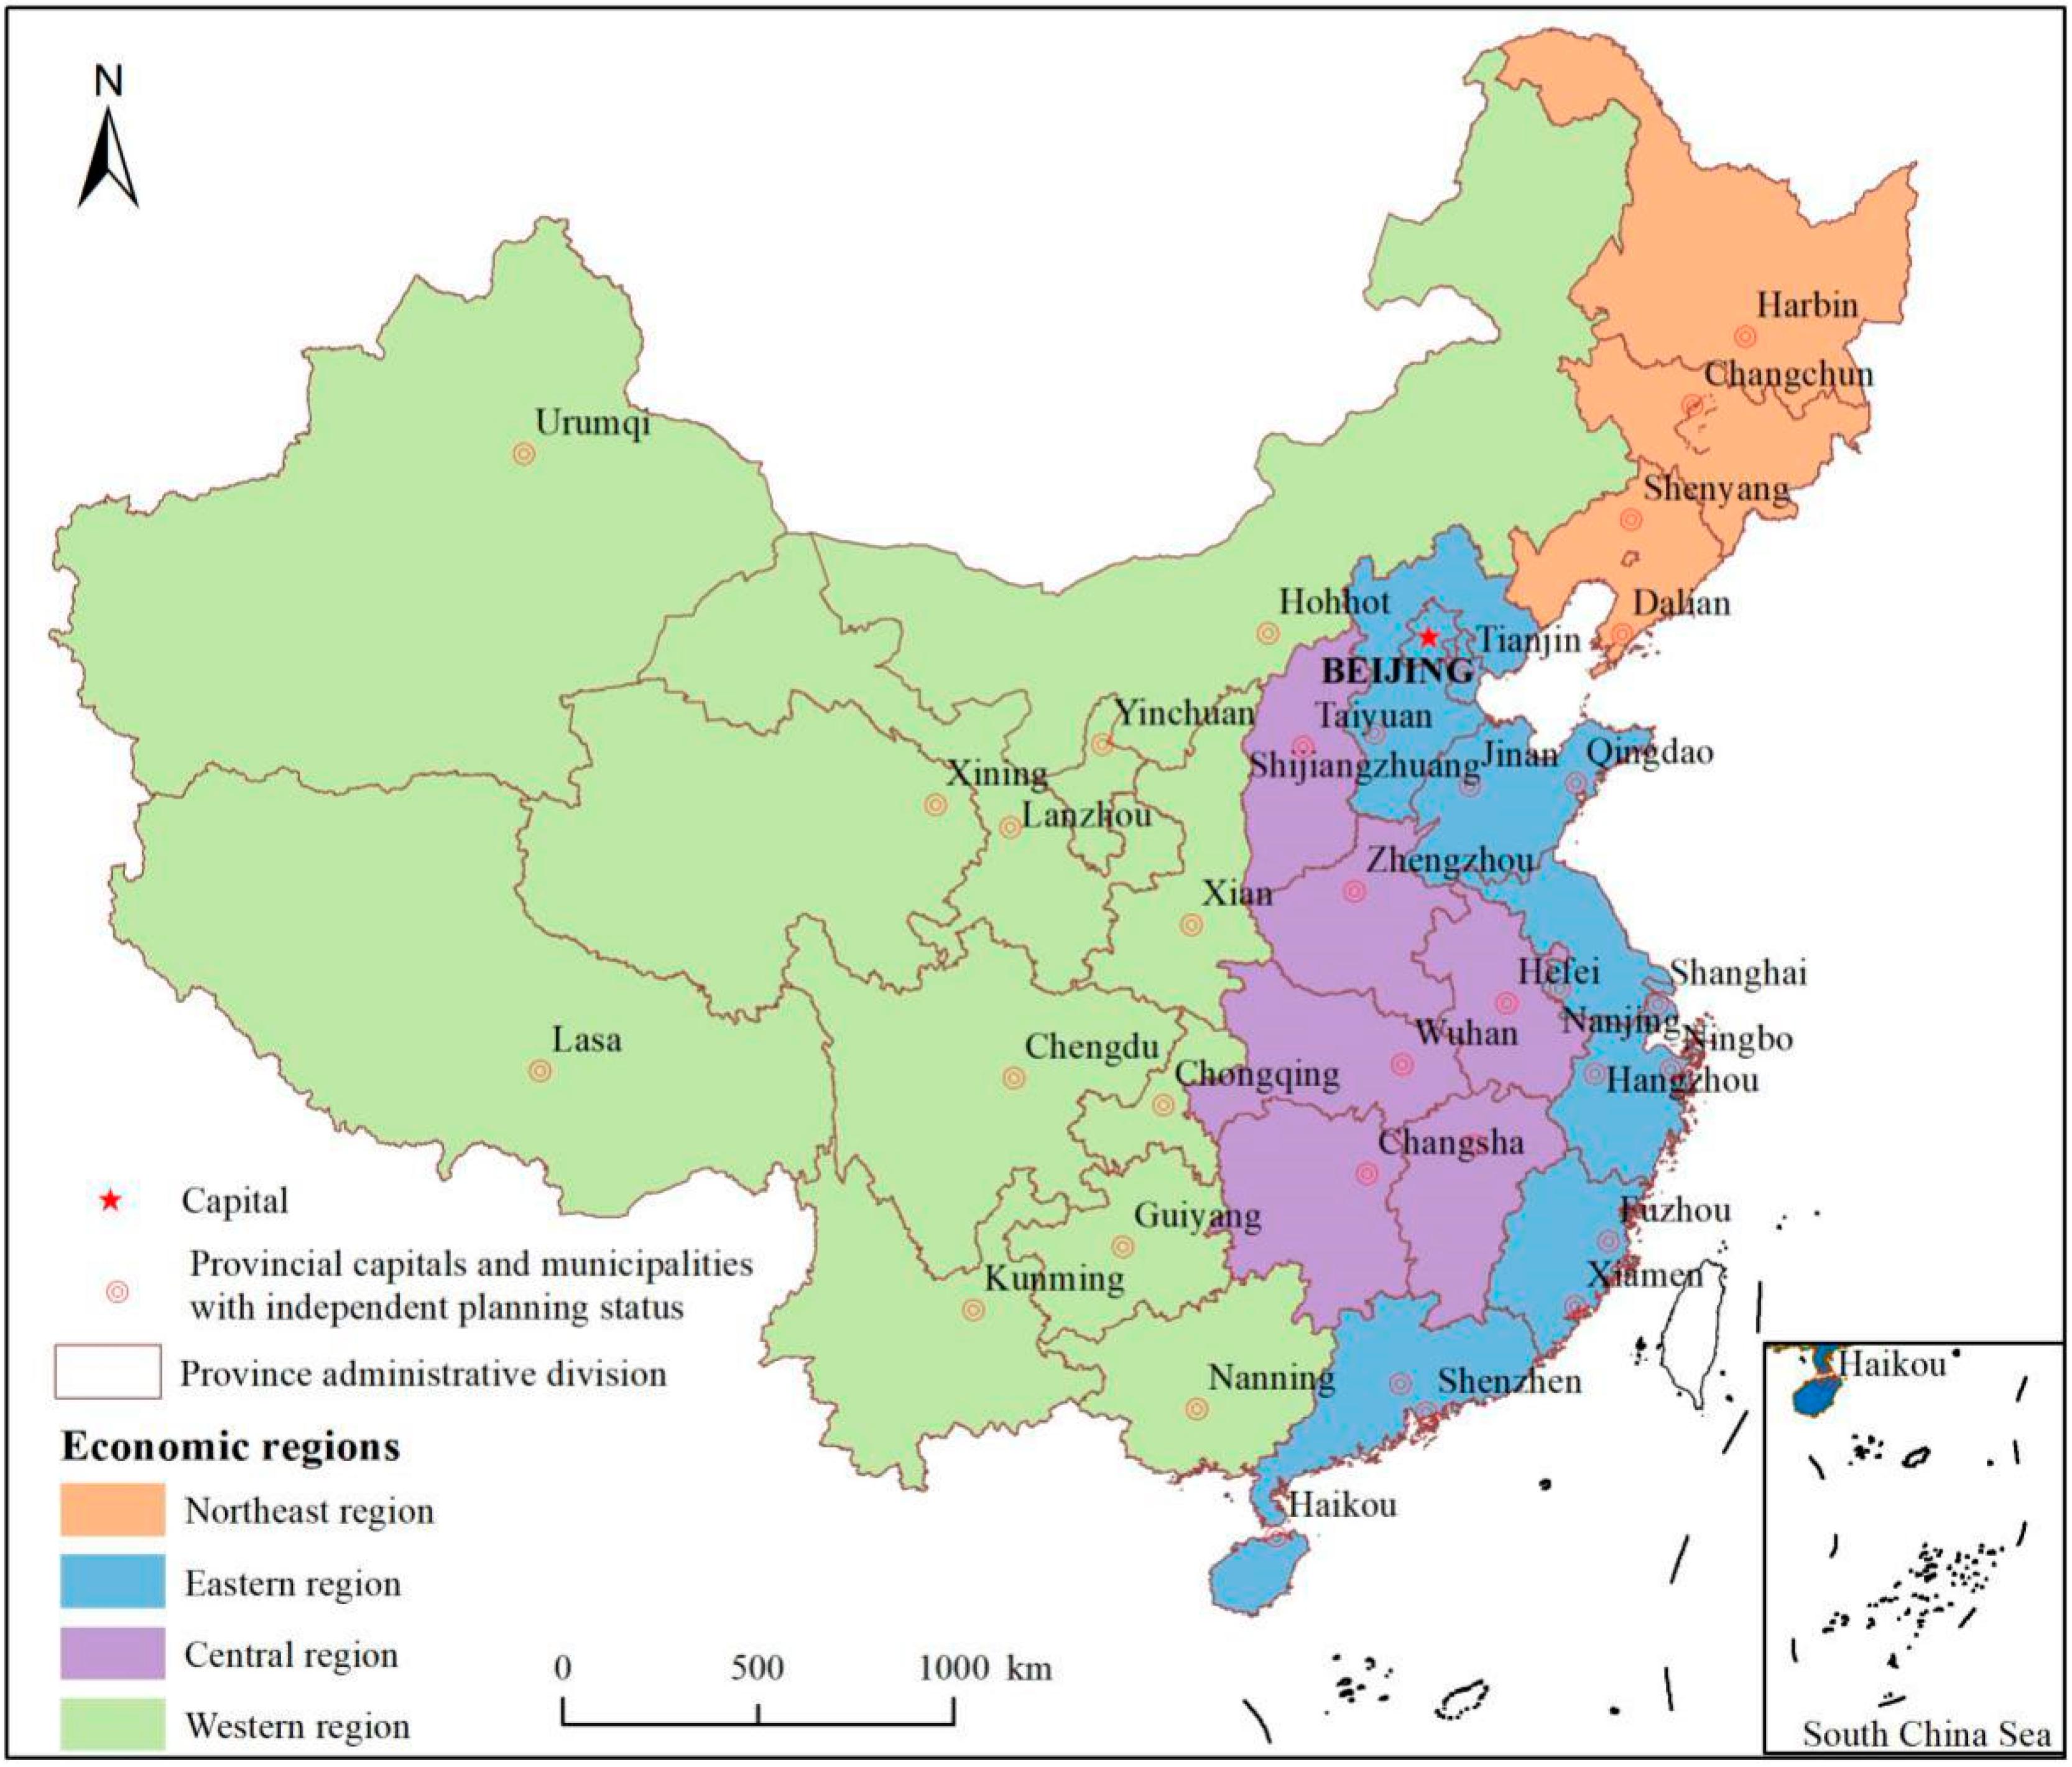
4.2. Railway Network Distribution in Four Economic Regions

The four major economic regions of China are shown in Figure 8. The main features of economic and social development in the various regions are the development of the western region, the revitalization of the northeast region, the rise of the central region, and the leading development in the eastern region.
The railway network distribution index is 0.31 in the eastern region, 0.32 in the central region, 0.19 in the western region and 0.39 in the northeast region. The railway network distribution of the northeast region is the best, followed by those of the central and eastern regions, while the western region is the most insufficient. Wang et al. (2009) divided China’s railway network expansion over the last century into four eras: preliminary construction, network skeleton, corridor building, and deep intensification [7]. Prior to 1950, the railway network mileage of the northeast region accounted for more than 40% of the network in China. In the 1970s, China implemented the policy of “reform and opening up” and shifted the economic center and railway construction to the southeast coastal region. During this period, the railway network in the eastern coastal region developed rapidly, which led to unbalanced inter-regional development. In the late 1990s, China implemented balanced regional development and successfully put forward the strategies of “the great western development strategy,” “revitalizing the old industrial bases in northeast China,” and “the rise of the central region”, which gradually enhanced the construction of the railway network in the central and western regions. In 2015, China proposed “The Belt and Road” development strategy, which provides targeted guidance for the future distribution of the railway network.
Therefore, according to the national development strategy, the future distribution of the railway network could focus on the central and eastern regions as well as the western urban agglomerations, while the western and northeast border areas may mainly consider their national security significance. A logical distribution of the railway network will guide urbanization and the development of population and economic aggregation.

4.3. Limitations and Future Improvements

This study mainly considers railway passenger transport, and represents the size of railway passenger transport with train frequency data. Due to the difficulty in data acquiring, we do not take into account the freight volume situation of China in this study. Adding the freight transport information will definitely make the railway network distribution pattern more accurate.
Lim and Thill (2008) investigated how the intermodal freight-transportation network affects the ability of regions to position themselves more effectively in the national space economy, and the performance of the intermodal freight network was evaluated by comparing accessibility measures based on the highway network and on the intermodal network, respectively [44]. This research can provide reference and guidance for the future research for combining passenger and freight status, and reflecting the characteristics of the railway network distribution of China more precisely.
In this study, the distance from the nearest railway station to the county center, based on the provincial-level functional area division, is used to determine the weight of railway network proximity using expert scoring. Potential future improvements could include setting different distance intervals and selecting different evaluation methods for expert scoring. In addition, the current research has only been applied to examine railway network distribution at the macro scale. The theory and evaluation method needs further testing if being applied to regions at small—and medium-scales.

5. Conclusions

Based on indicators of the railway network density, railway network proximity, the shortest travel time, train frequency, and also social‒economic indicators, this study took advantage of a railway network distribution index to investigate the railway network distribution pattern in China in 2015. The results of this study could guide the optimization of the railway network structure and provide a basis for macro decision-making for the planning and evaluation of major railway infrastructure construction.
The findings were as follows: (1) In 2015, railway network density was relatively low in almost half of the counties of China. The railway network density was high in the central and eastern parts of China and relatively low in western China, and there were multiple dense railway network areas. The railway network proximity was high in nearly half of the counties in China, as was evident in the strip distribution. Based on the shortest travel time, the convenience of most counties in terms of external connections to the rest of China is generally low, with the convenience gradually rising from coastal to inland areas; the areas with the shortest travel time were mainly concentrated in the eastern region. (2) In 2015, the railway network distribution in nearly one-third of the counties of China was ideal. The distribution was grouped into two major zones with multiple dense areas. It might be advisable to strengthen the connections between large and small cities in the eastern region, so that large cities can drive the development of small cities around them. The major urban agglomerations in the midwest also could focus on several aspects such as strengthening the construction of railway facilities, promoting the movement of people and industries between the east and west regions, and increasing the urban vitality of the western region.
This study revealed the distribution pattern of the railway network in China and has significance for the optimization of the railway network structure and the development of urbanization in China. Based on the railway network distribution indicators, the national railway network is divided into five levels: insufficient railway network distribution, relatively insufficient railway network distribution, moderate railway network distribution, good railway network distribution, and perfect railway network distribution. Utilizing the advantages of the railway should be considered when planning economic development and industry activities. The five national-level urban agglomerations—Beijing‒Tianjin‒Hebei, the Yangtze River Delta, the Pearl River Delta, Triangle of Central China, and Chengdu‒Chongqing—have moderate railway infrastructures, and local governments may harness the advantages of other transportation facilities in these regions, such as roads, aviation, and ports, to compensate for the inadequacy of the railway network, and actively participate in international economic competition to enhance China’s urbanization. There are four regional-level agglomerations that have good railway network distribution—Liaozhongnan, Jianghuai, Harbin-Changchun, and Central Plains—Where the government may take full advantage of the railway network and promote regional integration. The railway network distribution of other regional-level urban agglomerations and local-level urban agglomerations is moderate or relatively lacking. In the future, the local government could plan for the reasonable construction of railway facilities and combine them with other modes of transportation to match the development of the population and economy.

Author Contributions

You Li conceptualized this research and contributed extensively to data curation and formal analysis; Minmin Li contributed to the methodology, investigation, and writing of this research; Renzhong Guo and Biao He gave ideas to validate the conceptualization and methodology; Yong Fan provided many suggestions for improving and modifying this article.

Funding

This research was funded by the China Postdoctoral Science Foundation, grant number: 2018M633108, 2018M643150 and the Natural Science Foundation of China, grant number: 41701187.

Acknowledgments

The authors are grateful for the “Connection value of transportation network based on breaking points model”, “Research on Pole-like Furniture Recognition in Mobile Laser Scanning Data Considering the Topological Structure Between Components” and “Research on Spatial Structure and Evolution Model of Urban System based on Entropy Theory” projects of Shenzhen University. We also would like to thank Jian Sun, who works at Jilin University and gave many suggestions for improving this article.

Conflicts of Interest

The authors declare no conflict of interest.

References

  1. The World Bank. World Development Indicators. Available online: https://data.worldbank.org (accessed on 17 April 2019).
  2. UIC. High Speed Line in The World. Available online: http://www.uic.org/spip.php?mot8 (accessed on 17 April 2019).
  3. Rodrigue, J.P.; Comtois, C.; Slack, B. The Geography of Transport Systems; Routledge: New York, NY, USA, 2009. [Google Scholar]
  4. Jin, F.; Wang, C.; Li, X.; Wang, J. China’s regional transport dominance: Density, proximity, and accessibility. J. Geogr. Sci. 2010, 20, 95–309. [Google Scholar] [CrossRef]
  5. Geurs, K.T.; Van Wee, B. Accessibility evaluation of land-use and transport strategies: Review and research directions. Transp. Geogr. 2004, 12, 127–140. [Google Scholar] [CrossRef]
  6. Monzon, A.; Lopez, E.; Ortega, E. Has HSR improved territorial cohesion in Spain? An accessibility analysis of the first 25 years: 1990–2015. Eur. Plan. Stud. 2019, 27, 1–20. [Google Scholar] [CrossRef]
  7. Wang, J.; Jin, F.; Mo, H.; Wang, F. Spatiotemporal evolution of China’s railway network in the 20th century: An accessibility approach. Transp. Res. Part A Policy Pract. 2009, 43, 765–778. [Google Scholar] [CrossRef]
  8. Hansen, W.G. How accessibility shapes land use. J. Am. Plan. Assoc. 1959, 25, 73–76. [Google Scholar] [CrossRef]
  9. Morris, J.M.; Dumble, P.L.; Wigan, M.R. Accessibility indicators for transport planning. Transp. Res. Part A General. 1979, 13, 91–109. [Google Scholar] [CrossRef]
  10. Jiao, J.; Wang, J.; Jin, F.; Dunford, M. Impacts on accessibility of China’s present and future HSR network. J. Transp. Geogr. 2014, 40, 123–132. [Google Scholar] [CrossRef]
  11. Bruinsma, F.; Rietveld, P. The accessibility of European cities: Theoretical framework and comparison of approaches. Environ. Plan. A 1998, 30, 499–521. [Google Scholar] [CrossRef]
  12. Beria, P.; Debernardi, A.; Ferrara, E. Measuring the long-distance accessibility of Italian cities. J. Transp. Geogr. 2017, 62, 66–79. [Google Scholar] [CrossRef]
  13. Black, J.; Conroy, M. Accessibility measures and the social evaluation of urban structure. Environ. Plan. A 1977, 9, 1013–1031. [Google Scholar] [CrossRef]
  14. Yang, L.; Zhang, X.; Hong, S.; Lin, H.; Cheng, G. The impact of walking accessibility of public services on housing prices: Based on the cumulative opportunities measure. South China J. Econ. 2016, 1, 57–70. [Google Scholar]
  15. Dou, K.; Zhan, Q. Accessibility analysis of urban emergency shelters: Comparing gravity model and space syntax. In Proceedings of the 2011 International Conference on Remote Sensing, Environment and Transportation Engineering, Nanjing, China, 24–26 June 2011. [Google Scholar]
  16. Franke, D.; Vorel, J.; Peltan, T. Job accessibility modelling in Prague Functional Urban Area. In Proceedings of the 2017 Smart City Symposium Prague (SCSP), Prague, The Czech Republic, 25–26 May 2017. [Google Scholar]
  17. Ministry of Civil Affairs of the People’s Republic of China. Administrative Division of the People’s Republic of China; Chinese Social Publishing House: Beijing, China, 2017.
  18. Yao, S.M. Urban Agglomerations of China; University of Science and Technology of China Press: Hefei, China, 2006. [Google Scholar]
  19. Gu, C.L.; Yu, T.F.; Li, W.M. Urbanization in China: Pattern, Process and Mechanism; Science Press: Beijing, China, 2008. [Google Scholar]
  20. Fang, C.L.; Bao, C.; Ma, H.T. Urban Agglomeration Development in China; Science Press: Beijing, China, 2016. [Google Scholar]
  21. Fan, J.; Li, P.X. The scientific foundation of major function-oriented zoning in China. J. Geogr. Sci. 2007, 19, 515–531. [Google Scholar] [CrossRef]
  22. Wang, G.T. National Urban System Planning 2006–2020; The Commercial Press: Beijing, China, 2010. [Google Scholar]
  23. National Bureau of Statistics of China. Available online: http://www.stats.gov.cn/ztjc/zthd/sjtjr/dejtjkfr/tjkp/201106/t20110613_71947.htm (accessed on 17 April 2019).
  24. National Bureau of Statistics of China. China County Statistical Yearbook; China Statistics Press: Beijing, China, 2016.
  25. National Bureau of Statistics of China. China City Statistical Yearbook 2016; China Statistics Press: Beijing, China, 2016.
  26. Li, M.; Guo, R.; Li, Y.; He, B.; Chen, Y.; Fan, Y. Distribution Characteristics of the Transportation Network in China at the County Level. IEEE Access 2019, 7, 49251–49261. [Google Scholar] [CrossRef]
  27. Hu, H.; Wang, J.; Jin, F.; Ding, N. Evolution of regional transport dominance in China 1910–2012. J. Geogr. Sci. 2015, 25, 723–738. [Google Scholar] [CrossRef]
  28. Xu, S.B. The Principle of Analytic Hierarchy Process—Practical Decision-Making Method; Tianjin University Press: Tianjin, China, 1988. [Google Scholar]
  29. Erath, A.; Löchl, M.; Axhausen, K.W. Graph-theoretical analysis of the Swiss road and railway networks over time. Netw. Spat. Econ. 2009, 9, 379–400. [Google Scholar] [CrossRef]
  30. Huang, Y.; Lu, S.; Yang, X.; Zhao, Z. Exploring railway network dynamics in China from 2008 to 2017. ISPRS Int. J. Geo-Inf. 2018, 7, 320. [Google Scholar] [CrossRef]
  31. Kasraian, D.; Maat, K.; Vaan Wee, B. The impact of urban proximity, transport accessibility and policy on urban growth: A longitudinal analysis over five decades. Environ. Plan. B Urban Anal. City Sci. 2017, 1, 1–18. [Google Scholar] [CrossRef]
  32. Blainey, S.P.; Armstrong, J.; Smith, A.S.; Preston, J.M. New routes on old railways: Increasing rail’s mode share within the constraints of the existing railway network. Transportation 2016, 43, 425–442. [Google Scholar] [CrossRef]
  33. Huber, S.; Rust, C. Calculate travel time and distance with OpenStreetMap data using the Open Source Routing Machine (OSRM). Stata J. 2016, 16, 416–423. [Google Scholar] [CrossRef]
  34. Zhang, D.; Chow, C.Y.; Liu, A.; Zhang, X.; Ding, Q.; Li, Q. Efficient evaluation of shortest travel-time path queries through spatial mashups. GeoInformatica 2018, 22, 3–28. [Google Scholar] [CrossRef]
  35. Chinese Academy of Sciences. Provincial-Level Functional Area Division; Science and technology of China press: Beijing, China, 2008. [Google Scholar]
  36. Li, M.; He, B.; Guo, R.; Li, Y.; Chen, Y.; Fan, Y. Study on population distribution pattern at the county level of China. Sustainability 2018, 10, 3598. [Google Scholar] [CrossRef]
  37. National Development and Reform Commission. The Issuance of the Medium-and Long-Term Railway Network Plan 2016. Available online: http://www.ndrc.gov.cn/zcfb/zcfbtz/201607/t20160720_811696.html (accessed on 17 April 2019).
  38. Xie, F.; Levinson, D. Modeling the growth of transportation networks: A comprehensive review. Netw. Spat. Econ. 2009, 9, 291–307. [Google Scholar] [CrossRef]
  39. Levinson, D. Density and dispersion: The co-development of land use and rail in London. J. Econ. Geogr. 2007, 8, 55–77. [Google Scholar] [CrossRef]
  40. Li, X.; Huang, B.; Li, R.; Zhang, Y. Exploring the impact of high speed railways on the spatial redistribution of economic activities-Yangtze River Delta urban agglomeration as a case study. J. Transp. Geogr. 2016, 57, 194–206. [Google Scholar] [CrossRef]
  41. Duan, G.Y.; Gong, H.L.; Liu, H.H.; Zhang, Y.Q.; Chen, B.B.; Lei, K.C. Monitoring and analysis of land subsidence along Beijing-Tianjin Inter-city railway. J. Indian Soc. Remote Sens. 2016, 44, 915–931. [Google Scholar]
  42. Li’e, S.B.W. Spatial Pattern & Quantitative Relationship of Industrial Structure of Shandong Peninsula Urban Agglomeration. In Proceedings of the 3rd International Conference on Information Science and Control Engineering (ICISCE), Beijing, China, 8–10 July 2016. [Google Scholar]
  43. Zhou, J.; Yang, L.; Li, L. The implications of high-speed rail for Chinese cities: Connectivity and accessibility. Transp. Res. Part A Policy Pract. 2018, 116, 308–326. [Google Scholar]
  44. Lim, H.; Thill, J.C. Intermodal freight transportation and regional accessibility in the United States. Environ. Plan. A 2008, 40, 2006–2025. [Google Scholar] [CrossRef]
Figure 1. Technical flow for describing the distribution pattern of the railway network.
Ijgi 08 00336 g001
Figure 2. The spatial pattern of China’s railway network density in 2015.
Ijgi 08 00336 g002
Figure 3. The spatial pattern of China’s railway network proximity in 2015.
Ijgi 08 00336 g003
Figure 4. Spatial pattern of the shortest travel time by railway of China in 2015.
Ijgi 08 00336 g004
Figure 5. Spatial pattern of the railway network of China in 2015.
Ijgi 08 00336 g005
Figure 6. Distribution structure of urban agglomeration following the “5 + 9 + 6” plan of China in 2015.
Ijgi 08 00336 g006
Figure 7. Railway network distribution index in each urban agglomeration in 2015.
Ijgi 08 00336 g007
Figure 8. The four major economic regions of China.
Ijgi 08 00336 g008
Table 1. Data sources for the railway network distribution of China in 2015.
NameSourceTimeMethod
Land area, population, GDP, gross industrial value above designated size, fixed asset investmentChina County Statistical Yearbook, China City Statistical Yearbook2015Spatial visualization
Railway line network, Railway stations, train frequencyAMAP, Railway Customer Service Center of China 2015Web crawler technology
Table 2. Proximity of a railway network.
TypeStandard P i
RailwayOwn railway station1.5
L ≤ 30 km1.0
30 km < L ≤ 60 km0.5
L > 60 km0.0
L is the distance from the nearest railway station to the county center. The weighted value refers to the provincial-level functional area division [35].

