Who, Where, Why and When? Using Smart Card and Social Media Data to Understand Urban Mobility


Abstract
:1. Introduction
2. Behaviour from Smart Card Data
3. Study Area and Materials
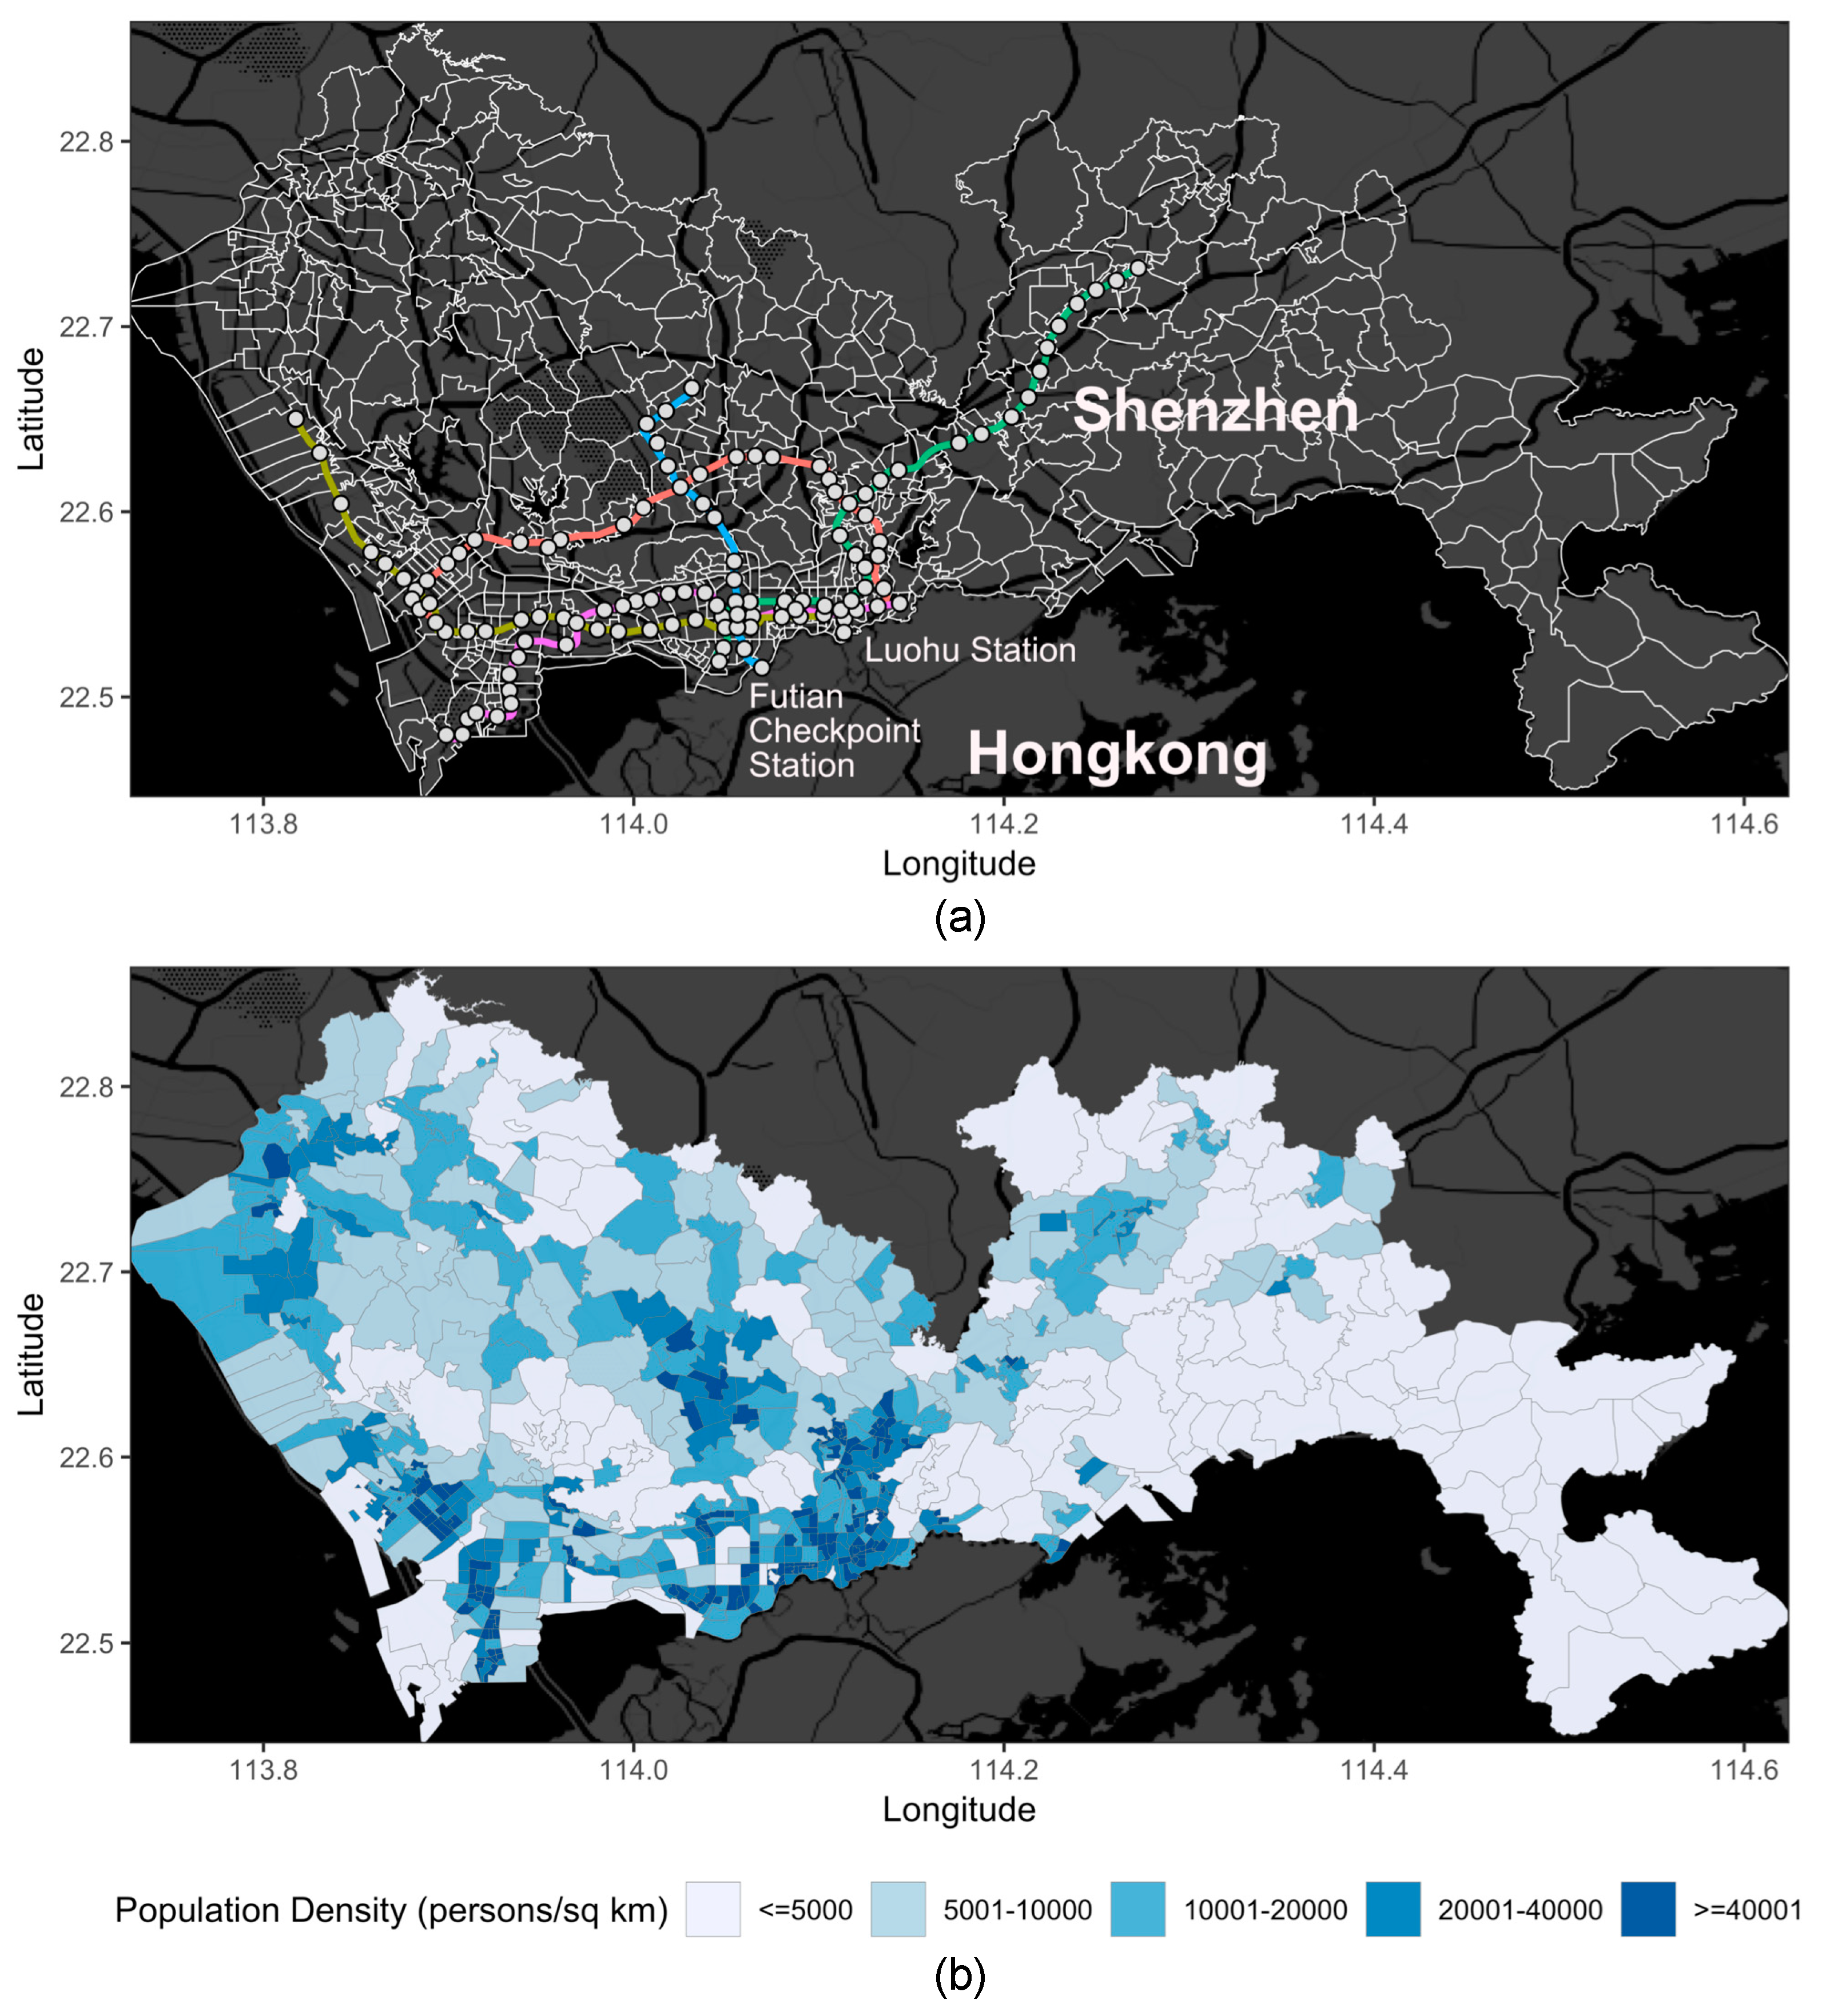
3.1. Study Area
3.2. Data
3.2.1. Shenzhen Public Transport
3.2.2. Social Media Data
4. Method
4.1. Temporal Trip Purpose Inference
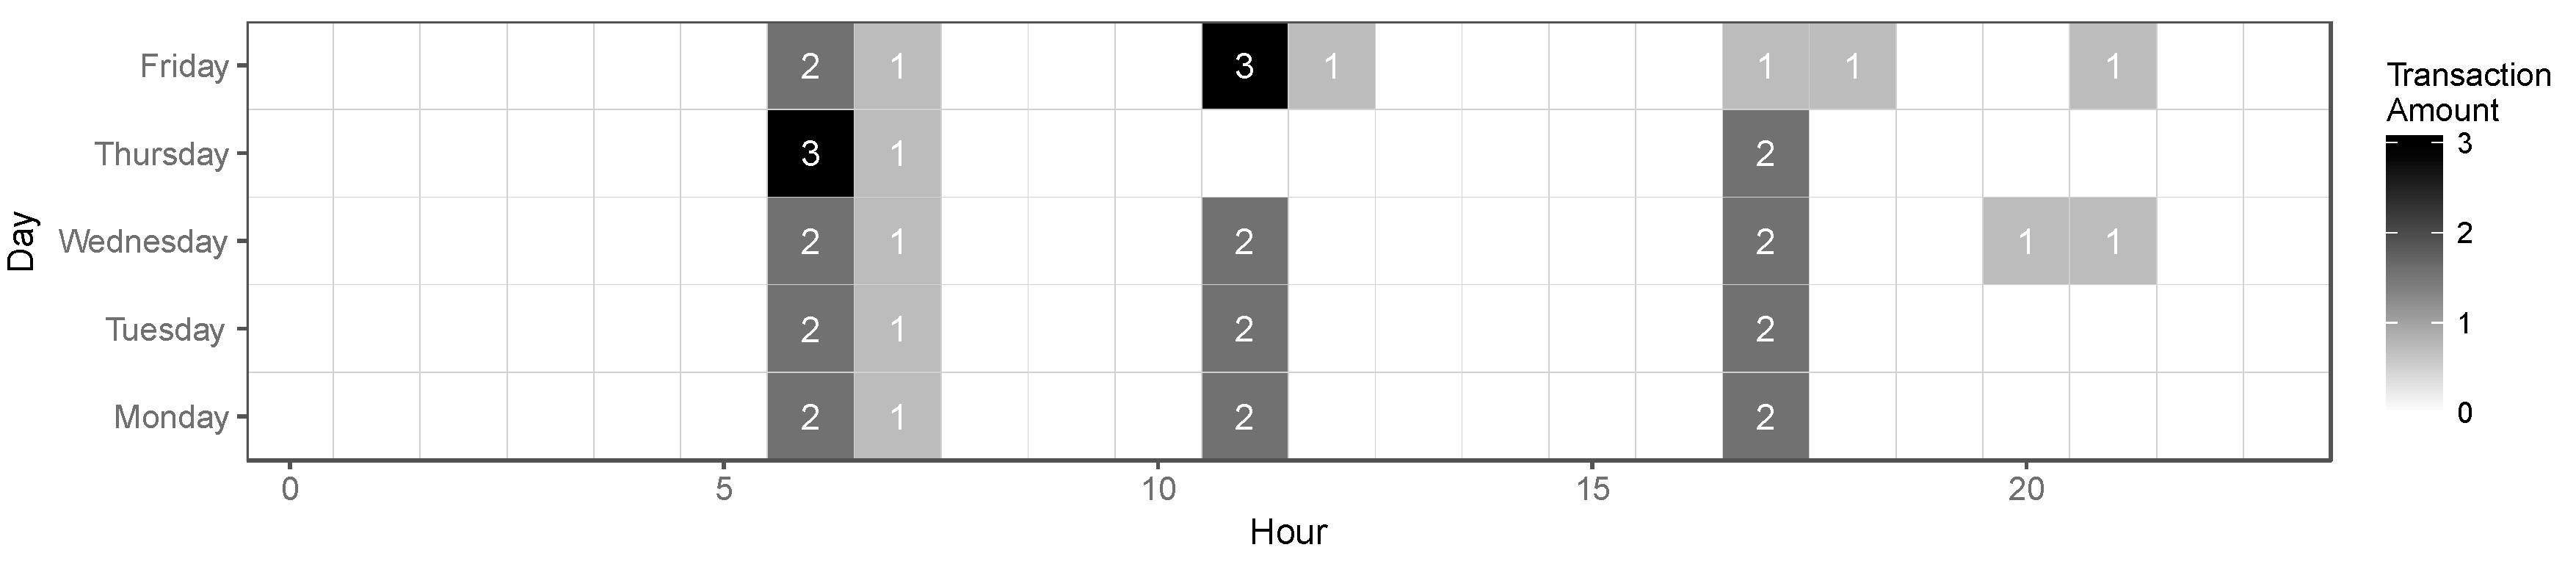
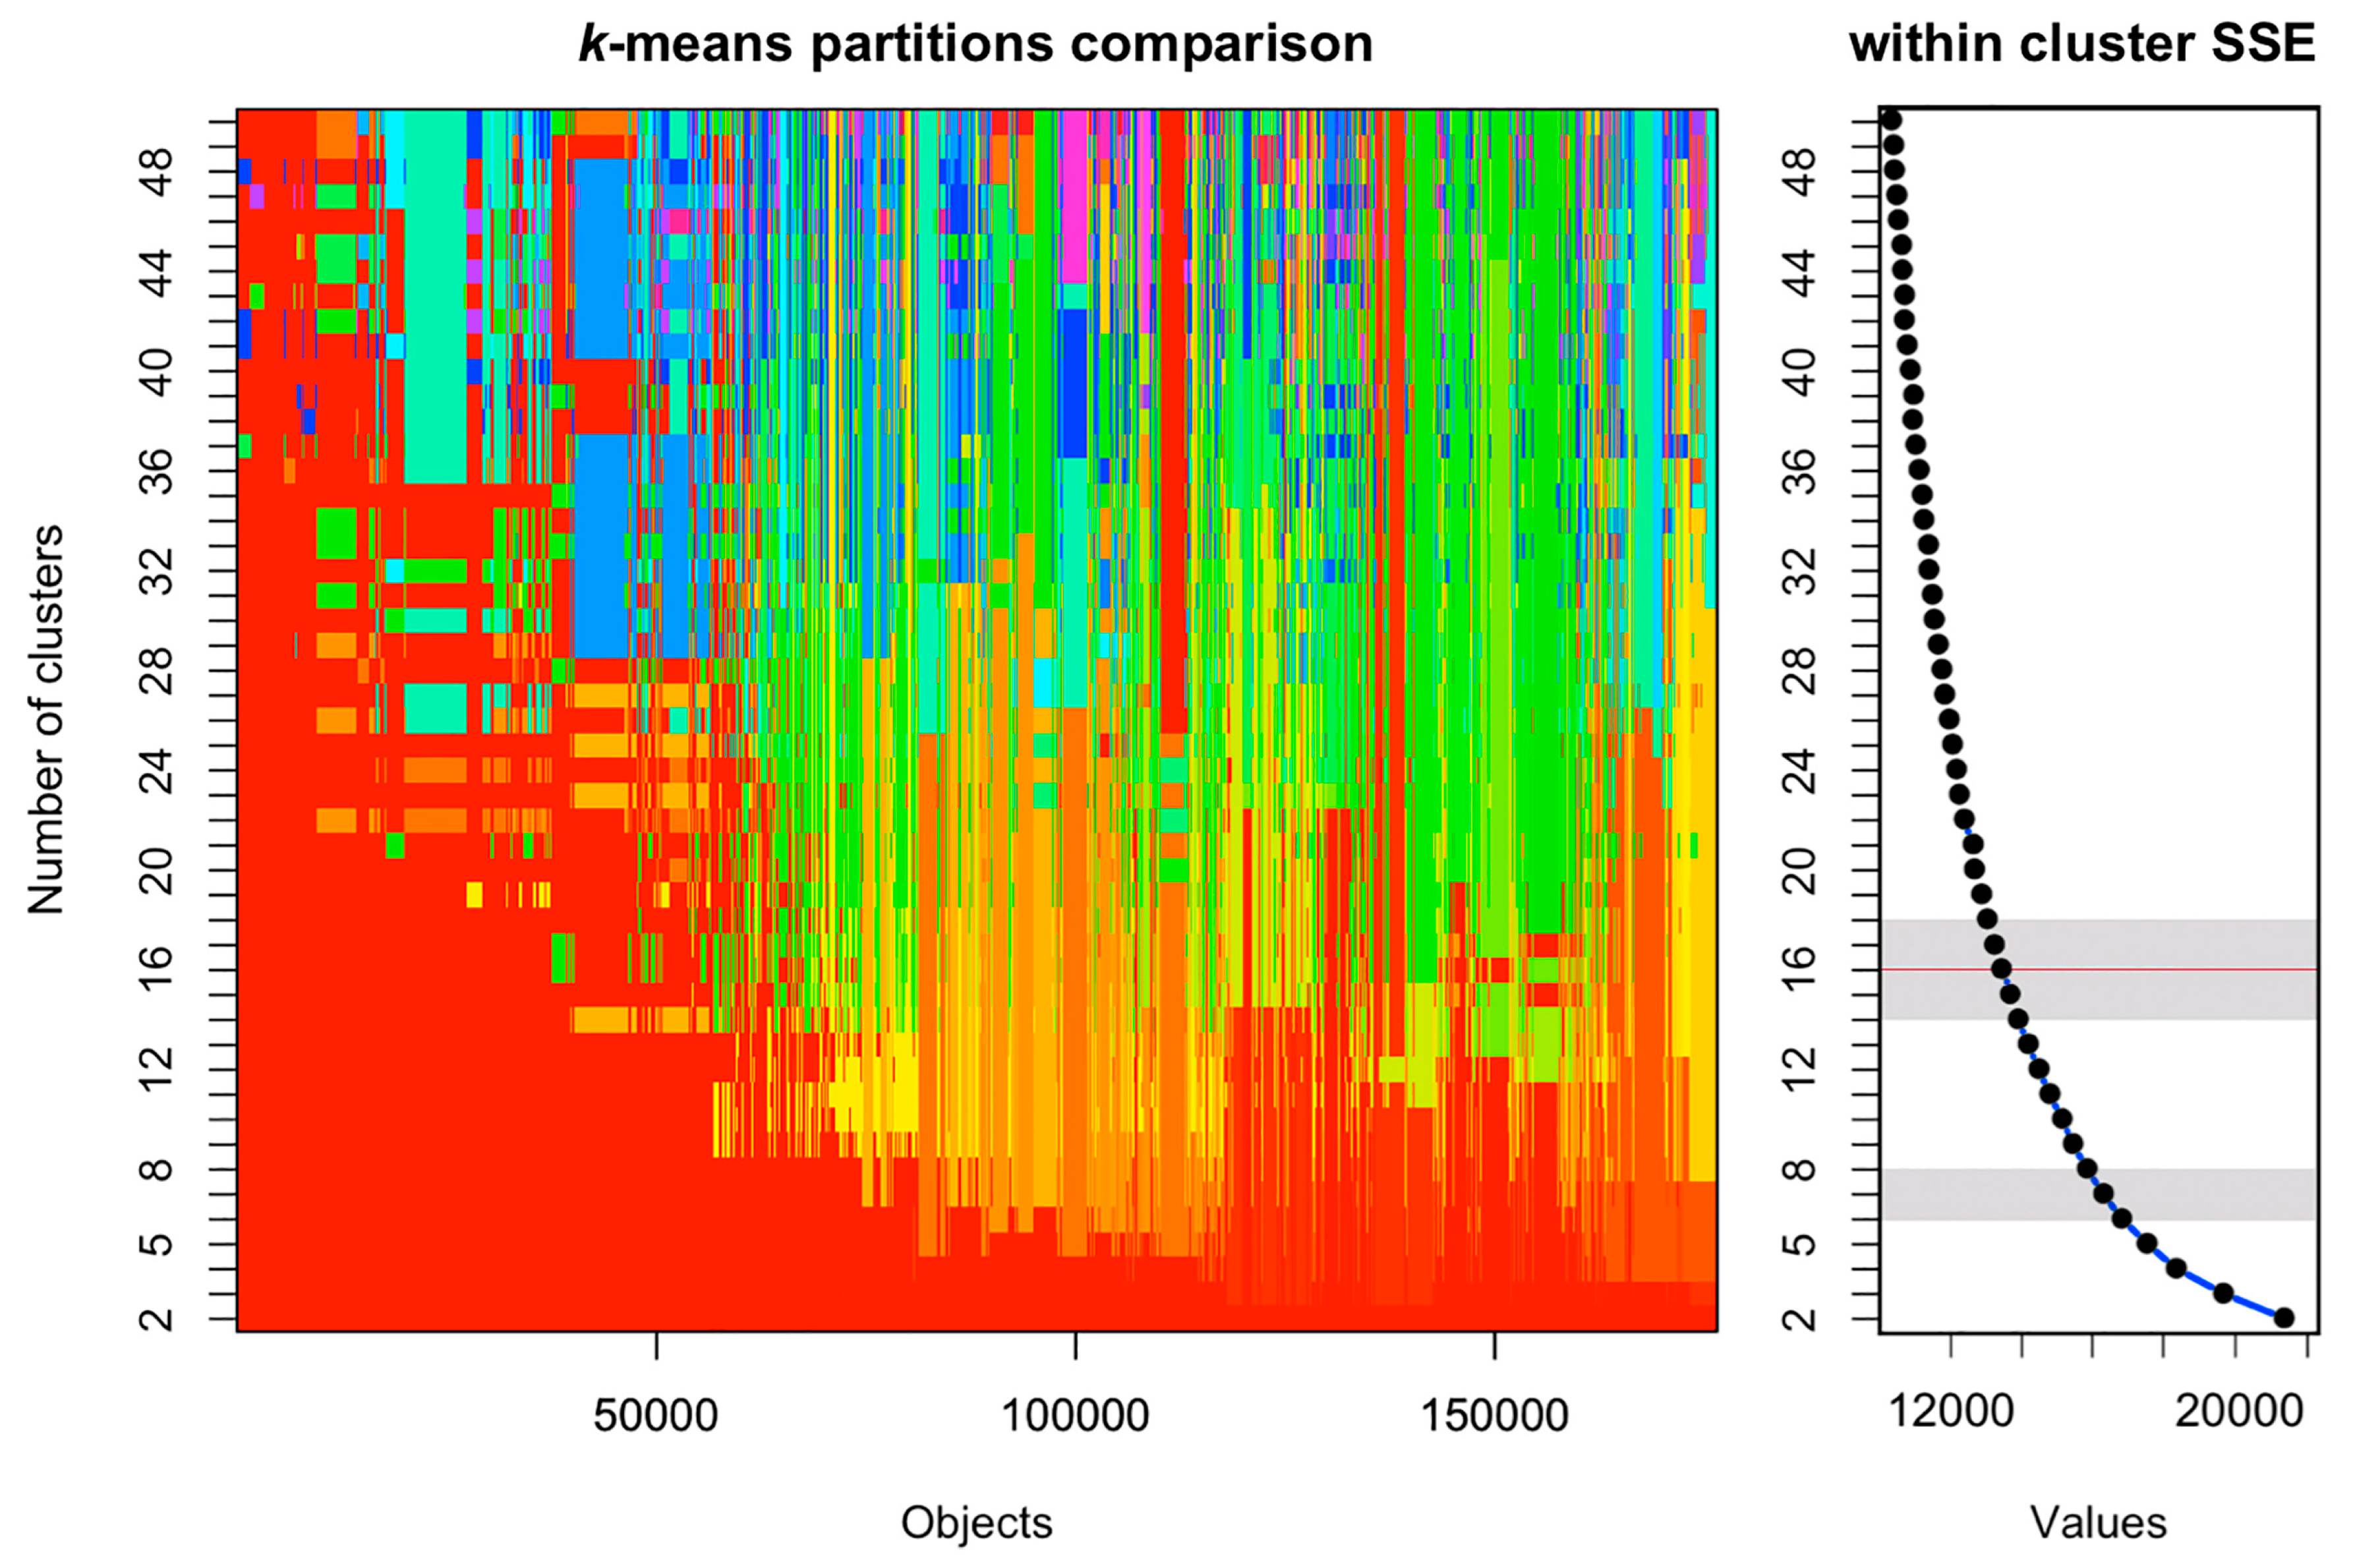
4.2. Traveler Division Based on Boarding Profile
5. Analysis and Results
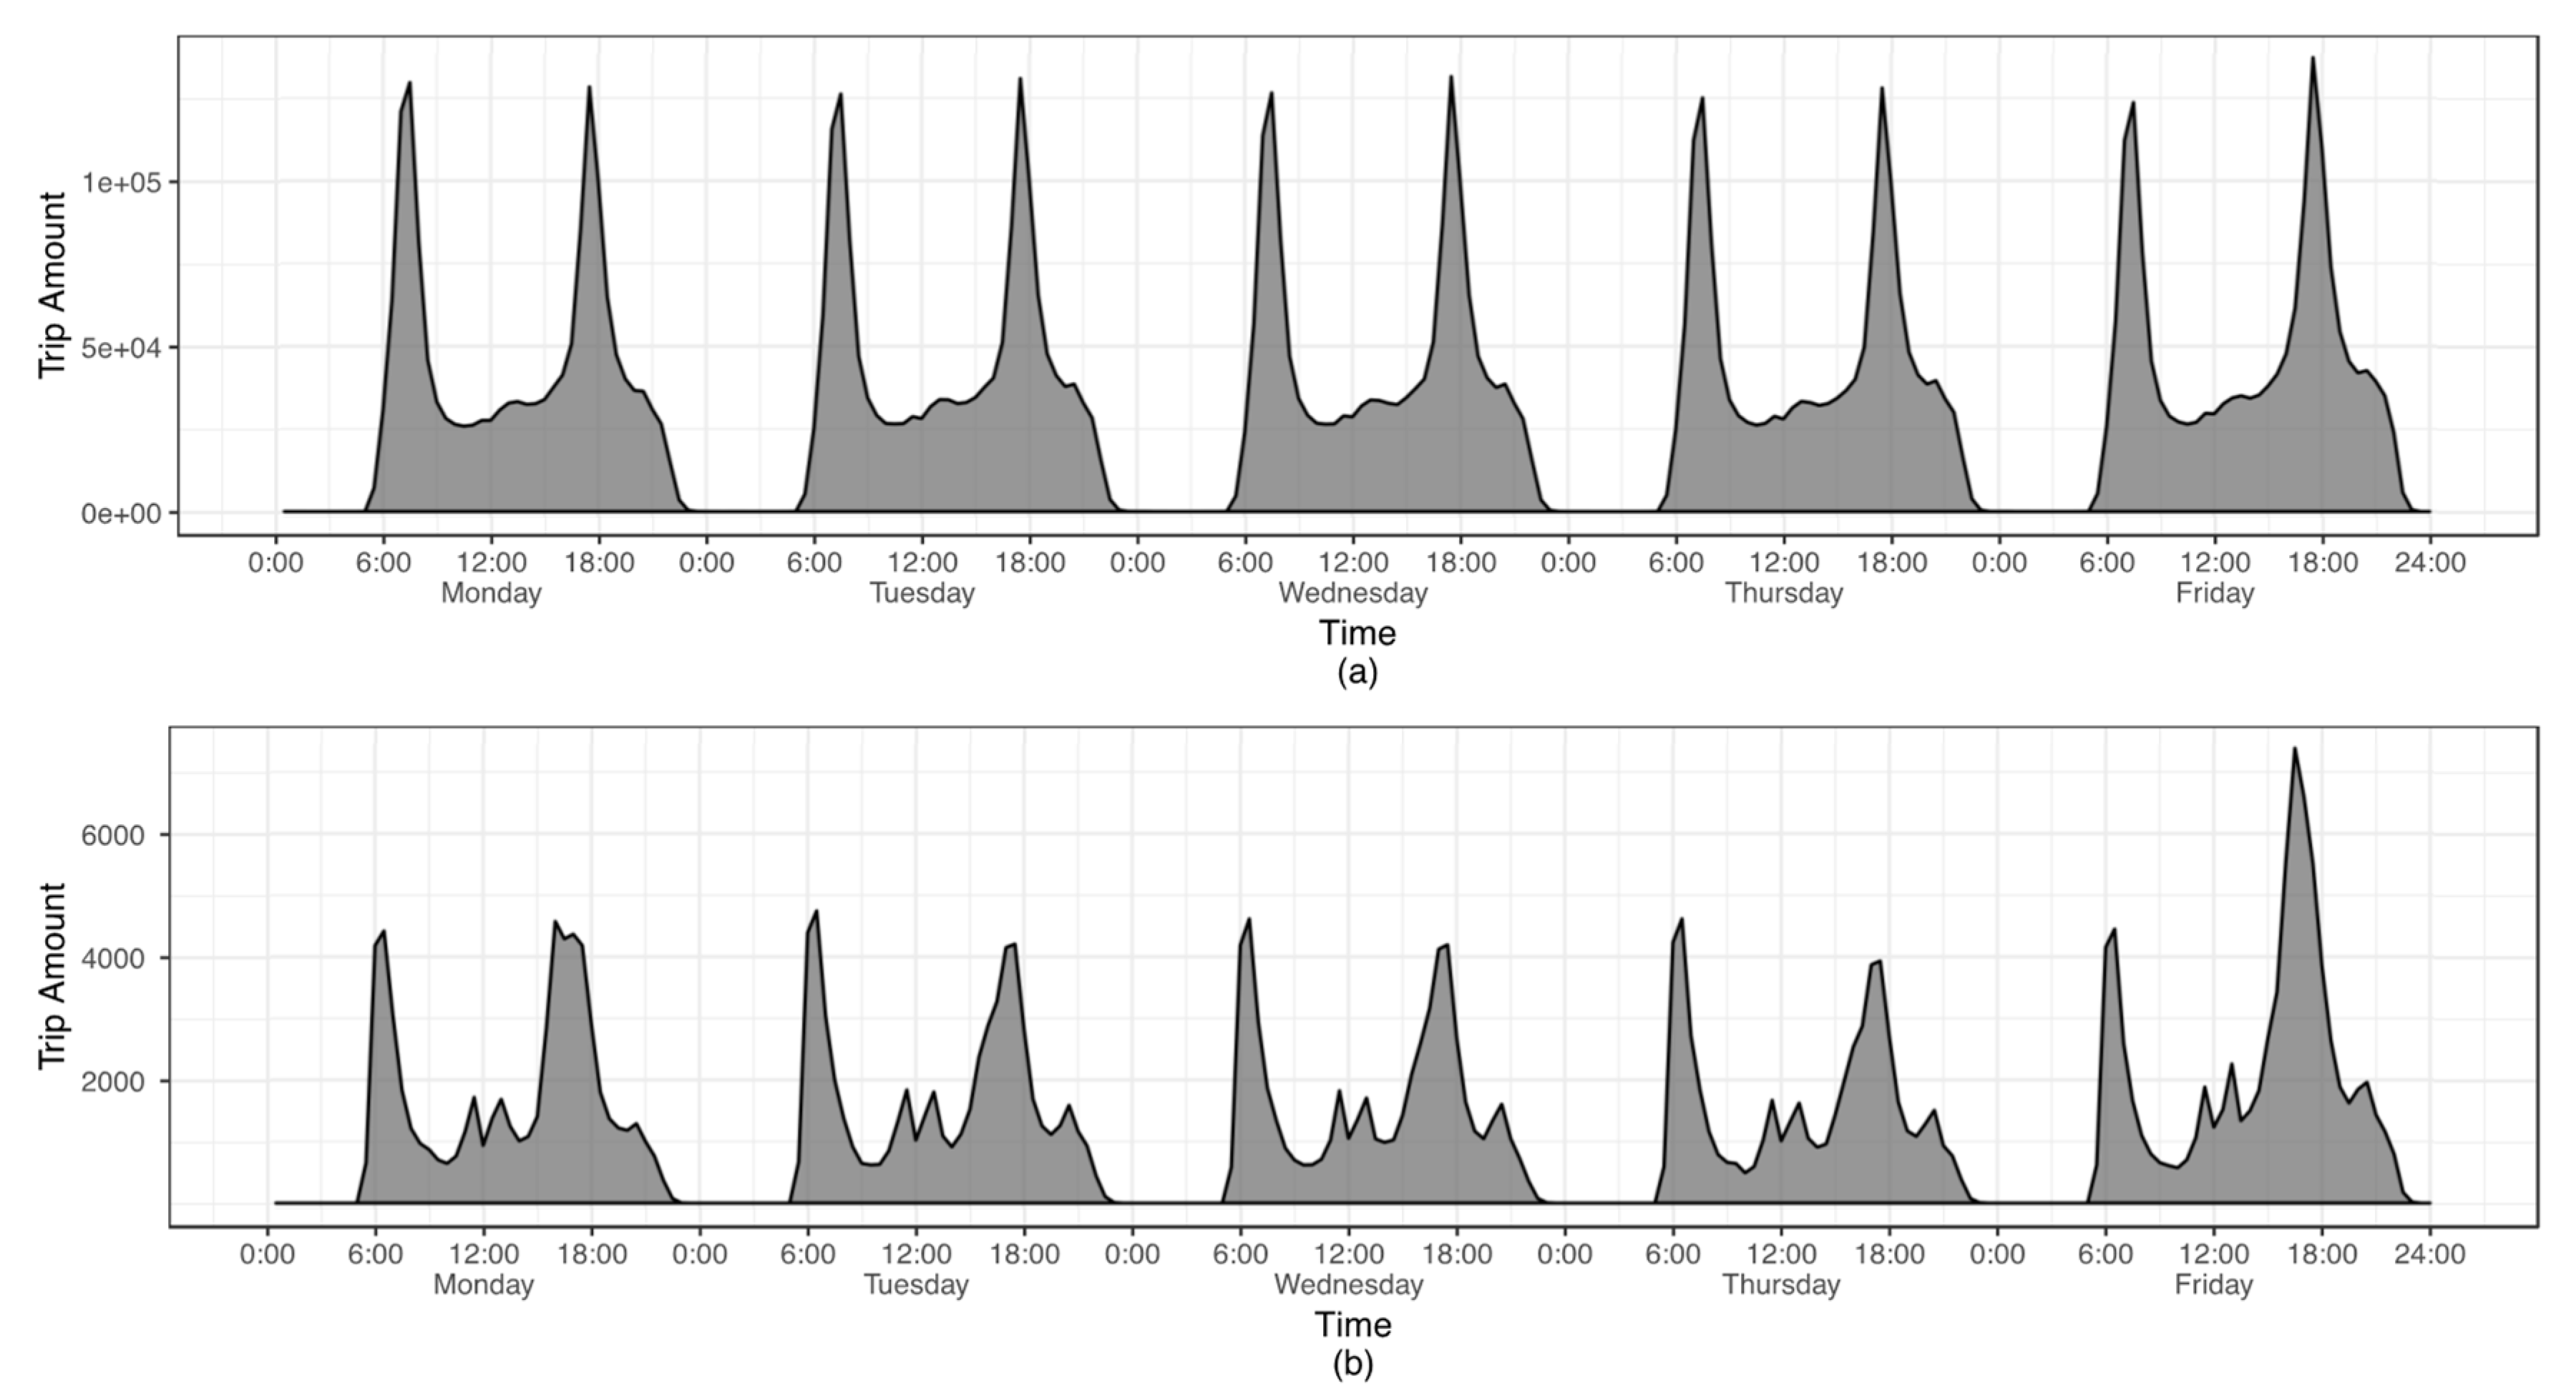
5.1. Temporal Mobility Analysis
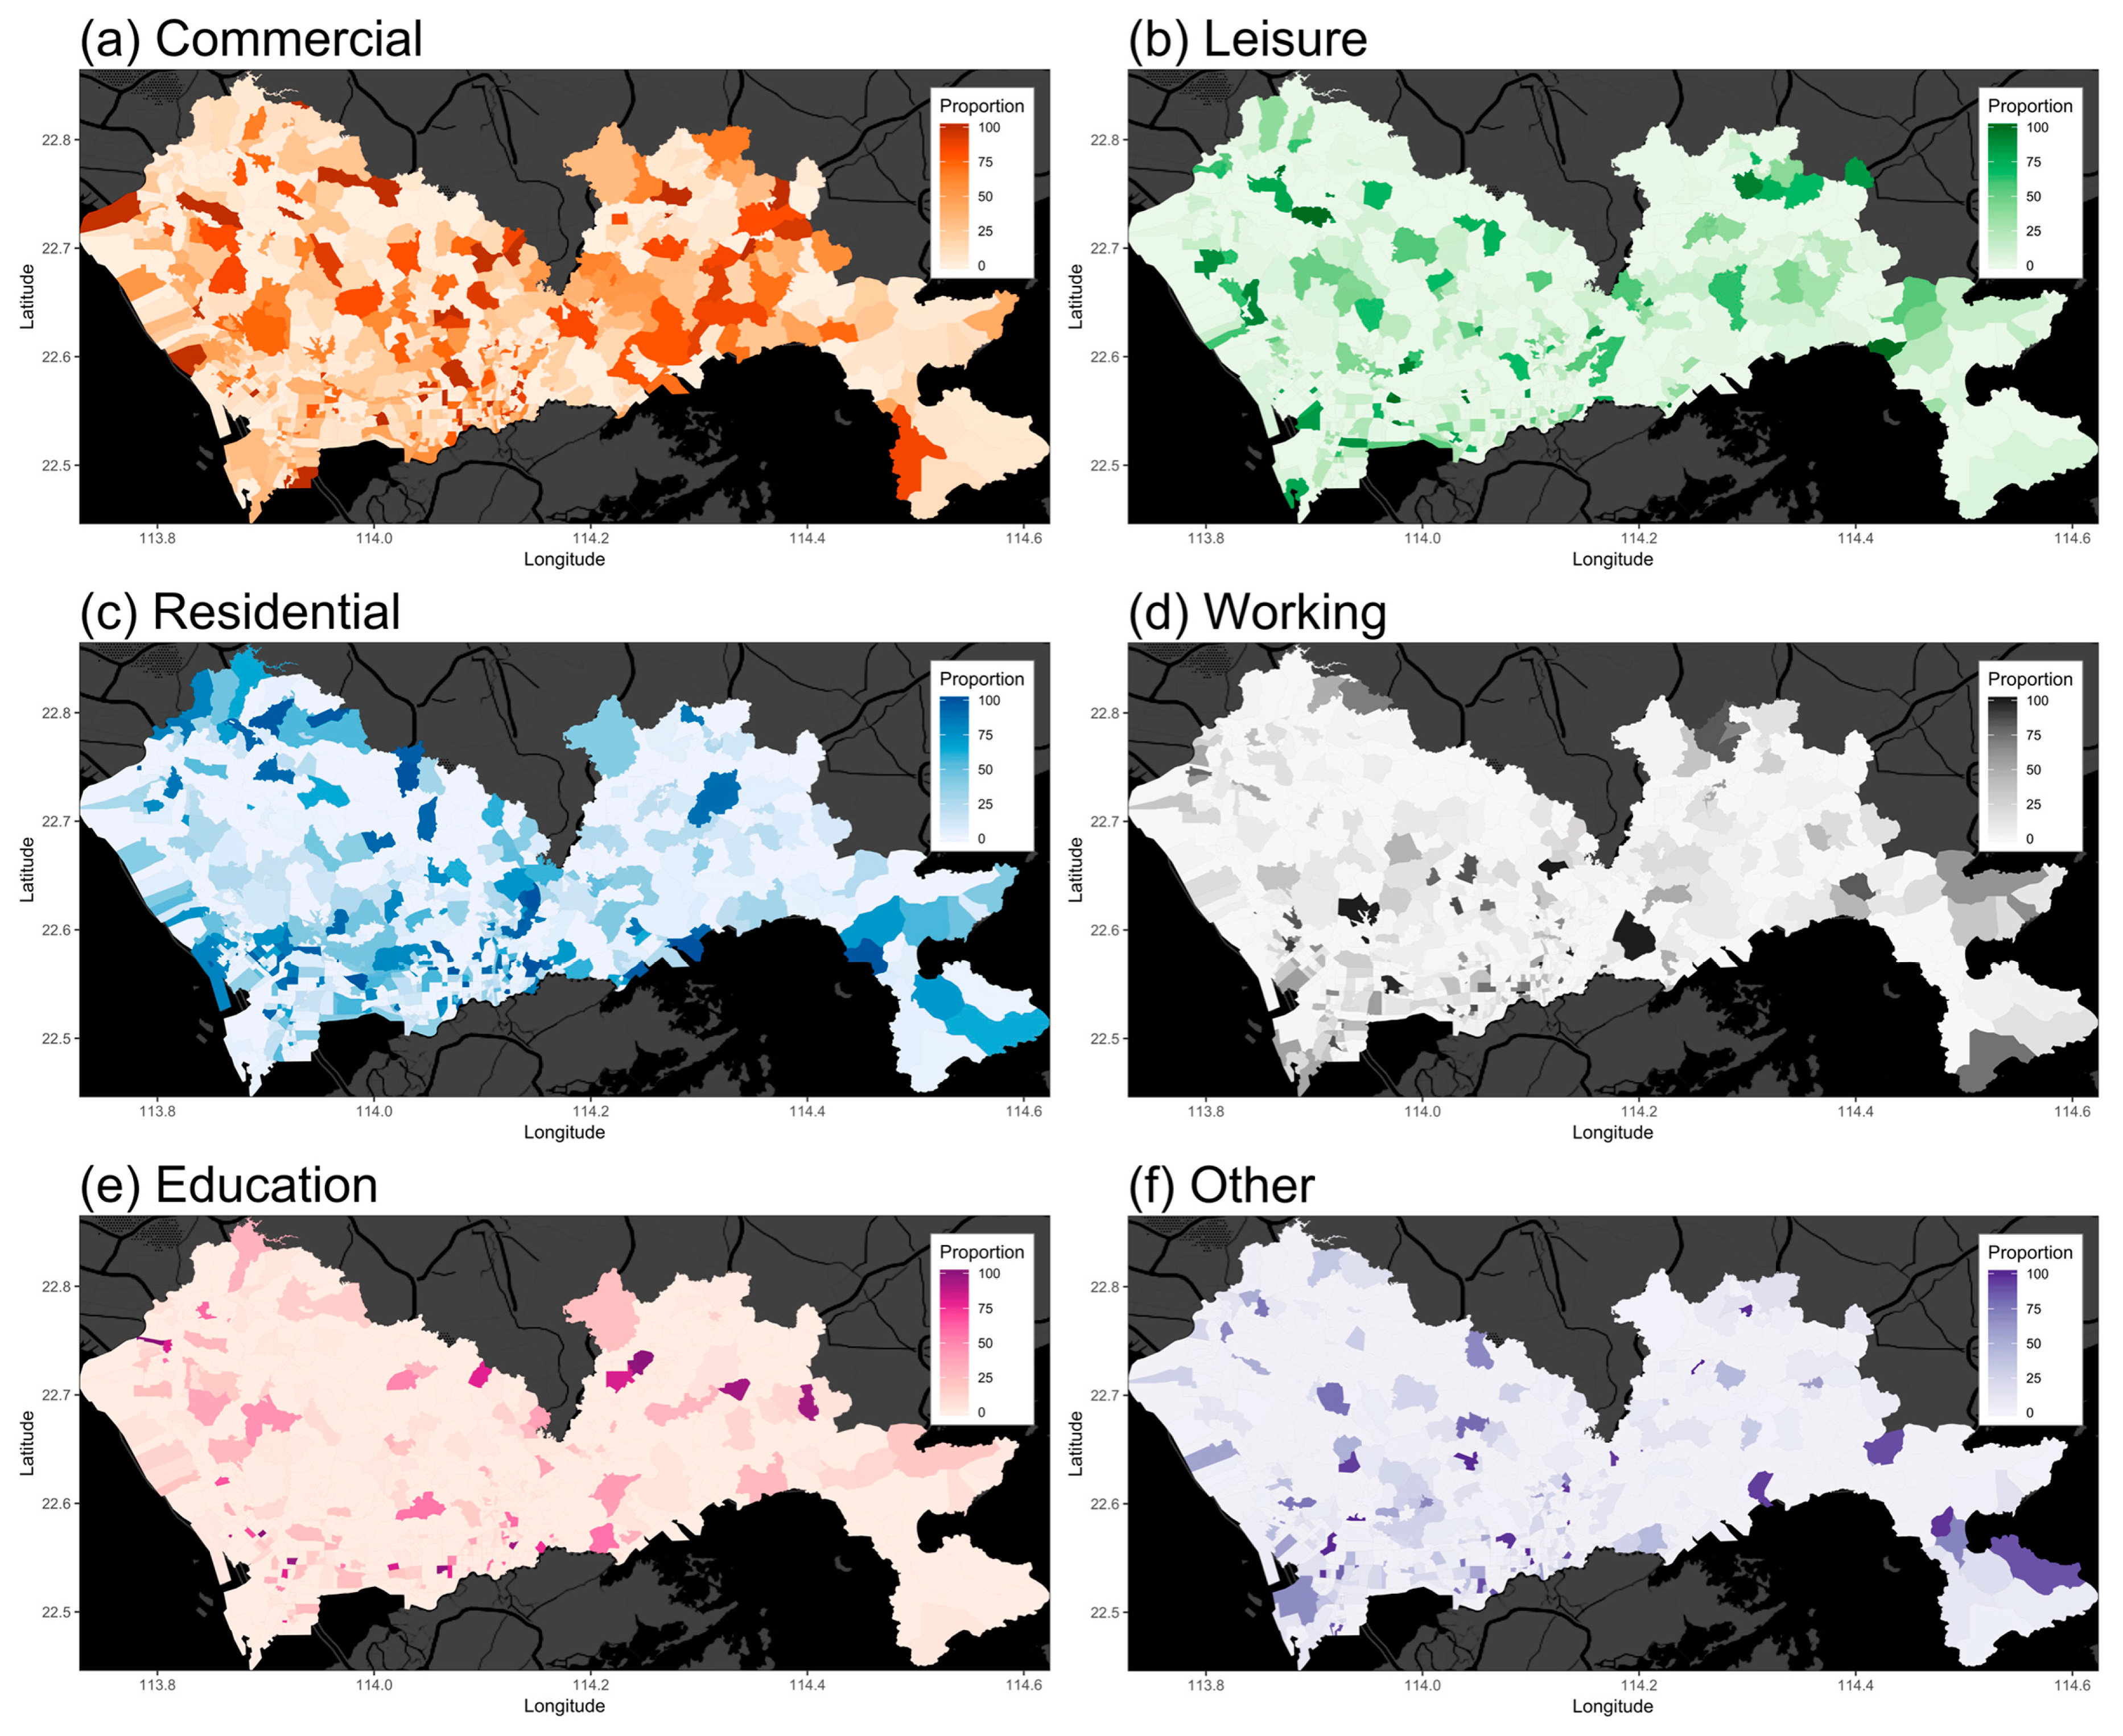
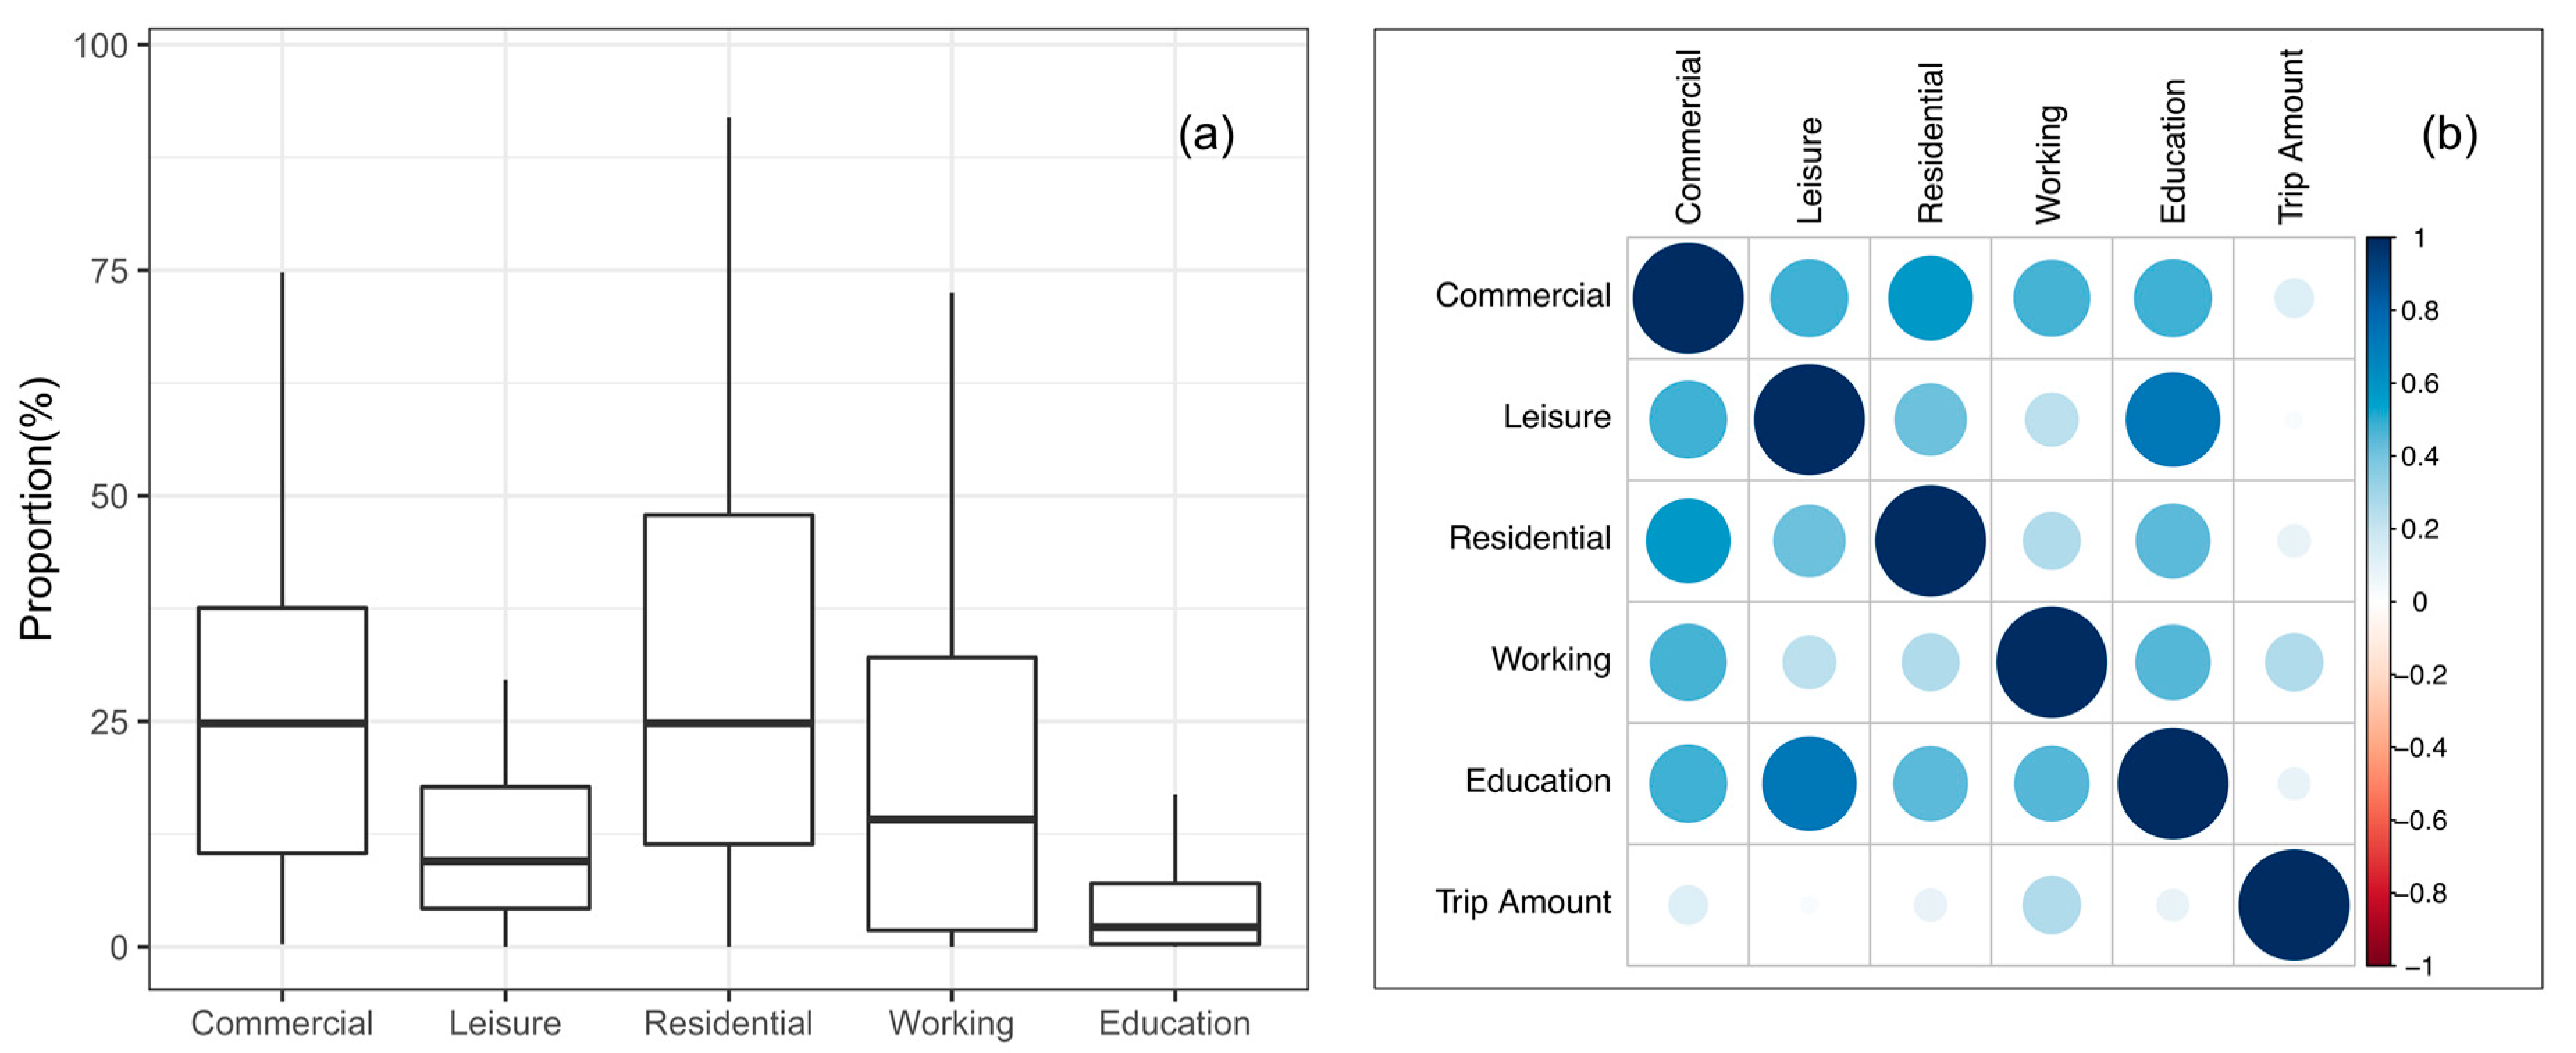
5.2. Trip Purpose Pattern Analysis
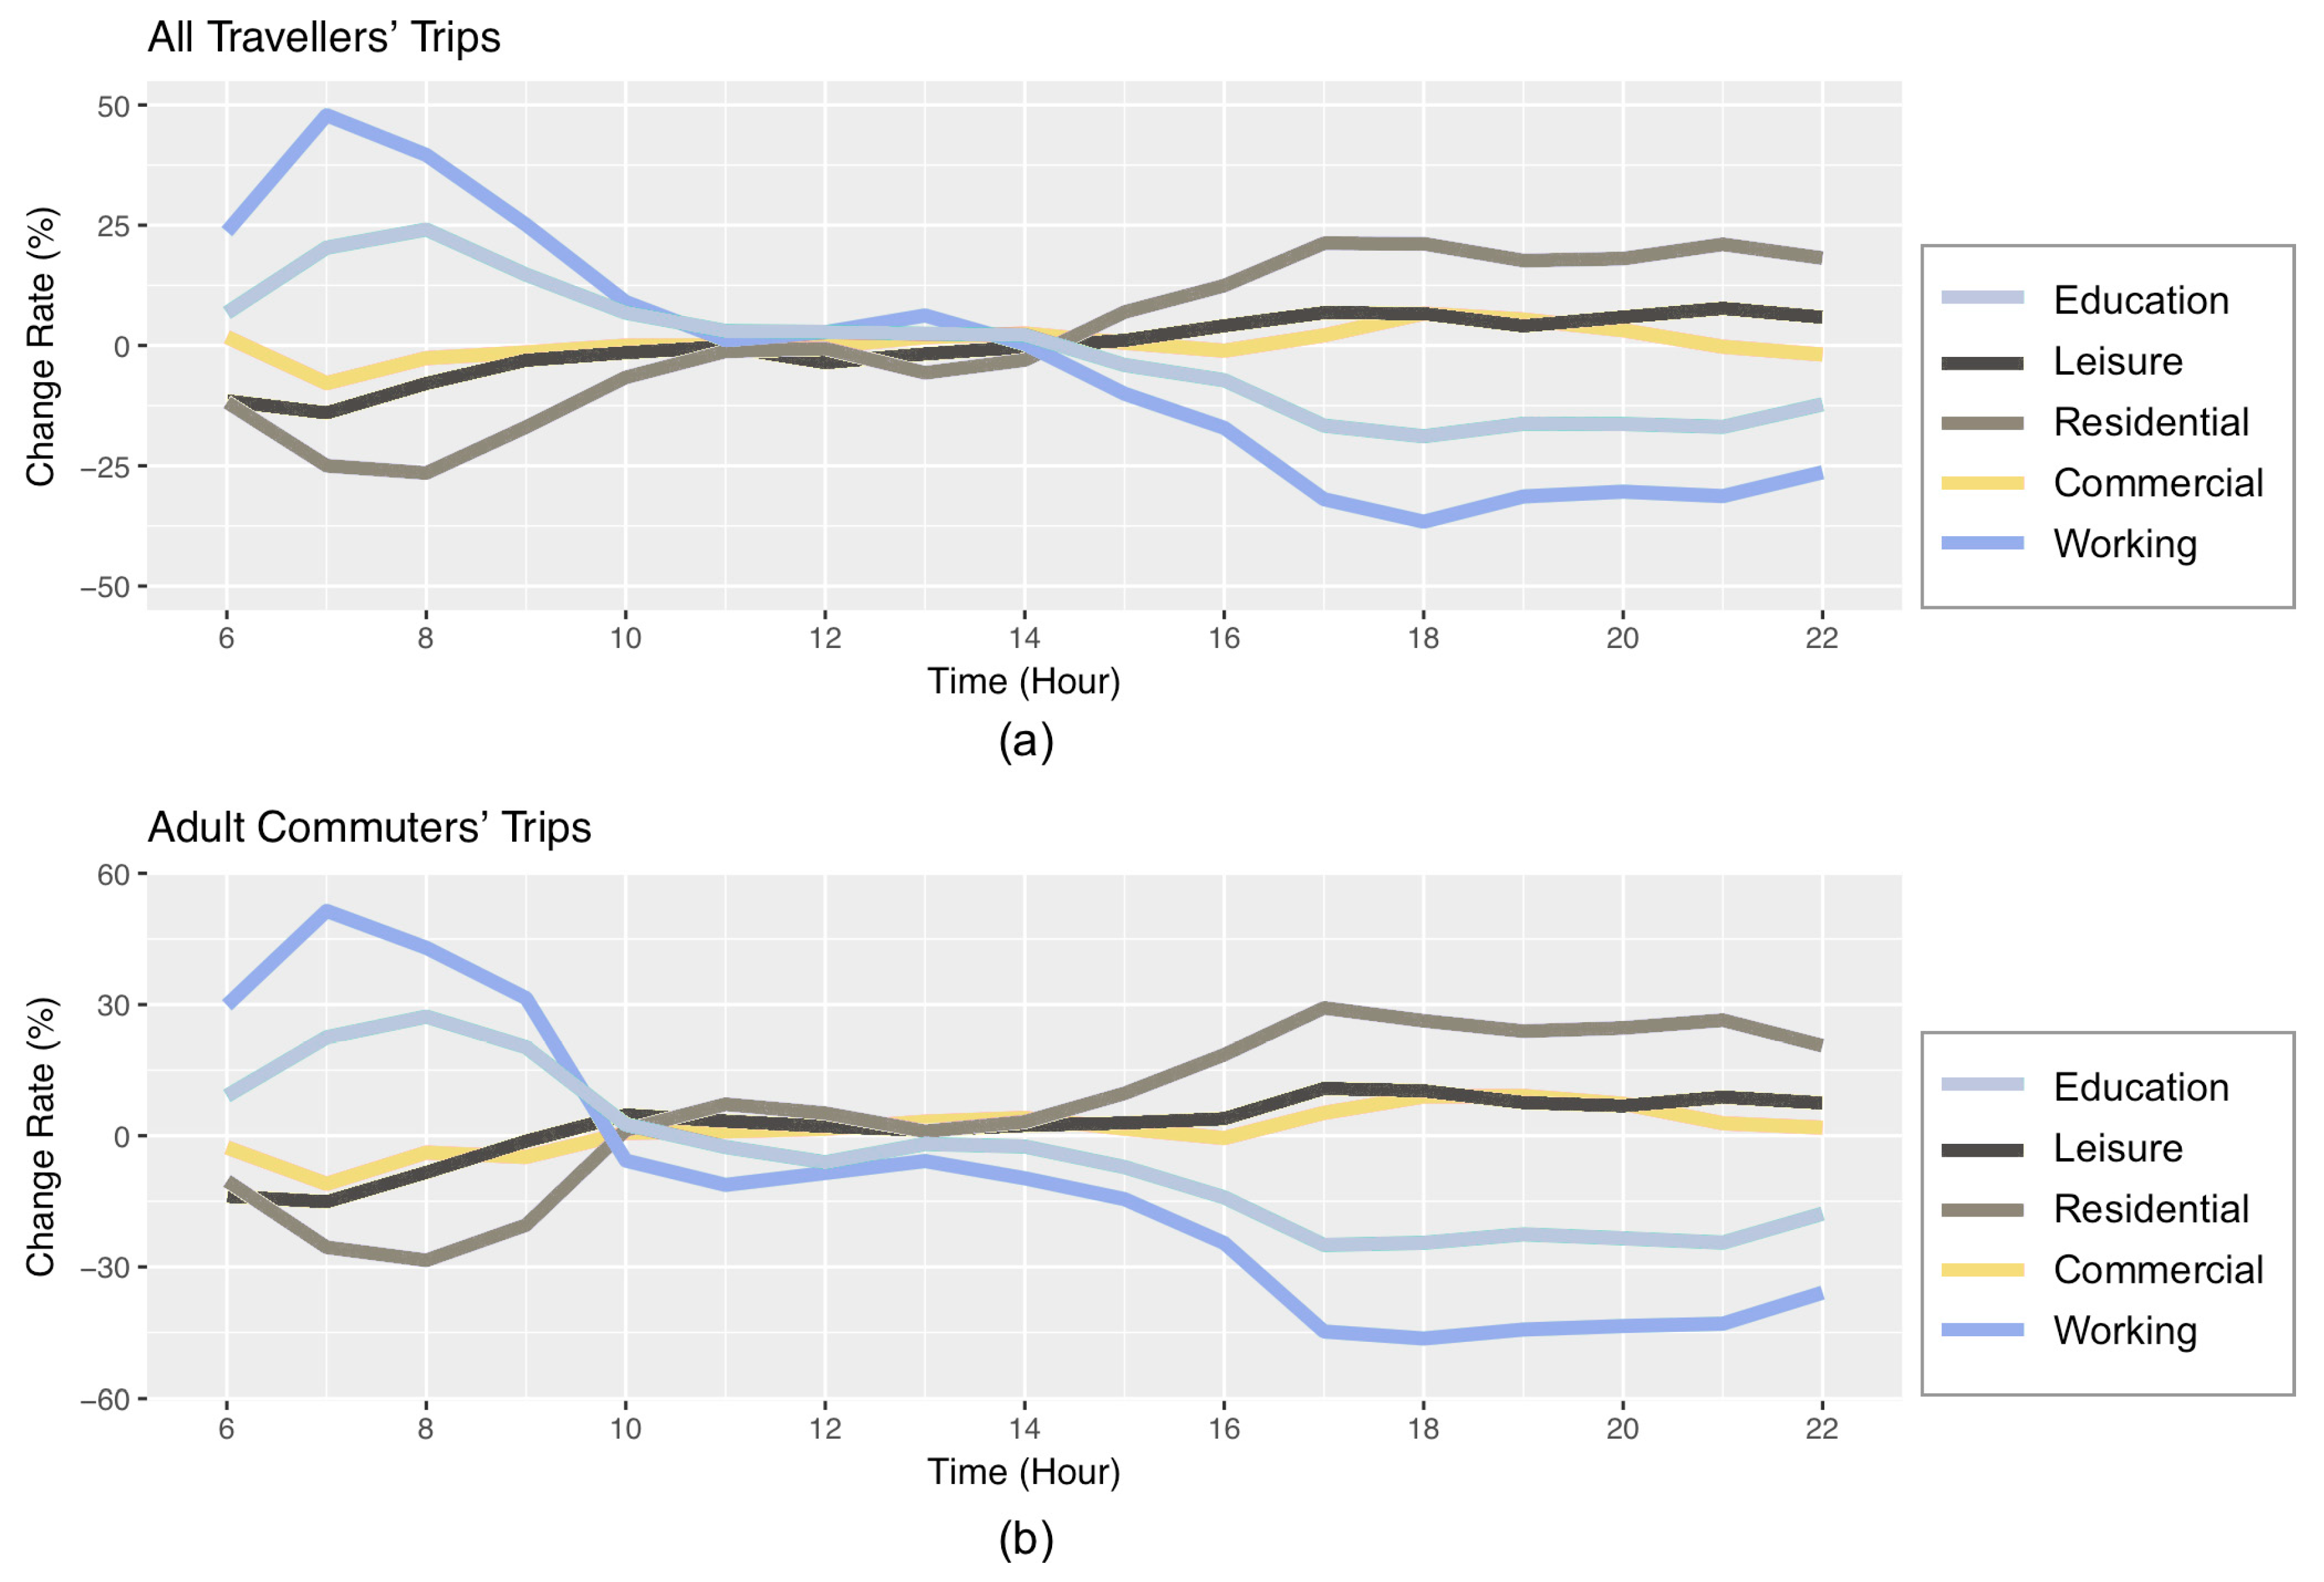
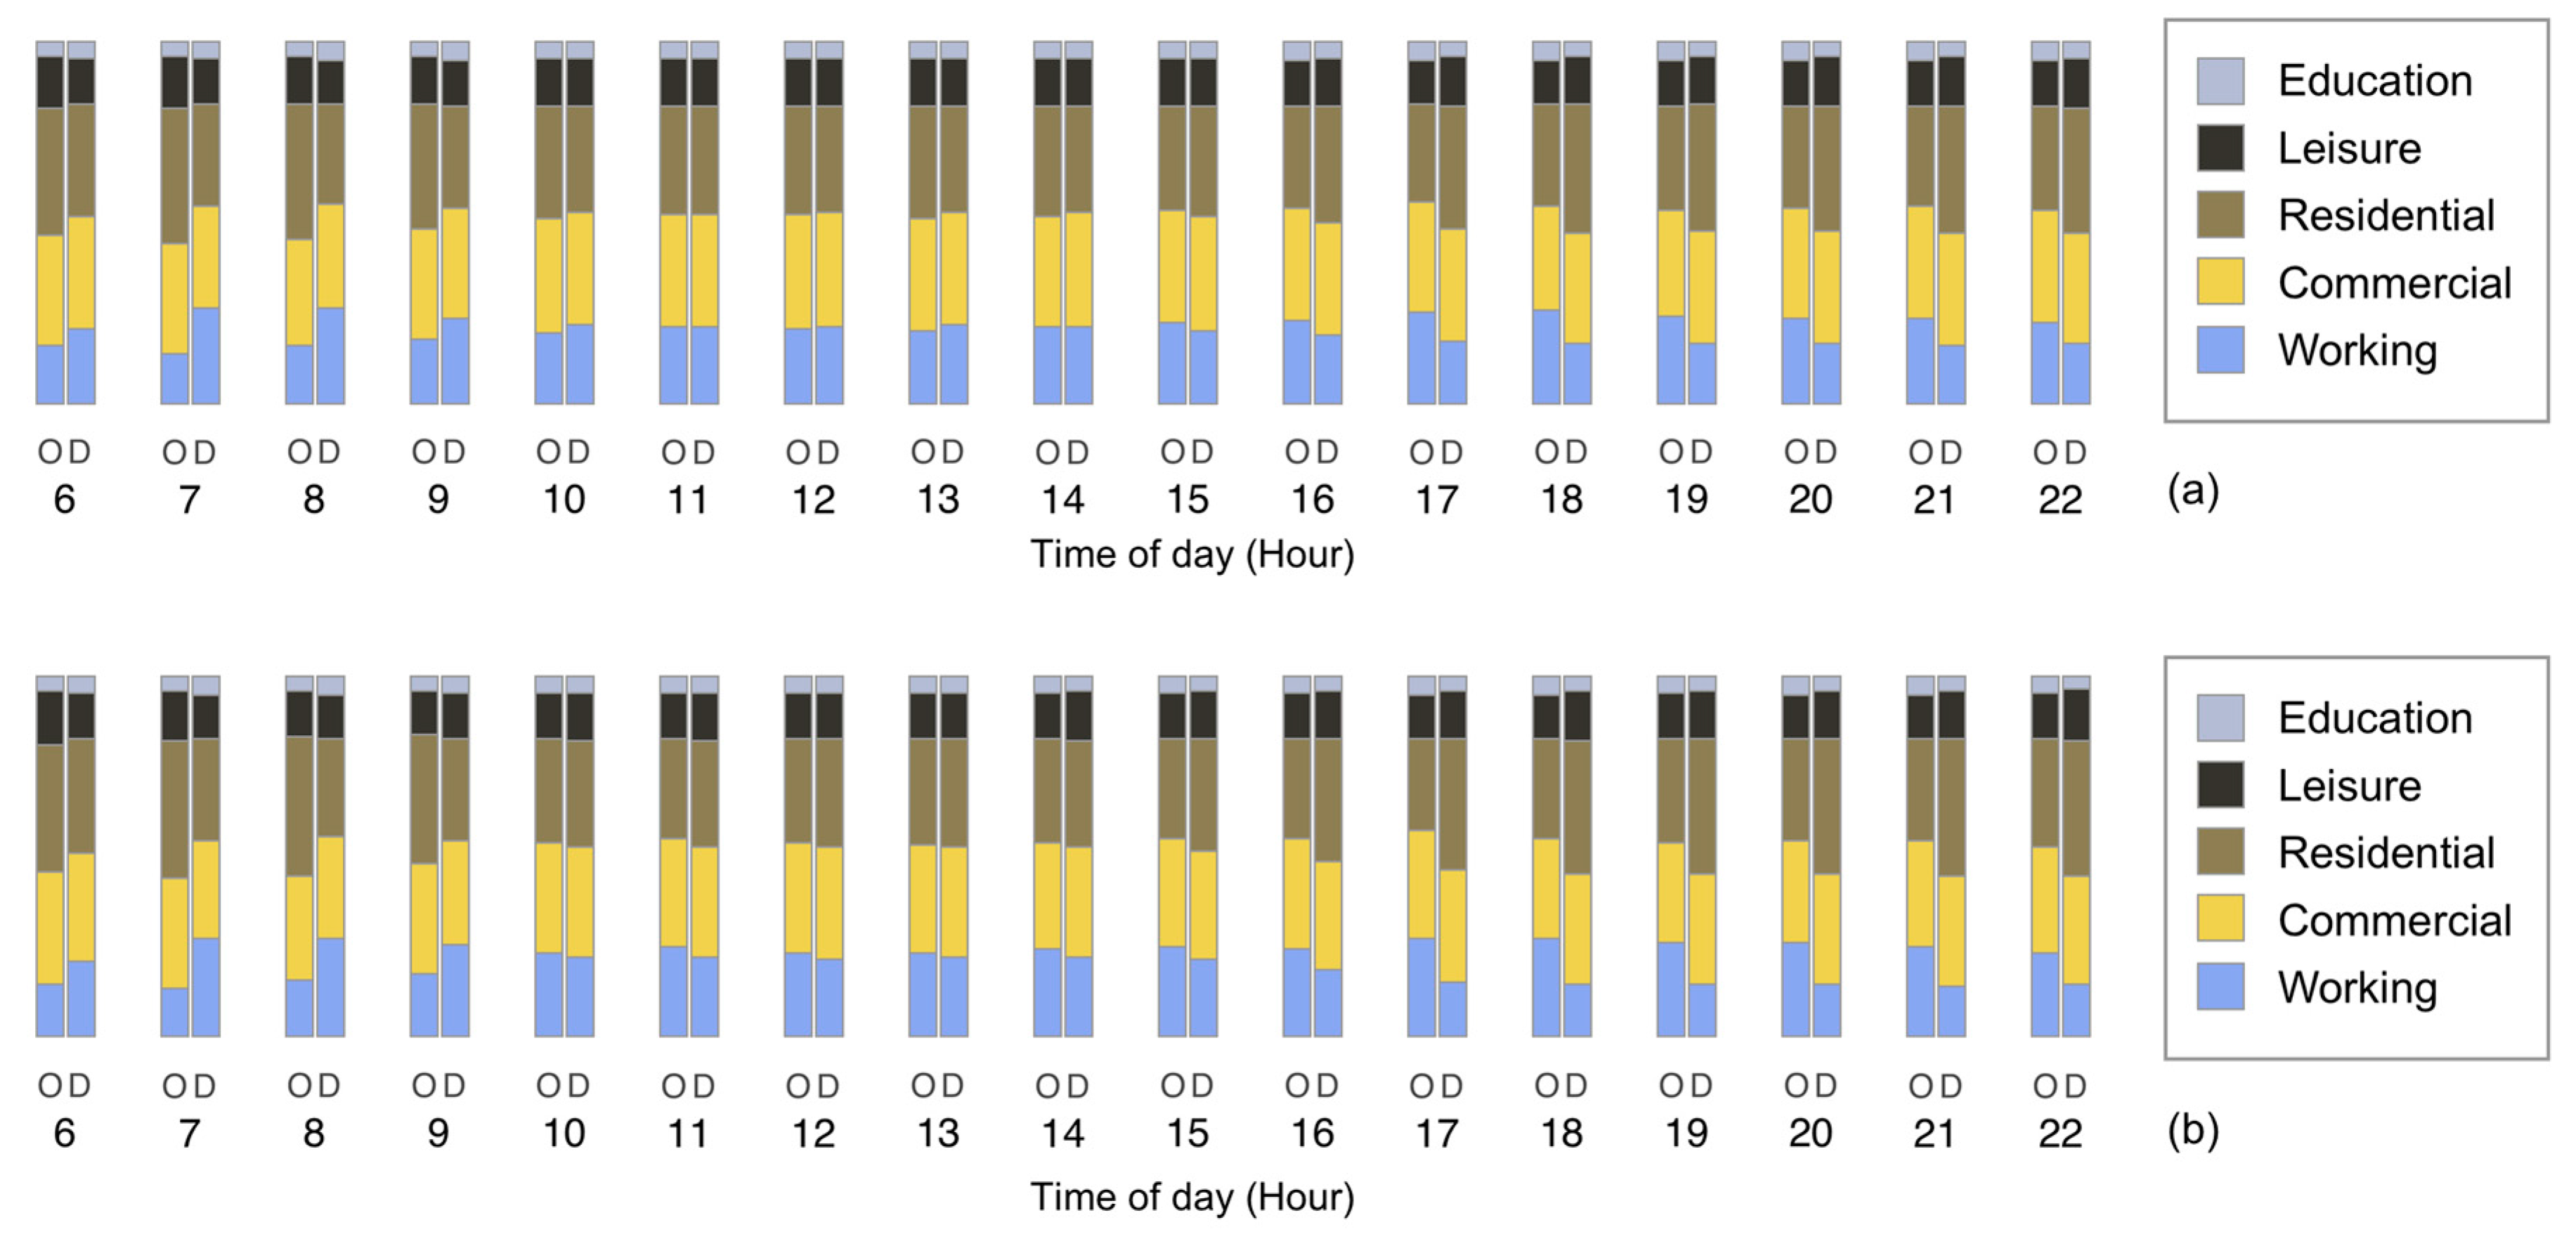
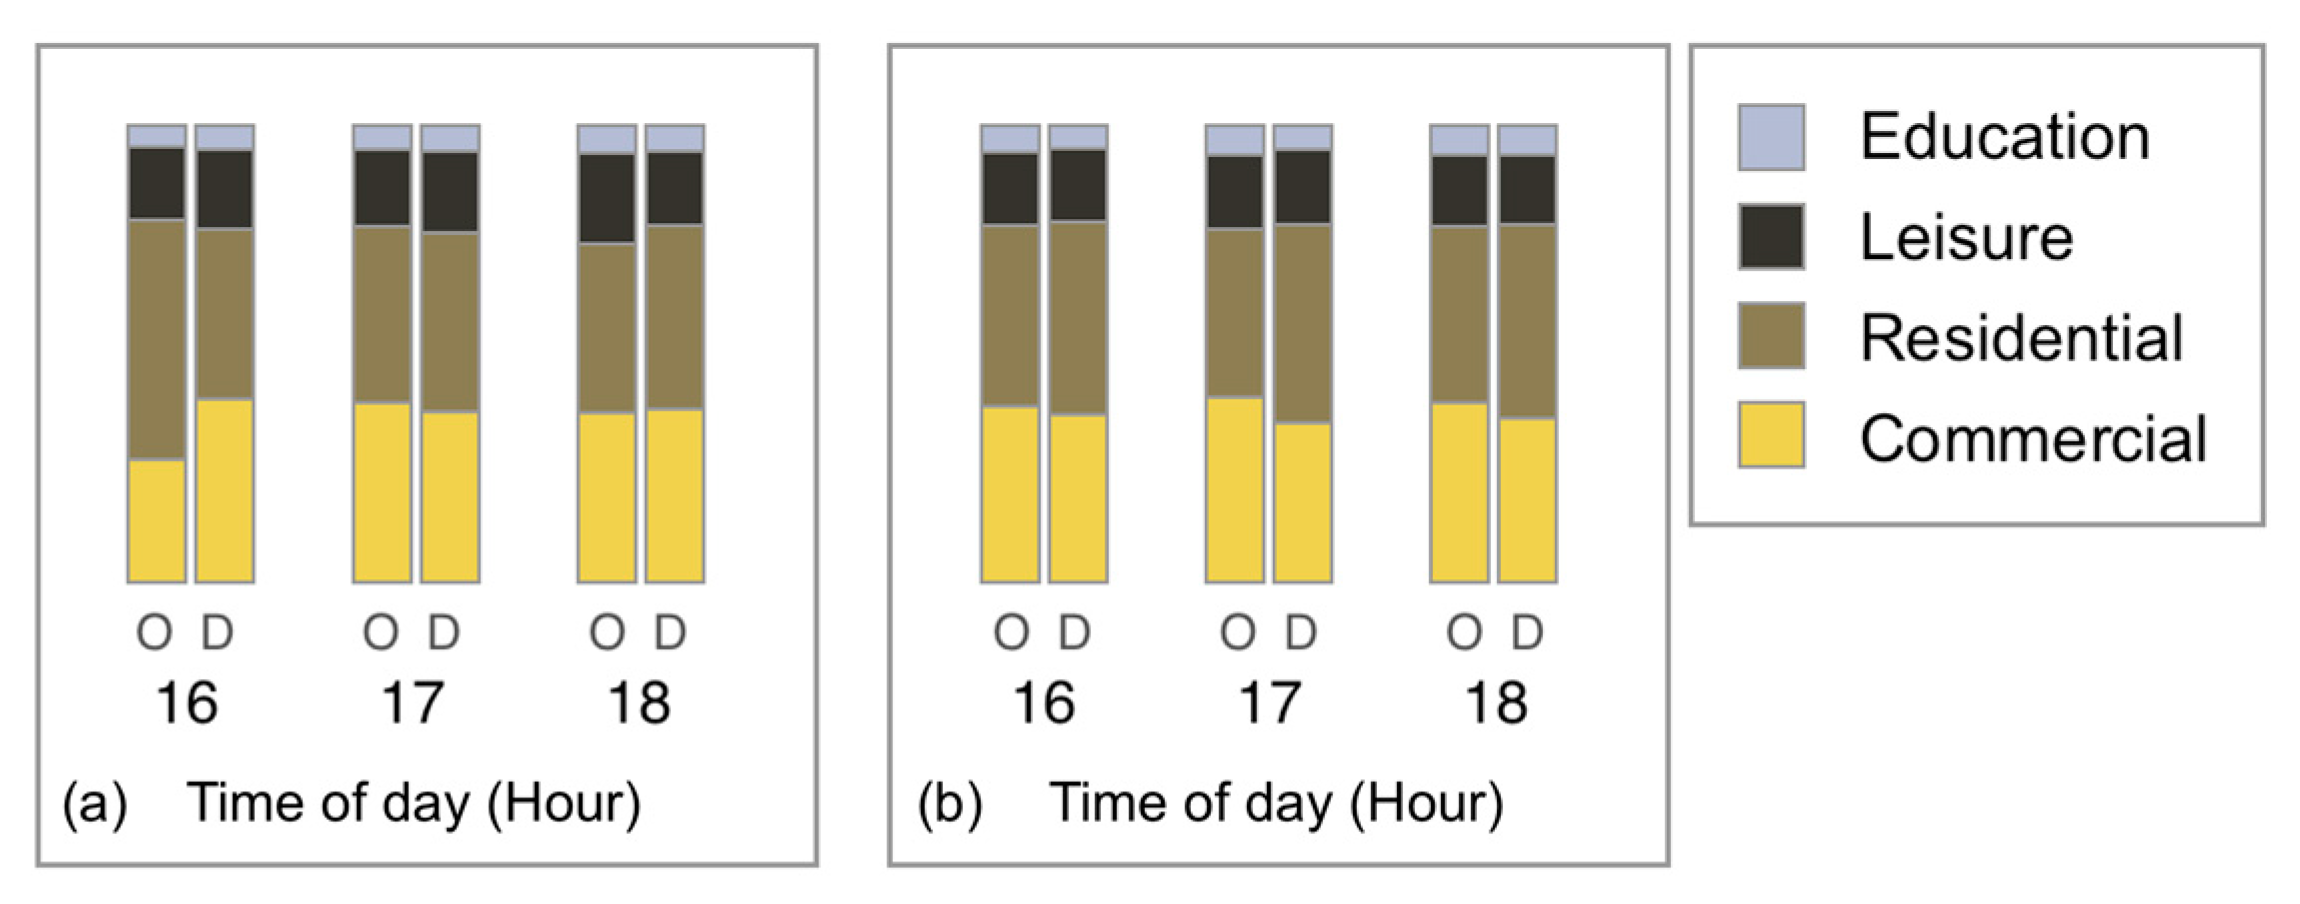
5.2.1. Temporal Trip Purpose of Adult Travellers
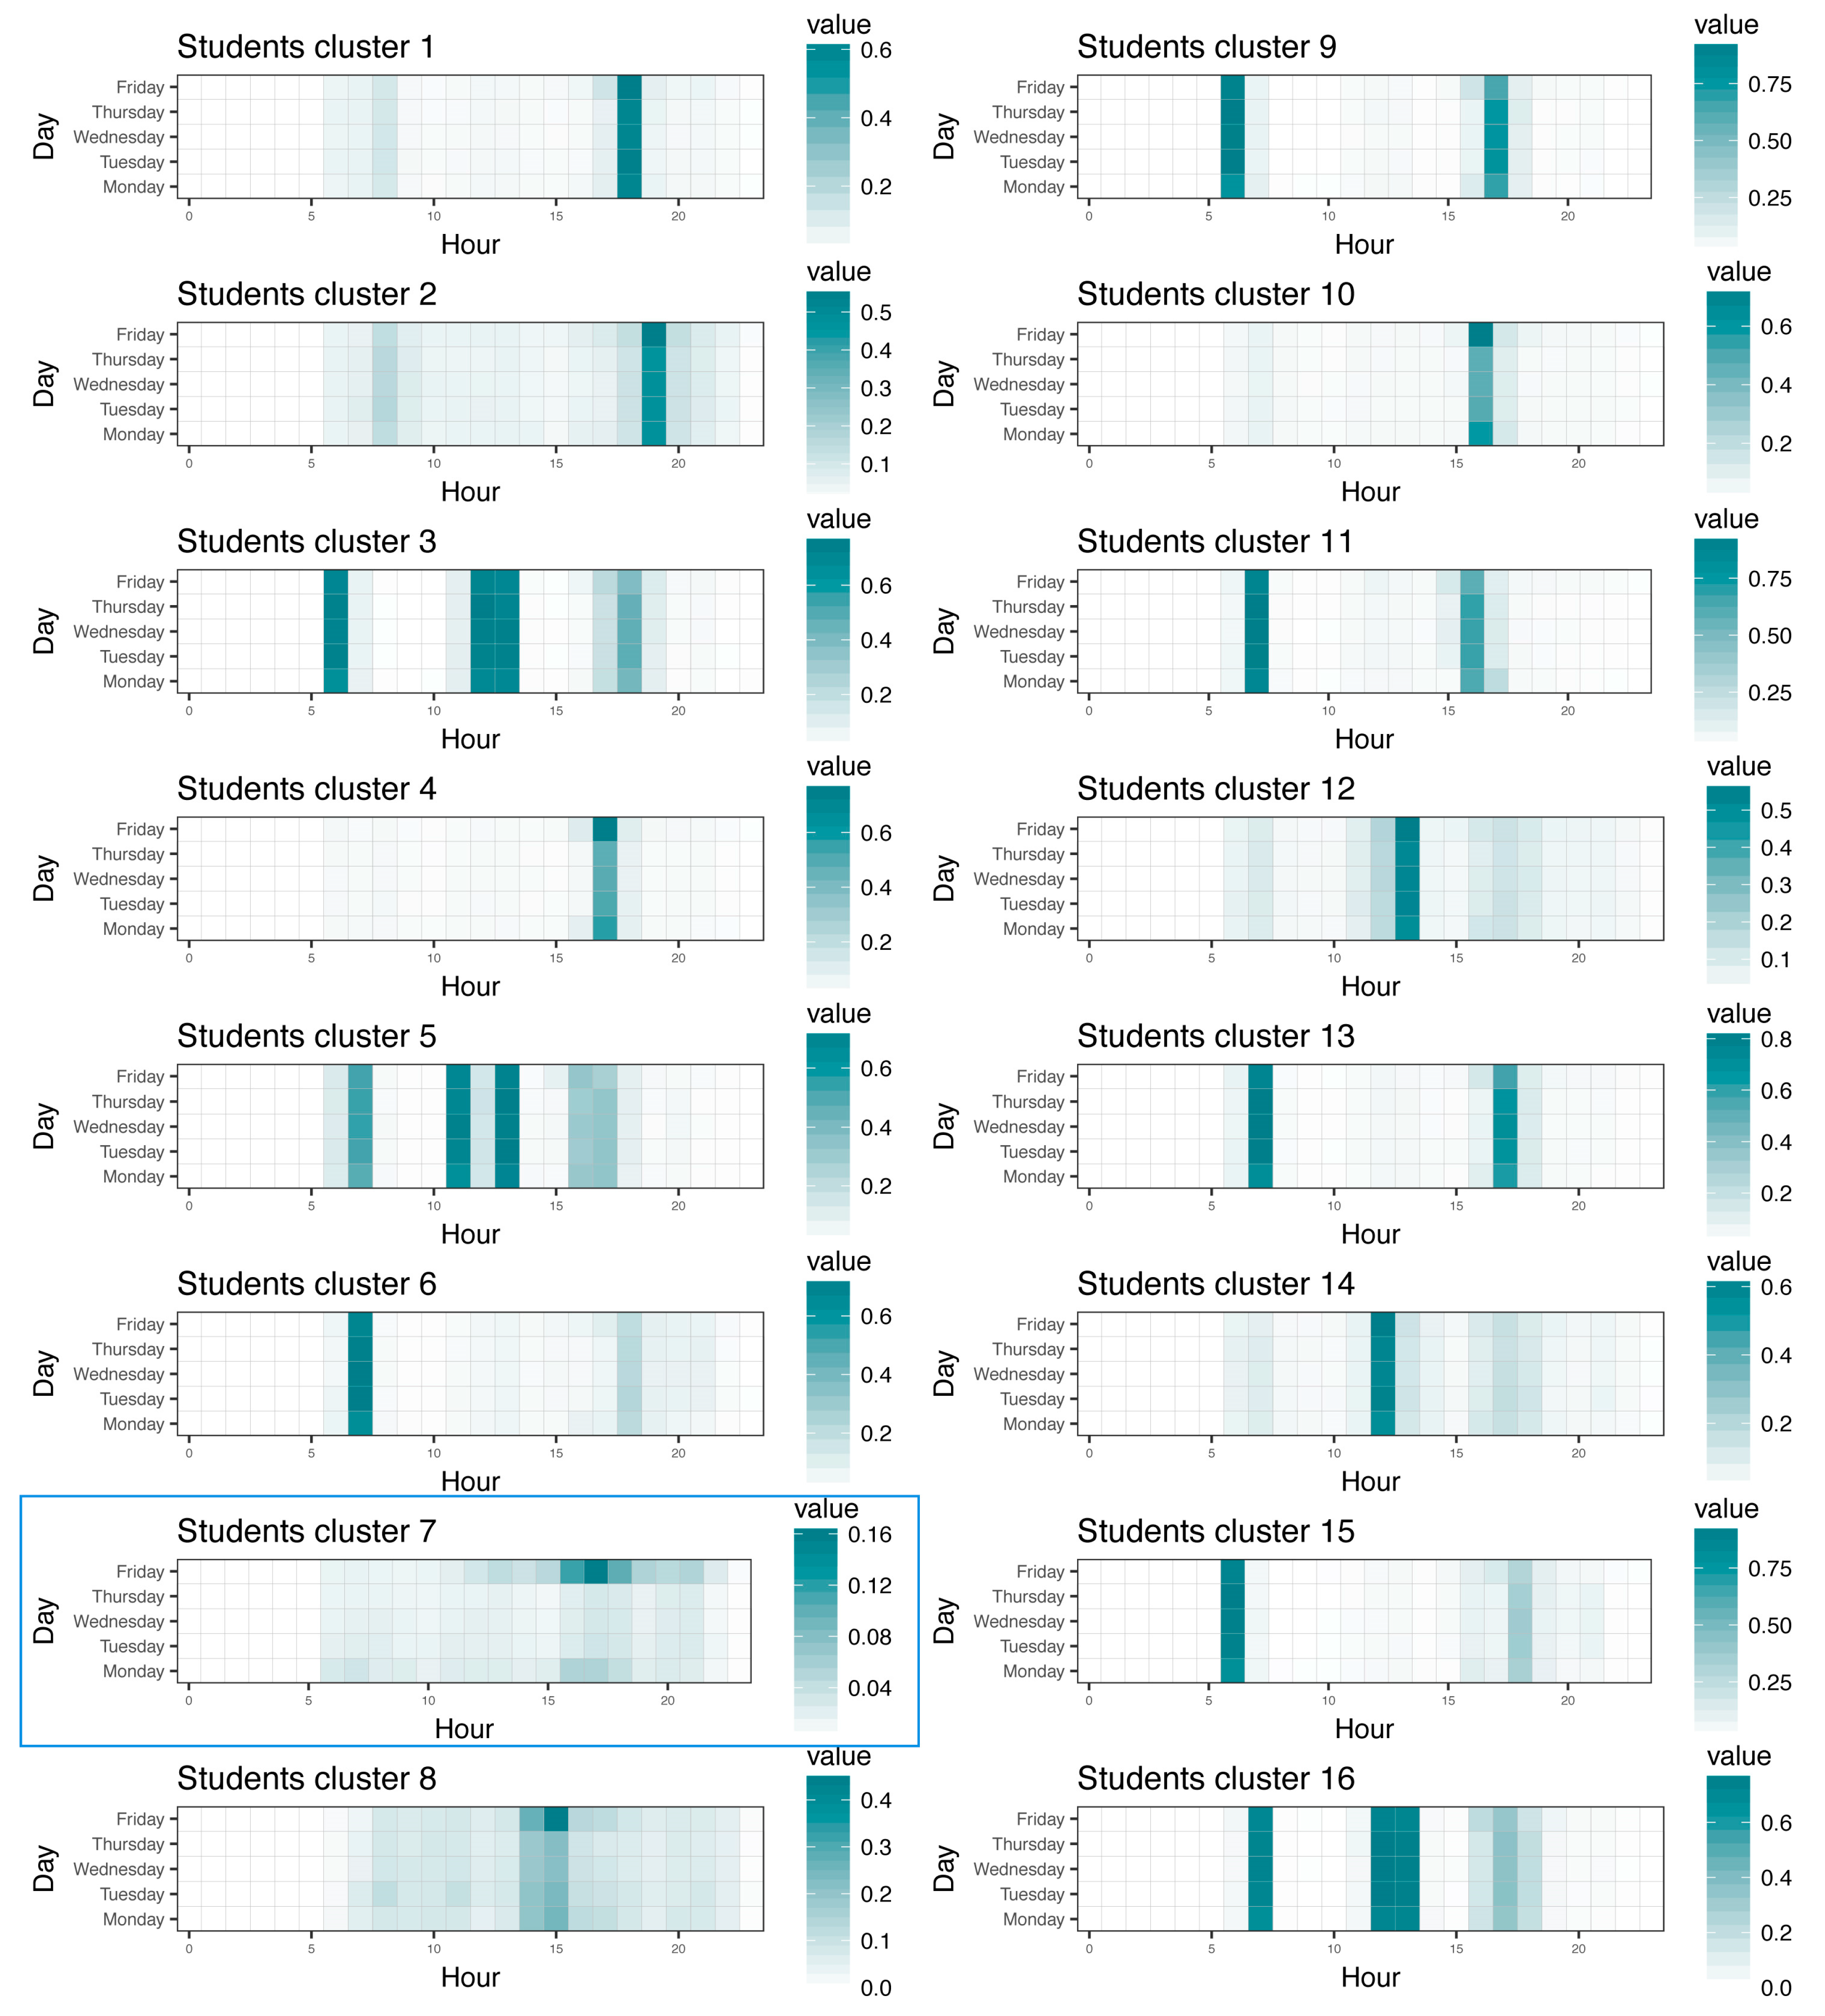
5.2.2. Temporal Trip Purpose of Students
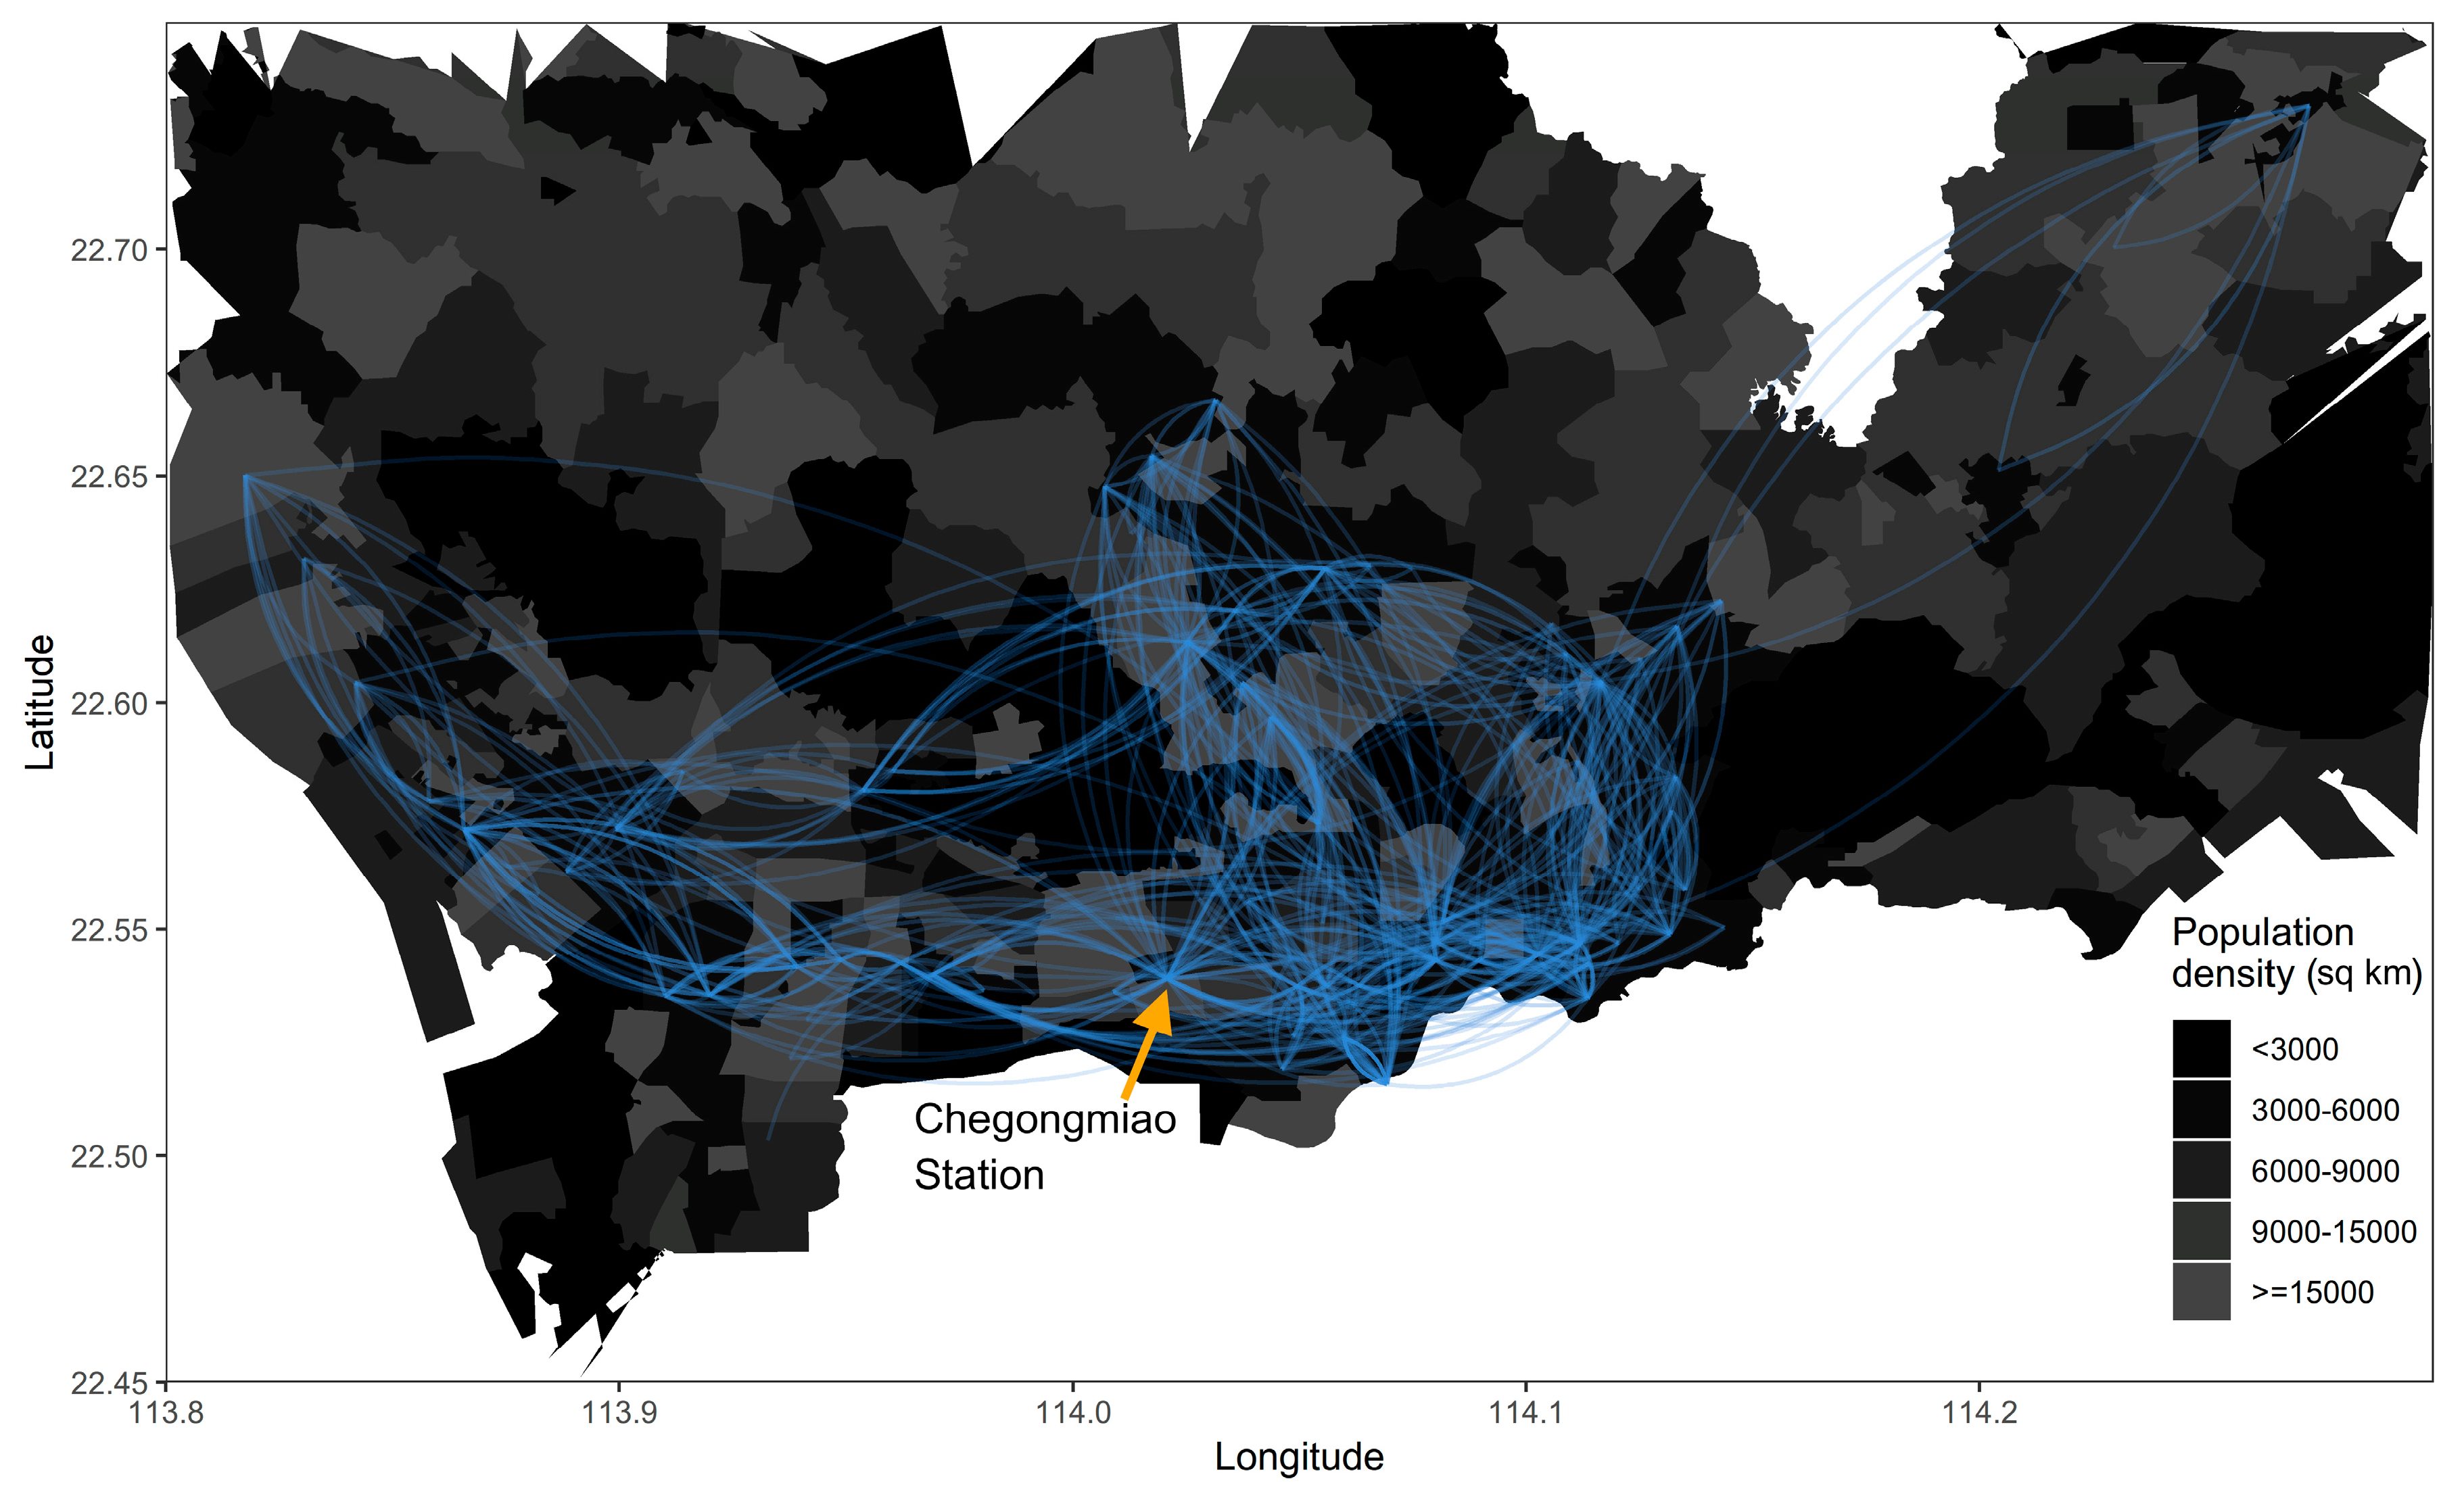
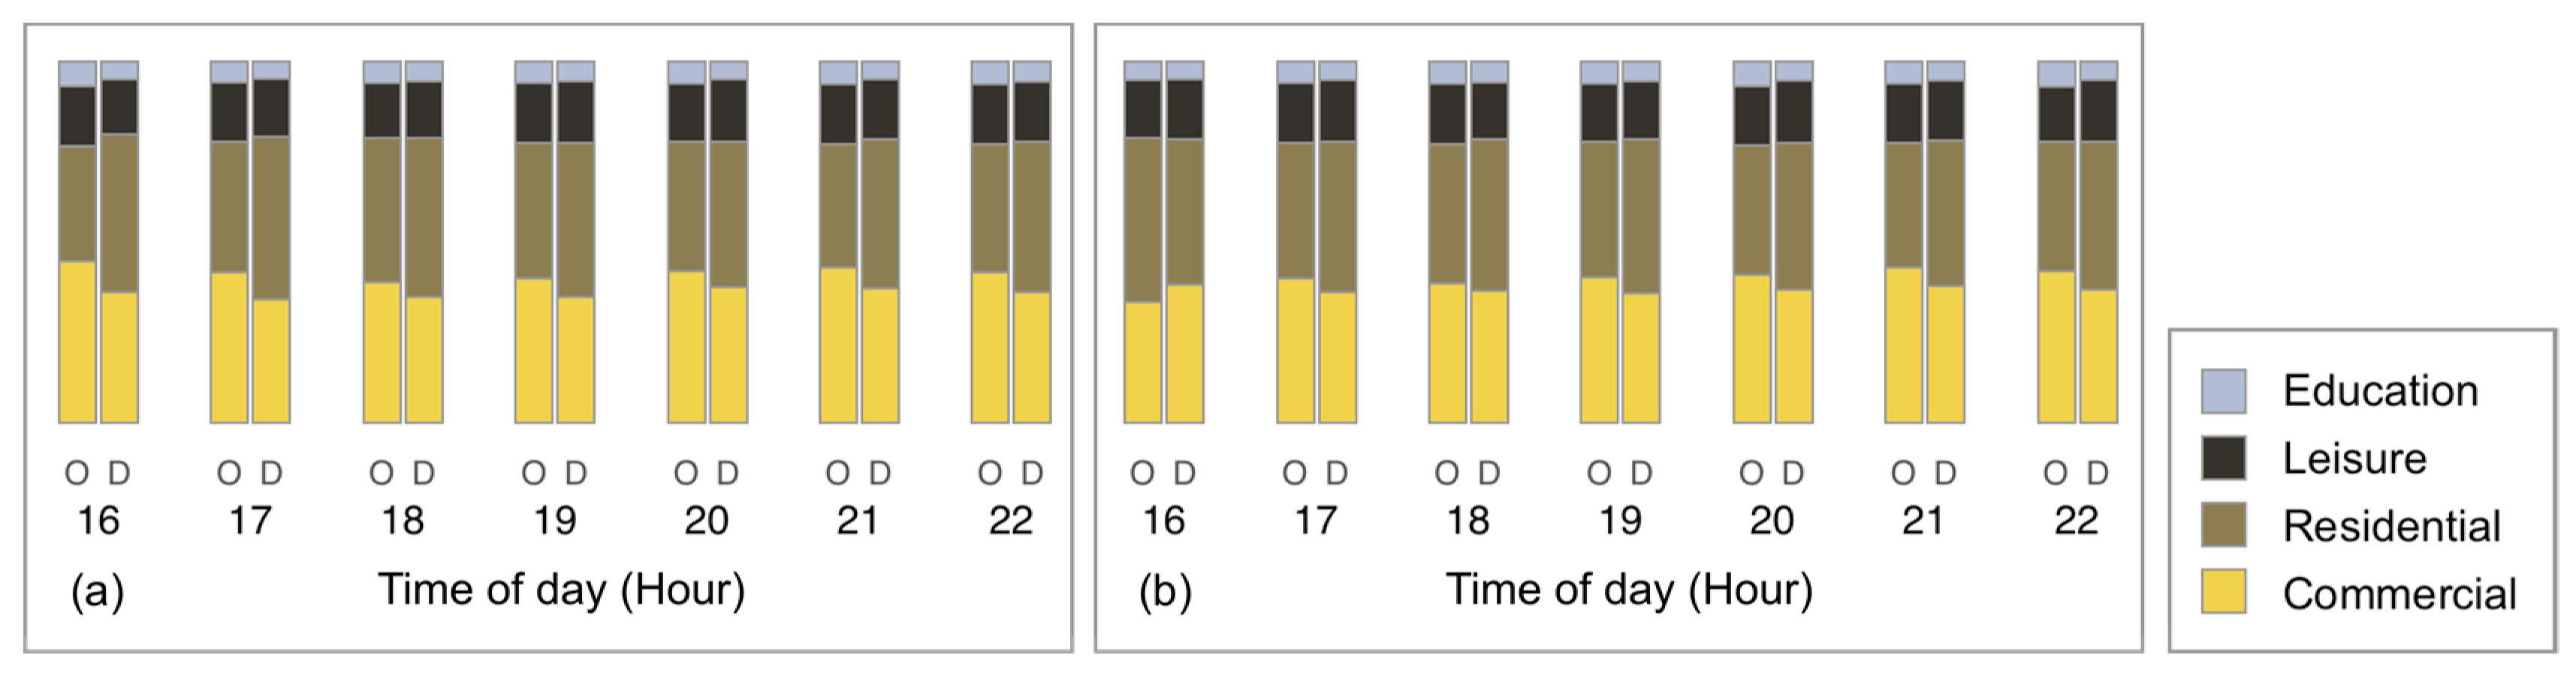
5.2.3. Traveller Division and Detailed Temporal Trip Purpose
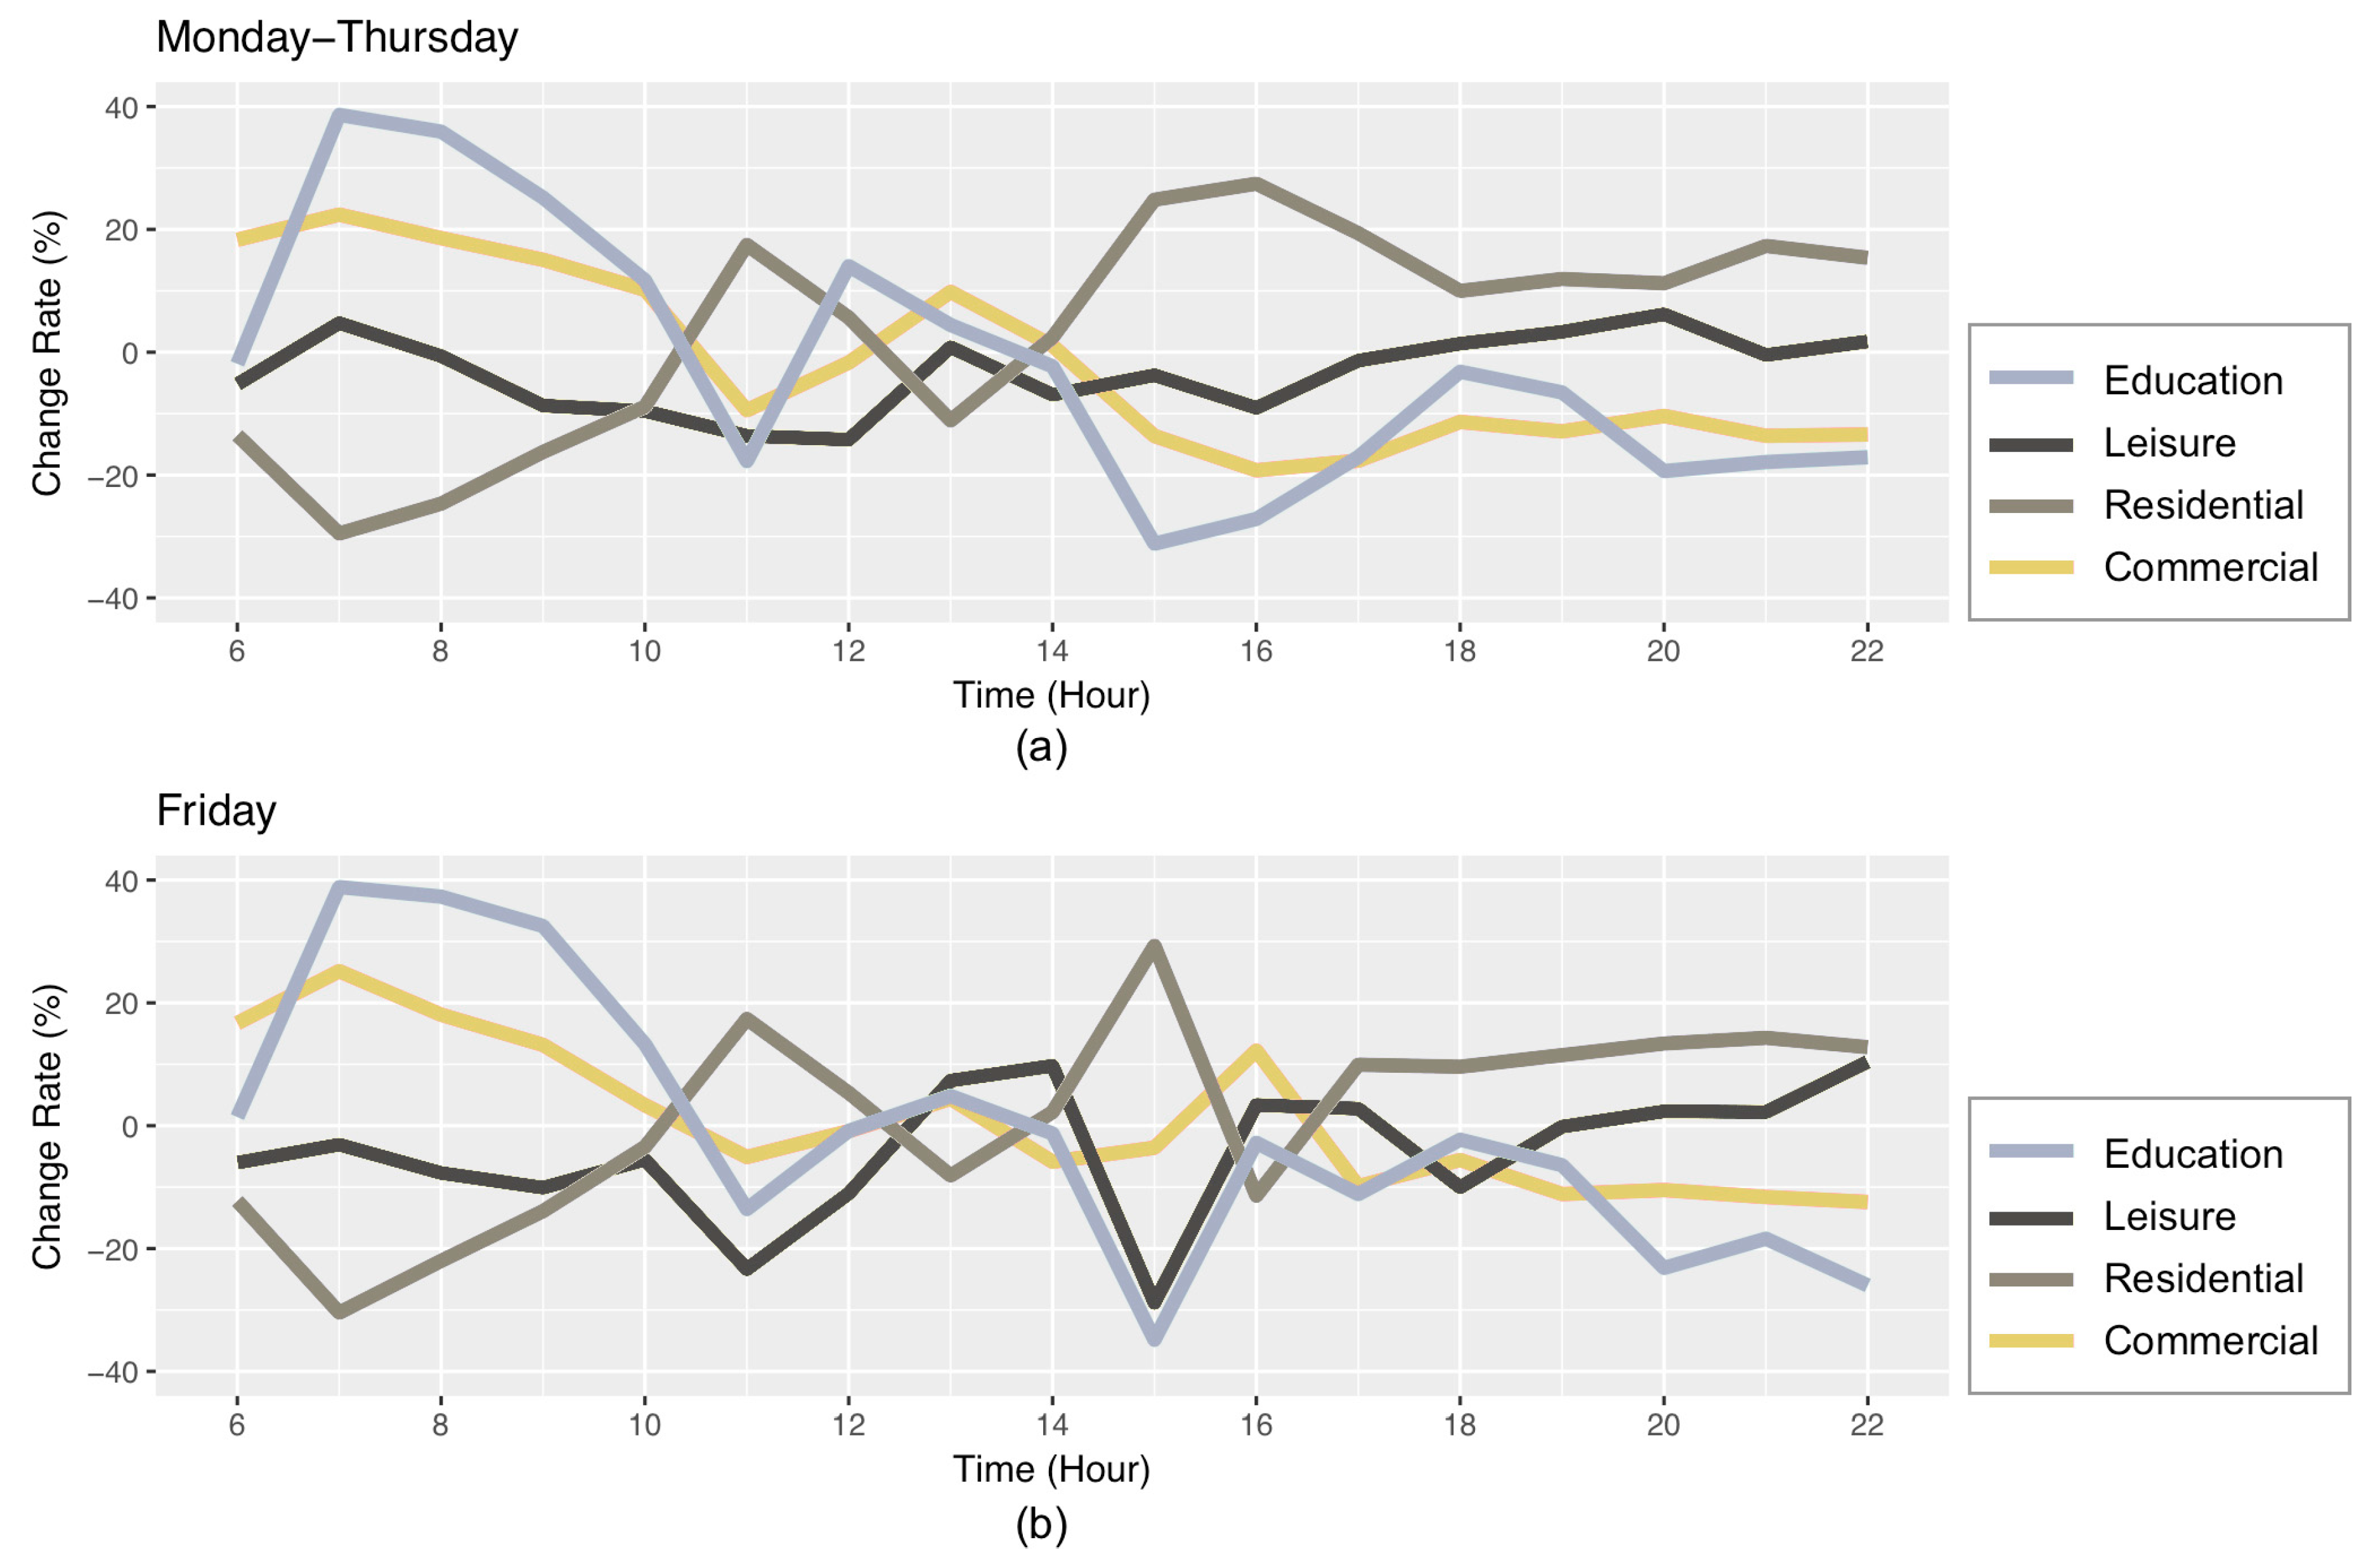
6. Discussion
7. Conclusions
Author Contributions
Funding
Acknowledgments
Conflicts of Interest
References
- Batty, M. The New Science of Cities; MIT Press: Cambridge, UK, 2013. [Google Scholar]
- Pan, G.; Qi, G.; Wu, Z.; Zhang, D.; Li, S. Land-Use Classification Using Taxi GPS Traces. IEEE Trans. Intell. Transp. Syst. 2013, 14, 113–123. [Google Scholar] [CrossRef]
- Collia, D.V.; Sharp, J.; Giesbrecht, L. The 2001 National Household Travel Survey: A look into the travel patterns of older Americans. J. Saf. Res. 2003, 34, 461–470. [Google Scholar] [CrossRef]
- Brownstone, D.; Golob, T.F. The impact of residential density on vehicle usage and energy consumption. J. Urban Econ. 2009, 65, 91–98. [Google Scholar] [CrossRef] [Green Version]
- Zhang, Z.; Mao, B.; Liu, M.; Chen, J.; Guo, J. Analysis of Travel Characteristics of Elders in Beijing. J. Transp. Syst. Eng. Inf. Technol. 2007, 7, 11–20. [Google Scholar] [CrossRef]
- Long, Y.; Liu, X.; Zhou, J.; Chai, Y. Early birds, night owls, and tireless/recurring itinerants: An exploratory analysis of extreme transit behaviors in Beijing, China. Habitat Int. 2016, 57, 223–232. [Google Scholar] [CrossRef] [Green Version]
- Pelletier, M.-P.; Trépanier, M.; Morency, C. Smart card data use in public transit: A literature review. Transp. Res. Part C Emerg. Technol. 2011, 19, 557–568. [Google Scholar] [CrossRef]
- Liu, Y.; Liu, X.; Gao, S.; Gong, L.; Kang, C.; Zhi, Y.; Chi, G.; Shi, L. Social Sensing: A New Approach to Understanding Our Socioeconomic Environments. Ann. Assoc. Am. Geogr. 2015, 105, 512–530. [Google Scholar] [CrossRef]
- Schmitt, G.; Klein, B.; König, R.; Schlaepfer, M.; Tunçer, B.; Buš, P. Big Data-Informed Urban Design, in Future Cities Laboratory: Indicia 01; Cairns, S., Devisari, T., Eds.; Lars Müller Publishers: Zürich, Switzerland, 2017; pp. 103–113. [Google Scholar]
- Bai, X.; Shi, P.; Liu, Y. Society: Realizing China’s urban dream. Nature 2014, 509, 158–160. [Google Scholar] [CrossRef] [PubMed]
- Zhong, C.; Manley, E.; Arisona, S.M.; Batty, M.; Schmitt, G. Measuring variability of mobility patterns from multiday smart-card data. J. Comput. Sci. 2015, 9, 125–130. [Google Scholar] [CrossRef]
- Ma, X.; Liu, C.; Wen, H.; Wang, Y.; Wu, Y.J. Understanding commuting patterns using transit smart card data. J. Transp. Geogr. 2017, 58, 135–145. [Google Scholar] [CrossRef]
- Kim, J.; Corcoran, J.; Papamanolis, M. Route choice stickiness of public transport passengers: Measuring habitual bus ridership behaviour using smart card data. Transp. Res. Part C Emerg. Technol. 2017, 83, 146–164. [Google Scholar] [CrossRef]
- Zhou, J.; Sipe, N.; Ma, Z.; Mateo-Babiano, D.; Darchen, S. Monitoring transit-served areas with smartcard data: A Brisbane case study. J. Transp. Geogr. 2017, 83, 1–11. [Google Scholar] [CrossRef]
- Zhao, Z.; Koutsopoulos, H.N.; Zhao, J. Individual mobility prediction using transit smart card data. Transp. Res. Part C Emerg. Technol. 2018, 89, 19–34. [Google Scholar] [CrossRef]
- Zhong, C.; Batty, M.; Manley, E.; Wang, J.; Wang, Z.; Chen, F.; Schmitt, G. Variability in Regularity: Mining Temporal Mobility Patterns in London, Singapore and Beijing Using Smart-Card Data. PLoS ONE 2016, 11, e0149222. [Google Scholar] [CrossRef] [PubMed]
- Bagchi, M.; White, P.R. The potential of public transport smart card data. Transp. Policy 2005, 12, 464–474. [Google Scholar] [CrossRef]
- Li, T.; Sun, D.; Jing, P.; Yang, K. Smart Card Data Mining of Public Transport Destination: A Literature Review. Information 2018, 9, 18–21. [Google Scholar] [CrossRef]
- Huang, X.; Tan, J. Understanding spatio-temporal mobility patterns for seniors, child/student and adult using smart card data. Int. Arch. Photogramm. Remote Sens. Spat. Inf. Sci. 2014, XL-1, 167–172. [Google Scholar] [Green Version]
- Wang, M.; Zhou, J.; Long, Y.; Chen, F. Outside the ivory tower: Visualizing university students’ top transit-trip destinations and popular corridors. Reg. Stud. Reg. Sci. 2016, 3, 202–206. [Google Scholar] [CrossRef]
- Liu, Y.; Kang, C.; Gao, S.; Xiao, Y.; Tian, Y. Understanding intra-urban trip patterns from taxi trajectory data. J. Geogr. Syst. 2012, 14, 463–483. [Google Scholar] [CrossRef]
- Wolf, J.; Guensler, R.; Bachman, W. Elimination of the Travel Diary: Experiment to Derive Trip Purpose from Global Positioning System Travel Data. Transp. Res. Rec. J. Transp. Res. Board 2001, 1768, 125–134. [Google Scholar] [CrossRef] [Green Version]
- Lee, S.G.; Hickman, M. Trip purpose inference using automated fare collection data. Public Transp. 2014, 6, 1–20. [Google Scholar] [CrossRef]
- Devillaine, F.; Munizaga, M.; Trépanier, M. Detection of Activities of Public Transport Users by Analyzing Smart Card Data. J. Transp. Res. Board 2012, 2276, 48–55. [Google Scholar] [CrossRef]
- Medina, S.A.O. Inferring weekly primary activity patterns using public transport smart card data and a household travel survey. Travel Behav. Soc. 2018, 12, 93–101. [Google Scholar] [CrossRef] [Green Version]
- Liu, L.; Hou, A.; Biderman, A.; Ratti, C.; Chen, J. Understanding individual and collective mobility patterns from smart card records: A case study in Shenzhen. In Proceedings of the 12th International IEEE Conference on Intelligent Transportation Systems (ITSC), St. Louis, MO, USA, 4–7 October 2009; pp. 1–6. [Google Scholar]
- Yue, M.; Kang, C.; Andris, C.; Qin, K.; Liu, Y.; Meng, Q. Understanding the interplay between bus, metro, and cab ridership dynamics in Shenzhen, China. Trans. GIS 2018, 22, 855–871. [Google Scholar] [CrossRef]
- Chen, C.; Gong, H.; Lawson, C.; Bialostozky, E. Evaluating the feasibility of a passive travel survey collection in a complex urban environment: Lessons learned from the New York City case study. Transp. Res. Part A Policy Pract. 2010, 44, 830–840. [Google Scholar] [CrossRef]
- Chung, E.-H.; Shalaby, A. A trip reconstruction tool for GPS-based personal travel surveys. Transp. Plan. Technol. 2005, 28, 381–401. [Google Scholar] [CrossRef]
- Bohte, W.; Maat, K. Deriving and validating trip purposes and travel modes for multi-day GPS-based travel surveys: A large-scale application in the Netherlands. Transp. Res. Part C Emerg. Technol. 2009, 17, 285–297. [Google Scholar] [CrossRef]
- Fisher, P.; Comber, A.J.; Wadsworth, R.A.R. Land use and land cover: Contradiction or complement. In Re-Presenting GIS; Fisher, P., Unwin, D., Eds.; Wiley: Chichester, UK, 2005; pp. 85–98. [Google Scholar]
- Rashidi, T.H.; Abbasi, A.; Maghrebi, M.; Hasan, S.; Waller, T.S. Exploring the capacity of social media data for modelling travel behaviour: Opportunities and challenges. Transp. Res. Part C Emerg. Technol. 2017, 75, 197–211. [Google Scholar] [CrossRef]
- Liu, Y.; Wang, F.; Xiao, Y.; Gao, S. Urban land uses and traffic ‘source-sink areas’: Evidence from GPS-enabled taxi data in Shanghai. Landsc. Urban Plan. 2012, 106, 73–87. [Google Scholar] [CrossRef]
- Zhao, J.; Qu, Q.; Zhang, F.; Xu, C.; Liu, S. Spatio-Temporal Analysis of Passenger Travel Patterns in Massive Smart Card Data. IEEE Trans. Intell. Transp. Syst. 2017, 18, 3135–3146. [Google Scholar] [CrossRef]
- Tibshirani, R.; Walther, G.; Hastie, T. Estimating the number of clusters in a data set via the gap statistic. J. R. Stat. Soc. B 2001, 63, 411–423. [Google Scholar] [CrossRef]
- Birkin, M. Spatial data analytics of mobility with consumer data. J. Transp. Geogr. 2019, 76, 245–253. [Google Scholar] [CrossRef]


| Reclassified Categories | Examples |
|---|---|
| Commercial | Retail, restaurant, life service (e.g., car washing, barber), etc. |
| Leisure | Sports, entertainment (e.g., karaoke), scenery spot, etc. |
| Residential | Residential community, residential building, etc. |
| Working | Office and industrial places. |
| Education | School, library, research institution, etc. |
| Other | Landmark, communal facilities (e.g., public lavatory), etc. |
© 2019 by the authors. Licensee MDPI, Basel, Switzerland. This article is an open access article distributed under the terms and conditions of the Creative Commons Attribution (CC BY) license (http://creativecommons.org/licenses/by/4.0/).
Share and Cite
Yang, Y.; Heppenstall, A.; Turner, A.; Comber, A. Who, Where, Why and When? Using Smart Card and Social Media Data to Understand Urban Mobility. ISPRS Int. J. Geo-Inf. 2019, 8, 271. https://doi.org/10.3390/ijgi8060271
Yang Y, Heppenstall A, Turner A, Comber A. Who, Where, Why and When? Using Smart Card and Social Media Data to Understand Urban Mobility. ISPRS International Journal of Geo-Information. 2019; 8(6):271. https://doi.org/10.3390/ijgi8060271
Chicago/Turabian StyleYang, Yuanxuan, Alison Heppenstall, Andy Turner, and Alexis Comber. 2019. "Who, Where, Why and When? Using Smart Card and Social Media Data to Understand Urban Mobility" ISPRS International Journal of Geo-Information 8, no. 6: 271. https://doi.org/10.3390/ijgi8060271
APA StyleYang, Y., Heppenstall, A., Turner, A., & Comber, A. (2019). Who, Where, Why and When? Using Smart Card and Social Media Data to Understand Urban Mobility. ISPRS International Journal of Geo-Information, 8(6), 271. https://doi.org/10.3390/ijgi8060271