Article

Automated Multi-Sensor 3D Reconstruction for the Web

1
Department of Built Environment, School of Engineering, Aalto University, FI-00076 Aalto, Finland
2
Finnish Geospatial Research Institute FGI, Geodeetinrinne 2, FI-02430 Masala, Finland
*
Author to whom correspondence should be addressed.
ISPRS Int. J. Geo-Inf. 2019, 8(5), 221; https://doi.org/10.3390/ijgi8050221
Submission received: 21 March 2019 / Revised: 12 April 2019 / Accepted: 4 May 2019 / Published: 8 May 2019

Abstract

:
The Internet has become a major dissemination and sharing platform for 3D content. The utilization of 3D measurement methods can drastically increase the production efficiency of 3D content in an increasing number of use cases where 3D documentation of real-life objects or environments is required. We demonstrated a developed, highly automated and integrated content creation process of providing reality-based photorealistic 3D models for the web. Close-range photogrammetry, terrestrial laser scanning (TLS) and their combination are compared using available state-of-the-art tools in a real-life project setting with real-life limitations. Integrating photogrammetry and TLS is a good compromise for both geometric and texture quality. Compared to approaches using only photogrammetry or TLS, it is slower and more resource-heavy but combines complementary advantages of each method, such as direct scale determination from TLS or superior image quality typically used in photogrammetry. The integration is not only beneficial, but clearly productionally possible using available state-of-the-art tools that have become increasingly available also for non-expert users. Despite the high degree of automation, some manual editing steps are still required in practice to achieve satisfactory results in terms of adequate visual quality. This is mainly due to the current limitations of WebGL technology.

1. Introduction

The Internet has become a major dissemination and sharing platform for 3D model content and 3D graphics have become an increasingly important part of the web experience. This is mainly due to the rise of browser-based rendering technology for real-time 3D graphics that has been under development since the mid-nineties. Most notably, the adaptation of WebGL [1] has enabled plug-in free access to increasingly powerful graphics hardware across multiple desktop and mobile computing platforms—without forgetting the development of various commercial and non-commercial approaches to publishing and managing 3D content on the web [2,3,4].
WebGL is a JavaScript application programming interface (API) that enables interactive 3D graphics with advanced rendering techniques like physically based rendering within a browser. It is based on OpenGL ES (Embedded Systems) [5] and natively supported by most modern desktop and mobile web browsers. There are high-level JavaScript libraries such as Three.js [6] and Babylon.js [7] that are designed to make WebGL more accessible and to help in application development. In practice, the 3D model formats supported in WebGL are dependent on these high-level libraries. While no standard format exists for web-based 3D content creation, several authors have utilized the glTF (GL Transmission Format) format [8,9,10]. Several pipelines have been suggested for creating and optimizing 3D content for the web [11,12]. Key advantages of web-based 3D compared to desktop applications are cross platform availability and straightforward deployment without separate installing. These advantages and the increasing user readiness have accelerated web-based 3D application development in many fields, e.g., data visualization, digital content creation, gaming, education, e-commerce, geoinformation and cultural heritage [2].
In recent years, many web-based and plug-in free 3D model publishing platforms have been created and have become increasingly popular, hosting millions of models for billions of potential users. For example, Sketchfab (Sketchfab SAS, Paris, France) [13], Google Poly (Google LLC, Mountain View, CA, USA) [14] or Facebook 3D Posts (Facebook Inc., Menlo Park, CA, USA) [15] have helped in popularizing the creation and publishing of 3D models for non-expert users. Perhaps the most notable example is Sketchfab, a powerful platform for sharing and managing 3D content with modern features such as support for virtual reality (VR)/augmented reality (AR) viewing, interactive animations and annotations, physically based rendering (PBR), a 3D model marketplace and a selection of exporters and APIs [16]. Sketchfab offers several pricing plans from free to enterprise level. Some have considered Sketchfab as the de-facto standard for publishing 3D content on the web [4]. Google Poly is a free web service for sharing and discovering 3D objects and scenes. It was built to help in AR and VR development and offers several APIs e.g., for application development in game engines. Facebook 3D Posts is a free feature that allows users to share and display 3D models in Facebook posts. All these platforms are based on WebGL and have an emphasis on high visual quality rather than accurate geometric representation.
The challenge in utilizing these web-based 3D publishing platforms is that they are subject to several technical constraints, including the memory limits of web browsers, the varying GPU performance of the device used and the need to maintain limited file sizes to retain tolerable download times. In addition, 3D assets must be converted to a supported format beforehand. The detailed requirements vary from platform to platform. For example, Sketchfab supports over 50 3D file formats including common formats like OBJ, FBX, GLTF/GLB [17]. They recommend models to contain up to 500,000 polygons and a maximum of 10 texture images [18]. Facebook requires models in GLB-format with a maximum file size of 3 MB [19]. Google Poly accepts OBJ and GLTF/GLB-files up to 100 MB in size and textures at a maximum of 8196x8196 [20]. This implies that the platforms cannot be utilized to view any 3D models available, but the platform specific requirements have to be acknowledged in the content creation phase.
Traditionally 3D content has been produced by 3D artists, designers or other professionals more or less manually by relying on diverse workflows and various 3D modeling solutions: e.g., 3ds Max (Autodesk Inc., Mill Valley, CA, USA) [21], Maya (Autodesk Inc., Mill Valley, CA, USA) [22], Blender (Blender Foundation, Amsterdam, Netherlands) [23], ZBrush (Pixologic Inc., Los Angeles, CA, USA) [24] or CAD software: e.g., AutoCAD (Autodesk Inc., Mill Valley, CA, USA) [25], Microstation (Bentley Systems Inc., Exton, PA, USA) [26], Rhinoceros (Robert McNeel & Associates, Seattle, WA, USA) [27] and SketchUp (Trimble Inc., Sunnyvale, CA, USA) [28]. Often the creation of web-compatible 3D content has been considered inefficient and costly and is seen as a barrier to entry for both the developers and end users [2].
The utilization of 3D measurement methods, primarily laser scanning and photogrammetry, have the potential to drastically increase the efficiency of 3D content production in use cases where 3D documentation of real-life objects or environments is required. This reality-based 3D data is used in numerous applications in many fields such as cultural heritage [29], 3D city modeling [30], construction [31,32], gaming [33] and cultural production [34].
The potential of reality-based 3D data collection technology has also been increasingly noted and promoted in the 3D graphics and gaming communities as a way to automate content creation processes (e.g., [35,36]). Furthermore, the global trend towards virtual and augmented realities (VR and AR) has increased the demand for creating high quality and detailed photorealistic 3D content based on real-life objects and environments. In addition to the detailed 3D geometry, the quality of the texture data also plays a crucial role in these photorealistic experiences of often unprecedentedly high levels of detail. Despite development efforts, the lack of compelling content is considered one of the key challenges in the adoption of VR and AR technologies [37].
Both laser scanning and photogrammetry have become increasingly available and have advanced significantly over the last few decades thanks to the development leaps made towards more powerful computing and automating various aspects of 3D reconstruction. Laser scanners produce increasingly detailed and accurate 3D point clouds of their surroundings by using laser-based range finding [38]. Compared to camera-based methods, laser scanning is an active sensing technique that is less dependent on the lighting conditions of the scene. However, laser scanning lacks color information which is required by many applications that rely on photorealism. This is usually solved by utilizing integrated digital cameras to colorize the point cloud data. Photogrammetry is a technique based on deriving 3D measurements from 2D image data. Additionally, the model geometry and the color information used in model texturing can be derived from the same set of images. Photogrammetry has benefited greatly from the advances made towards approaches such as structure-from-motion (e.g., [39]), dense image matching (e.g., [40]) and meshing (e.g., [41]) in the 21st century. In its current state it is an increasingly affordable and highly portable measuring technique capable of recording extremely dense colored 3D point cloud and textured 3D model data sets.
This development has spawned many open source and commercial software solutions for creating reality-based 3D mesh models automatically or semi-automatically from photogrammetric imagery: e.g., 3DF Zephyr (3Dflow srl., Udine, Italy) [42], RealityCapture (Capturing Reality s.r.o., Bratislava, Slovakia) [43], Metashape (Agisoft LCC, St. Petersburg, Russia) [44], Meshroom [45], COLMAP [46], Pix4D (Pix4D S.A., Lausanne, Switzerland) [47] or from arbitrary point cloud data: e.g., SEQUOIA (Amazon Web Services Inc., Seattle, WA, USA) [48], CloudCompare [49] for further use in 3D modeling software suites, 3D game engines or web-based 3D model publishing platforms etc. The emergence of these solutions has also made the creation of reality-based 3D content increasingly available for non-expert users [50].
A number of papers have been published on the integration of laser scanning and photogrammetry on many levels [51,52]. Generally, this integration is considered the ideal approach since no single technique can deliver adequate results in all measuring conditions [29,53,54,55]. Differences and complementary benefits between photogrammetry and laser scanning have been discussed by [52,55,56,57,58]. Evaluation of modeling results has been typically focused on analyzing the geometric quality of the resulting hybrid model. Assessing texture quality has gained surprisingly little attention (e.g., [58]). Furthermore, the actual hybrid model has been rarely compared to the modeling approaches that rely on single methods.
Over the years, integration of laser scanning and photogrammetry has been developed for diverse use cases. For example, for reconstructing the details of building façades [59,60], improving the extraction of building outlines [61] or improving accuracy [62], registration [55] and visual quality [63] of 3D data. Many approaches require user interaction that is time consuming and labor intensive or suitable for specific use cases and data, e.g., simple buildings with planar façades [64].
In many cases related to 3D modeling, the integration of these two techniques is merely seen as colorizing the point cloud data [65], dealing with texturing laser derived 3D models [58,66] or merging separately generated point cloud, image or model data [54,67,68,69,70,71] at the end of the modeling pipeline where the weaknesses of each data source becomes more difficult to overcome [51,72].
Despite being an avid research topic, very few data integration solutions exist outside of the academic world that would be applicable and available for people to use in their real-life projects. Some approaches that rely on widely available solutions have been described by [69,70,71]. In many of these cases, the integration of laser scanning and photogrammetry has been achieved by simply merging separately generated point cloud data sets, often with the purpose of acquiring 3D data from multiple perspectives to ensure sufficient coverage [70,71]. When looking at freely or commercially available solutions (see 
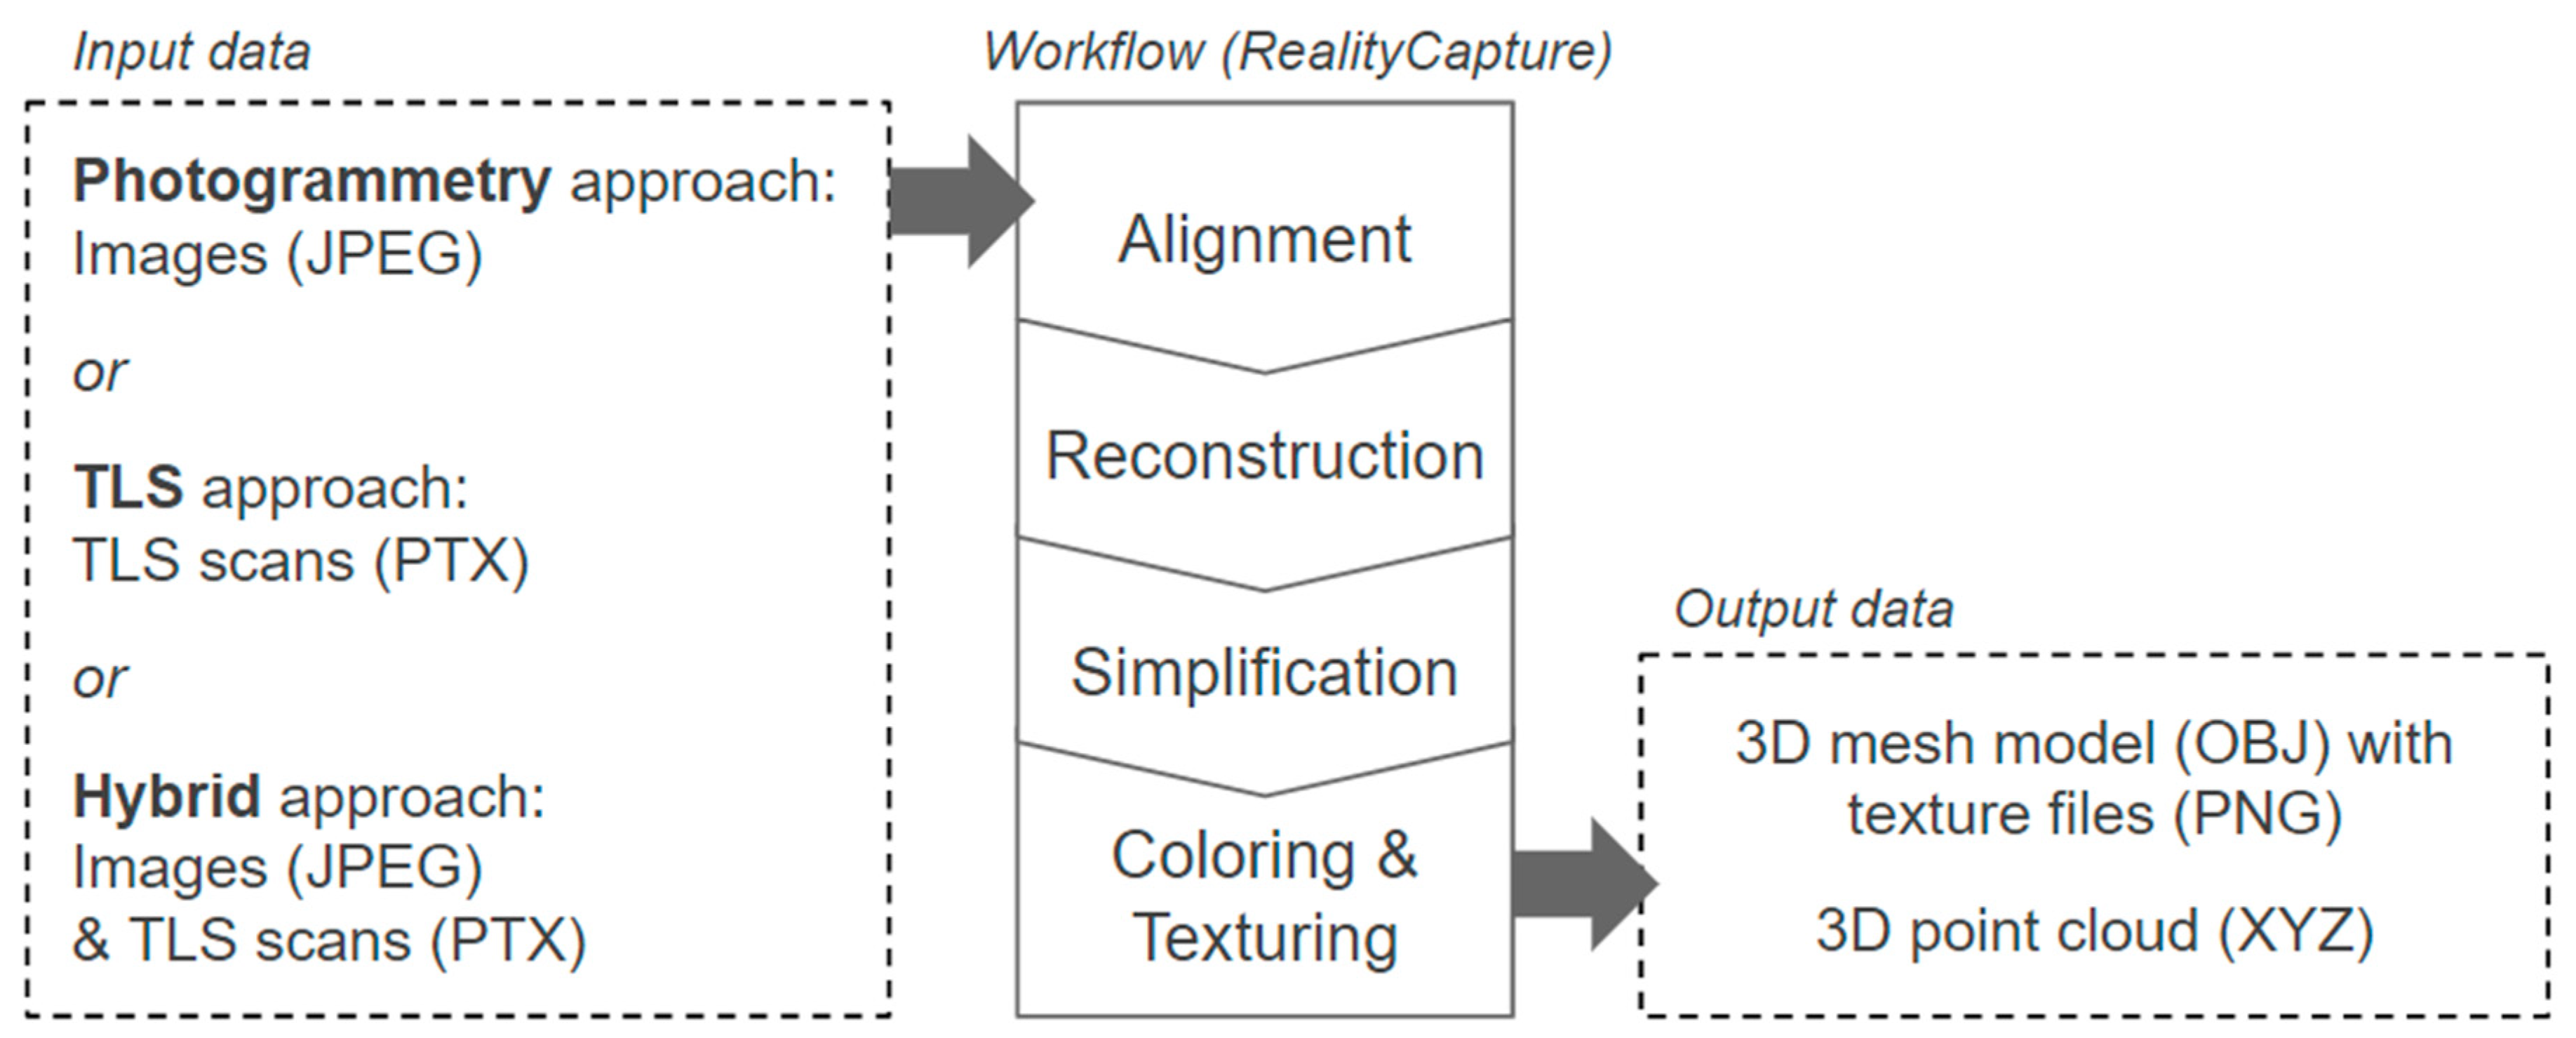
Table 1), RealityCapture is the most suitable to integrate laser scanning and photogrammetry in a highly automated 3D reconstruction and texturing process. Laser-scanned point clouds can also be imported into 3DF Zephyr. However, in 3DF Zephyr, laser scans have to be interactively registered as part of a separate process after the creation of a photogrammetric dense point cloud. An example of this type of approach is presented in [70]. RealityCapture allows the import of the laser-scanned point clouds to be done in earlier phases of the 3D reconstruction pipeline and thus benefits the process with the inherited dimensional accuracy of laser scanning.
Web-based 3D technologies have been applied for visualization and application development in various cases where the data originates from various 3D measurement methods (e.g., [73]). Related to web applications, 3D measurement methods have also been utilized for producing 3D data for environmental models [74], 3D city models [75,76], whole body laser scans [77] or indoor models [34]. The evaluation of the geometric quality of various 3D measurement methods is a mainstay in the research literature (e.g., [78]). In some cases, this evaluation has been done in projects aiming for web-based 3D (e.g., [34]). Related to web applications and reality-based models, the need for 3D model optimizations and automation has been stressed by [79] but the workflow for the automatic optimization is rarely presented in this context. Nevertheless, very little literature exists demonstrating the integration of laser scanning and photogrammetry in a complete workflow aiming to achieve photorealistic and web-compatible 3D models. Furthermore, assessing both the quality of the model geometry and texturing within the different data collection methods has not been done in previous studies, especially in the context of web-compatibility and automation.
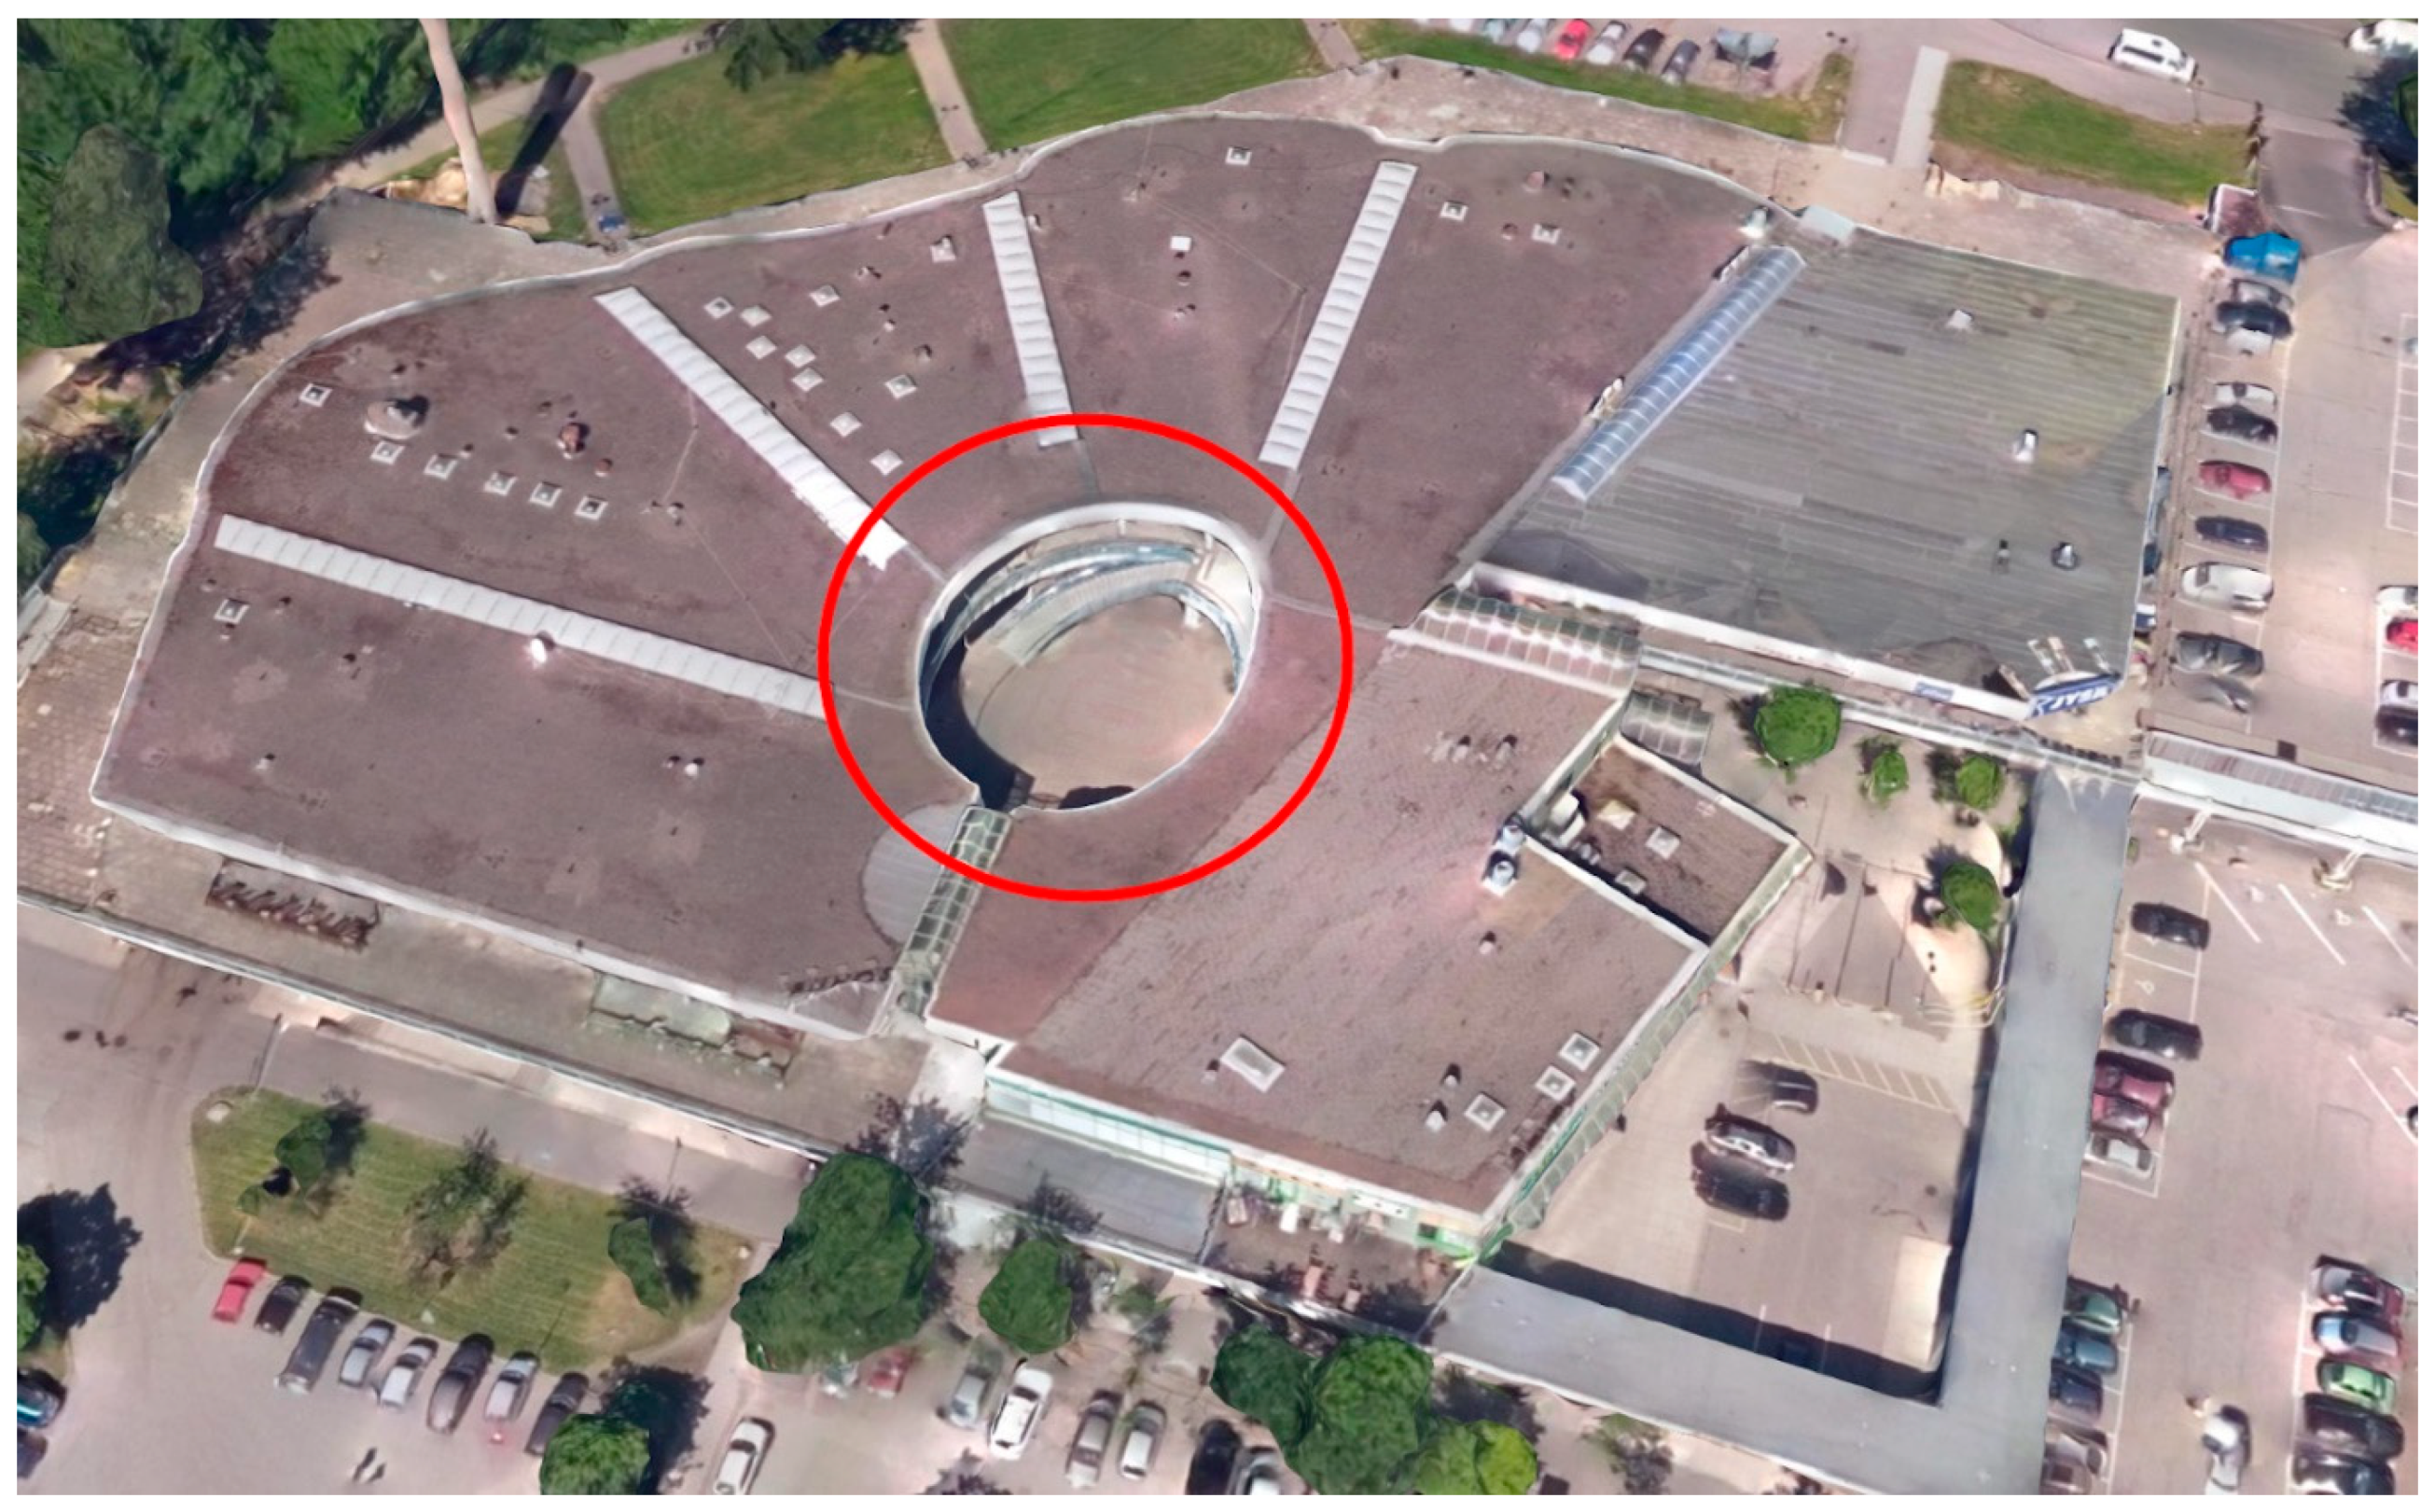
Our aim is to demonstrate a highly automated and integrated content creation process of providing reality-based photorealistic 3D models for the web. 3D reconstruction results based on close-range photogrammetry, terrestrial laser scanning (TLS) and their combination are compared considering both the quality of the model geometry and texturing. In addition, the visual quality of the compared modeling approaches is evaluated through an expert survey. Our approach is a novel combination of web-applicability, multi-sensor integration, high-level automation and photorealism, using state-of-the-art tools. The approach is applied in a real-life project called “Puhos 3D”, an interdisciplinary joint project between Aalto University and the Finnish national public service broadcasting company Yle, with the main goal of exploring the use of reality-based 3D models in journalistic web-based story telling [80].

2. Materials and Methods

2.1. Case: The Puhos Shopping Mall

An old shopping mall named Puhos in the Itäkeskus district in eastern Helsinki was used as a test site for this research (see Figure 1). The data was collected in July 2017 in a field campaign as part of an interdisciplinary project between Aalto University and the Finnish broadcasting company Yle. The aim of the project was to study the usage of a reality-based 3D environment in a journalistic web story: “Puhos: Take a look around a corner of multicultural Finland under threat” [80]. Photorealism and web-compatibility were the two key requirements set by the project.
The selected test site in the Puhos shopping mall consisted of a partially open two-storied space around an oval-shaped courtyard. From the perspective of taking 3D measurements, the site is a combination of indoor and outdoor space, with difficult lighting conditions and includes challenging materials (e.g., prominent glass and metal surfaces) and complex geometries (curved structures, railings, staircases, escalators etc.). Furthermore, as the measurement data was acquired in a real-life case on a fixed schedule, there were partly sunny weather conditions and a consistently large number of people that were beyond our control.

2.2. Data Acquisition Campaign

The data sets were collected using close-range photogrammetry and terrestrial laser scanning methods. Both techniques were used simultaneously in a real-life setting within a time window of approximately three hours and involved a group of three operators. Simultaneous data acquisition helped to mitigate the effects of the changing weather and lighting conditions at the scene.
Terrestrial laser scanning data was collected with two scanners, a Faro Focus S120 and Trimble TX5 with the specifications and parameters listed in Table 2. Both scanners basically shared identical specifications. The choice of two scanners enabled us to complete the data collection in half the time and helped to mitigate the effects of changing conditions at the scene. The scan parameters were kept identical throughout the scanning procedures with one exception: one scan station in the middle of the test site was scanned at a higher resolution setting specially to improve the quality of registration.
The photogrammetric close-range imagery was collected with a Nikon D800E digital single-lens reflex (DSLR) camera using a Nikkor AF-S 14–24 mm lens with following parameters (Table 3):
Since the project focused on photorealistic web visualization, no separate ground reference was required for georeferencing or quality control purposes, for example. Additionally, the main focus during the data acquisition was on ensuring as good a data overlap as possible and thus minimizing any gaps in the data rather than focusing on coordinate accuracy.

2.3. Data Pre-Processing

Raw, laser scanned, point cloud data was pre-processed in SCENE (version 6.0.2.23), a scan data processing and registration computer program (FARO Technologies Inc., Lake Mary, FL, USA) [81]. The process involved checking the laser data for errors and then registering all the scanning stations in the same unified coordinate system using both automatic and manual registration tools in SCENE. The registration was done using top view and cloud-to-cloud tools in the software. After the registration, the point cloud had a mean point error of 3.7 mm and a maximum point error of 16.5 mm. The point cloud data was colorized using the image data collected by the scanners. For further processing, the pre-processed TLS point clouds were exported without any subsampling as ordered files in the PTX point cloud format with data records including position, intensity and RGB color information for single scan points derived from the scanner images.
The resulting registered point cloud was also used as a reference data set for evaluating the geometric quality of the final web-compatible 3D models. In addition to registration, the reference point cloud (Figure 2) was checked for errors and outliers and points outside the project area were filtered. All the observations caused by moving objects, such as people, in the scene were cleaned manually using both SCENE and CloudCompare (version 2.10-alpha), an open source 3D point cloud and mesh processing program [49].
The collected close-range photographs we processed using Photoshop Lightroom (version 6.12) (Adobe Inc., San Jose, CA, USA) [82]. The image tonal scales were adjusted to recover details suffering from overexposure or underexposure in the images. Additionally, all blurred or otherwise failed photographs were excluded from the image set. Finally, the images were converted from Nikon’s raw image format (NEF) into JPEG files for further processing.

2.4. Multi-Source Photorealistic 3D Modeling for the Web

3D modeling from photogrammetric imagery, laser scans and their combination was done in RealityCapture (version 1.0.3.5735 RC) [43]. This is a versatile photogrammetry computer program that allows automatic registration, filtration, coloring, texturing and meshing of laser scanned point cloud data. RealityCapture applies the work published by [41]. For processing the laser data the supported ordered PTX scans were converted into a proprietary format with a .lsp file extension. Each spherical laser scan was converted and divided into six .lsp files. During the data import, the registration settings were set as “exact” in RealityCapture because the scans had already been registered using SCENE.
Throughout the 3D modeling process, the settings and parameters were kept the same for the three compared approaches. Image data was automatically self-calibrated by the software without any manual control points or special a priori calibration procedures. All three of the compared 3D models were reconstructed and textured using the following workflow (Figure 3):
Whenever possible during the process, all manual editing steps were omitted in order to test as straightforward a workflow as possible. All the resulting models were checked for defects such as non-manifold vertices and edges, holes or isolated vertices using the automated model topology checking tool in RealityCapture. The target specifications for the final exported 3D models were set according to the viewer performance guidelines of the selected web publishing platform, Sketchfab [18]. Thus, the originally much denser 3D models were simplified into 500,000 polygons and a maximum of ten 4096 × 4096 (4k) sized texture files were generated per model.
The resulting web-compatible 3D models (photogrammetry, TLS and hybrid) were finally exported from RealityCapture as 3D mesh files in the widely supported Wavefront OBJ format including the 4k texture files in PNG format. Furthermore, to support the geometric analyses done in CloudCompare, the models were exported as ASCII point clouds (.xyz) that consisted of an XYZ coordinate and RGB color information per vertex in the 3D mesh model.

2.5. Geometric and Texture Quality Evaluation

The resulting three compared 3D models (photogrammetry, TLS and hybrid) were analyzed from both geometric and texturing perspectives. Additionally, the numeric data analyses were supported with visual comparisons and an expert quality evaluation on both the geometric and texture quality of the three web-compatible 3D models.
In order to ensure a sufficiently large common feature apparent in each data set and to omit differences caused by varying surface materials and complex details, the geometric analysis was focused on analyzing deviations in the ground floor surfaces in respect to the TLS-based reference. The geometric analysis was done using CloudCompare and all three comparable data sets were prepared as follows:
  • An initial alignment to the TLS-based reference was carried out using a point pairs picking tool (based on [83]) and iterative closest point (ICP) algorithm (based on [84]).
  • An initial ground floor area segmentation was done.
  • A final alignment to the TLS-based reference was performed using point pairs picking and ICP tools.
  • The final segmentation for all models was done to achieve one-to-one correspondence between the compared models to mitigate the effects of data completeness and to remove the need for using any cut-off distances in the analysis.
Floor surface deviations were analyzed by comparing the segmented ground floor surfaces of all three models to the reference data using a multiscale model-to-model cloud comparison (M3C2) method [85] implemented in CloudCompare. M3C2 is a robust method suited for comparing point cloud data with variable roughness levels. Local 3D distances can be computed without any gridding or meshing. Essentially this cloud-to-cloud comparison method outputs a result as a 3D distance between two-point clouds that, in our case, represented the vertices in the 3D mesh of the comparable models. The M3C2 is more robust towards noise and changes in point density compared to more common cloud-to-cloud (C2C) methods. Additionally, the comparison results were adjusted according to the pre-existing registration error in the data.
The texture quality analysis was focused on comparing the histograms of the resulting texture atlases. For all three comparable models, a histogram per model was calculated using all the texture atlases with ImageJ2 [86]. The mean, standard deviation and mode values per histogram were included in the analysis. Furthermore, the number and percentage of both white and black pixels (8-bit) were calculated from the histogram values.

2.6. Expert Evaluation on Visual Quality

An expert evaluation focusing on the perceived visual quality of the models was organized in the form of an online survey. A total of 33 experts from the fields of 3D measuring and modeling, geoinformatics, computer graphics and computer gaming participated in the survey. The respondents were contacted via professional networks, e-mail and direct contact.
The respondents were asked to open the three models uploaded into Sketchfab (provided as links) and choose which of the models they liked best in terms of photorealism and visual appeal and which model had the best geometric or texturing quality. The respondents were not given any pre-existing knowledge about any of the models or their production processes. The questions were multiple-choice, followed by open questions in which the respondents were asked to provide the reasoning for their choice. The detailed questions are provided in Appendix A.

3. Results

The three compared web-compatible models (photogrammetry, TLS and hybrid) were processed with RealityCapture using as automated a workflow as possible. A summary of the compared models during the data processing is presented in Table 4. All the models were processed to the final web-compatible specifications.
The resulting web-compatible reality-based 3D models are presented in Figure 4.
A visual comparison of the level of detail of the resulting models is presented in Figure 5 and visually detectable quality issues between the created models are demonstrated in Figure 6.

3.1. Computing Times

The computing times needed for model production were collected for each model, based on values that RealityCapture natively records and outputs as a report variable. Pre-processing and, therefore, the alignment phases were omitted from the analysis since they were affected by manual work and were, thus, difficult to reliably measure and analyze. The processing of all three models was done with the same PC workstation (AMD Ryzen 7 2700X eight core processor, 32 GB RAM, Nvidia GeForce 1070 GTX GPU) using the Windows 10 operating system (×64 version 1803) and RealityCapture (1.0.3.5735 RC). The computing times for each model in the meshing and texture generation steps of the data processing workflow are presented in the Table 5 below.

3.2. Geometric Quality

The results of the ground floor surface analysis between the three web-compatible 3D models and the reference are presented in Figure 7. A quantitative summary of the analysis is presented in Table 6, including the mean and standard deviation of the calculated M3C2 distance values for each model.
The histograms of the M3C2 distance values of all three models vs. the TLS-based reference are presented in the Figure 8. Both Table 6 and the histograms in Figure 8 show that the distance values of the TLS-based model have the smallest standard deviation and the distance values of the photogrammetry-based model have the highest standard deviation.

3.3. Texture Quality

An overview of the histogram analysis including all the resulting texture atlases for all three models is presented in Figure 9.
A quantitative summary of the histogram analysis is presented in Table 7. The results of the histogram analysis (Figure 9 and Table 7) show that the TLS model suffers clearly from both overexposure and underexposure. This is clearly visible as the prominent spiking on the ends of the histogram (Figure 9) and as the distinctly higher number of white and black pixels in the texture images (Table 7). The histograms were calculated from a total of ten (4096 × 4096) texture atlases with a total of 167,772,160 pixel values per model. The numbers and percentages of black and white pixels indicate the level of underexposure and overexposure in the texture data.

3.4. Expert Evaluation on Visual Quality

According to the experts who participated in the survey, the hybrid approach appeared clearly superior in all aspects: overall visual appearance (91%), geometry (82%) and texturing (79%). Whereas the photogrammetry-based model had the worst performance in geometric quality (0%), the TLS-based model performed the worst in texturing quality (6%). A summary of the evaluation results is presented in Figure 10 below:
In total, 30 respondents (out of 33) chose the hybrid model as the most photorealistic and visually appealing, mentioning good texturing, good lighting or exposure, good geometry, high level of detail or simply a more realistic and clear appearance.
When asked to evaluate the geometric quality, the hybrid model appeared the best to most of the respondents. However, some choosing the TLS-based model found the hybrid model only slightly worse and almost as good as the TLS-based model. Similarly, some of the respondents choosing the hybrid model described the overall appearance of the TLS-based model to be almost as good, even though the TLS-based model was described as weaker, e.g., in the completeness of the details. The results clearly did not favor the photogrammetry-based model and the respondents described it as significantly weaker and less homogenous in terms of geometric quality. The respondents noted that the photogrammetry-based model had more holes and problems with the model details. e.g., with railings, a-frame signs and ceilings.
The majority of the respondents chose the hybrid model as the best in terms of texturing quality. Many considered it generally the clearest and of better quality in terms of the details. However, there was some dispersion in the responses considering the texturing quality. Some of the respondents stated that the distinction between the hybrid model and photogrammetry-based model was not straightforward. The TLS-based model was the least favored, stated repeatedly as being “blurry” with overexposed textures.

4. Discussion

We compared three 3D reconstruction approaches: close-range photogrammetry, terrestrial laser scanning and their combination using available state-of-the-art tools in a real-life project setting. We presented an approach that is a novel combination of web-applicability, multi-sensor integration, high-level automation and photorealism. Furthermore, we assessed the visual quality of web-based 3D content with an expert evaluation.
Despite the recent developments, web-compatibility remains a key challenge in the creation of reality-based 3D models. All the compared approaches produced vast amounts of data and the models had to be heavily decimated in order to meet the limitations of browser-based WebGL applications. For example, the polygon count of the hybrid model had to be decimated to 0.07% of its full size of almost 694 million polygons to achieve the target of 500,000 polygons. This means that some details are inevitably lost in the process. Even though web-compatible models can be created almost fully automatically, the results are still far from optimal.
The emphasis on photorealism and visual aesthetics places high demands on the visual quality of the models. Both the geometry and the textures need to be as free from errors and visible artifacts as possible. The desired high level of visual quality would practically result in some level of manual editing and optimization for either the model geometry (e.g., cleaning and fixing errors, UV-mapping, retopologizing), the textures (e.g., de-lighting, cleaning and fixing errors) or both. Basically, the higher the visual quality requirements are, the more difficult the work becomes to automate it. This is especially so, if a high degree of photorealism and detail has to be attained on a browser-based platform with limited resources.
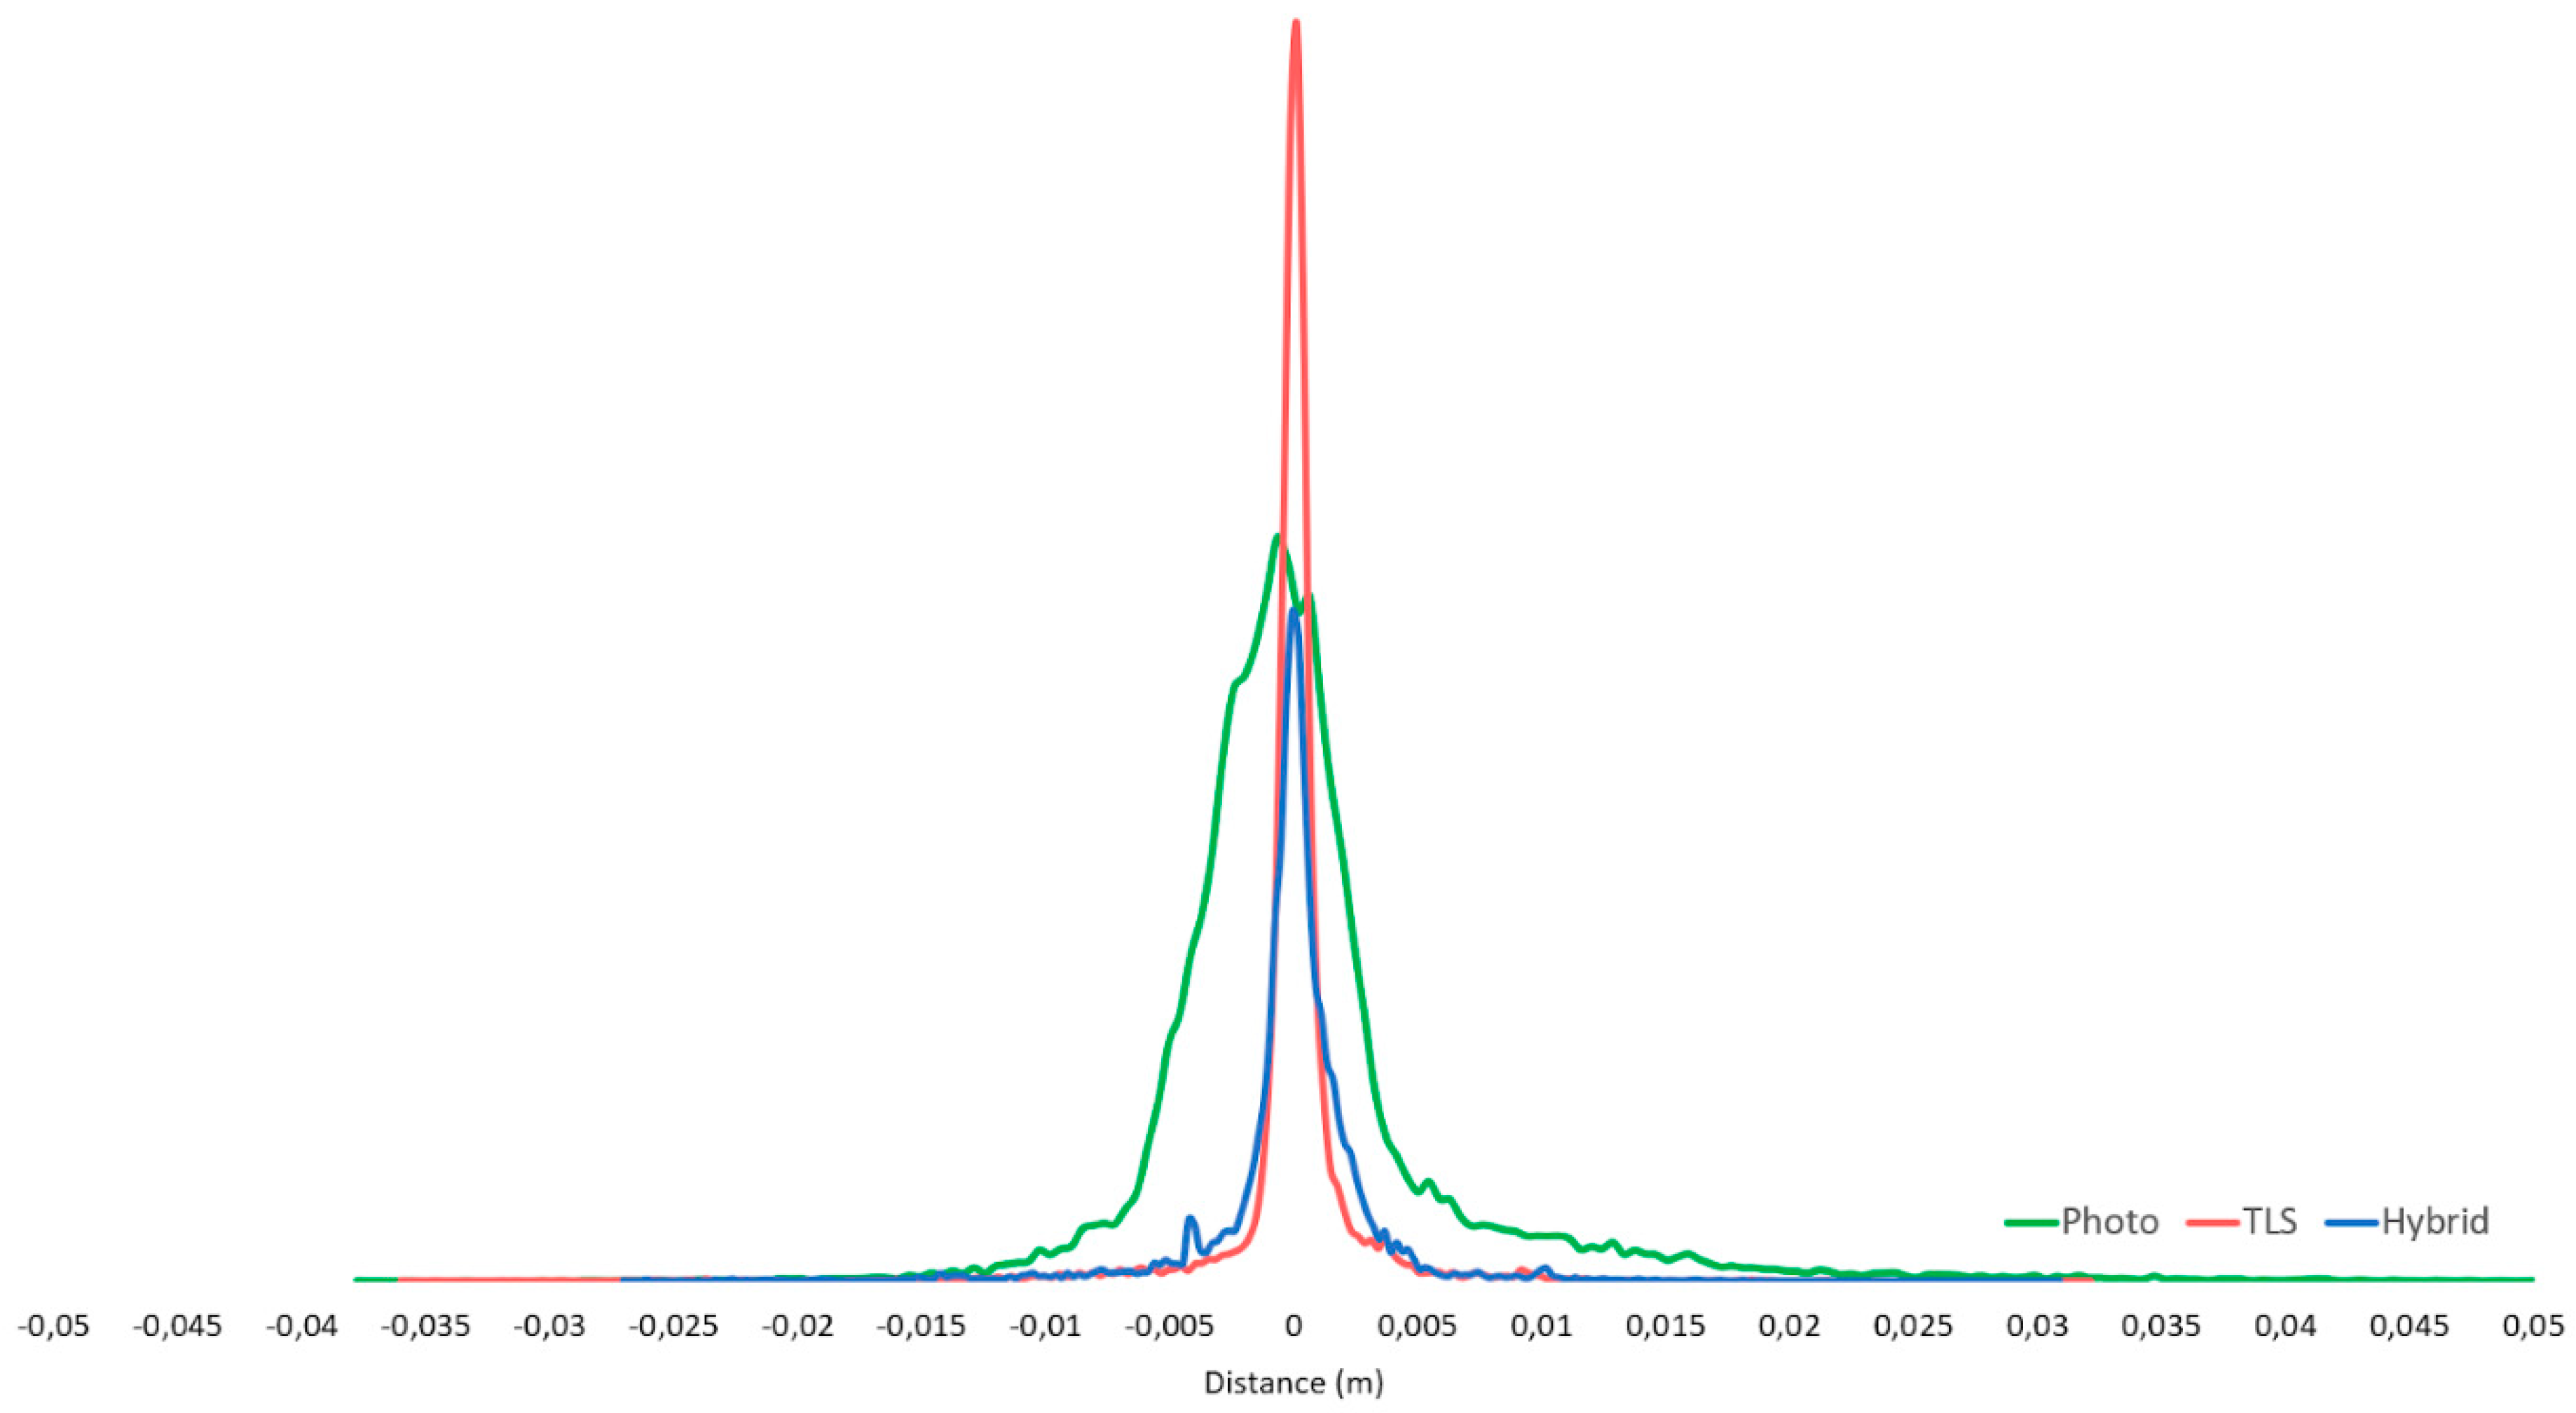
The integrated hybrid approach appeared as a good compromise compared to approaches relying solely to terrestrial laser scanning or photogrammetry. These results were also well in line with the previous research. The hybrid model improved the geometric quality of the photogrammetric model and improved the texture quality of the TLS-based model. However, there was a clear tradeoff in computing performance and the data volume. As a further downside, the addition of laser scanning naturally comes with a significant added cost and manual labor compared to highly affordable and more automated photogrammetry. Despite development, laser scanning is still far from being consumer friendly.
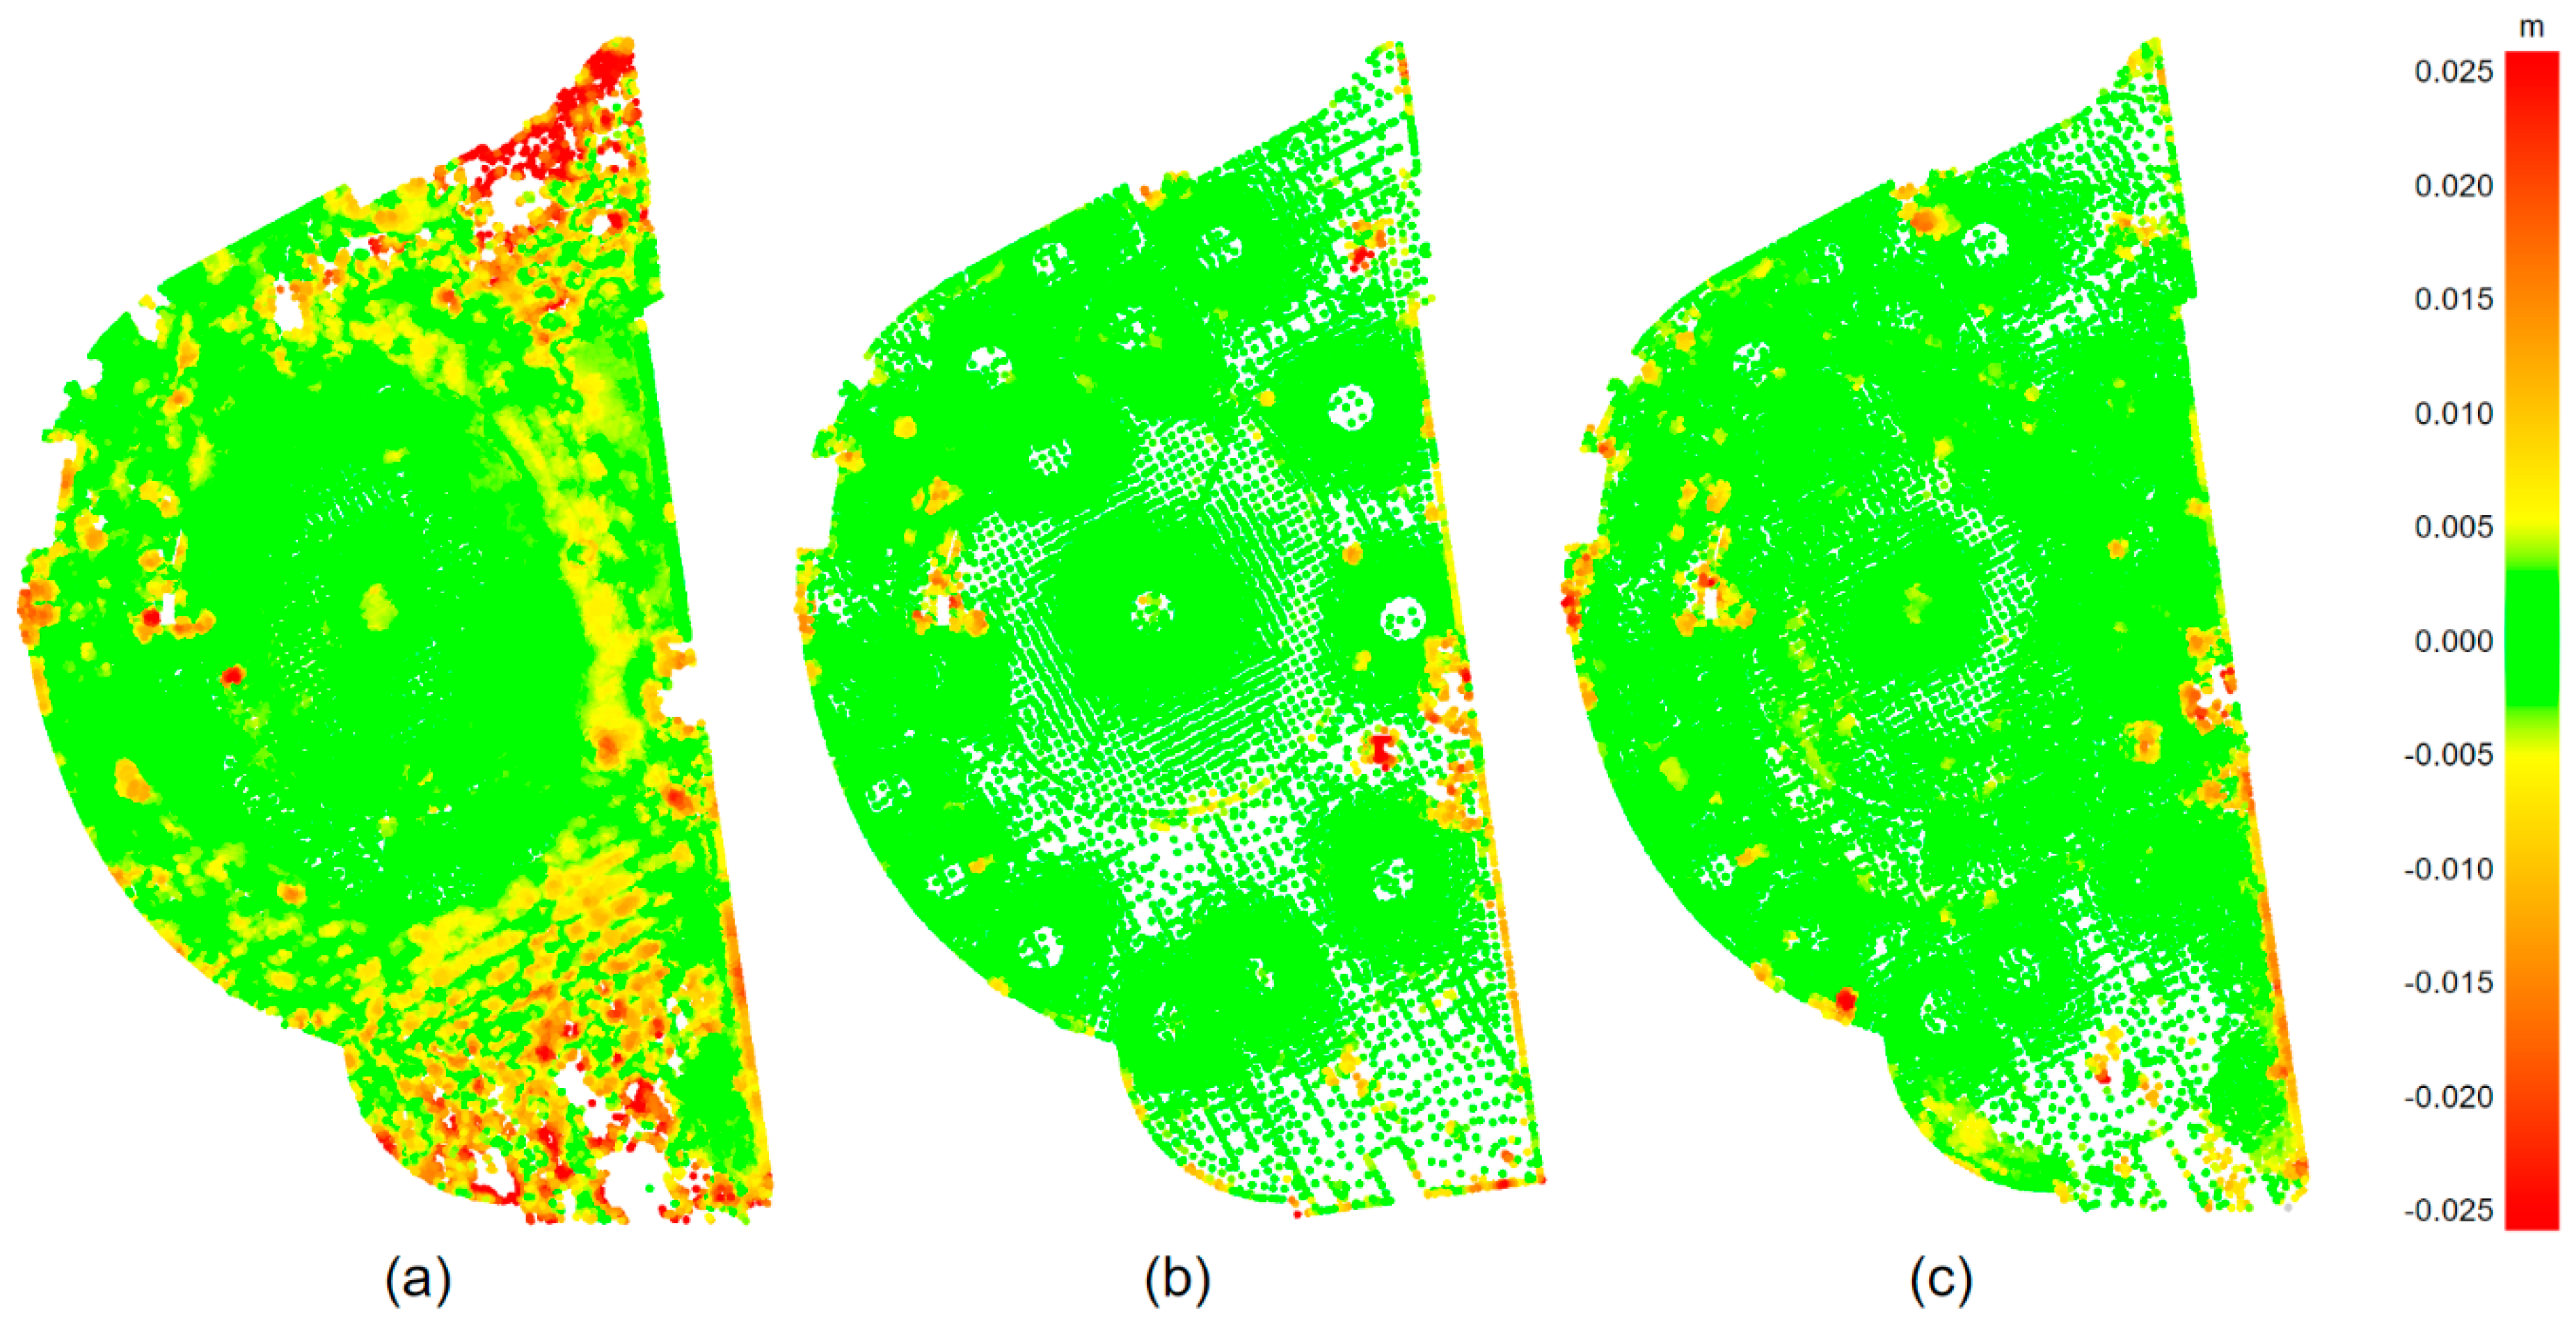
Using photogrammetry alone appeared to be the most affordable, accessible and portable option with a superior texturing quality compared to laser scanning. However, it lacks the benefits of laser scanning, such as direct metric scale determination and better performance on weakly textured surfaces, as well as independence regarding illumination in the scene. According to the analyses, the photogrammetry-based model clearly had the weakest geometric quality that deteriorated especially in the shadowy areas outwards from the center of the scene. Notably, not all images were automatically registered by RealityCapture and the total number of 306 aligned images can be considered a lightweight data set of images. The results could have likely improved by increasing the number of images.
The computing time for the TLS-based model was significantly faster than that of the photogrammetry or hybrid approaches. However, it was difficult to assess the complete workflow. The pre-processing steps were excluded from the analysis because we could consider only the parts of the process that were automated and mutually overlapping. In practice, the registration and filtering of the TLS data can require a significant amount of manual work, thus potentially being by far the most time-consuming step in the whole processing chain. This is the case particularly when modeling heavily crowded public spaces such as the Puhos shopping mall in our case.
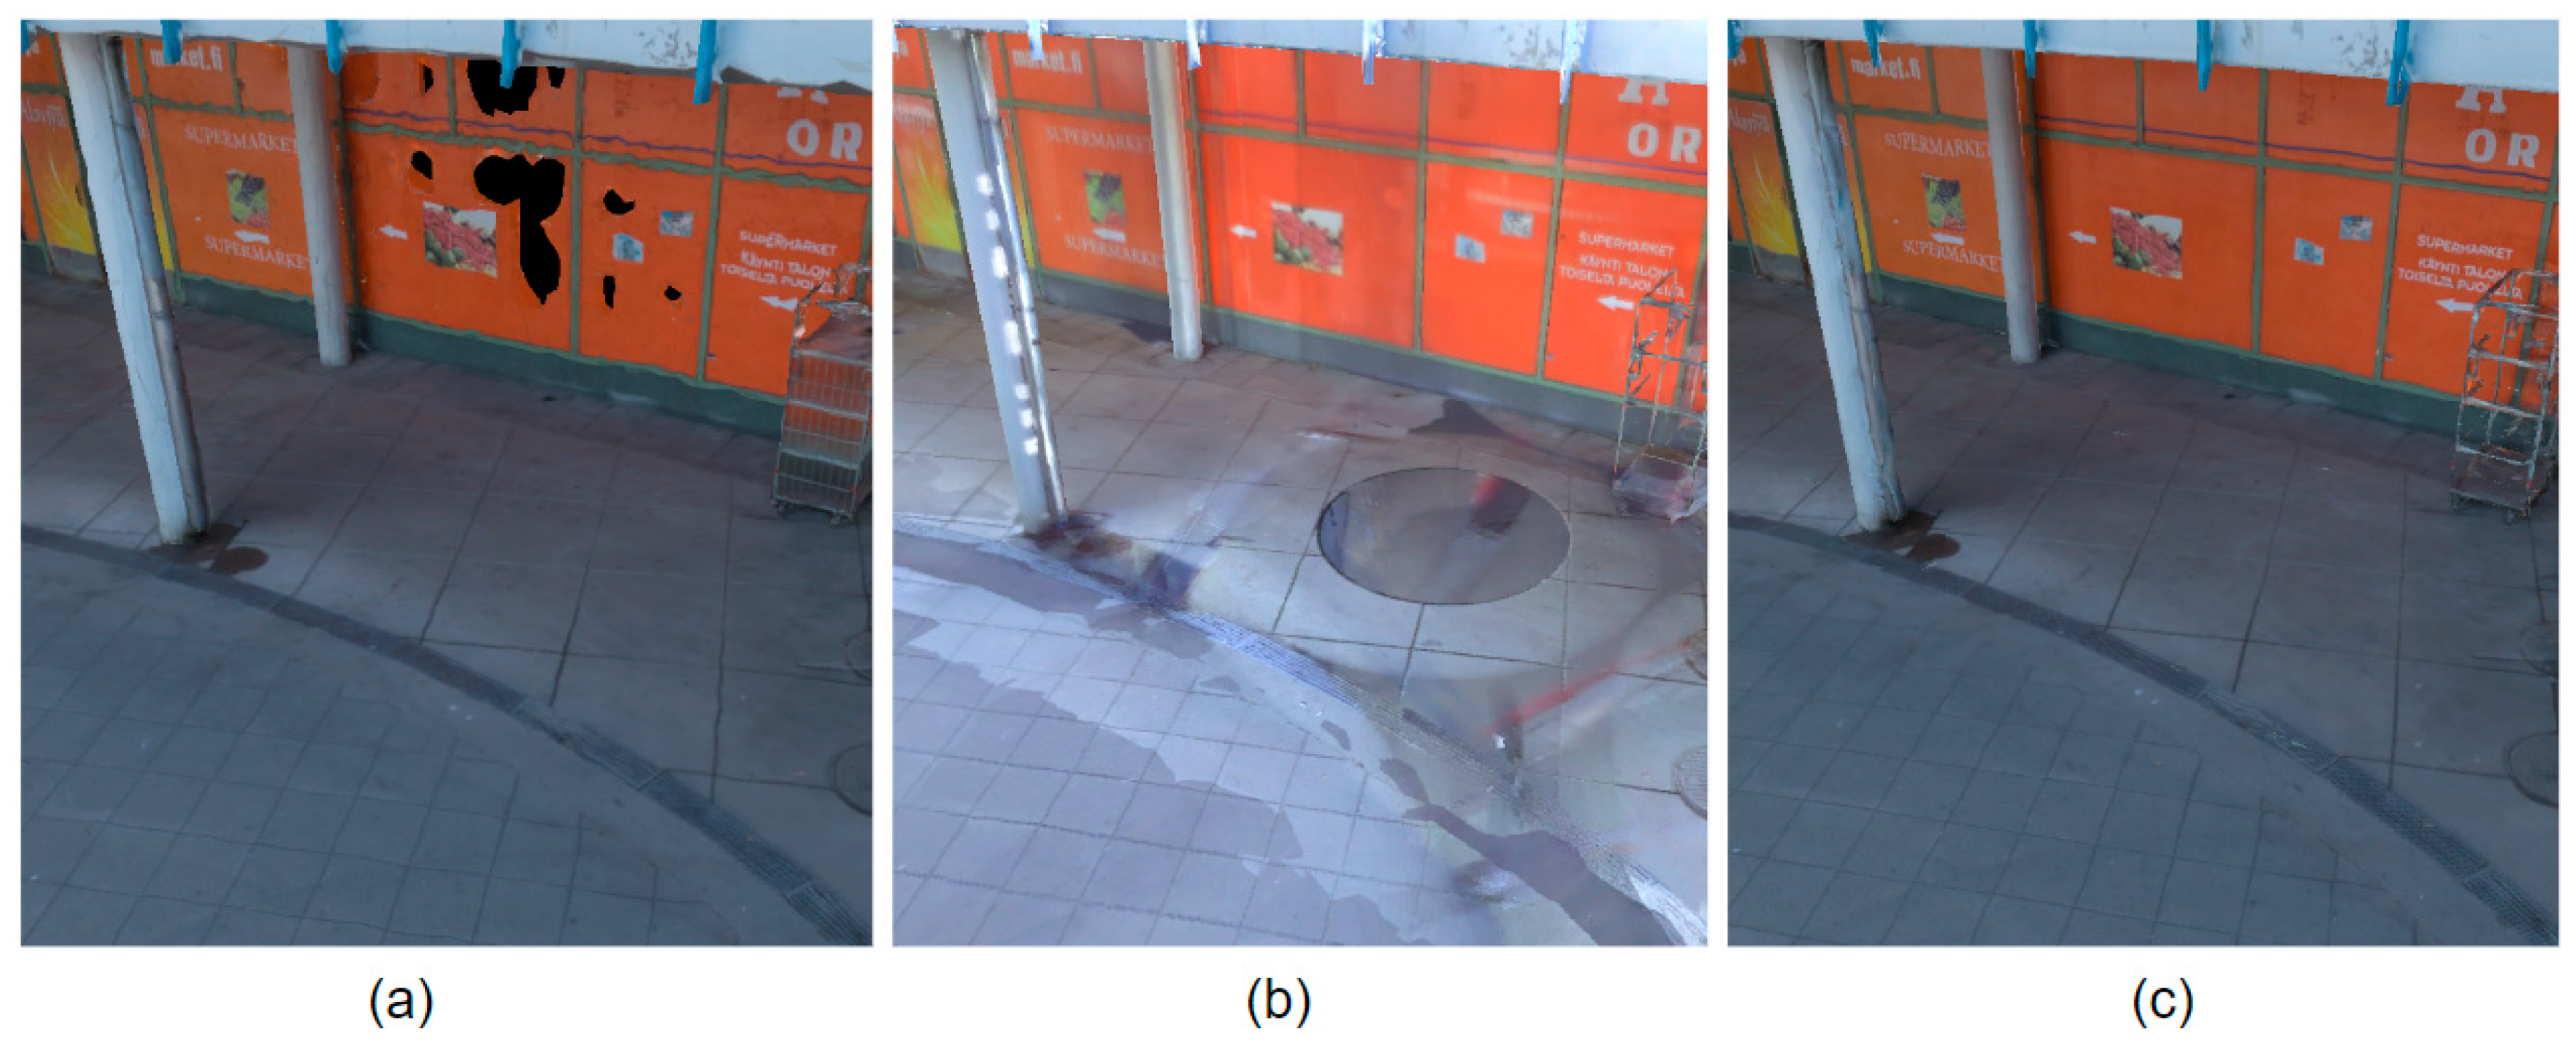
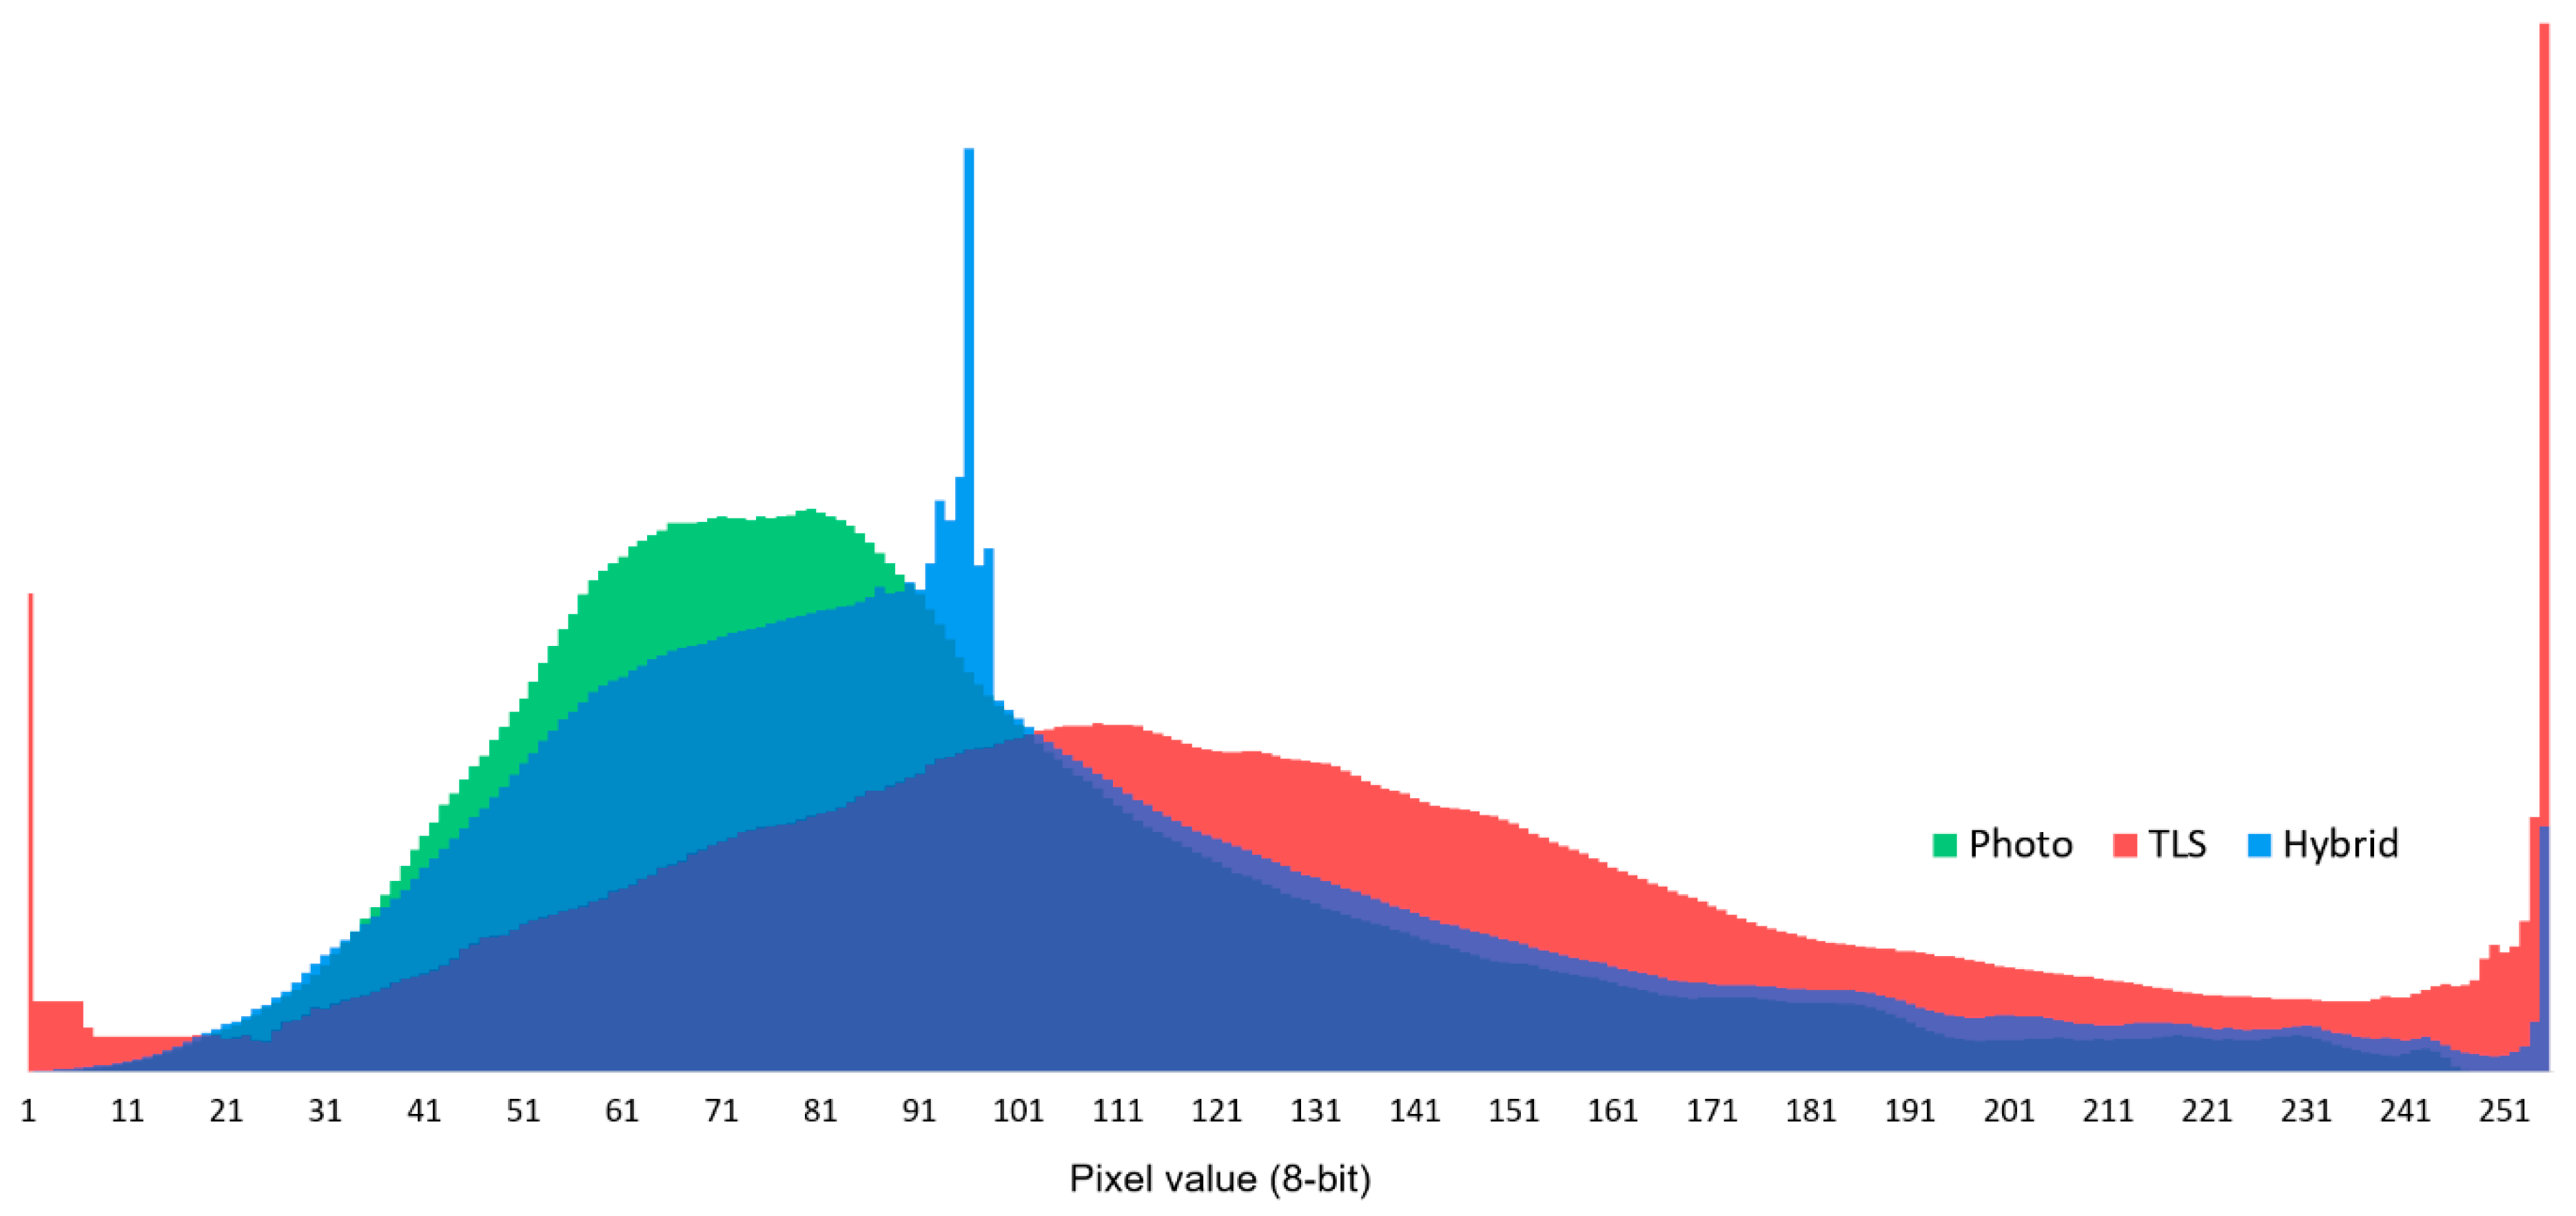
In terms of texturing, the inclusion of photogrammetry clearly improved the texture quality. The analyses showed that the TLS-based model suffered greatly from both underexposure and overexposure. This was mainly due to the weaker quality of the built-in camera in the laser scanner (see Figure 11). Utilization of high dynamic range (HDR) imaging, a common feature in many modern TLS scanners, would have improved the texturing quality but also would most likely have made the data collection significantly slower and therefore increased the problems with moving shadows in the scene, for example. Additionally, the possibilities for editing the raw images are limited with TLS when it comes to aspects such as adjusting the tonal scales or the white balance of the images prior to coloring the point cloud data. Moreover, in all three approaches the lights and the shadows in the scene are baked into the textures and reflect the specific lighting conditions over the time when the data was acquired. In many use cases, an additional de-lighting process would be required to allow the 3D model to be used in any lighting scenario.
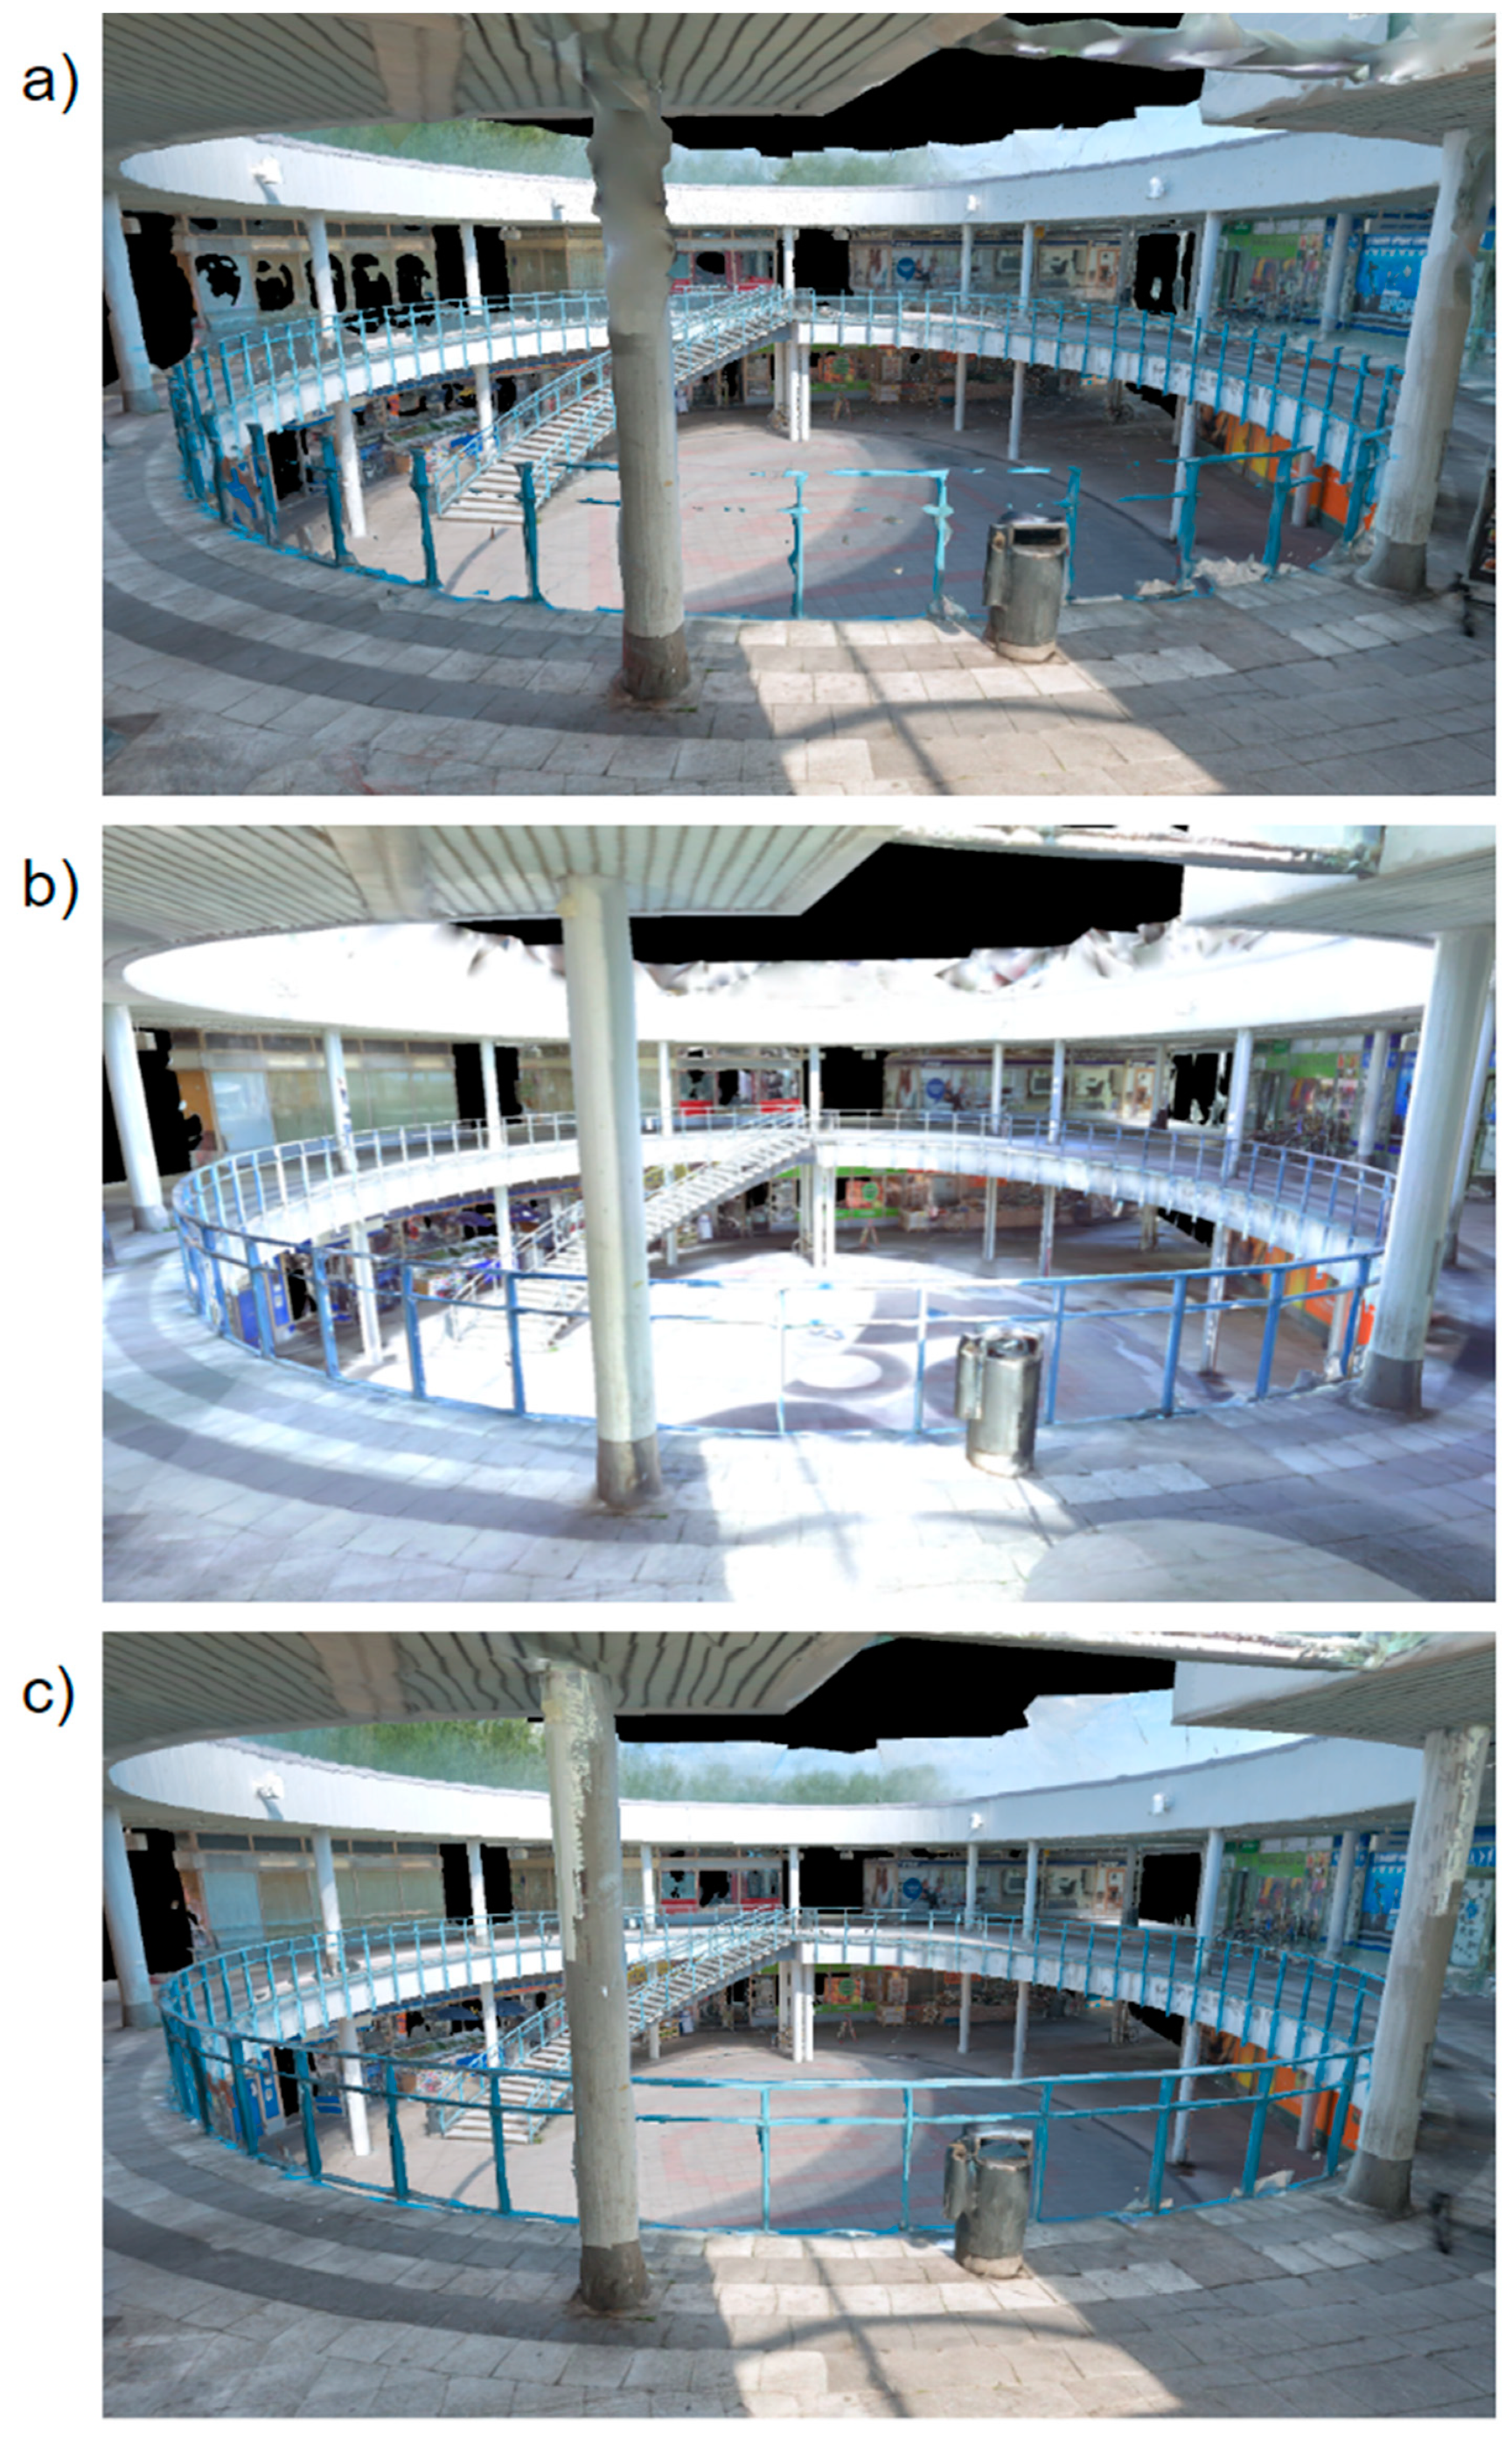
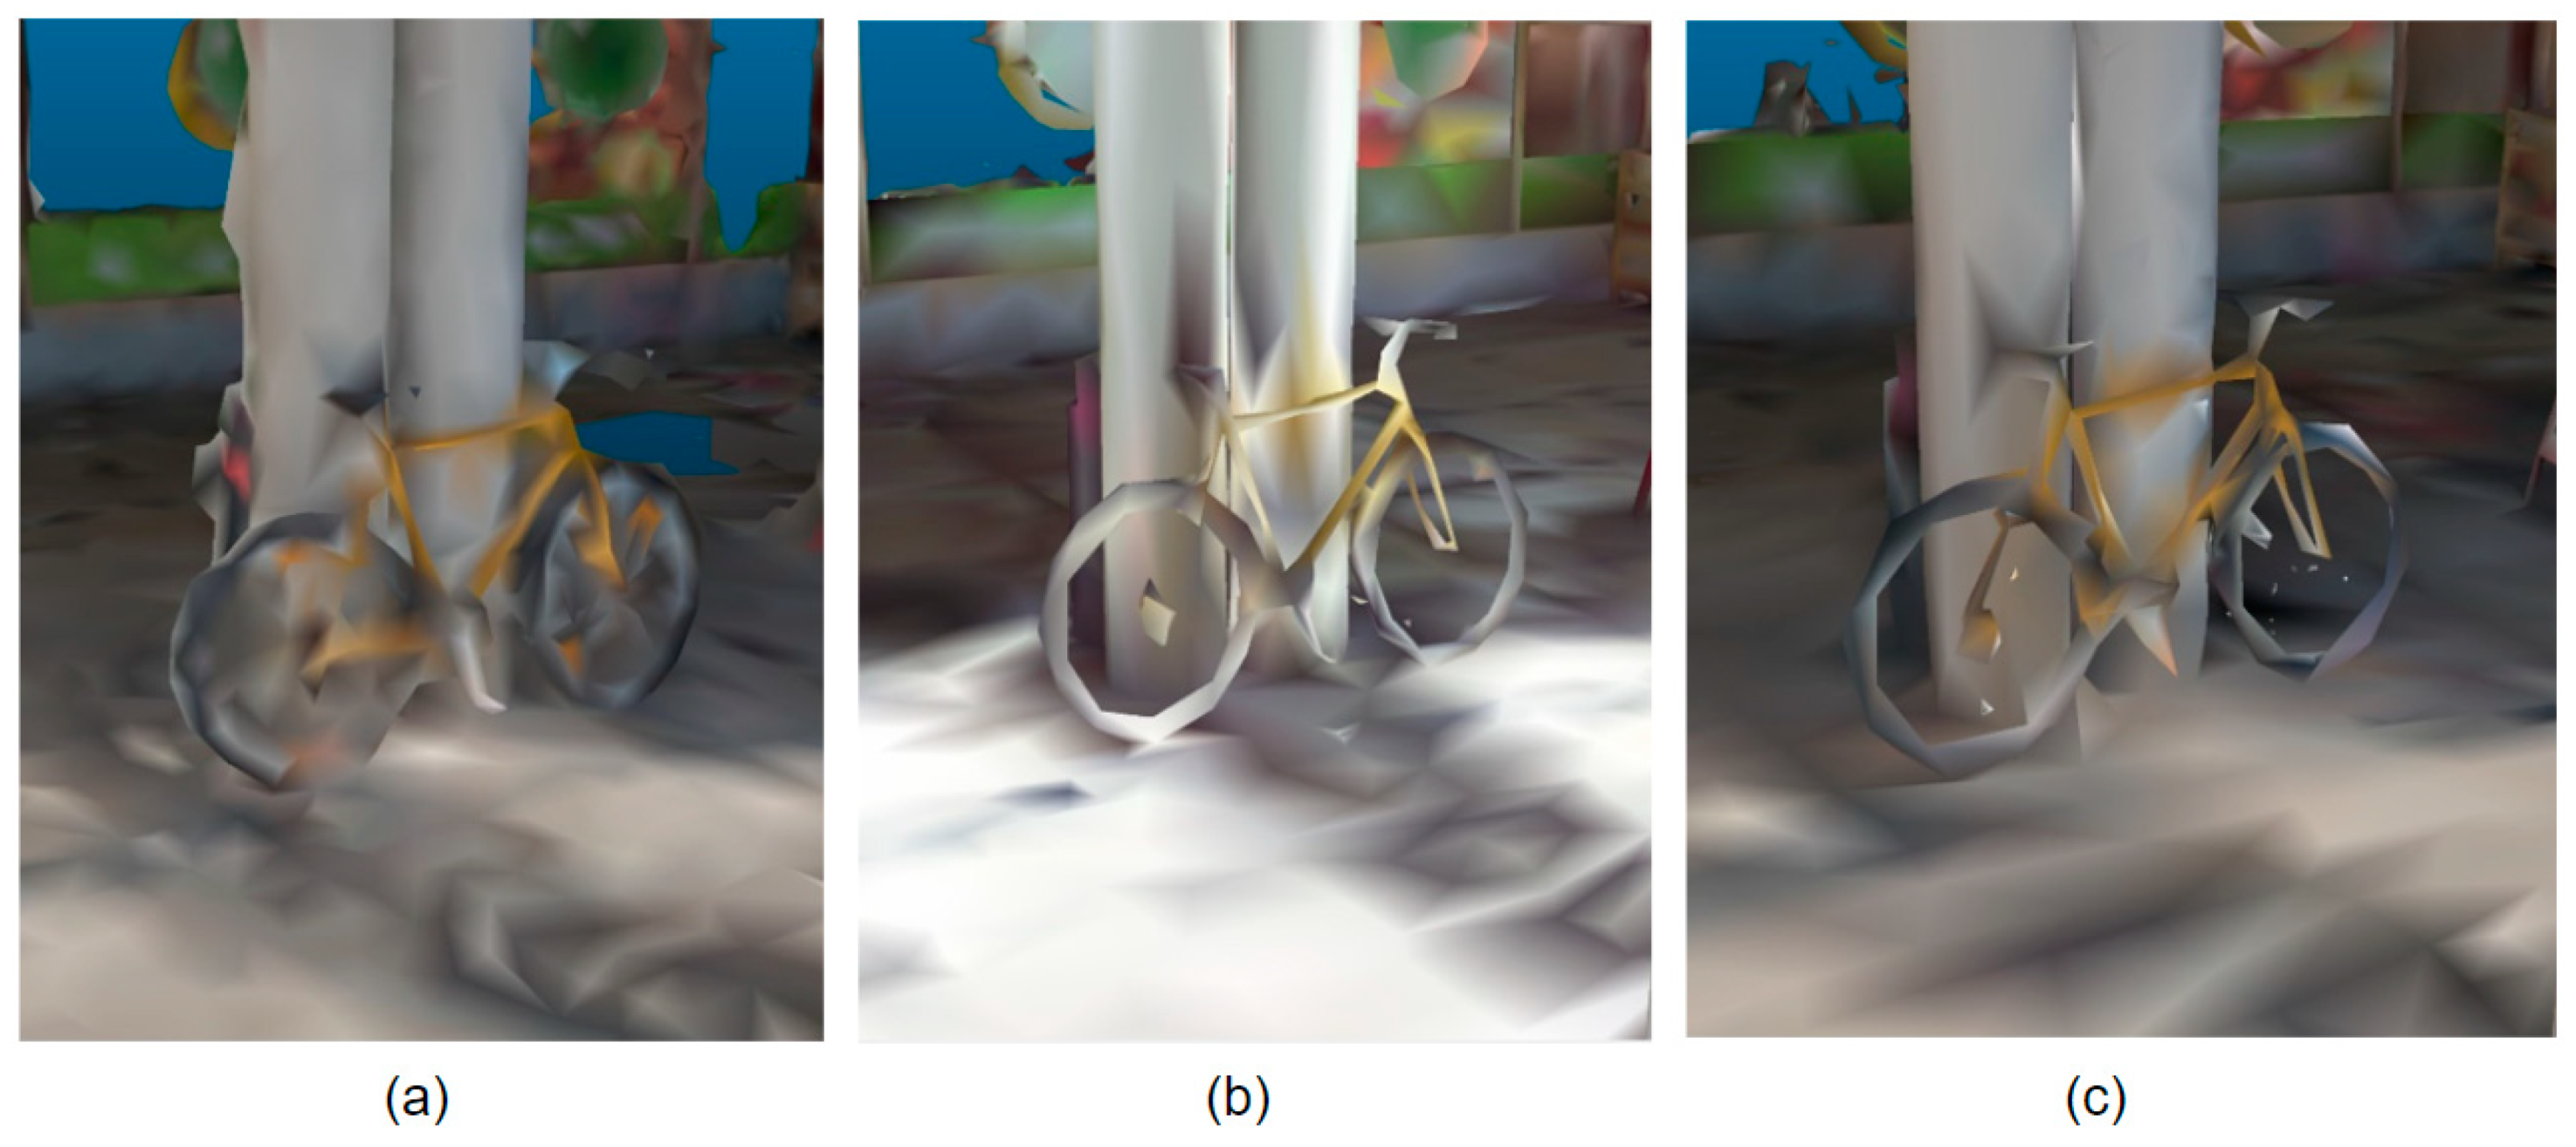
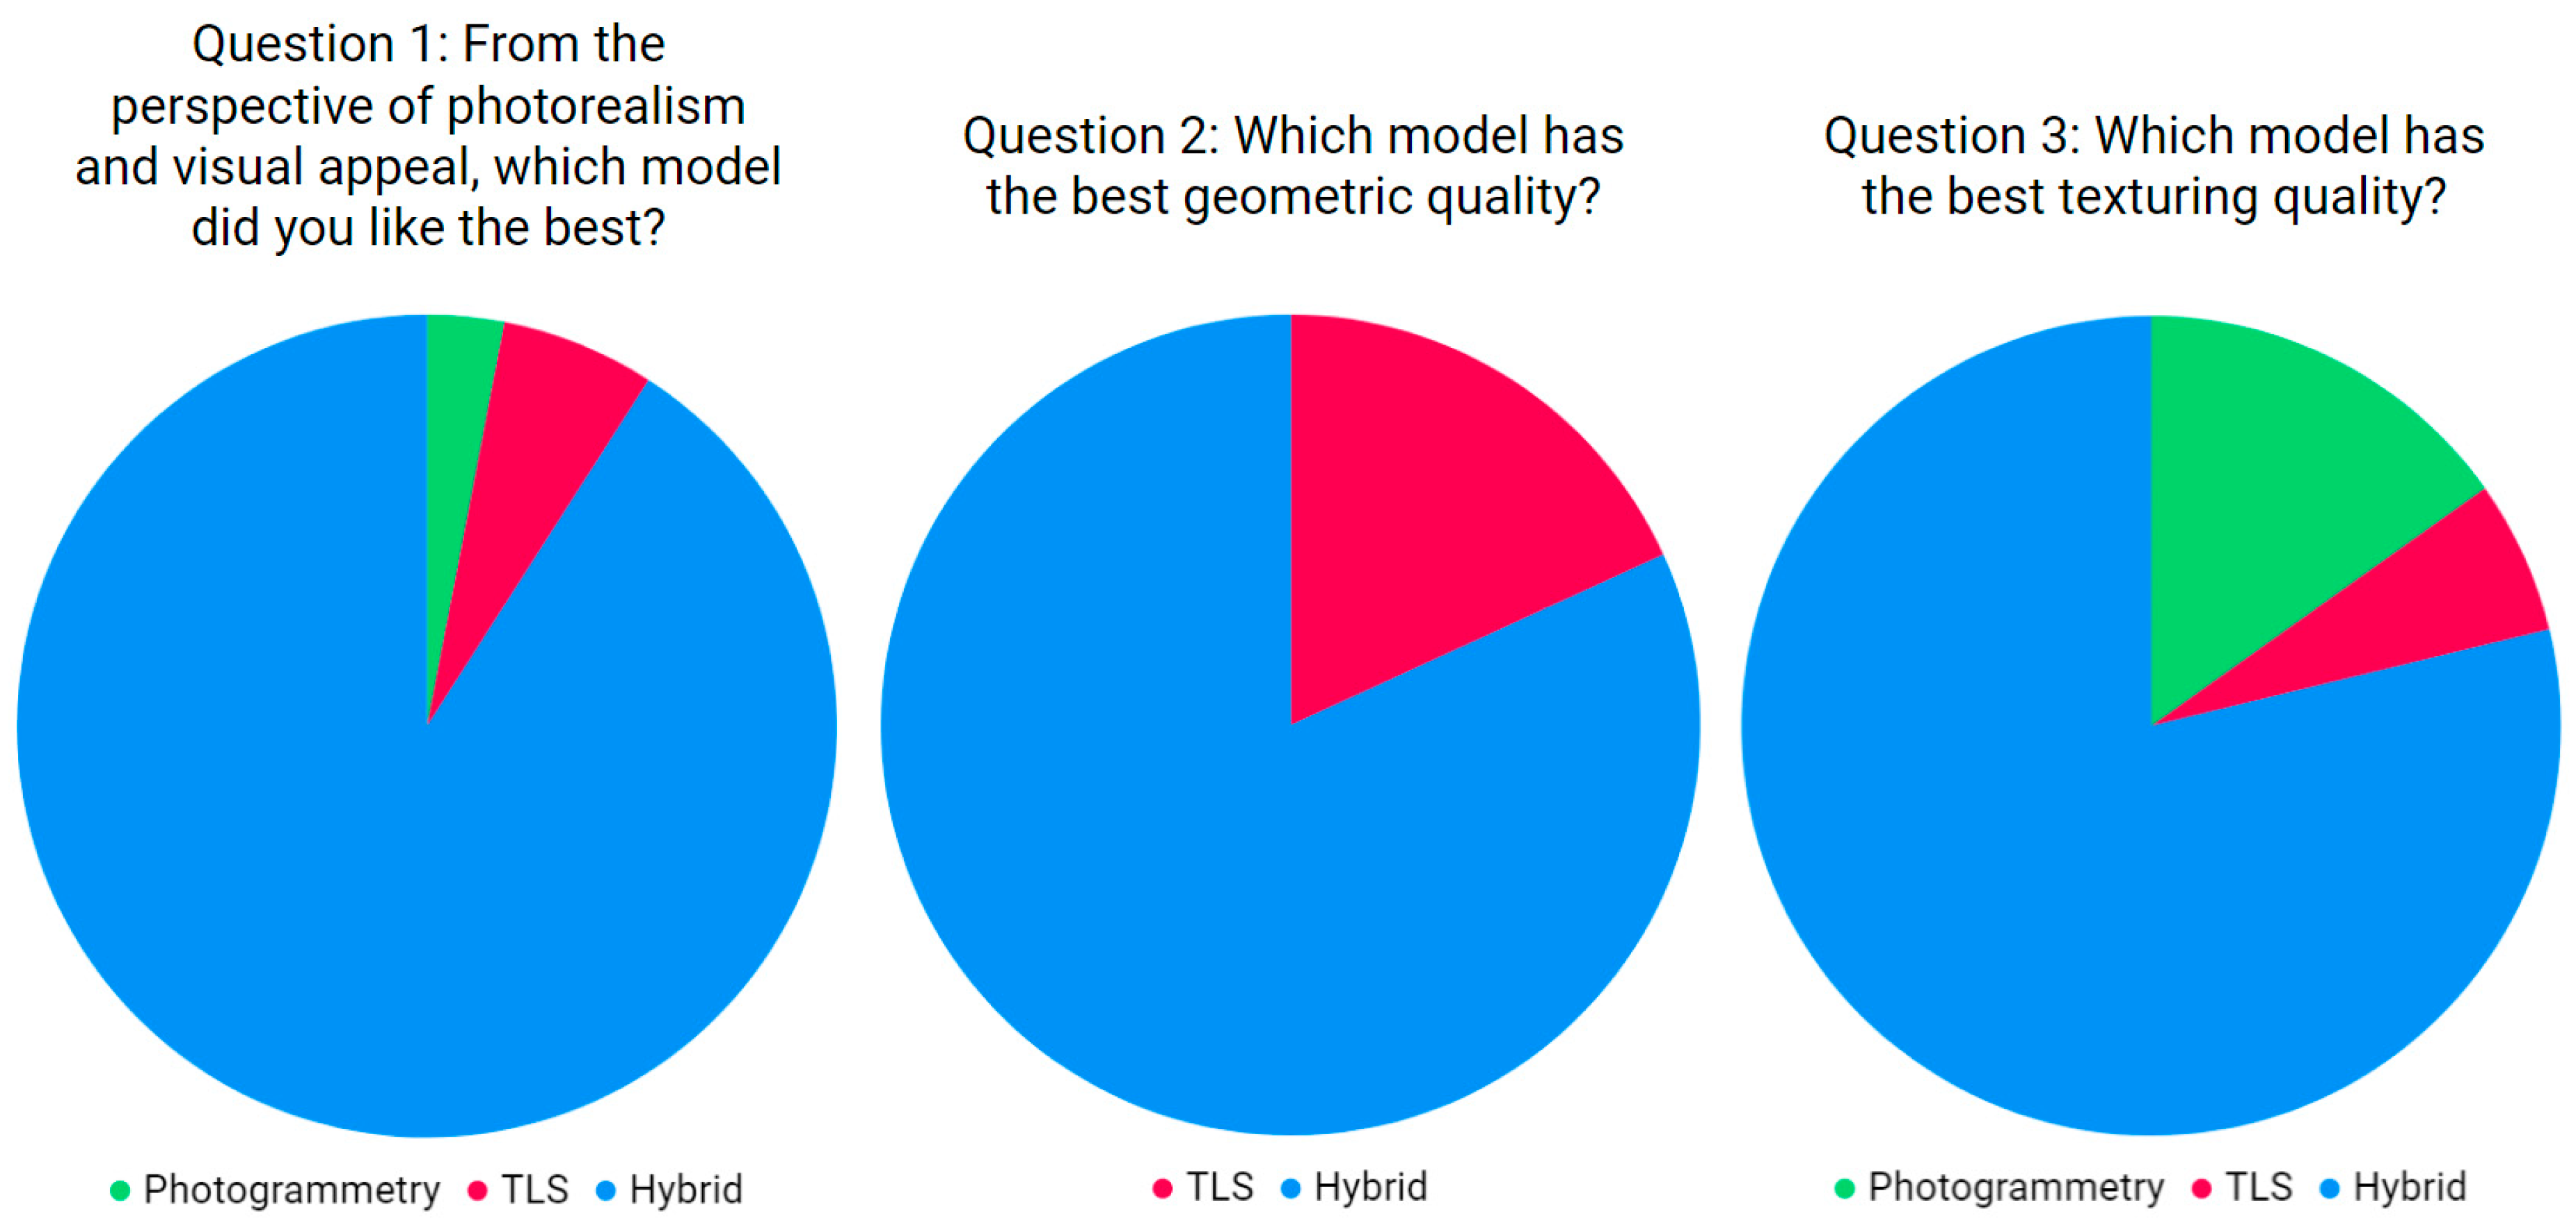
The results from the expert evaluation were even more favorable towards the hybrid approach than our numeric quality analyses. The quality of the geometry and texturing appear to go hand in hand. Good geometry appears to improve the visual appeal of the texturing and good texturing positively affects the visual appeal of the geometry. Furthermore, it appears that the people evaluating the visual quality are prone to focus on coarse errors and artifacts in the models. In our case these were elements such as holes in the photogrammetric model or texture artifacts in the TLS-based model (see Figure 6). These types of errors are often inherited from the quality issues (e.g., weak sensor quality, weak data overlap, changes in the environment during data collection) in the raw data and are thus very challenging to fix automatically at later stages of the modeling process.
Limitations in our approach included the real-life characteristics of our case study. Data acquisition was limited by uncontrollable and suboptimal weather conditions, a fixed time frame and the consistently large numbers of people in this public space. However, these limitations reflected a realistic project situation where some factors are always beyond control. It is also worth noting that our emphasis was on photorealistic web visualization where the accuracy, precision and reliability of the models was not prioritized. More robust ground reference should have been used if the use case would have been for an application such as structural planning. Furthermore, our focus on complete automation meant compromising on the quality of the models. The results would have been improved if manual editing steps such as point cloud processing or model and texture editing were included. Alternatively, the 3D reconstruction phase could have been accomplished with 3DF Zephyr but this would have resulted in reduced level of integration and increased manual work, as in [70]. Separate processing of laser scans and photogrammetric reconstruction could have been applied with mesh generation tools to produce somewhat similar, but significantly more manual, results as in [87]. A different web platform with support for streaming 3D models of multiple levels of details (LODs) might have allowed the use of larger and more detailed models. However, such platforms were unavailable as a free service.
Further research directions include comparing the results of an automated 3D reconstruction process with a traditionally created reality-based 3D model that has been manually optimized for the web. Future development of web-based real-time rendering and streaming of 3D graphics will enable larger and larger data sets and reduce the need to heavily decimate mesh model data sets. Additionally, the development of point-based rendering may advance the direct use of 3D point cloud data, streamlining the modeling processes by minimizing the actual need for any modeling.
With the rapid development of mobile data acquisition methods, namely SLAM (Simultaneous localization and mapping), integration will be handled more on a sensor-level. This tighter level integration could enable further automation and quality control on the roots of the potential problems. Currently, many available SLAM-based 3D mapping systems utilize laser scanners but lack the tight integration of photogrammetry, e.g., for producing textured 3D models. Moreover, further developed integration of laser scanning and photogrammetry could potentially advance semantic modeling, where objects in the scene could be segmented automatically into separate 3D model objects. This would be beneficial in numerous application development cases that currently rely on segmenting the scene manually into meaningful objects.
In addition to color, the type of reflection is an important attribute of a surface texture. 3D models with physically based rendering (PBR) of lighting would benefit from reality-based information on the surface reflection type: which proportion of the light is reflected diffusely and which is reflected specularly from the surface. However, there is no agile and fast method for capturing the reflection type in the area of measurement. Hence, developing this method would accelerate the adaptation of reality-based PBR 3D models, since models with high integrity could be produced with less manual labor.

5. Conclusions

The Internet has become a major dissemination and sharing platform for 3D model content. The utilization of 3D measurement methods can drastically increase the efficiency of 3D content production in numerous use cases where 3D documentation of real-life objects or environments is required. Our approach is a novel combination of web-applicability, multi-sensor integration, high-level automation and photorealism. We compared close-range photogrammetry, terrestrial laser scanning and their combination using available state-of-the-art tools in a real-life project setting.
Our study supports the view that creating web-compatible reality-based 3D models by integrating photogrammetry and TLS is a good compromise for both geometric and texture quality. Compared to approaches using only photogrammetry or TLS, it is slower and more resource heavy but combines many complementary advantages of both methods, such as direct scale determination from TLS or superior image quality typically used in photogrammetry. This paper shows that the integration is not only beneficial, but clearly productionally possible using available state-of-the-art tools that have become increasingly available also for non-expert users. In its current state, the integration functions almost fully automatically for pre-processed scan and image data. Despite the high degree of automation some manual editing steps are practically still required to achieve results that would be not only satisfactory from the perspective of visual aesthetics, but also from the perspective of quality. This is especially true when considering the current limitations of aspects such as the polygon count and textures set by the WebGL technology.
The increasing demand for 3D models of real-life objects and scenes is driven by global trends of digital transformation, building information modeling (BIM), VR/AR, industry 4.0 and robotization to name a few. This rapid development will continue to increase the technical maturity and will enable larger audiences to produce 3D models for wider use cases of diverse requirements. This will result in the need for consistent quality control and well-informed and skilled people who create and use these reality-based 3D models.

Author Contributions

Conceptualization, Arttu Julin, Kaisa Jaalama, Juho-Pekka Virtanen, Mikko Maksimainen and Matti Kurkela; Formal analysis, Arttu Julin and Matti Kurkela; Investigation, Arttu Julin and Kaisa Jaalama; Methodology, Arttu Julin, Juho-Pekka Virtanen, Mikko Maksimainen and Matti Kurkela; Visualization, Arttu Julin; Writing—original draft, Arttu Julin, Kaisa Jaalama, Juho-Pekka Virtanen, Mikko Maksimainen, Matti Kurkela, Juha Hyyppä and Hannu Hyyppä; Writing—review & editing, Arttu Julin, Kaisa Jaalama, Matti Kurkela, Juho-Pekka Virtanen, Mikko Maksimainen, Juha Hyyppä and Hannu Hyyppä.

Funding

This research work was funded by the Academy of Finland, the Centre of Excellence in Laser Scanning Research (CoE-LaSR) (No. 272195, 307362), “Competence-Based Growth Through Integrated Disruptive Technologies of 3D Digitalization, Robotics, Geospatial Information and Image Processing/Computing–Point Cloud Ecosystem”, pointcloud.fi (No. 293389), the Business Finland project “VARPU” (7031/31/2016), the European Social Fund projects S21272 and S21338, and the European Regional Development Fund project “3D Cultural Hub” (A72980).

Acknowledgments

The authors would like to thank the Finnish public service broadcasting company Yle for providing a real-life case for this research work.

Conflicts of Interest

The authors declare no conflict of interest.

Appendix A

The questions in the expert evaluation on visual quality:
  • 1a. From the perspective of photorealism and visual appeal, which model did you like the best? (multiple-choice question)
  • 1b. Why? Explain briefly. (open question with a text box)
  • 2a. Which model has the best geometric quality? (multiple-choice question)
  • 2b. Why? Explain briefly. (open question with a text box)
  • 3a. Which model has the best texturing quality? (multiple-choice question)
  • 3b. Why? Explain briefly. (open question with a text box)

References

  1. WebGL Overview. Available online: https://www.khronos.org/webgl/ (accessed on 30 January 2019).
  2. Evans, A.; Romeo, M.; Bahrehmand, A.; Agenjo, J.; Blat, J. 3D graphics on the web: A survey. Comput. Graph. 2014, 41, 43–61. [Google Scholar] [CrossRef]
  3. Potenziani, M.; Fritsch, B.; Dellepiane, M.; Scopigno, R. Automating large 3D dataset publication in a web-based multimedia repository. In Proceedings of the Conference on Smart Tools and Applications in Computer Graphics, Genova, Italy, 3–4 October 2016; Eurographics Association; pp. 99–107. [Google Scholar] [CrossRef]
  4. Scopigno, R.; Callieri, M.; Dellepiane, M.; Ponchio, F.; Potenziani, M. Delivering and using 3D models on the web: Are we ready? Virtual Archaeol. Rev. 2017, 8, 1–9. [Google Scholar] [CrossRef]
  5. OpenGL ES Overview. Available online: https://www.khronos.org/opengles/ (accessed on 10 April 2019).
  6. Three.js—Javascript 3D Library. Available online: https://threejs.org/ (accessed on 10 April 2019).
  7. Babylon.js—3D Engine based on WebGL/Web Audio and JavaScript. Available online: https://www.babylonjs.com/ (accessed on 10 April 2019).
  8. Scully, T.; Friston, S.; Fan, C.; Doboš, J.; Steed, A. glTF streaming from 3D repo to X3DOM. In Proceedings of the 21st International Conference on Web3D Technology (Web3D ’16), Anaheim, CA, USA, 22–24 July 2016; ACM: New York, NY, USA, 2016; pp. 7–15. [Google Scholar] [CrossRef] [Green Version]
  9. Schilling, A.; Bolling, J.; Nagel, C. Using glTF for streaming CityGML 3D city models. In Proceedings of the 21st International Conference on Web3D Technology (Web3D ’16), Anaheim, CA, USA, 22–24 July 2016; ACM: New York, NY, USA, 2016; pp. 109–116. [Google Scholar] [CrossRef]
  10. Miao, R.; Song, J.; Zhu, Y. 3D geographic scenes visualization based on WebGL. In Proceedings of the 6th IEEE International Conference on Agro-Geoinformatics, Fairfax, VA, USA, 7–10 August 2017; pp. 1–6. [Google Scholar] [CrossRef]
  11. Art Pipeline for glTF. Available online: https://www.khronos.org/blog/art-pipeline-for-gltf?fbclid=IwAR0DzggkHUpnQWTNn-lfO9-iLfiOTq4xbQvBMrWYXq9A-jnjSEsDcVhJpNM (accessed on 10 April 2019).
  12. Limper, M.; Brandherm, F.; Fellner, D.W.; Kuijper, A. Evaluating 3D thumbnails for virtual object galleries. In Proceedings of the 20th International Conference on 3D Web Technology, Heraklion, Crete, Greece, 18–21 June 2015; ACM: New York, NY, USA, 2015; pp. 17–24. [Google Scholar] [CrossRef]
  13. Sketchfab—Your 3D Content on Web, Mobile, AR, and VR. Available online: https://sketchfab.com/ (accessed on 15 January 2019).
  14. Poly. Available online: https://poly.google.com/ (accessed on 10 February 2019).
  15. Facebook. Available online: https://www.facebook.com/ (accessed on 15 January 2019).
  16. Features-Sketchfab. Available online: https://sketchfab.com/features (accessed on 15 January 2019).
  17. Supported 3D File Formats. Available online: https://help.sketchfab.com/hc/en-us/articles/202508396-Supported-3D-File-Formats (accessed on 10 April 2019).
  18. Improving Viewer Performance-Sketchfab Help Center. Available online: https://help.sketchfab.com/hc/en-us/articles/201766675-Viewer-Performance (accessed on 15 January 2019).
  19. Asset Requirements-Sharing. Available online: https://developers.facebook.com/docs/sharing/3d-posts/asset-requirements/ (accessed on 30 January 2019).
  20. Uploading to Poly-Poly Help. Available online: https://support.google.com/poly/answer/7562662?hl=en (accessed on 30 January 2019).
  21. 3ds Max. Available online: https://www.autodesk.eu/products/3ds-max/overview (accessed on 30 January 2019).
  22. Maya. Available online: https://www.autodesk.eu/products/maya/overview (accessed on 30 January 2019).
  23. Blender. Available online: https://www.blender.org/ (accessed on 30 January 2019).
  24. ZBrush. Available online: http://pixologic.com/ (accessed on 30 January 2019).
  25. AutoCAD. Available online: https://www.autodesk.eu/products/autocad/overview (accessed on 30 January 2019).
  26. Microstation. Available online: https://www.bentley.com/en/products/brands/microstation (accessed on 30 January 2019).
  27. Rhinoceros. Available online: https://www.rhino3d.com/ (accessed on 30 January 2019).
  28. SketchUp. Available online: https://www.sketchup.com/ (accessed on 30 January 2019).
  29. Remondino, F.; Rizzi, A. Reality-based 3D documentation of natural and cultural heritage sites—techniques, problems, and examples. Appl. Geomat. 2010, 2, 85–100. [Google Scholar] [CrossRef] [Green Version]
  30. Julin, A.; Jaalama, K.; Virtanen, J.P.; Pouke, M.; Ylipulli, J.; Vaaja, M.; Hyyppä, J.; Hyyppä, H. Characterizing 3D City Modeling Projects: Towards a Harmonized Interoperable System. ISPRS Int. Geo-Inf. 2018, 7, 55. [Google Scholar] [CrossRef]
  31. Pătrăucean, V.; Armeni, I.; Nahangi, M.; Yeung, J.; Brilakis, I.; Haas, C. State of research in automatic as-built modelling. Adv. Eng. Inform. 2015, 29, 162–171. [Google Scholar] [CrossRef] [Green Version]
  32. Wang, Q.; Tan, Y.; Mei, Z. Computational Methods of Acquisition and Processing of 3D Point Cloud Data for Construction Applications. Arch. Comput. Methods Eng. 2019, 1–21. [Google Scholar] [CrossRef]
  33. Photogrammetry and Star Wars Battlefront. Available online: https://www.ea.com/frostbite/news/photogrammetry-and-star-wars-battlefront (accessed on 15 January 2019).
  34. Virtanen, J.P.; Kurkela, M.; Turppa, T.; Vaaja, M.T.; Julin, A.; Kukko, A.; Hyyppä, J.; Ahlavuo, M.; Edén von Numers, J.; Haggrén, H.; et al. Depth camera indoor mapping for 3D virtual radio play. Photogramm. Rec. 2018, 33, 171–195. [Google Scholar] [CrossRef] [Green Version]
  35. An In-Depth Guide on Capturing/Preparing Photogrammetry for Unity. Available online: http://metanautvr.com/blog/2017/10/24/a-guide-on-capturing-preparing-photogrammetry-for-unity-vr/ (accessed on 25 October 2018).
  36. Photogrammetry, Unity. Available online: https://unity.com/solutions/photogrammetry (accessed on 25 October 2018).
  37. Augmented and Virtual Reality Survey Report-Industry Insights into the Future of AR/VR. Available online: https://dpntax5jbd3l.cloudfront.net/images/content/1/5/v2/158662/2016-VR-AR-Survey.pdf (accessed on 25 October 2018).
  38. Boehler, W.; Marbs, A. 3D scanning instruments. In Proceedings of the CIPA WG 6 International Workshop on Scanning for Cultural Heritage Recording, Corfu, Greece, 1–2 September 2002; pp. 9–12. [Google Scholar]
  39. Nistér, D. An efficient solution to the five-point relative pose problem. IEEE Pattern Anal. 2004, 26, 756–770. [Google Scholar] [CrossRef]
  40. Hirschmuller, H. Accurate and efficient stereo processing by semi-global matching and mutual information. In Proceedings of the IEEE Computer Society Conference on Computer Vision and Pattern Recognition Volume II, San Diego, CA, USA, 20–25 June 2005; Schmid, C., Soatto, S., Tomasi, C., Eds.; IEEE Computer Society: Los Alamitos, CA, USA, 2005; pp. 807–814. [Google Scholar] [CrossRef]
  41. Jancosek, M.; Pajdla, T. Multi-view reconstruction preserving weakly-supported surfaces. In Proceedings of the IEEE Computer Vision and Pattern Recognition (CVPR) 2011, Colorado Springs, CO, USA, 21–23 June 2011; pp. 3121–3128. [Google Scholar] [CrossRef]
  42. 3DF Zephyr. Available online: https://www.3dflow.net/3df-zephyr-pro-3d-models-from-photos/ (accessed on 30 January 2019).
  43. Reality Capture. Available online: https://www.capturingreality.com/ (accessed on 31 January 2019).
  44. Metashape. Available online: https://www.agisoft.com/ (accessed on 31 January 2019).
  45. Meshroom. Available online: https://alicevision.github.io/ (accessed on 31 January 2019).
  46. COLMAP. Available online: http://colmap.github.io/ (accessed on 31 January 2019).
  47. Pix4D. Available online: https://www.pix4d.com/ (accessed on 31 January 2019).
  48. SEQUOIA. Available online: https://sequoia.thinkboxsoftware.com/ (accessed on 31 January 2019).
  49. Cloud Compare. Available online: http://www.cloudcompare.org/ (accessed on 31 January 2019).
  50. Remondino, F.; Nocerino, E.; Toschi, I.; Menna, F. A Critical Review of Automated Photogrammetric Processing of Large Datasets. Int. Arch. Photogramm. 2017, 42, 591–599. [Google Scholar] [CrossRef]
  51. Rönnholm, P.; Honkavaara, E.; Litkey, P.; Hyyppä, H.; Hyyppä, J. Integration of laser scanning and photogrammetry. Int. Arch. Photogramm. 2007, 36, 355–362. [Google Scholar]
  52. Ramos, M.M.; Remondino, F. Data fusion in Cultural Heritage—A Review. Int. Arch. Photogramm. 2015, 40, 359–363. [Google Scholar] [CrossRef]
  53. Grussenmeyer, P.; Alby, E.; Landes, T.; Koehl, M.; Guillemin, S.; Hullo, J.F.; Assali, E.; Smigiel, E. Recording approach of heritage sites based on merging point clouds from high resolution photogrammetry and terrestrial laser scanning. Int. Arch. Photogramm. 2012, 39, 553–558. [Google Scholar] [CrossRef]
  54. Guarnieri, A.; Remondino, F.; Vettore, A. Digital photogrammetry and TLS data fusion applied to Cultural Heritage 3D modeling. Int. Arch. Photogramm. 2006, 36, 1–6. [Google Scholar]
  55. Habib, A.F.; Ghanma, M.S.; Tait, M. Integration of LIDAR and photogrammetry for close range applications. Int. Arch. Photogramm. 2004, 35, 1045–1050. [Google Scholar]
  56. Baltsavias, E.P. A comparison between photogrammetry and laser scanning. Int. Arch. Photogramm. 1999, 54, 83–94. [Google Scholar] [CrossRef]
  57. Velios, A.; Harrison, J.P. Laser scanning and digital close range photogrammetry for capturing 3D archaeological objects: A comparison of quality and practicality. In Archaeological Informatics: Pushing the Envelope CAA 2001; British Archaeological Reports International Series: Oxford, UK, 2001; Volume 1016, pp. 567–574. [Google Scholar]
  58. Gašparovic, M.; Malaric, I. Increase of readability and accuracy of 3D models using fusion of close range photogrammetry and laser scanning. Int. Arch. Photogramm. 2012, 39, 93–98. [Google Scholar] [CrossRef]
  59. Becker, S.; Haala, N. Refinement of building facades by integrated processing of lidar and image data. Int. Arch. Photogramm. 2007, 36, 7–12. [Google Scholar]
  60. Li, Y.; Zheng, Q.; Sharf, A.; Cohen-Or, D.; Chen, B.; Mitra, N.J. 2D-3D fusion for layer decomposition of urban facades. In Proceedings of the 2011 International Conference on Computer Vision, Barcelona, Spain, 6–13 November 2011; pp. 882–889. [Google Scholar] [CrossRef]
  61. Nex, F.; Rinaudo, F. Lidar of photogrammetry? integration is the answer. Eur. J. Remote Sens. 2011, 43, 107–121. [Google Scholar] [CrossRef]
  62. Guidi, G.; Beraldin, J.-A.; Ciofi, S.; Atzeni, C. Fusion of range camera and photogrammetry: A systematic procedure for improving 3-D models metric accuracy. IEEE Trans. Syst. Man Cybern. Part B 2003, 33, 667–676. [Google Scholar] [CrossRef] [PubMed]
  63. Alshawabkeh, Y. Integration of Laser Scanning and Photogrammetry for Heritage Documentation. Ph.D. Thesis, University of Stuttgart, Stuttgart, Germany, 2006; pp. 1–98. [Google Scholar] [CrossRef]
  64. Peethambaran, J.; Wang, R. Enhancing Urban Façades via LiDAR based Sculpting. Comput. Graph. Forum 2017, 36, 511–528. [Google Scholar] [CrossRef]
  65. Wang, Q.; Guo, J.; Kim, M.K. An Application Oriented Scan-to-BIM Framework. Remote Sens. 2019, 11, 365. [Google Scholar] [CrossRef]
  66. Haala, N.; Alshawabkeh, Y. Combining laser scanning and photogrammetry: A hybrid approach for heritage documentation. In Proceedings of the 7th International Conference on Virtual Reality, Archaeology and Intelligent Cultural Heritage, Nicosia, Cyprus, 30 October–4 November 2006; Eurographics Association: Aire-la-Ville, Switzerland, 2006; pp. 163–170. [Google Scholar]
  67. Vaaja, M.; Kurkela, M.; Hyyppä, H.; Alho, P.; Hyyppä, J.; Kukko, A.; Kaartinen, H.; Kasvi, E.; Kaasalainen, S.; Rönnholm, P. Fusion of mobile laser scanning and panoramic images for studying river environment topography and changes. Int. Arch. Photogramm. 2011, 3812, 319–324. [Google Scholar] [CrossRef]
  68. Rönnholm, P.; Karjalainen, M.; Kaartinen, H.; Nurminen, K.; Hyyppä, J. Relative orientation between a single frame image and LiDAR point cloud using linear features. Photogramm. J. Finl. 2013, 23, 1–16. [Google Scholar] [CrossRef]
  69. Balletti, C.; Guerra, F.; Scocca, V.; Gottardi, C. 3D integrated methodologies for the documentation and the virtual reconstruction of an archaeological site. Int. Arch. Photogramm. 2015, 40, 215–222. [Google Scholar] [CrossRef]
  70. Valenti, R.; Paternò, E. A comparison between tls and uav technologies for historical investigation. Int. Arch. Photogramm. 2019, 422, 739–745. [Google Scholar] [CrossRef]
  71. Jo, Y.H.; Hong, S. Three-Dimensional Digital Documentation of Cultural Heritage Site Based on the Convergence of Terrestrial Laser Scanning and Unmanned Aerial Vehicle Photogrammetry. ISPRS Int. J. Geo-Inf. 2019, 8, 53. [Google Scholar] [CrossRef]
  72. Remondino, F. Heritage recording and 3D modeling with photogrammetry and 3D scanning. Remote Sens. 2011, 3, 1104–1138. [Google Scholar] [CrossRef]
  73. Virtanen, J.P.; Hyyppä, H.; Kurkela, M.; Vaaja, M.T.; Puustinen, T.; Jaalama, K.; Julin, A.; Pouke, M.; Kukko, A.; Turppa, T.; et al. Browser based 3D for the built environment. Nord. J. Surv. Real Estate Res. 2018, 13, 54–76. [Google Scholar] [CrossRef]
  74. Krooks, A.; Kahkonen, J.; Lehto, L.; Latvala, P.; Karjalainen, M.; Honkavaara, E. WebGL Visualisation of 3D Environmental Models Based on Finnish Open Geospatial Data Sets. Int. Arch. Photogramm. 2014, XL-3, 163–169. [Google Scholar] [CrossRef]
  75. Krämer, M.; Gutbell, R. A case study on 3D geospatial applications in the web using state-of-the-art WebGL frameworks. In Proceedings of the 20th International Conference on 3D Web Technology, Heraklion, Crete, Greece, 18–21 June 2015; ACM: New York, NY, USA, 2015; pp. 189–197. [Google Scholar] [CrossRef]
  76. Prandi, F.; Devigli, F.; Soave, M.; Di Staso, U.; De Amicis, R. 3D web visualization of huge CityGML models. Int. Arch. Photogramm. 2015, 40, 601–605. [Google Scholar] [CrossRef]
  77. Ressler, S.; Leber, K. Web Based 3D Visualization and Interaction for Whole Body Laser Scans. In Proceedings of the 4th International Conference on 3D Body Scanning Technologies, Long Beach, CA, USA, 19–20 November 2013; pp. 166–172. [Google Scholar]
  78. Lehtola, V.V.; Kaartinen, H.; Nüchter, A.; Kaijaluoto, R.; Kukko, A.; Litkey, P.; Honkavaara, E.; Rosnell, T.; Vaaja, M.; Virtanen, J.P.; et al. Comparison of the selected state-of-the-art 3D indoor scanning and point cloud generation methods. Remote Sens. 2017, 9, 796. [Google Scholar] [CrossRef]
  79. Aderhold, A.; Jung, Y.; Wilkosinska, K.; Fellner, D.W. Distributed 3D Model Optimization for the Web with the Common Implementation Framework for Online Virtual Museums. In Proceedings of the IEEE Digital Heritage International Congress (DigitalHeritage), Marseille, France, 28 October–1 November 2013; pp. 719–726. [Google Scholar] [CrossRef]
  80. Puhos: Take a Look Around a Corner of Multicultural Finland under Threat. Available online: https://yle.fi/uutiset/3-9891239 (accessed on 25 October 2018).
  81. FARO SCENE. Available online: https://www.faro.com/products/construction-bim-cim/faro-scene/ (accessed on 31 January 2019).
  82. Photoshop Lightroom. Available online: https://www.adobe.com/products/photoshop-lightroom.html (accessed on 1 February 2019).
  83. Horn, B.K. Closed-form solution of absolute orientation using unit quaternions. J. Opt. Soc. Am. 1987, 4, 629–642. [Google Scholar] [CrossRef]
  84. Besl, P.J.; McKay, N.D. Method for registration of 3-D shapes. In Proceedings of the SPIE Robotics ’91, Boston, MA, USA, 14–15 November 1991; pp. 586–607. [Google Scholar]
  85. Lague, D.; Brodu, N.; Leroux, J. Accurate 3D comparison of complex topography with terrestrial laser scanner: Application to the Rangitikei canyon (NZ). ISPRS J. Photogramm. Remote Sens. 2013, 82, 10–26. [Google Scholar] [CrossRef]
  86. Rueden, C.T.; Schindelin, J.; Hiner, M.C.; DeZonia, B.E.; Walter, A.E.; Arena, E.T.; Eliceiri, K.W. ImageJ2: ImageJ for the next generation of scientific image data. BMC Bioinform. 2017, 18, 529. [Google Scholar] [CrossRef] [PubMed]
  87. Minto, S.; Remondino, F. Online Access and Sharing of Reality-based 3D Models. Sci. Res. Inf. Technol. 2014, 4, 17–28. [Google Scholar] [CrossRef]
Figure 1. Test site: the Puhos shopping mall in Helsinki. Project area marked with a red circle. Image courtesy of the City of Helsinki.
Ijgi 08 00221 g001
Figure 2. The prepared TLS-based reference point cloud based on 43 scans and consisting total of 260,046,266 points.
Ijgi 08 00221 g002
Figure 3. The 3D reconstruction process in RealityCapture.
Ijgi 08 00221 g003
Figure 4. The resulting automatically created web-compatible 3D models: (a) photogrammetry; (b) TLS; and (c) hybrid.
Ijgi 08 00221 g004
Figure 5. Visual comparison of details in (a) photogrammetry; (b) TLS; and (c) hybrid approaches. The photogrammetry model suffers from blurred details, whereas the texture data of the TLS model suffers from clear overexposure. For visualization purpose, the models are visualized here as colored vertices without the textures.
Ijgi 08 00221 g005
Figure 6. Quality issues on the textured 3D models. The photogrammetry-based model (a) suffers from holes in the data in shiny and non-textured surfaces such as taped windows. In the TLS-based model (b) the lack of data underneath the scanning stations causes circular patterns in the texture. In addition, the illumination differences in the scene cause abrupt differences between the textured areas. Many of these problems are fixed in the hybrid model (c).
Ijgi 08 00221 g006
Figure 7. Ground floor surface deviations of all modeling approaches vs. the reference: (a) the photogrammetry approach; (b) the terrestrial laser scanning approach; and (c) the hybrid approach. The color scale for the M3C2 distance values is ±2.5 cm.
Ijgi 08 00221 g007
Figure 8. Distance values of the compared modeling approaches vs. the reference: photogrammetry (green), TLS (red) and hybrid (blue).
Ijgi 08 00221 g008
Figure 9. A histogram analysis including all 8-bit pixel values of all texture atlases for the three modeling approaches: photogrammetry (green), TLS (red) and hybrid (blue). The significant peak in the hybrid model (pixel value 95) is caused by a grey-colored empty space between the texture islands on the texture atlases. This has no perceivable impact on the visual quality of the model.
Ijgi 08 00221 g009
Figure 10. Results of the expert evaluation on visual quality for the three modeling approaches: photogrammetry (green), TLS (red) and hybrid (blue).
Ijgi 08 00221 g010
Figure 11. Visual comparison of the raw images of TLS (a) and photogrammetry (b). The raw TLS image (a) suffers clearly from overexposure. The quality of the image data is directly transferred into texture information in the content creation process.
Ijgi 08 00221 g011
Table 1. Features of open source and commercial automated 3D reconstruction software.
SoftwarePhotogrammetric 3D ReconstructionPoint Cloud Based 3D MeshingTexturing
3DF Zephyrxxx
CloudComparex
COLMAPx
Meshroomxx
Metashapexx
Pix4Dxx
RealityCapturexxx
SEQUOIAxx
Table 2. Specifications and parameters for the terrestrial laser scanning (TLS) campaign.
Scanner SpecificationsFaro Focus 3D S120/Trimble TX5
Scan rate976,000 points/s
Range0.6–120 m
Ranging error±2 mm at 10 m (90% reflectivity)
Ranging noise0.6 mm at 10 m (90% reflectivity)
Total image resolutionUp to 70 Mpix
Scan Parameters
Scanning resolution setting12 mm at 10 m (one with 6 mm at 10 m)
Number of scan stations22/21
Table 3. Specifications and parameters for close-range photogrammetric imaging.
Camera SpecificationsNikon D800E
Image resolution7360 × 4912 (36 Mpix)
Sensor sizeFull frame (35.9 × 24 mm)
LensNikkor AF-S 14–24 mm f/2.8 G the focus and zoom locked at 14 mm
Focal length (fixed)14 mm
F-stop (fixed)f/8
Number of images433
Image file formatNEF (Nikon Electronic File)
Table 4. An overview of the modeling approaches during data processing in RealityCapture.
AlignmentPhotogrammetryTLSHybrid
Total input data file size6.5 GB21.1 GB27.6 GB
Number of automatically registered images306/433-363/433
Number of automatically registered laser scans-43/4343/43
Number of tie points1,234,1161,514,4542,628,226
Mean projection error (pixels)0.416Not applicable 10.429
Metric scaleNoYesYes
Reconstruction
Number of vertices193,590,937159,837,170347,794,658
Number of polygons386,145,064318,875,950693,603,980
Final web-compatible models
Number of vertices249,380232,146227,664
Number of polygons500,000500,000500,000
Number of 4k textures101010
1 TLS scan data was registered in the pre-processing phase and set as “exact” in RealityCapture.
Table 5. Computing times for each model from pre-processed and aligned data into web-compatible textured mesh models.
PhotogrammetryTLSHybrid
Meshing time07 h: 07 min: 50 s00 h: 43 min: 06 s19 h: 51 min: 23 s
Texturing time00 h: 22 min: 15 s00 h: 01 min: 51 s00 h: 34 min: 15 s
Total time07 h: 30 min: 05 s00 h: 44 min: 57 s20 h: 25 min: 38 s
Table 6. Summary of the ground floor surface deviation analysis.
PhotogrammetryTLSHybrid
Mean distance (signed)0.41 mm−0.15 mm−0.05 mm
Std. dev.6.20 mm2.72 mm3.18 mm
Number of observations35,89720,10420,741
Table 7. Summary of the image histogram analysis.
PhotogrammetryTLSHybrid
Mean (8-bit)92126100
Std. dev. (8-bit)435949
Mode (8-bit)79254 195
Number of black pixels15331,768,5274921
Number of white pixels16093,864,622909,088
Percentage of black pixels0.00091%1.05%0.0029%
Percentage of white pixels0.00096%2.30%0.54%
1 The 8-bit value of 254 appears as the maximum pixel value in the resulting texture images generated in RealityCapture.

