Article

Evacuation Planning Optimization Based on a Multi-Objective Artificial Bee Colony Algorithm

by
Olive Niyomubyeyi
1,2,*,
Petter Pilesjö
1,3 and
Ali Mansourian
1,3
1
Department of Physical Geography and Ecosystem Science, Lund University, SE-221 00 Lund, Sweden
2
Center for Geographic Information System and Remote Sensing, College of Science and Technology, University of Rwanda, Kigali 4285, Rwanda
3
Center for Middle Eastern Studies, Lund University, SE-221 00 Lund, Sweden
*
Author to whom correspondence should be addressed.
ISPRS Int. J. Geo-Inf. 2019, 8(3), 110; https://doi.org/10.3390/ijgi8030110
Submission received: 26 November 2018 / Revised: 13 February 2019 / Accepted: 24 February 2019 / Published: 28 February 2019

Abstract

:
Evacuation is an important activity for reducing the number of casualties and amount of damage in disaster management. Evacuation planning is tackled as a spatial optimization problem. The decision-making process for evacuation involves high uncertainty, conflicting objectives, and spatial constraints. This study presents a Multi-Objective Artificial Bee Colony (MOABC) algorithm, modified to provide a better solution to the evacuation problem. The new approach combines random swap and random insertion methods for neighborhood search, the two-point crossover operator, and the Pareto-based method. For evacuation planning, two objective functions were considered to minimize the total traveling distance from an affected area to shelters and to minimize the overload capacity of shelters. The developed model was tested on real data from the city of Kigali, Rwanda. From computational results, the proposed model obtained a minimum fitness value of 5.80 for capacity function and 8.72 × 10⁸ for distance function, within 161 s of execution time. Additionally, in this research we compare the proposed algorithm with Non-Dominated Sorting Genetic Algorithm II and the existing Multi-Objective Artificial Bee Colony algorithm. The experimental results show that the proposed MOABC outperforms the current methods both in terms of computational time and better solutions with minimum fitness values. Therefore, developing MOABC is recommended for applications such as evacuation planning, where a fast-running and efficient model is needed.

1. Introduction

The increase in the frequency of natural disasters such as earthquakes, landslides, and floods is becoming a critical problem globally due to their effects on humans and the environment [1]. The total deaths from natural disasters recorded worldwide between 2006 and 2016 was 1.2 million, twice that from the 1990s [2]. Thus, there is an obvious need to efficiently plan evacuation as a strategy, among others, to handle emergency situations and reduce disaster risks.
Evacuation plans are developed to ensure the safety of affected people by efficiently and quickly moving them away from dangerous places to safe places in order to reduce the loss of life and damage. However, evacuation planning is a complex process, involving many stakeholders and management aspects. In disaster management, evacuation planning is tackled as a Multi-Objective Optimization Problem (MOOP) with consideration of the spatial component [3,4,5,6]. Many studies presented multi-objective evacuation models [7,8,9], in which the main goal of the models was to find the best alternatives for allocating facilities and the optimal distribution of the affected population to appropriate safe places (also called “shelters”). These models often involve multiple conflicting criteria and objectives, such as distance and distribution to shelters; by optimizing one of the criteria or objectives, the other criteria or objectives are assigned inappropriate values.
Recently, Multi-objective Optimization Methods (MODM) integrated with Geographical Information Systems (GIS) were introduced to provide better solutions for spatial optimization problems [10,11]. The most used approaches can be classified into two categories: exact methods and metaheuristics methods [12,13,14]. The exact methods, including goal programming, linear programming, weighting, and constraint methods, are the oldest and traditional methods. These methods transform an MOOP into a scalar problem and solve it as a single optimization problem [15,16]. For example, Coutinho-Rodrigues et al. [16] presented a multi-objective approach for an urban location/routing problem using a mixed-integer linear programming model. Furthermore, Horner et al. [17] and Kocatepe et al. [18] designed a GIS-based network optimization approach for siting medical special needs hurricane relief shelters and used the GIS-based spatial p-median optimization technique to solve the evacuation and sheltering of pets and the human population with special needs in the state of Florida, United States of America (USA). Although exact methods guarantee finding an optimal solution, the results are highly dependent on the knowledge of experts who assign weights to the criteria. Having limited knowledge about the criteria and their effects or being biased toward some preferences both make the final result unreliable.
Unlike exact methods, metaheuristic algorithms are known to be efficient for solving more complex problems by providing a set of optimal solutions in a reasonable amount of time [13], without being influenced by the preferences of experts. Although they do not guarantee finding global optimal solutions, metaheuristic algorithms iteratively improve the feasible solutions through several heuristic techniques. A heuristic is an approach based on the rules, strategies, or ad hoc procedures to solve an optimization problem [19]. Many metaheuristics are inspired by natural processes. For example, Evolutionary Algorithms (EAs) and Swarm Intelligence algorithms (SIs) solve problems by mimicking the behavior of natural species or the rules of natural phenomena [20,21]. In the spatial optimization domain, many studies applied these techniques due to their potential to optimize multiple and conflicting objectives and provide non-dominated solutions as outputs [13]. These methods include Multi-objective linear programming [22], Genetic Algorithm (GA) [23,24,25,26], Particle Swarm Optimization (PSO) [27], Ant Colony Optimization (ACO) [28], Tabu Search [29,30], and the Artificial Bee Colony (ABC) [31]. Of these, Multi-Objective ABC is less used and tested in comparison to other techniques, mainly due to its relatively recent introduction.
Many studies on evacuation planning applied metaheuristics and mostly EAs [4,32,33]. For instance, Garrett et al. [34] used GAs to address the problem of evacuation planning to find optimal door locations for a building. Saadatseresht et al. [4] proposed multi-objective optimization for evacuation planning using Non-Dominated Sorting Genetic Algorithm II (NSGA-II). Georgiadou et al. [35] used an Evolutionary Algorithm to optimize the response to an emergency situation such as a major accident. For SIs, Hu et al. [36] and Xu et al. [37] applied modified PSO algorithms to find the optimal allocation of earthquake emergency shelters. A massive pedestrian evacuation problem was solved using a Multi-Objective ACO [38]. The proposed approach efficiently minimized three objective functions including total evacuation time, total routes risk degree, and total crowding degree. Saeidian et al. [39] proposed an approach to solve location allocation of earthquake relief centers using PSO, ACO, and Technique for Order of Preference by Similarity to Ideal Solution (TOPSIS) models, and GIS.
ABC, proposed by Karaboga [40], is another metaheuristic algorithm that mimics the foraging behavior of honey bees in nature. The ABC is reported to be an efficient algorithm for solving optimization problems with a single objective function, and it was applied in many fields [41]. The standard ABC was modified and improved for better performance in solving different problems [31,42,43,44], which includes developing and modifying the MOABC to solve multi-objective problems [43,45]. With this in mind, in this paper, we used and modified MOABC and propose a model for evacuation planning. One of the main issues with MOABC that influences evacuation planning is trapping into local optimum solutions. We addressed the issue by modifying the neighborhood strategies for local search, as well as testing and adopting selection strategies to choose from among the variety of existing strategies [12].
Our aim for evacuation planning was to find the optimal distribution of evacuees to safe places. To solve this problem, two conflicting objective functions to be minimized were defined. The model was tested and evaluated in Kigali, the capital of Rwanda.
This paper is organized as follows: Section 2 briefly introduces the concept of the Multi-Objective Optimization Problem, the mathematical model of evacuation problem, and the ABC algorithm. Section 3 describes the proposed MOABC approach in detail. Section 4 presents a case study and data preparation. Experimental results are provided and discussed in Section 5. The conclusions and recommendations are presented in Section 6.

2. Theoretical Background

2.1. Multi-Objective Optimization Problem

The MOOP is defined as the problem of finding a vector for decision variables that satisfies constraints and optimizes a vector function, whose elements represent the objective functions. These functions form a mathematical description of performance criteria, which usually conflict with each other. Hence, the term “optimize” means finding a solution that would provide acceptable values for all objective functions to the decision-maker [46]. This statement can be formally defined as minimize or maximize as follows:
F ( x ) = { f 1   ( x ) ,   f 2   ( x ) , f n   ( x ) } ,   subject   to : x X ,
where F(x) is the n-dimension objective function, fk (x) is an objective function (k = 1, 2, …, n), X is the set of feasible alternatives, and x = (x1, x2, …, xm) is a vector of decision variable, xi ≥ 0, for i = 1, 2, …, m [12,46].
Based on this definition of MOOP, some definitions concerning basic terminology are adopted in this research.
Decision variables are controllable parameters whose values can be controlled by decision-makers, which affect functioning of the system. These independent variables can be denoted as x j ,   j = { 1 , 2 , , n } . Then, a decision vector X containing n decision variables can be X = { x 1 , x 2 , , x n } T .
A feasible solution is a solution with vector x (set of values of decision variables) that satisfies all constraints. An optimal solution is one that provides the best trade-off between competing objectives among all feasible solutions.
The objective function is the actual goal of the problem; it is a cost function if it must be minimized or a profit function if it must be maximized. The fitness function is a measure of the quality or fitness of the solution to the objective function.
In MOOPs, the aim is to find good compromises (or trade-offs) among objectives rather than a single solution as in single objective optimization. The concept of Pareto optimality allows the evaluation of all trade-offs among optimal combinations of multiple criteria/objectives. A solution x* is called Pareto optimal if it is not dominated by any other member of solution set.
Given a set of multi-objective solutions, the non-dominated set of entire feasible solutions is called the Pareto-optimal set. The boundary defined by the set of all points mapped from the Pareto optimal set is called the Pareto-optimal front.

2.2. Mathematical Model for Evacuation Planning

Assume that, in a region prone to natural hazards such as floods and landslides, B represents the building blocks of residential or commercial and N represents candidate shelters for emergency rescue. Each B contains a certain number of people to be evacuated to N shelters. The task for the planner is to find the appropriate allocation of people from B to the N with consideration of some conflicting objective functions. Most of the objectives are minimizing the total capacity constraints violations of the shelters and minimizing the total evacuation distance to the assigned shelter. These criteria were considered in previous studies [4,16,32,37]. The following are expressions used in this research for each objective function [4]:
The function to minimize the total evacuation distance (fdistance) is
f d i s t a n c e = j = 1 n i = 1 m d i j   p i j .
The function to minimize the total capacity constraints violation values (fcapacity) is
f c a p a c i t y = j = 1 n | i = 1 m p i j c j 1 | ,
where m represents the number of decision variables (building blocks), n is the number of safe areas (shelters), dij is the distance between the ith point of origin and the jth safe area, pij is the population in the ith point of origin being evacuated to the jth safe area, and cj is the capacity of the jth safe area for receiving people.
Based on the defined spatial optimization problem in Equations (2) and (3), the safe area and building blocks are assigned as follows [4]: objective function (fdistance) determines building blocks with a greater population have priority to be assigned to the nearest safe area. Thus, more people can reach the safe areas in the shortest possible time. Objective function (fcapacity) determines the total population assigned to each safe area should be equal to or less than its capacity. The absolute sign for fcapacity indicates whether the total population of evacuees is more than the total capacity of the safe areas. The excess should be divided among the safe areas while trying to minimize the overload capacity for each safe area.

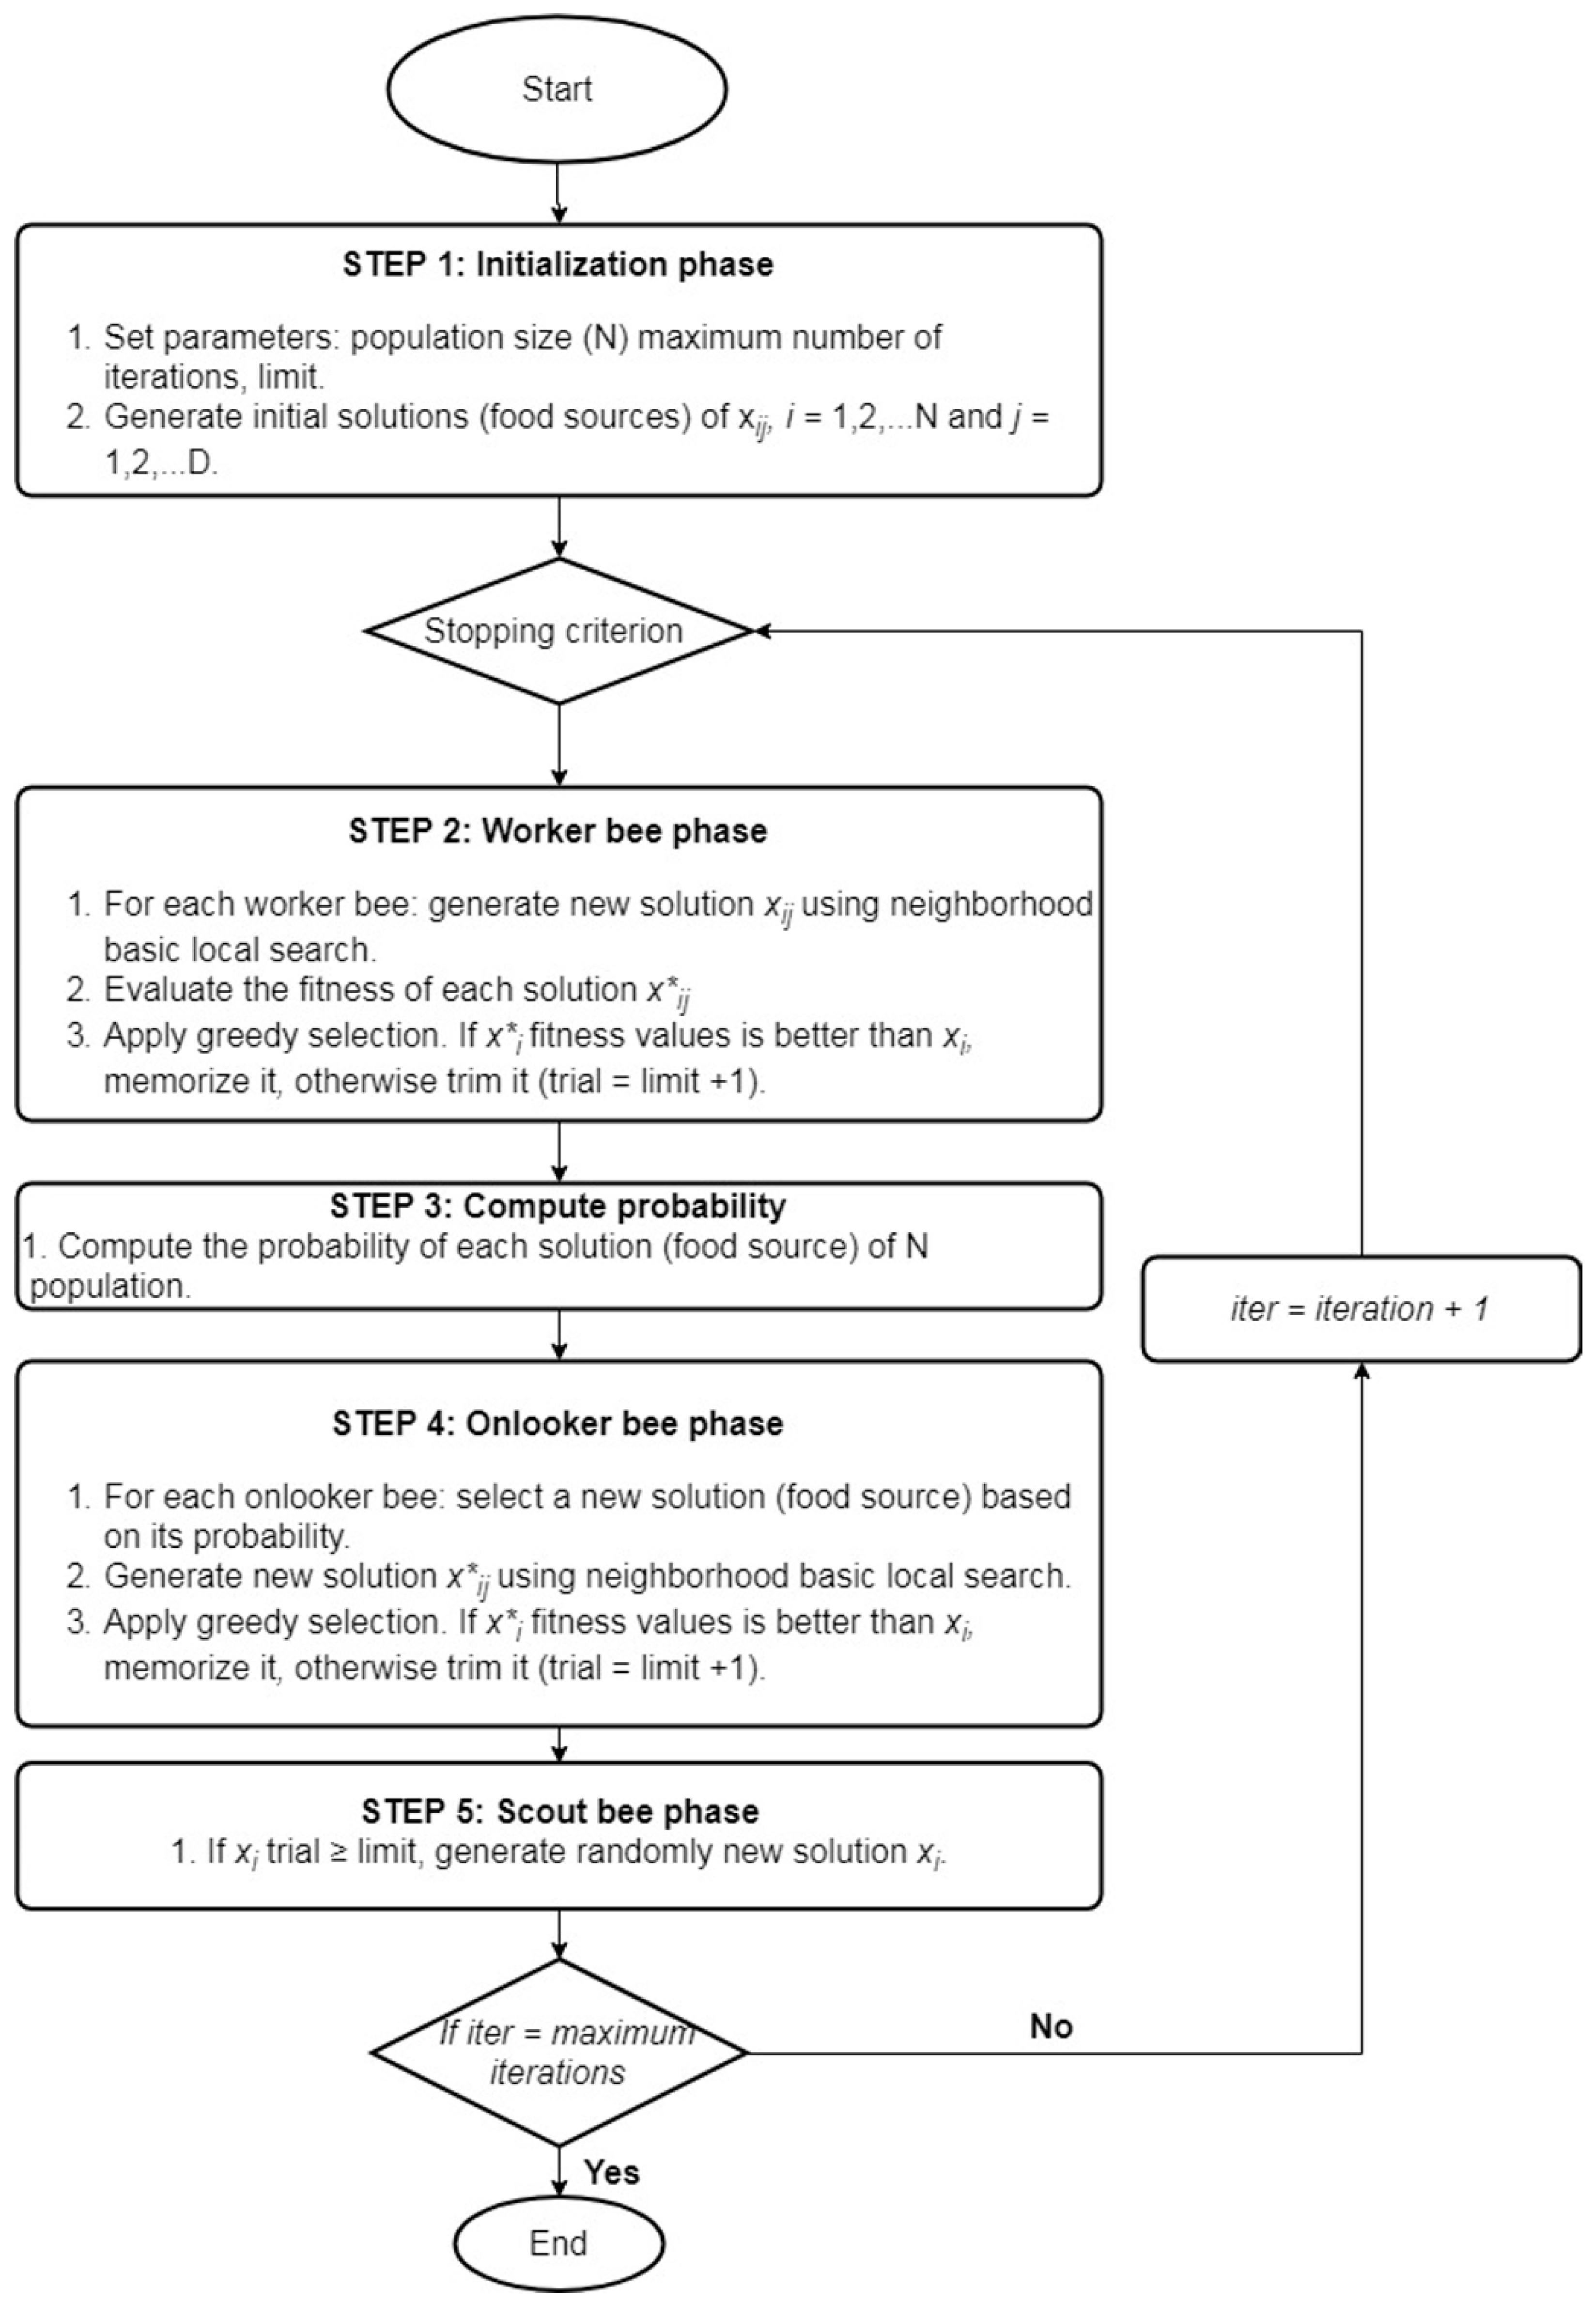
2.3. Introduction to Artificial Bee Colony Algorithm

In the ABC algorithm, a feasible solution of an optimization problem is represented as the food source with the amount of nectar (fitness). In our case, the optimization model is a minimization of two objectives. Therefore, the fitness of a feasible set of solutions is evaluated through a trade-off between the values of two objectives. Figure 1 shows the main steps for the ABC algorithm.
The ABC optimization mechanism involves three essential artificial bees being involved in the search process for food sources around the hive: scouts, worker, and onlooker bees. They collaborate with each other to optimize the problem and converge the solutions to the optimal solution. Initially, the worker bee searches for food around the food source and shares the searched food source information with the onlooker bees using a waggle dance. The neighborhood strategy computed in Equation (4) permits a worker bee to migrate from its old position to find a new food source. The best food source with the highest quality of nectar or fitness is selected by onlooker bees, which have high probability computed by Equation (5). Onlooker bees perform a local search to find the optimal solution based on the probability of each food source being selected, computed with Equation (6). Through the evaluation of fitness, a food source with low-quality fitness is abandoned, and the corresponding worker bee becomes a scout bee. The scout bee randomly carries out a global search for a new food source. A scout bee memorizes the information about the new food source and turns into a worker bee. The search process is repeated until the given criteria is met (maximum number of iterations).
x i d = l b d + r a n d ( 0 , 1 ) × ( u b d l b d ) ,
v i d = x i d + Ø i d × ( x i d x k d ) ,
p i = f i t i i = 1 s n f i t i ,
where i = 1, 2, 3, …. n represents an index of a food source with the range N of the size of the population; d = 1, 2, 3, …, D is the dimension index of the problem; ub and lb represent the lower and upper bounds of the dimension of the problem, respectively; rand (0, 1) is a generated random distributed value between 0 and 1; Øid is a real number selected randomly from the interval [−1, 1]; K is the index of food sources, which is different from i; Pi is a probability of the ith food source being selected by an onlooker bee; fiti is the fitness; and SN is the number of food sources. In ABC, the numbers of worker bees and onlookers are equal to SN (half of the N population): N = 2 × S N .

3. Methodology

3.1. Modified ABC Algorithm for Multi-Objective Evacuation Problem

The original ABC algorithm was designed to solve continuous optimization problems with a single objective function [40]. In order to solve a MOOP and handle the discrete multi-objective evacuation model defined above, some modifications were made based on ABC. Several studies extended the original ABC algorithm to address MOOPs [47,48,49]. Most of these studies concentrated on the use of Pareto-based approaches to optimize the multi-objective problem; however, fewer studied the improvement in the local search performance of ABC.
Aiming at the limitations and weaknesses of the traditional ABC to solve MOOPs, we applied three strategies and adopted a Pareto-based approach to improve the suitability of ABC for an MOABC-based evacuation problem, as shown in Figure 2. Firstly, a discrete random procedure was used for solution presentation and initialization. Secondly, random swap (RS) and random insertion (RI) neighborhood strategies were combined to improve the neighborhood search of worker and onlooker bees. This combination solved the issue of solutions being trapped in a local optimum that exists in the ABC algorithm. This is an important improvement in global optimization problems, such as the shelter allocation problem addressed in this research. Thirdly, the crossover operator of two points was used to enhance the communication among worker bees; hence, the number of best solutions to be selected for the next generation increases. Finally, Pareto-based approaches select non-dominated solutions based on the concepts of Pareto dominance. This approach ranks the solutions into Pareto-front levels based on their fitness values. For minimization problems, the lower the front level is, the better the optimal solutions will be. In MOABC, we applied the tournament selection technique to increase the pressure on the selection of onlooker bees. The benefit of using tournament selection is avoiding the problems of generating super-fit or super-poor solutions, where the selection of a better solution at each iteration does not improve the quality of the solutions.

3.2. Encoding and Initialization of Solutions

In the original ABC, the initial population is generated using Equation (4). In this study, the integer-encoding method and random procedure were used to create a set of initial solutions. As in a genetic algorithm, we structured an artificial bee (solution) as a chromosome [50]. An array of two dimensions was created to store a candidate bee and its fitness. Decision variables are represented by an index of B building blocks. In order to determine the elements of the array, a random integer was generated between 1 as the minimum value and N as a maximum value for a candidate shelter. According to its capacity, one candidate shelter can accommodate multiple B building blocks; thus, the repeated number in our solution was accepted.
After initialization, solutions were evaluated and ranked on the Pareto front using a non-dominated sorting approach [51]. The best solutions found were stored in the external archive. Figure 3 shows an example of a simulated solution generated with a length of 10 building blocks (index B) and a random integer generated between 1 and 4 as the number of shelters, randomly assigned to each B.

3.3. Neighborhood Search Strategies

According to the original ABC algorithm, the movement of a worker bee is calculated using a neighborhood search strategy, presented in Equation (5), to find the new position. To facilitate the applicability of MOABC to the evacuation model, a combination of two search strategies is proposed: RS and RI neighborhood operators (Figure 4). The random swap operator changes the index of the two candidate shelters chosen from the sequence, and random index i must differ from random index j (i.e., i = 1 and j = 4, ij). A random insertion operator adds a randomly chosen candidate shelter to a randomly chosen index of the building block and shifts the rest of the sequence; the index i must differ from j.

3.4. Crossover Operator

In the original ABC, worker bees perform a local search to find a new food source and update the existing food source position by applying the greedy selection process. For evacuation-based MOABC, a bee carries the candidate shelter assigned to each candidate building block. In this case, a bee with a better solution carries a better combination, and should share this information with other worker bees. Using only the neighborhood operator risks the worker bee being trapped in a local optimum area. Therefore, we applied a crossover operator for sharing information. Each worker bee (parent 1) of population N randomly selects another worker bee (parent 2), and based on the rate probability of crossover, exchange of information is controlled, as shown in Figure 5. Subsequently, the new solutions (child 1 and child 2; Figure 5) are evaluated and compared with the old solution. The better solution will be memorized by the population.

3.5. Selection of Onlooker Bees

Onlooker bees probabilistically choose their food sources depending on information provided by worker bees [41]. The probability of each food source is calculated based on its amount of fitness. Thus, the onlooker bee can select a better solution based on its probability, meaning that a food source with a high amount of fitness has a high chance of being selected. In this case, a neighboring solution is randomly selected to be mutated.
We propose using tournament selection for MOABC. In this selection process, three food sources are randomly selected from the population and onlooker bees will fly to the food source that has the highest fitness. After the selection, each onlooker bee performs a similar neighborhood search as worker bees and will produce a new food source. The fitness of the old food source and that of the new one are compared, and the best will be memorized.

3.6. Exploration of the Scout Bees

The scout bees are worker bees that were not optimized in the given maximum limit. This phase increases the population diversity and avoids the local minima issue. A scout bee is randomly generated. If the new food source is better than the existing one, then a new food source is added to an external archive. In MOABC, a scout bee generates a new solution using a neighborhood operator in order to avoid the decrease in the search focus in the neighborhood search.

3.7. Pareto Optimization for Evaluation Fitness

The aim of the MOABC algorithm is to find a set of solutions that simultaneously minimize the two defined objective functions. The assessment of the best and worse solutions is based on the assigned fitness. In this study, a non-dominated sorting algorithm introduced by Deb et al. [51] was used to rank the solutions into several levels according to their fitness values.
The algorithm is terminated when a specified number of iterations are met. The algorithm returns a final set of non-dominated solutions found by three types of artificial bees stored in an external archive that is updated at every generation. This set of the solution, also called the Pareto optimal set, represents the best alternatives for allocating people from building blocks to the appropriate candidate shelters. A trade-off between the objective values of the two optimized objectives enables an analysis of the results for decision-making.

4. Case Study

The city of Kigali is rapidly growing in both population and urbanization, with 1,318,000 inhabitants on an area of 370 km2 [52]. The city is characterized by steep hills separated by valleys. Due to its landscape and intense rainfall, many areas of the city are prone to floods and landslides [53]. Both landslides and flood disasters in Kigali caused a total of 64 deaths, 7953 injured people, and 280 houses destroyed between 2005 and 2013 [54]. An evacuation planning process is relatively nonexistent. Thus, evacuation planning is much needed in Kigali.
The present study was conducted on an area of 690 ha. The case study area has 1510 blocks with 176,741 inhabitants (Figure 6). The population data were provided by National Institute Statistics of Rwanda [52].

4.1. Input Data Preparation

In order to solve the given problem, the algorithm requires three types of data. In this case, GIS was used for data preparation and analysis of the spatial data. Firstly, the building blocks were used as the point of origin of the evacuees, along with its coordinates and population count. Secondly, the safe areas were the points of destination along with its coordinates and its capacity. Finally, the shortest distance between each building block and safe area was also required. The calculation process using these data is provided below.

4.1.1. Safe Area Selection and Capacity Computation

Emergency shelters are the most important facilities in the development of evacuation models for disaster management [55]. Therefore, in this model, the appropriate safe area facilities were determined to serve as shelters. As identified by the Sphere project [56], the minimum standards of living space per person must be respected in order to limit the crowd to safe areas.
In tropical and warm climates, 3.5 m2 of covered living space per person is considered adequate, excluding cooking and hygiene facilities [56]. Safe areas considered as rescue locations in the study area were determined by setting some criteria based on the international standards of evacuation planning of flood and landslide hazards. By using GIS tools and functions, we selected some open spaces, schools, and churches that met the suitability criteria. The criteria included being located outside of any zone prone to any disaster, being located on low slopes, and having access to resources including water sanitation, food, electricity, and toilets. Therefore, 10 places were selected, with the capacity of hosting 134,462 people. The estimation of 3.5 m2/person was used to limit the crowding density within safe areas. Figure 6 shows the case study area (a) and the 10 shelter areas (b).

4.1.2. Distance Matrix

The shortest distance between each building block and all safe areas was generated using a GIS network analysis tool in ArcGIS (Esri, Redlands, CA, USA). The Origin–Destination Cost Matrix tool and road network from Open Street Map (OSM) (OpenStreetMap Foundation, Cambridge, UK) were used to compute the short path.

5. Results and Discussion

This section provides the experimental results and analysis used to evaluate the performance of the proposed MOABC algorithm tested on an evacuation model. The library of Distributed Evolutionary Algorithms (DEAP) in Python (Python Software Foundation, Wilmington, DE, USA) [57] was used to facilitate the initialization of population and fitness assignment. Numpy and Matplotlib were used to manipulate arrays, calculate some statistics, and plot the results. GIS was used for data preparation and result visualization.

5.1. Parameter Setting

In order to obtain better results from the implemented MOABC algorithm, some parameters needed to be adjusted: population size, limit, and the maximum number of iterations. The maximum number of iterations was set to 500. In order to determine the population size (N) for the proposed algorithm for the multi-objective evacuation model, different values of population (20, 40, 60, and 80) were evaluated. Table 1 shows the selected parameters for MOABC. Through several tests, the best quality solution was found when the population size was greater than or equal to 20 (N ≥ 20). Large population size when N ≥ 80 impacted convergence speed and returned a small number of solutions in the final Pareto front. Figure 7a shows that the Pareto optimal front was best when the population size was 20. As the population size increased, the computation time increased as well, and the convergence of solutions slowed. Thus, a population size greater than 80 was not adopted here.
The maximum number of worker bees to be improved is another sensitive parameter for the proposed MOABC algorithm. If the limit parameter is set to a small value (i.e., limit = N), a solution is easily abandoned even if it has the potential to be improved. A low limit also influences the scouts to generate several random searches, which increases the diversity among the best solutions and the repetition of new solution generation leads to long computation time for the algorithm. Therefore, we tested when the limit value was low (limit = N) and high (limit = N × D and N × D × 100). Figure 7b shows the better Pareto optimal front and the convergence speed when a large number was obtained by N × D × 100. N represents the size of the population and D represents the dimension of the problem.
The crossover probability is used to adjust the exploitation of worker bees. A high crossover probability value affects the structure of the Pareto optimal front, whereas a low value increases the diversity but produces a better Pareto optimal front. Figure 7c shows that, when the crossover probability value was 1, several solutions were non-dominated compared to the Pareto front corresponding to a crossover probability of 0.5, but the structure of the optimal Pareto front was destroyed. The results of the tests differed little when the crossover probability value ranged from 0.6 to 0.8. Thus, the value of 0.5 was set as the best for crossover probability for MOABC.
Using tournament selection for onlooker bees to choose which food source to exploit can control the competition pressure. The larger tournament size influences the high probability of food source to be chosen, while the small tournament size influences the food source to be rejected. As Figure 7d shows, a tournament size of 3 produced the best Pareto optimal front. In order to limit the computing process time and maintain the convergence of MOABC, the maximum iterations were set to 500.

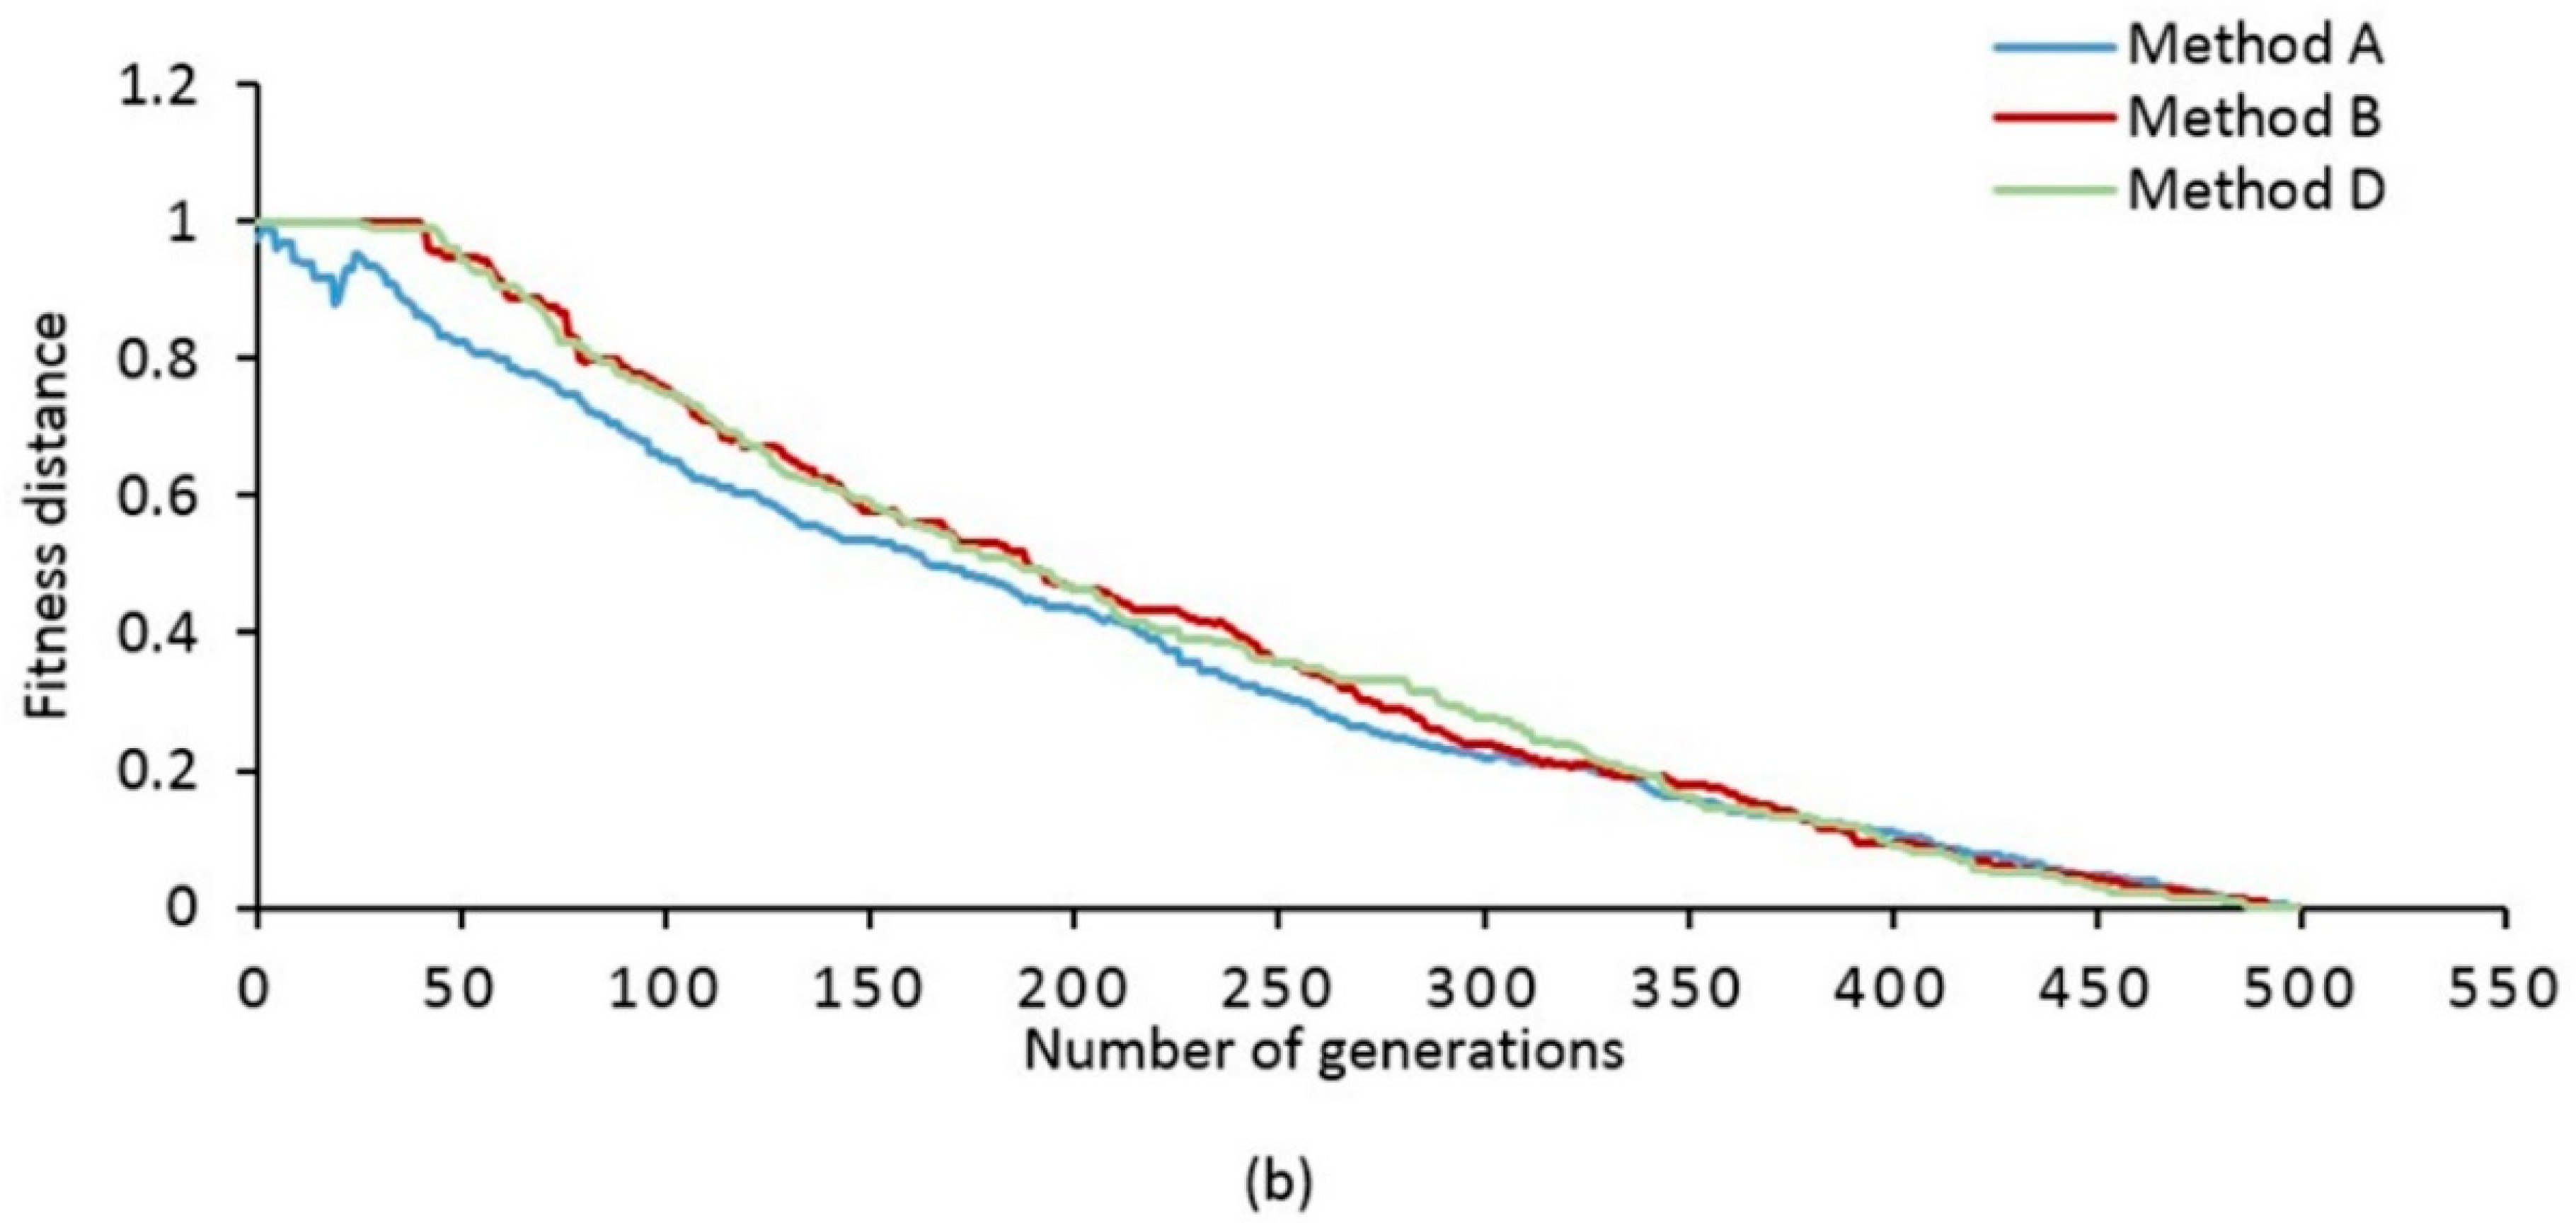
5.2. Effectiveness of Combining Neighborhood Search Random Swap and Random Insertion and Crossover Operator for MOABC

Table 2 shows the experimental results obtained from different tested methods A, B, C, and D. A represents the MOABC algorithm with the combination of RS and RI, while B represents MOABC using local basic search as introduced in the original ABC algorithm, and C and D represent MOABC with and without a crossover operator, respectively. The parameter settings given in Section 5.1 were used to run all tests of these algorithms. From this table, the final Pareto front size, capacity function fitness values, distance function fitness values, and execution time reveal the performance of the different tested methods. Method A produced a large number of solutions in the final Pareto front within an acceptable time, whereas Method B produced fewer solutions and increased the computation time.
The crossover operation calibrates the local optima search and prevents the best solutions from being trapped in local optima as demonstrated in Figure 8. Figure 8 illustrates the Pareto front size obtained by the three tested methods (the non-dominated solutions) in each generation. The optimal solution of Method A varied significantly from one generation to another. This variation of Pareto front size is influenced by the neighborhood search process that randomly swaps two individuals and simultaneously inserts two new random values in the length of the solutions. This modification improves the position of worker and onlooker bees from local to global optimization. A, B, and D comparisons are demonstrated in Figure 8. Method C produced the same results as Method A. Figure 9 shows the minimization function of two objectives that started to achieve approximately the optimum value by the 450th generation. Both objective functions distance and capacity were well minimized by method A.

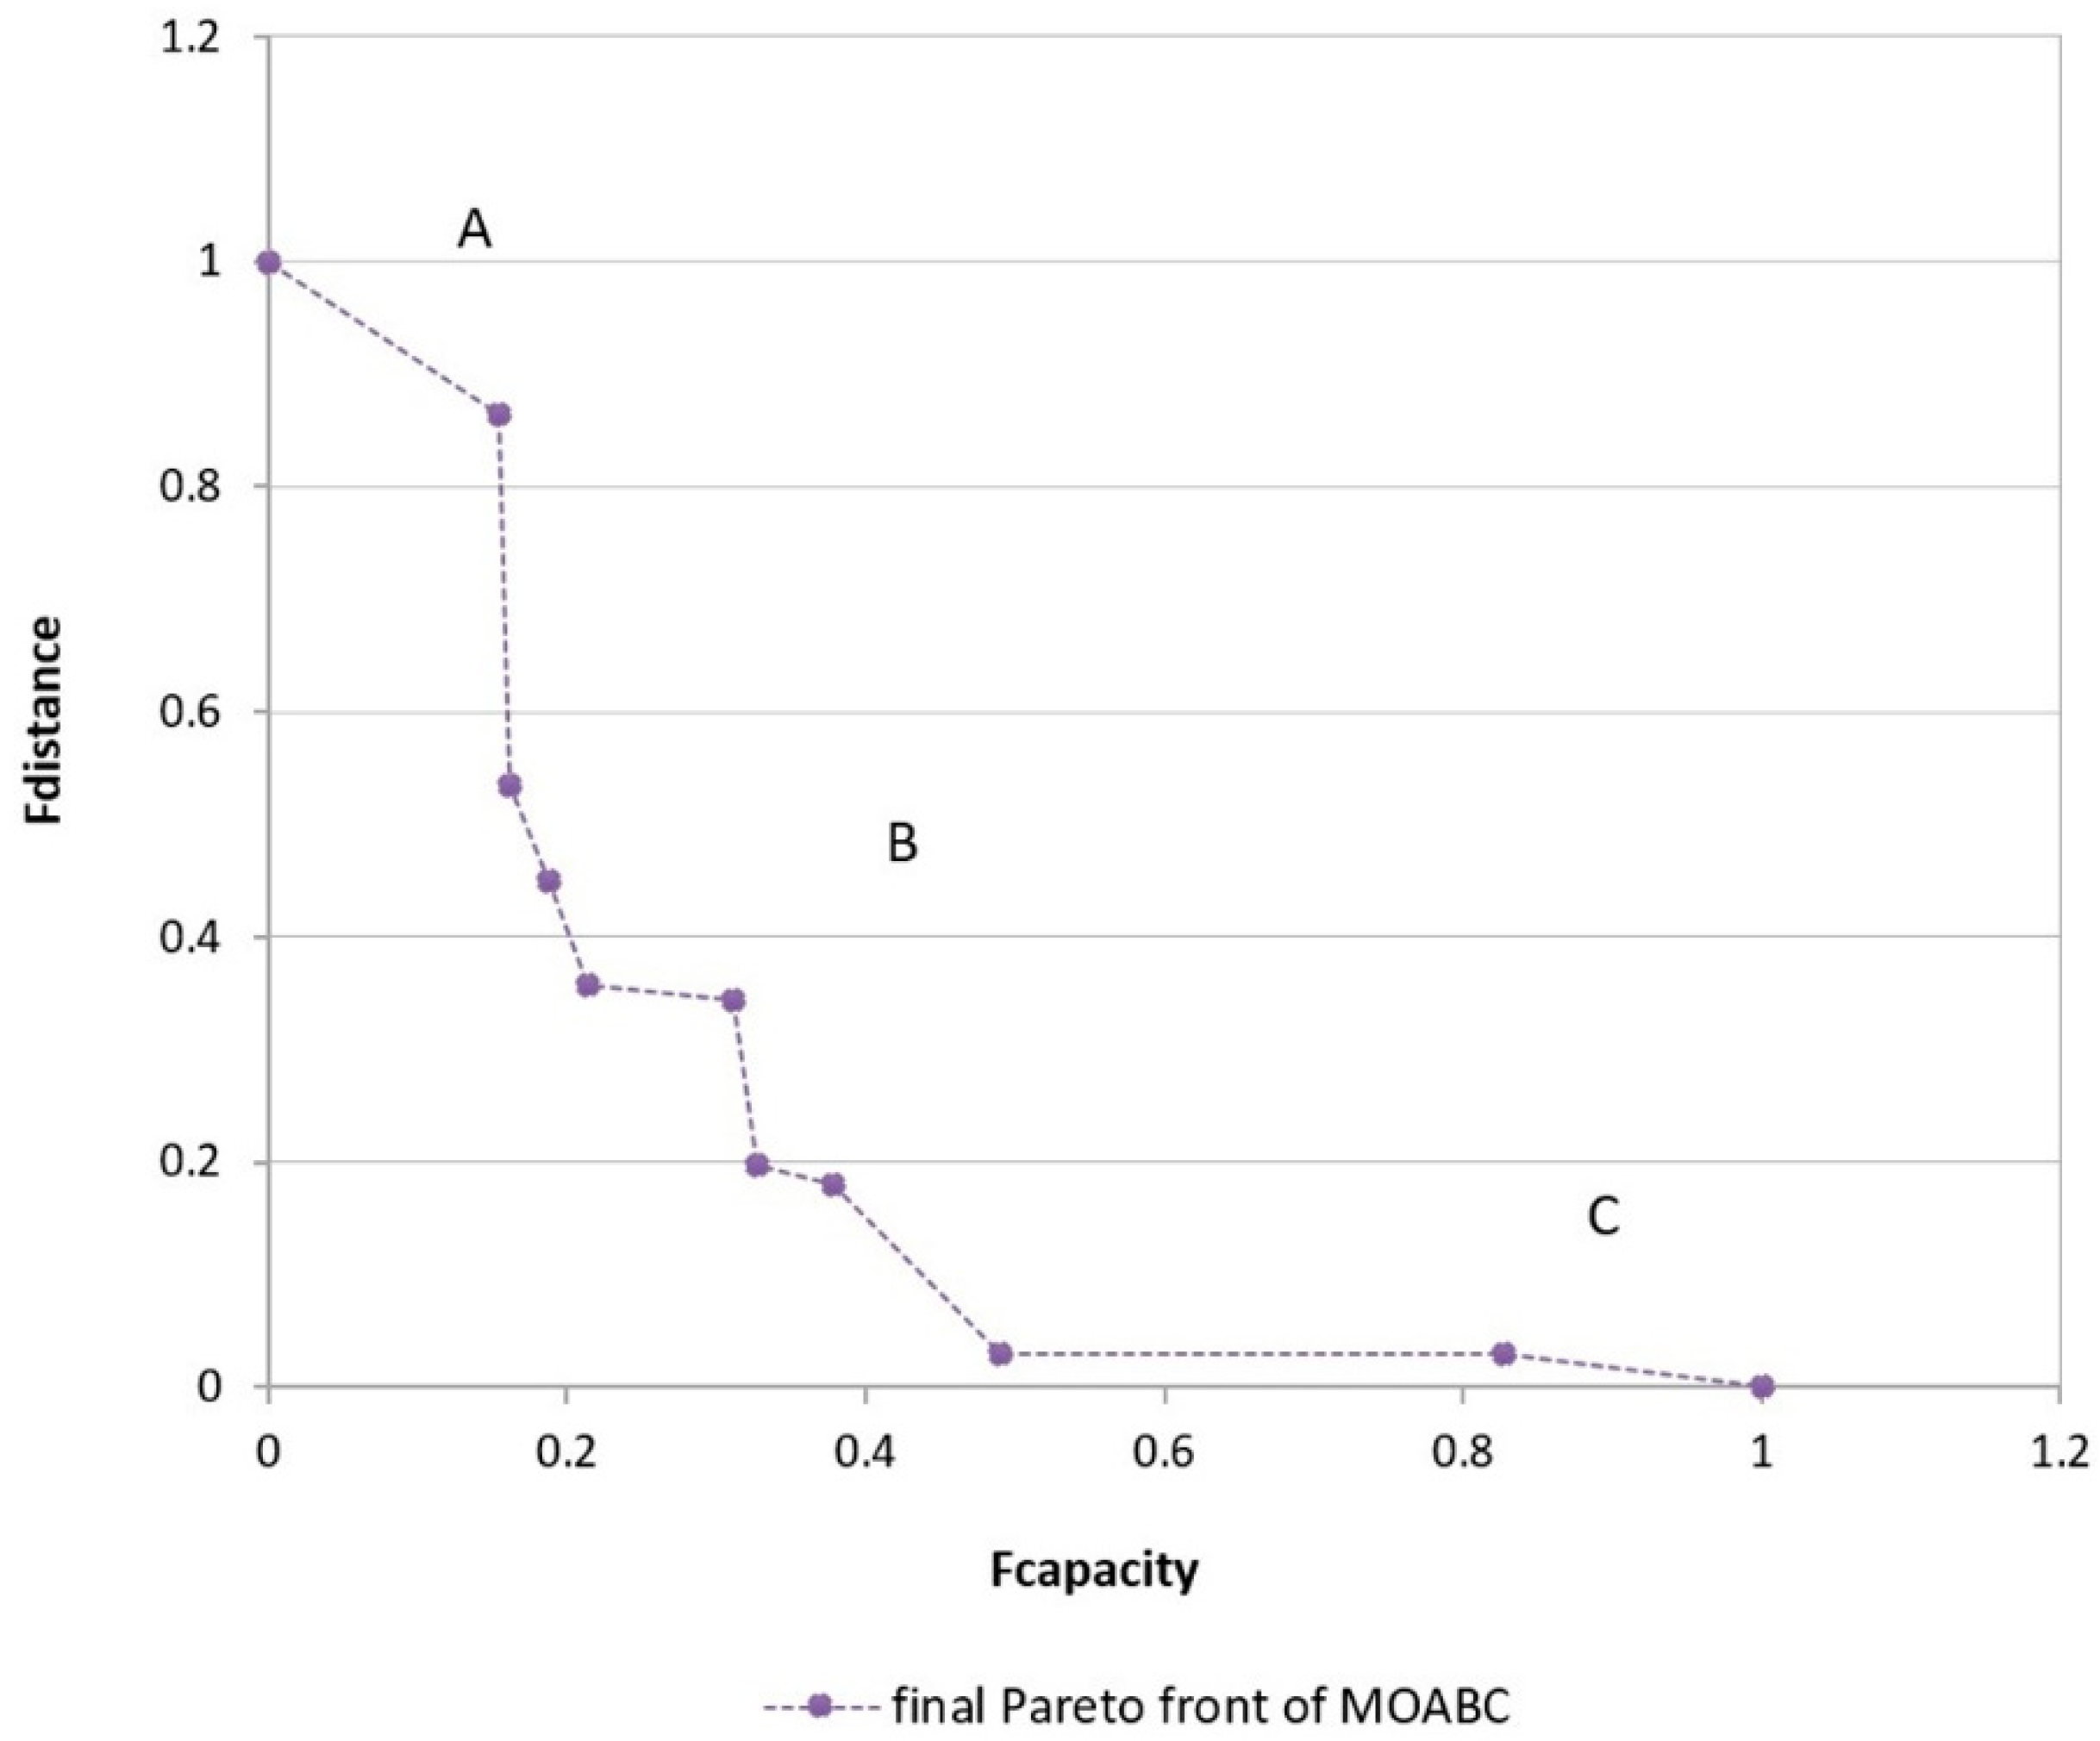
5.3. Pareto Optimal Front Analysis

Figure 10 represents the final Pareto front produced by Method A. The Pareto optimality shows a trade-off between the capacity and distance objective functions. Every point on the Pareto front corresponds to the minimal value of the two objective functions. Notably, the optimization values of both capacity and distance functions were standardized in order to plot and analyze them effectively. Here, we chose the Pareto front of Method A as the best as it produced many alternatives for decision-making compared to other methods, as shown in Table 2. A Pareto front can orient decision-making based on the selection of the solution position. For example, in Figure 10, if a solution from region A is chosen for decision-making, priority is given to the distance, which is similar to the capacity cost function that is prioritized if a solution from the C region is chosen. The points that are in region B of the Pareto front (ranging from 0.2 to 0.6) represent the case where the priority is almost equally given to both the distance and capacity cost functions.
Figure 11 compares the allocation among different solutions when the points from A, B, and C were selected as an optimum alternative (Figure 10). The lines (different colors for each shelter) allocate the building blocks to the shelters represented by small red triangles. For points from Solution A, the distance objective is given high priority in comparison to the capacity objective; thus, the pattern of allocation of building blocks moves toward the nearest shelter. For the optimal point from Solution C, the capacity objective is prioritized. Although it is not easy to visually find a significant difference in the three graphs, we noticed some changes while assigning buildings blocks to shelters 1, 3, 4, 5, 6, 8, and 10, compared with cases A and B. For the points from Solution B, the priority is similar for both the capacity and distance criteria.

5.4. Optimization Results Analysis

Figure 12 shows the evolution process and optimal allocation of the point in Solution B produced by Method A (Figure 10) through six different generations. Initially, a set of solutions representing the size of the building blocks of the study area is randomly generated and randomly assigned to each candidate shelter (Figure 3). The gray lines indicate the building blocks assigned to a shelter. In Figure 12, the wheels on the right side of each graph represent the number of building blocks assigned to each shelter. As this figure shows, from the first generation to the 150th generation, the solutions are uniformly distributed. However, changes were observed from the 250th generation until the 500th. By comparing the capacities and the area of the 10 candidate shelters, the fourth shelter is the largest and the ninth is the smallest. The seventh shelter is located far away from many building blocks. Therefore, the best optimal solution should assign the building blocks by avoiding overloading of shelters (i.e., the smallest), but should also satisfy the criterion of minimum distance. The wheel at the 500th generation shows that the algorithm minimized the number of building blocks at shelters 7, 8, and 9, while Shelter 4 was capable of accommodating a large number of evacuees from 298 building blocks.

5.5. Comparison with Other Algorithms

To evaluate the performance of the proposed MOABC algorithm, our algorithm was compared to standard MOABC as well as NSGA-II [51], which is a very popular algorithm for solving multi-objective optimization problems. All algorithms were implemented on the same data and run 500 times. To compare these algorithms, the Pareto-optimal fronts, fitness function values, convergence rate, and execution time were used.
Figure 13 shows the Pareto-optimal fronts generated by the standard MOABC (without improvement in the neighborhood strategies and selection process), NSGA-II, and the modified MOABC. The results show that the proposed MOABC produces good optimal results when using the proposed neighborhood strategies. NSGA-II generates a uniform distribution of solutions and a smooth Pareto front; the solutions are superior compared to the proposed MOABC Pareto front.
Figure 14 shows the convergence rates of the three algorithms. NSGA-II and the modified MOABC have better convergence rates in comparison to the standard MOABC. The convergence of the proposed MOABC is smoother than that of NSGA-II; however, NSGA-II converges faster. Looking at Table 3 and comparing the minimum fitness values of the objective functions and the execution time, the proposed MOABC produces the minimum values and is the fastest algorithm.

5.6. Sensitivity Analyses

5.6.1. Impact of Parameters

In the proposed MOABC method, the population size and the number of generations are two important parameters that influence the quality of fitness and the final Pareto front. Here, we analyzed MOABC’s sensitivity to these two parameters. An analysis of the impact of population size was provided in Section 5.1 and Figure 7, where we tested several parameters including colony size in order to find a setting that produces better results. We noticed that increasing the size of the population or decreasing the number of generations affects the number of optimal solutions in the Pareto front. Additionally, the population size and dimension of the problem influence the speed of the model computation.
A generation of the algorithm translates a population into a new structure of solutions (decisions). Thus, selecting the appropriate number of generations helps find an optimal solution within a reasonable amount of time. This parameter is a stopping condition of the algorithm. A large maximum number of generations causes long computational time, whereas too low a number prevents improvement of solutions to reach optimal solutions. To investigate this impact, the algorithm was run with 1000 generations. Figure 15 shows the Pareto front set with different numbers of generations. The fitness value was normalized between 0 and 1. We found that, at the beginning of the algorithm (up to 100 generation), the functions were not well minimized. The obtained fitness values of the two functions were better from the 300th to 1000th generations. However, when optimizing a spatial problem, it is also important to consider the dimension (size of decision variables) of the problem, the size of the Pareto front (number of solutions), and computation time for each generation. Therefore, we conclude that setting the generation parameter to between 500 and 700 can provide good results.

5.6.2. Repeatability Analysis

In metaheuristic algorithms, the randomization of the search process affects the results of the algorithm with every new run. To evaluate the stability and repeatability of the algorithm, we ran it five times with the same selected parameters provided in Table 1.
The results presented in Table 4 show the number of solutions in the final Pareto front, the minimum fitness value of capacity and distance function, and the variance value obtained from five runs. The results show that minimum fitness values were different in the five runs. This is due to the diversity, which is an indicator used to evaluate the uniformity of distribution of the solutions in terms of dispersion and extension. The adopted neighborhood search mechanism, together with a crossover operator, permits the MOABC algorithm to randomly generate new solutions at each iteration and converge them toward the global optimal solutions.
The results shown in Figure 16a compare the repeatability of the algorithm and the size of the final Pareto front against numbers of generations used to present the global optimization process of the algorithm (Figure 16a). In the results of the five runs, there are similarities and differences between the sizes of the global solutions found based on the numbers of generations. In the comparison of the five runs, the algorithm found similar numbers of global solutions at generations 0–50, 100–200, 300–350, 400, and 500.
To more accurately test the repeatability of the algorithm, the variances of the best fitness values for both the capacity and distance function for five runs were calculated. For ease of comparison, we normalized the best fitness values obtained through 500 generations as presented in Figure 16b, and the variance between 0 and 1 was computed. The algorithm is more stable if the variance value is closer to zero. From the investigation of the results, we found that the variance for capacity function ranged between 0.051 and 0.057, and it ranged between 0.080 and 0.086 for distance function (Table 4). From these results, it was concluded that the average of repeatability of the proposed MOABC is about 93%. The convergence rates of the algorithm for five different runs were also investigated. Figure 16b shows that the fitness variations of the five runs are almost similar, with minimal differences between the runs. The algorithm converges smoothly toward the global optimum. It starts to attain the best fitness value at 300 generations for both capacity and distance optimization functions. This shows the stability and repeatability of the MOABC algorithm for the considered problem.

5.7. Potential Use of the Proposed MOABC

Multi-objective optimization approaches support decision-making mostly in planning and management. They provide a set of optimal solutions from which decision-makers can choose one solution as the best according to their preferences. A trade-off between two objective functions allows decision-makers to evaluate the contribution of each objective function to final decision-making.
The proposed approach can be applied in two fields. From a scientific point of view, this approach can open the doors for future studies, where several points can be addressed, such as developing a hybrid algorithm that uses the proposed neighborhood strategies and the crossover operator to enhance the performance of the standard algorithms such as PSO, ACO, GA, and simulated annealing (SA). It can also be extended by emphasizing the number of solutions in the final Pareto front by applying other methodologies. From an application perspective, the proposed approach can be used for disaster management planning to solve evacuation problems. It can optimize other evacuation models with different objective functions from those used in this paper. Different institutions can use the proposed approach to enhance existing decision support systems in disaster management. Considering that the run time of the algorithm is short, the proposed approach can be integrated into a web-based disaster management system to generate a map that shows how the evacuees would be optimally assigned to proper shelters. The proposed approach would dynamically run in the web system and the computational cost would be very low since, as we demonstrated, the proposed MOABC executes quickly, even on large dataset.

6. Conclusions

In this paper, we presented a modified ABC algorithm to address evacuation planning by minimizing the total capacity constraints violations in shelters and the total evacuation distance to the assigned shelter.
We proposed a Multi-Objective Artificial Bee Colony (MOABC) based on the modified original ABC. The four important strategies, including worker bees for improving the neighborhood search of ABC and simultaneously optimizing two conflicting objectives, were: (1) the discrete random generation of the initial population; (2) combining random swap (RS) and random insertion (RI) neighborhood strategies; (3) a crossover operator for exchanging information between worker bees; and (4) the Pareto-based approach (non-dominant sorting method) for evaluation and fitness assignment of the MOABC. The proposed algorithm was compared to NSGA-II and standard MOABC. The experimental results showed that the proposed MOABC algorithm can perform better and is suitable for multi-objective evacuation problems in urban areas. In the future, instead of using a Pareto-based ABC approach, the ε-dominance multi-objective-based ABC can be studied to seek better optimal solutions for evacuation optimization problem applications. Future work could also focus on the improvement of encoding and representation of solutions for spatial optimization problems.
MOABC for an evacuation model was applied to the selected study area of Kigali, which was chosen due to the high frequency occurrences of flood and landslide hazards. The area is large, highly populated, and has some improperly located settlements. The characteristics of urban areas can increase the complexity of the model. Some of the candidate shelters used in this study cannot accommodate all evacuees from the nearest building blocks, so some may walk a long distance to be evacuated and reach safe areas. For future research, there is a need to conceptualize the model based on the characteristics of the area, including topography and behavior of evacuees, and to include other factors such as traffic, risks along evacuation paths, and socioeconomic conditions.

Author Contributions

Olive Niyomubyeyi was responsible for methodology, implementation, test and analysis, and writing; Petter Pilesjö was responsible for supervision and conceptualization; Ali Mansourian was responsible for idea development and conceptualization, coordination, supervision, reconstruction, and editing the manuscript.

Funding

This research was funded by the Swedish International Development Agency (SIDA) through the SIDA-University of Rwanda Program, GIS Sub-Program.

Acknowledgments

The authors would like to express their thanks to the University of Rwanda, Lund University, and SIDA Partnership Program for their financial support of this research.

Conflicts of Interest

The authors declare no conflicts of interests.

References

  1. Dilley, M.; Chen, R.S.; Deichmann, U.; Lerner-Lam, A.L.; Arnold, M. Natural Disaster Hotspots: A Global Risk Analysis; The World Bank: Washington, DC, USA, 2005; ISBN 978-0-8213-5930-3. [Google Scholar]
  2. Guha-Sapir, D.; Hoyois, P.; Wallemacq, P.; Below, R. Annual Disaster Statistical Review 2016: The Numbers and Trends. Brussels: CRED; Centre for Research on the Epidemiology of Disasters (CRED), Institute of Health and Society (IRSS): Brussels, Belgium, 2016; p. 91. [Google Scholar]
  3. Yusoff, M.; Ariffin, J.; Mohamed, A. Optimization approaches for macroscopic emergency evacuation planning: A survey. In Proceedings of the 2008 International Symposium on Information Technology, Kuala Lumpur, Malaysia, 26–28 August 2008; Volume 3, pp. 1–7. [Google Scholar]
  4. Saadatseresht, M.; Mansourian, A.; Taleai, M. Evacuation planning using multiobjective evolutionary optimization approach. Eur. J. Oper. Res. 2009, 198, 305–314. [Google Scholar] [CrossRef]
  5. Horner, M.W.; Downs, J.A. Optimizing hurricane disaster relief goods distribution: Model development and application with respect to planning strategies. Disasters 2010, 34, 821–844. [Google Scholar] [CrossRef] [PubMed]
  6. Caunhye, A.M.; Nie, X.; Pokharel, S. Optimization models in emergency logistics: A literature review. Socio-Econ. Plan. Sci. 2012, 46, 4–13. [Google Scholar] [CrossRef]
  7. Kuligowski, E.D.; Peacock, R.D. A Review of Building Evacuation Models; National Bureau of Standards: Gaithersburg, MD, USA, 2005.
  8. Stepanov, A.; Smith, J.M. Multi-objective evacuation routing in transportation networks. Eur. J. Oper. Res. 2009, 198, 435–446. [Google Scholar] [CrossRef]
  9. Murray-Tuite, P.; Wolshon, B. Evacuation transportation modeling: An overview of research, development, and practice. Transp. Res. Part C Emerg. Technol. 2013, 27, 25–45. [Google Scholar] [CrossRef]
  10. Malczewski, J. GIS-based multicriteria decision analysis: A survey of the literature. Int. J. Geogr. Inf. Sci. 2006, 20, 703–726. [Google Scholar] [CrossRef]
  11. Malczewski, J.; Rinner, C. Multicriteria Decision Analysis in Geographic Information Science; Advances in Geographic Information Science; Springer: Berlin/Heidelberg, Germany, 2015; ISBN 978-3-540-74756-7. [Google Scholar]
  12. Talbi, E.-G. Metaheuristics: From Design to Implementation; John Wiley & Sons: Hoboken, NJ, USA, 2009; ISBN 978-0-470-49690-9. [Google Scholar]
  13. Tong, D.; Murray, A.T. Spatial Optimization in Geography. Ann. Assoc. Am. Geogr. 2012, 102, 1290–1309. [Google Scholar] [CrossRef]
  14. Özdamar, L.; Ertem, M.A. Models, solutions and enabling technologies in humanitarian logistics. Eur. J. Oper. Res. 2015, 244, 55–65. [Google Scholar] [CrossRef]
  15. Alçada-Almeida, L.; Tralhão, L.; Santos, L.; Coutinho-Rodrigues, J. A Multiobjective Approach to Locate Emergency Shelters and Identify Evacuation Routes in Urban Areas. Geogr. Anal. 2009, 41, 9–29. [Google Scholar] [CrossRef] [Green Version]
  16. Coutinho-Rodrigues, J.; Tralhão, L.; Alçada-Almeida, L. Solving a location-routing problem with a multiobjective approach: The design of urban evacuation plans. J. Transp. Geogr. 2012, 22, 206–218. [Google Scholar] [CrossRef]
  17. Horner, M.W.; Ozguven, E.E.; Marcelin, J.M.; Kocatepe, A. Special needs hurricane shelters and the ageing population: Development of a methodology and a case study application. Disasters 2018, 42, 169–186. [Google Scholar] [CrossRef] [PubMed]
  18. Kocatepe, A.; Ozguven, E.E.; Horner, M.; Ozel, H. Pet- and special needs-friendly shelter planning in south Florida: A spatial capacitated p-median-based approach. Int. J. Disaster Risk Reduct. 2018, 31, 1207–1222. [Google Scholar] [CrossRef]
  19. Brownlee, J. Clever Algorithms: Nature-Inspired Programming Recipes; Revision 2; LuLu.com s.l.: Morrisville, NV, USA, 2012; ISBN 978-1-4467-8506-5. [Google Scholar]
  20. Zhou, A.; Qu, B.-Y.; Li, H.; Zhao, S.-Z.; Suganthan, P.N.; Zhang, Q. Multiobjective evolutionary algorithms: A survey of the state of the art. Swarm Evol. Comput. 2011, 1, 32–49. [Google Scholar] [CrossRef]
  21. Zhang, M.-X.; Zhang, B.; Zheng, Y.-J. Bio-Inspired Meta-Heuristics for Emergency Transportation Problems. Algorithms 2014, 7, 15–31. [Google Scholar] [CrossRef]
  22. Yanfang, L.; Dongping, M.; Jianyu, Y. Optimization of land use structure based on ecological GREEN equivalent. Geo-Spat. Inf. Sci. 2002, 5, 60–67. [Google Scholar] [CrossRef]
  23. Zhaobao, Z.; Hong, Z. The decision of the optimal parameters in Markov random fields of images by genetic algorithm. Geo-Spat. Inf. Sci. 2000, 3, 14–18. [Google Scholar] [CrossRef]
  24. Jiao, L.; Liu, Y. Model of land suitability evaluation based on computational intelligence. Geo-Spat. Inf. Sci. 2007, 10, 151–156. [Google Scholar] [CrossRef]
  25. Shaygan, M.; Alimohammadi, A.; Mansourian, A.; Govara, Z.S.; Kalami, S.M. Spatial Multi-Objective Optimization Approach for Land Use Allocation Using NSGA-II. IEEE J. Sel. Top. Appl. Earth Obs. Remote Sens. 2014, 7, 906–916. [Google Scholar] [CrossRef]
  26. Song, M.; Chen, D. An improved knowledge-informed NSGA-II for multi-objective land allocation (MOLA). Geo-Spat. Inf. Sci. 2018, 21, 273–287. [Google Scholar] [CrossRef]
  27. Ma, S.; He, J.; Liu, F.; Yu, Y. Land-use spatial optimization based on PSO algorithm. Geo-Spat. Inf. Sci. 2011, 14, 54–61. [Google Scholar] [CrossRef] [Green Version]
  28. Ai, B.; Ma, S.; Wang, S. Land-use zoning in fast developing coastal area with ACO model for scenario decision-making. Geo-Spat. Inf. Sci. 2015, 18, 43–55. [Google Scholar] [CrossRef]
  29. Eldrandaly, K.A.; Abdallah, A.F. A novel GIS-based decision-making framework for the school bus routing problem. Geo-Spat. Inf. Sci. 2012, 15, 51–59. [Google Scholar] [CrossRef] [Green Version]
  30. Lei, T.L.; Church, R.L.; Lei, Z. A unified approach for location-allocation analysis: Integrating GIS, distributed computing and spatial optimization. Int. J. Geogr. Inf. Sci. 2016, 30, 515–534. [Google Scholar] [CrossRef]
  31. Yang, L.; Sun, X.; Peng, L.; Shao, J.; Chi, T. An improved artificial bee colony algorithm for optimal land-use allocation. Int. J. Geogr. Inf. Sci. 2015, 29, 1470–1489. [Google Scholar] [CrossRef]
  32. Goerigk, M.; Deghdak, K.; Heßler, P. A comprehensive evacuation planning model and genetic solution algorithm. Transp. Res. Part E Logist. Transp. Rev. 2014, 71, 82–97. [Google Scholar] [CrossRef] [Green Version]
  33. Zheng, Y.-J.; Chen, S.-Y.; Ling, H.-F. Evolutionary optimization for disaster relief operations: A survey. Appl. Soft Comput. 2015, 27, 553–566. [Google Scholar] [CrossRef]
  34. Garrett, A.; Carnahan, B.; Muhdi, R.; Davis, J.; Dozier, G.; SanSoucie, M.P.; Hull, P.V.; Tinker, M.L. Evacuation Planning via Evolutionary Computation. In Proceedings of the 2006 IEEE International Conference on Evolutionary Computation, Vancouver, BC, Canada, 16–21 July 2006; pp. 157–164. [Google Scholar]
  35. Georgiadou, P.S.; Papazoglou, I.A.; Kiranoudis, C.T.; Markatos, N.C. Multi-objective evolutionary emergency response optimization for major accidents. J. Hazard. Mater. 2010, 178, 792–803. [Google Scholar] [CrossRef] [PubMed]
  36. Hu, F.; Xu, W.; Li, X. A modified particle swarm optimization algorithm for optimal allocation of earthquake emergency shelters. Int. J. Geogr. Inf. Sci. 2012, 26, 1643–1666. [Google Scholar] [CrossRef]
  37. Xu, W.; Ma, Y.; Zhao, X.; Li, Y.; Qin, L.; Du, J. A comparison of scenario-based hybrid bilevel and multi-objective location-allocation models for earthquake emergency shelters: A case study in the central area of Beijing, China. Int. J. Geogr. Inf. Sci. 2018, 32, 236–256. [Google Scholar] [CrossRef]
  38. Zong, X.; Xiong, S.; Fang, Z.; Li, Q. Multi-Objective Optimization for Massive Pedestrian Evacuation Using Ant Colony Algorithm. In Advances in Swarm Intelligence; Tan, Y., Shi, Y., Tan, K.C., Eds.; Springer: Berlin/Heidelberg, Germany, 2010; Volume 6145, pp. 636–642. ISBN 978-3-642-13494-4. [Google Scholar]
  39. Saeidian, B.; Mesgari, M.S.; Pradhan, B.; Ghodousi, M. Optimized Location-Allocation of Earthquake Relief Centers Using PSO and ACO, Complemented by GIS, Clustering, and TOPSIS. ISPRS Int. J. Geo-Inf. 2018, 7, 292. [Google Scholar] [CrossRef]
  40. Karaboga, D. An Idea Based on Honey Bee Swarm for Numerical Optimization; Erciyes University, Engineering Faculty, Computer Engineering Department: Kayseri, Turkey, 2005. [Google Scholar]
  41. Karaboga, D.; Gorkemli, B.; Ozturk, C.; Karaboga, N. A comprehensive survey: Artificial bee colony (ABC) algorithm and applications. Artif. Intell. Rev. 2014, 42, 21–57. [Google Scholar] [CrossRef]
  42. Fang, Z.; Li, L.; Li, B.; Zhu, J.; Li, Q.; Xiong, S. An artificial bee colony-based multi-objective route planning algorithm for use in pedestrian navigation at night. Int. J. Geogr. Inf. Sci. 2017, 31, 2020–2044. [Google Scholar] [CrossRef]
  43. Luo, J.; Liu, Q.; Yang, Y.; Li, X.; Chen, M.; Cao, W. An Artificial Bee Colony Algorithm for Multi-objective Optimisation. Appl. Soft Comput. 2017, 50, 235–251. [Google Scholar] [CrossRef]
  44. Yang, L.; Zhu, A.; Shao, J.; Chi, T. A Knowledge-Informed and Pareto-Based Artificial Bee Colony Optimization Algorithm for Multi-Objective Land-Use Allocation. ISPRS Int. J. Geo-Inf. 2018, 7, 63. [Google Scholar] [CrossRef]
  45. Akbari, R.; Hedayatzadeh, R.; Ziarati, K.; Hassanizadeh, B. A multi-objective artificial bee colony algorithm. Swarm Evol. Comput. 2012, 2, 39–52. [Google Scholar] [CrossRef]
  46. Coello, C.A.C.; Lamont, G.B.; Veldhuizen, D.A.V. Evolutionary Algorithms for Solving Multi-Objective Problems, 2nd ed.; Springer: New York, NY, USA, 2007; p. 810. [Google Scholar]
  47. Zhang, H.; Zhu, Y.; Zou, W.; Yan, X. A hybrid multi-objective artificial bee colony algorithm for burdening optimization of copper strip production. Appl. Math. Model. 2012, 36, 2578–2591. [Google Scholar] [CrossRef]
  48. Farahani, R.Z.; Hassani, A.; Mousavi, S.M.; Baygi, M.B. A hybrid artificial bee colony for disruption in a hierarchical maximal covering location problem. Comput. Ind. Eng. 2014, 75, 129–141. [Google Scholar] [CrossRef]
  49. Huo, Y.; Zhuang, Y.; Gu, J.; Ni, S. Elite-guided multi-objective artificial bee colony algorithm. Appl. Soft Comput. 2015, 32, 199–210. [Google Scholar] [CrossRef]
  50. Roberts, S.A.; Hall, G.B.; Calamai, P.H. Evolutionary Multi-objective Optimization for landscape system design. J. Geogr. Syst. 2011, 13, 299–326. [Google Scholar] [CrossRef]
  51. Deb, K.; Pratap, A.; Agarwal, S.; Meyarivan, T. A fast and elitist multiobjective genetic algorithm: NSGA-II. IEEE Trans. Evol. Comput. 2002, 6, 182–197. [Google Scholar] [CrossRef] [Green Version]
  52. NISR Population and Housing Census of Rwanda, 2012—Rwanda Data Portal. Available online: http://rwanda.opendataforafrica.org//pkzmyhf/population-and-housing-census-of-rwanda-2012 (accessed on 22 November 2018).
  53. Bizimana, J.P.; Schilling, M. Geo-Information Technology for Infrastructural Flood Risk Analysis in Unplanned Settlements: A case study of informal settlement flood risk in the Nyabugogo flood plain, Kigali City, Rwanda. In Geospatial Techniques in Urban Hazard and Disaster Analysis; Springer: Berlin/Heidelberg, Germany, 2009; pp. 99–124. [Google Scholar]
  54. MIDIMAR. The National Risk Atlas of Rwanda; MIDIMAR: Kigali, Rwanda, 2015.
  55. Rolland, E.; Patterson, R.A.; Ward, K.; Dodin, B. Decision support for disaster management. Oper. Manag. Res. 2010, 3, 68–79. [Google Scholar] [CrossRef] [Green Version]
  56. The Sphere Project. Humanitarian Charter and Minimum Standards in Humanitarian Response: The Sphere Handbook; The Sphere Project: Rugby, Warwickshire, UK, 2011; ISBN 978-1-908176-00-4. [Google Scholar]
  57. Fortin, F.-A.; Rainville, F.M.; Gardner, M.A.; Parizeau, M.; Gagné, C. DEAP: Evolutionary Algorithms Made Easy. J. Mach. Learn. Res. 2012, 13, 2171–2175. [Google Scholar]
Figure 1. Main steps of Artificial Bee Colony (ABC) algorithm.
Ijgi 08 00110 g001
Figure 2. Main steps of the proposed Multi-Objective Artificial Bee Colony (MOABC) for evacuation planning.
Ijgi 08 00110 g002
Figure 3. An example of an initialized bee represents assigned shelter on each building block.
Ijgi 08 00110 g003
Figure 4. A neighbor bee generated by neighborhood search operator random insertion (RI) (gray) and random swap (RS) (orange).
Ijgi 08 00110 g004
Figure 5. Crossover operator for sharing information among worker bees. An example of two worker bees (parent1 and parent2) exchange index of points (orange) to generate new worker bees (child1 and child2; gray).
Ijgi 08 00110 g005
Figure 6. Maps of (a) the geographical location of the selected sectors of the city of Kigali, and (b) the candidate shelters and residential blocks of the selected study area.
Ijgi 08 00110 g006
Figure 7. Parameter analysis. The optimal Pareto fronts when (a) the population size ranges from 20 to 80; (b) the parameter limit is set to population size, which is population size times the dimension size and times 100; (c) the crossover probability ranges from 0.5 to 1; and (d) the tournament size ranges from 2 to 4.
Ijgi 08 00110 g007
Figure 8. The variation in final Pareto front size of three methods: A, B, and C.
Ijgi 08 00110 g008
Figure 9. Fitness variation in the best values with number of generations. (a) Fitness value of capacity function, and (b) distance function found by methods A, B, and D.
Ijgi 08 00110 g009aIjgi 08 00110 g009b
Figure 10. The final optimal Pareto front from the proposed MOABC algorithm.
Ijgi 08 00110 g010
Figure 11. The allocation map of optimum solutions A (left), B (center), and C (right).
Ijgi 08 00110 g011
Figure 12. Improvement of optimum solutions through generations. The gray lines on the left side of each graph represent the allocation of shelters. The numbers of building blocks assigned to shelters are presented on the right side of each graph (pie chart). (a) Optimal allocation and minimum fitness value obtained from one generation; (b) optimal allocation and minimum fitness values of the 50th generation; (c) optimal allocation and minimum fitness values of the 150th generation; (d) optimal allocation and minimum fitness values of the 250th generation; (e) optimal allocation and minimum fitness values of the 350th generation, and (f) optimal allocation and minimum fitness values of the 500th generation.
Ijgi 08 00110 g012
Figure 13. The Pareto-optimal fronts generated by: (a) the standard MOABC; (b) NSGA-II; and (c) the proposed MOABC. The standardized minimum fitness values of both capacity and distance function.
Ijgi 08 00110 g013
Figure 14. The convergence process for different generations of (a) standard MOABC; (b) NSGA-II; and (c) the proposed MOABC.
Ijgi 08 00110 g014
Figure 15. Pareto front set for different numbers of generations.
Ijgi 08 00110 g015
Figure 16. Repeatability of the proposed MOABC algorithm from five runs. (a) Variation of Pareto front size with numbers of generations; (b) fitness variation of five runs.
Ijgi 08 00110 g016
Table 1. Parameter settings of the Multi-Objective Artificial Bee Colony (MOABC) algorithm in the study.
ParameterValue
Population size20
LimitN × D × 100
Crossover probability rate0.5
Tournament size3
Maximum number of generations500
N: population size; D: dimension of the problem.
Table 2. Comparison of results obtained using different methods. RS—random swap; RI—random insertion.
MethodAlgorithmPopulation SizeNumber of GenerationsFinal Pareto Front SizeFcapacityFdistanceExecution Time (s)
AMOABC with Combination of RS and RI2050083.449.29 × 108199
BMOABC with the basic local search strategy2050033.968.61 × 108274
CMOABC with crossover operator2050083.449.29 × 108199
DMOABC without a crossover operator2050046.029.04 × 108193
Table 3. The comparison results of three algorithms.
AlgorithmMinimum Fitness Value of Fcapacity Minimum Fitness Value of Fdistance Execution Time (s)
Standard MOABC49.01.18 × 109163
NSGA-II38.91.08 × 1091971
Proposed MOABC5.88.72 × 108161
Table 4. Results of repeatability test of the proposed MOABC algorithm.
RunPopulation SizeNumber of GenerationsFinal Pareto Front SizeFitness Value of FcapacityFitness Value of FdistanceVariance (Fcapacity)Variance (Fdistance)
12050044.738.84 × 1080.0560.080
22050065.858.89 × 1080.0510.086
32050045.628.83 × 1080.0580.080
42050085.18.87 × 1080.0570.082
52050046.298.91 × 1080.0530.082

