1. Introduction
Cultural and creative industries include all human activities based on human creativity and talent. Their roots come from artistic creation and reside in intellectual property. All sectors and subjects pertaining to culture and creative industries are intermingled and complementary. Film needs music, scenic arts need architecture, advertising needs graphics and television [
1]. Map outputs, mostly created by geographic information systems, can be applied to any human activity which can be localized in space. Contemporary information systems extend across sectors. In recent years, digital spatial databases have also been applied to non-technical disciplines and the humanities. Topics such as Smart Cities, innovation incubators, co-working centers or Industry 4.0 have emerged today in both lay and professional literature. Governments at both national and local levels are seeking to find appropriate models and theories for a precise definition of culture, art, and creative industries [
2].
This is why a unique initiative to map cultural and creative industries in Central Europe was set-up at Palacký University Olomouc. With a clear definition of culture, representatives of the university, city, and region will have concrete information about the impact of cultural industries in the region. It will allow them to set the parameters for further development of culture (subsidies or adjustments to study fields) and may be a source of technological/non-technological innovation or a reason for movement in the workforce. This article built on the conclusions of a multidisciplinary collaboration of experts in technical (cartography, IT) and humanities (economics, cultural sciences, art) fields. Its aim was to describe the possibilities of implementing geographical information systems in the field of creative industries. The analyses and map outputs provide a clear overview of the spatial definition of cultural and creative industries including the main aspects which influence their pursuits. These aspects could not be identified without geographical information systems. This article hypothesized that the interconnection of creative industries with cartographic instruments significantly increases the competitiveness and use of acquired knowledge. It does not aim to describe the process of creating maps (i.e., a how-to manual) but explains the unique principle of joining both disciplines. It discusses possible analyses and benefits stemming from interdisciplinary cooperation in areas not yet deeply explored. The main goal of this article was the creation of suitable map visualizations (the current state) and spatial-based identification (the potential for development). We did not aim at advanced spatial analysis.
The term “Geographical Information System (GIS)” can be defined as a computerized system for storing, editing, and using data which describes locations on the Earth’s surface [
3,
4]. Various practical and theoretical applications are already a routine for many industries such as transportation or agriculture [
5]; on the other hand, GIS is ready to meet new topics such as creative industries. The main benefit of GIS involvement is more advanced geographic analyses than just localization only. It permits more in-depth interpretation of the examined aspects, spatial analyses, predictions or modelling. The combination of spatial analysis outputs with the localization of creative industries is the primary outcome of our study only. It implements both levels, spatial localization of the current state and spatial analysis of selected characteristics, in order to better understand the examined problem and draw adequate conclusions and include map visualizations.
Lazzereti [
6] confirms the implementation of GIS, claiming that “most entities are urban-oriented and have an urban characteristic … this phenomenon is particularly noticeable in large cities that offer capital, institutions, knowledge and infrastructure”. Also, as mentioned by Chinitz [
7], “large cities provide a more diverse mix of industries, unlike smaller towns, which are rather specialized”. In cities, cultural industries tend to cluster into highly specialized, spatially restricted clusters or hubs which can be identified using spatial mapping based only on GIS. Based on concentration mapping [
8], there are several benefits:
Making the labor market and workforce flow more efficiently—transfer of workers between workplaces as a part of time-limited projects;
Creating a social structure and added value for locations. For example, the concentration of cultural subjects in historical parts of cities with a high aesthetic value, along with cafes and bars, where contacts are established among individual artists;
Easy and quick access to information among entities;
Client availability and a larger sales market;
Supplier availability and high flexibility in collaborative workings.
1.1. Creative Industries in Central Europe
The project described in this article was carried out at Palacký University Olomouc, Czech Republic (see below). In the context of the historical, political, and economic aspects of both university and public life, it is necessary to clarify the term “Central Europe”. In the context of this article, Central Europe refers to the Visegrad Group countries: Czech Republic, Slovakia, Poland, and Hungary. The authors did not aim to compare the situation with other countries that could also be geographically classified as Central Europe, such as Germany or Switzerland, because of the close cooperation between the university environment and the similar state of creative industries in these countries, and also because these countries have completely different historical and economic positions.
The creative economy and emerging narrower concepts of cultural and creative artistic minds as generators of economic growth have attracted the attention of countries, regions, cities, and politicians around the world over the last few decades [
9,
10]. One of the first descriptions of the interconnection of culture, creativity, and economics in the global environment is given in “The Culture Industry: Enlightenment as Mass Deception” from
Dialectic of Enlightenment [
11]. The term “creative economy” was used for the first time by Australian Prime Minister Paul Keating, whose government released “Creative Nation: Commonwealth Cultural Policy” in October 1994 [
12]. Economies currently face new challenges such as the spread of information and communication technologies and the growing importance of highly educated workers and human capital in innovation cycles [
13]. In order to maintain competitiveness, the importance of innovation, intellectual property rights, and “smart solutions” using highly educated workers, artists, and creative people is growing. Their significance is defended in works such as “These People Are the New Driving Power of Expanded Economies”, “The Economic Performance of the UK’s Creative Industries”, and in “Creativity is Crucial” [
14,
15,
16]. Different countries show different approaches to creative industries and different degrees of maturity in their approach to supporting them. It is obvious that no single concept or definition of the terms exists; however, the essence remains the same: a modern concept of cultural and innovation policy in terms of the interconnection between culture and the economy and market environment.
The cultural and creative industries in Central Europe came to the public at a later stage than in Western European countries. The end of economic crisis started a period in which investment tended to grow [
17]. One of the first activities was the Forum for Creative Europe held in Prague in 2009 under the Czech Presidency of the European Union. In 2011, the research project “Mapping Cultural and Creative Industries in the Czech Republic” was launched in the Czech Republic by the Art Institute. The aim of this project was to define and obtain complete quantitative and qualitative information on the state of individual sectors of cultural and creative industries. The “Methodology for Mapping Cultural and Creative Industries at Local and Regional Levels” was published as a result of this project in 2015 [
1,
18].
The methodology describes the workflow for analyzing phenomena in a given territory and identifying the conditions in and needs of individual sectors of cultural and creative industries. In the context of this methodology, the activity to detect current conditions is referred to as “mapping”. However, it does not handle any spatial/cartographical mapping in the true sense, because no map outputs are created. The main objectives of this methodology are to create and describe the processes for mapping creative industries at local and regional levels. Furthermore, it creates a unified system according to which it is possible to compare individual territorial units and apply the system repeatedly in one location with the aim of obtaining comparable results over a period of time.
1.2. The “Creative Olomouc” Project
The main goal of mapping creative industries in Olomouc was to determine the current state, structure, and dynamics of the industry around Olomouc, Czech Republic. The town of Olomouc has a population of over 100,000 inhabitants. A very specific aspect, which is not observable in other cities, is the city’s synergy with the University—Palacký University has 25,000 students and 4000 employees, and it is the largest employer and labor force in the Olomouc Region [
19]. Acquired knowledge should play an important role in designing a support sector for cultural and creative industries, and it makes a significant contribution to the development of both local and regional development strategies. The aim was to create an information base which has outputs that can possibly be taken into account in forthcoming updates to the Strategic Development Plan. A strategy for developing creative industries can be established based on the outputs from mapping. Furthermore, sub-measures will be considered: construction of a creative center and greater interconnectivity between creative industries and tourism/university. Based on this project, twelve fields of creative industries were spatially processed (
Table 1), representing more than 4000 subjects/entities acquired from public databases and field surveys. These entities had to be properly verified and filtered, and only available and relevant records were included in accordance with the project requirements.
The idea led to the introduction of a “Creative Olomouc” project. This project was created by Palacký University, the Statutory City, the Olomouc Region, and the Arts and Theatre Institute. The main objective of the mapping was to identify the current state, structure, and dynamics of individual branches of creative industries in the region. The original impetus for mapping came from the university environment, followed by a negotiation of support and cooperation with the political representation and magistrate departments of the city, especially with the Department of Concept and Development, the Economic Development Department, and the Department of Culture. The actual launch of the project then took place in September 2015.
The fundamental basis of cooperation was in the “Memorandum on Collaboration for Mapping Cultural and Creative Industries in Olomouc” which describes the commitments of various stakeholders. The Art Institute provided its own methodology for mapping cultural and creative industries in Olomouc which was created under the project “Mapping Cultural and Creative Industries in the Czech Republic” and provided expert methodological consultations for its successful implementation. The city of Olomouc was involved in providing documents and ensuring communication with individual parties involved in mapping through their organizational units and contributory organizations. Mapping itself was carried out in accordance with a methodology by the staff and students of Palacký University.
2. Data and Methods
2.1. Data
The Creative Olomouc study originally examined raw data from 4374 entities (i.e., companies, institutions, and individuals) in the Olomouc District obtained from public registers, databases, and field studies. Primary data collection took place in 2016 and 2017. Data are still kept up to date by annual updates to the original non-spatial database. Each record has 20–30 additional attributes (addresses, employee numbers, VAT ID, etc.). Processing of these bulky data was carried out manually by a team of experts who had to verify the whole dataset. The process was done gradually by establishing contact with each original subject and then verifying and validating the information collected. Verified data were shared in a cloud-based environment (Google Docs) among a team of authors. For further cartographic visualization and GIS processing, data from a commercial database (ArcCR 500), an open database (OpenStreetMap), and the Czech Statistical Office were combined. Topographical data such as city/region borders, roads, rivers, railways, etc., were obtained from ArcCR 500; these layers were used as the topographical background on the scale of 1:500,000. It was a spatial-based vector dataset provided by Esri in SHP/GDB formats. Some of the thematic data (ATMs, shops, tram and bus stops) were obtained from OpenStreetMap by point layers. Finally, economic and statistical aspects (e.g., exact address points, number of employees, turnover) were obtained from the Czech Statistical Office in tabular form. The resulting dataset was a vector dot layer in the Esri shapefile format with all attributes representing the data. It uses the UTM WGS84 coordinate system (latitude/longitude).
The original intention of the study was to carry out mapping only within the city of Olomouc. However, based on the initial surveys, it could be seen that a number of entities beyond the city boundaries were also involved in the cultural and creative industries of the city and had to be included in the study. Several subjects involved in the economic activity of the downtown area also had their headquarters outside the city of Olomouc. For these reasons, the study was extended beyond the territory of the city of Olomouc.
2.2. Workflow
The study was based on the certified methodology of the Ministry of Culture of the Czech Republic [
1] which was divided into seven stages:
Creation of a list of entities;
Verification of the list;
Identification of industry needs (seminars);
Surveys;
Additional methods;
Quantitative analysis;
Qualitative analysis.
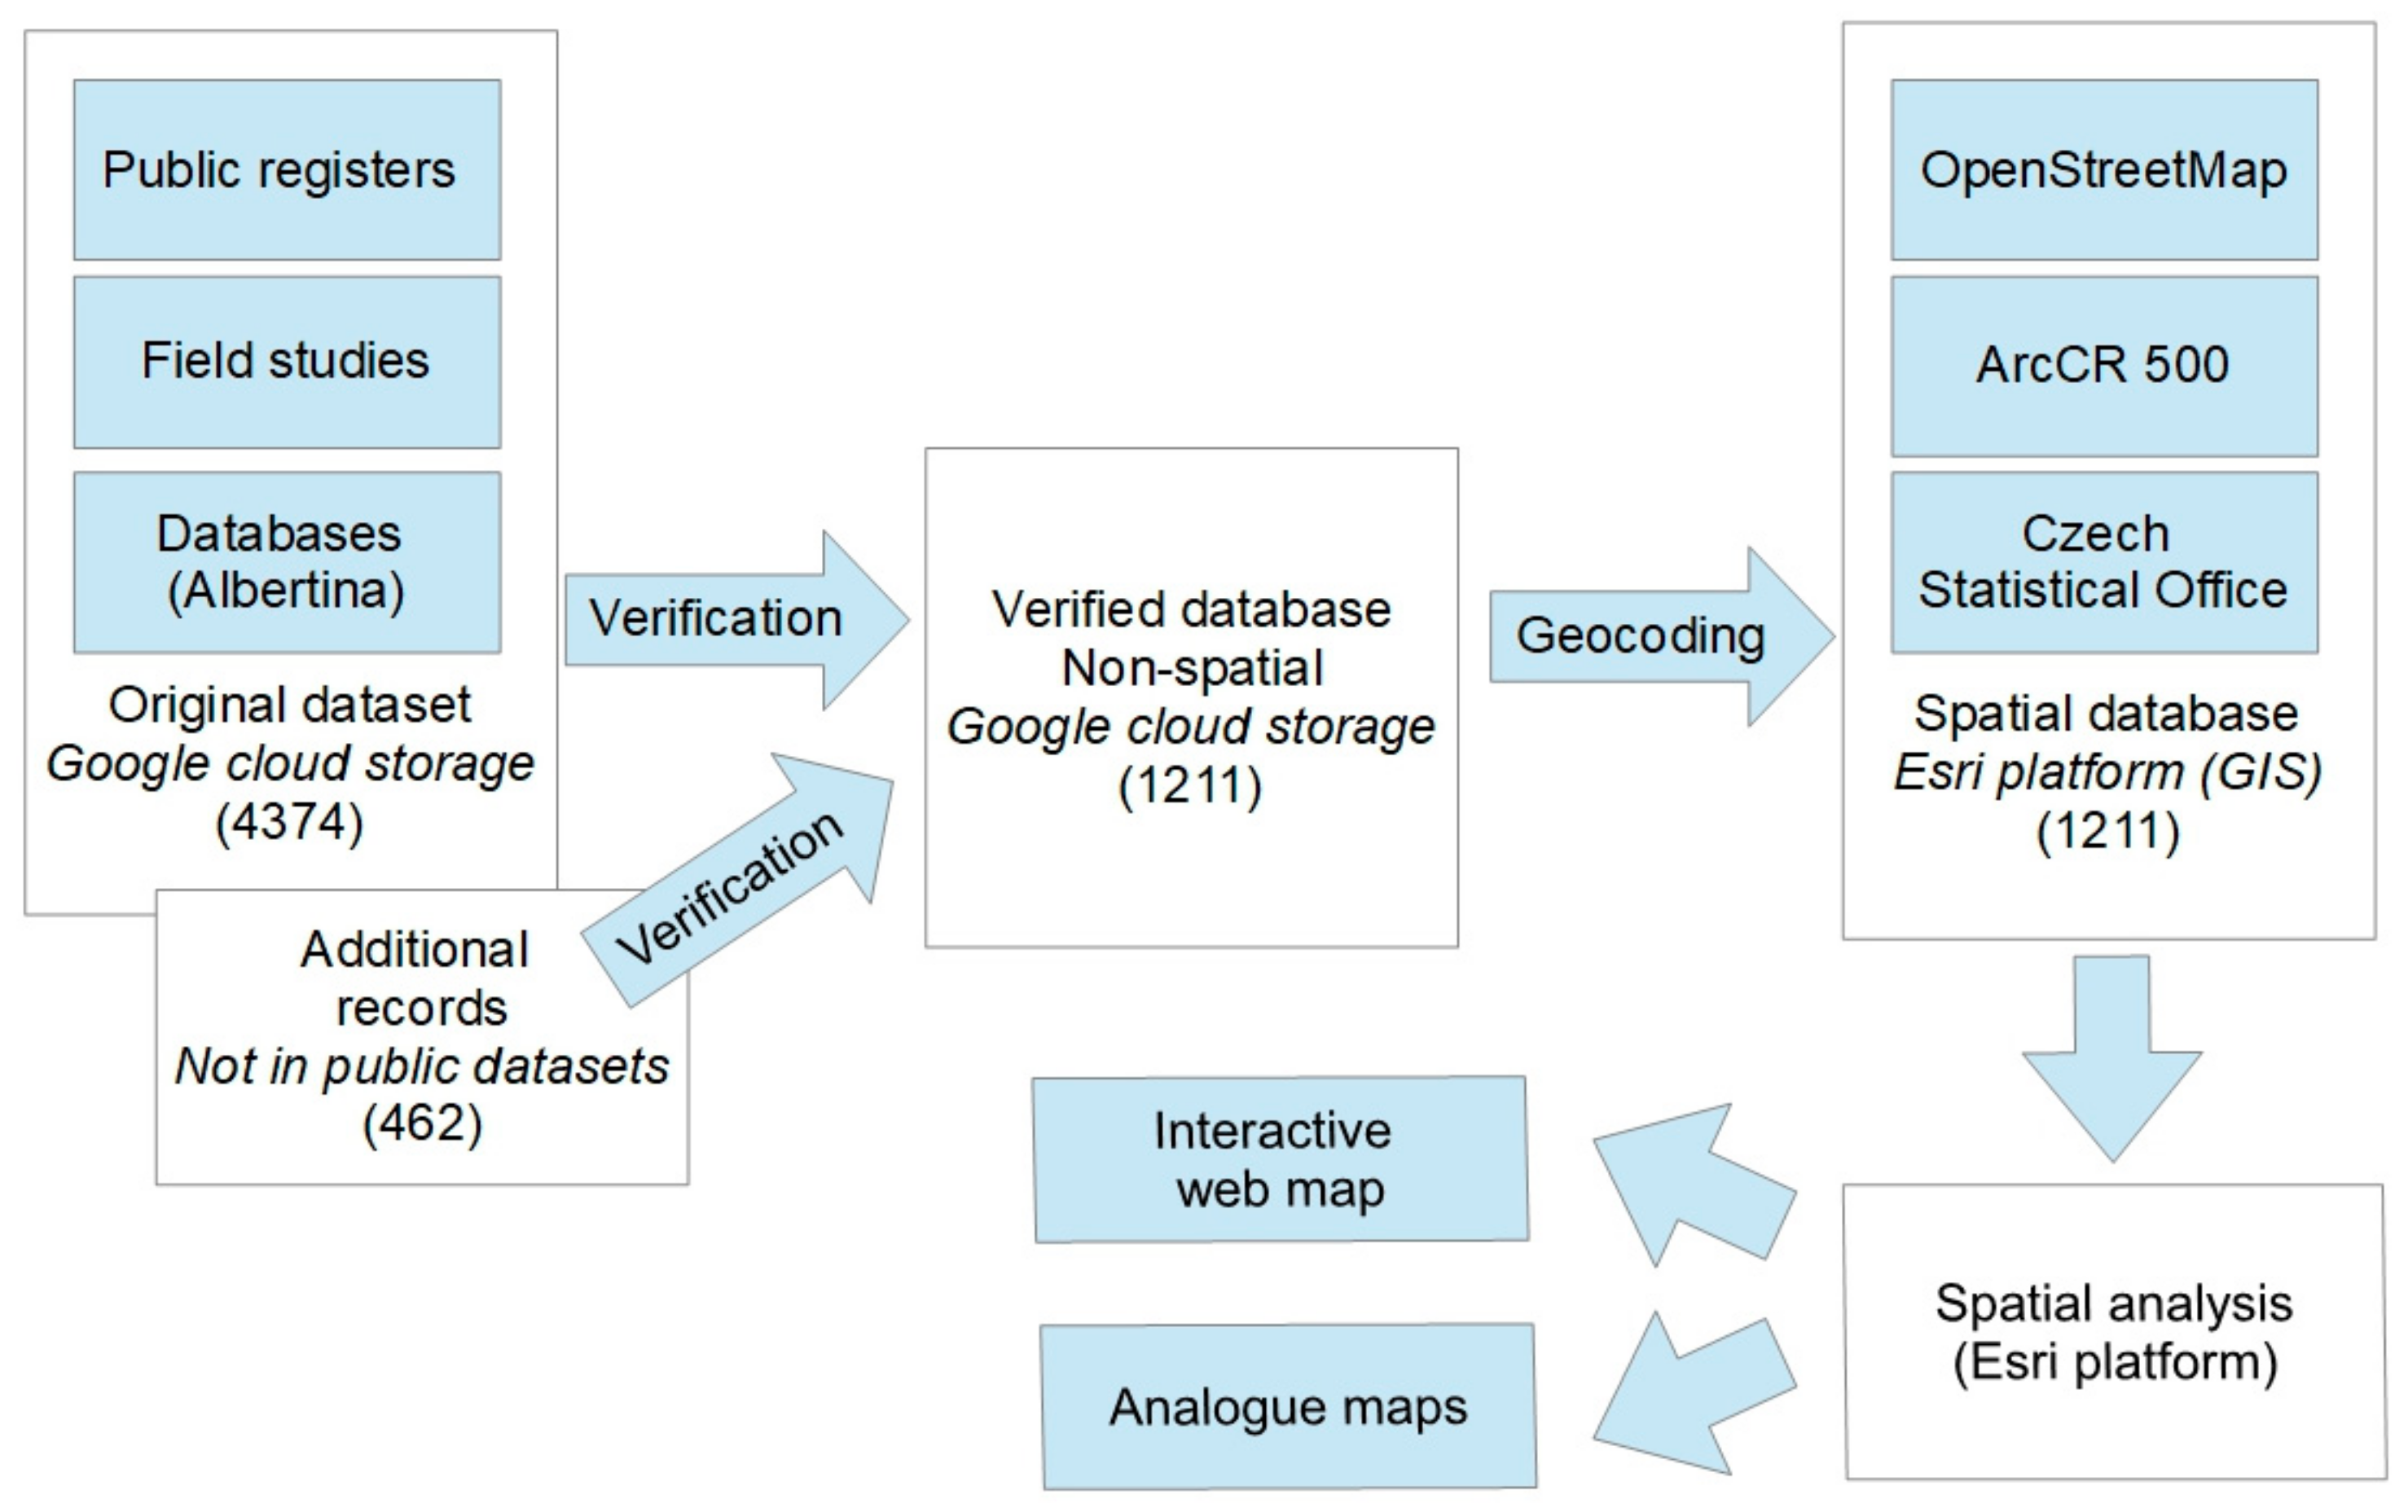
The primary dataset was collected from the Albertina database tracking list. The subjects were selected according to the prevailing activity in the CZ NACE [EU standardized classification of economic subjects; NACE = Nomenclature statistique des activités économiques dans la communauté Européenne], which is the activity involving the overwhelming majority of the company’s turnover. A database with a total of 4,374 records was created from some of the data obtained. However, the NACE codes contained only very general specifications, and some entities had no link to cultural or creative industries or were not active. Because of these deficiencies in public registers, many mapping entities had to be excluded. After filtering inappropriate subjects, the data were verified by contacting individual entities and confirming the information about their activities. During the project, the data were supplemented by another 462 records not registered under the appropriate codes in the public registers. The raw data needed to be modified for processing in GIS. The data in the original tabular form had to be converted into spatial data in a standardized vector format (Esri shapefile). This represented the acquisition of postal addresses for all individual entities, followed by geocoding and transformation in specialized software, ArcGIS (see
Figure 1).
Another important factor in mapping and defining creative industries was organizing sector-specific seminars and questionnaire surveys on the activities of individual entities to collect detailed information about the activities and needs of individual entities and sectors. Data collection, filtering and verification, the seminars, and the questionnaire survey were carried out by a team of experts. Individual mapped sectors were then defined according to a table which followed the methodology. The table was created by the Art Institute [
1] (
Table 2).
Compared to the methodology of the Ministry of Culture [
1], some changes were made to the Creative Olomouc study due to the specific situation and demarcation of sectors between the methodology and actual conditions. The resulting distribution better corresponded to the needs and characteristics of the cultural and creative industries in the Olomouc Region. There was an above average number of subjects in the IT and audio–video sectors, while minimum number were placed in the crafts sector. The modifications merged sights, museums, and galleries together with libraries and archives into a common class under Cultural Heritage. Galleries were then included in Fine Arts because of their strong ties to local artists. Crafts were not mapped in detail, particularly because of the challenge in defining them considering their diversity and also because of their decline. Information technology and video games were classed as Software Development (affected by the proximity of the most important Czech IT hub in Brno and the enormous potential of the sector for further development). The TV and Radio and Film and Video classes were also merged because of their extensive interconnection and overlapping nature in the Olomouc Region. Because of historical tradition, a separate branch for Apparel and Fashion Design was reserved for the needs of creative industries in Olomouc.
Twelve final sectors were specified as a result of the described changes and comprised 1211 entities employing 5175 persons with an annual turnover of around EUR 190,000,000 (CZK 4722 million) (
Table 1). The strongest sector in terms of the number of subjects was Literature, Books, and Press with 302 subjects, followed by Software Development (130), Fine Arts (123), and Music (120) [
19].
3. Implementation of Geographical Information Systems
3.1. Data Pre-Processing
Data containing information about entities were originally tabular (Google Docs storage: Google Tables) and it was not possible to work with such stored data in a GIS. It was therefore necessary to convert the data into spatial vector data, i.e., the Esri shapefile format. In order to assign a location to entities, several methods are possible, the most commonly used being geocoding of addresses or direct localization by coordinates. Because the tabular data already had address and city attributes, geocoding was selected. According to Longley et al. [
3], geocoding, or addressing, is a term for assigning accurate positioning to entities based on address information or coordinates in a particular coordinate system, typically latitude and longitude. The geocoding process is absolutely necessary for any further work in a GIS. It is important to note the instability of the geocoding system over time. Renaming and replacing of phenomena may result in errors [
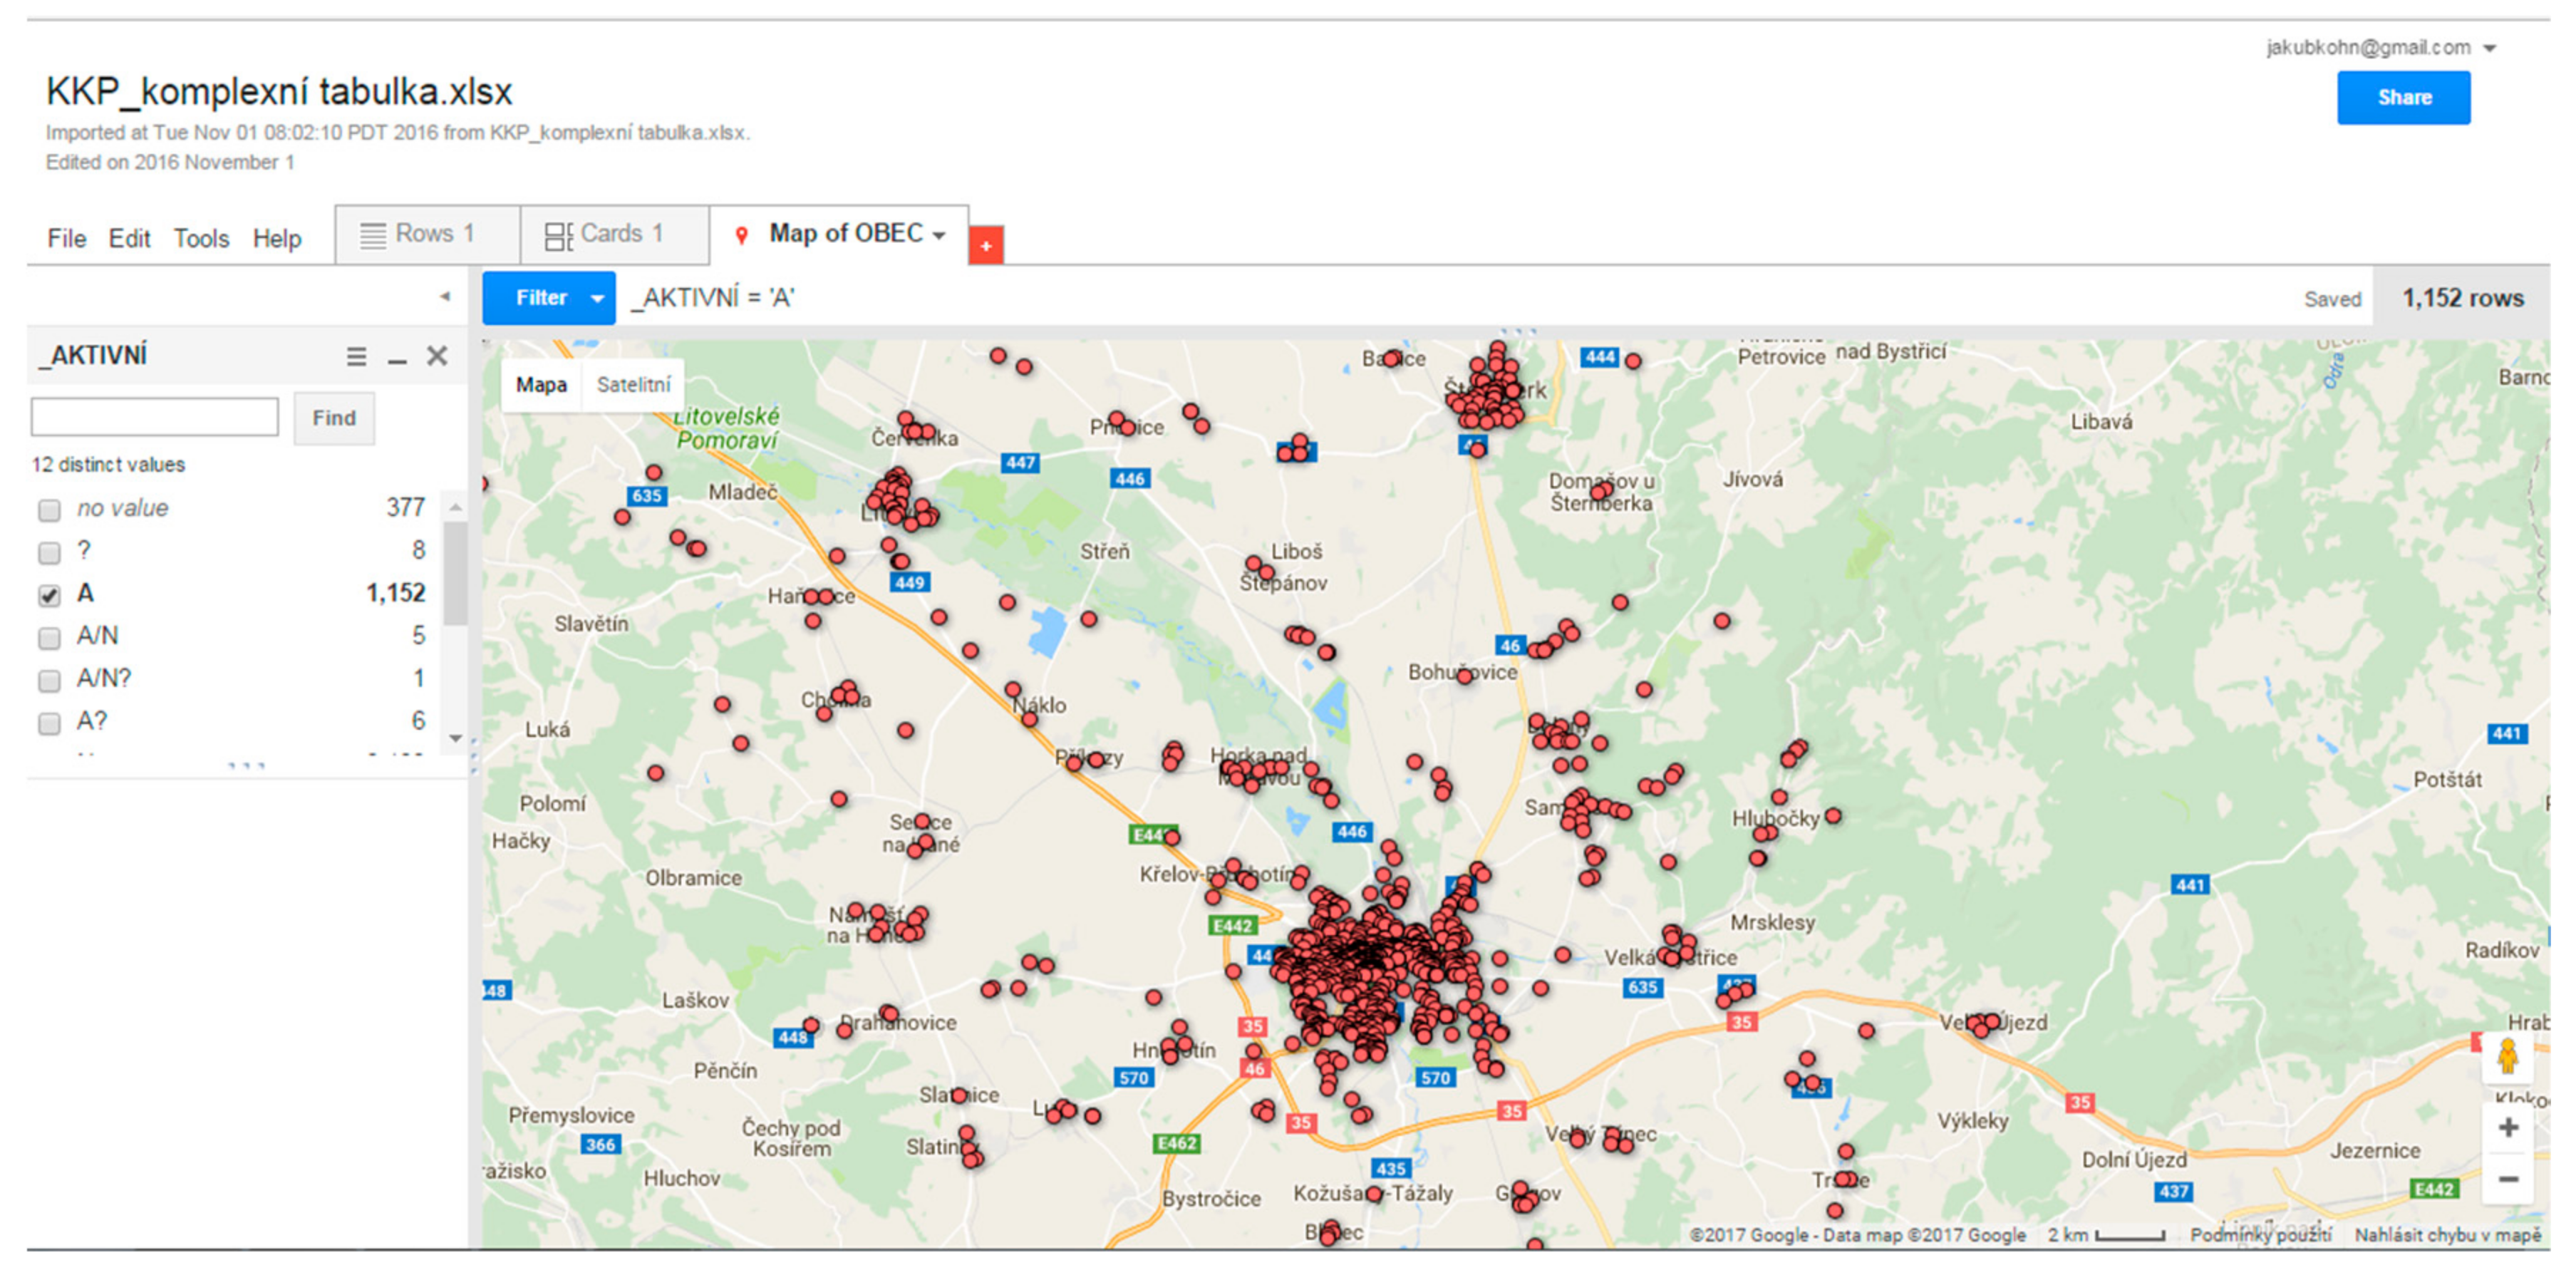
3]. Today, a number of methods allow objects to be located in space by geocoding addresses, but the complete address must be in one column. For this reason, the first data processing step was to create a new, full column in order to geocode the subjects. Google Fusion Tables was selected for the geocoding process, primarily because of the Google Docs cloud environment. Google Fusion Tables is an online tool which allows geocoding in a user-friendly way— the address column type only needs to be modified to “Location” and then the full address column in the “Map of” tab selected (
Figure 2). The only drawback of this solution is the limited export of spatial data formats. For this reason, it was necessary to make another intermediate step. The geocoded data were saved in KML and converted into the Esri shapefile format with all attributes using the ArcGIS Desktop v10.5 specialized software and then modified for further GIS processing.
3.2. Spatial Analysis
After collection and necessary modifications, the data obtained could be processed and visualized according to locations in space. The main objective behind the mapping was to identify the strengths and needs of individual sectors and the specific characteristics of cultural and creative industries in the city of Olomouc and its surroundings. The same requirements were also set for visualizing the spatial delimitation of entities and its GIS processing. Cartographic processing was carried out according to two main approaches. The first approach involved the requirements of the Creative Olomouc project and mapping team. Based on these requirements, cartographic outputs were tailored to the needs of the mapping team. The second approach was oriented toward cartographic visualization. This task was to outline the visualization methods which would serve as a glimpse of the future use of GIS in mapping cultural and creative industries, further providing inspiration for mapping other cities and regions in the Czech Republic [
20]. Since the spatial distribution of entities in the Olomouc Region is very irregular, with most entities located in the city center and the remaining approximately 20% outside the city’s boundaries, it was necessary to create map outputs specifically for the city of Olomouc and the region as a whole in various scales and in different formats. For ease of reproduction, the A4 page format was selected as the default for creating cartographic outputs.
The next step was spatial analysis and interactive visualization of the results. Cultural and creative industries are not a self-supporting group; they are strongly connected to each other, their surroundings, and other economically active entities. Spatial deployment of creative industries is therefore influenced by a number of socio-economic aspects (e.g., infrastructure, influence of shopping malls, transport availability or local competitors) that were necessary (for the implementation of a GIS) to include in the resulting spatial analyses and subsequent visualization of these aspects. An attempt was made in the GIS to incorporate creative industries into the mapping of factors which influence the behavior and decision-making of the city’s population, who are the driving force of these creative industries. Another objective behind the geoinformatics processing was the identification of sites with the potential for developing creative industries based on the outputs from the spatial analyses. The process was conducted by testing the usability of datasets with a socio-economic character and determining the applicability of individual spatial analyses to appropriately define the spatial relationships between creative industries and the socio-economic phenomena in their surroundings. A functional solution for the spatial potential is proposed in
Section 3.3.5. From an interdisciplinary point of view, the authors consider this chapter to be of the most benefit.
Based on the application of the certified methodology of the Ministry of Culture [
1] over the Olomouc Region, the socio-economic aspects with the greatest impact on the development of creative industries were identified as:
Population density;
Accessibility of subjects;
Accessibility of subjects via cycling;
Availability of subjects from public transport stops;
Accessibility for pedestrians to creative industries from city car parks;
Defining optimal locations for developing creative industries based on a combination of the abovementioned aspects.
3.3. Selection and Comparison of the Usability of Spatial Analyses and GIS Methods
By linking information about creative industries and the socio-economic data concerning subjects, spatial analysis in a GIS was possible. These methods provided detailed insight into the properties and rules of the spatial aspects of creative industries in Olomouc. The objective was to provide interpretation and visualization of the spatial relationships between creative industries and decision-makers in the population, who are the basic driving force behind the development of creative industries. The results of the analyses were visualized not only in static form using maps but also in an interactive form via a web application [
21]. The outputs of some analyses were unfortunately, however, not published as static maps, but their application in an interactive environment was a very clear and useful output. These visualization variations have consequently required customized testing and selection of analyses. The following spatial analyses and methods were applied and tested:
Network analysis (service area, closest facility, location–allocation);
Kernel density;
Accumulated cost surface;
Spatial join;
Urban planning analysis;
Voronoi polygons;
Weighted overlay.
3.3.1. Network Analysis
Network analysis can be considered a fundamental tool [
22]. It is a group of mathematical operations over a topologically correct model—the network. It is routine in the field of traffic, public transport, and (socio)economics. Typically, it allows for the creation of an individually “rated” network consisting of vertices and edges. Based on the rating of individual sections, barriers, and network throughput, some operations over this network were calculated (e.g., service and availability zones of some entities, the shortest and/or fastest route). Three types of analyses were applied:
Service Area: The possibility of creating service zones and the availability of individual entities including the factors associated with them [
22]. Urban public transport service zones were created to provide representative visualizations of the availability of subjects in the creative industries via public transport. The input dataset for calculations was created over the road layer from the OpenStreetMap dataset without constraining unidirectional, branching, barrier, and speeding (the analysis focused only on pedestrian serviceability).
Closest Facility: Verifying the availability of entities from different (significant) locations in the city [
22]. As a result, there was an unclear combination of routes that could not be published in static (analogue) form. Practical use was in an interactive web application—the feature was incorporated by clicking on the map space to convert the route to the closest subject to the creative industries.
Location–Allocation: Locates the subject and assigns it to a consumer [
22]. At first glance, the analysis seemed ideal, but because of the complex definition of consumers, creative industries were dropped from this spatial analysis.
3.3.2. Kernel Density Estimation
Kernel density estimation is a method for calculating core estimates. Based on point records in a certain area, this method visualizes the observed phenomenon through a continuous array. The distance and statistical significance of individual points to the surroundings were evaluated [
23]. Raster outputs representing the distribution density of subjects in creative industries were also created and further analyzed in order to define sites with the potential for developing creative industries [
24].
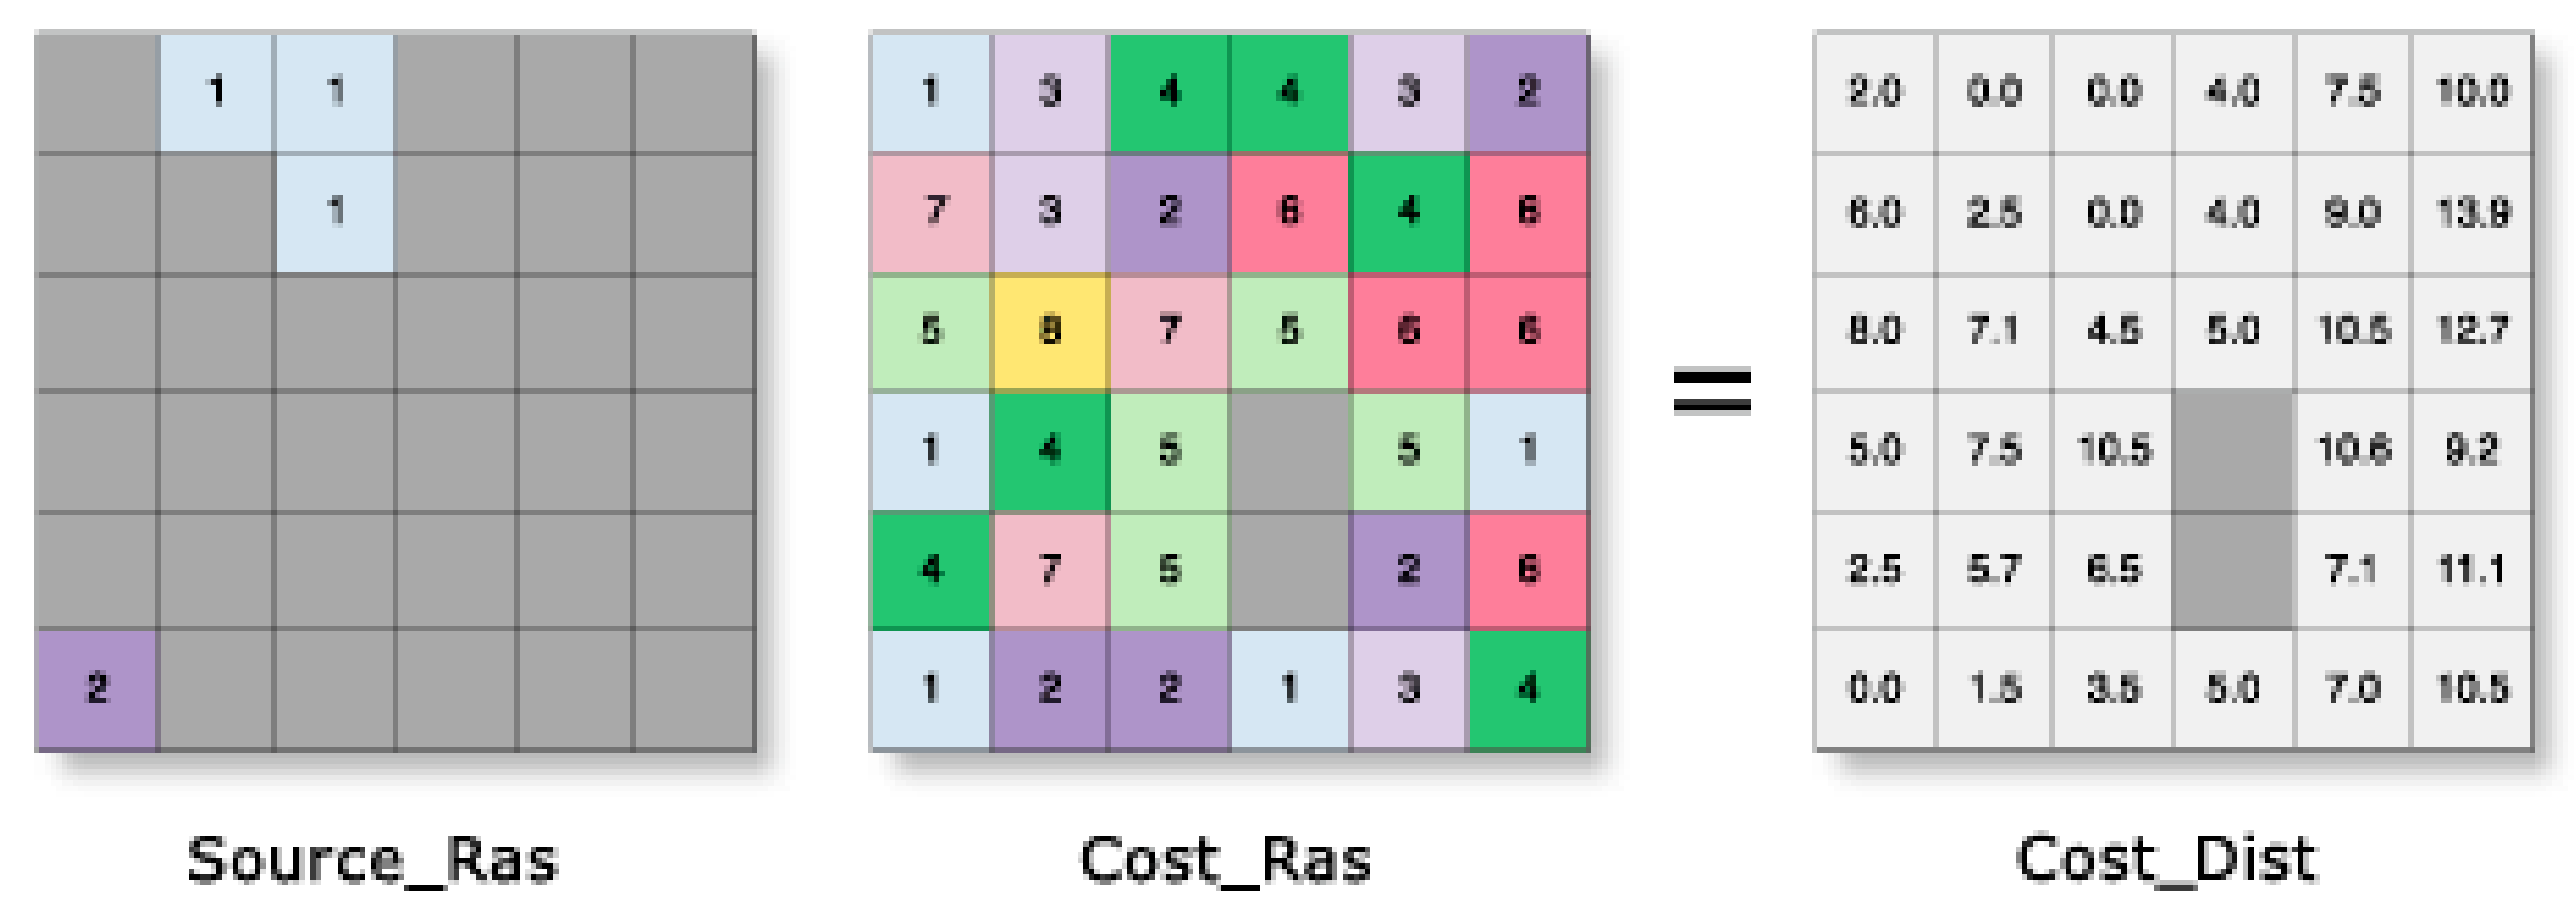
3.3.3. Accumulated Cost Surface
Spatial analysis working with raster data: this method creates a cost surface appreciated by the distance to move from the selected source. When moving across individual cells, the distance is multiplied by the frictional value [According to Reference [
25], a general cost distance formula is defined as: “Cost of travel over surface” × “Characteristics of the mover” × “Movement characteristics on the surface”, depending on the purpose and type of dataset] (
Figure 3). The output of the method is a so-called load surface, which represents the distance or difficulty of moving from the source point [
25]. Using this method, time and distance accessibility analyses were developed for creative industry entities which, in many cases, showed more accurate results than network analyses.
3.3.4. Spatial Join
The spatial calculation tool was used to generate most of the results. It allows the attributes (properties) of two element classes to be combined based on their mutual spatial relationship. The resulting combination of attributes is effected in the newly created element class [
24]. We used Spatial Join to create a hexagonal grid of population density in which the polygon layer of hexagons and address points were spatially connected. This method was also used to connect a layer of subjects from a creative industry with parts of the city in order to create a choropleth map which represents individual branches. In this case, attributes from the original layer were joined to the branched layer based on the same spatial location. In the implementation of a GIS in mapping, this tool has enabled, in particular, elements used in other spatial analyses and methods to be appropriately prepared.
3.3.5. Urban Planner
Urban Planner is an analytical extension of the ArcGIS for Desktop software and used to evaluate the territorial potential and identify optimal areas for territorial development based on multi-criteria analyses. It uses territorial analytical data as input. Based on an assessment of the territorial potential using set values, pillar weight, and various other factors and phenomena, areas with the potential for further development can be effectively visualized [
26]. The Urban Planner extension was tested primarily for the purpose of verifying the ability to identify sites with the potential for developing creative industries. This testing was carried out on the city of Olomouc using territorial analytical data provided by the Olomouc municipality. Urban Planner was a very useful tool for mapping creative industries to implement in a GIS.
Since this extension is primarily intended for spatial planning, it was necessary to adjust the input data and individual scales appropriately so as to be able to properly visualize sites with the potential for developing creative industries. During the initial set-up of optimal locations, the overall potential for the economic development scenario of Transport, Housing, and Commercial Facilities was worked out in the default settings. It resulted in completely eliminating the city center where the largest number of subjects is actually concentrated. In a more detailed study of this problem, it was found that the data layers entered into the calculation considerably limited territorial development in the city center. Specifically, flood risk and the Protection of Cultural and Social Elements had to be excluded from the calculation. Creative industries are firmly tied to the center of the city and are a part of its cultural and social elements. The flood risk layer was not suitable and omitted because it did not include the center of Olomouc which is a key area for determining the potential of the territory in developing creative industries [
27].
Based on this knowledge, a brand-new category of “Culture Olomouc” was created in order to facilitate the adjustment of the input data layers and their combination (
Figure 4). However, this approach did not prove ideal, because each layer required data layers with specific settings, and it was therefore not possible to combine them into a single category. This is why “Culture Olomouc” was defined as a key category and combined with the Housing and Transport categories.
3.3.6. Specification of Service Areas using Voronoi Polygons
Another applied GIS method was defining the service areas of subjects in creative industries by Voronoi polygons (also called Thiessen polygons). Voronoi polygons are defined as polygons that contain just one service point. The other points inside the polygon are closer to this measured point than any other point measured [
28]. The only parameter for defining the service areas of individual entities is therefore only the direct distance from an entity not including any road network or obstacles in the field. For this reason, it is better to use spatial analysis or other analysis involving the calculation of at least the road network (see the abovementioned Accumulated Cost Surface method,
Section 3.3.3.). Despite these shortcomings, Voronoi polygons demonstrated to be a suitable solution for easy and clear visualization of the approximate gradient zones of individual subjects (
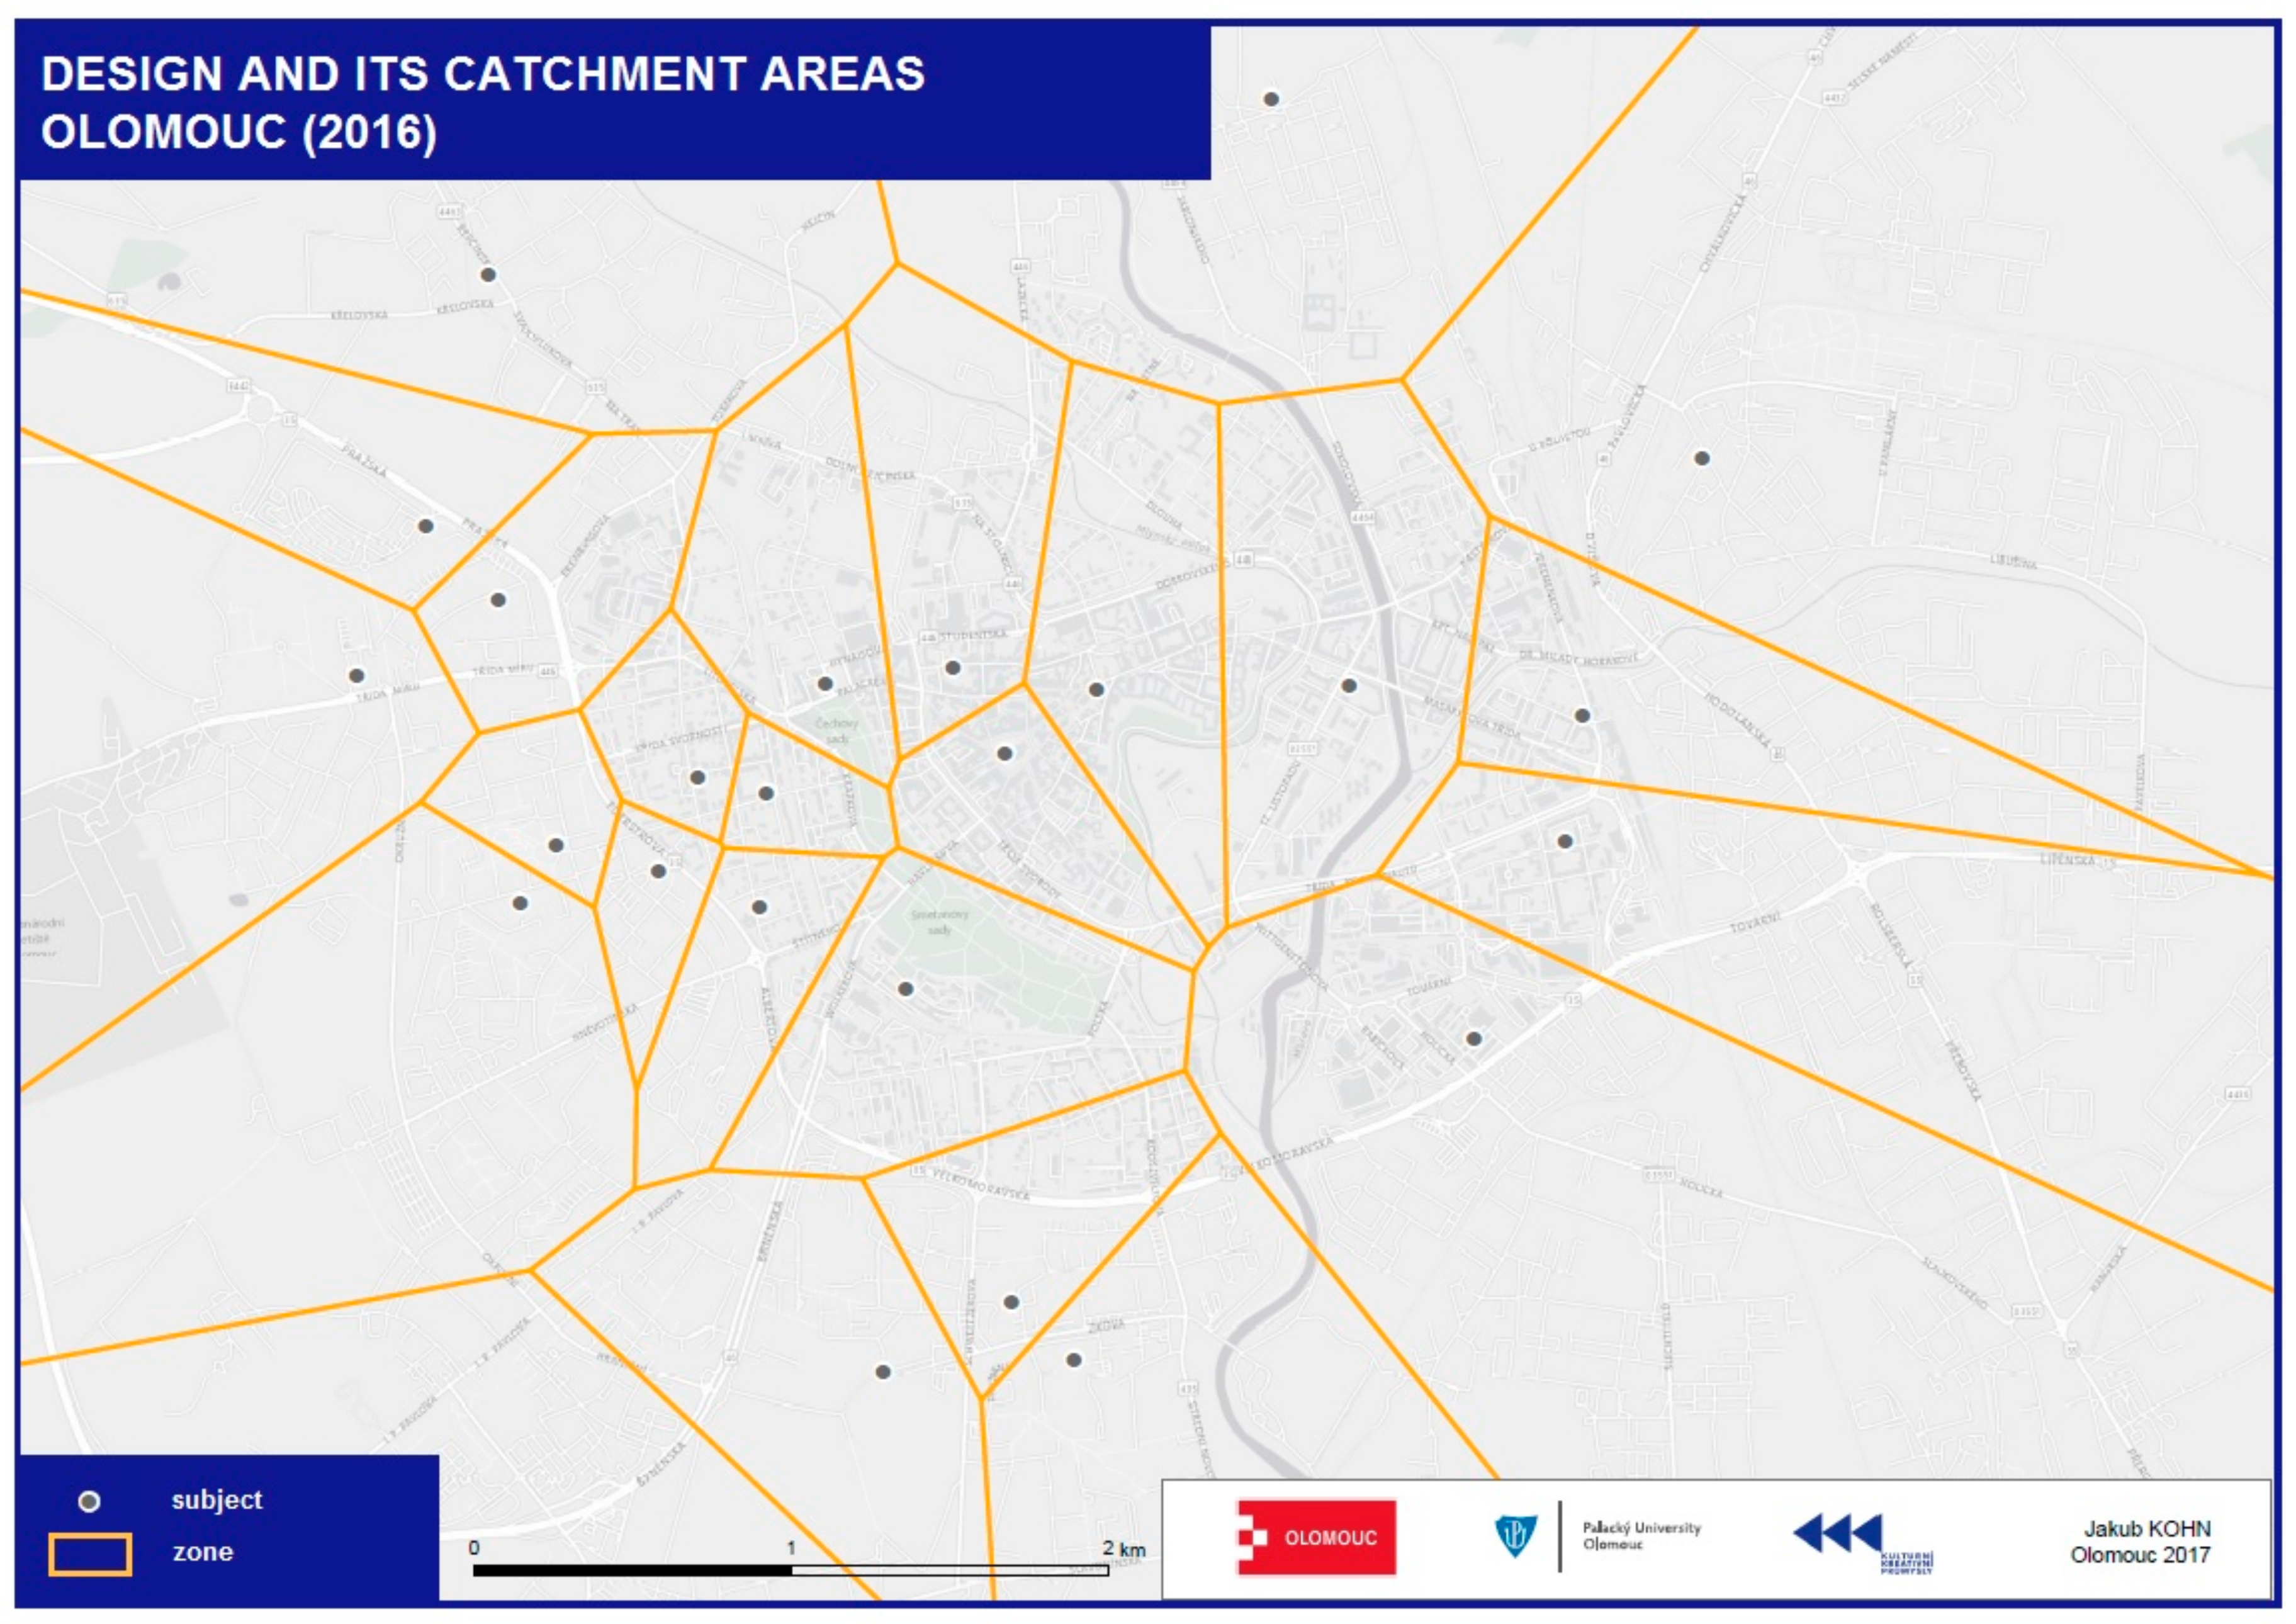
Figure 5). Based on the size of the resulting polygons, sites with large or possibly small coverage can be clearly identified. For greater clarity in outputs, service areas were defined for each of twelve sectors separately.
3.3.7. Weighted Overlay
The Weighted Overlay tool is one of the most commonly used approaches for defining locations based on the transformation of raster data [
29]. It is based on the settings of their importance (influence) as a weight (
Table 3). As part of the implementation of the GIS for mapping creative industries, this tool was applied to define optimal locations with development potential in Olomouc. Demarcation of the sites was carried out by transferring the outputs from previous analyses and methods which had been converted into raster form and, subsequently, appropriately reclassifying them. Combinations of multiple outputs with different balances (30%, 50%, and 80% according to Urban Planner Model [
26]) were also tested. In order to identify sites with the potential for developing creative industries, combinations of these outputs were tested:
Economic potential of the territory for housing development—the result of the Urban Planner extension;
Economic potential for transport development—the result from the Urban Planner extension;
Economic potential for cultural development—the result from the Urban Planner extension;
Density of the distribution of subjects in creative industries—the result of the kernel density method;
Density of parking spaces—the result of the kernel density method;
Density distribution—the result of the kernel density method;
Population density—hexagon grid created with the Spatial Join method;
Pedestrian public transport availability—the result of the Network Area Analysis Service Area;
Pedestrian accessibility to creative industries—the result of the Network Area Analysis Service Area;
Walkway Parking Availability—the result of the Network Area Analysis Service Area;
Results of cycling and pedestrian availability generated by the accumulated cost method.
On the basis of usability testing, the outputs generated with the accumulated cost method were taken from the selection as they represented mainly the line accessibility in the street network. The resulting weighted overlay calculation was oriented only towards those lines which did not correspond to the real distribution of phenomena entering the calculation. At the same time, it was necessary to set the weights to individual inputs in order to match reality as closely as possible. This fact proved to be a very demanding question, because it was modelling the real impact of many aspects that could not be precisely determined in this work. For this reason, the highest values near the 50% weighting density of the creative industry were set which is a basic prerequisite for further development because of the interdependence of subjects. Other outputs comprised the remaining 50% of the weight. This weight adjustment was carried out by testing individual settings and comparing the results. The output was a total of two maps showing locations with the potential for developing creative industries, one of which included outputs from the Urban Planner.
4. Results and Outputs
The main output comprised thirty analogue maps in which the spatial aspects of creative industries were visualized together with the spatial definition of the main socio-economic phenomena affecting cultural and creative industry activities in the Olomouc Region. These map outputs were part of the methodology, and thirty analogue map outputs were designed (see
Table 4). An interactive web application [Available at:
https://tinyurl.com/creativeolomouc.] was also compiled. It contains all the sub-maps (layers) from the static maps in digital form. The undisputed advantage of this application is the possibility of zooming to the building level which, combined with information about the subject in pop-up windows, represents a much stronger instrument of spatial representation of cultural and creative industries. Additionally, the application is complemented by so-called onscreen analysis, in which a route to the nearest subject is displayed after clicking on a specific location on the map. All analogue maps were forwarded to the municipality. Currently, map outputs are the base source for the Strategic Development Plan for another stage of the Creative Olomouc project (see Conclusion).
For the purposes of this work, the point character method (
Figure 6,
Figure 7 and
Figure 8) was the most convenient manner of simply visualizing the deployment of cultural and creative industry subjects and is also the most commonly used. It has been used to visualize subjects in a district or within a city’s boundaries and is often combined with spatial analysis outputs. This method also created the first map outputs providing insight into the approximate spatial distribution of cultural and creative industries in Olomouc and on which additional processing was adapted. The individual spots were color-coded according to the sector of the subject. Cartographic visualization of entities according to the number of employees or the minimum annual turnover was also processed using the point character method (
Figure 6). Subjects were categorized according to minimum annual turnover and number of employees. Different sizes were shown in each category.
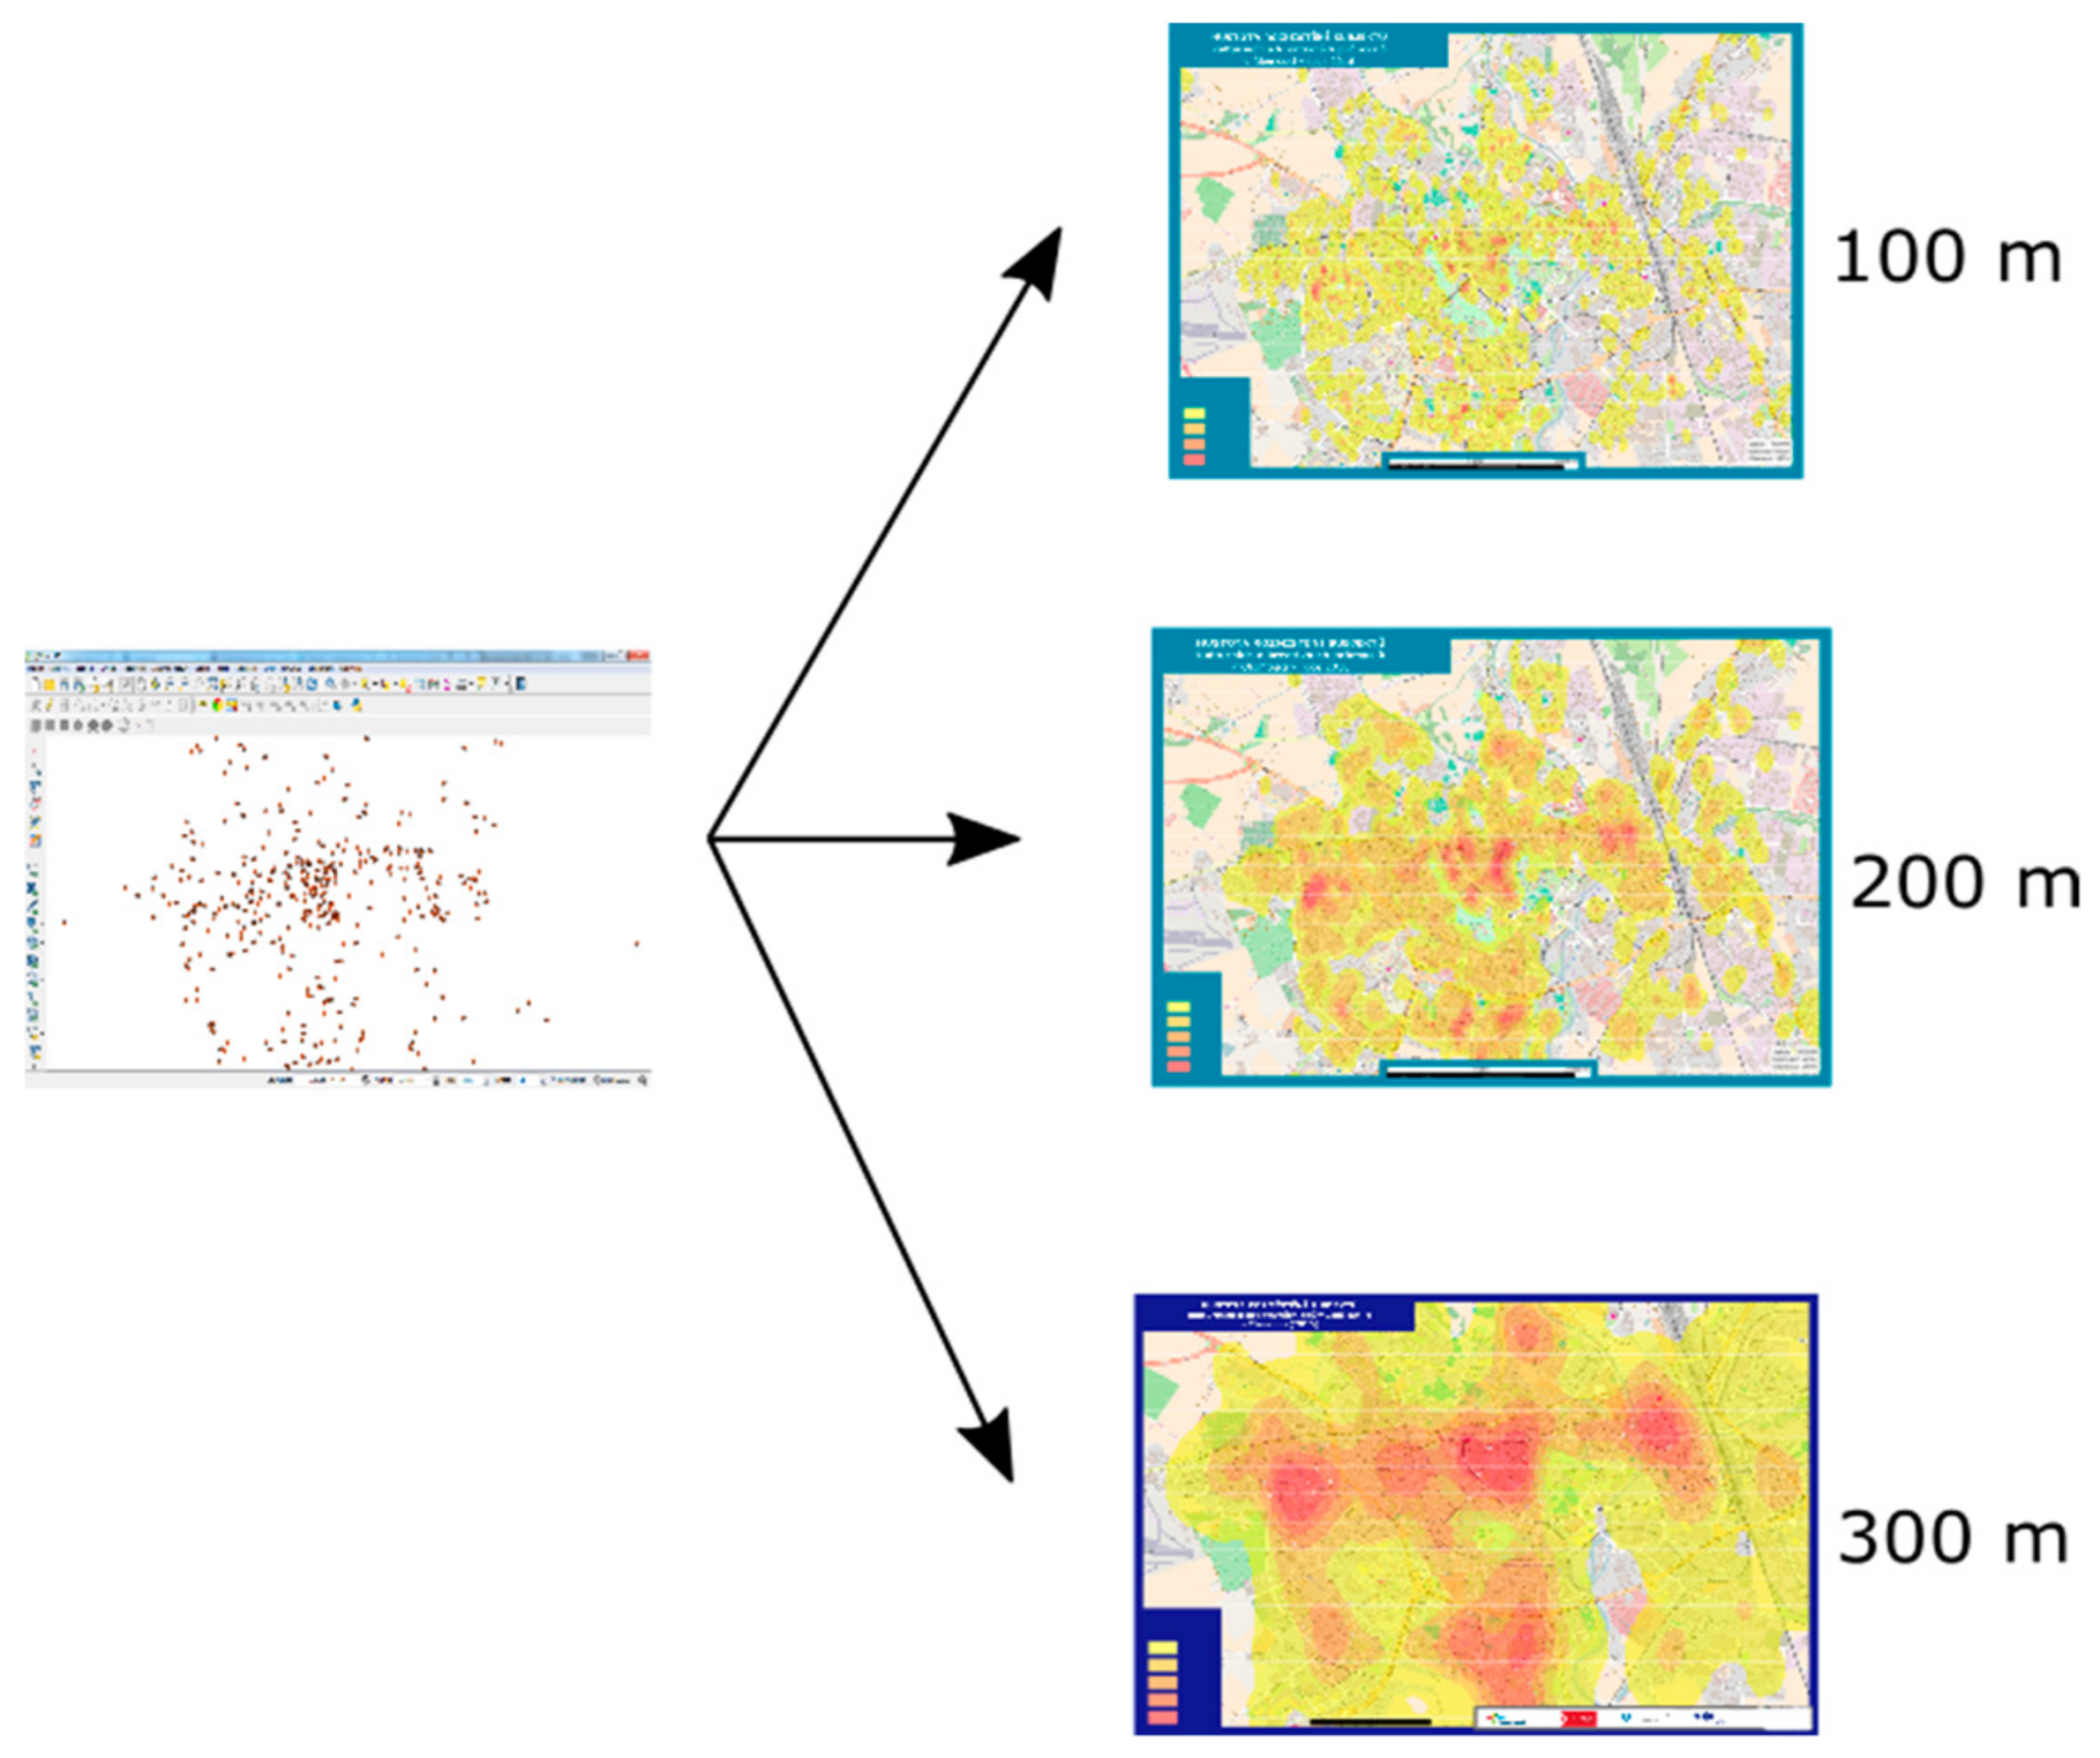
According to the mapping team’s requirements, heat maps depicting the density of deployment of cultural and creative industries in Olomouc were also developed. Heat maps are a specific type of dasymetric method and represent a very popular means of visualizing point-location depictions which are widely used, for example, in marketing [
30]. However, it is very important to set the radius of the calculation for clustering. If the input parameters are not appropriate, the final result may be very misleading [
31]. Maps with a radius of 100, 200, and 300 meters were created (
Figure 7). When comparing these maps, the most promising results showed an output with a radius of 200 meters.
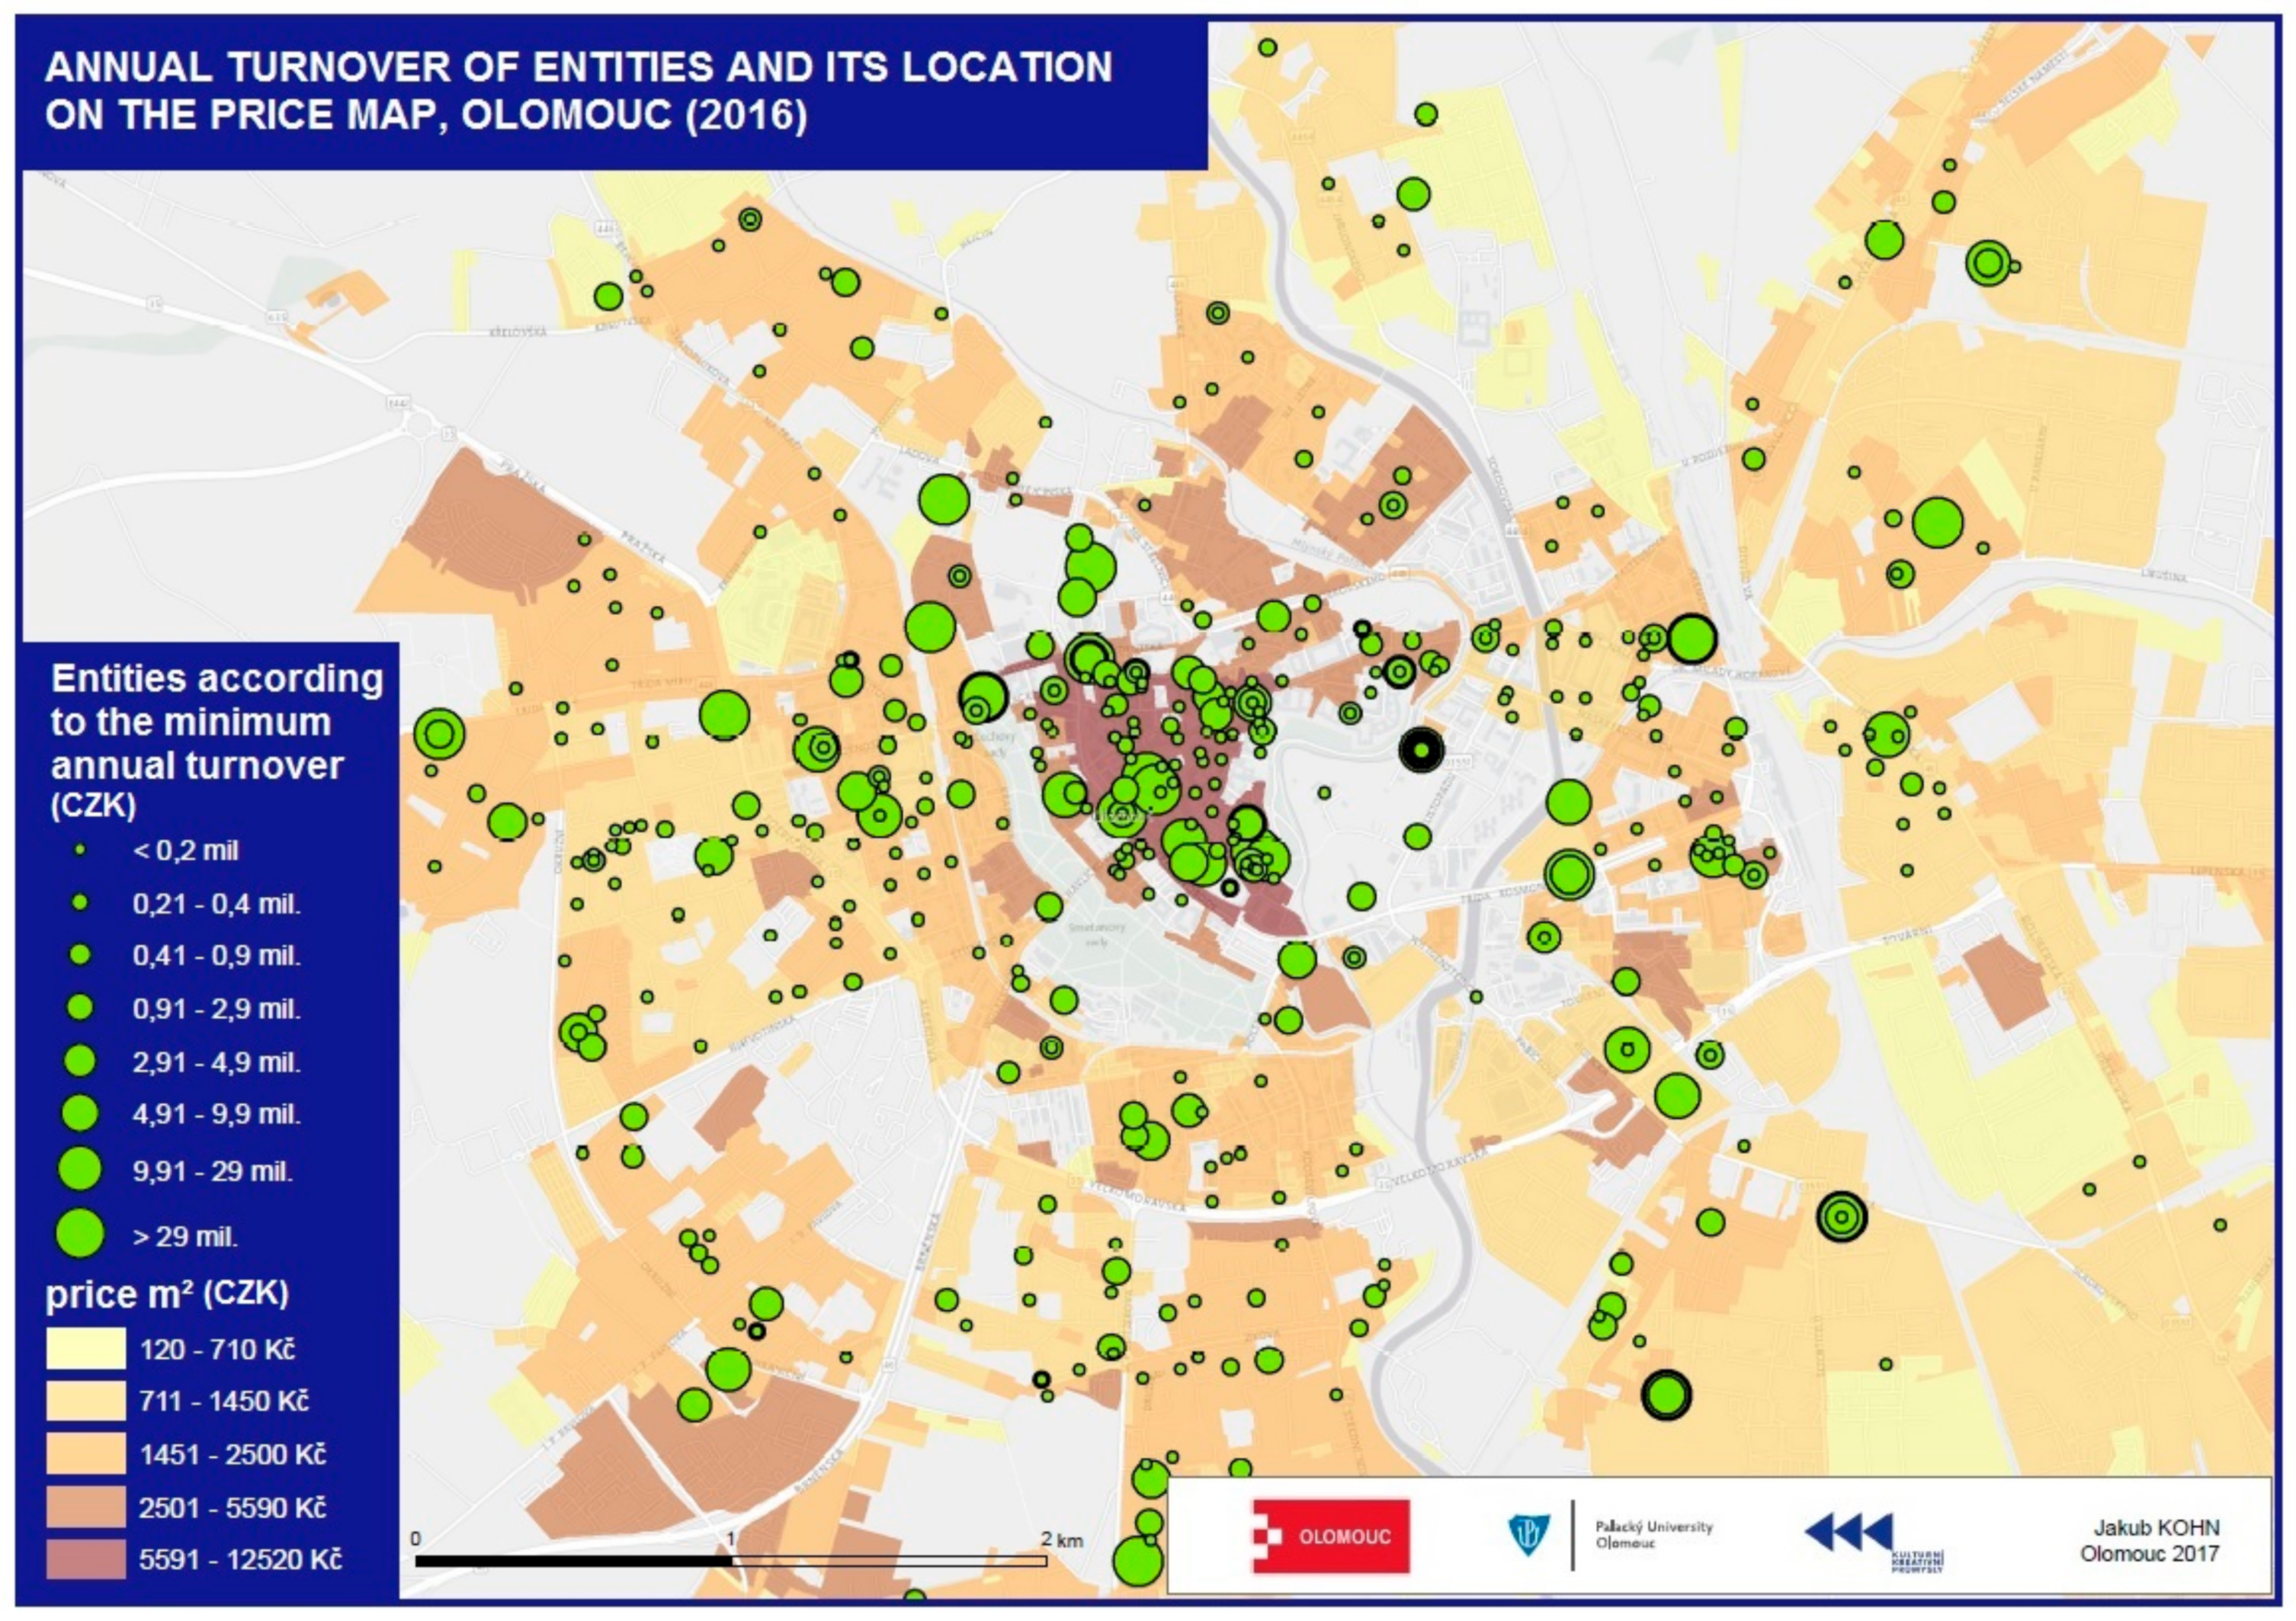
Very useful cartographic work for the mapping team was mapping subjects on an Olomouc price map (
Figure 8). This map shows individual entities using the cartographic method of the city map with point characters. The Olomouc price list was provided directly by the City Council of Olomouc. The same cartographic method can be used to create a population density map for the occurrence of subjects. More scientific conclusions will be published in following research (see Conclusion). So far, some correlations can be observed: location in the historical center or nearby public facilities (such as shopping malls), land price, and transport accessibility. It is evident that entities are dominantly located nearby the city center. The fundamental reason regards the position of the historical center where markets and storage are traditionally located.
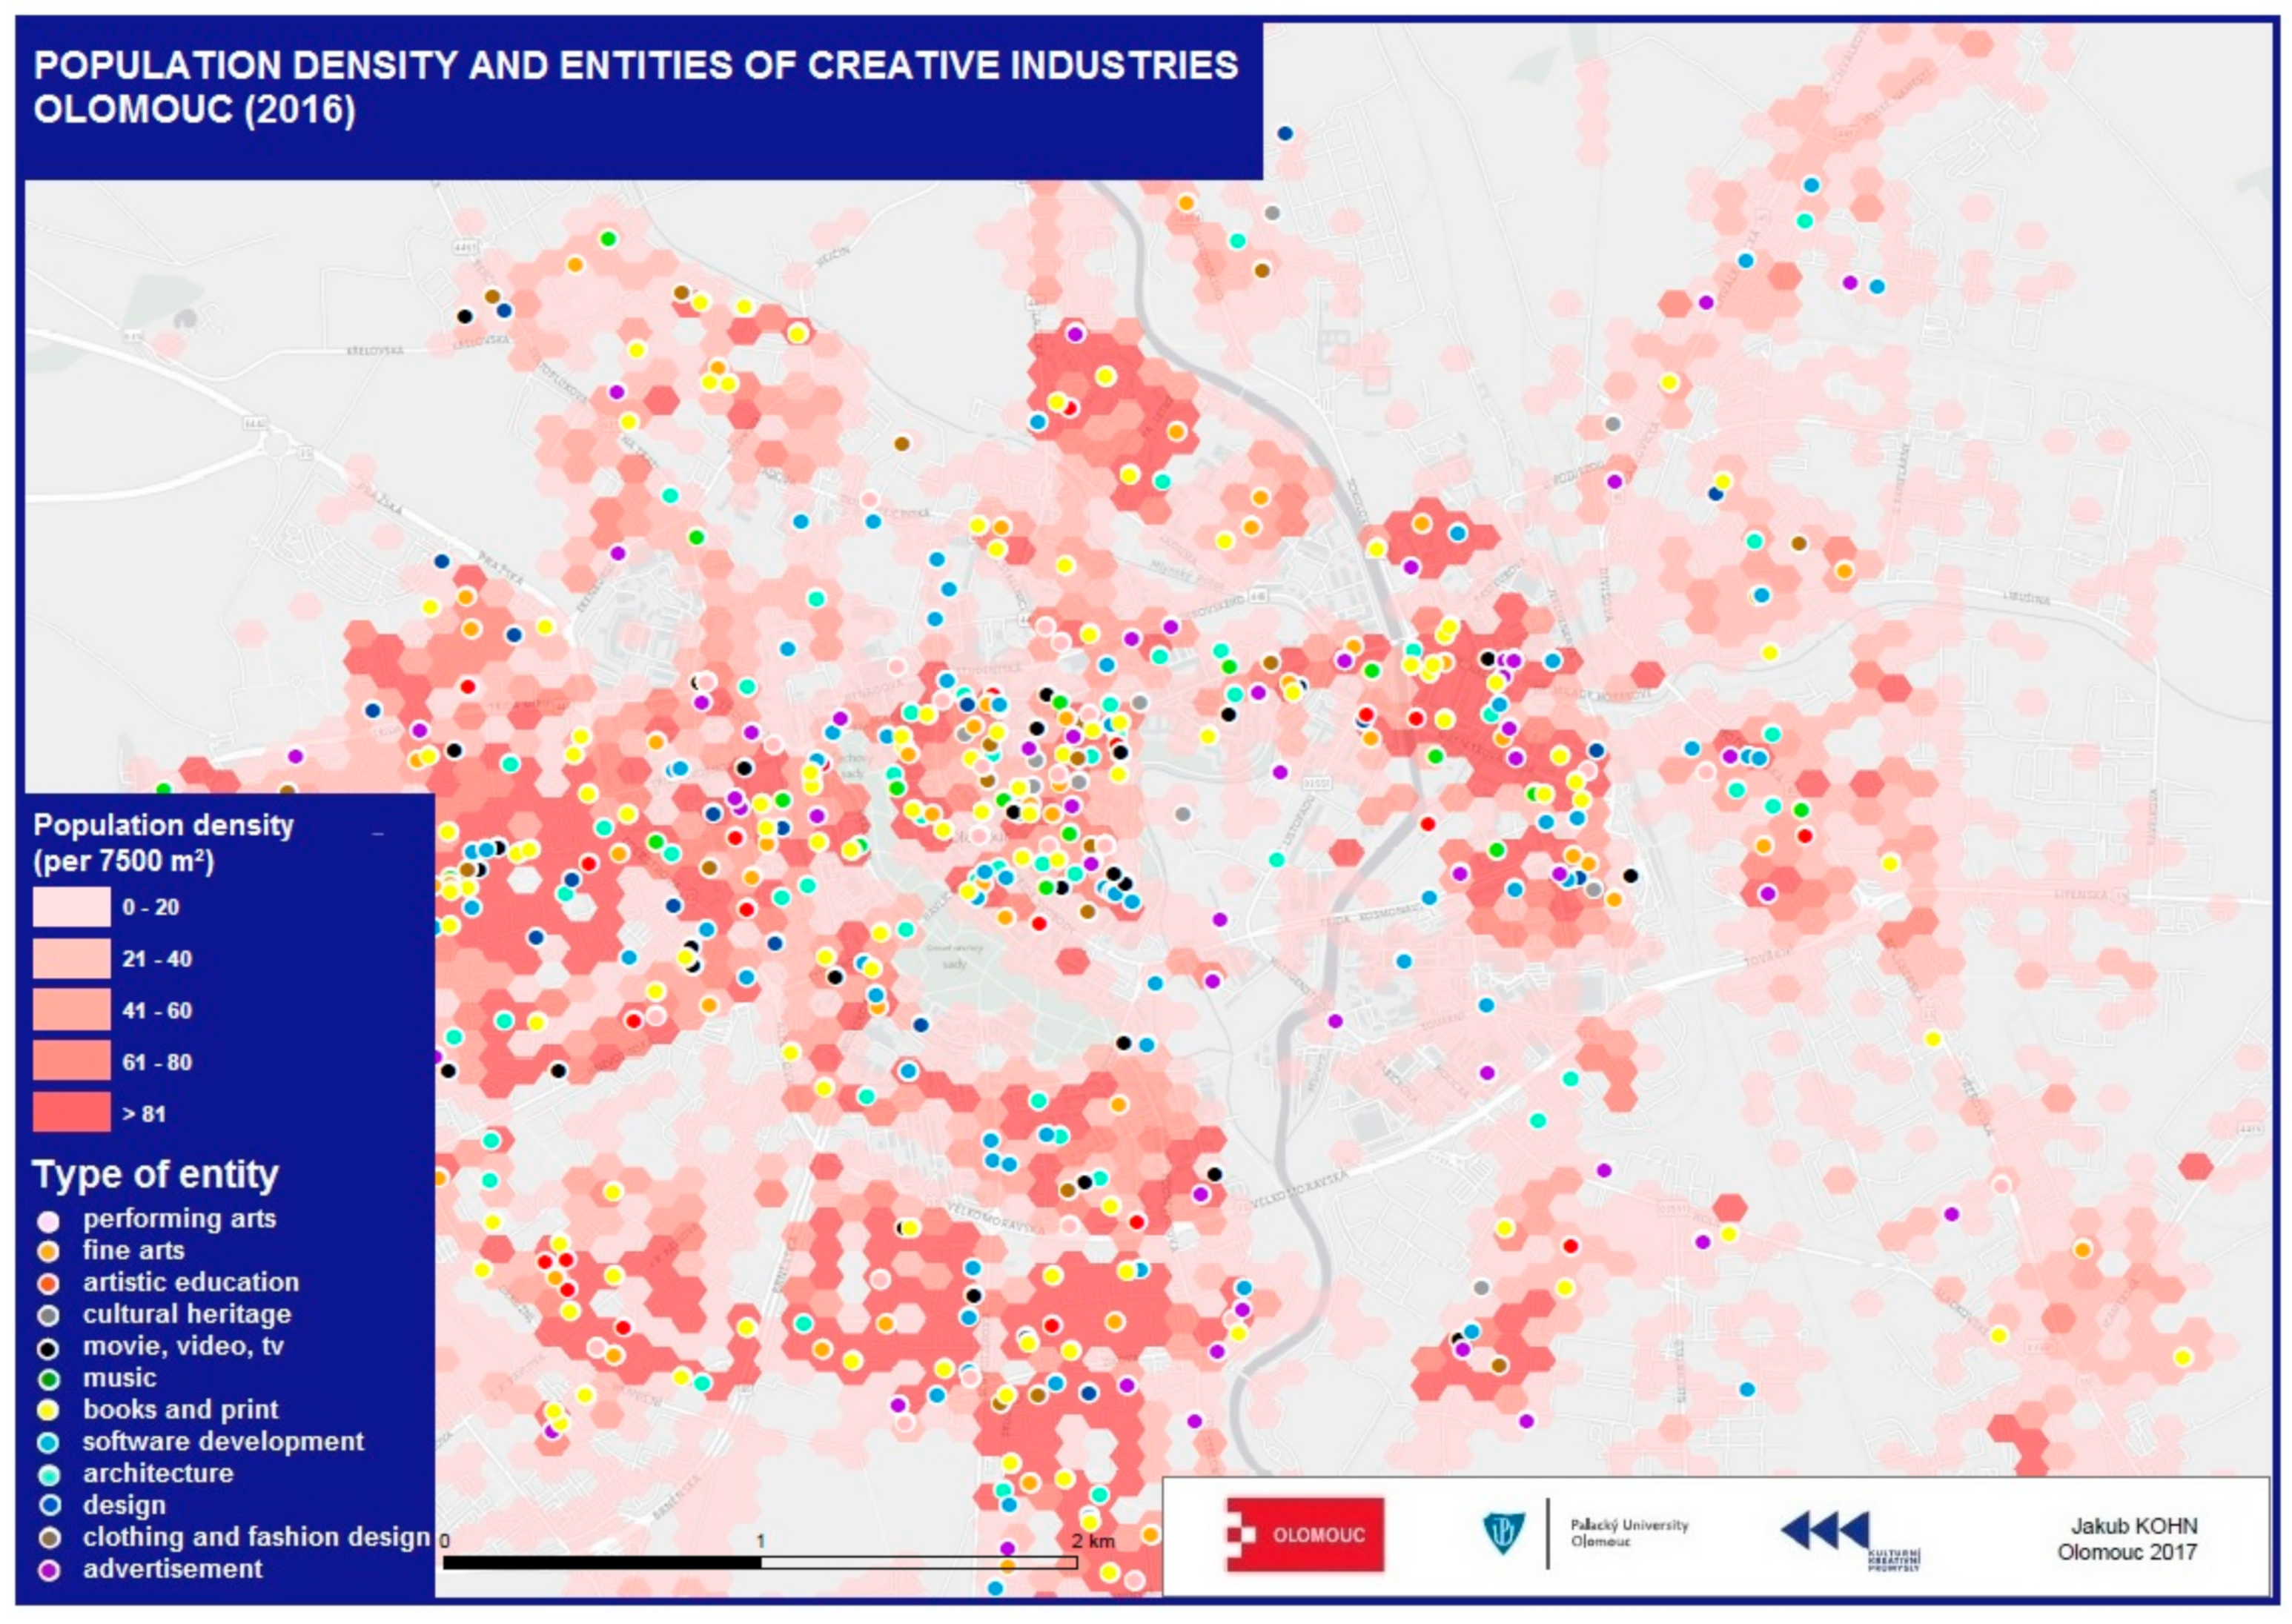
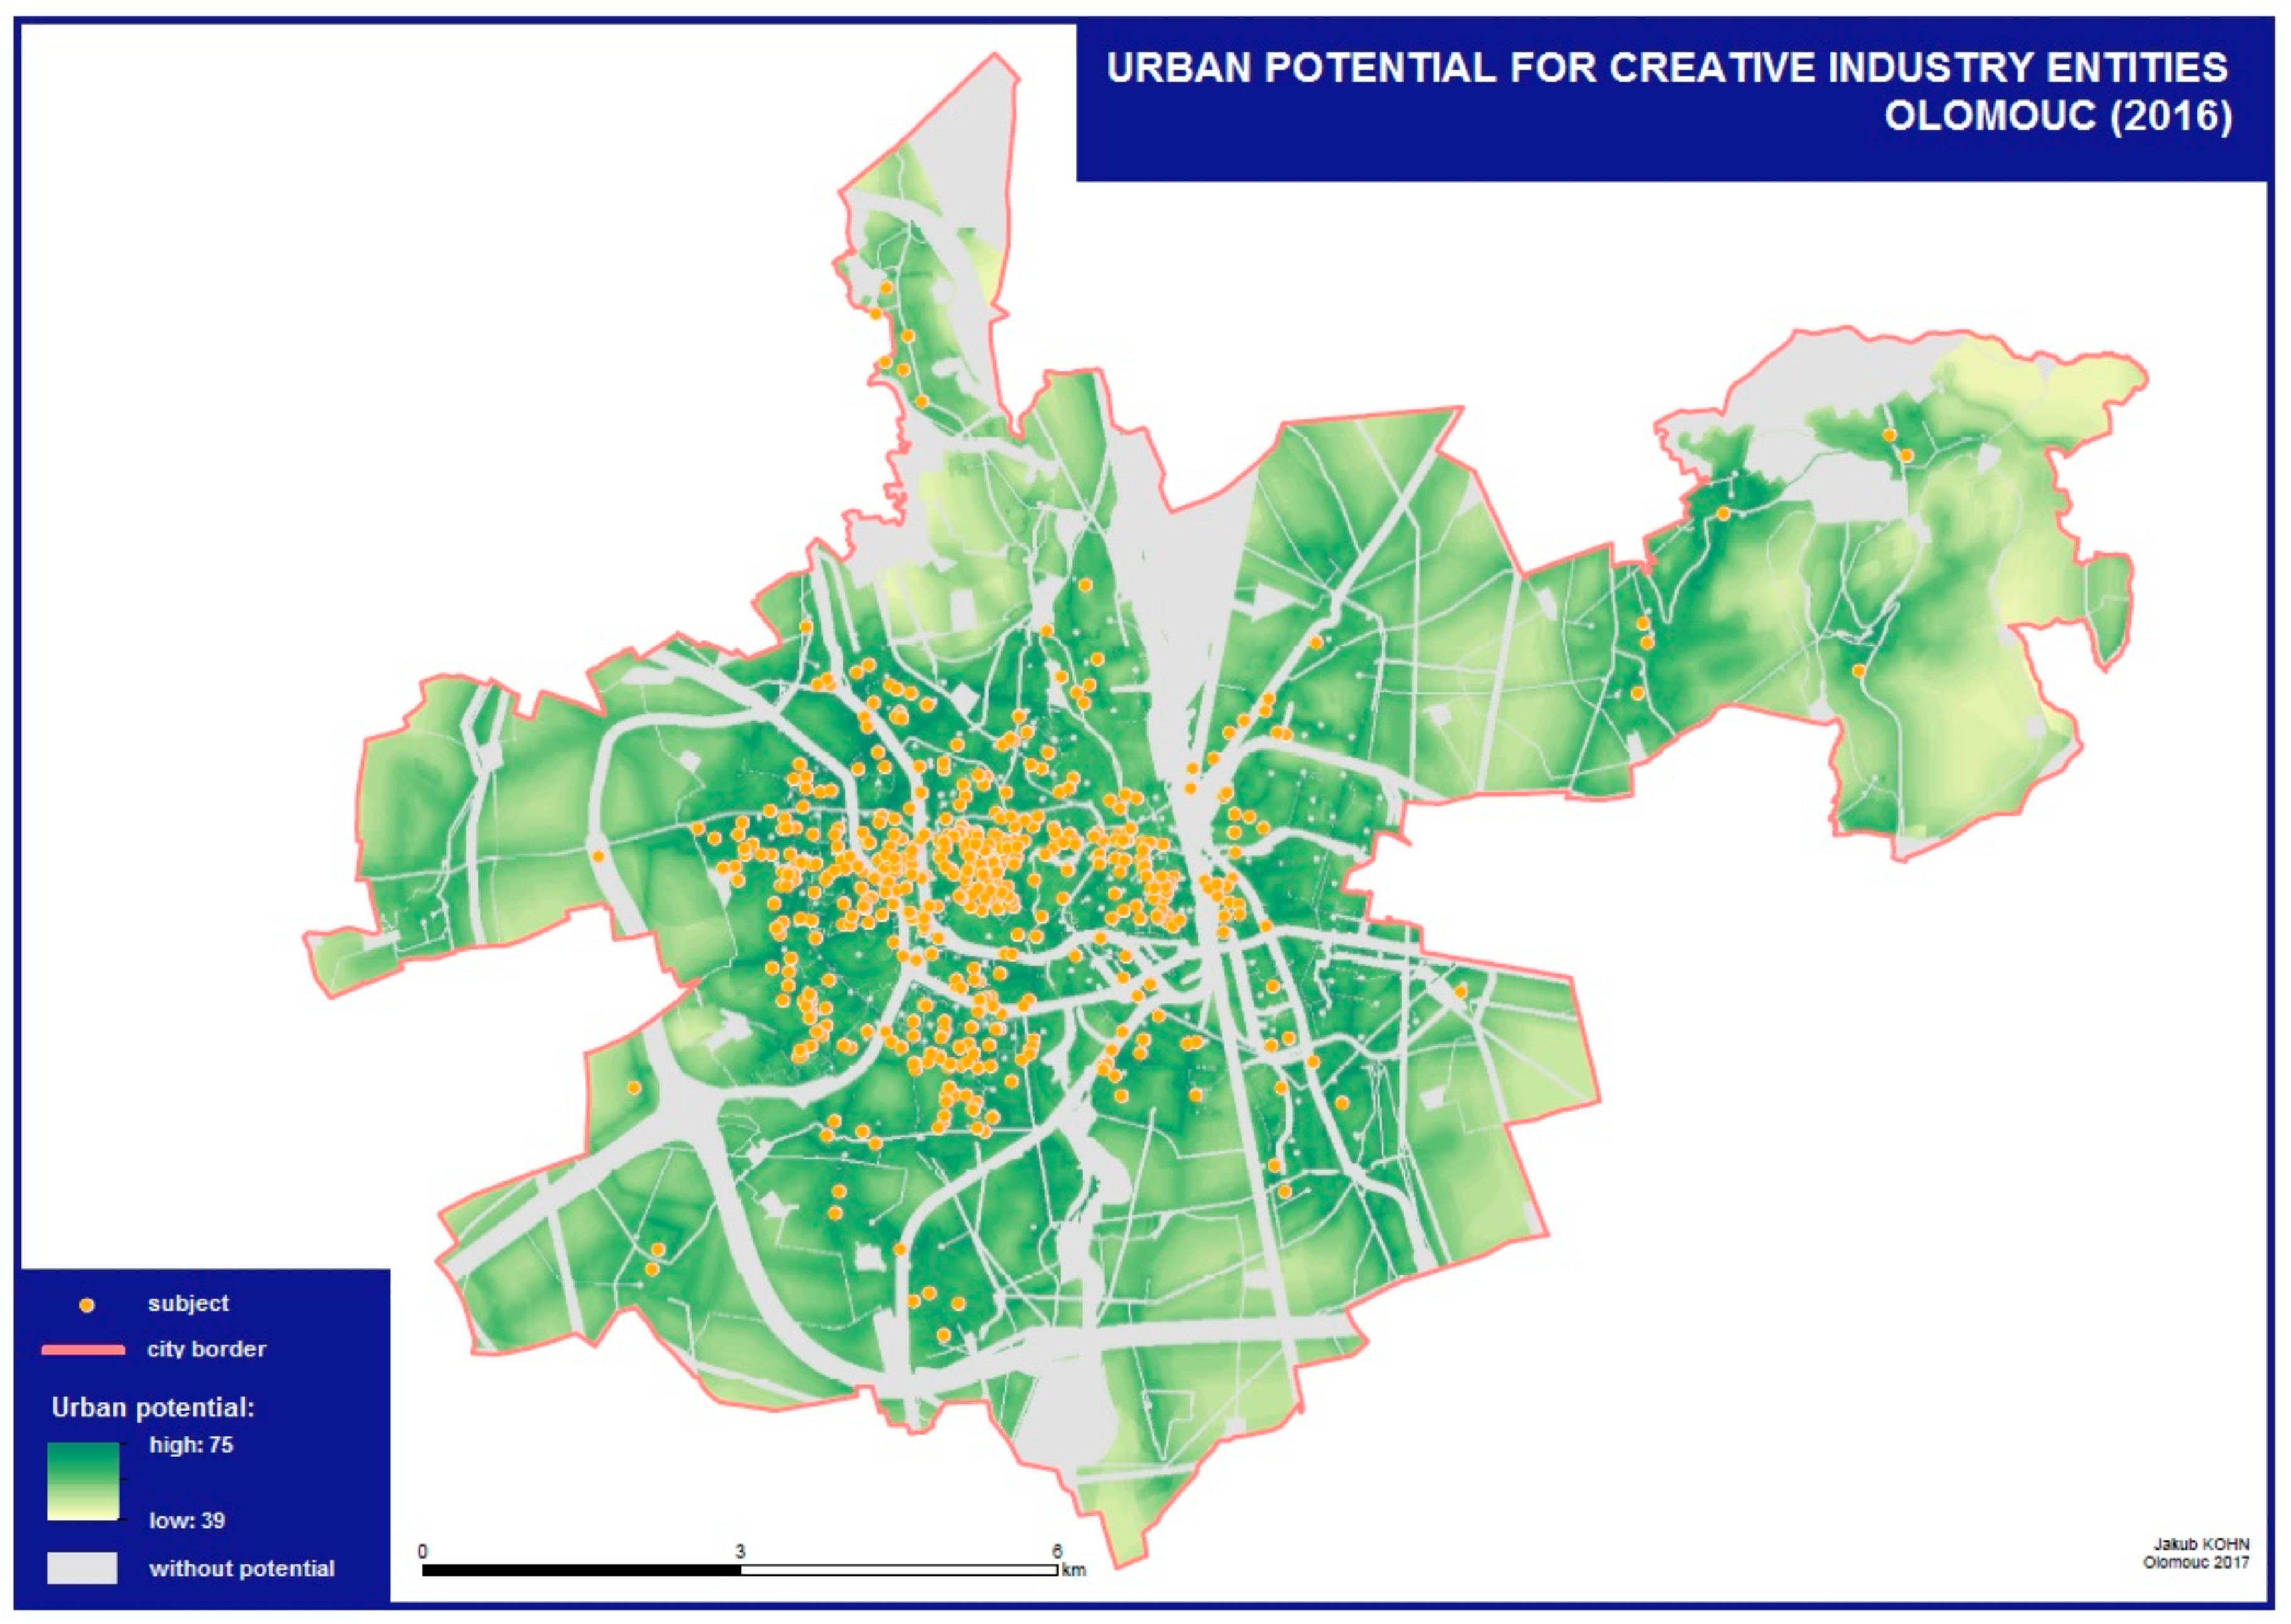
Under implementation of the GIS, socio-economic aspects influencing creative industry activities were visualized, and sites with the potential for the development of creative industries were delineated. In dealing with this step, the most challenging part was identifying the phenomena affecting a creative industry’s activities examined in this work. The most important phenomena were population density (
Figure 9) and transport availability. Two main findings can be observed: (1) the majority of active cultural and creative industry subjects work in a regional city or its immediate vicinity; and (2), as shown by their location depicted on the city’s price map, entities have a strong tendency to concentrate in the city center or areas in the city with higher prices and service levels. The reason for this is that higher price areas are more developed with higher infrastructure levels (typically business parks, shopping malls, and surroundings). Strong evidence for this can also be found in smaller towns such as Litovel, Šternberk, and Uničov.
Considering that cultural and creative industries are mostly only in built-up areas and that their nature is rather micro-geographic, the common choropleth map of population density would be of insufficient benefit within the administrative boundaries of municipalities. Therefore, it was necessary to find a suitable method of visualizing population density which would allow visualization at the level of building structures. For this reason, a population density choropleth map was created based on a hexagonal network with predefined dimensions.
5. Conclusions
This article presented an interdisciplinary link between geospatial elements and cultural sectors by spatially mapping creative industries. This is a unique study of Central Europe visualizing and interpreting the spatial location of elements in cultural and creative industries. Most previous studies have not worked deeply with the spatial component, i.e., location. Only localization in space brings unique added value. The main purpose of this work was to create suitable visualizations and process the spatial aspects of cultural and creative industries in a GIS environment. In order to map these creative industries, the most challenging task was to build a model which adequately captured the needs and culture of the city, as each locality had its own specifics.
For this reason, more than 1200 subjects from several fields were involved in the mapping of creative industries in Olomouc. The entire mapping process was based on interdisciplinary collaboration between experts in the humanities and engineering. The area around Olomouc is the first territory in the Czech Republic which has been spatially mapped for its creative potential. Horizontal interconnection and cross-over across themes can be tracked in virtually all the sectors studied. For example, advertising requires printing and video, quality promotional materials, and foreign translations; TV cannot provide content without camerapersons and scriptwriters; a festival would not be produced without sound engineers; the music industry is increasingly dependent on modern software and technology; and theatres, museums, and libraries need well-targeted advertising, etc. It is evident that creative industries are interconnected and, therefore, important to map spatially as a whole.
The main benefit of our approach was the verification and illustration of the use of GIS for creative industries which has not been used before in Central Europe. This article confirmed that GIS is suitable for both visualizations of the current state and spatial-based identification of the potential for development. The target group of the simple location-only map was the general public rather than experts. On the other hand, spatial analyses, such as service areas and urban potential, definitely provide a higher benefit—they are the basis for decision-making processes at the government level, and for which the Olomouc Region is involving more complex analyses in the next stage of the project (see below). The authors hope that the article will be a “guide” for other governments. There is also an opportunity to extend the mentioned workflow and implement more complex GIS and/or economic analyses. The main risk lies with the people involved. Due to the interdisciplinary nature, any analysis requires communication and collaboration among professionals from different fields (economics, social sciences, cartography, etc.). If a balance is missing, it could lead to distorted conclusions. The authors are convinced that data or technological limitations can be solved, but personal involvement is crucial. The main limitation of this research is the level of implementation (relative to the date of publication). Only basic level GIS analyses were described and implemented, and more complex analyses are capable (e.g., book stores that could be reached by bicycle/vehicle).
The involvement of creative industries in the Olomouc Region will take place over the long term. This article described the first stage only—spatial mapping and visualizations based on GIS analyses, facilitating the improved interpretation and understanding of current conditions. The outputs and results mentioned in this article will be entered as base sources for the next stage. Supplementary analyses will aid governments and agencies in making more effective decisions and investments. Currently (2019–2020), another stage is under way which is focused on more complex and specific analyses. Under the auspices of the municipality, specific applications will be implemented and spread among residents (e.g., ATMs or tram/bus stops according to particular conditions). The authors hope that the presented findings will be beneficial for scientists and municipalities and will service to motivate continued research on the topic.


