Abstract
The spatio-temporal relationship between tourism product similarity and spatial proximity has not been adequately studied empirically because of data and methodological limitations. New forms of data available at high temporal frequencies and low levels of spatial aggregation, together with large commercial data and expanding computational ability allow a variety of theories, old and new to be explored and evaluated more meticulously and systemically than has been possible hitherto. This study uses spatial visualization and data harvesting to synthesize a variety of data for exploring the evolution of hotel clusters and co-location synergies in US cities. The findings question the reliability of the current data to be used for identifying and analyzing the formation of tourist destination clusters and their dynamics. We conclude that synthesizing social media and large commercial data can generate a more robust database for research on tourism development and planning and improving opportunities for the examining spatial patterns of tourism activities. We also devise a protocol to combine ‘social media’ sources with big commercial sources for tourism development and planning, and eventually other sectors.
1. Introduction
Over the past decade, we have seen a wealth of new forms of data produced at high temporal frequencies and low levels of spatial aggregation. These new data available, together with large commercial data and expanding computational ability, allow a variety of theories, old and new to be explored and evaluated more meticulously and systemically than has been possible hitherto. [1]. Mining these new sources of data offers an alternative mechanism to acquire and compile geographic information [2,3,4]. Batty (2012, p192) [5] pointed out that “[t]he idea of integrating much of this diverse data together to add value to our conceptions of how it might be linked to other more traditional data as well as focusing it in specific ways to make cities more efficient and more equitable, has come to define the ‘smart cities movement’. With regard to the tourism sector, because of data and methodological limitations, the relationship between tourism product similarity and spatial proximity has not been adequately studied empirically and spatially over time [6,7,8,9]. There has been limited empirical spatio-temporal analysis on spatial distribution and clustering to understand the evolution of hotel clusters to help understand the spatial clustering among tourism and hospitality businesses [9,10,11]. Reliable longitudinal data are critical to analyzing these spatial patterns.
ReferenceUSA claim their website contains the “most accurate and comprehensive” information updated monthly on 20 million businesses in Canada and the USA and widely used in research and practice [12,13,14]. Such enterprise-level decade-long data series can help to study agglomeration-related issues from scale economies, externalities, co-location, and congestion. Our preliminary investigation of the ReferenceUSA data, however, found deficiencies and discrepancies, both internally, and with other less structured tourism social media sites, such as TripAdvisor and Google. Considerable effort is needed to salvage sufficient reliable information before conducting spatial and temporal analysis of business agglomeration.
Synthesizing data from various websites such as TripAdvisor and Google, and the traditional big commercial database from ReferenceUSA provides one starting point to create a more credible micro-level database with high temporal frequencies for the study of the tourism sector with its distinctive clustering and primary activities. This study uses spatial visualization and data harvesting to synthesize a variety of longitudinal data for exploring the evolution of hotel clusters and co-location synergies in US cities. We also devise a protocol to combine ‘social media’ sources with big commercial sources for tourism development and planning, applicable to other sectors.
2. The Tourism Sector
The tourist activities and service sector initially evolved its own discipline—hospitality management—largely drawing on business school concepts, and less so on the explicitly spatial disciplines such as geography. Nonetheless, as widely acknowledged today, location is vital for the success of tourism businesses such as hotels [9,11,15,16]. For economic geography, the manner in which businesses cluster physically as a result of trade-off between competition and agglomeration, and driven by demographics, innovation, and investment is a central topic [17,18,19].
Several theories and core heuristics, used by scholars and tourism destination managers to characterize the growth stages of a destination, might be explored using a reliable time series business-level database. They are similar to and draw on product cycle theory, market positioning, carrying capacity, and the like [20]. The tourist area life cycle due especially to Butler (1980) [20] and others employs the same underlying notions as formal theories of scale economy, externalities, and co-location. The notion of “carrying capacity” has been equally important since much tourism involves the intense development of relatively small, often fragile locations, with geographic location and scale often governed by visitor ease of access and choice. The fortunes of a destination, and the various clusters of activity within it, depend largely on how well businesses individually and collectively tackle the challenges of enhancing synergies and offsetting congestion [21,22].
The tourism industry business clusters consist of linked components, for instance, accommodation and retail. These components provide a variety of products and services to visitors. The clusters differ widely in their markets, size, and composition. Nonetheless, given adequate data it should be possible to evaluate general propositions about their formation and development, and their key parameters. The study here draws on previous spatial analysis of recreational accommodation by Yin [23] and tourism dynamic cluster analysis by [21].
3. Data for Tourism Research
Traditional tourism data sources for tourism research include administrative data, census data, organizations’ data, yellow page, and commercial data such as ReferenceUSA (Baum and Mezias, 1992). In recent years, relevant information is becoming available from non-traditional sources, such as crowdsourcing, online social networking, and other internet-based sources [2,24].
3.1. Traditional Data
Since 1997, the commercial data, ReferenceUSA data has been widely used in the U.S. by both academics and professionals. Initial review of ReferenceUSA data within and across years indicated anomalies, even with respect to the existence of a business, let alone its precise location or name. There appears to be serious over-counting, and a syndrome of “disappearing and re-appearing” enterprises. The problems were considerably more acute with other non-geographic data listed in the database, such as employment, sales volume, and so on, which is ideally required to test concepts about cluster development. Even prior to the investigation reported here, the implausible variability between years for even the total number of enterprises had been noted. For example, the total figures for the U.S. did not match those in corresponding to the census. Moreover, businesses were double-counted or omitted in some years. Comparison of hotel locations between ReferenceUSA data and online sources such as TripAdvisor and Google further exposed discrepancies between and across these databases.
The problems of using inaccurate and inconsistent data for modeling and decision making have challenged researchers for years, especially with longitudinal research [25,26]. The selection of information and evaluation of its reliability has to be assessed in terms of its intended purpose. In testing an empirical theory, some formal relationships are involved, such as those implied by the heuristics mentioned above, and this in turn implies in estimating model parameters some statistical test or other measure of credibility is to be applied. Such tests determined what level of uncertainty is acceptable in the initial data set.
3.2. Synthesizing Traditional and New Forms of Data
In the internet era, massive amounts of information with a wide range of data types and sources are generated on a moment-to-moment basis. The rapid expansion of digital data from varied sources such as TripAdvisor and Google has become a source of big data [23,27,28], which is offering many new opportunities and insights for more informed decision-making and planning [28,29].
Both Google and TripAdvisor have maps and other information about hotels such as name, address, rating, price, and reviews from visitors’ experiences. Other websites include Expedia, Orbits, Hotels, etc. Individual business’ websites may also provide information on the history of their hotel, such as year established, ownership, renaming, address, price, and rating. These data contain some geo-location and time related information at the micro level [5,30,31], and are used by various companies to model and predict research [32].
Unlike traditional data, much of the internet-based data are often massive, relatively unstructured, non-conventionally categorized, biased, and of variable quality, in comparison with statistical and survey data [31]. There are also privacy concerns about using these data [33]. In addition, many sites tend to sway away from sharing data, even though these data can be valuable research resources when handling with the right procedures to protect privacy.
For research purposes, these data need to be processed systematically before they should replace or augment traditional data [5]. “[F]inding and meaningfully combining information is a primary challenge for users of big data” [34] (p6). Integrating selected data from various websites such as Google and TripAdvisor with ReferenceUSA data allows us to assemble a more robust database that can be used to explore spatial clustering and dynamics of tourism sector activities.
With respect to the principal data used for this paper it is reasonable to distinguish “social media” data from customer-driven sites (e.g., TripAdvisor) from the “commercial data” (e.g., ReferenceUSA) even though both of them are extensive. ReferenceUSA provides information on millions of businesses. Fortunately, for evaluation purposes, considerable data may be organized, cleaned, and manipulated using contemporary spreadsheets. The distinction between these two types of data is problematic in that both data sets are “commercial”, and both integrate data from a variety of sources—public data sets, telephone directories, industry organizations, personal communication, and customer generated data. Social media data, especially customer reviews are troublesome for the industry. As seen later, however, the associated information does provide useful supplementary information for improving the reliability of a more orderly database. A further distinction might be drawn with industry-specific data assemblers using otherwise confidential information (e.g., Hotel Valuation Services, PKF International, etc.). It should be recognized that much of these data have been recorded in the past through occasional surveys on a regular basis (e.g., census of business) but the findings with respect to individual businesses are suppressed as “non-disclosures”, or statistically aggregated. More detailed data are collected annually through tax records and company accounts, but with restricted access.
In sum, because of data availability and quality at the individual spatial locations, empirical work on retail business spatial clustering has been limited [11,35]. Fortunately, one recent major change in spatial science, made possible by big data and recent technology development, “has been its increasing collection and use of data at the individual rather than the aggregate scale, avoiding…the modifiable areal unit problem” [36] (p62).
As a starting point, the touchstone for data credibility was whether it would be useful to test spatial and secular theories with which have long-standing experience [21]. These, of course, draw on previous and current tourism development modeling and spatial studies. Equally the methodology makes use of a variety of spatial visualization and data harvesting techniques [37].
4. Method
4.1. Selection of Study Areas
To examine hotels for the entire North America, data amounts to some 20–30 variables for each of the approximately one and half million properties (15 years). The inclusion of the restaurant and entertainment sectors poses a greater challenge, but potentially manageable. However, as explained above, even defects in the hotel sector data demanded that a smaller sample of destinations be explored so that the circumstances of individual enterprises could be assessed against the available “ground truth” (personal experience and hotel-specific websites) and against other public and commercial data. Familiarity is important here because in assessing the data it is necessary to assess ground-truth not only in terms of the existence of properties, but also the overall and particular characteristics. It was also important that the choices included both comparability and diversity in size, structure, history, and a mix of visitors.
For our investigative study we selected three coastal tourism cities: Savannah, GA, Charleston, NC, USA and New Orleans, LA, USA. All are cities with pleasant weather and attractive waterfronts. In addition, each is known for its rich history, well-preserved architecture and historical districts. Savannah, for example, has been nominated as the “most beautiful” place many times by USA Weekend Magazine and New York Times. Charleston is a major tourist destination, with luxury hotels, hotel chains, inns, bed and breakfast, and a large number of award-winning restaurants and quality shopping. New Orleans is a major United States port and the largest city in the state of Louisiana with the tourism and hospitality industry as its primary economic driver. For all three cities, our initial study focused on comparable areas within the historic district, downtown, and waterfront.
4.2. Data Preparation
We used ReferenceUSA data that provided the primary database for each destination. Hotel data were extracted for a period of 15 years (1997 to 2011) using the standard industrial classification (SIC) codes for hotels and motels (701101), and bed and breakfast (701107). The inclusion of both categories is because our initial investigation suggested that hotels might be categorized differently by disparate sources. For instance, one can be categorized as hotel by ReferenceUSA, but as bed and breakfast by TripAdvisor. A hotel may even be categorized as both hotel and bed and breakfast by ReferenceUSA. The ReferenceUSA data also include information on location references including physical addresses and also north–south coordinates. This information was used to geocode the tabular ReferenceUSA data into spatial files using ArcGIS. A spatial database was established that includes hotel, transportation, attraction or landmark, historical district, census, and parcel. To confirm locations and identify potential mislocations, these references were cross-checked with other sources, including associated city, state, regional, and federal governments.
4.3. Synthesizing and Updating Data: Using Spatial Visualization and Data harvesting
The technical challenges that arise from lack of precision, incompleteness, and duplication in the primary data and its reconciliation with information drawn from different sources includes several operations in each of the three stages outlined next:
- (1)
- The first stage was focused on inspecting the tabular ReferenceUSA information to expose scope of some errors for the need to correct, for example, omissions and over-counting. This includes cross-check manually totals across years and with U.S. census information, as mentioned earlier.
- (2)
- The second stage was based on the geocoded tabular information for spatial visualization to inspect data errors and correct errors. This was via comparison of year-by-year hotel location maps using ReferenceUSA data. This was also done manually to spot possible problems using the maps and attached attribute tables.
- (3)
- Data harvesting and big data were used in the third stage to inspect and correct data. This stage is the most time consuming and important part. The stage was based on comparison between geocoded hotel data and big data including Google, Google Street View, TripAdvisor, hotel websites, and other internet sources to check whether a hotel indeed existed for a specific year. This stage combines manual cross-check and automatic information search and retrieval.
Stage two and three can sometimes be overlapped when there is a need to cross check and confirm the updates and corrections with the internet-based data. The geocoded ReferenceUSA data on businesses were verified, corrected, or supplemented for years from 1997 to 2011 following the above procedures. Five types of errors were identified in the ReferenceUSA hotel data as illustrated in Table 1. This process was eased using spatial visualization and data harvesting for assessing the coverage and consistency of data, linking and integrating data, and displaying the combined results. Indeed, spatial overlays of the various data proved far more facile than reconciling conflicts directly within the corresponding database.

Table 1.
Updating hotel data: Stage two and three.
Data Harvesting
Data harvesting is the computational process that searches for valuable information in large volumes of web data to extract information from the web. Data harvesting can help to find, extract, and blend and synthesize data from multiple sources to be used as a more robust data acquisition method. It has been used by social network website companies to study consumer preferences. Data harvesting was used in this study to help extract useful information from various websites for synthesizing and updating ReferenceUSA information.
Our data harvesting process involved data discovery, data extraction, and database management [38]. The main techniques that were used include the Web, breadth-first search, regular expressions, multithreading, and database technologies [39,40]. Our procedure of the data harvesting includes getting the URL, retrieving source code, analyzing hotel’s website and retrieving sources codes, retrieving related data, processing data, and storing data in a database. The Web was crucial to the data harvesting extraction of information from the source code of static web pages. The breath-first search strategy refers to a process that, after the current level of the search is completely finished, the search was carried over to the next level to retrieve information from linked webpages. Regular expressions help to extract information of the linked hotel webpages. Multithreaded microprocessor technology allows microprocessor to improve performance. Database was then used to store and manipulate data extracted from the internet.
The information retrieved from different internet sources (Google, TripAdvisor, and hotel websites) included the name, address, rating, price, telephone number, years of reviews, history of hotels, etc. Information on the name, address, phone number, rating, and price of hotels were used to match hotels from difference sources for comparison and synthesizing.
Although such a review itself may be subject to errors, in our research these sources were employed only to identify the year of existence of hotels to help cross-check and correct annual ReferenceUSA information. With regard to stage three, the customer reviews on TripAdvisor and other similar websites have information to help us identify and verify the year of existence of a hotel. The review information includes both the year that a review was provided and most of the time, also the year of the hotel stay for the review. If a property was recorded in user reviews for a period of a year, it was taken that it was operating during the year. In some cases, this was confirmed by consulting the website of the property or company concerned or historical Google Street View images. Some of the information on a hotel’s history, such as the year of establishment, reopening, etc. was found on their official websites. Google Street Views was used to check if there were visible hotel signs along the streets from different years to cross reference information from TripAdvisor or other sources.
4.4. Visualizing the Dynamic Clustering for Comparison
Kernel density maps were used to visualize the spatial patterns of hotels in the study areas on their spatial distribution and clustering and to help compare the original data with the synthesized and updated data. Kernel density is an index of point density illustrated below by a smoothly curved surface fitted over each point. The surface value reaches the highest at each point’s location and decreases with the increment of distance from the point, reaching zero at the specified search radius distance from the point. The Kernel density was used to map the point density of hotels in gradual color. Spatial patterns of hotel clusters can be clearly visualized on maps to show whether and where they are clustered, dispersed, or randomly distributed.
5. Findings and Discussion
5.1. Synthesizing and Updating Data
Figure 1, Figure 2 and Figure 3 compare hotels in the three study areas before and after big data synthesizing. Eight maps were included for each city illustrating hotel locations from 1997 to 2011. Black dots are the hotels geocoded from the original ReferenceUSA data and stars are the updated hotels supplemented with big data. For all three cities, one or more hotels were updated every year over the 15 years period due to the errors identified above. These figures also showed that there is more updating required for recent years than earlier years. This may be because much of the internet based information was not available until recent years; and therefore, there was not enough data to update earlier years’ information, leaving some remaining question as to the completeness of the updated maps.
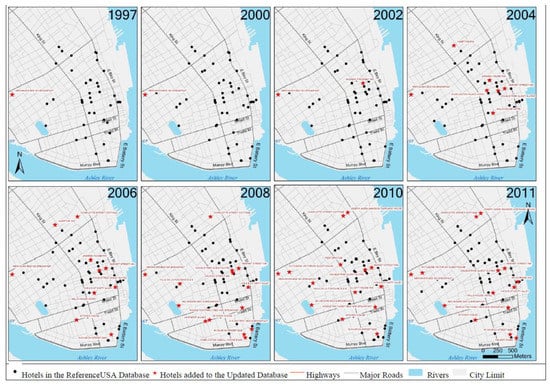
Figure 1.
Original and updated hotels: Charleston, NC, USA.
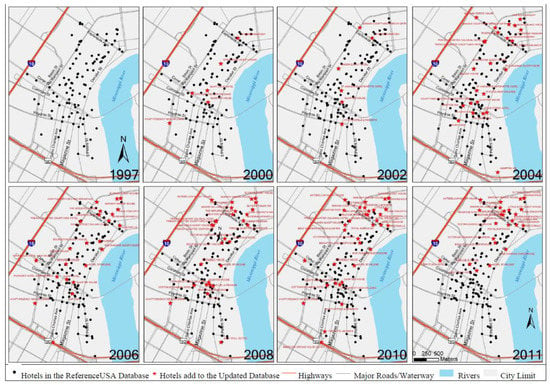
Figure 2.
Original and updated hotels: New Orleans, LA, USA.
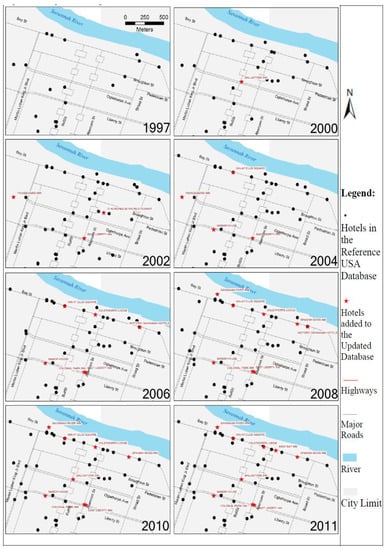
Figure 3.
Original and updated hotels: Savannah, GA, USA.
5.2. Analyzing the Dynamic Clustering: Spatial Visualization Using Density Maps
Figure 4, Figure 5 and Figure 6 compare hotel densities before and after big data synthesizing. The upper parts of each figure show the density generated from the original data and lower parts from the updated data over the 15-year period. The density classes of hotels were categorized into four levels. Level 1 stands for a relative low density and level 4 for a relative high density. The four density levels were derived by standardizing all density numbers against the highest density generated in each city. After standardizing, a set of percentages was created ranging from 0 to 100. These percentages were put into four groups: 0–20%, 20–40%, 40–65%, and 65–100%. The last group includes standardized density percentage values from 65 to 100 to get an area that is large enough for visualization. The histograms at the corners of each small inset map in Figure 4, Figure 5 and Figure 6 show the actual number of hotels located in each of the four corresponding density levels. In addition, on top of year 1997 and 2011 original density maps, three different types of lines, as shown in the legend, were used to show density levels two to four based on the updated data to be compared with the original data for the same years.
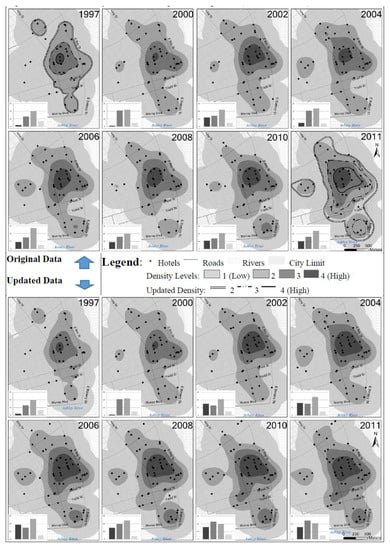
Figure 4.
Kernel density of hotels: Original vs. updated (Charleston, NC, USA).
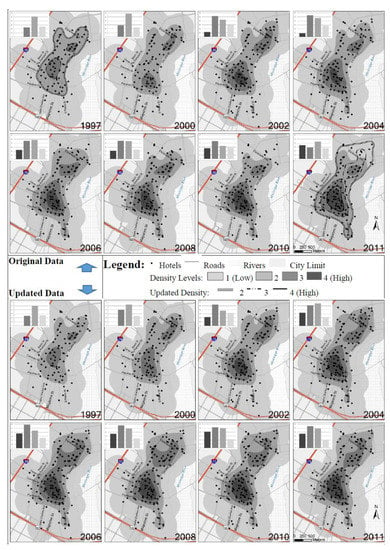
Figure 5.
Kernel density of hotels: Original vs. updated (New Orleans, LA, USA).
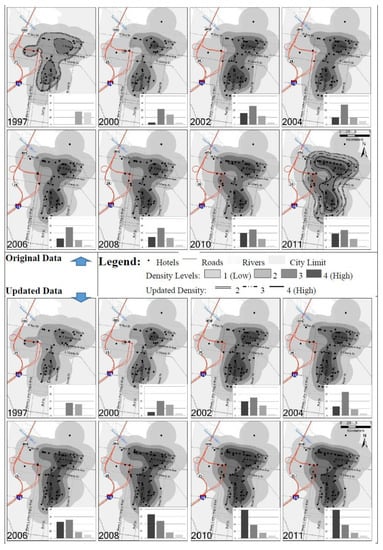
Figure 6.
Kernel density of hotels: Original vs. updated (Savannah, GA, USA).
In Charleston (Figure 4), the small cluster that is in the downtown area between King Street and East Bay Street was observed in 1997 and has been growing. This cluster is shown in both the original and updated data. However, as shown in the year 2011 map, updated data displayed larger clusters for density level two through four than the original data. The updated density of a cluster in the southern part at the waterfront near East Battery Street and Murray Blvd for year 2011 was higher than the original. In addition, the growth of these clusters is more consistent in the updated maps over the 15-year period than the original ones, which show some irregular density changes over the years.
In New Orleans (Figure 5), there were two clusters: One in the north, located in the French quarter district; and the other in the center, around Canal and Common Street. The French quarter district cluster and Canal Street district were similar in terms of the density level in year 1997, with a little larger size for the Canal Street district. However, the Canal Street district had been growing in size and density. By the year 2011, it was not only bigger in size but also higher density. The original data shows that the cluster located in the French quarter did not grow as much as the other clusters in terms of both the density level and size, especially after year 2004, while the updated data shows that this cluster had been extending towards the north even though with a lower density than the Canal Street cluster. The difference between two sets of density from original and updated databases respectively was not as obvious in New Orleans as it was in Charleston, especially for the Canal Street district cluster. This might be because of the amount of data. The total number of hotels in the Canal Street district might be big enough to minimize the influence from a relatively smaller number of updated hotel records.
In Savannah (Figure 6), the cluster along Savannah River and East Bay Street grew every year from 1997 to 2011. There was also a cluster growing in the south below East Liberty Street. There was substantial difference between density patterns generated from original and from updated data, especially for density level three and four as seen in the year 2011 map. According to the updated database, the cluster in the southern part along Drayton Street and Abercom Street had been extending to meet the cluster along the East Bay Street to become one large cluster. Likewise with Charleston: The growing clusters were more consistent for the updated maps over the 15-year period.
Figure 7 includes line and 3D bar charts showing and comparing the differences between density levels from the two databases. The same shade was used for the same density level for both databases. Larger circle points in the line charts represent original data, and the smaller squares represent updated data. The line charts for all three cities show that despite of the differences in the sheer volume with regard to the number of hotels in each density level, the lines that represent the same density level, in general, were similar over the 15-year period. That is, the patterns of density change indicated in both databases were similar. In general, density level one was more consistent between two databases for all three cities. However, notably for the reliable analysis of tourist destination structures and performance, the most significant differences were for the higher density level three and four where hotels clearly clustered.
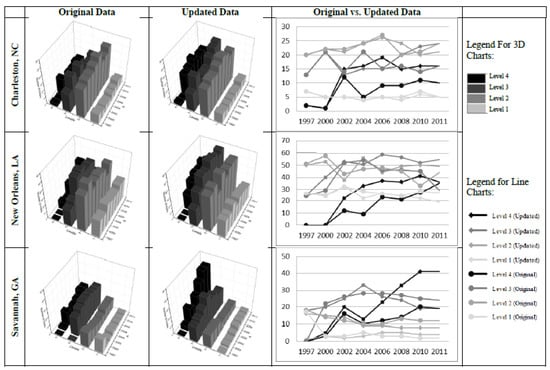
Figure 7.
Comparison of hotel density over time: Original vs. updated data.
6. Conclusions
This paper explored synthesizing new and traditional data for examining patterns of hotel development over a 15-year period. With respect to the ReferenceUSA data, conclusions might be drawn with respect to two key questions. First, whether the data, in their current state, are sufficiently robust for the purposes advertised. This is especially important because the data are claimed to be the “most accurate and comprehensive in the industry”. Moreover, it is widely used because “[m]ore than 4 million customers” use this for various purposes. They are also used by “[n]umerous national organizations and government agencies, including the FBI, Homeland Security, … to make critical decisions every day.”. For some purposes where completeness is not an issue, the data may be sufficient. For others, depending on the precise “critical decision”, one might consider that more completeness and precision than is currently evident in the data are essential.
This concern applies also to its use in policy-making because ReferenceUSA indicate that more than 3 million customers use their data for demographic research, economic development planning, and community analysis. At least for our purpose—to identify and analyze tourist destination cluster formation and dynamics, we question the reliability of the current data. That said we considered that the introduction of internet-based data to supplement the big commercial data could generate a more robust database for research on tourism development and planning.
Our findings demonstrated that the internet-based data that had become available in recent years potentially provided a valuable resource for assembling more credible and consistent temporal and spatial databases. The spatial clustering patterns created using synthesized data showed a more consistent pattern without irregular density changes over the years, manifested in the original database. Our analysis also shows that there were substantial difference with regard to the spatial hotel clustering between the original data and our revisions for two of the three study areas. In these two cities, Charleston and Savannah, additional hotel clusters were identified, especially in recent years. In New Orleans, the spatial hotel clustering patterns were more consistent.
Despite the analytic and empirical difficulties, it was concluded that synthesizing social media data with big commercial data improved opportunities for examining patterns of hotel, entertainment, and retail development, and opportunities for potentially constructing and testing more complex industry models and theories. It is also recognized that, whatever the current reliability of these data, this was likely to improve over time and become more consistent, accurate, and complete.
Author Contributions
Conceptualization, L.Y. and S.C.; Data curation, L.Y. and L.W.; Formal analysis, L.Y. and L.W.; Methodology, L.Y., L.W., S.C. and L.W.; Supervision, L.Y.; Visualization, L.Y.; Writing—original draft, L.Y. L.W. and S.C.; Writing—revising and editing, L.Y. and S.C.; Resources, L.W.
Funding
This research received no external funding.
Acknowledgments
We would like to thank the reviewers and editors for their constructive comments.
Conflicts of Interest
The authors declare no conflict of interest.
References
- Ruppert, E. Rethinking empirical social sciences. Dialogues Hum. Geogr. 2013, 3, 268–273. [Google Scholar] [CrossRef]
- Goodchild, M.F.; Li, L. Assuring the quality of volunteered geographic information. Spat. Stat. 2012, 1, 110–120. [Google Scholar] [CrossRef]
- Miller, H.J.; Goodchild, M.F. Data-Driven Geography. GeoJournal 2015, 80, 449–461. [Google Scholar] [CrossRef]
- Yin, L.; Cheng, Q.; Wang, Z.; Shao, Z. ‘Big data’ for pedestrian volume: Exploring the use of Google Street View images for pedestrian counts. Appl. Geogr. 2015, 63, 337–345. [Google Scholar] [CrossRef]
- Batty, M. Smart cities, Big Data. Environ. Plan. B Plan. Des. 2012, 39, 191–193. [Google Scholar] [CrossRef]
- Hernandez, T. Enhancing retail location decision support: The development and application of geovisualization. J. Retail. Consum. Serv. 2007, 14, 249–258. [Google Scholar] [CrossRef]
- Chancellor, C.; Cole, S. Using Geographic Information System to Visualize Travel Patterns and Market Research Data. J. Travel Tour. Mark. 2008, 25, 341–354. [Google Scholar] [CrossRef]
- Weidenfeld, A.; Williams, A.M.; Butler, R.W. ‘Knowledge transfers and innovations amongst attractions’. Ann. Tour. Res. 2010, 37, 604–626. [Google Scholar] [CrossRef]
- Prayag, G.; Landré, M.; Ryan, C. Restaurant location in Hamilton, New Zealand: Clustering patterns from 1996 to 2008. Int. J. Contemp. Hosp. Manag. 2012, 24, 430–450. [Google Scholar] [CrossRef]
- Muller, C.C.; Inman, C. The Geodemographics of Restaurant Development. Cornell Hotel. Restaur. Adm. Q. 1994, 35, 88–95. [Google Scholar] [CrossRef]
- Krider, R.E.; Putler, D.S. Which Birds of a Feather Flock Together? Clustering and Avoidance Patterns of Similar Retail Outlets. Geogr. Anal. 2013, 45, 123–149. [Google Scholar] [CrossRef]
- Hoehner, C.M.; Schootman, M. Concordance of commerical Data Souces for Neighborhood-Effects Studies. J. Urban Health 2010, 87, 713–725. [Google Scholar] [CrossRef] [PubMed]
- Duncan, D.T.; Aldstadt, J.; Whalen, J.; Melly, S.J.; Gortmaker, S.L. Validation of Walk Score® for Estimating Neighborhood Walkability: An Analysis of Four US Metropolitan Areas. Int. J. Environ. Res. Public Health 2011, 8, 4160–4179. [Google Scholar] [CrossRef] [PubMed]
- Powell, L.M.; Han, E.; Zenk, S.N.; Khan, T.; Quinn, C.M.; Gibbs, K.P.; Pugach, O.; Barker, D.C.; Resnick, E.A.; Myllyluoma, J.; et al. Field validation of secondary commercial data sources on the retail food outlet environment in the U.S. Health Place 2011, 17, 1122–1131. [Google Scholar] [CrossRef] [PubMed]
- Craig, C.M.; Ghosh, A.; McLafferty, S. Models of the retail location process: A review. J. Retail. 1984, 60, 5–36. [Google Scholar]
- Yin, L.; Hastings, J. Capitalizing on Views: Assessing Visibility Using 3D Visualization and GIS Technologies for Hotel Development in the City of Niagara Falls, USA. J. Urban Technol. 2007, 14, 59–82. [Google Scholar] [CrossRef]
- Baum, J.A.C.; Mezias, S.J. Localized Competition and Organizational Failure in the Manhattan Hotel Industry, 1898–1990. Adm. Sci. Q. 1992, 37, 580. [Google Scholar] [CrossRef]
- Porter, M. Clusters and the Economics of Competition. Harvard Business Review 1998, 76, 77–90. [Google Scholar]
- Storper, M. Agglomeration, trade, and Spatial Development: Bringing Dynamics Back. J. Reg. Sci. 2010, 50, 313–342. [Google Scholar] [CrossRef]
- Butler, R.W. The Concept of a Tourist Area Cycle of Evolution: Implications for Management of Resources. Canadian Geographer 1980, 24, 5–12. [Google Scholar]
- Cole, S. A Logistic Tourism Model: Resort Cycles, Globalization, and Chaos. Ann. Tour. Res. 2009, 36, 689–714. [Google Scholar] [CrossRef]
- Cole, S. Synergy and congestion in the tourist destination life cycle. Tour. Manag. 2012, 33, 1128–1140. [Google Scholar] [CrossRef]
- Yin, L. “Assessing Indirect Spatial Effects of Mountain Tourism Development: An Application of Agent-based Spatial Modeling”. J. Reg. Anal. Policy 2007, 37, 257–265. [Google Scholar]
- Ip, C.; Law, R.; Lee, H. A Review of Website Evaluation Studies in the Tourism and Hospitality Fields from 1996 to 2009. Int. J. Tour. Res. 2011, 13, 234–265. [Google Scholar] [CrossRef]
- Graham, J.W. Missing Data Analysis: Making It Work in the Real World. Annu. Rev. Psychol. 2009, 60, 549–576. [Google Scholar] [CrossRef] [PubMed]
- Hosler, A.; Dharssi, A. Identifying retail food stores to evaluate the food environment. Am. J. Prev. Med. 2010, 39, 41–44. [Google Scholar] [CrossRef] [PubMed]
- O’Leary, D.E. ‘Big Data’, The ‘Internet of things’ and the ‘Internet of Signs’. Intell. Syst. Acc. Financ. Manag. 2013, 20, 53–65. [Google Scholar] [CrossRef]
- Batty, M. Big data, smart cities and city planning. Dialog Hum. Geogr. 2013, 3, 274–279. [Google Scholar] [CrossRef] [PubMed]
- Shelton, T.; Poorthuis, A.; Zook, M. Social media and the city: Rethinking urban socio-spatial inequality using user-generated geographic information. Landsc. Urban Plan. 2015, 142, 198–211. [Google Scholar] [CrossRef]
- Cheshire, J.; Batty, M. Visualization Tools for Understanding Big Data. Environ. Plan. B Plan. Des. 2012, 39, 413–415. [Google Scholar] [CrossRef]
- Goodchild, M.F. The quality of big(geo) data. Dialogues Hum. Geogr. 2013, 3, 280–284. [Google Scholar] [CrossRef]
- Bollier, D.; Firestone, C.M. The Promise and Peril of Big Data; Aspen Institute, Communications and Society Program: Washington, DC, USA, 2010; p. 56. [Google Scholar]
- Moreno, M.A.; Goniu, N.; Moreno, P.S.; Diekema, D. Ethics of Social Media Research: Common Concerns and Practical Considerations. Cyberpsychol. Behav. Soc. Netw. 2013, 16, 708–713. [Google Scholar] [CrossRef] [PubMed]
- Bizer, C.; Boncz, P.; Brodie, M.L.; Erling, O. The meaningful use of big data: Four perspectives—Four challenges. ACM Sigmod. Rec. 2012, 40, 56–60. [Google Scholar] [CrossRef]
- Karande, K.; Lombard, J.R. Location strategies of broad-line retailers: An empirical investigation. J. Bus. Res. 2005, 58, 687–695. [Google Scholar] [CrossRef]
- Johnston, R.; Harris, R.; Jones, K.; Manley, D.; Sabel, C.E.; Wang, W.W. One Step Forwardbut Two Steps Back to the Proper Appreciation of Spatial Science. Dialogues Hum. Geogr. 2014, 4, 59–69. [Google Scholar] [CrossRef]
- Muller, B.; Yin, L.; Kim, Y.; Alexandrescu, F. The Dynamics of Land Development in Resort Communities: A Multiagent Simulation of Growth Regimes and Housing Choice. Environ. Plan. A Econ. Space 2008, 40, 1728–1743. [Google Scholar] [CrossRef]
- Beckmann, M.; Wehrden, H. Where you search is what you get: Literature mining–Google Scholar versus Web of Science using a data set from a literature search in vegetation science. J. Veg. Sci. 2012, 23, 1197–1199. [Google Scholar] [CrossRef]
- Meiners, C.R.; Patel, J.; Norige, E.; Liu, A.X.; Torng, E. Fast Regular Expression Matching Using Small TCAM. IEEE/ACM Trans. Netw. 2014, 22, 94–109. [Google Scholar] [CrossRef]
- La Fratta, P.A.; Kogge, P.M. Energy-efficient multithreading for a hierarchical heterogeneous multicore through locality-cognizant thread generation. J. Parallel Distrib. Comput. 2013, 73, 1551–1562. [Google Scholar] [CrossRef]
© 2019 by the authors. Licensee MDPI, Basel, Switzerland. This article is an open access article distributed under the terms and conditions of the Creative Commons Attribution (CC BY) license (http://creativecommons.org/licenses/by/4.0/).