Abstract
The article presents a map dashboard aimed at enhancing the information flow in the forest-based supply chain (FbSC). We especially focus on the procurement stage and connect the stakeholders in (near) real-time via standardized data models, interfaces and services, as well as using open-source software only. For the communication strategy, we use a new approach that incorporates the user’s roles and tasks to create role-tailored views on the dashboard showing specific task-oriented web maps. Hence, the first research question aims at identifying the roles and tasks in Austrian forestry. We identified four major roles (site managers & foresters, forest workers, truck drivers, customers) and six tasks during group discussions. The second research question deals with the effects of a role-tailored map dashboard. Therefore, we evaluated the prototype in a two-week test phase that concludes with a field study with five experts. The results are twofold: qualitative using the results from field interviews and quantitative based on a now vs. then comparison with regard to the number of media disruptions. This comparison reveals that up to 80% of the media disruption in our use case scenario could be removed by using the role-tailored map dashboard.
1. Introduction
In 2016, the forest sector in Austria had a production value of around 1.5 Billion Euros [1] with its main activities lying in the production of forestry goods (mainly timber, but also forest fuels), in forestry services as well as in additional non-forestry services. The temporal sequence of activities from raw product to the final product is called forest-based supply chain (FbSC) (e.g., [2]) and comprises four distinct phases: procurement, production, distribution and sales.
The process of procurement is defined as the production of the raw material in the forest, including the transportation to the first production facilities (i.e., saw mill). Production, distribution and sales encompass the activities to create marketable intermediate or final products and the distribution as well as sales process thereof. These processes are carried out by different stakeholders that are connected by the FbSC—i.e., flows of material, money and information. Hence, from an information and communication technology point of view, it seems obvious that these stakeholders and processes could be connected to ensure a seamless information flow in the FbSC.
However, as Rönnqvist et al. [3] point out, in many cases, stakeholders and processes remain disconnected as information technologies continue to be isolated solutions that apply to only one single forest, process or machinery. In addition, many technological solutions are tailored to one specific problem or use-case. If we would like to reach a higher level of sustainability and efficiency in the FbSC, there are several challenges to research and development of digital technologies that need to be tackled. One factor is that the FbSC has many local variabilities that hinder the development of a global technological solution that connects stakeholders and processes. In addition, the systems have to cope with the large amounts of data of the FbSC [2,4].
Especially in Austria—dominated by small and privately-owned forests, where only a minor proportion of the forested land is owned by the state and big forest enterprises—the FbSC has several issues and shortcomings that are listed below. Here, we focus on the procurement stage of the FbSC.
- Unstructured communication: Communication is mainly carried out using verbal interactions through radio sets, phones, WhatsApp groups or spreadsheets shared between actors within and across organizations. This results in scarce documentation or archiving of agreements and supplies and may lead to different states of information at each stakeholder level.
- Non-standard information and process structure: Even within organizations, there are often different kinds of information and processes utilized for planning processes. In many forest enterprises, the decision processes are different depending on the forester in charge. This results in different ways of information handling lacking a standardized information exchange or archiving.
- Varying communication channels: Decentralized file-oriented data handling as well as diverse software and planning tools are used within and across organizations. The current state is a communication mixture of electronic delivery systems, verbal communication and analogue supply notes with no standardized way of sharing information due to different software tools and ways for making and managing deliveries. This leads to many media disruptions between the processes and tasks in the FbSC.
- Unstructured sources of information: Fourthly, during the daily processes, different kinds of information are created and need to be integrated into one framework, which include form entries, map visualizations, environmental information (e.g., forest streets, forest district borders, woodpile locations, turning areas) and sensor information (e.g., GNSS positions, truck activities, weight sensors). As all of this information is contained in closed systems and do not have documented interfaces, an integration is very complex.
- Specific software solutions: This vast amount of different communication approaches has been developed out of the need to exchange information, but without having any software solution at hand for a “digital forest”. Such a solution additionally needs to consider the context and role of the users because different users need different information at different process stages.
- Limited common picture: Finally, these challenges contribute to the fact that only a very limited common picture can be derived. In detail, the common picture should combine processes of the forest-based supply chain horizontally and vertically using forms and maps integrated in one or several dashboard(s). Such a system would pave the way for a process and data standardization and result in the possibility of archiving, sharing and analyzing data of the FbSC.
In order to address the shortcomings of the FbSC, the paper has the following objectives: It deals with a prototypical system to increase the transparency and enhance the information flow between the stakeholders of the FbSC—both horizontally and vertically integrated. In detail, we focus on the procurement stage of the FbSC, and connect the involved stakeholders in real-time via standardized data models and applications integrated in a dashboard. The design of the prototypical application is created in close collaboration with the intended users in several European countries (Austria, Germany, Switzerland, Belgium, Finland, Portugal). Hence, the stakeholders are able to closely participate in the design and development process. Besides the technical specialties and the context-based applications, we validate our approach with the help of an implementation in one of Austria’s biggest privately-owned forest enterprises.
Due to the idea to incorporate different user roles and their daily working tasks into the development of our dashboard prototype, we especially focus on research questions that deal with this role-tailored strategy. Hence, with the help of the role-tailored map dashboard implementation and its testing, we try to answer the following research questions:
- What are the common roles and tasks that are required to create collaborative dashboard maps for the digital forest in the FbSC in procurement processes (in Austria)?
- What are the effects of a community-based/role-tailored map dashboard on management and planning tasks in the procurement process in the forest-based supply chain?
The first research question is answered utilizing a collaborative process that integrates the potential users of the application and the dashboard in finding the required elements of dashboards for the FbSC. The methodological approach is intended to elaborate on the task-orientation of the applications and evaluates the requirements for implementing user interfaces with a high user-experience. The second research question is tailored towards quantifying the effects of the prototypical implementation, realized in this research work. We evaluate the applications to improve the information flow in the procurement stage of the FbSC on two levels—quantitative and qualitative. On a qualitative level, we evaluate several interviews with foresters that used the system over a test period in a large Austrian forest enterprise. On the quantitative level, we critically compare and evaluate the processes in the FbSC with and without the prototype. We regard the number of media disruptions in the FbSC as proxy for the ability to serve a seamless and transparent information flow for the stakeholders of the FbSC.
The paper is organized as follows. Section 2 discusses the relevant literature, followed by the software and design approach utilized in the paper (Section 3). Section 4 elaborates on the results obtained. Section 5 discusses the results accordingly. In Section 6, we conclude the paper by summarizing the most important results.
2. Relevant Literature
The scientific literature of relevance for this particular paper was found in several scientific fields of expertise. In forest science and closely related areas, a number of papers that deal with the FbSC and their digitization exist. Additionally, in the field of Geographic Information Science and Technology and Computer Science, a number of papers are of interest for improving the information flow in the FbSC. Additionally, the field of User Experience and User Interface Design can significantly contribute to the methods utilized in this paper.
Scholz et al. [5] performed a literature review regarding the digitization of the FbSC and provide guidelines for the development of technologies to improve the information flow in FbSCs. The article concludes that higher sustainability and efficiency of the FbSC requires a seamless information flow between the entities present in the FbSC [6,7,8,9,10]. Hug [11] lists the current shortcomings of the planning and management processes in the FbSC and concludes that a number of media disruptions are present in daily management and planning operations in the FbSC.
The planning and decision making in the FbSC has been subject to a number of papers that range from strategic and tactical to the operational level. Optimization—i.e., operations research—plays a major role in decision making, as literature suggests [2,4,12,13,14]. Harvest scheduling was analyzed e.g., by [15,16,17,18,19]. Transport planning in the FbSC from the roadside to the destination has been subject to several studies including [20,21,22,23,24,25,26,27].
In order to foster collaboration in planning and decision making—striving for a better allocation of resources—model predictive control (MPC) is suggested as possible methodology in the FbSC [28,29,30,31]. From an information technology perspective, interoperability needs to be solved on the syntactic and semantic level. Therefore, web services embedded in a service-oriented architecture [32] as well as linked data approaches [33] are valid strategies. For the integration of spatial and sensor data, Open Geospatial Consortium (OGC) services are of particular importance [34,35]—especially the OGC Sensor Web Enablement initiative [36]. Von Schnetzler et al. [37] proposed a modification of the supply chain operations reference to describe and standardize the FbSC. Collaborative approaches in the FbSC are still hard to find [5]. Nevertheless, a number of publications identified crucial issues regarding the interactions of stakeholders of the FbSC (e.g., [38,39,40,41,42]).
Well-designed and intuitive map-based visualization tools (e.g., dashboards) that are tailored to the specific context and users enable an understandable way to visually communicate spatio-temporal data and support the decision making process [43]. Therefore, user interface design guidelines, methods and concepts from different domains (e.g., Human Computer Interaction, Interaction Design, Web Design, Philosophy, Geovisualization, Cartography) can be used for developing web mapping apps and dashboards. Ref. [44,45,46,47,48,49,50] are dealing with the creation of maps from the viewpoint of Cartography as well as Geovisualization. Other disciplines have a significant influence on (web) map creation too. For example, gestalt principles from Psychology deal with the spatial arrangement of elements and their visual perception [51,52]. This can be valuable for developing mapping applications and map dashboards. Traun [53] elaborated on the creation of perception-oriented maps under consideration of the gestalt principles such as visual grouping, figure-ground articulation, similarity, proximity and continuity. Atzl [54] presented a summary of design guidelines and design strategies derived from a literature review that are suited for map design. These guidelines may be used for developing the role-tailored map dashboard in this paper. Additionally, these guidelines give advice with respect to the usage of colors, alignment and positioning of elements, proximity and grouping, balance, repetition and consistency, affordance and visibility, feedback and errors as well as text and pictograms. For developing and evaluating our first prototypes together with end users, structured group discussions (focus groups) [55] and a combination of field interviews and observation (contextual inquiry) [56] are used.
3. Software and Design Approach
In this article, we present a prototypical role-tailored map dashboard, which aims at enhancing the procurement processes in the FbSC by reducing media disruptions as well as providing a graphical communication tool for Austrian forest enterprises. To define a first concept, we address three main requirements: (1) usage of open source software tools for the map dashboard prototype that support CRUD (create, read, update, delete) operations, (2) include the different roles and tasks in the design approach (task-oriented and card-based design), and (3) use a standard conform architecture. The implications of these requirements and their implementation methods will be discussed in the next few sections.
3.1. Technical Open-Source Workflow
One of the key requirements for the prototypical development was to use open-source software and frameworks only. Thus, only open-source tools have been used for the components that are part of the technical concept of our prototypical map dashboard. These components use different software tools and frameworks (e.g., for storing, publishing, integrating and visualizing the data). The technical concept is shown in Figure 1. A PostgreSQL database with a PostGIS extension is used for data storage.
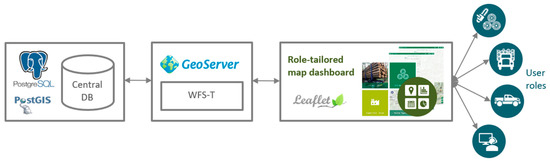
Figure 1.
Technical open-source workflow for creating a role-tailored map dashboard.
Due to the need of enabling create, read, update and delete (CRUD) operations on the client-side, a transactional web feature service (OGC WFS-T) is used to publish the data and make them accessible in a standardized way via GeoServer. In contrast to an OGC web feature service (WFS) which allows to query and retrieve features only, WFS-T supports transaction requests. This makes it possible to not only retrieve data of a service, but also to update it.
In general, to update the streaming data in our map dashboard that are integrated using WFS-T, we use a trigger that requests and updates the data at a specific interval (pull approach). The pull approach requires the client to periodically retrieve data from the server using a specific time interval to get updates [57]. In contrast, when using the push approach (e.g., using the web socket protocol), then the client automatically gets data that have changed [57]. By default, the push-based approach does not archive the data, whereas a pull-based approach does this by definition.
We use the open-source JavaScript library Leaflet and the Esri Leaflet extension (a lightweight set of specific tools for Leaflet) for developing the web map apps that integrate the data as WFS-T. Leaflet is the leading open-source JavaScript library for mobile-friendly interactive maps and it works efficiently across the major desktop and mobile platforms. In addition, there are many plugins available to extend the basic mapping features provided by the Leaflet library.
3.2. Task-Oriented Card-based Design Approach and Communication Strategy
The map dashboard prototype was developed following a user-centered design (UCD) approach. This means that the users are involved in all development phases. Their needs, goals and preferences are important factors to ensure that usability goals are met [58]. The ISO 9241-210:2010 standard provides guidance for implementing UCD. Therefore, Jokela et al. [59] summarize the main activities of UCD: (1) understand and specify the context of use, (2) specify the user and organizational requirements, (3) produce design solutions, and (4) evaluate designs against requirements. This is not a sequential process, but rather a circular one that often needs several refinement cycles.
At the beginning, only one prototypical web mapping application was defined for all user groups, which has then been refined after identifying the roles (see Section 4.1). The major roles and their tasks have been identified through focus groups and several coordination meetings with several stakeholders. For developing the prototypical web mapping application, simple visualizations (wireframes) and more detailed mock-ups are created for depicting the first ideas for the prototype as well as to build the foundation for the focus groups. The map dashboard uses a task-oriented design approach and follows a “one-task-one-app” philosophy (cf. [60,61]). This means that the role-tailored map dashboard consists of different small apps, each aimed at performing a specific task. By using this task-oriented approach, novel users are less distracted due to the reduced complexity and information, and thus can focus on the specific task that has to be performed [60].
To provide an intuitive and easily understandable approach for presenting the ‘right’ apps to the ‘right’ roles, a central start page was developed, following a card-based design metaphor (similar to the design strategy presented in Scholz and Mittlböck [60]). This means that depending on the role of the user, this central start page contains different cards that link to the specific map dashboard apps. For example, in Figure 2 the screenshot on the left side (a) shows the view for the site managers and the right one (b) shows the view for the truck drivers. Each view contains all apps that are needed for the specific role.
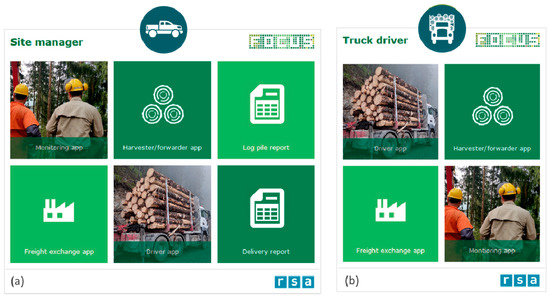
Figure 2.
Two exemplary start pages showing (a) the view for the site managers, and (b) the view for the truck drivers using the task-oriented design metaphor.
The card-based design is well known and used by popular companies (e.g., Microsoft, Google) and websites (e.g., Pinterest). Cards can have different forms, shapes and colors as well as combinations of images or icons together with a title or short texts [62]. According to our level of knowledge, the usage of this card-based and task-oriented communication strategy is new in the context of enhancing the FbSC by reducing media disruptions and enabling a better interoperability. Furthermore, using the apps helps to enhance the situational awareness and to share information within and across organizations within the FbSC. All web mapping apps are accessible via the central task-oriented start page and are only visible if they are needed from the specific role of the user.
For the development of the user interfaces for all map apps of the overall role-tailored map dashboard, common design strategies from different domains (e.g., Human Computer Interaction, Interaction Design, Philosophy, User Experience Design, Cartography, Geovisualization) such as summarized in [54] are used. These design strategies comprise rules of arrangement from the ‘gestalt’ theory (e.g., figure-ground articulation, proximity-, similarity-, symmetry-, closure-, and continuity-principles) or other common design guidelines regarding alignment and positioning of elements, grouping, text and pictograms, balance, repetition and consistency, affordance and visibility or feedback and error in web applications. We used the design strategies for developing the dashboard and its different map apps with regard to the placement of elements (header, menu, legend, buttons), the selection of self-speaking symbols on buttons, the size of text and elements as well as visual feedback for users (descriptive text parts, error messages, step-by-step guidance in menus).
The different web maps of the map dashboard are twofold: (1) they have a map area that shows the geolocated information (e.g., wood pile storages, truck positions) and (2) a menu section for creating/updating the information using forms.
Another important aspect is that the role-tailored map dashboard and all its apps have to be responsive, because they have to be rendered on desktop PCs, laptops and tablets. Further, the menus and forms have to be adapted depending if landscape or portrait mode is used on the device.
We evaluated the final role-tailored map dashboard prototype using contextual inquiry that combines field observations and a structured interview. The interview contains quantitative as well as qualitative questions (see Appendix A). Some of the resulting web maps of the role-tailored map dashboard are presented in Section 4.2 in more detail, the evaluation of the quantitative results is presented in Section 4.3 and the qualitative results in Section 4.4.1.
3.3. ISA-95 Based Conceptual Model
The components of our conceptualized model relate to the levels of the international standard ISA-95 and are shown in Figure 3. ISA-95 is a standard that defines an information model for the integration of Enterprise Resource Planning Systems (ERP/IT) and the Manufacturing Execution Systems (MES/OT) [63]. The ISA-95 standard includes models and terminology for determining the information to be exchanged between IT systems and systems for production, maintenance and quality [64]. ISA-95 was developed for manufacturing enterprises of all industries. The OT (operational technology) levels in ISA-95 contain a collection of devices and sensors as well as their embedded software. The IT (information technology) levels include the hardware infrastructure and software applications that transform the data and data streams from the OT levels. In addition, we divided the model into passive and active components.
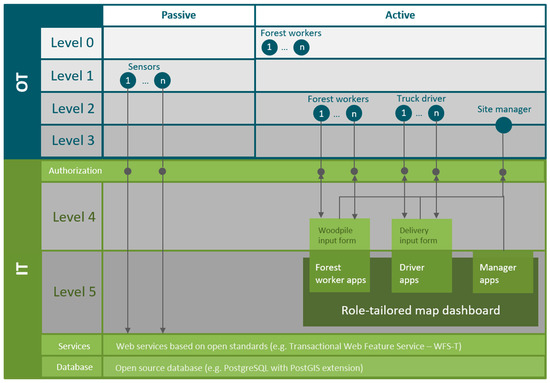
Figure 3.
Passive and active components of the role-tailored map dashboard with regard to the ISA-95 standard levels (based on [64]).
Level 0 to 4 are conformant with the ISA 95 standard and level 5 (product development) as well as the IT/OT levels are additionally added (cf. [64]).
Level 0 is the (physical) production process and in our case, the forest workers (e.g., lumberjack, harvester) are the active components of this level (“people as sensors”). The forest workers at this level are responsible for cutting trees and producing the woodpiles along the roadside.
The sensing and manipulation of the production process is part of level 1. In our case, this level comprises different passive sensors that are part of machines/vehicles (e.g., positional accuracy, horizontal ground speed, loading/unloading status) or weather sensors that provide additional information such as temperature, humidity and wind speed. The sensor data are requested at a specific interval (every 30 seconds for our prototype), stored together in the PostgreSQL database and published in a common standardized OGC WFS using GeoServer for integration into the map dashboard.
Level 2 contains monitoring, supervisory control and automated control of the production process. In our use case, the forest workers (e.g., harvester, forwarder), the truck drivers as well as the site managers are the active components that are responsible for monitoring the production processes within the procurement stage.
The managing of the workflow to produce end products and optimizing the production processes (level 3) are tasks of the site managers. To fulfil the tasks of level 2 and 3, the responsible persons use the dashboard web mapping apps. The prototypical map dashboard consists of several small and role-tailored map apps that provide the possibility to create, read, update and delete data via specific tools and forms in these maps.
Level 4 and level 5 contain the overall dashboard prototype and all its web mapping apps (IT levels). The information that is created, read, updated or deleted via the dashboard prototype interfaces uses an OGC WFS-T on GeoServer. The data is directly updated using WFS-T if the user makes a transaction via the dashboard interface. To make these updates visible on the map dashboard for all users, the WFS-T layer is requested and updated periodically (currently every 20 s).
4. Results
The results of this publication are fourfold (see Figure 4): The first result was the identification of the different roles and their associated tasks (see Section 4.1). The roles and their tasks have been identified through focus groups and several coordination meetings with twelve different partners from the EU FP7 FOCUS project (Figure 4a).
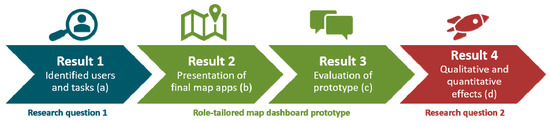
Figure 4.
The four results with regard to the research questions: (a) the identified major roles and tasks, (b) some of the final web mapping prototypes, (c) evaluation of the prototype, and (d) the qualitative and quantitative effects of the role-tailored map dashboard prototype.
To create the final role-tailored map dashboard as the second result, the initial model presented in Section 3 (based on open source software, task-oriented communication strategy and ISA 95) has been refined using an iterative process. After several refinement steps, the functional map dashboard prototype was finished. In Section 4.2 some of the role-tailored web mapping apps of the dashboard are presented (Figure 4b).
The third result was an evaluation of the final prototypical role-tailored map dashboard (see Section 4.3). The prototype was introduced to the users in December 2017, but the active test phase already started in May 2017. The prototype was evaluated in a two weeks test phase of the prototypical map dashboard in an Austrian forest enterprise and a concluding in-field observation combined with structured interviews.
The two weeks test phase was conducted at two of the five sites of the participating Austrian forest enterprise and six people were involved in this evaluation. The six participants have used Android tablets as well as Desktop PCs for testing the dashboard prototype. To obtain views from different roles, the six participants comprised two truck drivers, two site managers and two foresters. One of the site managers was the main contact person during the cooperation and we got ongoing feedback from this site manager during the whole project duration. Thus, the results that we present here are viewed from the perspective of this Austrian forest enterprise including its relationships with other enterprises and industries.
The final interview was carried out on one working day in May 2018 using a structured interview consisting of 37 main questions and several subquestions (see Appendix A). The interview contained quantitative and qualitative questions and was conducted in-situ in combination with field observations (contextual inquiry). This means that we accompanied the truck drivers during their transportation tasks (including charging woodpiles, deliveries and unloading woodpiles) and also accompanied the foresters on their way to the woodpile locations for managing the timber harvesting (within the forest and also in their offices). The site managers have been visited in their offices. They tested our dashboard prototype during their daily tasks and we could observe them and ask them questions. Each time, the interviews were conducted at the end of the specific sessions with the five users. The interview was anonymous, took about an hour and was audio recorded additionally. We interviewed five of the six experts who were involved in the two weeks field testing phase consecutively over the day. The same interview was used for all five participants. Parts of these interviews (mainly the quantitative questions) aimed at the evaluation of the final prototypical role-tailored map dashboard (Figure 4c).
An additional part of the interviews aimed at revealing the fourth result (Figure 4d): An analysis of the qualitative and quantitative effects of our approach on the woodpile storage and transportation planning processes of the FbSC (see Section 4.4).
4.1. Identified Roles and Tasks
The identified roles and tasks are the result of an iterative process that involved group discussions with the twelve different partners (including EU-wide project partners for doing the groundwork such as conceptualization and first prototype implementations), as well as doing a national evaluation with one Austrian forest enterprise. The identified roles and tasks are rather generalized and depict the major actors involved in the procurement process of this Austrian forest enterprise. The major roles that are relevant for our use case are:
- (1)
- In-house and external forest workers responsible for harvesting and forwarding tasks
- (2)
- In-house and external truck drivers that pick up the logs and deliver them to the customers
- (3)
- Customers/controllers from production facilities (e.g., sawmills)
- (4)
- Site managers and foresters that work together and manage the harvesting, transportation and sale of log processes
The tasks that we integrate into the role-tailored map dashboards are those that are most relevant for our use case for an Austrian forest enterprise and involve the four roles described above. These tasks and corresponding dashboard apps are:
- (1)
- Register woodpile on roadside (the specific dashboard map app “Harvester/forwarder app” has to provide create, read, update and delete operations)
- (2)
- Plan and manage deliveries and transportation of logs (the specific dashboard map app “Driver app” has to provide create, read, update and delete operations)
- (3)
- Acquire return deliveries and optimize routes by exchanging freights (the specific dashboard map app “Freight exchange app” has to provide create, read, update and delete operations)
- (4)
- Monitoring of street barriers, trucks and their delivery state (the specific dashboard map app “Monitoring app” has to integrate information from diverse sensors e.g., GPS, smartphones and OBD-II interface; read operations)
- (5)
- Create reports that summarize the amount of wood per site and the planned deliveries (the specific dashboard app “Reporting app” has to create the selected report dynamically; read operation)
- (6)
- Inform about incoming freights and amounts of wood (the specific dashboard app “Geofencing app” has to show some kind of alerting if a truck arrives within the next e.g., 15 min including some additional information about the goods)
The relationship between the identified roles and the different map dashboard apps representing the tasks identified above are shown in Figure 5. All apps of the role-tailored map dashboard are inserting, querying, updating or deleting the data from a central database to enhance interoperability within and between the actors. Hence, the map dashboard provides a common interface to share relevant information between all actors involved in the procurement process tailored to the needs of the different roles.
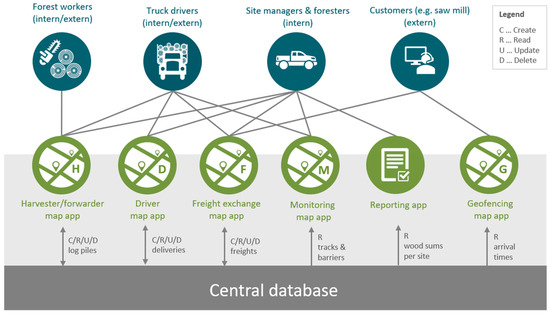
Figure 5.
Identified major roles, their tasks and the corresponding web mapping apps.
One possible usage scenario of the role-tailored map dashboard is shown in Figure 6. The forest workers use the “Harvester/forwarder app” to create or update log pile storages. These new log pile locations are stored and shown in (near) real-time to all other roles that are involved in this process. The site managers (and foresters) can use the “Monitoring app” to see and monitor the current log pile storages. The deliveries are stored and also shared with all truck drivers. The site managers can create different types of reports on demand to see e.g., the sums of solid cubic meters per range of wood types/qualities and site. The “Driver app” can be used by the site managers to plan and manage the deliveries for the next days. This information is shared with all truck drivers. Next to the planned deliveries, the truck drivers can also use the dashboard apps to get detailed information about the exact location of the log piles. If a delivery is done, the truck driver should communicate this using the role-tailored map dashboard. The customers (e.g., sawmills) can use the “Freight exchange app” to create and update available deliveries that should be forwarded to another facility. These deliveries are valuable for acquiring backhauls. The “Geofencing app” can be used by the customers to get informed about incoming deliveries (e.g., a truck arrives within the next 15 min).
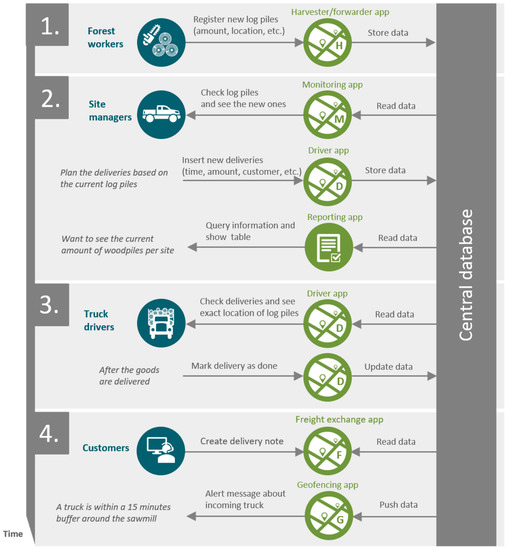
Figure 6.
Exemplary use case scenario of how the involved roles interact with the prototype.
This is only one exemplary scenario and does not illustrate all possible tasks that can be performed via using the different map apps of the role-tailored map dashboard prototype. Some of these web maps are presented in the following section.
4.2. Presentation of the Web Mapping Apps of the Role-Tailored Map Dashboard Prototype
The prototypical map dashboard consists of five separate web maps and a reporting app that are all tailored to the user roles and their specific tasks. The map apps can be accessed via the task-oriented start page of the role-tailored map dashboard presented in Section 3.2.
Figure 7 shows the “Harvester/forwarder app” and Figure 8 shows the “Driver app”. The overall design and layout are identically, but the underlying tasks that can be performed by each of this map apps are different. The “Harvester/forwarder app” supports the registration and updating of woodpile storage locations and can be used by forest workers and site managers/foresters and truck drivers. The “Driver app” enables managing the log deliveries and can be used by truck drivers and site managers.
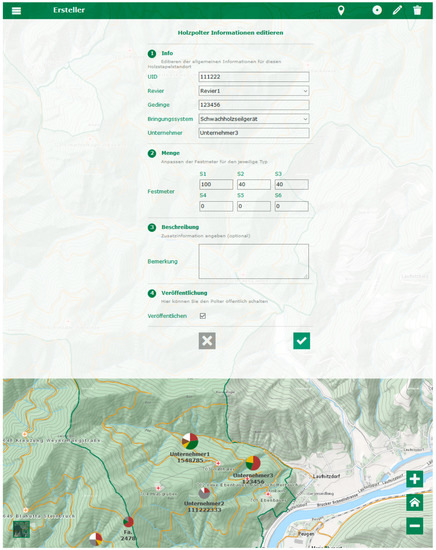
Figure 7.
The “Harvester/forwarder app” for managing woodpile locations is one of the five web mapping apps of the role-tailored map dashboard.
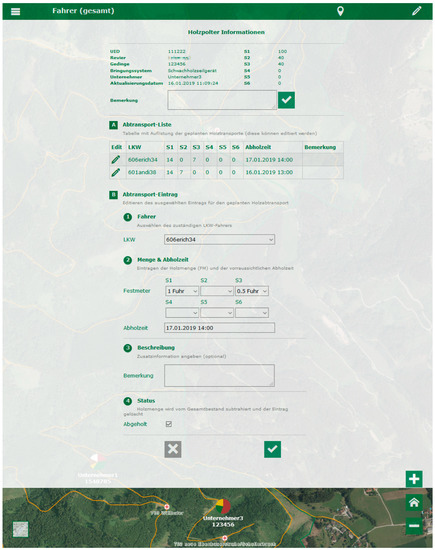
Figure 8.
The “Driver app” is used for managing deliveries and here, the planned deliveries for a specific woodpile storage location are shown.
The “Freight exchange app” is shown in Figure 9. This app contains information about active and consumed delivery notes and is available for customers (the sawmills), site managers as well as truck drivers.
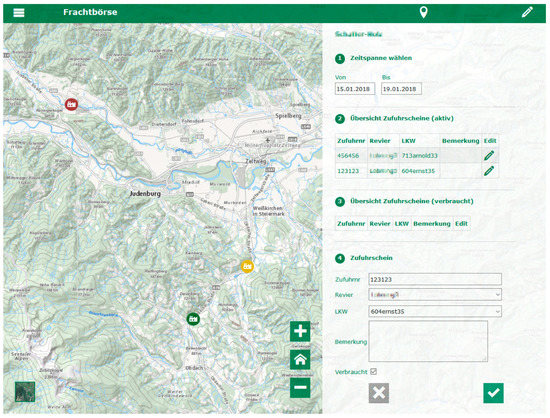
Figure 9.
The “Freight exchange app” showing active and consumed delivery notes for different customers (sawmills).
As another example, Figure 10 shows the prototypical “Monitoring app” that is provided to site managers and truck drivers. There are different versions of this app available, each showing a different time span (e.g., last 4 h, last 24 h and last 5 positions). This app shows an overview of different relevant information needed for monitoring the transportation processes. Therefore, the GNSS-tracks of the truck drivers, environmental information from a specific reporting smartphone app (e.g., street barriers) as well as truck states that are picked from the OBD-II interface (e.g., loading/unloading, driving, inactive) are combined and visualized accordingly.
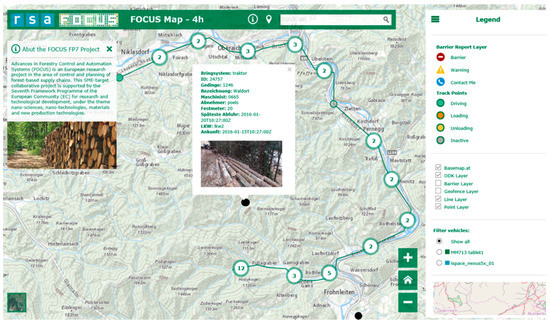
Figure 10.
The “Monitoring app” showing the last 4 h (including tracks, truck states, barriers, environmental information).
All web mapping apps use the same design and layout. They contain the common map elements (e.g., zoom, home, change basemap, legend, show my location, identify window). All apps have a header containing the buttons that are relevant for performing the specific tasks. Nevertheless, there are some differences between the “editing apps” (e.g., “Harvester/forwarder app”, “Driver app”, “Freight exchange app”) and the “monitoring apps” (e.g., “Monitoring app” of the last 4 h). The editing apps have at least one of the CRUD operations within the header. In addition, this web map types combine maps and forms for inserting/updating data. Within the forms there is a step-by-step guidance that gives some advice on the order and type of user inputs. The monitoring apps are rather visualization tools that have some additional map elements (e.g., address search, layer selection, filtering of truck drivers on the map and overview map).
For the visualization of the different map contents (e.g., log pile point layer, track streaming layer, barrier point layer, etc.), different strategies for presenting dynamic information are used. These include for example (1) dynamic and zoom-depending clustering of points, (2) spiral spreading of overlapping points, (3) pulsing points, (4) different transparency, color and size values, and (5) dynamic charts (for more details see [65]). Especially the dynamic chart symbols that are used for showing information about the log pile storage locations are developed for this prototype (cf. Figure 7 and Figure 8). This pie-chart symbol combines information about the amount of solid cubic meters in relation to the overall amount of wood (rendering the size of the symbol) and the percentage of the wood ranges and timber types (using different colors). In addition, some labels are used to give further information on the entrepreneurs. Hence, the most important information is shown at first glance.
4.3. Evaluation of the Role-Tailored Map Dashboard Prototype
In addition to the focus groups and intermediate project meetings of the EU FP7 project FOCUS, we evaluated the final prototype using contextual inquiry. During our contextual inquiry with five forest workers (all of them are male) of a big Austrian forest company during a typical work day, we asked several questions regarding the role-tailored map dashboard, its central start page, as well as the overall layouts and designs. In this section, mainly the quantitative results of the interview are presented including some additional qualitative answers that were directly connected to these questions. The qualitative questions are discussed in Section 4.4.1.
The general idea of creating a role-tailored map dashboard based on different apps that are shared with all actors that are involved in the procurement process was graded with 1.6 in average (where the options range from 1.0 = “very good” to 5.0 = “not sufficient”). One participant stated that this dashboard approach will only work if all fill in their information directly. The “one-task-one-app” philosophy—that is the foundation for our role-tailored map dashboard approach—was rated by all five probands with “very good (1.0)”. Two participants additionally stated that it would be too complex to put all the tasks into one app and that this splitting is very intuitive and clear. One participant mentioned that due to this central page, it seems as one big system and the user does not really recognize that there are different apps in the background and that this approach perfectly fits for the usage on tablets in the field.
The overall appearance and design of the card-based central start page is graded with 1.2 in average. The question about how understandable and intuitive this central start page is, was evaluated with 1.2 in average too. All five participants agreed that the central start page is very helpful for the navigation to the specific app (a grade of 1.0 in average). Thus, all participants use this central start page as start point to navigate to the other apps (instead of using the web links only). One participant mentioned, that he also has a bookmark to the web map that he uses most often, but nevertheless, he uses the central start page instead of this bookmark.
The first results from the in-field interview with five participants of the Austrian forest enterprise show that our idea of using a role-tailored and task-oriented map dashboard approach and present the apps using a card-based design metaphor goes in the right direction and is well accepted from this five representants from the forest community.
During the interview, we also asked several questions regarding the design, layout and complexity of the different dashboard map apps. Three of the participants got a short introduction into the handling of the different web maps in advance. Two of them think that this introduction was helpful. Two participants got no introduction before the test phase and both did not have any problems when using the role-tailored dashboard apps. All five experts evaluated the dashboard apps as not being complex at all, resulting in an overall grading value of 1.5 (1 = “very good” to 5 = “not satisfactory”). The combination of maps and forms was evaluated by four participants as very useful. Especially the visualization of log pile locations was seen as the big advantage of the dashboard apps. One participant stated that he would only need the forms, but he believes that the maps are very meaningful for the truck drivers. The step-by-step guidance within the forms was liked by three of the five participants, two of them would not really need it, although they do not consider it being disruptive. The possibility to switch between the street map and the satellite map is necessary for all five participants. The following elements are graded on average by the five participants: (1) division of map to form with 1.2, (2) coloring with 1.3, (3) header with 1.1, (4) size of symbols and buttons with 1.0, (5) used icon symbols with 1.4, and (6) map symbols with 1.4. One critical point was that not all icons were self-descriptive at first usage (especially the “point/circle” symbol for creating new entries and the “minus/straight line” symbol for creating lines). Four participants especially liked the dynamic charts symbols, because the range of wood types/quality and amounts can be seen at a first glance. Overall, all five participants were satisfied with the role-tailored map dashboard and like the simple and intuitive interface.
4.4. Effects of A Role-Tailored Map Dashboard
This section aims at answering the second research question dealing with the effects of a role-tailored map dashboard for enhancing processes in the FbSC. First, we present the qualitative effects extracted from the field interviews with the five experts (Section 4.4.1). In the second Section 4.4.2 we show the quantitative effects by doing a now vs. then comparison with regard to the number of media disruptions within the FbSC.
4.4.1. Qualitative Effects Based on Field Interviews
One aim of the structured interview (see Appendix A) was to find out qualitative effects of the role-tailored dashboard with regard to transparency, interoperability, reduction of media disruptions, decrease of resources and willingness for further usage. In this subsection, the most often mentioned statements from the interview with five experts are summarized. The detailed list of comments and annotations from this interview are shown in the table in Appendix B.
Three of the experts stated that one of the main advantages of the role-tailored map dashboard is that everybody who is involved in the specific processes has the same information and thus the map dashboard prototype fosters transparency of these processes along the FbSC. Three of the five experts mentioned that the easily understandable and intuitive user interface of the map dashboard in combination with a central database reduces the overall complexity of data organization and management. In addition, the site manager stated that now the forest territories use different sheets and tables and that such a map dashboard supports the process of harmonizing the data and information through having standardized input forms. Three of the interviewees revealed that specific tasks will get easier (e.g., navigation to woodpile storage places), because of the map that shows woodpile locations in combination with additional information that is currently not linked in their system (e.g., forest streets, storage places, truck reversing locations, solid cubic meters of wood, planned deliveries, etc.) and that this reduces the need for additional phone calls. The site manager believes that it is possible to save time through using our map dashboard prototype over a longer time period, because it would be possible to predict amounts of wood and make conclusions about truck workloads as well as the possibility to create reports automatically. Further, the site manager mentioned that having up-to-date stock values on a centralized dashboard enhances the allocation of specific delivery notes and help to retain an overview of all the decentralized woodpile storage locations. During the interview and also during our observations, we found out that for our experts, real-time data does not have a high importance, because all of them currently use the map dashboard one to three times per day to update the information (e.g., during waiting times in the truck or within the office).
All five experts see the need for an offline support of the map dashboard because there are several areas where no mobile connection is available. Three experts are willing to further test the current map dashboard prototype, but two of them stated that it only makes sense if everybody in the company uses the map dashboard to keep the data up to date. Three interviewees suggest to develop an offline solution and further enhance the prototype in a continuing project.
4.4.2. Quantitative Effects Based on a Now VS. Then Comparison
On a quantitative level, we made a now vs. then comparison with regard to the number of media disruptions alongside the FbSC in the current state (now) and when using our role-tailored map dashboard prototype (then). The aim was to find out if the processes within the FbSC could be enhanced through our map role-tailored dashboard approach.
Figure 11 shows the actual state of the FbSC processes and their involved roles as well as the typical media disruptions during these processes (harvest planning, woodpile storage, transport planning and wood processing). The site managers (foresters) are responsible for monitoring and planning several of the processes of the FbSC and thus, we created the figures from their point of view. Our prototype focuses on the processes of woodpile storage and transport planning (highlighted with colors), but for the sake of completeness, we also included the other processes that have not been in our focus (colored using grey hues). Hence, for counting the media disruptions in a now vs. then comparison, we only concentrate on the woodpile storage and transportation planning processes.
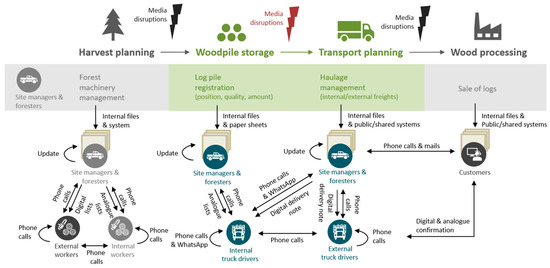
Figure 11.
Media disruptions within the FbSC processes showing the actual state (now).
Within the daily tasks of our participants, the following ten media disruptions could have been identified (cf. Figure 11):
- Digital files/lists containing information about current woodpile storages (e.g., location, amount of solid cubic meters, quality, etc.) are filled by site managers/foresters for their territories and are printed and handed-out to the specific truck drivers in analog form (at most once per week) → media disruption
- If there are changes, the truck drivers are informed via telephone (there are no new lists) and also if the truck drivers have any questions (e.g., regarding the exact location of a woodpile) they also use their phones → media disruption
- (a)
- The site managers/foresters update this information digitally when they are in their offices (if there are many different changes, sometimes new analog lists are handed-out) → media disruption
- (b)
- The truck drivers annotate the changes on their analog lists → media disruption
- In addition, the truck drivers exchange information with each other regarding specific details (e.g., swapping places, to avoid “collisions” on small forest streets, delays, etc.) via:
- (a)
- Phone and radio → media disruption
- (b)
- Small WhatsApp groups → media disruption
- There are internal electronic systems for digital delivery planning available where the site managers/foresters can manage and monitor deliveries where the truck drivers get their specific digital delivery notes directly from → media disruption
- (a)
- The site managers and truck drivers insert information about the deliveries and send their digital delivery notes to customers using external electronic systems too, but these tasks are part of the wood processing stage of the FbSC that was not the main focus in our current prototype
- The site managers/foresters correspond with different persons and using different media for planning the transportations:
- (a)
- They use phones to communicate with their truck drivers (e.g., to get information when a delivery is done) or to talk to customers (such as sawmills) → media disruption
- (b)
- They have additional WhatsApp groups with specific truck drivers, foresters and site managers → media disruption
- (c)
- They write emails with customers (e.g., quotations/offerings) → media disruption
Our aim was to reduce the number of media disruptions within the woodpile storage and transportation planning processes of the FbSC by developing a role-tailored map dashboard prototype. Figure 12 shows how the same processes and communication tasks would look like when using our prototype. Our role-tailored map dashboard approach can reduce all media disruptions between the woodpile storage and the transportation planning processes of the FbSC through combining and merging all the different information together into one central system. This holds true only under the permission that all persons involved use the role- tailored map dashboard in a right way and update their information regularly.
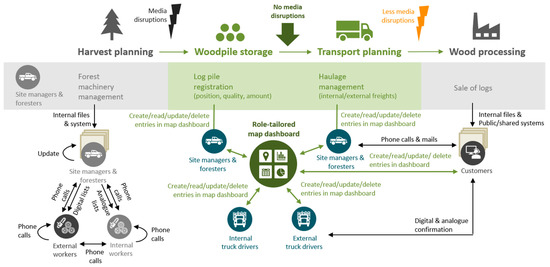
Figure 12.
Reduction of media disruptions within the FbSC processes by using the role-tailored map dashboard prototype (then).
Through the high amount of media disruptions (especially phone calls), important information can be lost. The role-tailored map dashboard is fed with information from all who are involved in the processes and this information is centrally stored. This helps to reduce the loss of information and makes the whole information flow more transparent to all stakeholders. In addition, the losses in the amount of produced and sold timber, whether uncaused or culpable, are of high interest of forest owners and forestry experts [66]. Whereas the uncaused losses include losses during technical processes regarding transportation and handling of wood, deprecation of wood due to long-term storage or depreciation of wood stocks due to technological unavailability [66]. Especially in small scale forestry often managed by forest associations, several different hauling companies are employed. These haulers are not fully familiar with the forest districts, which leads to the issue that woodpiles may be forgotten or lost in the forest. In our map dashboard, all the woodpile storages (also very small ones) including also important additional information (such as cubic meters, quality, creation date, planned deliveries, customers, etc.) are visible and thus, cannot get lost. Due to the stored date information, it is easy to see how long the specific wood stocks are already stored. Hence, our map dashboard can help to reduce the amount of timber that is harvested but never dispatched by keeping the information in the map dashboard.
Through the possibility to also give the customers access to specific map apps of the dashboard, the media disruptions between them and the site managers/foresters can be reduced (see the process of transportation planning and wood processing in Figure 12). Nevertheless, there will be still some communication needed between the site managers and customers, so the media disruptions 5a and 5c (see list above) cannot be removed completely.
In overall, the quantitative now vs. then comparison shows, that in our usage example, it would be possible to reduce the media disruptions from 10 to 2, which is a reduction of 80%.
5. Discussion
Digitization of processes alongside the FbSC is an important topic and gains attention in the forest community. Mobile devices such as tablets and smartphones will play an increasing role in the future of data collection within the forest [67]. Scholz et al. [5] have already revealed that there is a need for an integrated, near real-time, and process oriented solution combining sensor measurements, positioning and spatial data. In this article, we presented a role-tailored map dashboard prototype that aims at fulfilling all these requirements using the map metaphor and a responsive design.
For answering the first research question “What are the common roles and tasks that are required to create collaborative dashboard maps for the digital forest in the FbSC in procurement processes (in Austria)?”, we identified the roles and tasks on a rather general base and with regard to one specific Austrian forest company. We think it is important to not go into too much detail for the classification of roles, because it still should be simple and not too specified on the needs of individuals. In Section 4.1, we identified major user roles for our use case. These are site managers & foresters, forest workers (e.g., harvester, forwarder), truck drivers and customers. Additionally, we extracted six main tasks that are relevant for the role-tailored map dashboard prototype: (1) the registration of woodpile storages on roadside, (2) the planning and management of deliveries, (3) the acquisition of backhaulages, (4) the monitoring of street barriers, transportation routes and delivery states, (5) the creation of reports, and (6) the announcement in advance for incoming freights (alerting). The roles and tasks presented here show the perspective of our participating forest company only. We are aware that not all processes and tasks are covered, but for our first role-tailored prototype we focused on the main roles and tasks only. For getting more generalized results, additional studies based on the here presented results with several different forest companies would be necessary.
The second research question concerning the effects of a role-tailored map dashboard on procurement processes in the FbSC is answered on a qualitative way using field interviews with five experts, as well as on a quantitative way by making a now vs. then comparison of the number of media disruptions in the FbSC. Summarized, the major qualitative effects extracted from the structured interviews (see Section 4.4.1 and Appendix B) of our role-tailored map dashboard are the reduction of complexity, harmonization of data, better transparency of processes and information, better overview of woodpile storages, and the combination of not yet linked information (this makes several tasks easier and reduces especially the number of phone calls).
Hug [11] selected a similar approach to reveal the weaknesses and potentials for rationalizations in the FbSC including a now vs. then comparison that contains qualitative and quantitative evaluations of different concepts and showed that time reductions up to 40% are possible. Hug [11] revealed that the handwritten data transmission, media disruption and associated input errors, as well as non-standardized data storage at forest district cause time-consuming work processes and redundancies. Further, the most time-consuming effort is planning, followed by the timber harvesting and thus, considerable potential for rationalizations can be reached through using information technology (IT) for these processes [11].
We can support this statement that IT has high potentials for enhancing and optimizing processes in the FbSC. In the now vs. then comparison presented here, we revealed that up to eight out of ten media disruptions can be eliminated by using our role-tailored map dashboard (see Section 4.4.2). We are aware of the fact, that a number of five participants may be too small to get reliable and general results and that further interviews and studies may be necessary. However, it provides a first impression on how to effectively tackle media disruptions in the FbSC. In the future, it is planned to do further evaluations with more users (from the Austrian forest company) and also using techniques such as eye-tracking, click behavior and mouse-tracking.
Our field study, containing observations and interviews, shows that there is a need for a role-tailored approach that incorporates specific roles and tasks into the design process of a central and harmonized map dashboard for enhancing the FbSC. Another need that we revealed during our field study is that of an offline solution for our role-tailored dashboard, because there is often no, respectively a bad internet connection in the forest areas. The active test phase of two weeks shows first tendencies only and may be too short to get fully reliable results. A long-term study would be necessary involving all employees from the participating forest company. Nevertheless, we could reach good results during our small field study with the participating Austrian forest company, which can be used as a foundation for further evaluations and studies. For example, it is planned to evaluate if the users use our dashboard prototype in the intended way without falling back to old habits regarding using different communication channels such as phone calls that would not be necessary any more. This evaluation is important to get empirical evidences about the reduction of media disruptions. The participating Austrian forest company is willing to contribute to the enhancement of the prototype and to make further evaluations over longer periods in a subsequent research project.
Our role-tailored map dashboard developed for an Austrian forest company is a fully functional prototype, which will be developed further in the near future. This approach, including the final dashboard prototype as well as the identified user roles (as discussed in our research questions), can be further extended to German-speaking countries, because of the similar forestry processes and structures. The validity of this approach for other countries in Europe or beyond has to be further investigated.
6. Conclusions
As we presented several results in this paper, we divide our conclusions into four sections: (1) technical conclusion dealing with the process of developing a role-tailored map dashboard, (2) conclusions drawn from including roles and tasks into our approach, (3) conclusions drawn from our contextual inquiry containing field observations and interviews (to measure qualitative effects), and (4) conclusions about quantifying media disruptions in the FbSC procurement process using a now vs. then comparison (quantitative effects).
First, we came up with the following conclusions regarding the technical implementation of our role-tailored map dashboard:
- Having a common IT solution which incorporates standardized interfaces is important to foster data harmonization, standardization and interoperability within and across forest companies.
- The usage of open-source software/solutions facilitates to share the final map prototype without high costs or licensing issues.
- To follow a user-centered design approach that involves the users in all the development phases is important to create a kind of “bonding”. In addition, the integration of design guidelines, common visualization strategies and user evaluations is important to develop a map dashboard that meets usability goals and an interface that is on-trend.
- Due to the internet connection problems within the forest, a solution that works online and offline is inevitable.
Second, we identified three main aspects that deal with the integration of roles and task into the development process of a role-tailored map dashboard:
- Splitting the map dashboard into several small and role-tailored map apps aiming at fulfilling specific tasks reduces the complexity and makes the overall prototype clearer, easier to understand and thus, more user-friendly.
- The task-oriented design metaphor is a suitable way for presenting a role-tailored map dashboard.
- All of the experts that were involved into the development and evaluation of the map dashboard prototype liked the “one-task-one-app” philosophy and having a tailored view on the information with regard to their specific needs.
Third, there are several conclusions concerning the experiences we had during the field observations and interviews:
- Data sharing, especially across organizations is a critical issue and companies are often not willing to share their information.
- Not everybody likes changes and new technologies, thus it is not easy to integrate a new system into a company. However, it takes a longer period of time to change working habitats and processes, as well as to integrate a new system (such as our role-tailored map dashboard) into a forest company.
- The role-tailored map dashboard approach can be successful only if all stakeholders insert the information needed and submit their updates regularly.
- Monitoring and tracking of devices, machines and processes is a critical topic. Nevertheless, the participating truck drivers had fewer problems with privacy issues than expected.
- Having the information in real-time is not as important as expected, because the people who were involved in the testing phase stated that they submitted their updates a few times per day (mostly in their offices or during short waiting times). Due to the fact, that the users use the map dashboard at different times, the information has to be of real-time nature to ensure that the information is up-to-date.
- Longer test periods involving different forest companies, as well as the involvement of more participants is needed to get generalizable and reliable results.
Last, three final conclusions about using the number of media disruptions for getting quantitative effects of a role-tailored map dashboard:
- The number of media disruption in the FbSC is a suitable measure for doing a now vs. then comparison to find out quantitative aspects of integrating a role-tailored map dashboard.
- A comprehensive study is needed involving all stakeholders to validate the presented findings.
- The reduction of the number of media disruption depends on the fact that all persons involved into the specific processes of the FbSC use the dashboard correctly. This means, if the people still make phone calls instead of inserting the information into the dashboard system, the number of reduced media disruptions would decrease accordingly.
Summarized, the combination of maps with forms for creating, reading, updating and deleting information from the client-side, linking and visualizing data that was not directly available before, as well as to share this information with those who are involved to foster transparency is the big added value of a role-tailored map dashboard. The idea is to put the users and their roles, as well as their daily working tasks in the foreground and to build the map dashboard around them. Do not try to improve people, but rather, their tools!
Author Contributions
The idea, research questions and conceptualization for this article was developed by C.A., J.S., B.V. and M.M. Major parts have been written by C.A., who also created the figures and tables, as well as the coordination between all the contributing authors. J.S. provided his knowledge about the processes in the FbSC and wrote the main parts of the introduction together with L.K. (Section 1), as well as did major parts of the literature review together with C.A. (Section 2). The conceptualization of the final map dashboard prototype was done by M.M. and C.A., the implementations and the field study were conducted by C.A. and B.V. (presented in Section 3 and Section 4). The interviews were evaluated from C.A. (Section 4.3 and Section 4.4.1). L.K. and B.V. gave advice about the article structure and all of the contributing authors did revisions on all sections. Major parts of the discussion and the conclusion have been written by C.A. and J.S. (Section 5 and Section 6).
Funding
This research was partly funded by the Seventh Framework Programme and co-funded by the European Union in the course of the EU FP7 FOCUS (Advances in FOrestry Control and aUtomation Systems in Europe) project.
Acknowledgments
In this section you can acknowledge any support given which is not covered by the author contribution or funding sections. This may include administrative and technical support, or donations in kind (e.g., materials used for experiments).
Conflicts of Interest
The authors declare no conflict of interest. The funders had no role in the design of the study; in the collection, analyses, or interpretation of data; in the writing of the manuscript, and in the decision to publish the results.
Appendix A
In this appendix, the questionnaire which was used for the structured interview is presented. The interview was conducted in German language and the questions were translated in English for this article only.
General information
- 1.
- Date
- 2.
- Gender
- 3.
- Age (optional)
- 4.
- Role/position within the company (e.g., truck driver, forester)
Tasks & area of responsibility
- 5.
- How long have you been working for [name of company]?
- 6.
- What are your typical tasks or activities on a working day?
- 7.
- For which of these tasks do you use one of our developed apps from the role-tailored map dashboard?
- 8.
- In general, which apps do you use most often?
- 9.
- If more than one app is used, which app do you use for which task?
Context & usage
- 10.
- Have you already gained experience with similar systems before using the developed role-tailored apps, or do you already have experience with web maps in general?
- 11.
- How do you like the idea of a role-tailored map dashboard consisting of different task-oriented apps as a common view for all the roles in your company? (rate from 1 “very good” to 5 “insufficient”)
- 11.1.
- In your opinion, how helpful is the entire dashboard with all the different apps? (rate from 1 “very good” to 5 “insufficient”)
- 12.
- Which of your tasks have changed through using the dashboard?
- 12.1.
- How were these tasks performed before (e.g., paper notes, PC)?
- 12.2.
- Did the different apps of the role-tailored map facilitate your tasks?
- 12.3.
- What is the major difference to before using the dashboard?
- 12.4.
- Is there now information that you did not have before?
- 12.5.
- Are you making decisions differently based on what you see in the apps (e.g., where to pick up the next woodpile)? Do the apps influence your decisions? If yes, which decisions?
- 12.6.
- Are you planning tasks differently than before using the dashboard?
- 13.
- Has the use of the dashboard apps made things easier for you in everyday working life?
- 13.1.
- If so, what is now better than before (please list some advantages that arise for you due to the use of the different dashboard apps)? What is the added value for you?
- 13.2.
- If not, has it become more complicated for you, or has anything become more difficult? And if so, what has become more difficult?
- 14.
- How long have you been using the dashboard at work (how long is the trial period for you)?
- 15.
- When or at what times within a working day do you use the apps (e.g., in between, just before breaks, just at the end of the day, immediately after the activity)?
- 15.1.
- How many times per day do you use which of the available apps?
- 15.2.
- How much time do you need per day for doing all the necessary entries?
- 15.3.
- Intuitively, do you gain time through the system or do you need more time than before?
- 16.
- Do you use the app rather to get information from the others (passive or consuming - read), or do you also insert information for the others (active filling - write)?
- 16.1.
- Which information is mainly important for you?
- 16.2.
- What are you looking up? Respectively, what information do you enter?
- 17.
- Does the current division into the different apps make sense for you? Are the apps well divided or would you rather prefer to have a different division?
- 18.
- Do you feel more surveilled than before? Do you have any concerns (e.g., privacy issues) when using the apps?
Complexity & satisfaction
- 19.
- Did you get any introduction on how to use the dashboard apps?
- 19.1.
- If yes, was this introduction necessary for you? Respectively, was this introduction enough to understand everything and to use the dashboard on your own?
- 19.2.
- If not, would you have needed an introduction?
- 20.
- In your opinion, is the overall use of the dashboard complicated and complex? Respectively, did you have any problems with the apps in the beginning? If yes, which problems?
- 20.1.
- How would you rate the complexity of using the apps? (rate from 1 “very easy to understand” to 5 “not easy at all”)
- 21.
- How satisfied are you with the overall role-tailored dashboard and its apps? (rate from 1 “very satisfied” to 5 “not satisfied at all”)
- 21.1.
- Until now, which problems occur during the use of the different dashboard apps (e.g., internet connection, GPS signal, size of items on mobile devices)?
- 22.
- Do you want to keep using the apps?
Functionality & design
- 23.
- How much do you like the tile design on the start page? (rate from 1 “very good” to 5 “insufficient”) (1–5)
- 23.1.
- How understandable is this start page? (rate from 1 “very good” to 5 “insufficient”)
- 23.2.
- Does this page help you to navigate to the different apps? (rate from 1 “very good” to 5 “insufficient”)
- 23.3.
- Do you always use the start page to get to the apps (or did you save the links to the apps directly in your web browser)?
- 24.
- How do you like the task-oriented approach ("one task one app")? (rate from 1 “very good” to 5 “insufficient”)
- 24.1.
- How intuitive is the system?
- 25.
- How well is the reality (your everyday working tasks) depicted with the different apps?
- 26.
- Which function do you use most frequently (e.g., make new entries, delete entries, edit entries or only "read" information)?
- 27.
- How well are the tasks implemented that can be performed by using the dashboard? (rate from 1 “very good” to 5 “insufficient”)
- 28.
- How well is the combination of the different tasks and information from you and your colleagues? (rate from 1 “very good” to 5 “insufficient”)
- 29.
- Do you like the combination of input forms and interactive maps showing all the entered information (or would you prefer to separate these two things)?
- 29.1.
- In several apps, there is a step-by-step guide in the menu, how do you like that? Do you think that’s good or helpful (especially in the beginning)?
- 30.
- Do you have all the information you need? Are you missing specific information in any of the apps (e.g., paths, points of interest)? Do you need additional data?
- 31.
- Do you prefer to use the street map or the satellite image as background map?
- 32.
- For editing entries, are you rather using the toolbar in the header (top right) or do you use the additional possibility to open the editing menu through the identify window?
- 33.
- How satisfied are you with the legend and the symbols used in the different mapping apps? (rate from 1 “very good” to 5 “insufficient”)
- 33.1.
- Are the chart symbols that show how much cubic meters of wood are available at each storage location meaningful and legible? Do you like the presentation of the woodpiles as dynamic charts?
- 34.
- Please rate the following elements (each from 1 “very good” to 5 “insufficient”):
- 34.1.
- The color scheme
- 34.2.
- The header
- 34.3.
- The icons within the toolbar (pencil for editing, recycle bin for deleting, etc.)
- 34.4.
- The division and arrangement of map and menu (layout)
- 34.5.
- The symbols within the map (charts, color of lines representing streets/paths, etc.)
- 34.6.
- The size of icons and buttons
- 35.
- In your opinion, how important is it to get the information in real-time?
- 35.1.
- Which information of your colleagues is the most important for you?
- 36.
- Finally, what do you like most about the role-tailored dashboard? Respectively, what is the most significant added value for you?
- 37.
- What do you dislike or what do you think is missing in the overall dashboard?
Appendix B
Table A1 shows a summary of the main qualitative statements of the field interviews with five experts of a big Austrian forest company. The different statements are ordered with regard to their topic, show if it is a pro or con and also the number of participants who mentioned similar comments. Several statements are rather assumptions and thoughts of the participants, because the two weeks test phase was too short to get proved results.

Table A1.
Summary of the main qualitative statements of the structured interview (cf. Appendix A).
Table A1.
Summary of the main qualitative statements of the structured interview (cf. Appendix A).
| Topic | Pro/con | Statement | Number of Participants |
|---|---|---|---|
| Transparency of processes and information | pro | Everybody who is involved into the FbSC has the same knowledge | 3 |
| pro | Better overview of material flows | 1 | |
| pro | If everybody makes updates, then the up-to-date information is a big advantage in contrast to the actual situation | 1 | |
| pro | Remove restricted site thinking | 1 | |
| pro | Foster flexibility | 2 | |
| pro | Better overview of all tasks and a common picture/view | 2 | |
| pro | Presumptive, so it would be easier to make specific decision | 1 | |
| pro | Short-term changes could be regarded easier (real impacts would be seen after a longer test phase only) | 1 | |
| Interoperability and data sharing | pro | Through sharing information with other truck drivers using a common system, it would be easier to outsource cost-intensive and broad freights | 1 |
| pro | Using a central database enables to create dynamic reports and enables to perform different kinds of analyses | 2 | |
| pro | Improved networking/crosslinking; facilitates to “look beyond one’s own nose” | 1 | |
| con | Movements could be tracked and some kinds of conclusions can be made (maybe, some people would feel to be more observed then before) | 2 | |
| con | A truck driver would not need this shared information, but believes that the benefit is rather for the foresters and site managers | 1 | |
| con | Data from other foresters/sites are not relevant, the benefit is rather for the truck drivers | 1 | |
| con | Internal data sharing is no problem, external data sharing could be critically | 2 | |
| pro | Several people would have more information than now | 1 | |
| con | If somebody does not want to share information, it is easily possible to enter no or wrong information | 1 | |
| Reduction of media disruption and complexity | pro | All persons involved in the FbSC know the exact locations of log pile storage places and figures of cubic meters (without having to call someone on the phone) | 1 |
| pro | Reduced complexity through having a central database and an easily usable/intuitive user interface | 3 | |
| pro | Specific tasks will get easier (e.g., navigation to the log pile storage places), because the drivers do not need additional descriptions by colleagues on the phone → map that shows log pile storages is a big advantage | 3 | |
| pro | Having standardized forms enables to harmonize the data and information (even within the company) | 1 | |
| Decrease resources (costs and time) | pro | The site manager believes that it is possible to save time through our approach over longer time period → if the map dashboard is updated and filled well, it would be possible to predict amounts and make conclusions about truck workloads and to create reports automatically | 1 |
| pro | Having up-to-date stock values on a centralized point (across the different sites) enhances the allocation of specific delivery notes → cost-intensive waiting times can be reduced and it is possible to drive to the production facility (customer) directly | 1 | |
| pro | The overall forest enterprise could benefit from this system | 1 | |
| pro | More efficient documentation of data | 1 | |
| pro | Raising efficiency of the workload could be possible | 2 | |
| pro | The map dashboard could be valuable for just-in-time planning | 1 | |
| con | Could not really recognize a facilitation, maybe it took a little bit more time per day for make the additional entries | 1 | |
| con | Until everybody is used to the new map dashboard, some additional time-efforts would be needed | 1 | |
| Willingness for further use and additional issues | pro | Want to further test and use the prototypical map dashboard (on condition that everybody takes part) | 3 |
| con | Would further use the map dashboard and make entries if others benefit | 1 | |
| pro | Long-term goal is to integrate this map dashboard completely in our daily life | 1 | |
| pro | Reality is good depicted in the system (extensive and realistic task handling) | 1 | |
| pro | There are further points that could be integrated and enhanced (further detailed information about special ranges of wood, further types of reports, additional estimation data, etc.) | 3 | |
| con | For a permanent integration, an offline solution would be needed→ because there are many areas without any mobile connection available | 5 | |
| pro | Want to develop an offline solution and further enhance the map dashboard in a continuing project | 3 | |
| con | Real-time data is not of very high importance, because the system would be used 1–3 times per day | 3 |
References
- Statistik Austria. Forstwirtschaftliche Gesamtrechnung (Fgr): Österreichergebnisse 2017. Available online: https://www.statistik.at/web_de/statistiken/wirtschaft/land_und_forstwirtschaft/gesamtrechnung/forstwirtschaftliche_gesamtrechnung/index.html (accessed on 30 October 2018).
- D’Amours, S.; Rönnqvist, M.; Weintraub, A. Using Operational Research for Supply Chain Planning in the Forest Products Industry. Inf. Syst. Oper. Res. 2008, 46, 265–281. [Google Scholar] [CrossRef]
- Rönnqvist, M.; D’Amours, S.; Weintraub, A.; Jofre, A.; Gunn, E.; Haight, R.G.; Martell, D.; Murray, A.T.; Romero, C. Operations Research Challenges in Forestry: 33 Open Problems. Ann. Oper. Res. 2015, 232, 14–40. [Google Scholar] [CrossRef]
- Rönnqvist, M. Optimization in Forestry. Math. Programm. 2003, 97, 267–284. [Google Scholar] [CrossRef]
- Scholz, J.; De Meyer, A.; Marques, A.S.; Pinho, T.M.; Boaventura-Cunha, J.; Van Orshoven, J.; Rosset, C.; Künzi, J.; Kaarle, J.; Nummila, K. Digital Technologies for Forest Supply Chain Optimization: Existing Solutions and Future Trends. Environ. Manag. 2018, 1–26. [Google Scholar] [CrossRef]
- Audy, J.F.; D’Amours, S.; Rönnqvist, M. Planning Methods and Decision Support Systems in Vehicle Routing Problems for Timber Transportation: A Review; Technical Report from the Interuniversity Research Centre on Enterprise Networks, Logistics and Transportation, CIRRELT-2012-38; CIRRELT: Montreal, QC, Canada, 2012. [Google Scholar]
- Beaudoin, D.; Frayret, J.M.; LeBel, L. Negotiation-Based Distributed Wood Procurement Planning within a Multi-Firm Environment. Forest Policy Econ. 2010, 12, 79–93. [Google Scholar] [CrossRef]
- Frisk, M.; Göthe-Lundgren, M.; Jörnsten, K.; Rönnqvist, M. Cost Allocation in Collaborative Forest Transportation. Eur. J. Oper. Res. 2010, 205, 448–458. [Google Scholar] [CrossRef]
- Lehoux, N.; D’Amours, S.; Frein, Y.; Langevin, A.; Penz, B. Collaboration for a Two-Echelon Supply Chain in the Pulp and Paper Industry: The Use of Incentives to Increase Profit. J. Oper. Res. Soc. 2011, 62, 581–592. [Google Scholar] [CrossRef]
- Carlsson, D.; Rönnqvist, M. Supply Chain Management in Forestry—Case Studies at Södra Cell AB. Eur. J. Oper. Res. 2005, 163, 589–616. [Google Scholar] [CrossRef]
- Hug, J. Optimierung von Geschäftsprozessen in der Forstwirtschaft durch den Einsatz von Informationstechnologie am Beispiel der Holzbereitstellung Auf Revierebene. Ph.D. Thesis, Albert-Ludwigs-Universität, Freiburg in Breisgau, Germany, 2004. [Google Scholar]
- Bravo, M.L.; Naim, M.M.; Potter, A. Key Issues of the Upstream Segment of Biofuels Supply Chain: A Qualitative Analysis. Logist. Res. 2012, 5, 21–31. [Google Scholar] [CrossRef]
- De Meyer, A.; Cattrysse, D.; Rasinmäki, J.; Van Orshoven, J. Methods to Optimise the Design and Management of Biomass-for-Bioenergy Supply Chains: A Review. Renew. Sustain. Energy Rev. 2014, 31, 657–670. [Google Scholar] [CrossRef]
- Wee, H.M.; Yang, W.H.; Chou, C.W.; Padilan, M.V. Renewable Energy Supply Chains, Performance, Application Barriers, and Strategies for Further Development. Renew. Sustain. Energy Rev. 2012, 16, 5451–5465. [Google Scholar] [CrossRef]
- Chauhan, S.S.; Frayret, J.M.; LeBel, L. Supply Network Planning in the Forest Supply Chain With Bucking Decisions Anticipation. Ann. Oper. Res. 2011, 190, 93–115. [Google Scholar] [CrossRef]
- Chauhan, S.S.; Frayret, J.M.; LeBel, L. Multi-Commodity Supply Network Planning in the Forest Supply Chain. Eur. J. Oper. Res. 2009, 196, 688–696. [Google Scholar] [CrossRef]
- Epstein, R.; Nieto, E.; Weintraub, A.; Chevalier, P.; Gabarró, J. A System for the Design of Short Term Harvesting Strategy1research Partially Supporte by Fondef under Project Fi-11.1. Eur. J. Oper. Res. 1999, 119, 427–439. [Google Scholar] [CrossRef]
- Murray, A.T.; Church, R.L. Heuristic Solution Approaches to Operational Forest Planning Problems. Oper.-Res.-Spektrum 1995, 17, 193–203. [Google Scholar] [CrossRef]
- Weintraub, A.; Epstein, R.; Morales, R.; Seron, J.; Traverso, P. A Truck Scheduling System Improves Efficiency in the Forest Industries. Interfaces 1996, 26, 1–12. [Google Scholar] [CrossRef]
- Andersson, G.; Flisberg, P.; Bertil, L.; Rönnqvist, M. RuttOpt—A Decision Support System for Routing of Logging Trucks. Can. J. For. Res. 2008, 38, 1784–1796. [Google Scholar] [CrossRef]
- Akhtari, S.; Sowlati, T.; Day, K. Optimal Flow of Regional Forest Biomass to a District Heating System. Int. J. Energy Res. 2014, 38, 954–964. [Google Scholar] [CrossRef]
- Beaudoin, D.; LeBel, L.; Frayret, J.M. Tactical Supply Chain Planning in the Forest Products Industry through Optimization and Scenario-Based Analysis. Can. J. For. Res. 2007, 37, 128–140. [Google Scholar] [CrossRef]
- Carlsson, D.; Rönnqvist, M. Backhauling in Forest Transportation: Models, Methods, and Practical Usage. Can. J. For. Res. 2007, 37, 2612–2623. [Google Scholar] [CrossRef]
- Scholz, J. Spatial Adaptive Large Neighborhood Search for Wood Supply Chain Optimization. Int. J. Appl. Geospatial Res. 2015, 6, 27–43. [Google Scholar] [CrossRef]
- Forsberg, M.; Frisk, M.; Rönnqvisty, M. Flowopt—A Decision Support Tool for Strategic and Tactical Transportation Planning in Forestry. Int. J. For. Eng. 2005, 16, 101–114. [Google Scholar] [CrossRef]
- Flisberg, P.; Frisk, M.; Rönnqvist, M. Fuelopt: A Decision Support System for Forest Fuel Logistics. J. Oper. Res. Soc. 2012, 63, 1600–1612. [Google Scholar] [CrossRef]
- Marques, A.F.; de Sousa, J.P.; Rönnqvist, M.; Jafe, R. Combining Optimization and Simulation Tools for Short-Term Planning of Forest Operations. Scand. J. For. Res. 2014, 29, 166–177. [Google Scholar] [CrossRef]
- Sarimveis, H.; Patrinos, P.; Tarantilis, C.D.; Kiranoudis, C.T. Dynamic Modeling and Control of Supply Chain Systems: A Review. Comput. Oper. Res. 2008, 35, 3530–3561. [Google Scholar] [CrossRef]
- Hai, L.T.; Hai, P.H.; Thai, C.L.; Hugé, J.; Ahenkan, A.; Quynh, L.X.; Hieu, V.V.; Le The Tung, N.; Hens, L. Software for Sustainability Assessment: A Case Study in Quang Tri Province, Vietnam. Environ. Model. Assess. 2011, 16, 541–550. [Google Scholar] [CrossRef]
- Wang, W.; Rivera, D.E.; Kempf, K.G. Model Predictive Control Strategies for Supply Chain Management in Semiconductor Manufacturing. Int. J. Prod. Econ. 2007, 107, 56–77. [Google Scholar] [CrossRef]
- Puigjaner, L.; Laínez, J.M. Capturing Dynamics in Integrated Supply Chain Management. Comput. Chem. Eng. 2008, 32, 2582–2605. [Google Scholar] [CrossRef]
- Papazoglou, M.P. Web Services: Principles and Technology; Prentice Hall: Edingburgh, UK, 2008; ISBN 978-0321155559. [Google Scholar]
- Weinberger, G.; Scholz, J. A Semantic Web Approach for the Forest-Based Supply Chain. Available online: https://agitposters2018.blogspot.com/2018/07/42-semantic-web-approach-for-forest.html (accessed on 1 November 2018).
- Bröring, A.; Echterhoff, J.; Jirka, S.; Simonis, I.; Everding, T.; Stasch, C.; Liang, S.; Lemmens, R. New Generation Sensor Web Enablement. Sensors 2011, 11, 2652–2699. [Google Scholar] [CrossRef]
- De la Beaujardiere, J. OpenGIS® Web Map Server Implementation Specification. Available online: https://portal.opengeospatial.org/files/?artifact_id=14416 (accessed on 30 December 2018).
- Botts, M.; Percivall, G.; Reed, C.; Davidson, J. OGC® Sensor Web Enablement: Overview and High Level Architecture. In Proceedings of the Geosensor Networks: Second International Conference (GSN 2006), Boston, MA, USA, 1–3 October 2006; Nittel, S., Labrinidis, A., Stefanidis, A., Eds.; Springer: Berlin, Germany, 2008; pp. 175–190. [Google Scholar]
- Von Schnetzler, M.J.; Lemm, R.; Bonfils, P.; Thees, O. The Supply Chain Operations Reference (Scor)-Model to Describe the Value-Added Chain in Forestry. Allg. Forst Jag. 2009, 180, 1–14. [Google Scholar]
- Arraiolos, A.; Vuillermoz, M.; Bigot, M. ICT Deployment Strategy in Aquitaine Wsc: The Explotic Breakthrough. In Proceedings of the 34th Council on Forest Engineering, Quebec City, QC, Canada, 12–15 June 2011; pp. 1–13. [Google Scholar]
- Azouzi, R.; D’Amours, S. Information and Knowledge Sharing in the Collaborative Design of Planning Systems within the Forest Products Industry: Survey, Framework and Roadmap. J. Sci. Technol. For. Prod. Process. 2011, 1, 6–14. [Google Scholar]
- Zhang, F.; Johnson, D.; Johnson, M.; Watkins, D.; Froese, R.; Wang, J. Decision Support System Integrating GIS with Simulation and Optimisation for a Biofuel Supply Chain. Renew. Energy 2016, 85, 740–748. [Google Scholar] [CrossRef]
- Jerbi, W.; Gaudreault, J.; D’Amours, S.; Nourelfath, M.; Lemieux, S.; Marier, P.; Bouchard, M. Optimization/Simulation-Based Framework for the Evaluation of Supply Chain Management Policies in the Forest Product Industry. In Proceedings of the 2012 IEEE International Conference on Systems, Man, and Cybernetics (SMC), Seoul, Korea, 14–17 October 2012; pp. 1742–1748. [Google Scholar]
- Marques, A.F.; Olmo, B.; Audy, J.F.; Rocha, P. A Comprehensive Framework for Developing Inter-Firm Collaboration—A Study in the Forest-Based Supply Chain. J. Sci. Technol. Forest Prod. Process. 2015, 5, 51–64. [Google Scholar]
- Mittlböck, M.; Atzl, C. Strategien für die Visualisierung und Kommunikation von raumzeitlichen Inhalten mit dynamischen Webkarten. AGIT J. Angew. Geoinf. 2015, 1, 566–571. [Google Scholar] [CrossRef]
- Kraak, M.J.; Ormeling, F. Cartography: Visualization of Spatial Data, 3rd ed.; The Guilford Press: New York, NY, USA, 2010; ISBN 978-1609181932. [Google Scholar]
- Field, K. Cartography; Esri Press: Redlands, CA, USA, 2018; ISBN 978-1589485020. [Google Scholar]
- Brewer, C.A. Designing Better Maps: A Guide for Gis Users, 2nd ed.; Esri Press: Redlands, CA, USA, 2016; ISBN 978-1589484405. [Google Scholar]
- Peterson, G.N. GIS Cartography: A Guide to Effective Map Design, 2nd ed.; CRC Press: Boca Raton, FL, USA, 2015; ISBN 978-1482220674. [Google Scholar]
- Krygier, J.; Wood, D. Making Maps—A Visual Guide to Map Design for GIS, 2nd ed.; The Guilford Press: New York, NY, USA, 2016; ISBN 978-1462509980. [Google Scholar]
- Tyner, J.A. Principles of Map Design; The Guilford Press: New York, NY, USA, 2010; ISBN 978-1-60623-544-7. [Google Scholar]
- Muehlenhaus, I. Web Cartography: Map Design for Interactive and Mobile Devices; CRC Press: Boca Raton, FL, USA, 2014; ISBN 978-1439876220. [Google Scholar]
- Rubin, E. Visuell Wahrgenommene Figuren; Glydendal: Copenhagen, Denmark, 1921. [Google Scholar]
- Wertheimer, M. Untersuchungen zur Lehre von der Gestalt II. Psychol. Forsch. 1923, 4, 301–350. [Google Scholar] [CrossRef]
- Traun, C. Wahrnehmungsorientierte Kartengestalung. In Online-Karten Im Fokus: Praxisorientierte Entwicklung und Umsetzung; Henning, S., Ed.; Wichmann: Berlin, Germany, 2015; pp. 71–86. ISBN 978-3-87907-589-8. [Google Scholar]
- Atzl, C. How to Design Web Maps That Users Like? In Online-Karten im Fokus: Praxisorientierte Entwicklung und Umsetzung; Henning, S., Ed.; Wichmann: Berlin, Germany, 2015; pp. 33–51. ISBN 978-3-87907-589-8. [Google Scholar]
- Moser, C. User Experience Design—Mit Erlebnisorientierter Softwareentwicklung zu Produkten, die Begeistern; Springer: Berlin, Germany, 2012; ISBN 978-3-642-13362-6. [Google Scholar]
- Beyer, H.; Holtzblatt, K. Contextual Design: Defining Customer-Centered Systems; Academic Press: San Francisco, CA, USA, 1998. [Google Scholar]
- Bhide, M.; Deolasee, P.; Katkar, A.; Panchbudhe, A.; Ramamritham, K.; Shenoy, P. Adaptive Push-Pull: Disseminating Dynamic Web Data. IEEE Trans. Comput. 2002, 51, 652–668. [Google Scholar] [CrossRef]
- Saffer, D. Designing for Interaction—Creating Innovative Applications and Devices, 2nd ed.; New Riders: Berkeley, CA, USA, 2010; ISBN 978-0321643391. [Google Scholar]
- Jokela, T.; Iivari, N.; Matero, J.; Karukka, M. The Standard of User-Centered Design and the Standard Definition of Usability: Analyzing Iso 13407 against Iso 9241-11. In Proceedings of the Latin American Conference on Human-Computer Interaction, Rio de Janeiro, Brazil, 17–20 August 2003; pp. 53–60. [Google Scholar]
- Scholz, J.; Mittlböck, M. Spatio-Temporal Visualization of Simulation Results Using a Task-Oriented Tile-Based Design-Metaphor. In Service Oriented Mapping 2012; Jobst, M., Ed.; Jobstmedia Management Verlag: Wien, Austria, 2012; pp. 369–382. ISBN 3-9502039-2-3. [Google Scholar]
- Mittlböck, M.; Morper-Busch, L.; Atzl, C.; Klug, H. Task-Orientierte Web-Maps zur zompakten Visualisierung kartographischer Inhalte. In Angewandte Geoinformatik 2012; Strobl, J., Blachke, T., Griesebner, G., Eds.; Herbert Wichmann Verlag: Berlin/Offenbach, Germany, 2012; ISBN 978-3-87907-520-1. [Google Scholar]
- Pal, P. How Card-Based Design Is Changing Web & Mobile Ui Designing? Available online: https://think360studio.com/how-card-based-design-is-changing-web-mobile-ui-design/ (accessed on 2 November 2018).
- Rouse, M. Ansi/Isa-95. Available online: https://searcherp.techtarget.com/definition/ANSI-ISA-95 (accessed on 2 November 2018).
- Atos. The Convergence of It and Operational Technology. Available online: https://atos.net/content/dam/global/ascent-whitepapers/ascent-whitepaper-the-convergence-of-it-and-operational-technology.pdf (accessed on 3 November 2012).
- Atzl, C.; Vockner, B.; Mittlböck, M. Online-Visualization of Streaming Data. GI-Forum 2016—Geospatial Innov. Soc. 2016, 1, 57–66. [Google Scholar] [CrossRef]
- Šafařík, D.; Hlaváčková, P. Losses in the Amount of Produced and Sold Timber. Procedia Econ. Financ. 2015, 34, 51–57. [Google Scholar] [CrossRef]
- Rosset, C.; Scholz, J.; Boaventura-Cunha, J.; Pinho, T.M.; Rasinmäki, J.; Marques, A. Planning and Control of Forest-Based Supply Chains Utilizing an Integrated Model-Based Approach with Focus on Forest Ecosystem Management. In Proceedings of the 16th Symposium for Systems Analysis in Forest Resources (SSAFR 2015), Uppsala, Sweden, 26–28 May 2015; p. 31. [Google Scholar]
© 2019 by the authors. Licensee MDPI, Basel, Switzerland. This article is an open access article distributed under the terms and conditions of the Creative Commons Attribution (CC BY) license (http://creativecommons.org/licenses/by/4.0/).