Article

Spatial-Temporal Analysis of Human Dynamics on Urban Land Use Patterns Using Social Media Data by Gender

1
State Key Laboratory of Resources and Environmental Information System, Institute of Geographic Sciences and Natural Resources Research, Chinese Academy of Sciences, Beijing 100101, China
2
University of Chinese Academy of Sciences, Beijing 100049, China
3
School of Geography and Tourism, Shaanxi Normal University, Xi’an 710119, China
*
Author to whom correspondence should be addressed.
ISPRS Int. J. Geo-Inf. 2018, 7(9), 358; https://doi.org/10.3390/ijgi7090358
Submission received: 15 June 2018 / Revised: 25 August 2018 / Accepted: 27 August 2018 / Published: 29 August 2018
(This article belongs to the Special Issue Human-Centric Data Science for Urban Studies)

Abstract

:
The relationship between urban human dynamics and land use types has always been an important issue in the study of urban problems in China. This paper used location data from Sina Location Microblog (commonly known as Weibo) users to study the human dynamics of the spatial-temporal characteristics of gender differences in Beijing’s Olympic Village in June 2014. We applied mathematical statistics and Local Moran’s I to analyze the spatial-temporal distribution of Sina Microblog users in 100 m × 100 m grids and land use patterns. The female users outnumbered male users, and the sex ratio ( S R varied under different land use types at different times. Female users outnumbered male users regarding residential land and public green land, but male users outnumbered female users regarding workplace, especially on weekends, as the S R on weekends ( S R was 120.5) was greater than that on weekdays ( S R was 118.8). After a Local Moran’s I analysis, we found that High–High grids are primarily distributed across education and scientific research land and residential land; these grids and their surrounding grids have more female users than male users. Low–Low grids are mainly distributed across sports centers and workplaces on weekdays; these grids and their surrounding grids have fewer female users than male users. The average number of users on Saturday was the highest value and, on weekends, the number of female and male users both increased in commercial land, but male users were more active than female users ( S R was 110).

1. Introduction

The relationship between human dynamics in urban areas and land use types has always served as one of the foundations for the study of geography [1]. Currently, with the rapid development of urbanization in China, the conflicts between rapid urban population growth and land use have become increasingly prominent. A traditional census cannot reflect the spatial distribution of humans in urban areas in real time because of the related statistical cycles and units. Therefore, knowing how to obtain an accurate picture of the dynamics of population distribution data is currently a problem. In recent years, with the development of social networks and communication technology and the popularization of mobile intelligent terminals, each individual user plays the role of a sensor, which allows an increasing amount of User-Generated Content (UGC) data (e.g., social media data) to be made available, including Volunteer Geographical Information (VGI) [2,3,4]. This urban big data brings content and methodological innovation to the study of the spatial-temporal behavior of people in urban areas. Many researchers have obtained the geographical location information of users from bus smart cards, taxi Global Positioning System (GPS) trajectory data, the GPS interface of smart phones, and internet application data, allowing them to study the behavior of users. Among these studies, researchers have focused on analyzing each user’s trajectory and hotspot clustering to identify the main urban functional areas. Combining bus smart card data with travel surveys of urban inhabitants and land use maps at the block level allows researchers to identify the bus cardholders’ places of residence, workplaces, and commuting habits; as a result, urban functional zones and traffic flow directions can be analyzed [5,6,7]. In addition to public transportation, taxi GPS trajectory data in cities have become an important aspect related to the careful management of urban planning. The results show that the effects of different urban facilities on taxi passengers have different laws of distribution and driving mechanisms [8]. Urban land use types could be identified by the points at which taxis pick up and off-load passengers by combining these data with the improved Density-Based Spatial Clustering of Applications with Noise (DBSCAN) model [9]. The spatial-temporal distribution of employment density in Singapore was calculated based on an optimization model for total walking time, which was built by analyzing public transportation smart card data, travel surveys, and building information [10]. By collecting the sequence of an individual’s GPS data from smart phones and taking into account a user’s sequential visits to locations, scholars built a personalized location recommendation system using the location collection and presented a life pattern normal form to define individual life patterns [11,12]. In addition to these data types, social media data have provided another data source for studying the dynamics of population distribution. Some researchers have employed the hotspot clustering method for exploratory spatial analysis by using location check-in data and choosing business factors for geographical distribution measurements to obtain business district information [13,14,15,16]. Other researchers have applied geo-tagged posts of an urban area from Twitter and cloud computing to mine popular travel routes and trajectory patterns [17,18].
Gustave Le Bon believed that the crowd is ‘an aggregation of people’, and this aggregation pattern has characteristics that are not found in a single individual [19]. Sina Microblog is one of the mainstream social media platforms in China and, according to the 2014 Sina Microblog User Development Report officially published by Sina Microblog, more than 50 million users actively use Sina Microblog every day. For this reason, current research studies on Sina Microblog data have mostly focused on the crowd behavior of network users and their relationships [20,21]. In addition to the characteristics of crowd behavior in virtual networks, Sina Microblog users also have spatial-temporal distribution characteristics in real life. Sina Location Microblog contains geographic location information, and each user’s location is automatically obtained and uploaded by the users’ mobile devices when the users post microblogs; this occurs without the active participation of the users and is different from microblog check-in data. This type of spatial location information usually objectively represents the geographical spatial activity characteristics of the users.
Therefore, in this paper, we obtained Sina Location Microblog data and analyzed the spatial-temporal distribution characteristics of users according to sex cohorts in the research area, as well as the coupling relationship between the spatial-temporal distribution characteristics of users according to sex cohorts and different land use types. In Section 2, we describe the data and methods. After the statistical results and local clusters of the grids in the study area are described in Section 3.1, we further analyze the spatial-temporal distribution of users according to sex cohorts via land use patterns in Section 3.2. Finally, a discussion is presented and conclusions are drawn in Section 4.

2. Materials and Methods
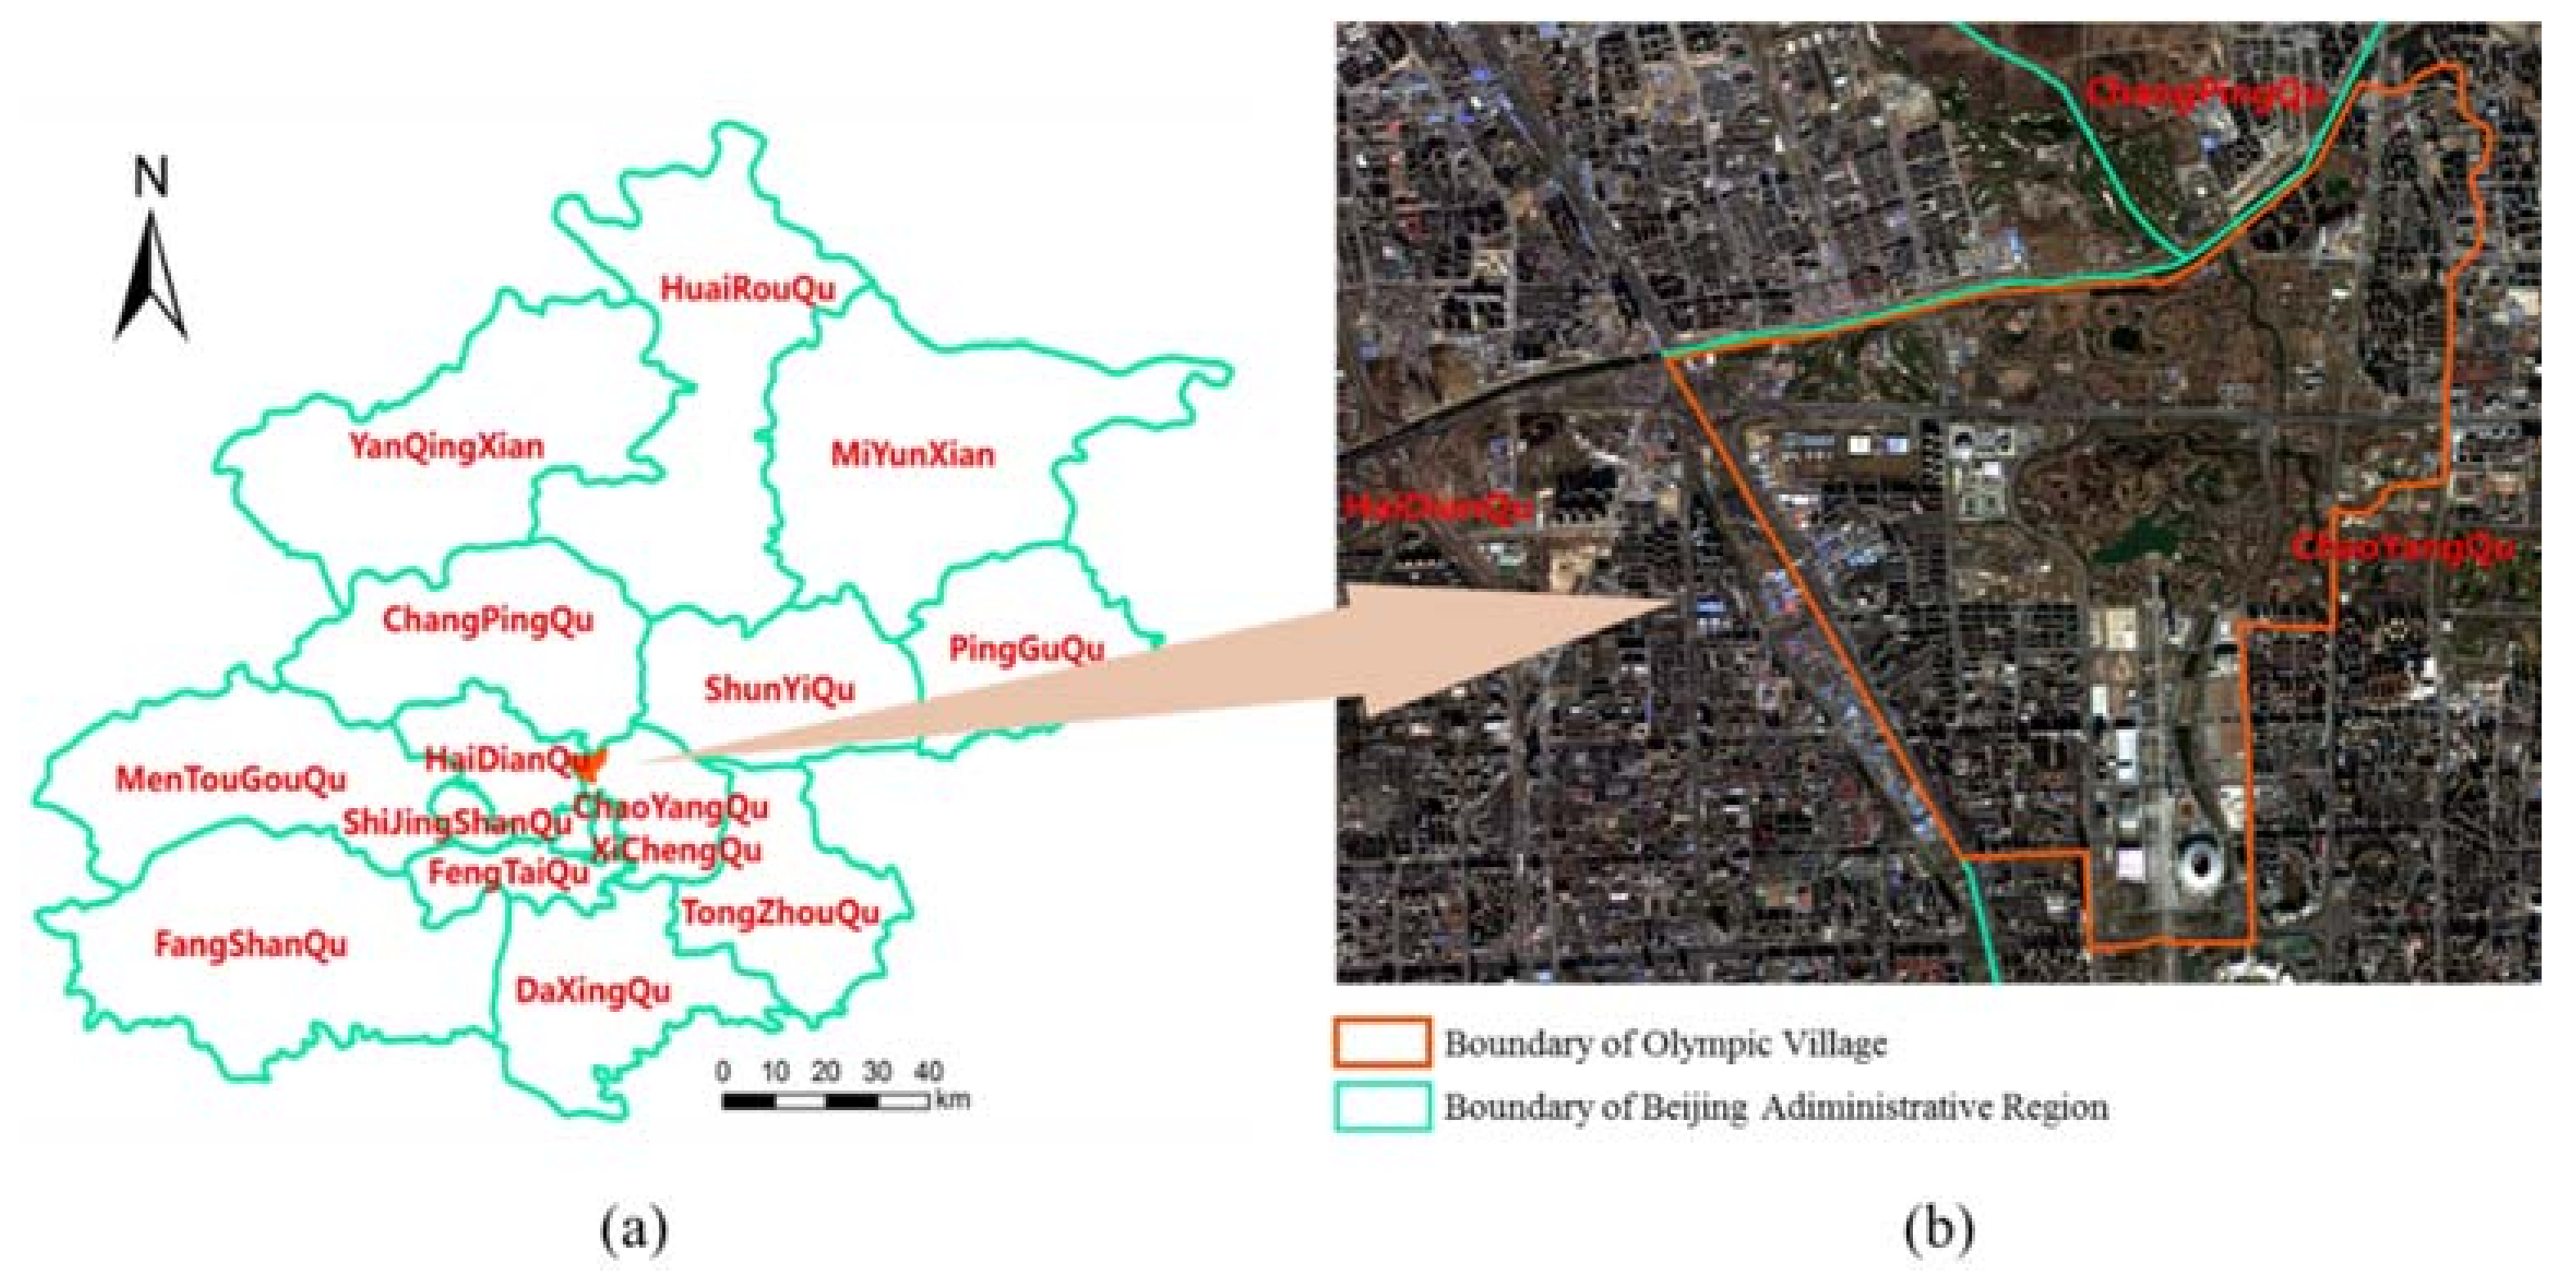
2.1. Overview

The study area, a square 8 km × 8 km area around Olympic Village, is a typical case study area in Beijing, China. The Olympic Village area lies in the northwestern part of Chaoyang District in Beijing (Figure 1), covers 18.8 km2, and includes 12 neighborhood communities and 1400 business locations. The 100,000 residents in the Olympic Village area live in 62,000 households [22]. The Olympic Village area has various land use types, including residential, retail commercial, education and scientific research workplaces, as well as sports, cultural, and public green spaces.

2.2. Data Collection

Sina Location Microblog data was obtained using the Sina Microblog application programming interface (http://open.weibo.com/wiki/2/users/domain_show) and Web crawler technology in June 2014. After removing duplicate and invalid data, we obtained more than 97,000 location microblog records including data from 56,000 microblog users, of which 56% were registered as female. Each microblog record contained a user ID, microblog ID, microblog created date and time, the geographic coordinates of the microblogging location, and the user’s gender. Because of the substantial amount of information, the PostgreSQL database was employed to store and manage these data. The remote sensing imagery of resources satellite three (ZY-3) of the study area, China’s first autonomous civilian high-resolution stereo mapping satellite, with a spatial resolution of 2.1 m, was used to extract land use types.

2.3. Methods

2.3.1. Skewness and Kurtosis

Skewness is a measure of the asymmetry of the probability distribution of a real-valued random variable about its mean. The skewness value can be positive or negative. Kurtosis represents the level of the peak of the probability density distribution curve at the average value.
The skewness of a random variable, X , is the third standardized moment φ 3 , as defined by Equation (1):
φ 3 = E [ ( X μ   σ ) 3 ] = μ 3 σ 3 = E [ ( X μ ) 3 ] { E [ ( X μ ) 2 ] } 3 / 2 = k 3 k 2 3 / 2
where μ represents the mean, σ represents the standard deviation, E represents the expectation operator, μ 3 represents the third central moment, and k t represents the tth cumulant. Skewness can be expressed in terms of the noncentral moment E [ X 3 ] by expanding Equation (2):
φ 3 = E [ ( X μ   σ ) 3 ] = E [ X 3 ] 3 μ E [ X 2 ] + 3 μ 2 E [ X ] μ 3 σ 3 = E [ X 3 ] 3 μ ( E [ X 2 ] μ E [ X ] ) μ 3 σ 3 = E [ X 3 ] 3 μ σ 2 μ 3 σ 3
If φ 3 > 0 , the mass of the distribution is concentrated on the left of the figure, and the right tail is longer. The distribution is said to be right-skewed or to have a positive skew. If φ 3 < 0 , the mass of the distribution is concentrated on the right of the figure, and the left tail is longer. The distribution is said to be left-skewed or to have a negative skew.
The kurtosis is the fourth standardized moment, as defined by Equation (3):
  φ 4 = E [ ( X μ   σ ) 4 ] = μ 4 σ 4 = E [ ( X μ ) 4 ] { E [ ( X μ ) 2 ] } 2
where μ 4 represents the fourth central moment. If φ 4 > 0 , the distribution is called leptokurtic; if φ 4 < 0 , the distribution is called platykurtic.
In this paper, we calculated the skewness and kurtosis of the number of Sina Location Microblog users using SPSS version 22.0.

2.3.2. Spatial-Temporal Aggregation Granularity

Aggregation granularity represents the level of data refinement or synthesis in a data unit of a data warehouse. The higher the degree of data refinement is, the smaller the level of granularity. By transferring this concept into geography, spatial-temporal aggregation granularity is produced (specifically, the concept of spatial-temporal quantization).
(1) Spatial aggregation granularity
The spatial aggregation granularity of this study was represented using regular grids and irregular polygon zones. A grid transformation of population data can express the spatial distribution and differentiation laws of the population on the regional units. A study in Shenzhen used a 1-km spatial resolution for the grid transformation of a dynamic population monitoring system, which provided more accurate urban population density information and allowed researchers to analyze the dynamic characteristics of a fine grid of the Shenzhen population [23]. In addition, scholars applied a 250 m and 0.001° spatial resolution for the grid transformation of population data and Sina check-in microblog data to give the data spatial continuity and proximity [24,25,26]. Hence, according to the scale of the study zone, the study zone was divided into regular grids of 100 m × 100 m (Figure 2). We conducted a spatial statistical analysis of the data while using 100 m × 100 m grids to analyze the spatial distribution of Sina users [27].
We analyzed the remote sensing imagery to extract several sample polygon zones, which were classified into the following four land use types: (A) education and scientific research, (B) commercial land, (C) public green space, and (D) residential. Sample zones contained the grids with the highest numbers of users and clustering patterns based on the results of statistical analysis and Local Moran’s I.
(2) Temporal aggregation granularity
We applied both the total and average numbers of the different types of temporal aggregation granularity to describe the users’ behavior; these statistical indicators were calculated using Equations (4)–(10):
The total number of users in each grid was calculated using Equation (4):
  S U M i = N i , j
where i represents the grid ID and j represents the date. S U M i represents the total number of users in grid i during a month, and N i , j represents the number of users in grid i on date j. In this paper, j = 1, 2, …, 30.
The sex ratio of users was calculated using Equation (5):
S R i = M i   F i × 100
where S R i represents the sex ratio of users in grid i, M i represents the number of male users in grid i, and F i represents the number of female users in grid i. If S R i > 100 , then male users outnumber female users; a higher value of S R i indicates a greater number of male users. If S R i < 100 , then female users outnumber male users; a lower value of S R i indicates a greater number of female users. If S R i = 100 , then an equal number of female and male users is present.
The total number of users for each grid on weekdays and weekends were calculated using Equations (6) and (7), respectively:
  S U M w e e k d a y ( i ) = N i , n
  S U M w e e k e n d ( i ) = N i , m
where S U M w e e k d a y ( i ) and S U M w e e k e n d ( i ) represent the total number of users in grid i on weekdays and weekends, respectively, and i represents the grid ID. N i , n represents the number of users in grid i on date n, where n represents the date of the weekday; N i , m represents the number of users in grid i on date m, where m represents the date of the weekend.
The average numbers of users active on weekdays and weekends were calculated using Equations (8) and (9), respectively:
A V G w e e k d a y ( i ) = S U M w e e k d a y ( i ) D w e e k d a y
A V G w e e k e n d ( i ) = S U M w e e k e n d ( i ) D w e e k e n d
where S U M w e e k d a y ( i ) and S U M w e e k e n d ( i ) represent the total number of users in grid i on weekdays and weekends, respectively; A V G w e e k d a y ( i ) and A V G w e e k e n d ( i ) represent the average number of users in grid i on weekdays and weekends, respectively; D w e e k d a y and D w e e k e n d represent the total number of weekdays and weekends, respectively; and, in this paper, D w e e k d a y = 21 and D w e e k e n d = 9 . i represents the grid ID.
The average numbers of users on a particular day during the week for the different land use types were calculated using Equation (10):
A V G k , p = S U M k , p D k
where S U M k , p represents the total number of users on day k for land use pattern p ; A V G k , p represents the average number of users on day k for land use pattern p ; k represents a day during the week, including Monday, Tuesday, Wednesday, Thursday, Friday, Saturday, and Sunday; p represents the land use pattern, including education and scientific research land, commercial land, public green space land, and residential land.
In this study, the temporal granularity of the data was classified in three ways: the 30 individual days of the study; the weekdays, including Mondays, Tuesdays, Wednesdays, Thursdays, and Fridays (21 days in total); and the weekends, including Saturdays and Sundays (nine days in total).

2.3.3. Local Moran’s I

Spatial autocorrelation is a measure of the degree of numerical clustering in a spatial region and includes both global and local spatial autocorrelations. By using local spatial autocorrelation, the spatial clustering of elements with high or low values within the region of interest can be identified as well as spatial outliers.
The Local Moran’s I statistic of spatial association is given by Equation (11):
I i = x i X ¯ , S i 2 j = 1 , j 1 n w i , j ( x j X ¯ )
where x i represents an attribute for feature i, X ¯ represents the mean of the corresponding attribute, and w i , j represents the spatial weight between features i and j:
S i 2 = j = 1 , j i , n ( x j X ¯ ) 2 n 1 X ¯ 2
where n represents the total number of features.
We chose the difference between SUMweekday(i) and SUMweekend(i), the difference between the number of female users and male users on weekdays, and the difference between the number of female users and male users on weekends as the three local indicators of spatial association index cluster patterns.

3. Results

3.1. Analysis of the Intensity of User Activity

3.1.1. Statistical Analysis

(1)
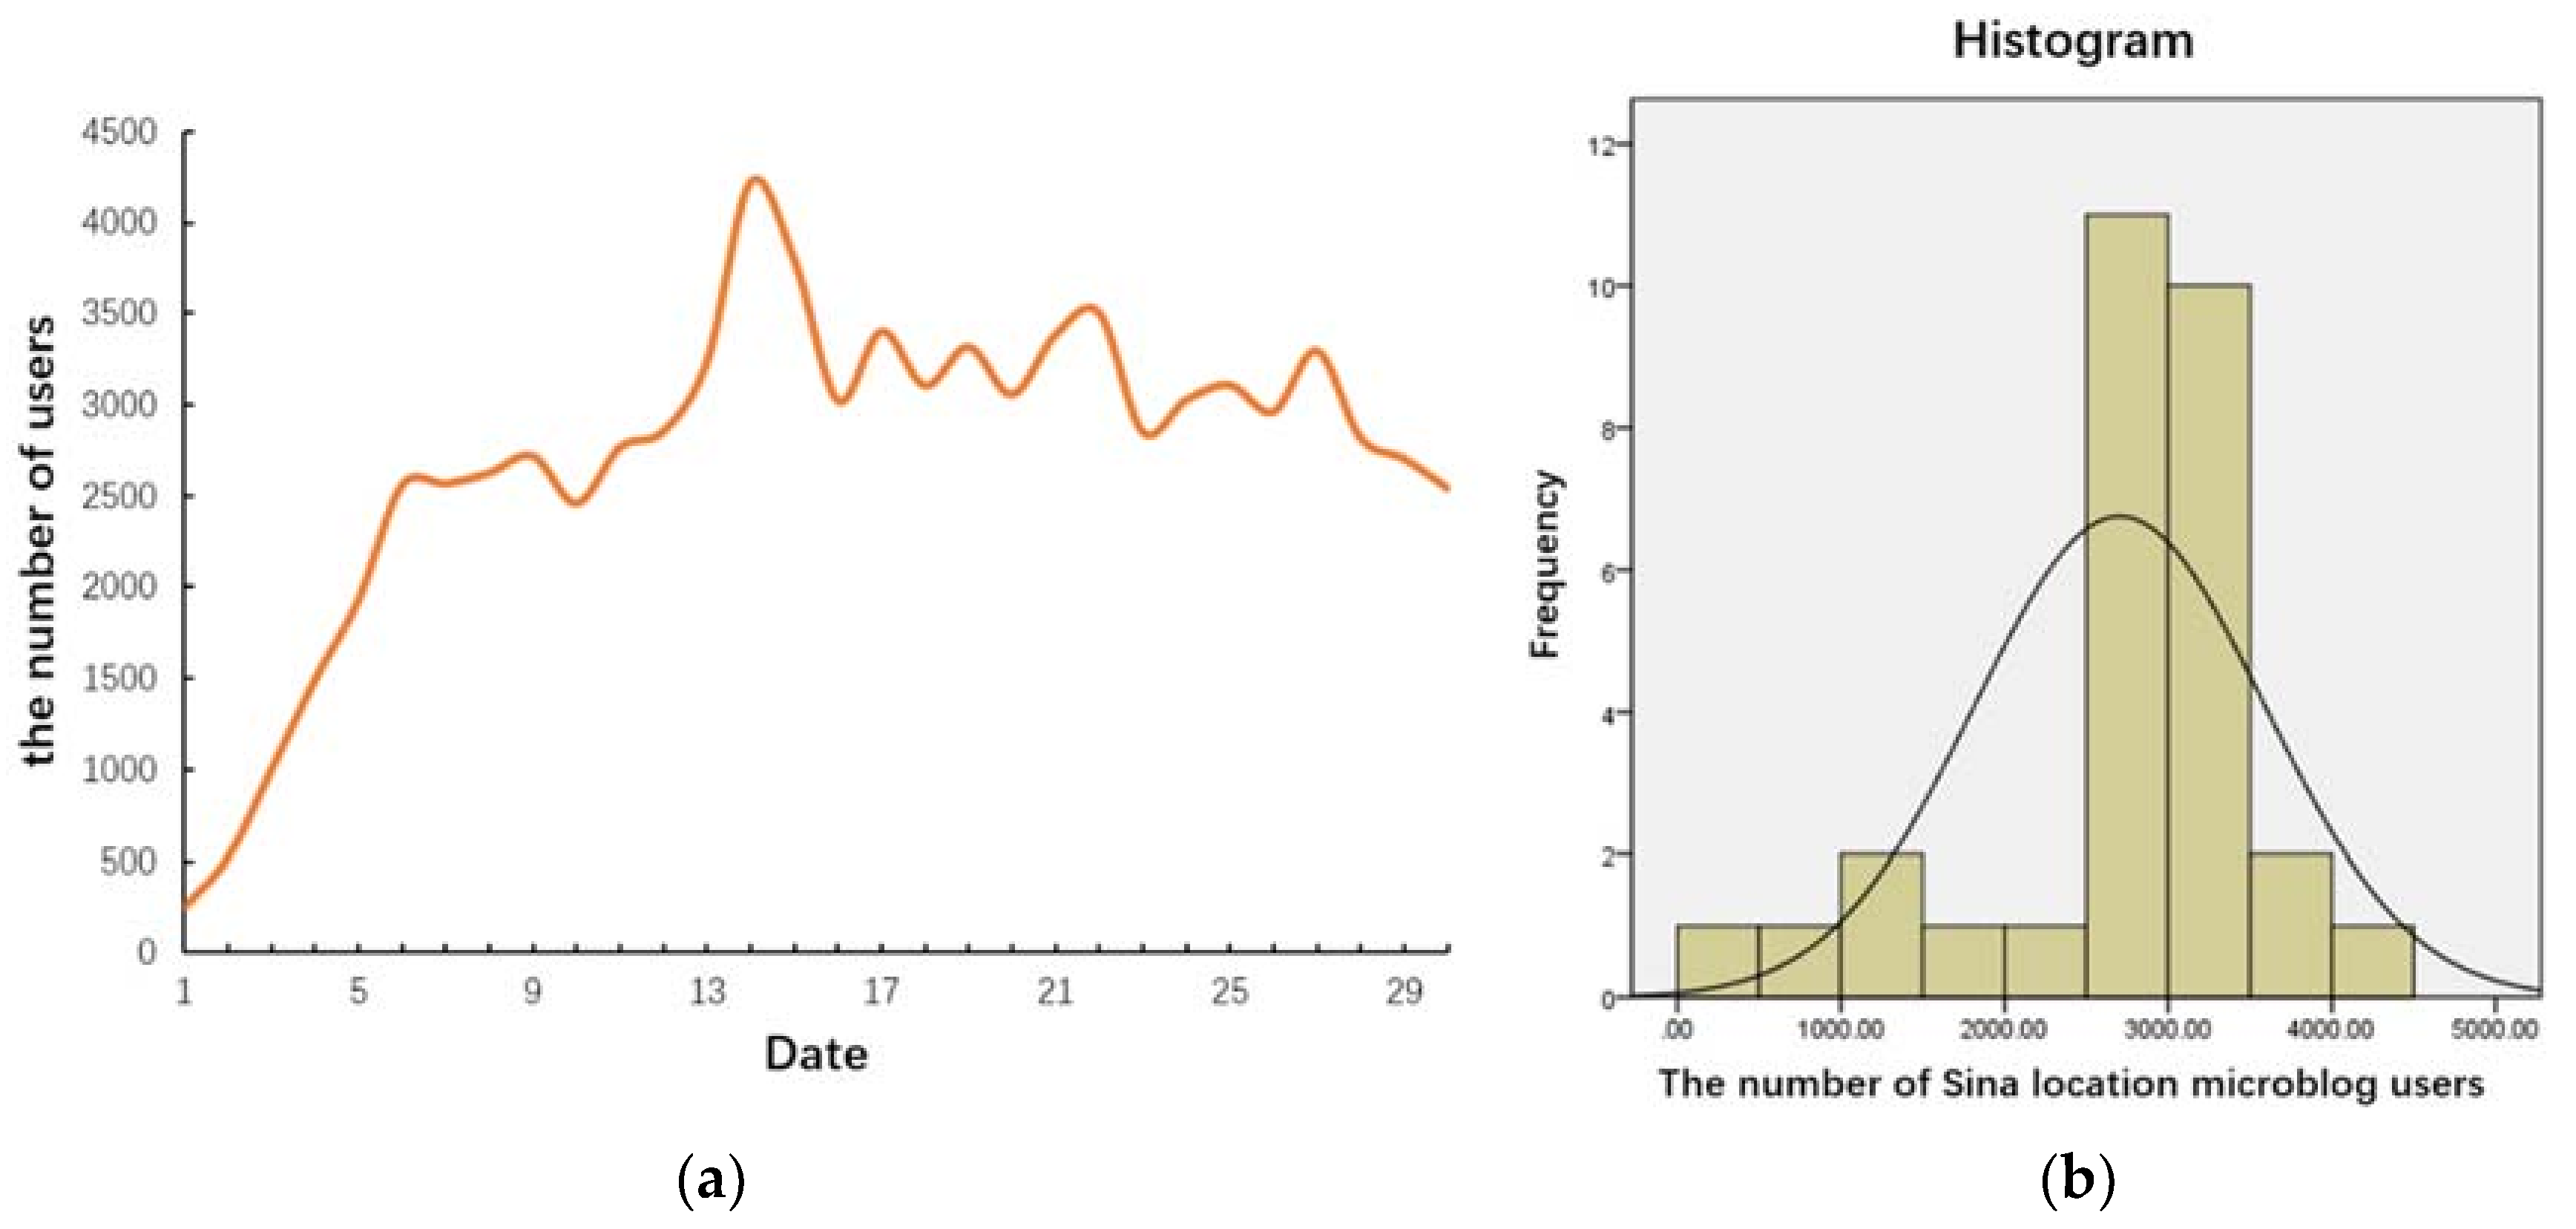
We utilized SPSS version 22.0 to calculate the descriptive statistics and the histogram of the number of users during the month. Of the total of 56,000 microblog users, 56% were registered as female, which means the sex ratio ( S R ) was 78.6. As shown in Table 1 and Figure 3a, the maximum number of users was 4225 on 14 June, and the minimum was 248 on 1 June. The skewness was −1.355, which was less than 0, indicating that the mass of the distribution was concentrated on the right of Figure 3b and the left tail was longer. Therefore, the distribution was left-skewed. The kurtosis was 2.03, which was greater than 0, indicating that the distribution was leptokurtic.
(2)
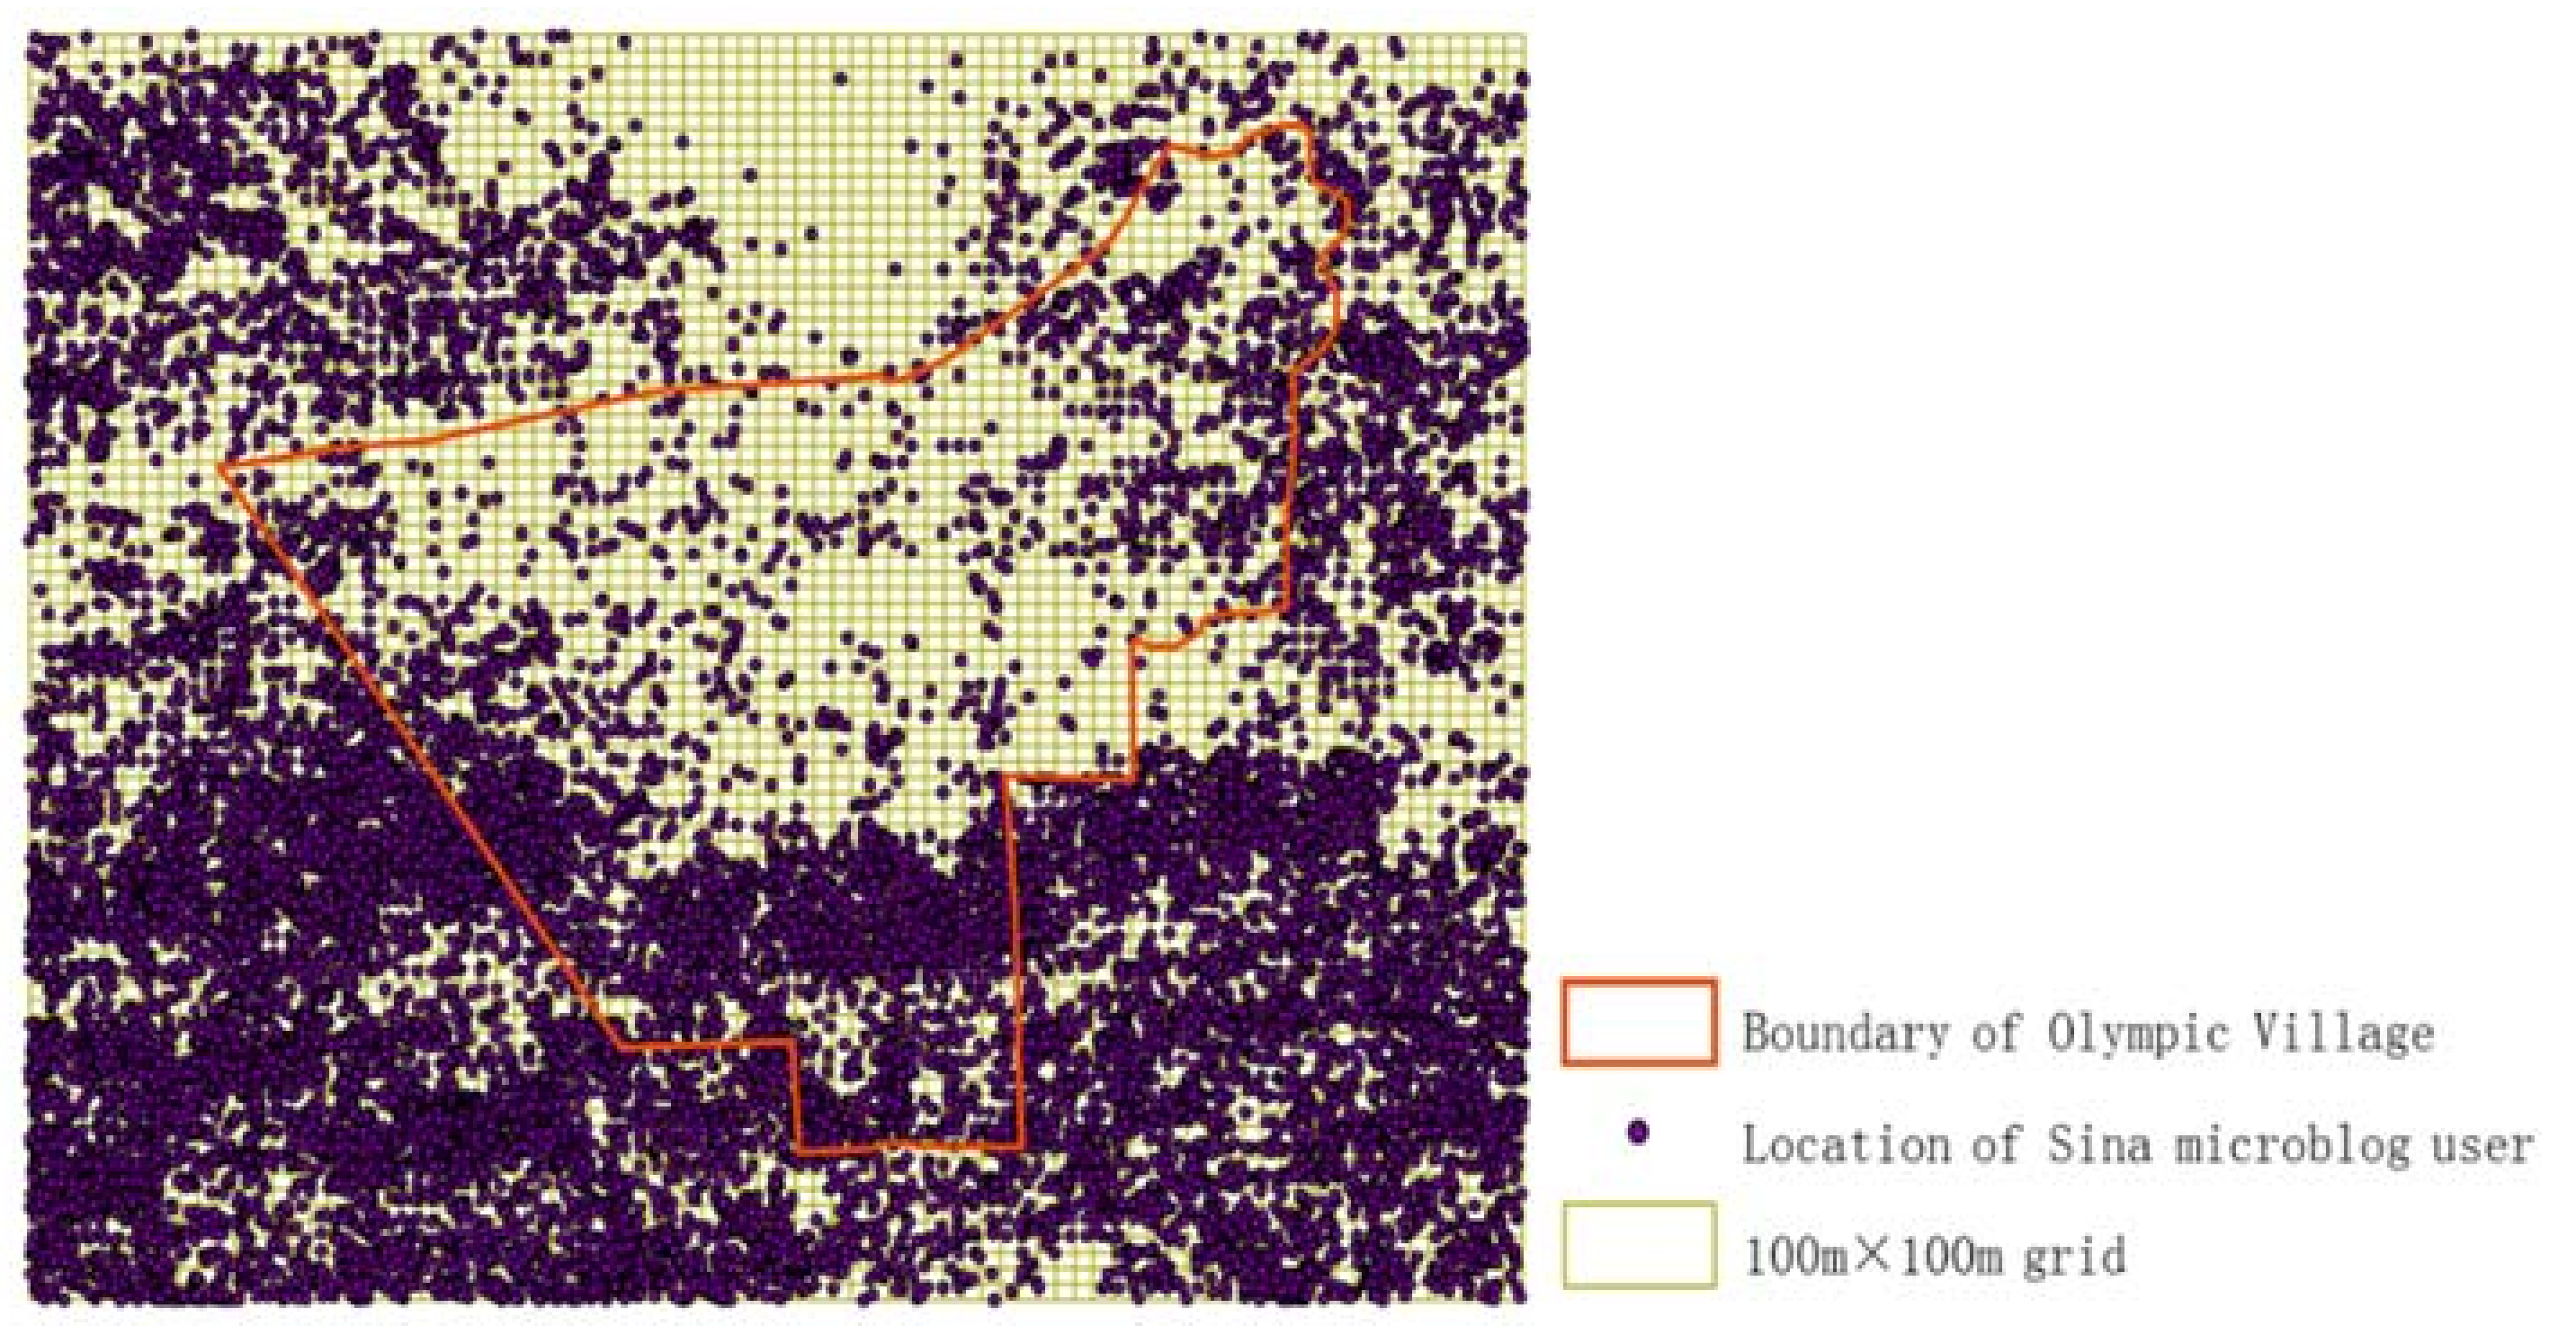
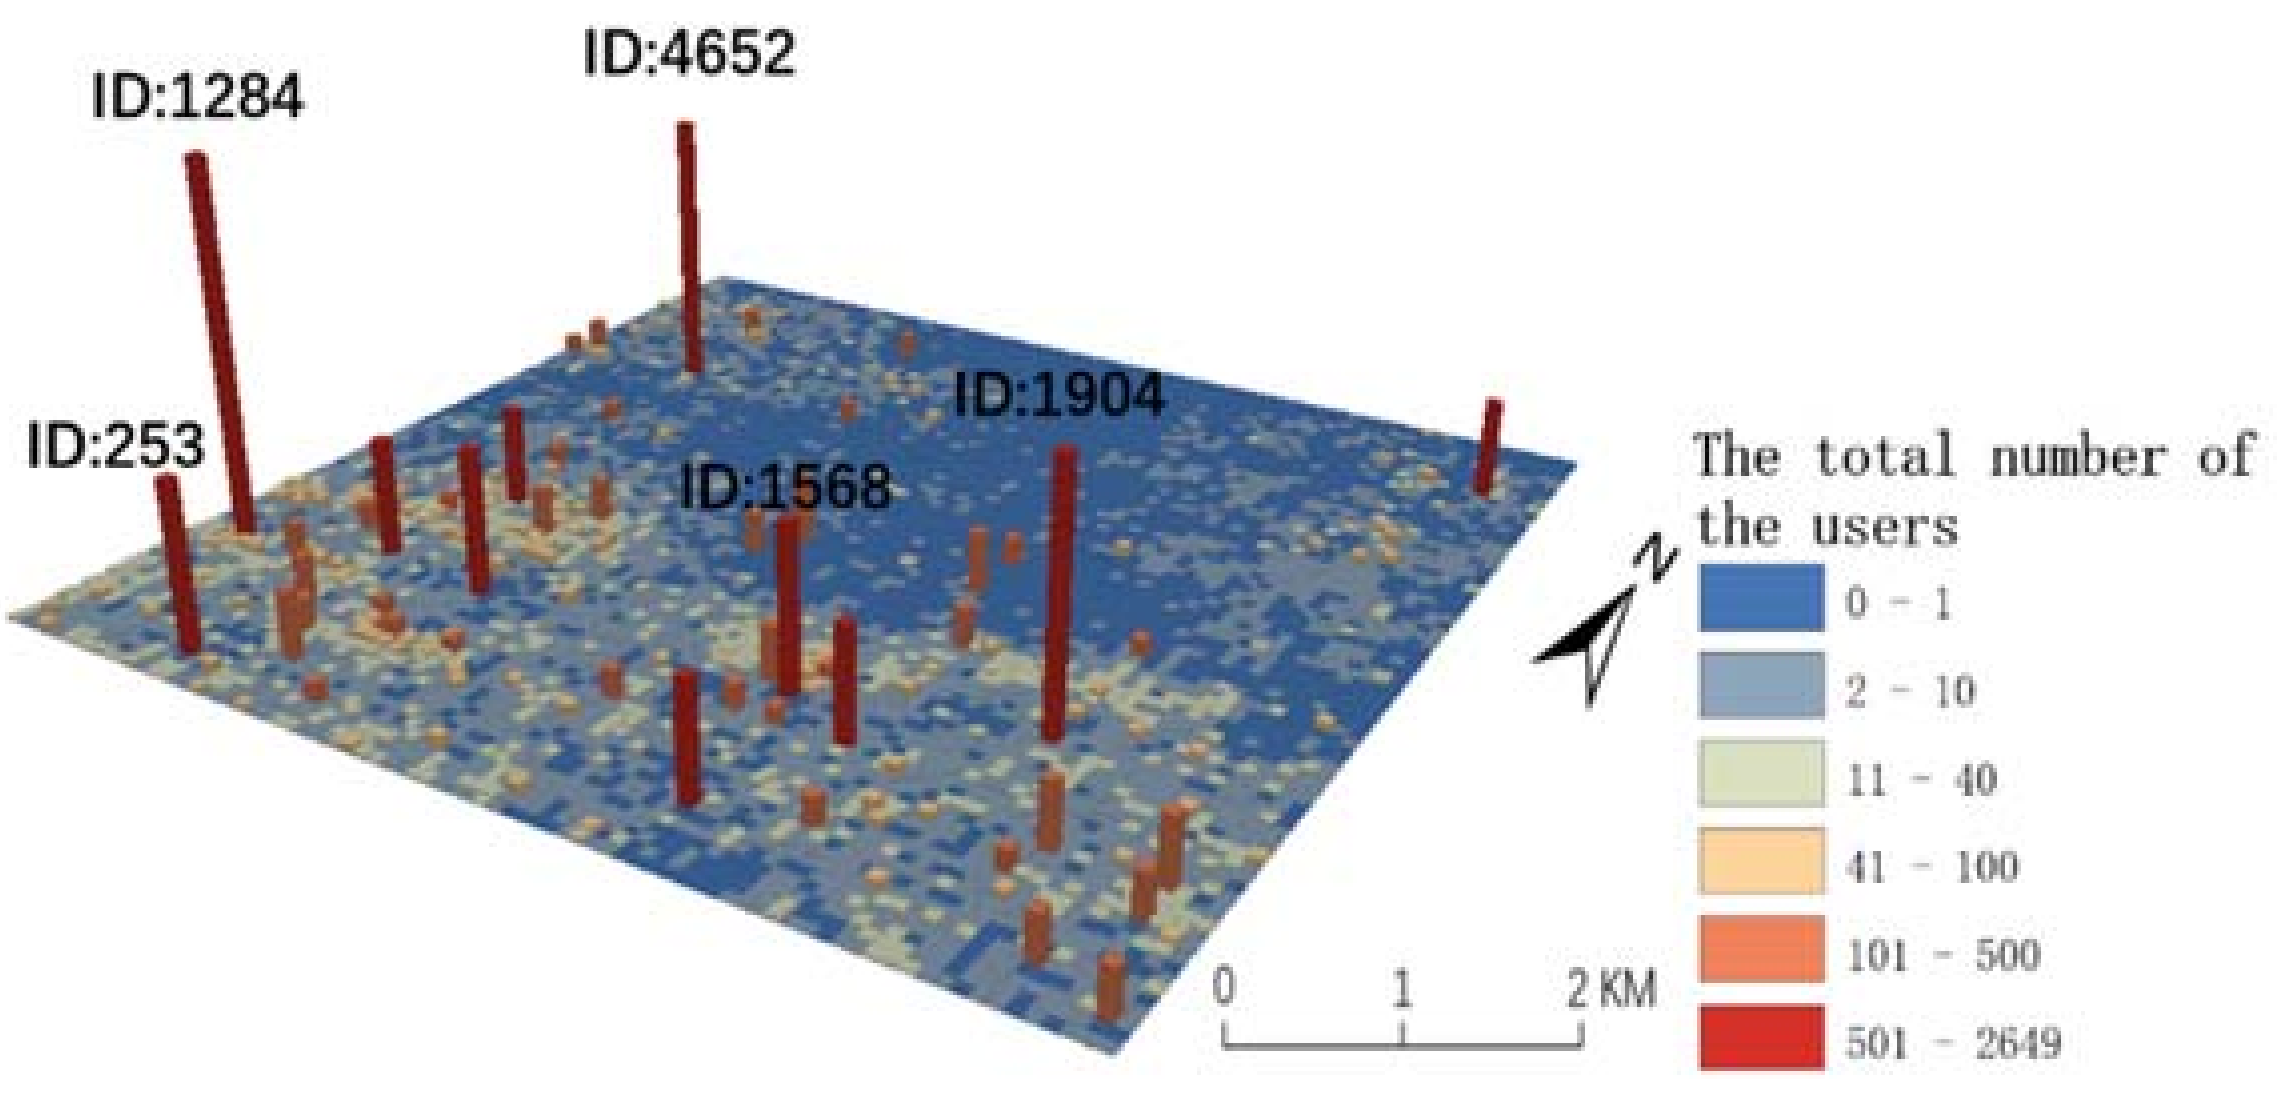
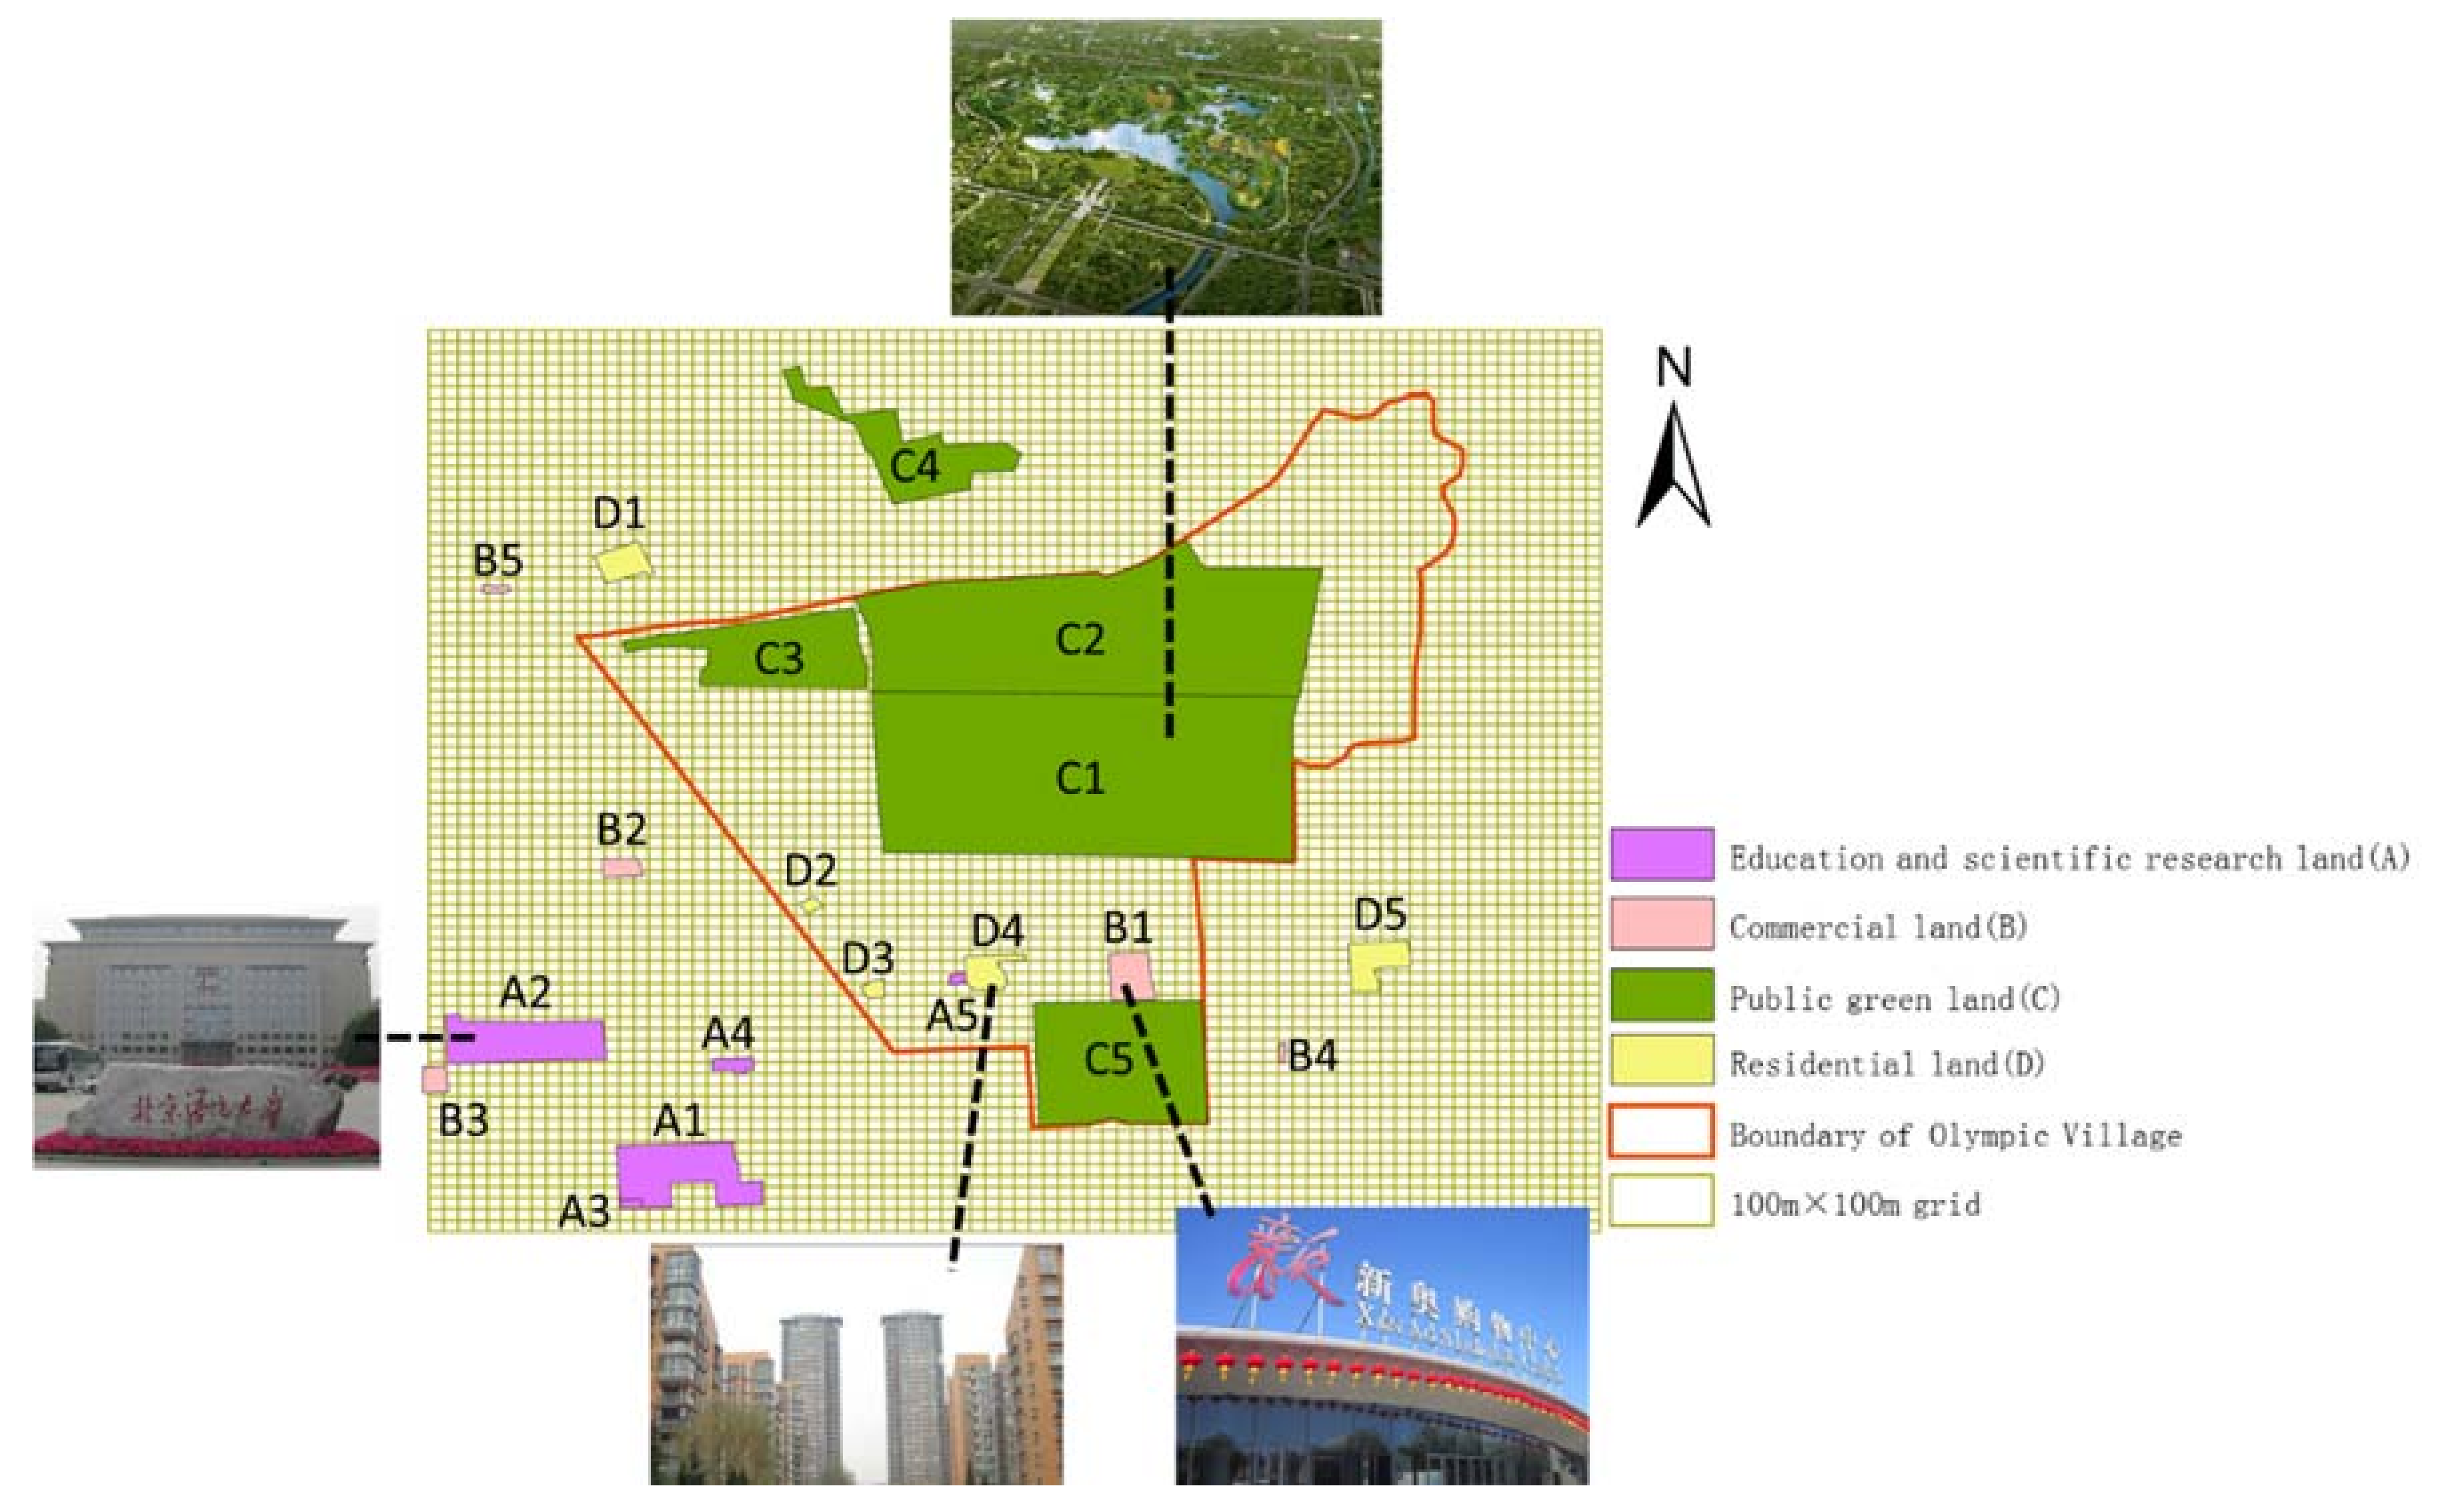
In Table 2, the minimum and maximum total numbers of users ( S U M ) were 0 and 2649 in the grids, respectively. The maximum numbers of female users ( F ) and male users ( M ) were 1837 and 828 in the grids, respectively.
The maximum S U M was observed in the dormitories of Beijing Language and Culture University (Grid ID 1284, DOBLCU), indicating that the users here were primarily students (Table 2). The sex ratio ( S R ) of Grid 1284 was 44.2, meaning that female users outnumbered male users by a ratio greater than 2:1. The second highest S U M was in Yongtaixili (Grid ID 4652, YTXL), which is one of the largest communities in the Qinghe District of Beijing, established in 1996. This mature community has a high concentration of service-type businesses within and around the community that causes a concentrated area with a large and active population. The third highest S U M was in Yiyuan of Anhuibeili (Grid ID 1904, YYAH), which has more than 4000 residents and conditions similar to those of YTXL. The S R of YYAH was the lowest in the top five grids, meaning that the proportion of female users was the highest. The fourth highest S U M was at the Peking University Health Science Center School of Nursing (Grid ID 253, PUHSCSN), which is a workplace where the users primarily consisted of students and staff. The S R was 119.3, indicating that male users outnumbered females. The fifth highest S U M was in the Olympic Torch Square (Grid ID 1568, OTS), which is in the northern National Stadium area; during and after the 2008 Olympic Games in Beijing, the National Stadium became a landmark building in Beijing attracting large numbers of visitors. Its S R was 53.3, indicating that female users outnumbered males by a ratio greater than 2:1. Grids with no users were mainly in the center of Dongxiaokou Forest Park (DFP), which has large areas without pedestrian access or trails, or that are covered by water. Figure 4 shows the result of grid transformation of the total number of Sina Location Microblog users in June 2014.
(3)
In Table 3 and Table 4, the maximum total numbers of users on weekdays ( S U M w e e k d a y ) and weekends ( S U M w e e k e n d ) were 1613 and 1036, respectively, with a minimum total number of 0. The maximum average numbers of users on weekdays ( A V G w e e k d a y ) and weekends ( A V G w e e k e n d ) were 77 and 115, respectively.
The top seven grids contained residential, workplace, and public land (Table 3 and Table 4). The grid with the highest total and average numbers of users on weekdays and weekends was DOBLCU (Grid ID 1284), with a S U M w e e k d a y of 577 users greater than the S U M w e e k e n d , while the A V G w e e k d a y was 38 users fewer than the A V G w e e k e n d . The sex ratio ( S R ) of DOBLCU increased on weekends; however, there were still twice as many female users as males on weekends. DOBUPT is also residential land; however, its S R s were higher than those of DOBLCU, meaning the proportion of male users was higher in DOBUPT than that in DOBLCU. Among YTXL, YYAH, HYJB, and OTS, the first three places represent residential land with a large and concentrated population. Their S R s were both lower than 100. On weekdays, the S R of YYAH was the lowest, showing that there were three times as many female users as male. On weekends, the S R s of these four places showed that there were approximately twice as many female users as male. OTS is public land, so the number of people here on weekends was usually larger than that of weekdays and the S R s were both less than 100. The S U M w e e k d a y and A V G w e e k d a y of PUHSCSN were greater than the S U M w e e k e n d and A V G w e e k e n d of PUHSCSN. Moreover, the S R s were more than 100 and the S R was higher on weekends than on weekdays. These quantitative characteristics of the users were opposite when compared with the quantitative characteristics of residential and public land. The grids with no users were primarily in the center of Dongxiaokou Forest Park, where public access is limited due to a lack of sidewalks or due to areas covered by water.

3.1.2. Local Moran’s I

We applied the Univariate Local Indicators of Spatial Association using GeoDa software (https://spatial.uchicago.edu/software) to calculate the Local Moran’s I of the difference between S U M w e e k d a y and S U M w e e k e n d , the difference between the numbers of female users and male users on weekdays, and the difference between the numbers of female users and male users on weekends (Figure 5 and Figure 6).
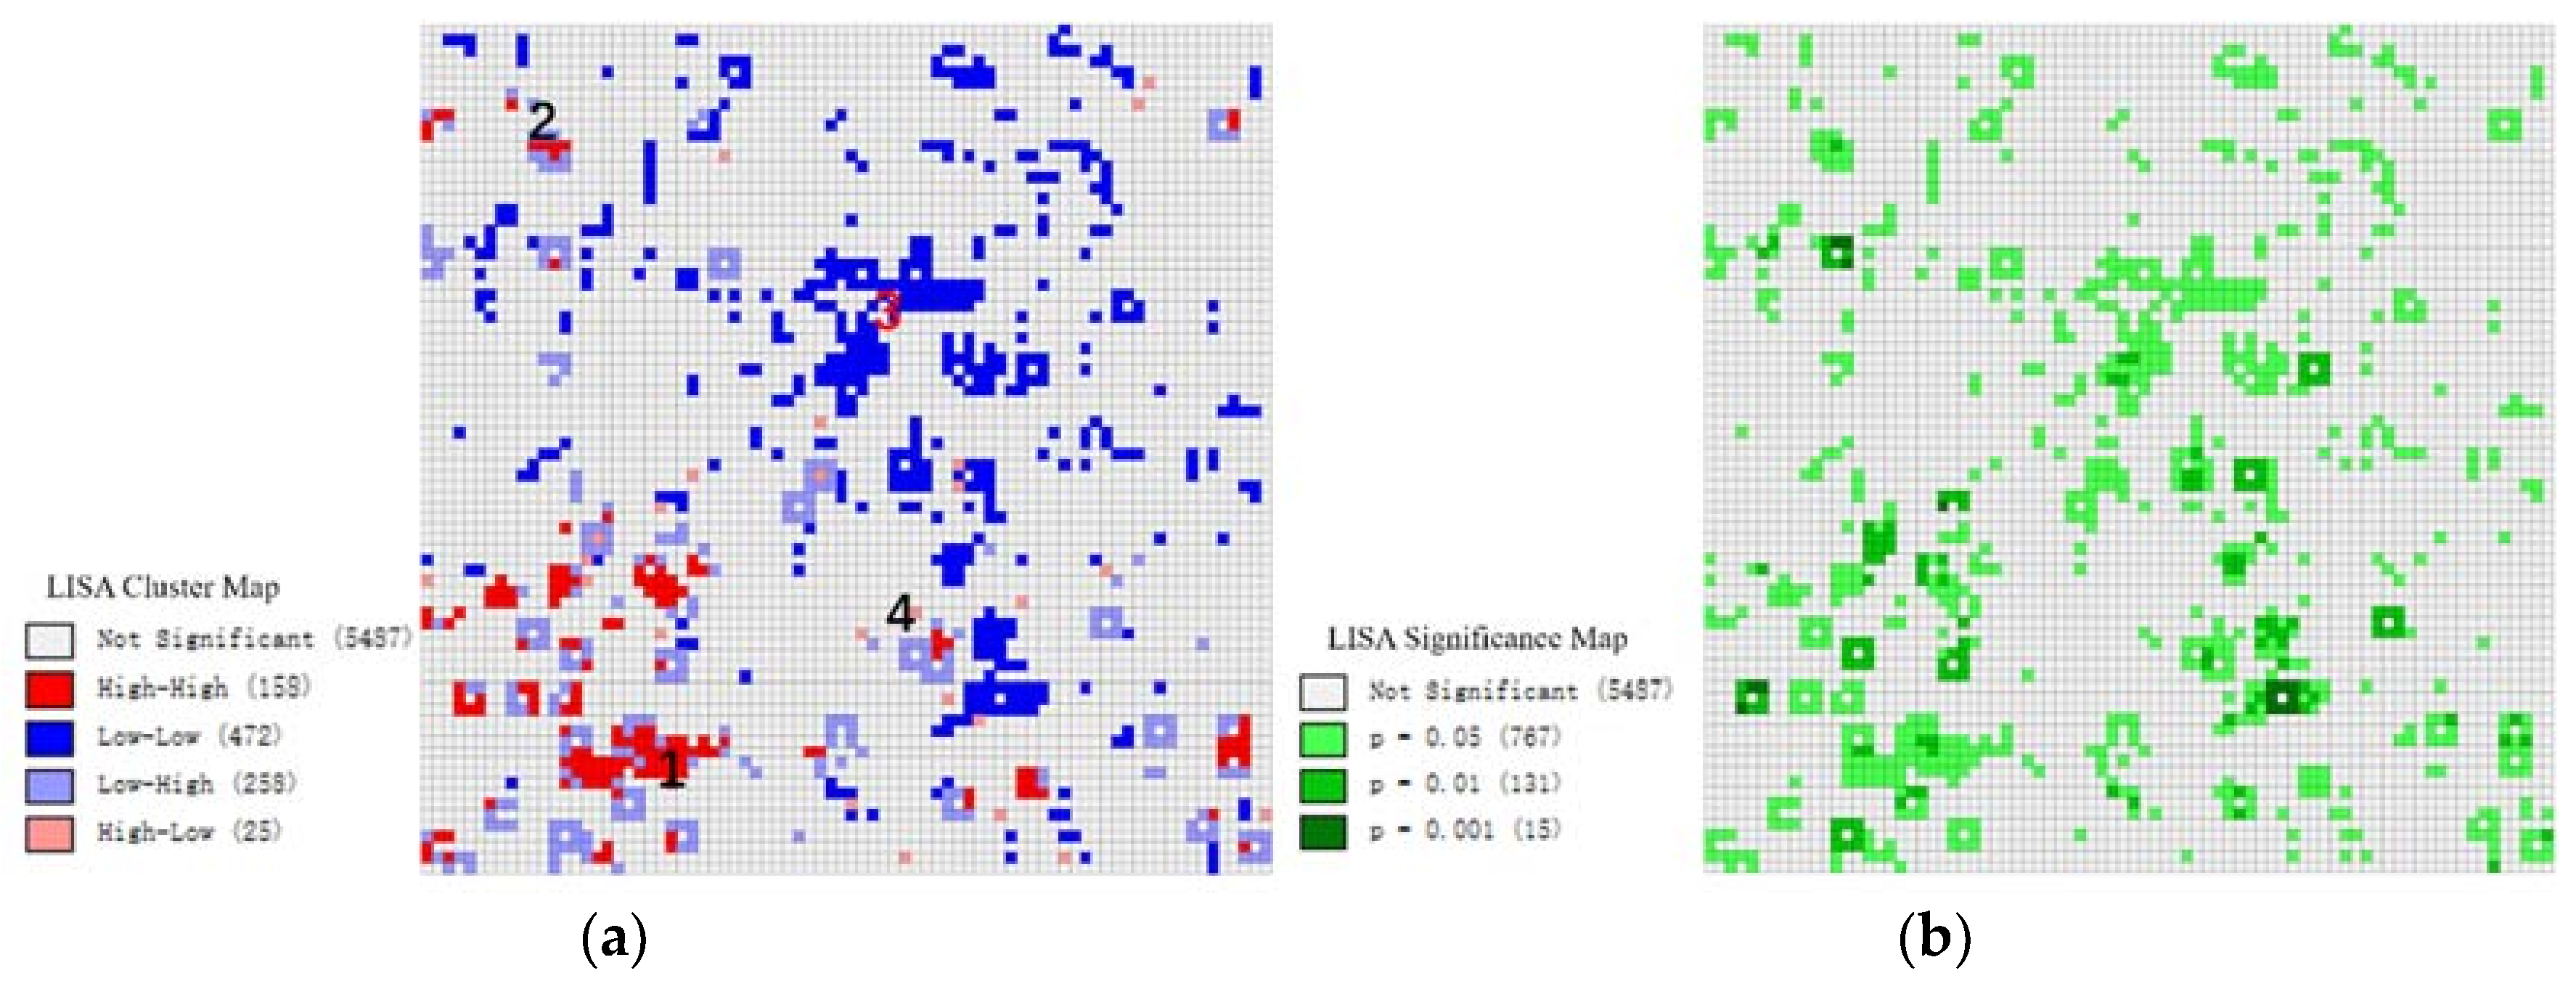
  • The Moran’s I is 0.0145, and its z-value is 2.8957, meaning that the spatial distribution of the local indicator has a positive spatial correlation.
    (1)
    High–High: this represents a grid and its surrounding grids with a relatively large difference between S U M w e e k d a y and S U M w e e k e n d , meaning that these grids have more weekday than weekend users, and the spatial differentiation among them is small. High–High grids are mainly distributed in residential land, education and scientific research land, and in areas with some companies (Figure 5). For example, the position shown by the number 1 in Figure 5 contains the Peking University Health Science Center and the Beijing University of Science and Technology. These grids and their surrounding grids have more weekday than weekend users; thus, they are distribution areas with positive values.
    (2)
    Low–Low: this represents a grid and its surrounding grids with relatively little difference between S U M w e e k d a y and S U M w e e k e n d , meaning that these grids have fewer weekday than weekend users, and the spatial differentiation among them is small. Low–Low grids are mainly distributed in public green land (Figure 5). For example, the position shown by the number 3 in Figure 5 contains Olympic parks and forest parks. These grids and their surrounding grids have fewer weekday than weekend users; thus, they have distribution areas with negative values.
    (3)
    Low–High: this represents a grid with relatively little difference between S U M w e e k d a y and S U M w e e k e n d , while its surrounding grids have a relatively greater difference between S U M w e e k d a y and S U M w e e k e n d , and the spatial differentiation among them is large. Low–High grids are randomly distributed around High–High grids (Figure 5). For example, the position shown by the number 2 in Figure 5 is a recreational park near residential land. These grids have fewer weekday than weekend users.
    (4)
    High–Low: this represents a grid with a relatively large difference between S U M w e e k d a y and S U M w e e k e n d , while its surrounding grids have relatively little difference between S U M w e e k d a y and S U M w e e k e n d , and the spatial differentiation among them is large. High–Low grids are mainly distributed around Low–Low grids (Figure 5). For example, the position shown by the number 4 in Figure 5 is a subway station. These grids have more weekday than weekend users, and fewer weekday than weekend users in the areas around these grids.
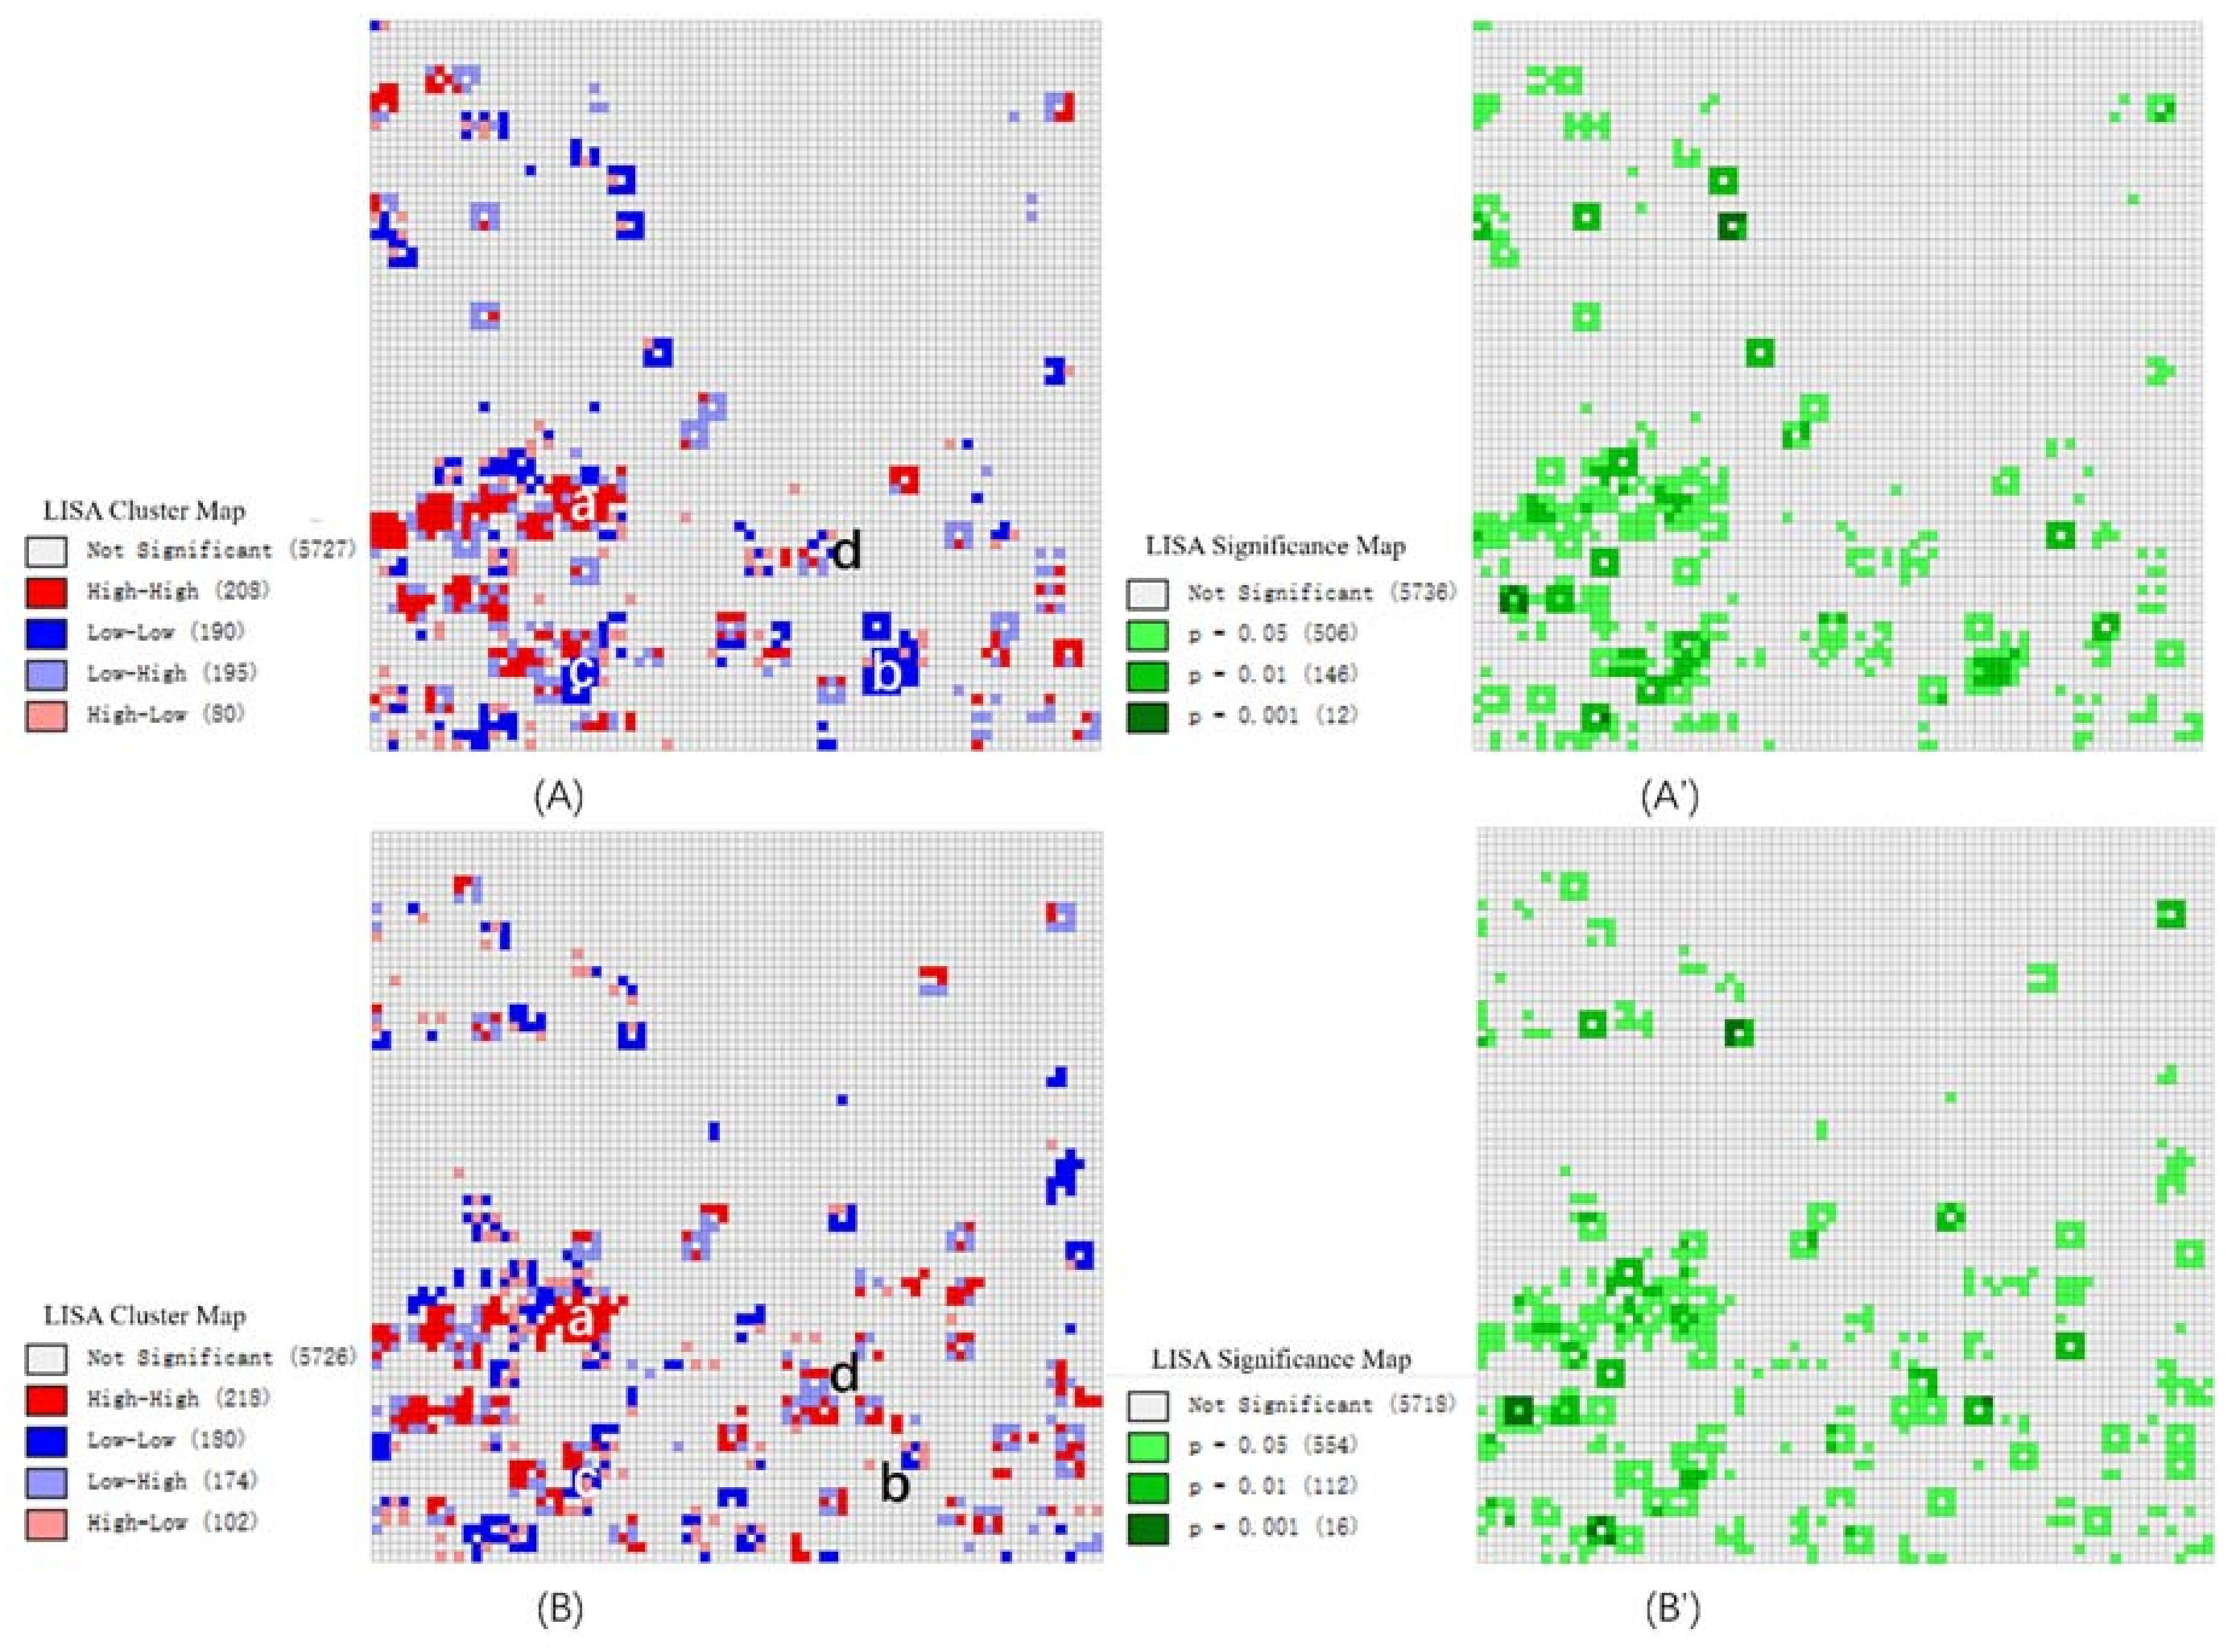
  • The Moran’s I of the difference between the number of female users and male users on weekdays is 0.0346, and its z-value is 5.9051; the Moran’s I of the difference between the number of female users and male users on weekends is 0.0269, and its z-value is 4.7393, meaning that the spatial distribution of the local indicators has a positive spatial correlation.
    (1)
    High–High: this represents a grid and its surrounding grids with relatively large differences between the number of female users and male users, meaning that these grids have more female users than male users, and the spatial differentiation among them is small. High–High grids are mainly distributed at education and scientific research land and residential land. For example, the zone shown by the letter a in Figure 6A,B contains several universities and some communities. These grids and their surrounding grids have more female users than male users; thus, they are distribution areas with positive values.
    (2)
    Low–Low: this represents a grid and its surrounding grids with relatively little differences between the number of female users and male users, meaning that these grids have fewer female users than male users, and the spatial differentiation among them is small. Low–Low grids are mainly distributed at sports centers and workplaces. For example, the positions shown by the letter b contains the National Olympic Sports Center comprehensive training center, swimming pool, and tennis hall as well as several sports management centers, and the position shown by the letter c contains an office building. Additionally, the b and c zones show an obvious change between Figure 6A and Figure 6B, respectively, meaning that male users outnumber female users at playgrounds and workplaces on weekdays. These grids and their surrounding grids have fewer female users than male users; thus, they have distribution areas with negative values.
    (3)
    Low–High: this represents a grid with relatively little difference between the numbers of female users and male users, and its surrounding grids have relatively greater differences between the number of female users and male users, and the spatial differentiation among them is large. Low–High grids are distributed around High–High grids. For example, the position shown by the letter d contains a shopping center mall and Olympic park, and Figure 6B shows that there are more Low–High grids and High–High grids on weekends than on weekdays in the d zone, meaning the number of female users and male users increases over the weekends. In particular, male users obviously outnumber female users in several grids.
    (4)
    High–Low: this represents a grid with a relatively large difference between the numbers of female users and male users, and its surrounding grids have relatively little differences between the number of female users and male users, and the spatial differentiation among them is large. High–Low grids are mainly distributed around Low–Low grids. These grids have more female users than male users, as well as fewer male users than female users in areas around these grids.

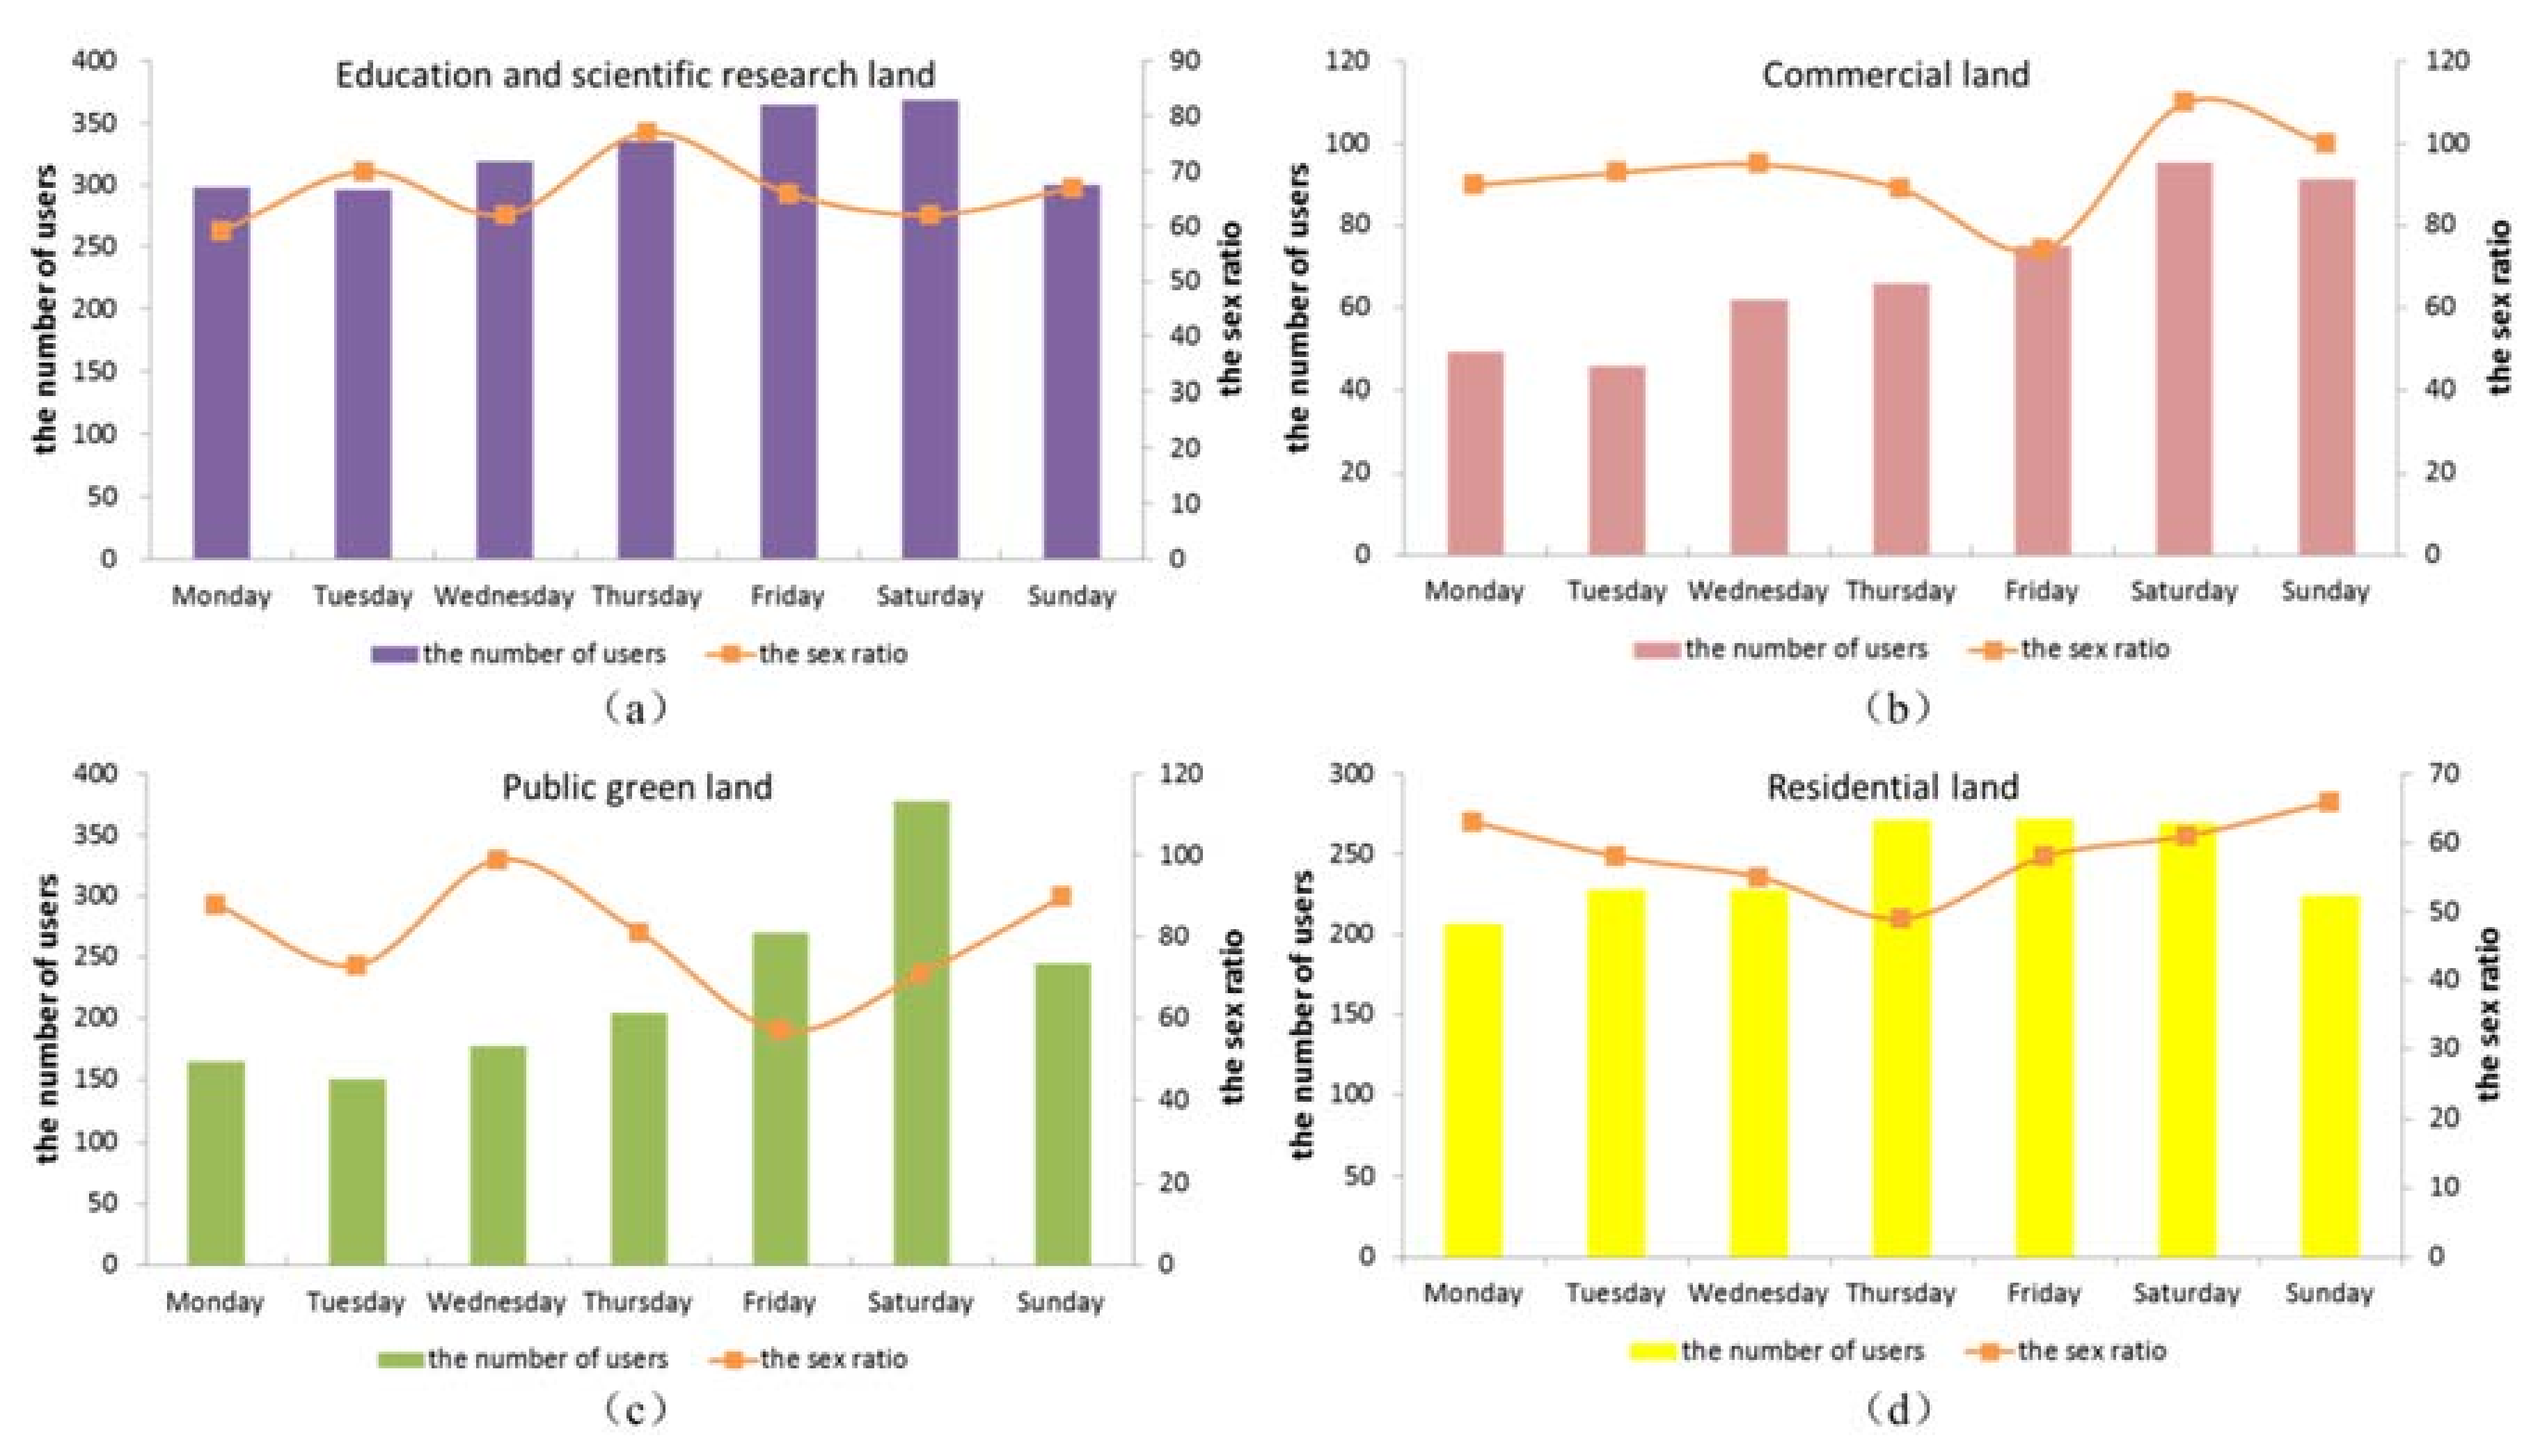
3.2. The Relationship between the Activity of Users and Land Use Types

According to the results of the statistical analysis and Local Moran’s I, the four land use types in Figure 7 were classified as follows. The letter A represents education and scientific research land, where A1–A5 represent the Peking University Health Science Center, Beijing Language and Culture University, New Oriental Education and Technology Group, the middle school associated with the University of Science and Technology in Beijing, and Chaoyang Foreign Language School, respectively. The letter B represents commercial land, where B1–B5 represent the Xin’ao Shopping Center, Shengxi No. 8 Shopping Center, Wudaokou Shopping Center, Beichen Shopping Center, and Qinghe Shopping Mall, respectively. The letter C represents public green space land, where C1–C2 represent the south and north Olympic Forest Parks, respectively, and C3–C5 represent the Aoyuncun Sports Club, Dongsheng Recreation and Sports Park, and Olympic Park, respectively. The letter D represents residential land, where D1–D5 represent Yongtaixili, Tianherenjia, Beishatan No. 5, Fenglinlvzhou, and Yiyuan of Anhuibeili, respectively.
Furthermore, we calculated the average daily numbers and the S R s of users on the four land use types over one week to analyze the spatial-temporal distribution and characteristics of users.
The statistical analysis shows that the average number of users on all four land use types clearly increased on weekends, especially on commercial and public green space lands (Figure 8). First, education and scientific research land on Saturday ( A V G S a t ) had the highest average number of users (368 users). The S R peaked at 77 on Thursday, meaning that the female users outnumbered male users, although this dominance was smallest on Thursday. The S R curve fell from Thursday to Saturday, showing that the proportion of female users increased as the weekend approached. Second, on commercial land on Saturday, the average number of users ( A V G S a t was 96 users) and the S R (at 110) peaked, with male users outnumbering female users on Saturday. From Monday to Thursday, the S R s did not significantly increase or decrease. The S R was the lowest on Friday, meaning that the proportion of female users was highest at that time. On Saturday and Sunday, the S R s exceeded 100, meaning that the male users outnumbered female users; also, the proportion of male users increased from Friday to Sunday. Third, for public green space land, A V G S a t peaked at 378 users, while the S R reached its lowest point (59) on Friday. The S R curve varied during the week. From Wednesday to Friday, the S R curve dropped, showing that the proportion of female users apparently increased; from Friday to Sunday, the S R curve increased, showing that the proportion of male users increased. Finally, on residential land, A V G F r i peaked at 272 users, with the lowest S R occurring on Thursday at 50. The S R on residential land decreased from Monday to Thursday and increased from Thursday to Sunday.

4. Discussion and Conclusions

Sina Microblog, as a representative of VGI data, has been a significant urban human sensing data source in China. Many researchers focus on studying the spatial-temporal characteristics of the Sina check-ins of microblog users [13,28]. In this paper, we applied mathematical statistics and Local Moran’s I to analyze the spatial-temporal distribution characteristics of Sina Location Microblog users according to sex cohorts for land use patterns in urban areas, with the users’ coordinates objectively uploaded by the GPS interfaces of smart phones.
We found that the number of overall female users outnumbered male users ( S R was 78.5). The quantitative characteristics of users in 100 m × 100 m grids showed that the grids with more female users than male users were concentrated on residential land and public green land, and the grids with more male users than female users were concentrated on workplaces (Table 2, Table 3 and Table 4). The residential land grids and the public green space grids had a higher average number of users over weekends than on weekdays, meaning that the users were more active over weekends across these land use types. The workplace grids had a higher average number of users on weekdays than on weekends. The S R s exceeded 100, and the S R increased on weekends, meaning that male users still outnumbered female users. Meanwhile, from the Local Moran’s I analysis, the users were mainly distributed on residential land, universities, and companies on weekdays and on public green space over weekends. Female users outnumbered male users at education and scientific research land and residential land; male users outnumbered female users on playgrounds and workplaces on weekdays, and the number of male users increased over weekends on commercial land, even more than the number of female users. As seen in Figure 8, through the analysis of the quantitative characteristics and S R s of users on four land use types during the week, we found that the average number of users peaked on education and scientific research land, where female users were more active than male users ( S R ranged from 59 to 77), followed by the average number of users on residential land ( S R ranged from 49 to 66). In addition, the average daily number of users on weekends exceeded that of weekdays on these four land use types. Except for the S R curve for users across education and scientific research land, the other three S R curves showed that the proportion of male users increased on weekends, especially on commercial land ( S R was 110); this phenomenon may be related to the shopping habits of males and females. Females will pay more attention to commodities, while males (especially the partners of female shoppers) use the internet to pass the time. These results reflect that female users are generally more active than men in social networks, which also shows that women are more concerned with self-presentation in social networks [28]. Furthermore, it illustrates that women’s social constraints are weakened in the network virtual space.
In conclusion, Sina Location Microblog data can demonstrate the human dynamics behind the spatial-temporal characteristics of gender differences in urban areas. Overall, the female users outnumbered the male users, but the sex ratio varied in different land use types at different times. Social media data with geographic location information can provide information that supports the study of the dynamic distribution of the urban population and can be used for urban planning. This helps urban planners to consider both the urban economic growth and gender needs in the development of urban planning according to the spatial-temporal distribution of the urban population separated by sex cohorts. Planners can then integrate the perspective of gender into the decision-making and operation of urban planning to make the planning increasingly fair and realize a people-oriented concept of urban planning, and especially improving the gender consciousness of space use in urban public spaces. For example, urban planners can not only protect women’s safety by reducing dark corners in public areas, but can also increase and expand the number of female toilets in areas where women are concentrated according to the spatial distribution characteristics of women. This paper is an empirical attempt to employ Sina Location Microblog for data collection and spatial comparative analysis. It still leaves a large space for additional research, which needs further exploration and application. The results in this paper cannot be expanded to represent the characteristics of the urban population as a whole, and we cannot access additional information related to user attributes, such as educational background, occupation, and age. In future studies, the relationships between users and urban land use types can be further studied from different aspects by using more detailed user attribute information.

Author Contributions

C.L. and A.Z. conceived and designed the experiments; C.L. performed the experiments and analyzed the data; C.L. wrote the original draft preparation; and C.L., A.Z., Q.Q., H.S., and J.W. jointly revised the paper.

Funding

This research was supported by the Strategic Priority Research Program of the Chinese Academy of Sciences (Grant No. XDA19040402), National Natural Science Foundation of China (Grant Nos. 41421001, 41471414 and 41201412), National Key Research and Development Program of China (Grant No. 2017YFB0503500), and the Featured Institute Construction Services Program (Grant No. TSYJS03).

Acknowledgments

The remote sensing imagery was provided by the Satellite Surveying and Mapping Application Center (National Administration of Surveying, Mapping and Geoinformation). We would like to thank LetPub (www.letpub.com) and American Journal Experts (https://secure.aje.com/) for providing linguistic assistance during the preparation of this manuscript.

Conflicts of Interest

The authors declare no conflict of interest.

References

  1. Liu, Y.; Xiao, Y.; Gao, S. A Review of Human Mobility Research Based on Location Aware Devices. Geogr. Geo-Inf. Sci. 2011, 27, 8–13. [Google Scholar]
  2. Li, H. Population information management and application analysis under the era of big data. Mod. Manag. Sci. 2014, 10, 111–113. (In Chinese) [Google Scholar]
  3. Yang, W.; Ai, T. POI Information Enhancement Using Crowdsourcing Vehicle Trace Data and Social Media Data: A Case Study of Gas Station. ISPRS Int. J. Geo-Inf. 2018, 7, 178. [Google Scholar] [CrossRef]
  4. Liu, Y.; Liu, X.; Gao, S.; Gong, L.; Kang, C.; Zhi, Y.; Chi, G.; Shi, L. Social Sensing: A New Approach to Understanding Our Socioeconomic Environments. Ann. Assoc. Am. Geogr. 2015, 105, 512–530. [Google Scholar] [CrossRef]
  5. Zhou, X.; Yue, Y.; Yeh, A.G.O. Uncertainty in Spatial Analysis of Dynamic Data-Identifying City Center. Geomat. Inf. Sci. Wuhan Univ. 2014, 39, 701–705. [Google Scholar]
  6. Long, Y.; Sun, L.J.; Tao, S. A Review of Urban Studies Based on Transit Smart Card Data. Urban Plan. Forum. 2015, 3, 70–77. [Google Scholar]
  7. Long, Y.; Zhang, Y.; Cui, C.Y. Identifying commuting pattern of Beijing using bus smart card data. Acta Geogr. Sin. 2012, 67, 1339–1352. [Google Scholar]
  8. Wu, J.S.; Li, B.; Huang, X.L. Spatio-temporal dynamics and driving mechanisms of resident trip in small cities. J. Geo-Inf. Sci. 2017, 19, 176–184. (In Chinese) [Google Scholar]
  9. Pan, G.; Qi, G.; Wu, Z.; Zhang, D.; Li, S. Land-Use Classification Using Taxi GPS Traces. IEEE Trans. Intell. Transp. Syst. 2013, 14, 113–123. [Google Scholar] [CrossRef]
  10. Medina, S.A.O.; Erath, A. Estimating Dynamic Workplace Capacities by Means of Public Transport Smart Card Data and Household Travel Survey in Singapore. Transp. Res. Rec. J. Transp. Res. Board 2013, 2344, 20–30. [Google Scholar] [CrossRef]
  11. Zheng, Y.; Zhang, L.; Xie, X.; Ma, W.Y. Mining correlation between locations using human location history . In Proceedings of the 17th ACM SIGSPATIAL International Conference on Advances in Geographic Information Systems, Seattle, WA, USA, 4–6 November 2009; pp. 472–475. [Google Scholar]
  12. Ye, Y.; Zheng, Y.; Chen, Y.; Feng, J.; Xie, X. Mining Individual Life Pattern Based on Location History. In Proceedings of the Tenth International Conference on Mobile Data Management: Systems, Services and Middleware, Taipei, Taiwan, 18–20 May 2009. [Google Scholar]
  13. Hu, Q.W.; Wang, M.; Li, Q.Q. Urban Hotspot and Commercial Area Exploration with Check-in Data. Acta Geod. Cartogr. Sin. 2014, 43, 314–321. [Google Scholar]
  14. Jiao, Y.; Liu, W.; Shi, E. Research on the spatial distribution and mechanism of commercial activities of Guangzhou based upon multi-source POI data. Urban Insight 2015, 6, 11. [Google Scholar]
  15. Chen, W.; Liu, L.; Liang, Y. Retail center recognition and spatial aggregating feature analysis of retail formats in Guangzhou based on POI data. Geogr. Res. 2016, 35, 703–716. [Google Scholar]
  16. Leng, B.R.; Yu, Y.; Huang, D.Q.; Yi, Z.H. Big data Based Job-residence relation in Chongqing Metropolitan area. Planners 2015, 5, 17. [Google Scholar]
  17. Comito, C.; Falcone, D.; Talia, D. Mining human mobility patterns from social geo-tagged data. Pervasive Mob. Comput. 2016, 33, 91–107. [Google Scholar] [CrossRef]
  18. Altomare, A.; Cesario, E.; Comito, C.; Marozzo, F.; Talia, D. Trajectory Pattern Mining for Urban Computing in the Cloud. IEEE Trans. Parallel Distrib. Syst. 2017, 28, 586–599. [Google Scholar] [CrossRef]
  19. Gustave, L.B. The Crowd: A Study of the Popular Mind; Cosimo Classics: New York, NY, USA, 2006. [Google Scholar]
  20. Li, X.H.; Zhao, Y.D. Analysis of social network user behavior. Comput. Era 2017, 6, 29–35. [Google Scholar]
  21. He, Y.; Zhang, Y. On the user characteristics of different topics on Sina Microblog. J. Intell. 2016, 35, 107–110. (In Chinese) [Google Scholar]
  22. Olympic Village Subdistrict Office. Olympic Village Subdistrict Office Basic Situation. Available online: http://aycdq.bjchy.gov.cn/web/620/index.html (accessed on 12 April 2017).
  23. Mao, X.; Xu, R.R.; Li, X.S.; Wang, Y.; Li, C.; Zeng, B.; He, Y.; Liu, J. Fine Grid Dynamic Features of Population Distribution in Shenzhen. Acta Geogr. Sin. 2010, 65, 443–453. [Google Scholar]
  24. Lu, A.M.; Li, C.M.; Lin, Z.J.; Shi, W.Z. Spatial Continuous Surface Model of Population Density. Acta Geod. Cartogr. Sin. 2003, 32, 344–348. [Google Scholar]
  25. Qi, W.; Li, Y.; Liu, S.H.; Gao, X.L.; Zhao, M.F. Estimation of urban population at daytime and nighttime and analyses of their spatial pattern: A case study of Haidian District, Beijing. Acta Geogr. Sin. 2013, 68, 1344–1356. [Google Scholar]
  26. Chen, R.; Wang, H.Q.; Meng, B.; Gui, L.; Liu, Y. Urban Spatial analysis and visualization based on LBSN Check-in data. Geomat. World 2017, 24, 85–91. [Google Scholar]
  27. Lei, C.C.; Zhang, A.; Qi, Q.W.; Su, H.M. Grid-based location Microblog data fetching and human information extraction. Sci. Surv. Mapp. 2017, 42, 125–129. (In Chinese) [Google Scholar]
  28. Zhang, Z.A.; Huang, Z.F.; Jin, C.; Guan, J.; Cao, F.-D. Research on spatial-temporal characteristics of scenic tourist activity based on Sina Microblog: A case study of Nanjing Zhongshan Mountain National Park. Geogr. Geo-Inf. Sci. 2015, 31, 121–126. [Google Scholar]
Figure 1. Location of the Olympic Village area. (a) Location of the Olympic Village within the administrative divisions of Beijing; (b) remote sensing imagery showing the boundaries of the Olympic Village within central Beijing.
Ijgi 07 00358 g001
Figure 2. The locations of Sina Microblog users in June 2014 in and near the Olympic Village, overlaid on 100 m × 100 m grids.
Ijgi 07 00358 g002
Figure 3. Variation in the number of Sina Location Microblog users in June 2014: (a) the number of users per day; (b) the histogram of the data.
Ijgi 07 00358 g003
Figure 4. Grid transformation of the total number of Sina users in June 2014. Grid IDs are provided for the five grids with the highest numbers of users.
Ijgi 07 00358 g004
Figure 5. (a) The local indicator of the spatial association cluster pattern of the difference between SUMweekday(i) and SUMweekend(i); (b) the local indicator of spatial association significance map (p < 0.05).
Ijgi 07 00358 g005
Figure 6. The local indicators of the spatial association cluster pattern of (A) the difference between the number of female users and male users on weekdays and (B) the difference between the number of female users and male users on weekends. (A’,B’) are the local indicators of the spatial association significance map (p < 0.05).
Ijgi 07 00358 g006
Figure 7. Spatial distribution of land used for (A) education and scientific research, (B) commercial uses, (C) public green space, and (D) residences.
Ijgi 07 00358 g007
Figure 8. The statistical results of the daily number and sex ratio of users for one week on (a) education and scientific research land, (b) commercial land, (c) public green space land, and (d) residential land.
Ijgi 07 00358 g008
Table 1. Descriptive statistics.
StatisticsMaximumMinimumStd. DevSkewnessKurtosisPercentiles
255075
Value4225248886.207−1.3552.032556.2528523251.25
Table 2. The partial statistical results of the quantities of microblog users in June 2014.
Grid IDGrid LocationLand Use S U M F M S R
1284The dormitories of Beijing Language and Culture University (DOBLCU)Residential land2649183781244.2
4652Yongtaixili (YTXL)Residential land2048122082867.9
1904Yiyuan of Anhuibeili (YYAH)Residential land1768130746135.3
253Peking University Health Science Center School of Nursing (PUHSCSN)Workplace1147523624119.3
1568Olympic Torch Square (OTS)Public land112273239053.3
6397Dongxiaokou Forest Park (DFP)Green space land000-
6398Dongxiaokou Forest Park (DFP)Green space land000-
6399Dongxiaokou Forest Park (DFP)Green space land000-
Note: S U M represents the total number of users, F represents the number of female users, M represents the number of male users, and S R represents the sex ratio. We chose the uppercase of some letters of the grid location name as the abbreviation of the grid location name; for instance, the dormitories of Beijing Language and Culture University are abbreviated as DOBLCU.
Table 3. The partial statistical results of the quantities of users on weekdays in June 2014.
Grid IDGrid LocationLand Use S U M w e e k d a y F M A V G w e e k d a y S R
1284The dormitories of Beijing Language and Culture University (DOBLCU)Residential land161311734407737.5
4652Yongtaixili (YTXL)Residential land12217005215874.4
1904Yiyuan of Anhuibeili (YYAH)Residential land11739162575628.1
253Peking University Health Science Center School of Nursing (PUHSCSN)Workplace82537744839118.8
1543The dormitories of Beijing University of Posts and Telecommunications in Erlizhuang (DOBUPT)Residential land7184063123476.8
1568Olympic Torch Square (OTS)Public land6534412123148.1
1334Huiyuan Apartment J block (HYJB)Residential land247149981265.8
Note: F represents the number of female users, M represents the number of male users, S R represents the sex ratio, S U M w e e k d a y represents the total number of users on weekdays, and A V G w e e k d a y represents the average number of users on weekdays. We chose the uppercase of some letters of the grid location name as the abbreviation of the grid location name; for instance, the dormitories of Beijing Language and Culture University are abbreviated as DOBLCU.
Table 4. The partial statistical results of the quantities of users on weekends in June 2014.
Grid IDGrid LocationLand Use S U M w e e k e n d F M A V G w e e k e n d S R
1284The dormitories of Beijing Language and Culture University (DOBLCU)Residential land103666437211556
4652Yongtaixili (YTXL)Residential land8275203079259
1904Yiyuan of Anhuibeili (YYAH)Residential land5953912046652.2
1334Huiyuan apartment J block (HYJB)Residential land5453621836150.6
1568Olympic Torch Square (OTS)Public land4692911785261.2
1543The dormitories of Beijing University of Posts and Telecommunications in Erlizhuang (DOBUPT)Residential land4332361974883.5
253Peking University Health Science Center School of Nursing (PUHSCSN)Workplace32214617636120.5
Note: F represents the number of female users, M represents the number of male users, S R represents the sex ratio, S U M w e e k e n d represents the total number of users on weekends, and A V G w e e k e n d represents the average number of users on weekends. We chose the uppercase of some letters of the grid location name as the abbreviation of the grid location name; for instance, the dormitories of Beijing Language and Culture University are abbreviated as DOBLCU.

