1. Introduction
In recent years, low-altitude remote sensing unmanned aerial vehicle (UAV) technology has been widely adopted in many fields, and it has become a key spatial data acquisition technology. The application of UAV low-altitude remote sensing images is a recent trend in real estate registration. Traditional manual measurements of both developed and undeveloped land areas involves substantial time, effort, and costs. Additionally, traditional aerial photogrammetry techniques are time-consuming and the costs of flying are high. For small study areas, UAV remote sensing has many advantages over traditional manual measurements and aerial photogrammetry. It is flexible, low-cost, safe, reproducible, and reliable, with low flight heights, high precision, and large-scale measurements that save on manpower and material costs [
1,
2,
3,
4,
5,
6].
A digital orthophoto map (DOM) is an image obtained by vertical parallel projection of a surface, and has the geometric accuracy of a map and visual characteristics of an image. A true digital orthophoto map (TDOM) is an image dataset that produces a surface image by vertical projection, eliminating the projection differences of standard DOMs, and retaining the correct positions of ground objects and features. TDOMs ensure the geometric accuracy of features and maps [
5,
6,
7,
8]. The most notable difference between a TDOM and a traditional DOM is that a TDOM performs ortho-rectification and analyzes the visibility of features. Moreover, a conventional orthophoto uses a digital elevation model (DEM), whereas a true orthophoto uses a digital surface model (DSM). Thus, TDOMs are rich in color, and simplify the identification of textural patterns [
7,
8,
9,
10,
11,
12,
13,
14,
15].
Many previous studies have analyzed UAV images. In a study of DOM accuracy, Gao et al. [
16] investigated ancient earthquake surface ruptures, and obtained both a DEM and a DOM with resolutions of 0.065 m and 0.016 m, respectively. Additionally, Uysal et al. [
17] obtained 0.062 m overall vertical accuracy from an altitude of 60 m. However, production workflow and methods can influence the accuracy of orthophotos. Westoby et al. [
18] outlined structure from motion (SfM) photogrammetry; a revolutionary, low-cost, user-friendly, and effective tool. Since then, common production workflows have used SfM and multi-view stereopsis techniques to produce DSMs and DOMs, and to build 3D geological models [
7,
14,
19,
20,
21,
22,
23]. As for orthorectification, Zhu et al. [
24] proposed an object-oriented true ortho-rectification method.
Unmanned aerial vehicle (UAV) low-altitude remote sensing has a wide range of applications. It allows for the rapid remote surveying of inaccessible areas, and can be used to monitor active volcanos, geothermally active areas, and open-pit mines [
25,
26,
27]. It can also be used to map landslide displacements [
4,
28,
29] and to study glacial landforms [
30,
31,
32], precision agriculture [
33,
34], archaeological sites [
35], landscapes [
36], and ecosystems [
13].
However, previous research on the use of TDOMs in remote sensing is lacking in some areas. Therefore, our study aims to improve TDOM production using UAV images in the following ways: (1) The accuracy of TDOMs in current research is still unsatisfactory in some applications, such as determining the boundaries of rural housing sites and precision agriculture. We outlined a structure from motion, revised DSM and multi-view image texture compensation workflow to generate a high-precision TDOM accuracy within 0.05 m. (2) We used DSM to generate DOM, we artificially edited the DSM in the point cloud for obliquely shaded areas. This technique may help to eliminate the tilt and shadow in DOMs after DSMs have been revised. (3) For the oblique shielding area, we used a multi-view image compensation method to improve texture compensation [
37]. (4) We vectorized homestead buildings in the test area to demonstrate its practical application.
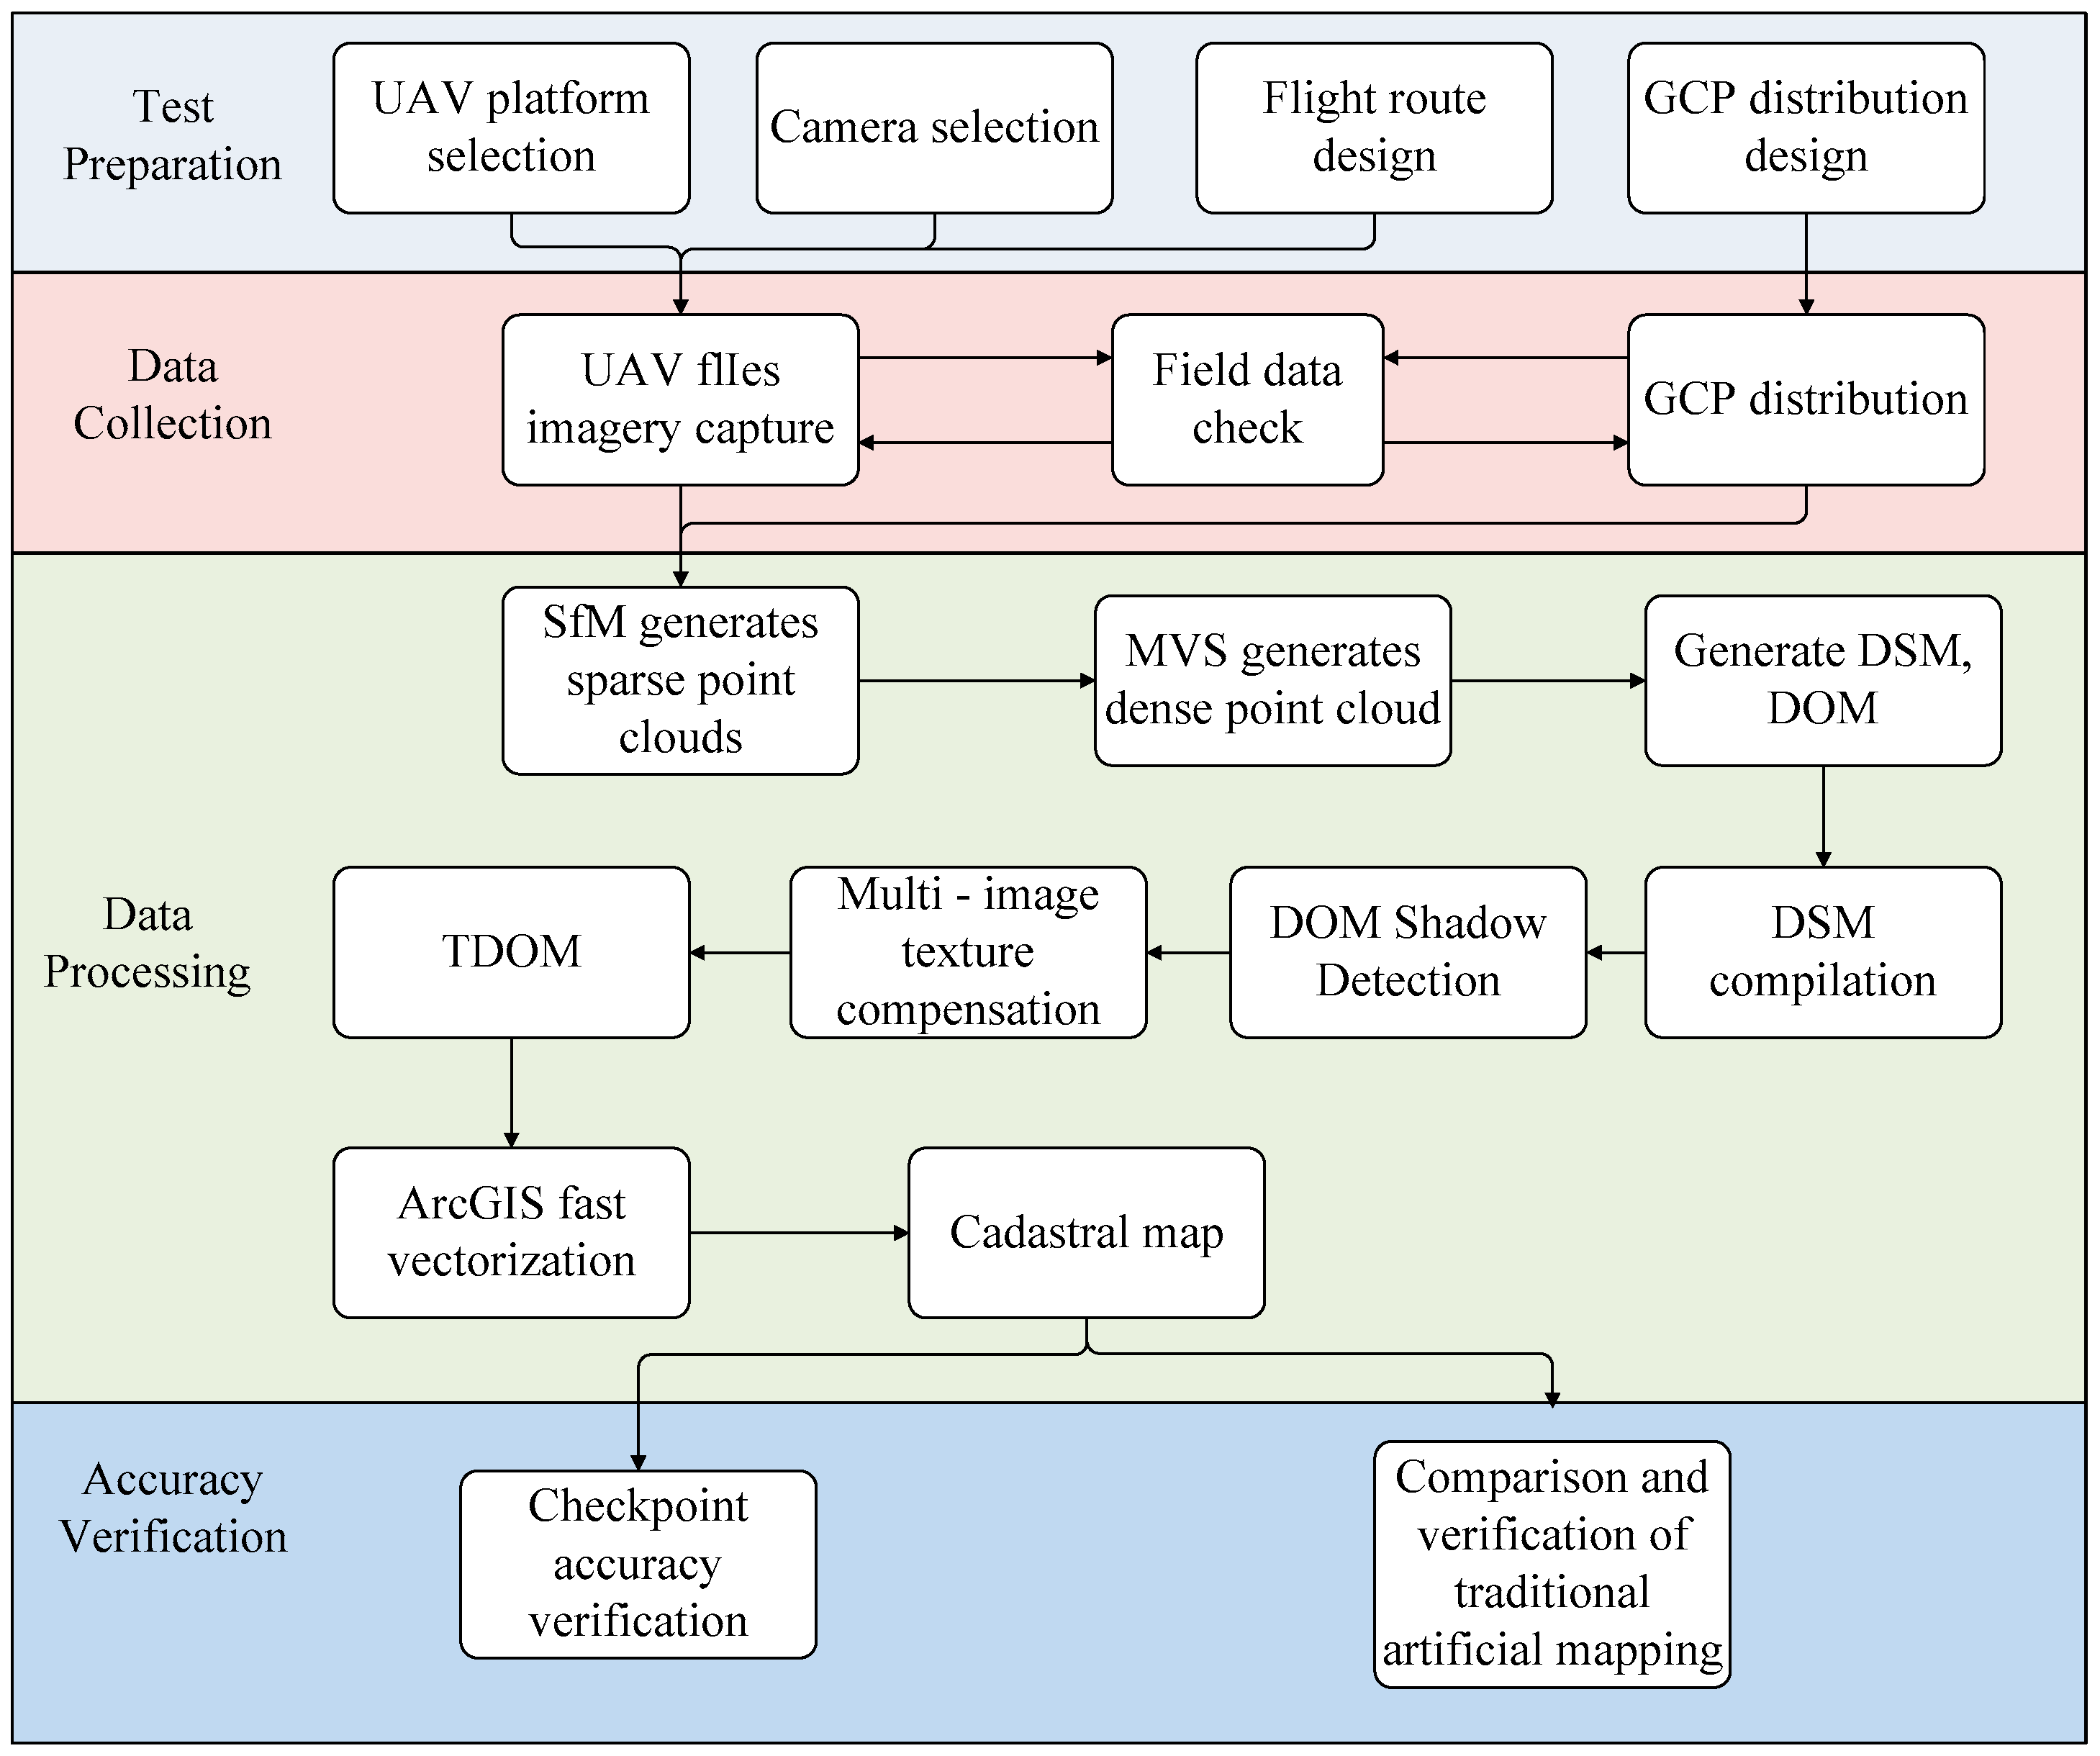
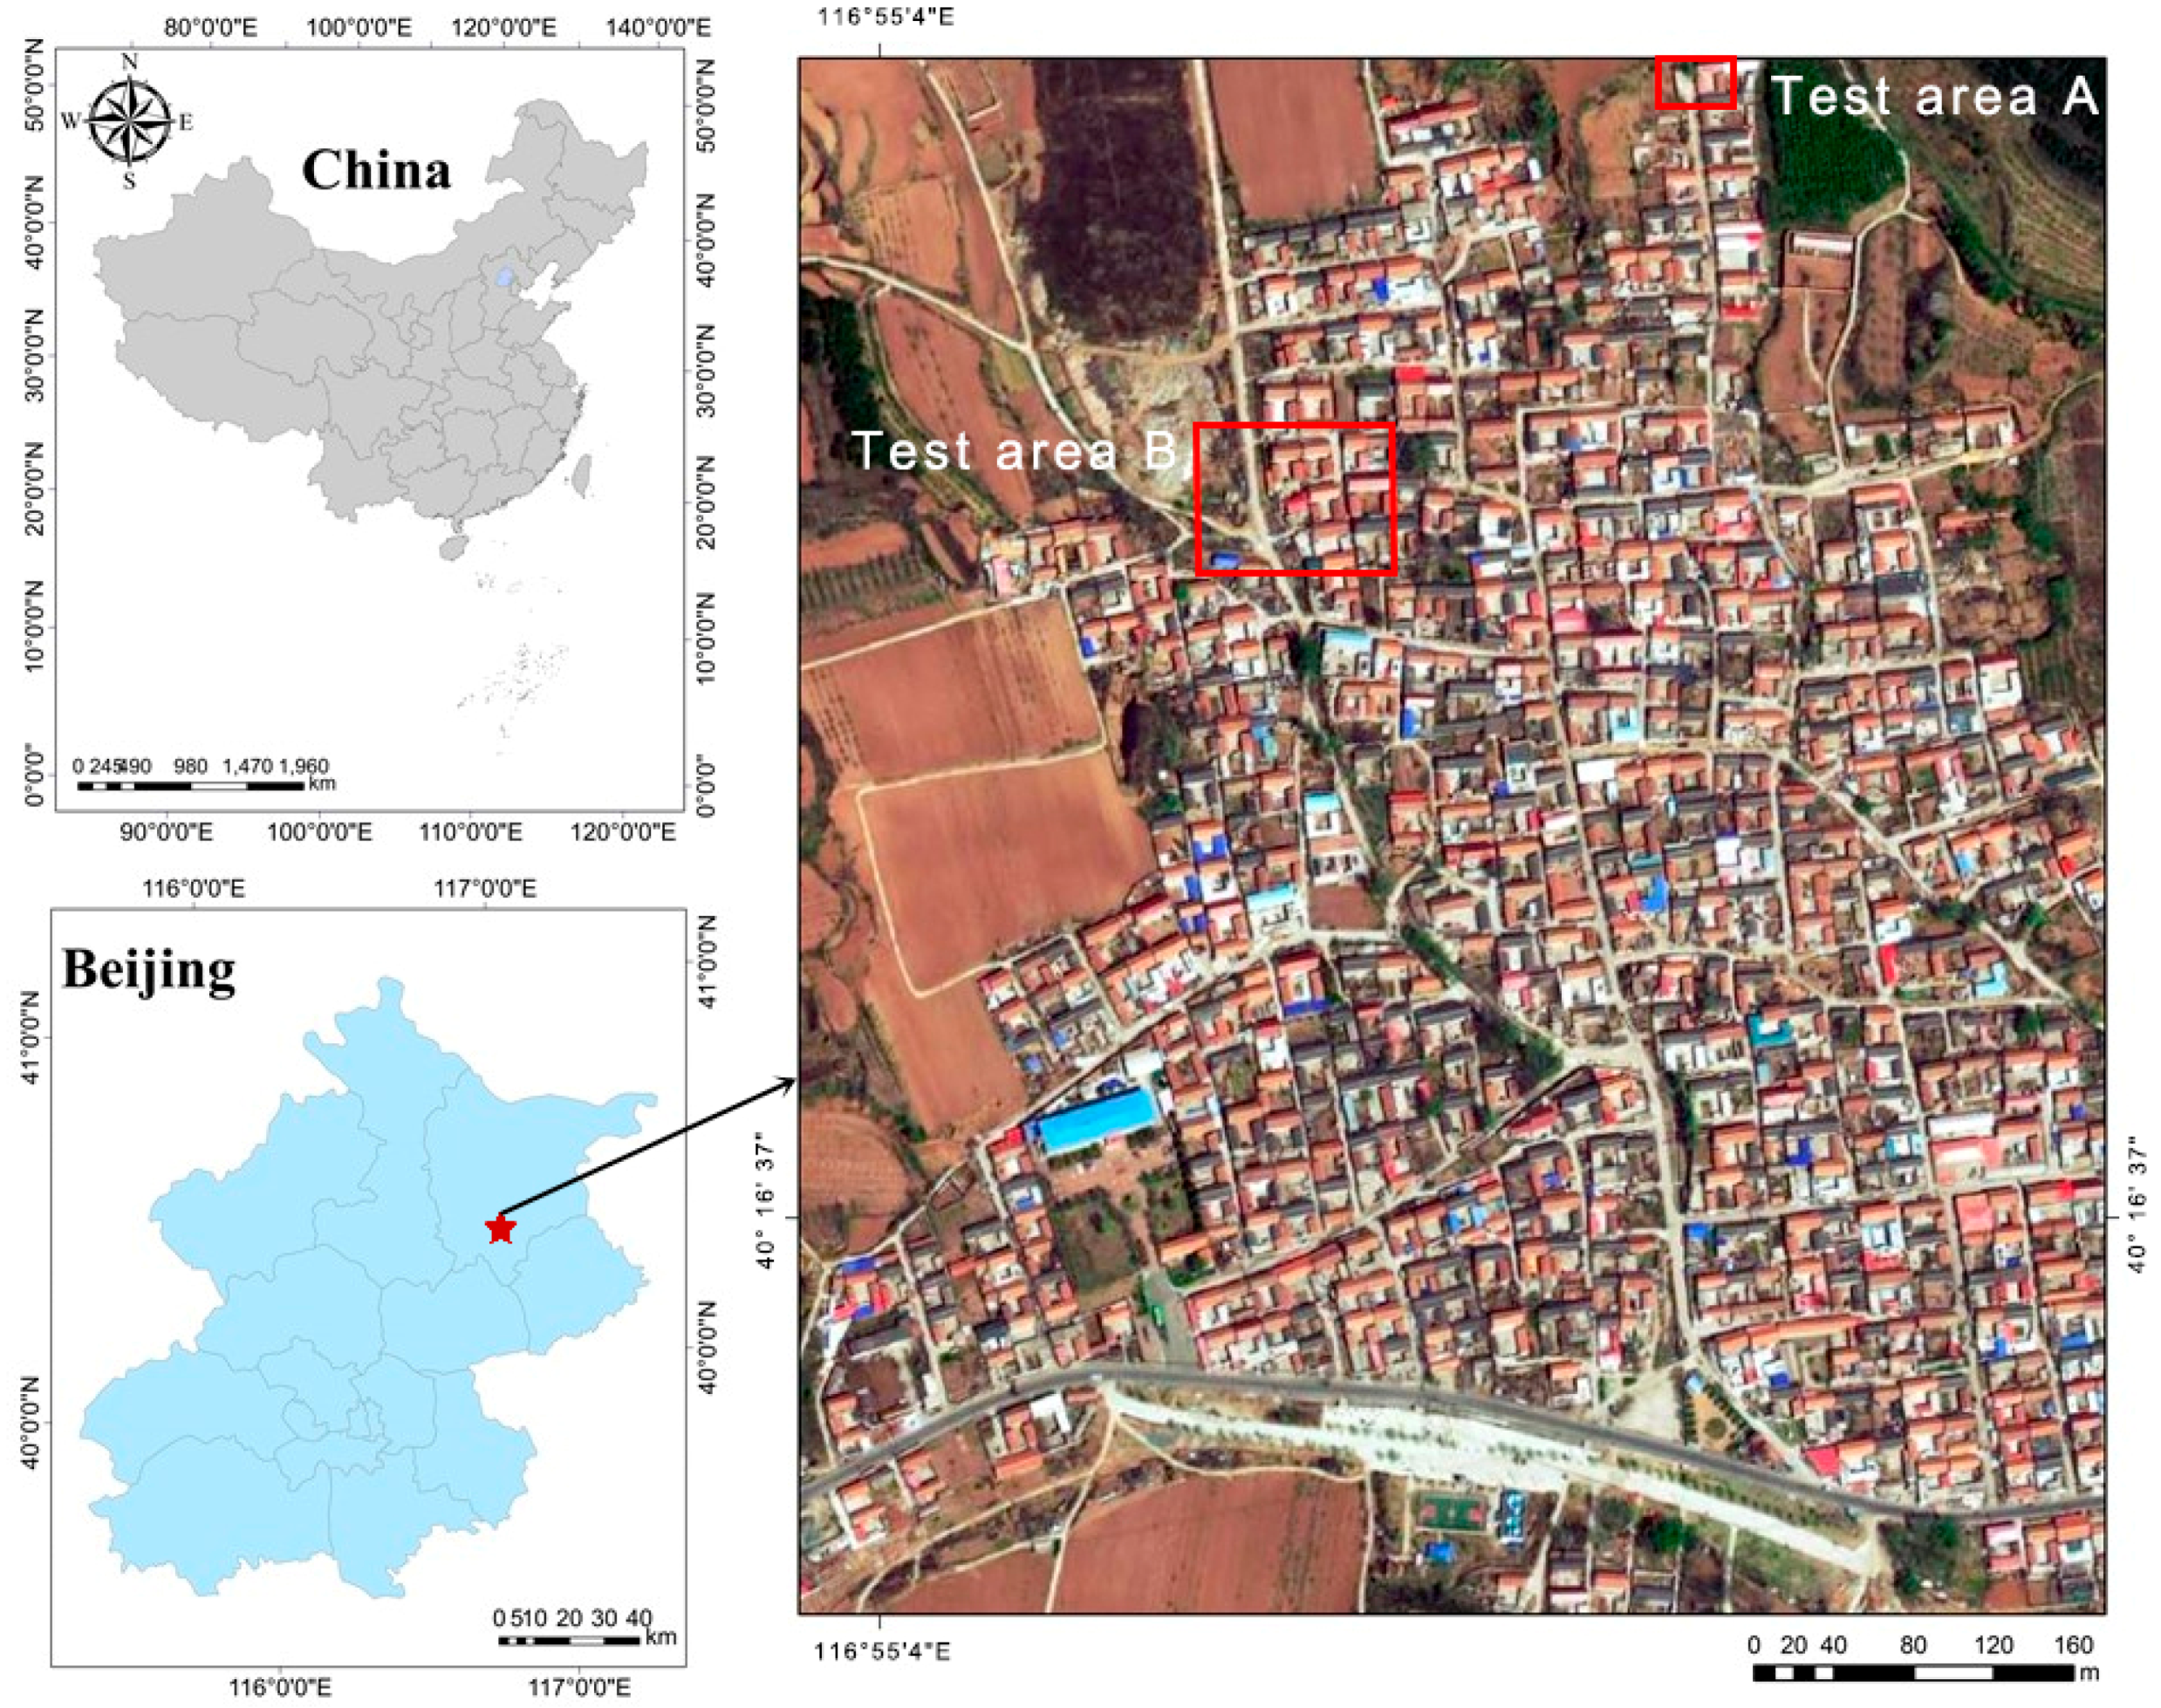
In this study, we use Miyun District in Beijing, China as the research area, collect UAV aerial data, and introduce the structure from motion (SfM) algorithm to generate point clouds, DSMs, and DOMs. For houses with partial DOM tilt problems, we use a revised DSM and multi-view image compensation to eliminate tilt and generate the TDOM. The complete workflow of the study is shown in
Figure 1. We then validate and discuss the generated point clouds, DSM, and TDOM, and propose a high-precision mapping method for UAV remote sensing, which may be applicable to real estate registration in China and elsewhere.
3. Materials and Methods
3.1. UAV Flight
3.1.1. UAV and Digital Camera
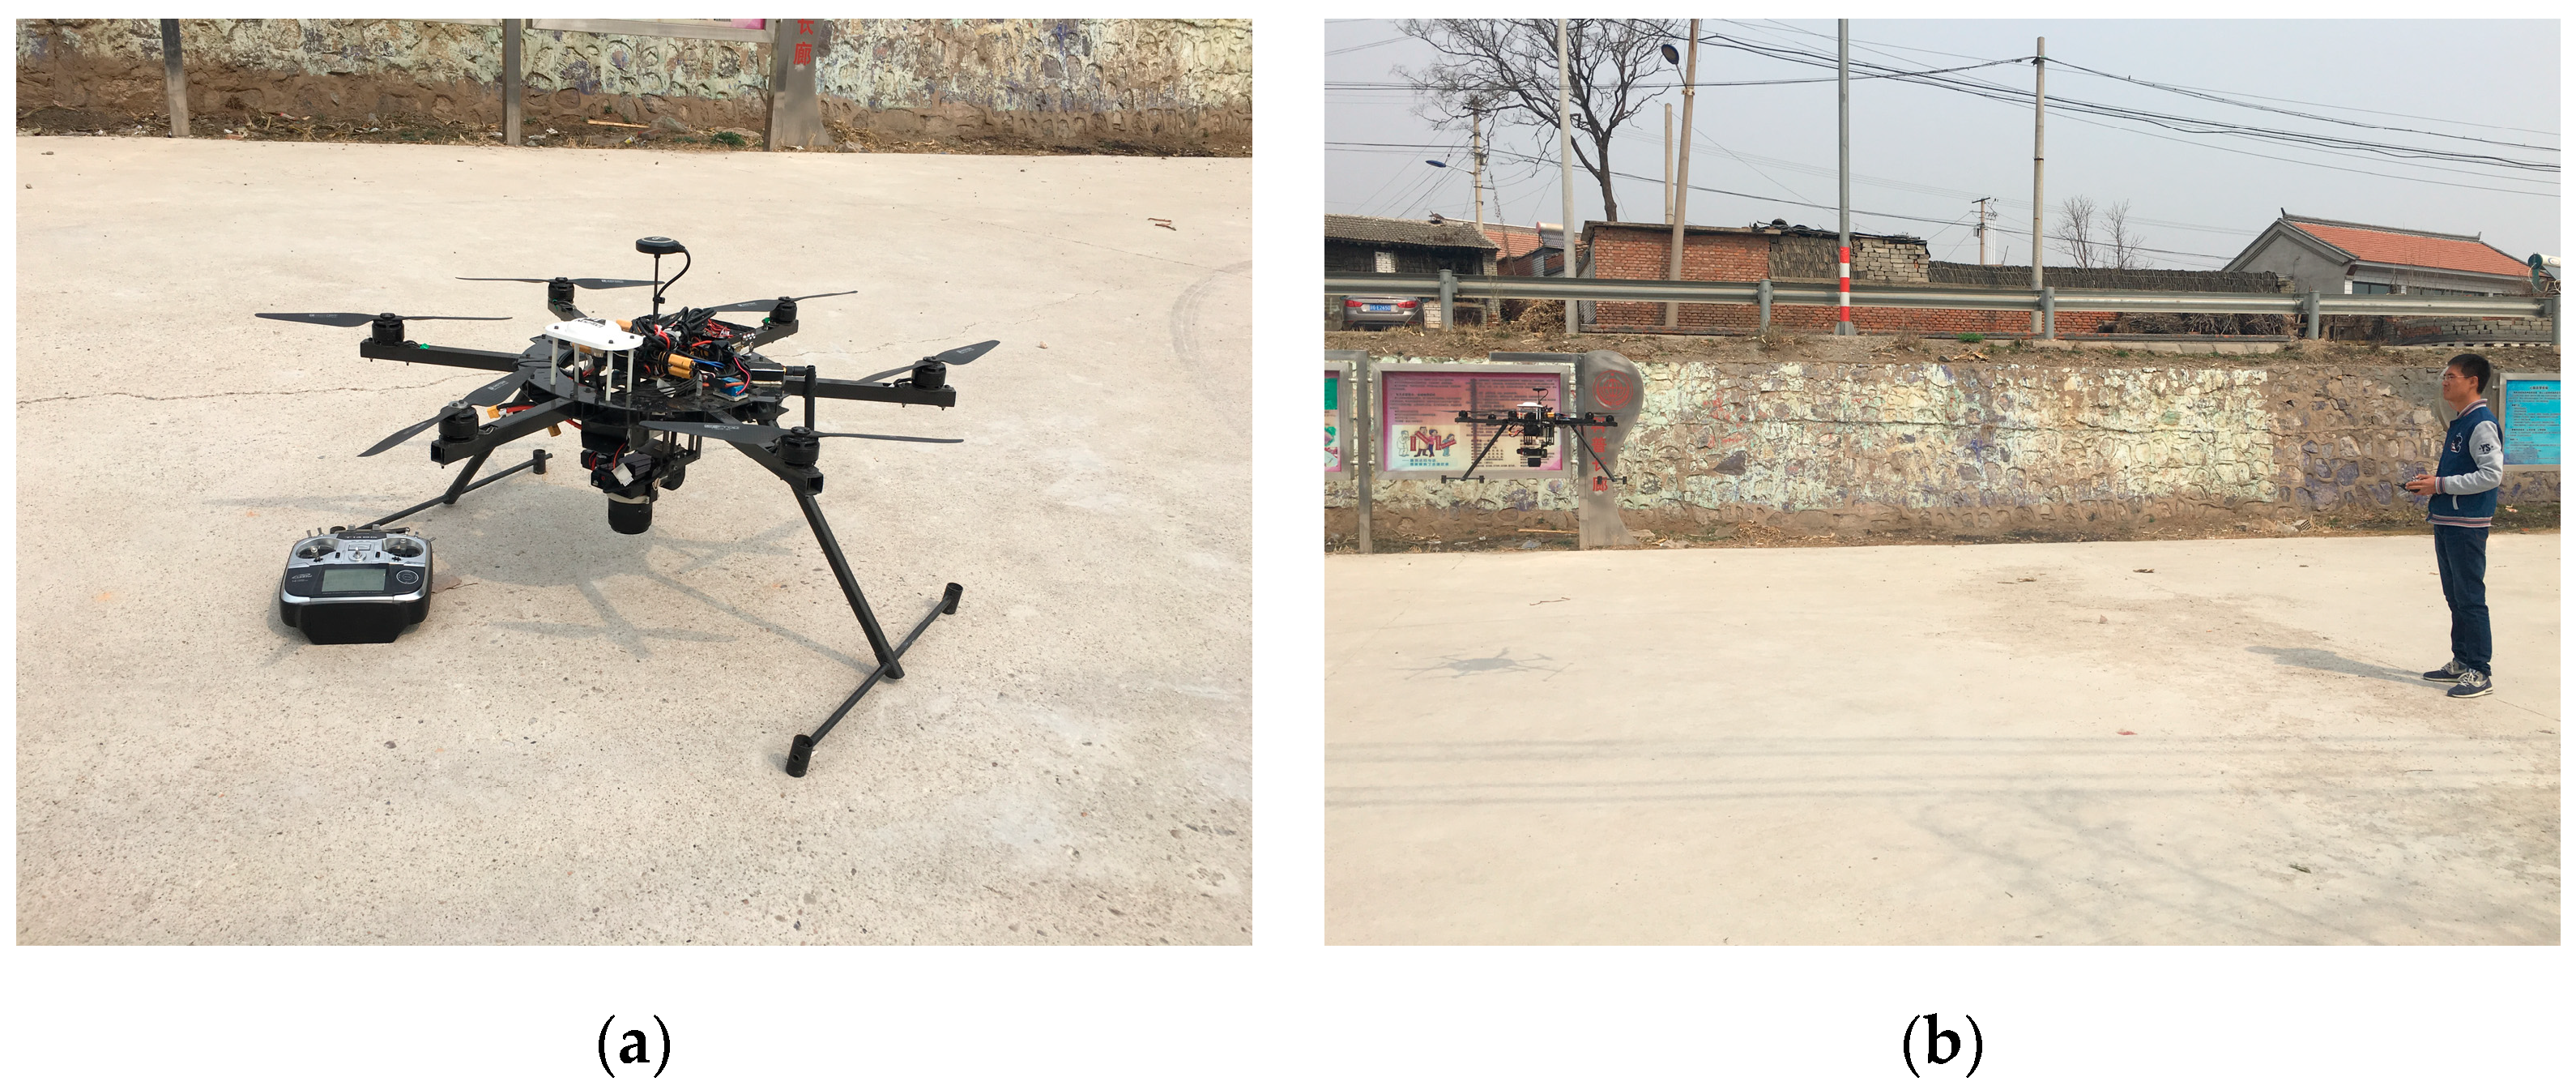
The Dà-Jiāng Innovations (DJI) S900 UAV (Shenzhen, Guangdong, China,
https://www.dji.com/cn) used in this study was a six-rotor flight platform, which is a highly portable, powerful aerial system for photogrammetry. The S900’s main structural components are composed of light carbon fiber, making it lightweight, but strong and stable. It weighs 3.3 kg, and has a maximum takeoff weight of 8.2 kg when carrying a pan/tilt/zoom (PTZ) camera. It can fly for up to 18 min with a payload of 6.8 kg and a 6S 12,000 mAh battery on a breezeless day. In the test, we flew for approximately 12 min.
The UAV was equipped with a Sony A7r digital camera providing 36 million pixels and a resolution of 7360 × 4912 pixels. It had a sensor size of 35.9 × 24 m, a Vario-Tessar T* FE 24-70 mm F4 ZA OSS(ZEL2470Z) lens, a shutter time of 1/1600 s, an aperture of f6.3, and an ISO of 250. The camera was equipped with the DJI S900 UAV to collect image data, as shown in
Figure 3a. The camera weight was 998 g, the focus length was set to 50 mm, and the field of view (
FOV) was 46.7°, calculated using Equation (1):
where
d is the diagonal length of the sensor size and
f is the focus length. Camera calibration was performed as part of the SfM process by Pix4d, which calculated the initial and optimized values of interior orientation parameters: initial focal length = 50 mm, optimized = 49.65 mm; principal point coordinates
x = 17.5, 17.55 mm;
y = 11.679, 11.682 mm, radial distortion = −0.048, −0.189 mm, and tangential distortion = 0, 0 mm.
3.1.2. Ground Control Point (GCP) Layout
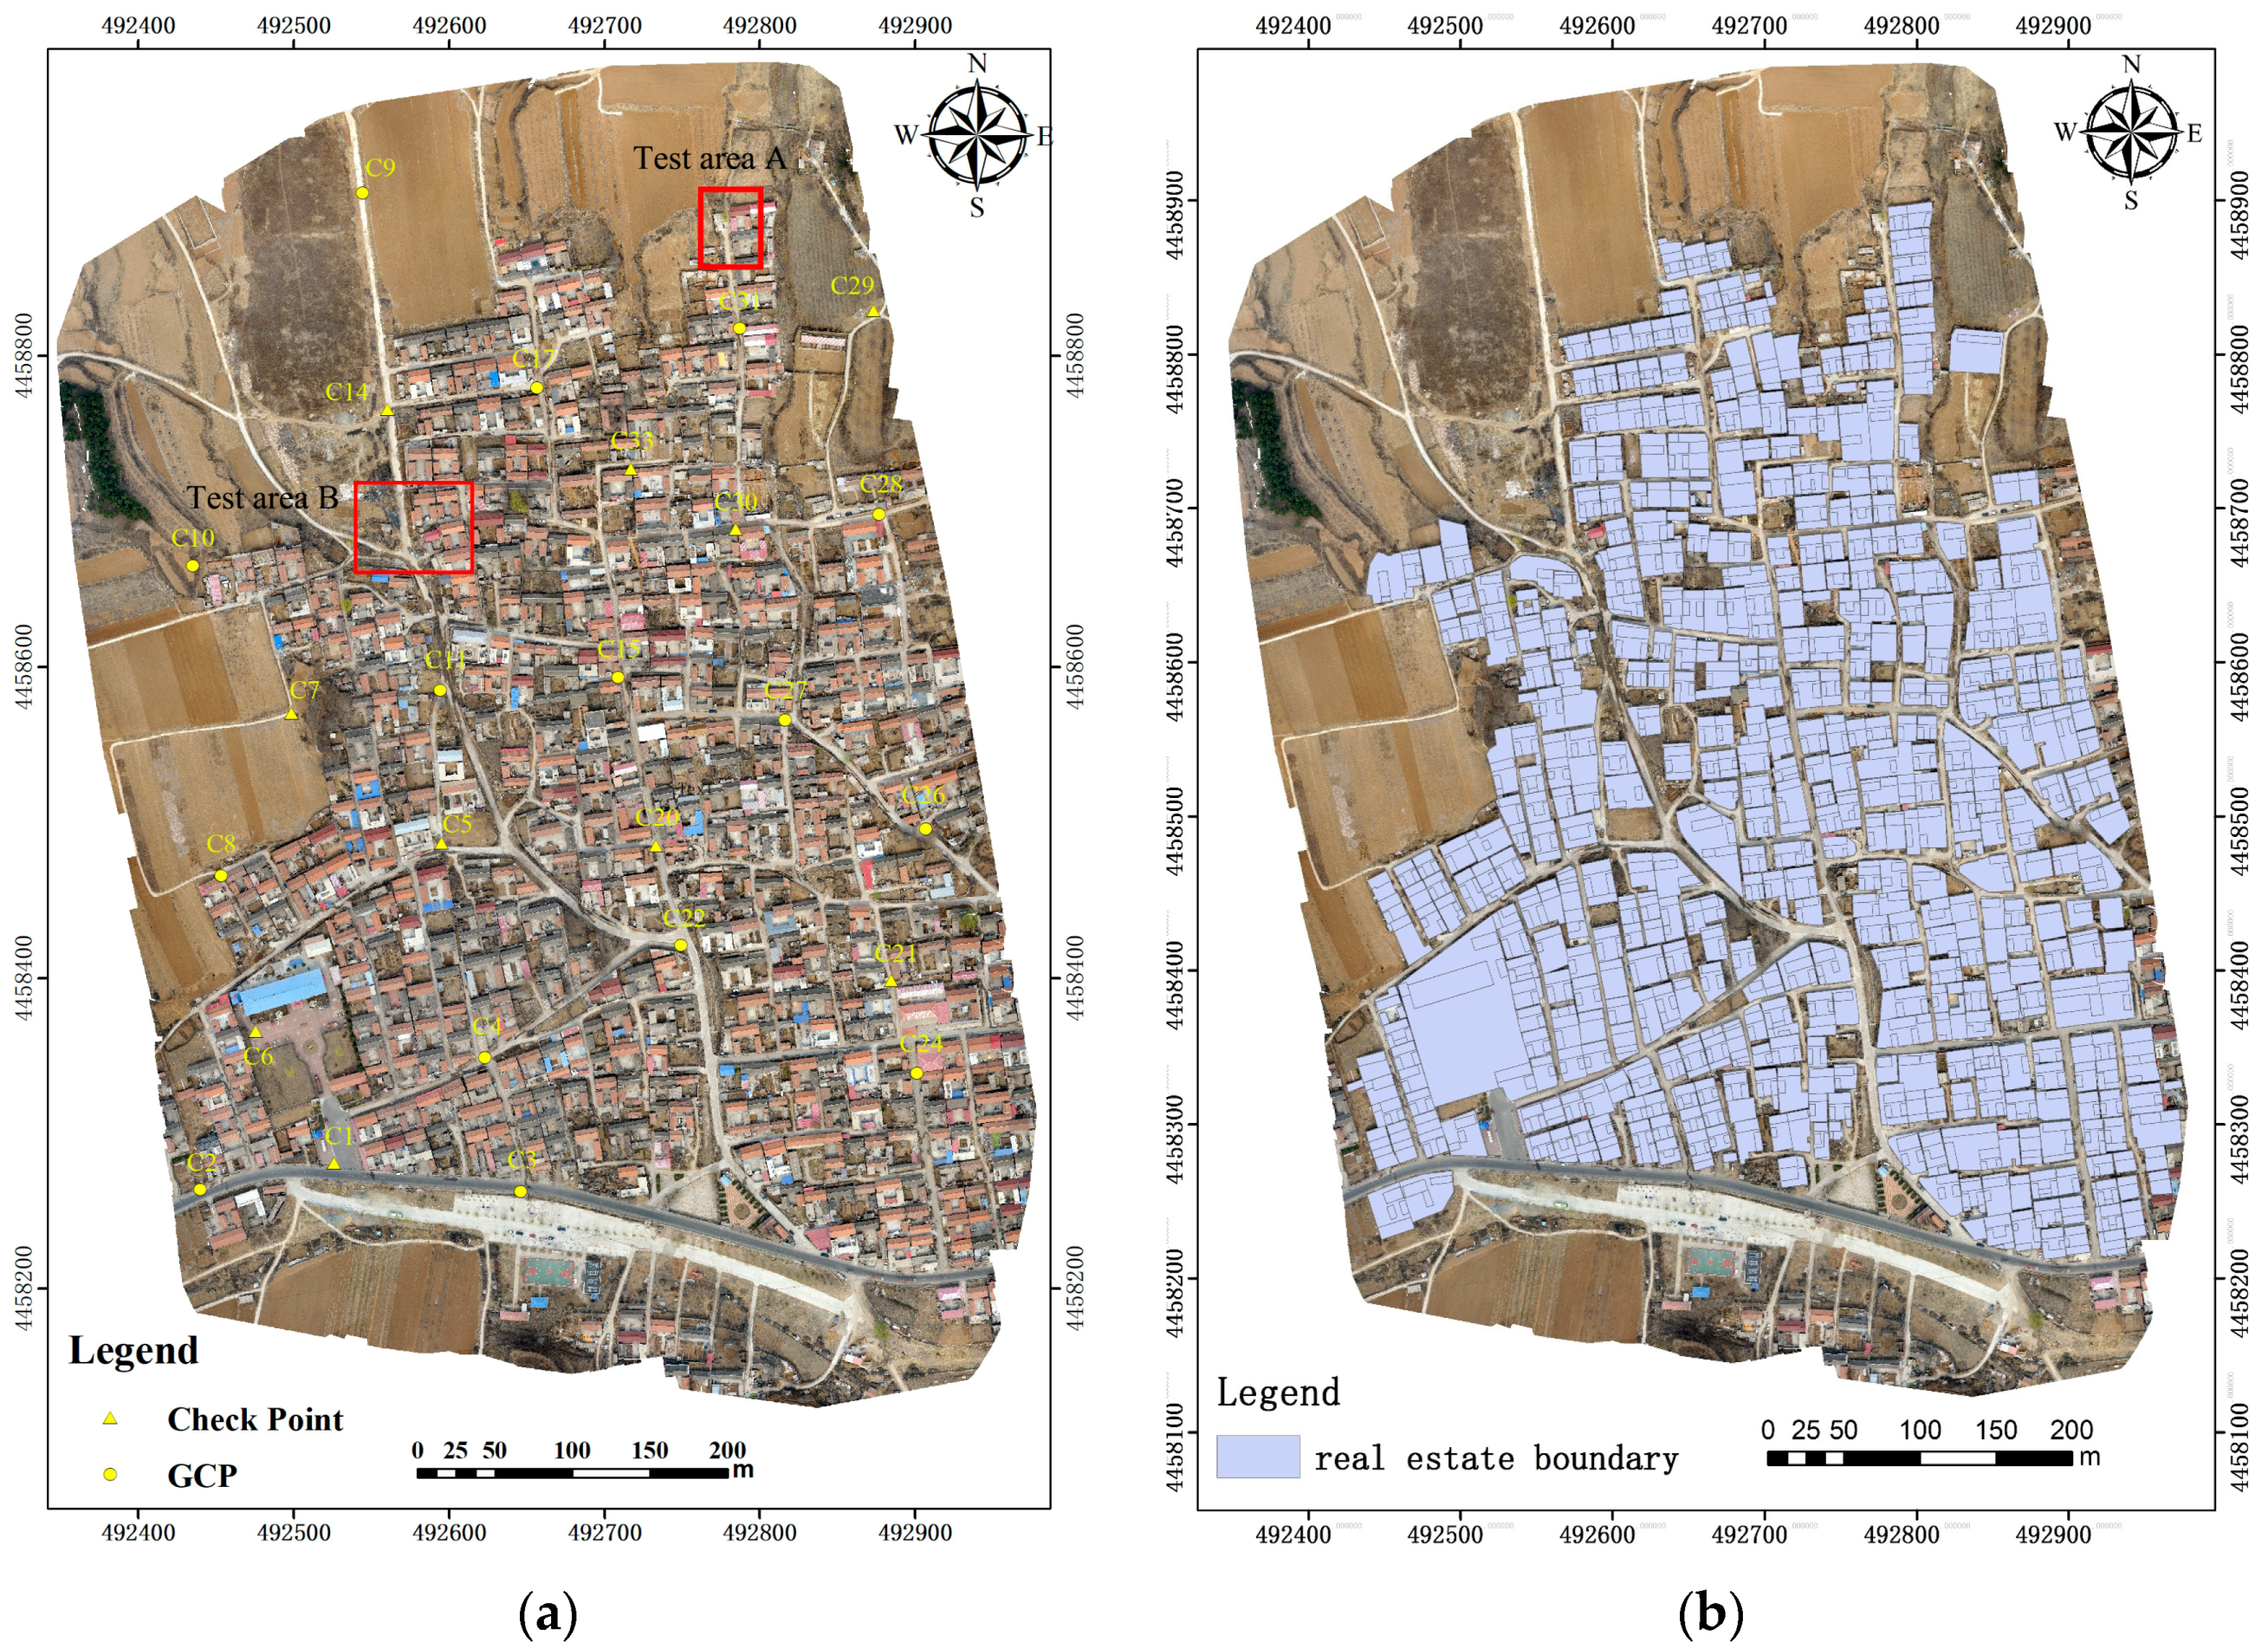
We used ground control point (GCP) data obtained by continuously operating reference station (CORS) method of georeferencing the data. Compared with the real-time kinematic global positioning satellite (RTK-GPS) method, the CORS-GPS method is more stable and reliable, which improves the accuracy to within 0.02 m [
38]. Before performing field observations, we used Google Earth to establish 15 control points and 10 checkpoints that were randomly distributed within the village survey area: along the main road, at road interchanges, at housing inflection points, and in farmland. We used a CORS method to collect GCP data, using the STONEX SC200 high-performance CORS receiver. We established the ground CORS base station, employing a mobile hand-held GPS to measure the coordinates of each control point and checkpoint data. The CORS method used GLONASS and BeiDou GNSS positioning, the root-mean-squared error (RMSE) of the CORS method was within 0.02 m, and the coordinate system was WGS84.
3.1.3. Flight Plan and Data Collection
Route planning was completed using the software RockyCapture version 1.22 (
http://www.rockysoft.cn) of the DJI UAV system. The survey area was 0.3 km
2, 701 m long, and 330 m wide. The route design comprised two flights, 10 planned routes, and a serpentine line. The flight height was 160 m above the ground, the designed ground sampling distance (GSD) was 1.6 cm, the planning overlap rate was 80%, the side overlap rate was 60%, the exposure interval was 2 s, and each flight lasted 12 min. Aerial photography was performed under sunny, cloudless, and breezeless weather conditions. A total of 460 images were taken.
3.2. SfM Algorithm and Point Cloud Generation
With recent advances in computer vision technology, SfM and multi-view stereo (MVS) algorithms have been successfully applied to UAV image processing to generate high-precision DSMs and DOMs. In this study, we used a total of 460 high-precision images and 15 GCPs were obtained from the flight, and the control point data were identified in the images. Using the coordinates assigned by the control point data and the image feature points containing these control points, the software retrieved and matched the same feature points in the two images, restored the position and altitude of each image camera exposure, and the image position in the air, and showed the motion. The software illustrated the trajectory and the 3D position of the ground feature points, which formed a sparse 3D point cloud. Geometric reconstruction based on MVS algorithms can produce more detailed 3D model with 15 GCPs to improve the absolute accuracy of the models. The DSM grid-generated 3D model used a map projection of WGS84 UTM 50 N. The original image was projected onto the DSM, and the image texture was mixed in the overlapping area to produce a digital orthophoto image of the entire area.
We used Pix4Dmapper Pro-Non-Commercial version 2.0.83 (
https://pix4d.com) to process the image data. The processing settings were as follows: key points image scale: full; point cloud densification image scale: 1/2 (half image size); point density: optimal; minimum number of matches: 3; matching image pairs: aerial grid or corridor; targeted number of key points: automatic, rematch: automatic; set generate 3D textured mesh; maximum number of triangles: 1,000,000; texture size (pixels): 8192 × 8192; point cloud format: LAS; 3D textured mesh format: OBJ. We used an inverse distance weighted (IDW) method to generate DSMs. For DSM filters, we used sharp noise filter and sharp surface smoothing. The following software environment was used: CPU = Intel(R) Xeon(R) CPU E3-1240 v5 @3.50 GHz; RAM = 20 GB; GPU = NVIDIA GeForce GTX1060 6 GB; operating system = Windows 10 Pro, 64-bit.
3.3. DSM Revision
The DSM contains land cover surface height information, such as ground-level buildings, bridges, and trees. While the DTM represents terrain (land surface) information the DSM represents the land cover surface. Additionally, though DEMs contain height information, normally of the terrain, the DSM is in fact a type of DEM that reflects the surface features of all objects located on the ground, to more accurately and intuitively express geographic information. The DSM can also be modified to restore the tilt of buildings. We used DSM instead of DEM to generate DOM results with more surface information.
We manually classified and edited the generated point cloud to obtain a higher quality DSM, and then used the DSM to generate the DOM in Pix4D. We classified the point clouds to remove vegetation, especially vegetation that exceeded the height of buildings. For the buildings, we referred to the original UAV image or the existing topographic map to modify the boundary of the upper building surface. The boundaries of buildings were manually drawn in point clouds.
Figure 4a illustrates how the top surface of each building was drawn by connecting control points. All building heights were higher than the ground surface. In
Figure 4b, the surrounding ground surface was drawn manually, ensuring a consistent ground level. We regenerated the DSM after drawing these boundaries to enhance their precision and clarity. This had the effect of also improving the accuracy and clarity of the corresponding DOM building boundaries, thereby reducing, or even eliminating, the double-projection phenomenon. Finally, we smoothed and de-noised the DSM, and the high-precision DSM was manually revised for parts of buildings that were heavily sloped and sheltered.
3.4. Multi-View Image Texture Compensation and TDOM Accuracy Evaluation
An aerial image was used to transform the central projection into orthograph-projection and to obtain the orthophoto image. An image correction method was used to achieve the correct transformation between the two projections. In this study, we used the digital differential correction method [
39]. The principle is to correct the digital image by pixel differentials (i.e., according to the known directional element and DEM of the image, and according to a certain digital model with the control point settlement). The process individually corrected many, very small areas the size of a pixel.
We used manual multi-view image compensation to compensate for the texture of the shaded areas in Pix4D (
Figure 5). Masked areas were manually drawn. The adjacent images including the masked area were selected for manual sorting. The sorting method was based on the degree of shading and orthorectification. The masked area camera exposure location for multi-view was shown in
Figure 5b. Masking area fill-in work was performed one-by-one. To avoid the adjacent image also having a shaded area, occlusion analysis was performed on the first adjacent image after sorting. If the first adjacent image was not shaded, texture compensation was performed; otherwise, texture compensation was not performed, and shadow detection was performed on the next adjacent image. This process was repeated until a suitable adjacent image was obtained to compensate for the texture, and a TDOM was generated with all shadows eliminated. As a result, the buildings maintained a vertical viewing angle, showing only the top of the buildings.
After TDOM was generated, we calculated Root Mean Square Error (
RMSE) to evaluate the accuracy of the TDOM, we can get the coordinates (
x,
y,
z) of check points which were well seen on the TDOM in Pix4D, and the coordinates (
x,
y,
z) of these check points measured in the field. the
X-direction error, the
Y-direction error, the plane error, and the elevation error were calculated using Equations (2)–(5):
where
RMSE is the error,
XOi,
YOi, and
HOi are the value measured in the field,
XGPSi,
YGPSi,
HGCPi are the coordinates obtained from the TDOM in Pix4D, and
n is the number of checkpoints.
4. Results and Discussion
4.1. Point Cloud Evaluation
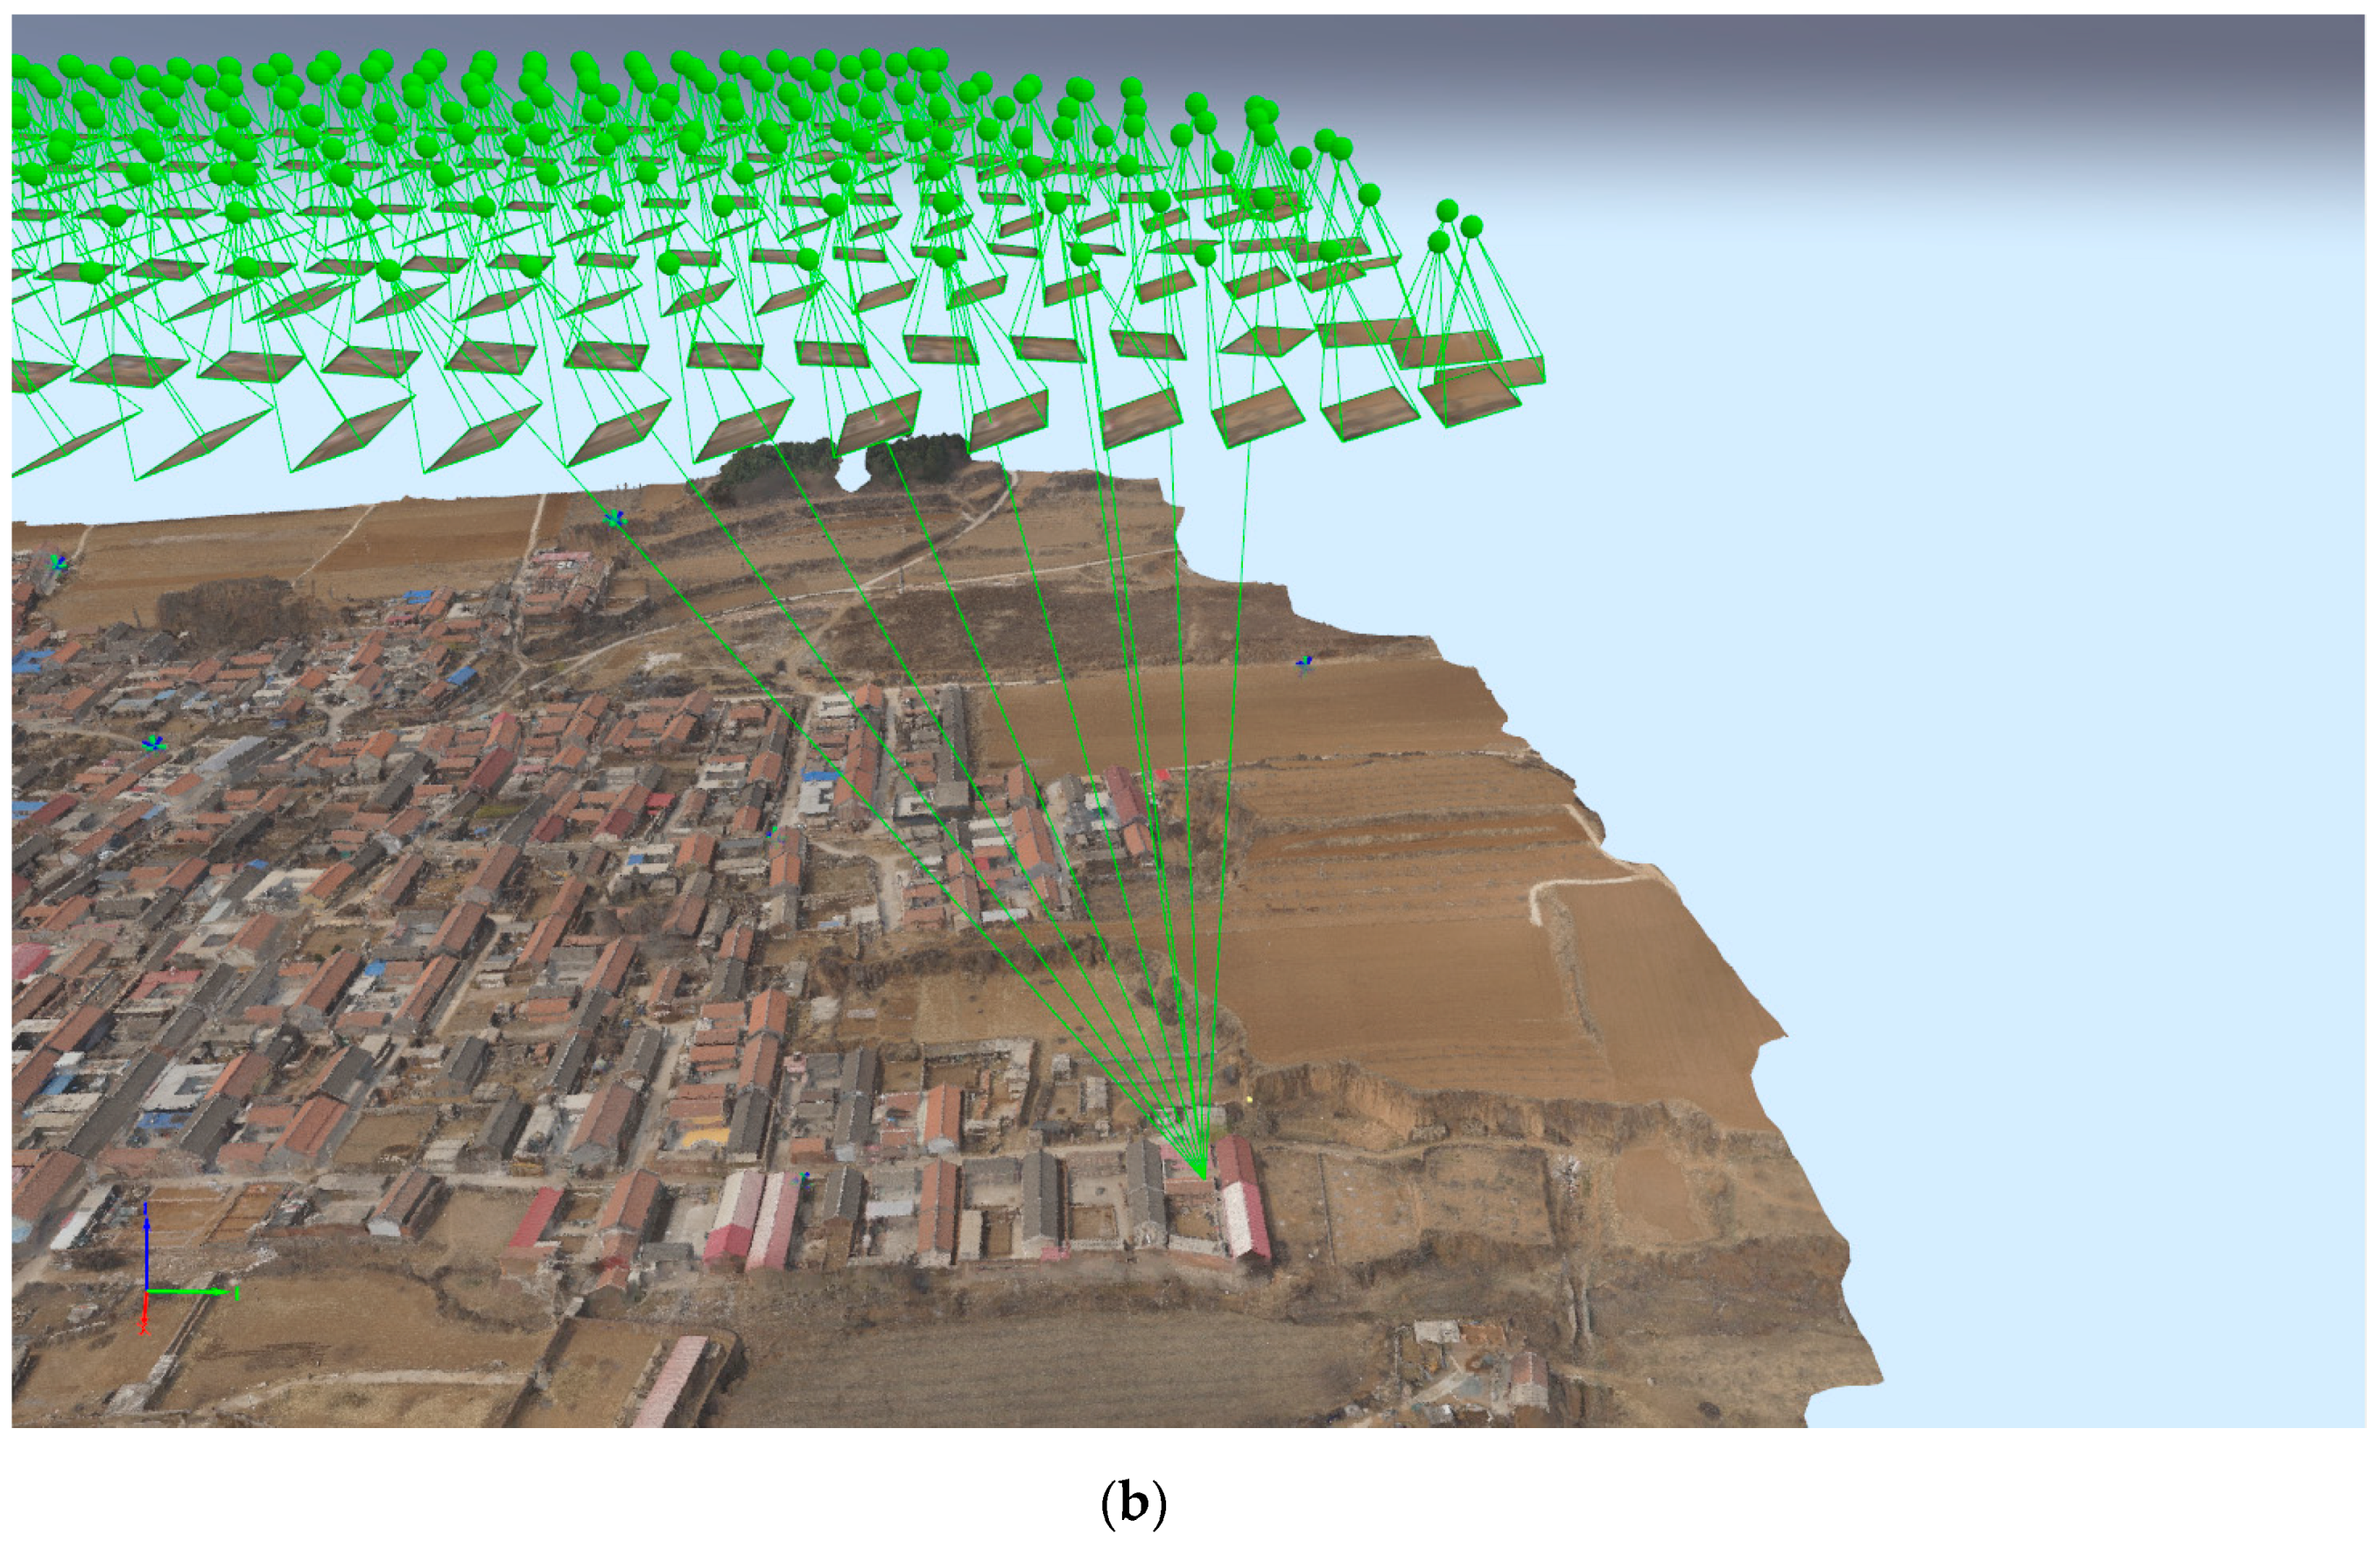
A SfM algorithm was used to restore the camera exposure position and motion trajectory, thereby generating a sparse point cloud. The sparse point cloud was then used for camera calibration, and an MVS algorithm was used to generate a dense point cloud, according to the DSM generation method using reverse distance weight interpolation. The photogrammetric block was processed in Pix4D with the number of 2D key point observations for bundle block adjustment = 12,842,781, number of 3D points for bundle block adjustment = 4,604,850, and mean reprojection error of 0.241951 pixels.
Figure 6a shows that, by using the SfM with feature point matching, we can restore each image camera exposure position and UAV trajectory and densify the sparse point cloud. The 3D point clouds contained approximately 154.88 million points, with an average of 592.85 points/m
3. The 3D point cloud data were used to create a mesh network model, and then the inverse distance weight interpolation method was used to generate the DSM, the sharp noise filtering and surface smoothing was processed for DSM.
Figure 6b shows the overlap of the DOM, with green areas indicating an overlap of more than five images for every pixel. Our study area is green except for the borders, indicating a high degree of overlap. In general, these methods will generate high-quality results so long as the number of key point matches is also sufficient. Red and yellow areas in
Figure 6b indicate low overlap for which poor results may be generated.
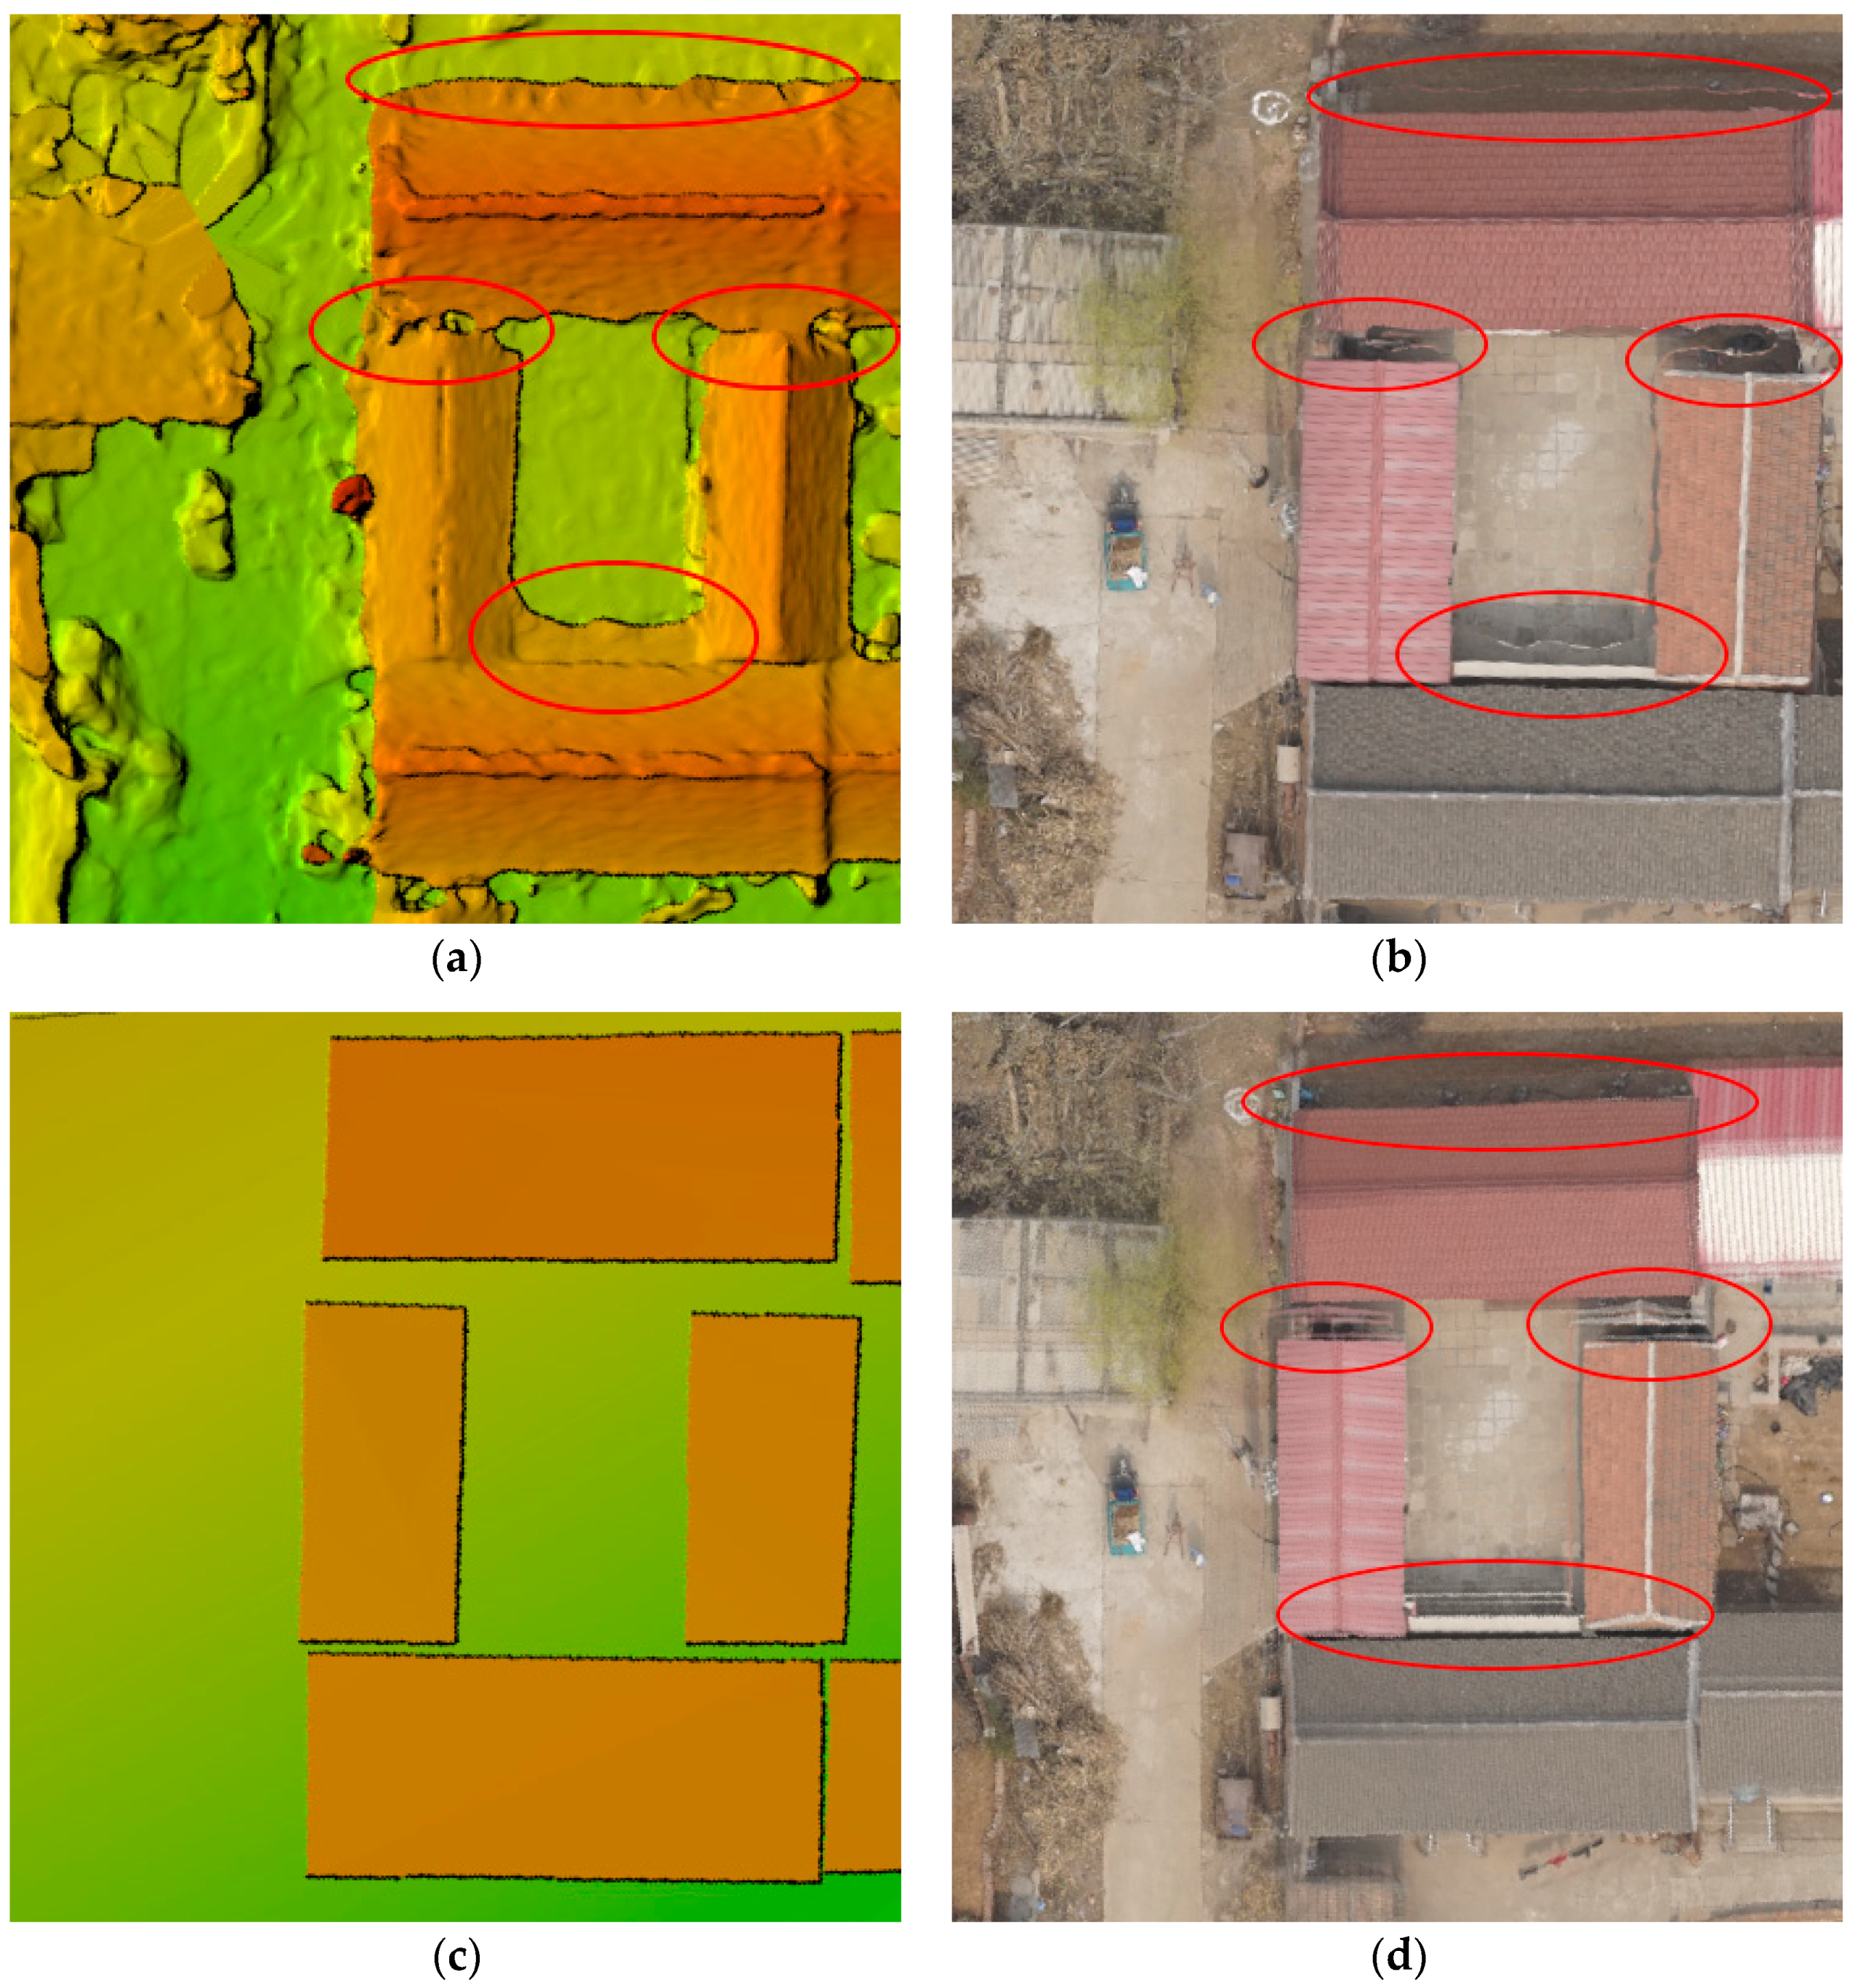
4.2. DSM Revision and TDOM Ortho-Rectification
Figure 7 shows the original DSM, original DOM, revised DSM, and the DOM generated by the revised DSM, illustrating building outline contours without the tilt obscured. The generated DOM also reduces tilting and shading. A comparison of
Figure 7c with
Figure 7a reveals that the boundary contours of the four buildings in view are more precise and clearer and the ground height is unified in
Figure 7c.
Figure 7b shows the DOM generated by the original DSM in which, due to the double projection of the DSM caused by shadowing within the red circles, there is also a double projection within the red circles in the DOM that generated
Figure 7b.
Figure 7d is the DOM generated by the revised DSM and, as can be seen in the red circles, due to the double-projection phenomenon, double projection of the DOM is essentially eliminated (red circles). Partial elimination of the left and right red circles in the original dual projection may be due to the ground point cloud requiring further processing. This problem can be solved by multi-view image compensation.
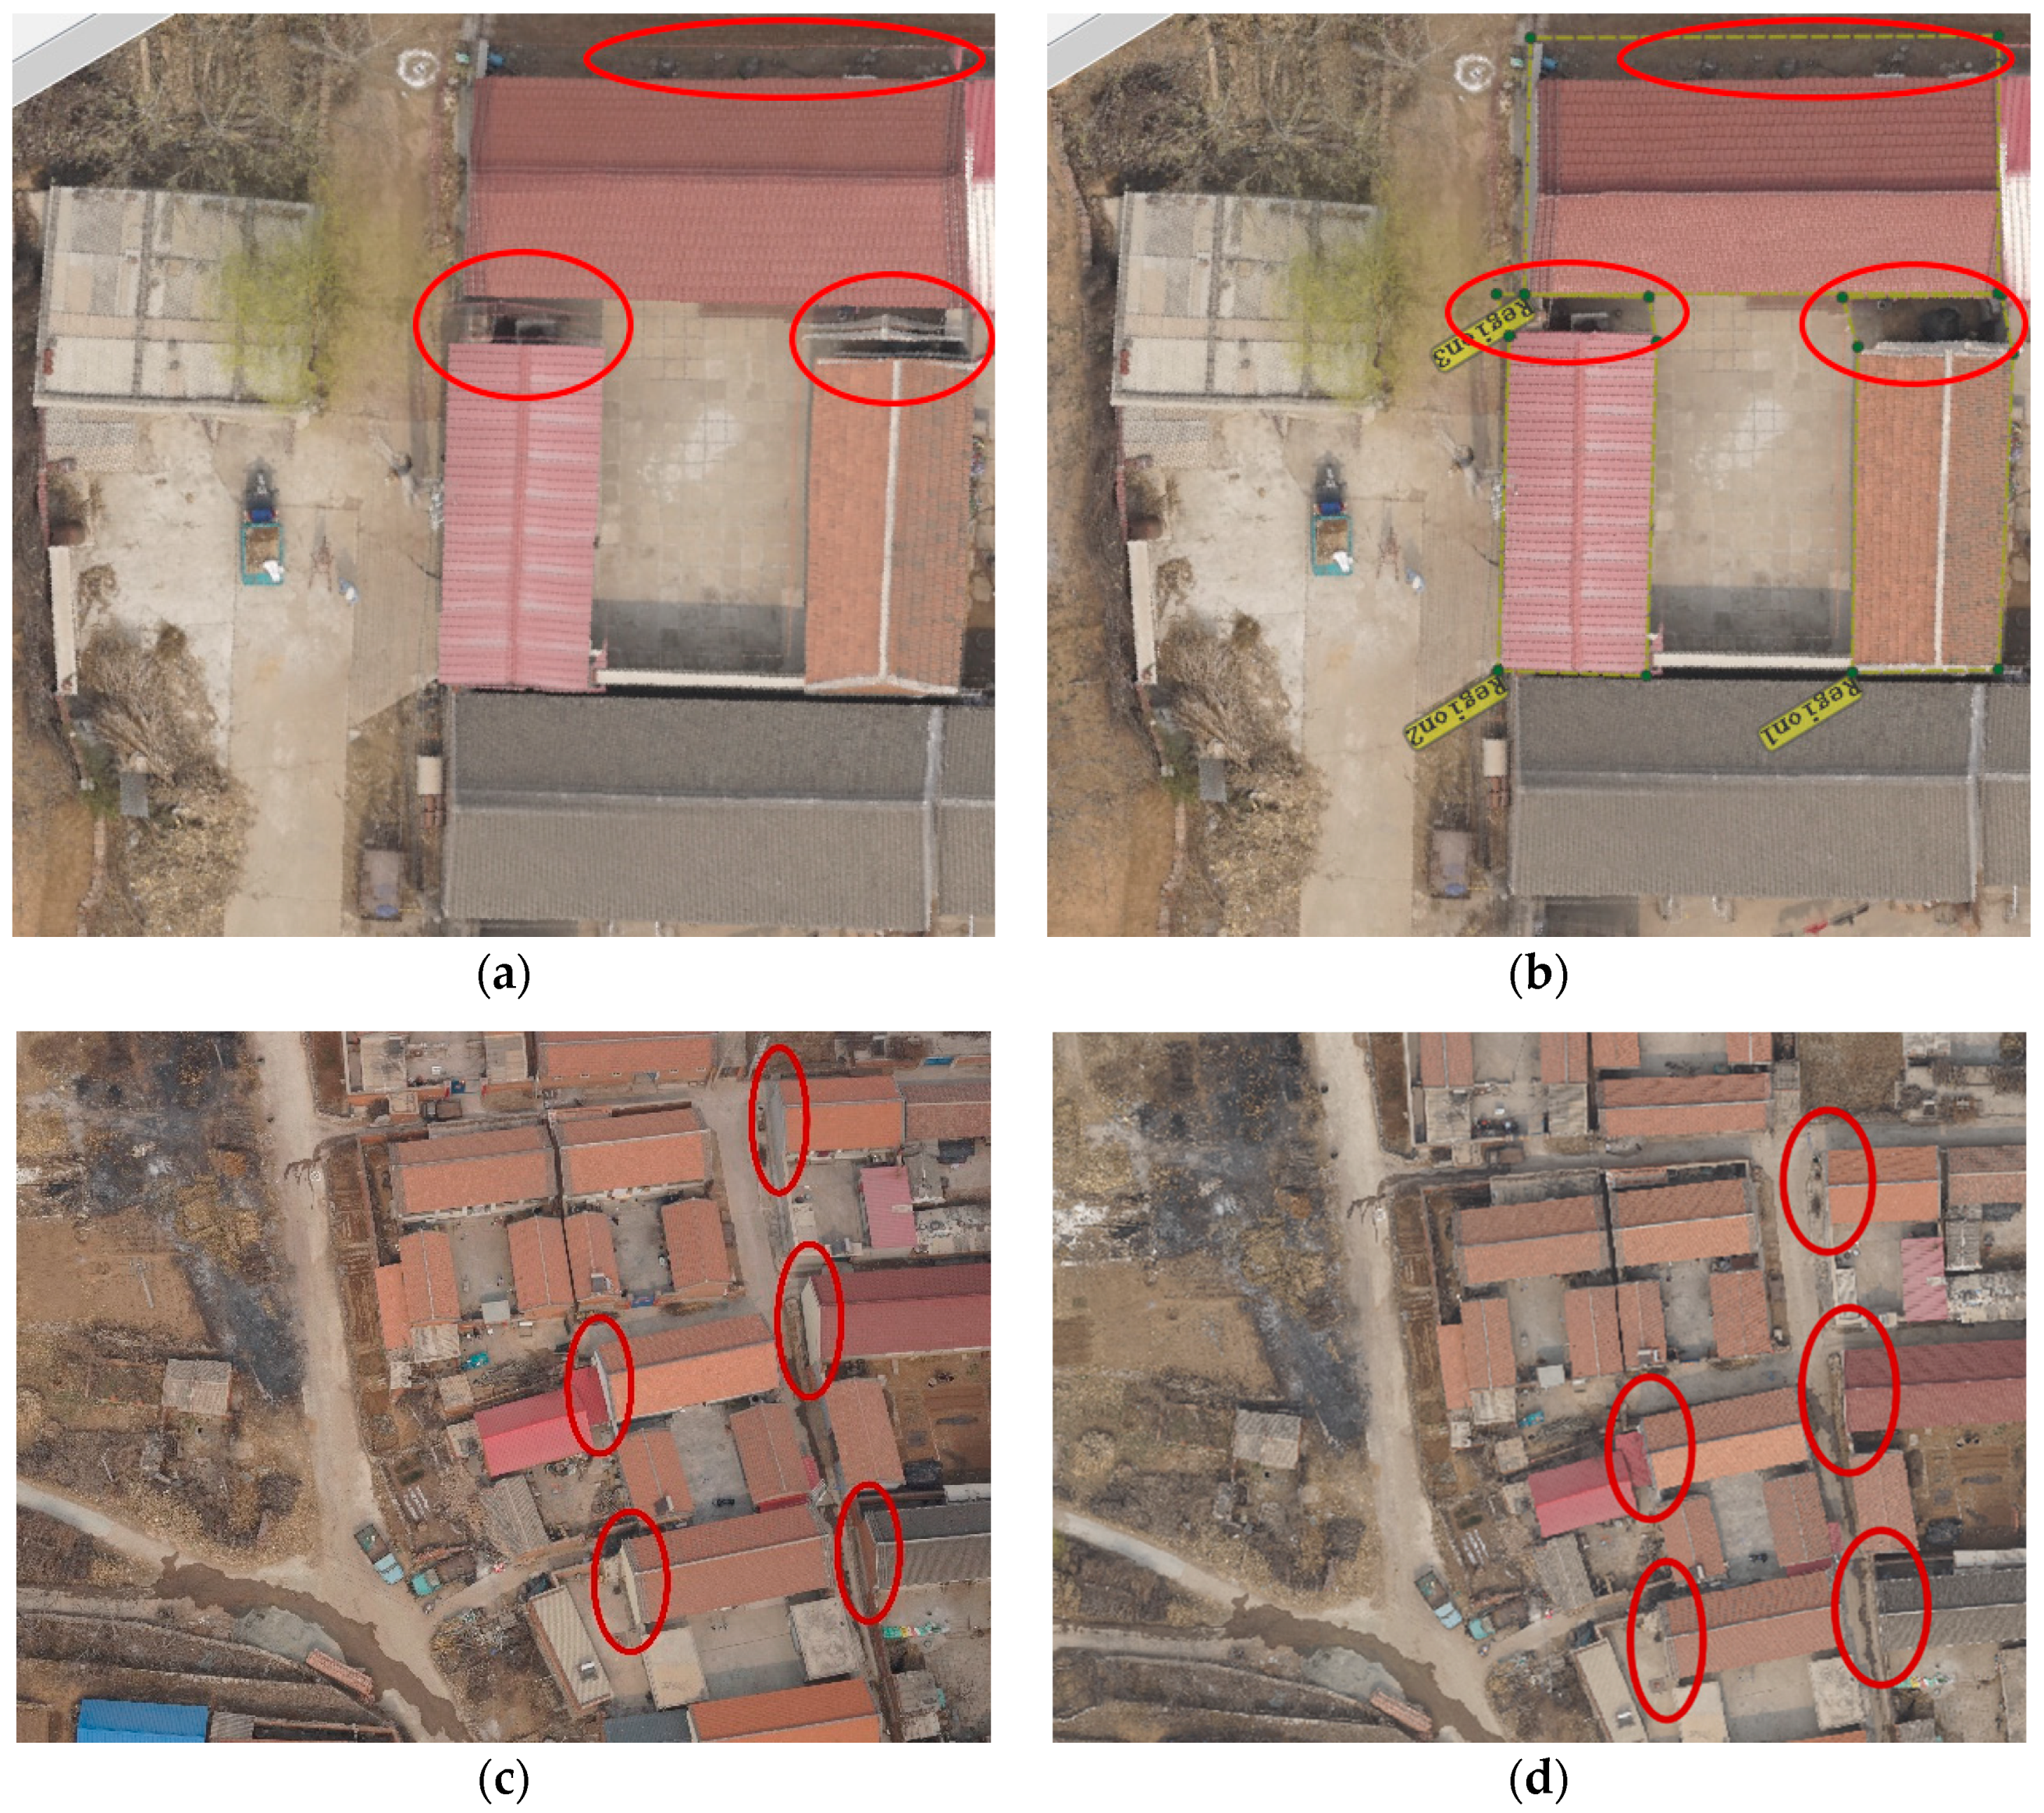
Figure 8 compares the original DOM and TDOM after multi-view image compensation for test areas A and B. It is clear that, after multi-view image compensation, the double projection shown in the red circle in
Figure 8a has been eliminated in
Figure 8b, and the vertical view has been restored. In
Figure 8c the buildings are mostly tilted, showing the sides of the houses; however, after the multi-view image compensation method has been employed, the internal structure has eliminated the tilt phenomenon and resulted in a completely vertical surface landscape (
Figure 8d). Only the top of the buildings are displayed in
Figure 8d, in which all side surfaces have been avoided, and oblique shadows have been avoided. Thus, through local tests shown in
Figure 2 (area A and area B), we find that the multi-view image compensation method can effectively eliminate the double shadow caused by obstructed shadows and eliminate the sides of buildings. This is, therefore, an effective method for solving the obstruction caused by obliquity. However, it should be noted that the test area was chosen to complete the masking compensation because it has a vertical viewing angle in the peripheral image that allows compensation.
4.3. TDOM Accuracy Evaluation
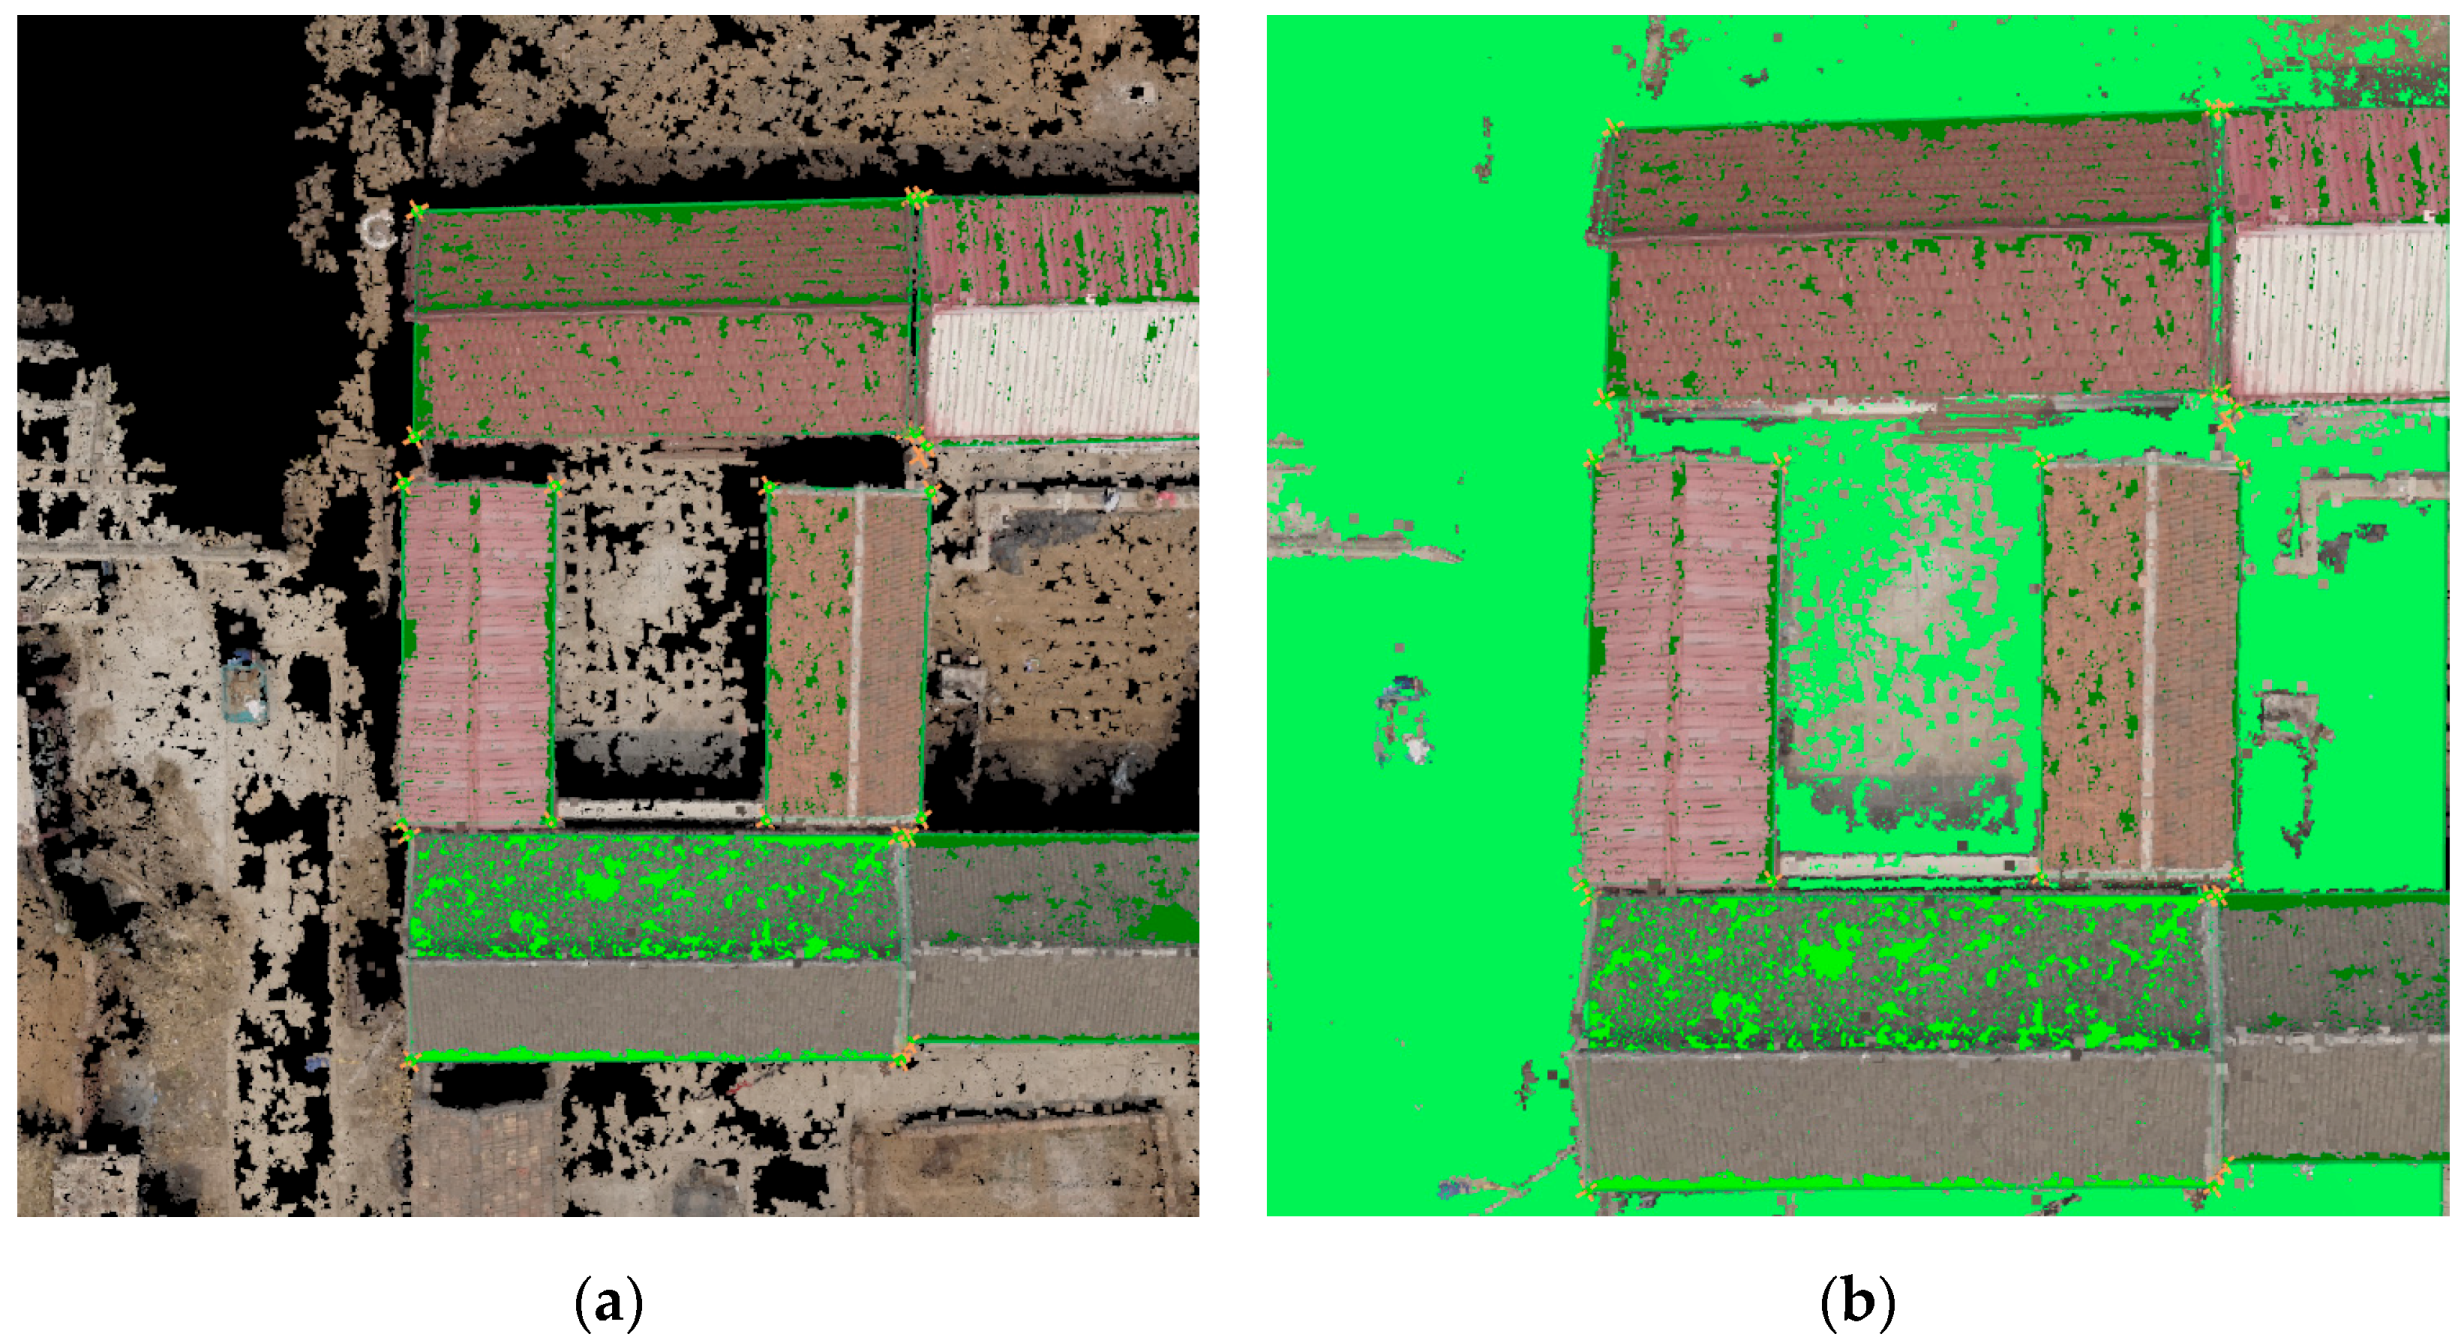
Figure 9a shows the final TDOM image, and ten checkpoints were randomly selected and compared with the field measurements (
Table 1). The maximum and minimum errors were 0.0674 m and 0.0173 m, respectively. The plane error of the TDOM checkpoints was 0.0365 m and the elevation error was 0.0323 m. The generated DSM and TDOM resolution was 0.0166 m. In the work of Uysal et al. [
13], the plane and elevation errors were both 0.062 m. Therefore, our method reduced the plane and elevation errors to <0.05 m. The “digital aerial photogrammetry aerial triangulation specification GB-T23236-2009”, which is a national standard valued in China TDOM accuracy evaluation [
40], is 7.1 at a scale of 1:500; this specifies plane and elevation error maximum limits of 0.175 m and 0.15 m, respectively. Our DOM checkpoint calculation results meet these requirements and are, therefore, of high quality.
4.4. Application of Rural Housing Site Confirmation
The generated TDOM may be applicable to confirming the boundaries of rural residential lands in Beijing. In recent years, China has implemented a nationwide registration of immovable property. An important step in registration is determining the authority of the real estate boundary, which is generally performed using traditional manual mapping. The use of UAV low-altitude remote sensing technology can greatly increase the efficiency, and accuracy of these maps, as well as reduce the costs, associated with producing them. Since confirming the boundaries of rural residential lands requires the determination of precise building boundaries, the boundary of the premises must be accurate, and there must be no lateral or oblique shadows, which reduce imaging accuracy, outside the roof area. This study generated high-precision TDOMs that eliminate the obstruction of shadows and could, therefore, be used to determine the boundaries of rural homestead sites.
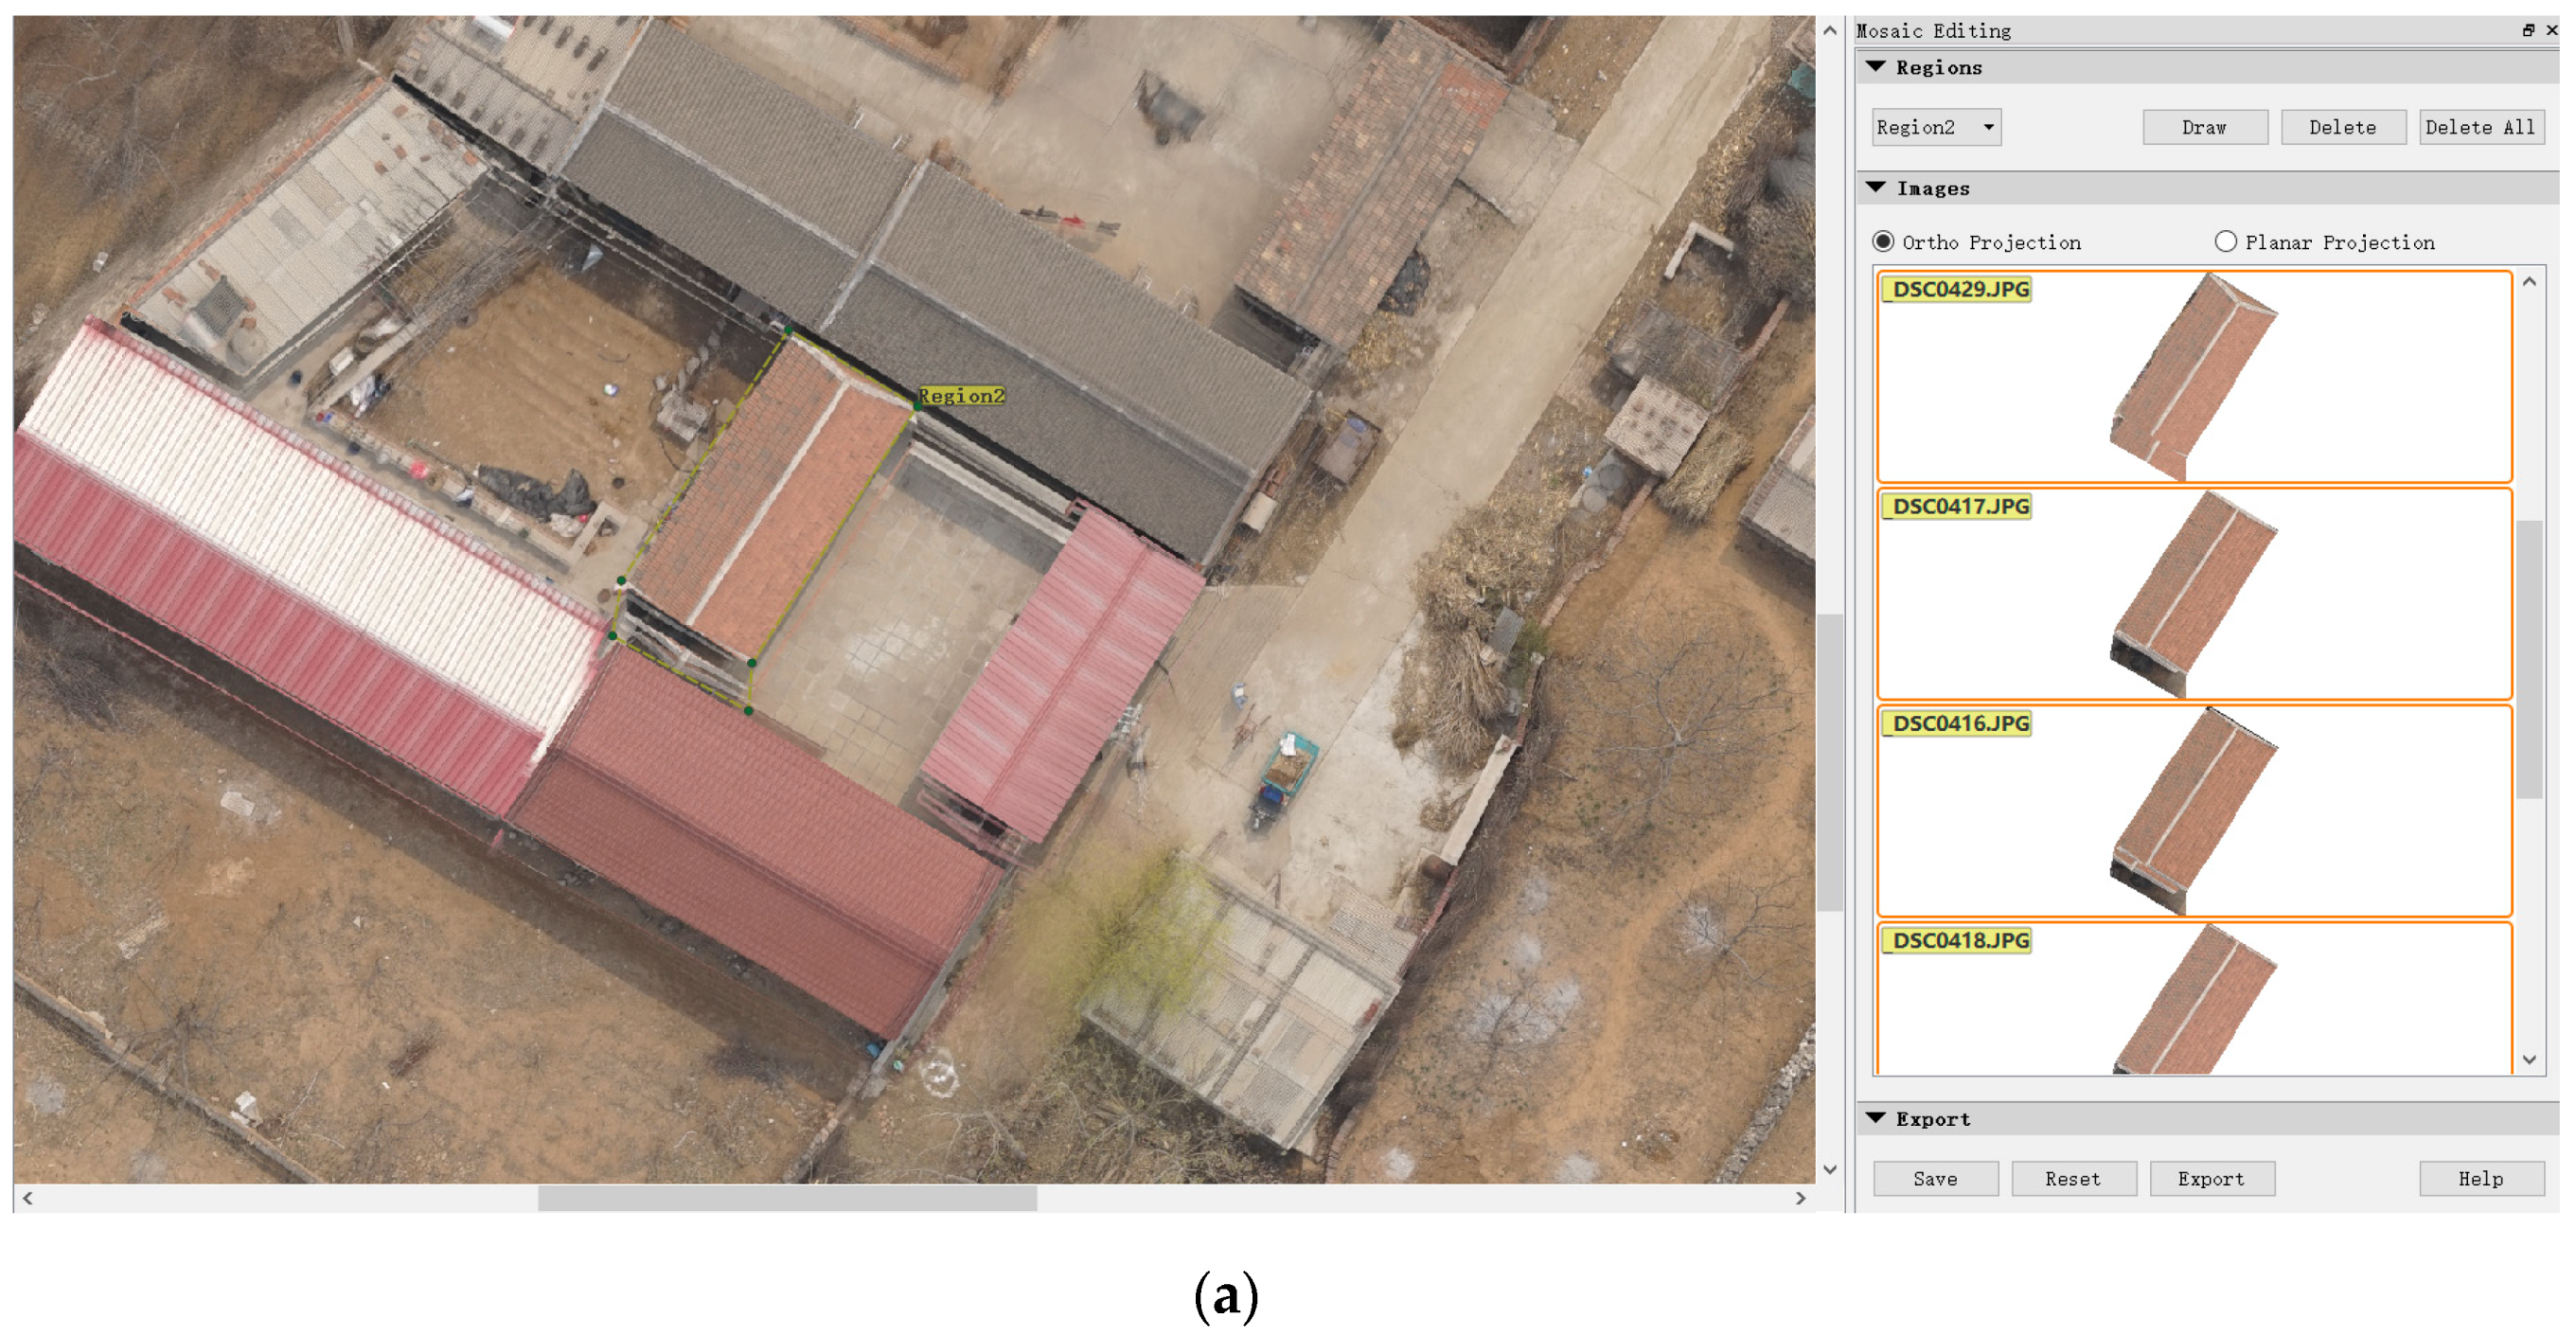
To illustrate the practical applications of the TDOM generated in this study, we vectorized roof footprints manually in ArcGIS 10.2. To achieve this, we referred to the housing boundary in the TDOM, in order to manually create the features for the top surface of the house and each household. The yards were also vectorized, and it was necessary to zoom in on the TDOM during the process to determine that the corner exactly matched the actual houses. The results of this experiment are shown in
Figure 9b.
5. Conclusions
In this study, we collected high-resolution professional camera images using a multi-rotor UAV in Xishaoqu Village, Miyun County, Beijing. Ground control points were established and measured using the CORS method. We used a SfM algorithm to calculate the camera exposure, camera calibration, and motion trajectory, and MVS intensive matching for generating the 3D point cloud model. High-precision DSMs and DOMs were generated from the point cloud. For shaded areas, we performed textural repair based on the DSM. The use of ortho-rectification in TDOM generation was found to effectively solve the traditional DOM center projection deformation issue, as well as the obscuring of terrain by oblique shadows. The TDOM produced had a high degree of accuracy: a plane error of 0.0365 m and an elevation error of 0.0323 m, and the generated DSM and TDOM resolution was 0.0166 m. Thus, our results improved on the “digital aerial photogrammetry aerial triangulation specification GB-T23236-2009” 7.1 at a scale of 1:500, which has maximum limits for plane and elevation errors of 0.175 m and 0.15 m, respectively. As the confirmation of the boundary of rural residential land requires the recovery of precise building boundaries, our methods, which exceed the accuracy required by national standards, may provide a new tool for mapping rural land areas. Using UAVs to collect images and generate TDOMs can greatly reduce the workload related to field-based measurements and improve the accuracy of Beijing real estate registration. Furthermore, the generated TDOM may be widely applicable to land planning, precision agriculture, desertification monitoring, land use surveys, and rural housing registration.


