Abstract
In the last decade, citizen science (CS) has seen a renewed interest from both traditional science and the lay public as testified by a wide number of initiatives, projects, and dedicated technological applications. One of the main reasons for this renewed interest lies in the fact that the ways in which citizen science projects are designed and managed have been significantly improved by the recent advancements in information and communications technologies (ICT), especially in the field of geoinformatics. In this research work, we investigate currently active citizen science projects that involve geoinformation to understand how geoinformatics is actually employed. To achieve this, we define eight activities typically carried out during the implementation of a CS initiative as well as a series of approaches for each activity, in order to pinpoint distinct strategies within the different projects. To this end, a representative set of ongoing CS initiatives is selected and surveyed. The results show how CS projects address the various activities, and report which strategies and technologies from geoinformatics are massively or marginally used. The quantitative results are presented, supported by examples and descriptions. Finally, cues and critical issues coming from the research are discussed.
1. Introduction
Citizen science (CS) is currently arousing a great deal of interest from both the public and the scientific community. This is due to the unprecedented potential offered to CS by information and communications technologies (ICT), at a more rapid growth rate and at a larger scale than ever before. In fact, the Internet, smart mobile devices, global navigation satellite system (GNSS) sensors, broadband networks, cloud computing, and service-oriented and distributed-processing architectures are widespread technologies that are available for use. Additionally, geoinformatics is a mature discipline offering a geoenabling framework for the aforementioned technologies, benefiting those CS projects that are most sensitive to the geographic dimension of data. An investigation of the current state of the application of geoinformatics to CS is necessary to better understand the phenomenon as well as to envisage possible evolutions and challenges. This is the main objective of the present work, and is addressed by (i) defining a representation framework for the analysis of CS projects; (ii) collecting a significant set of CS initiatives; and finally (iii) examining the sample projects according to the proposed framework. In the following two subsections, we recall the notion of geoinformatics and cite literature dealing with CS characteristics.
1.1. Geoinformatics: A Tentative Definition
Geoinformatics is a term that was introduced in 2000, referring to the words “geo” (i.e., “geospatial”), and “informatics” (which stands for “information science”). It focuses on geoenabling modern information technologies (e.g., databases, decision support systems, the Internet), communication technologies (e.g., wireless networks, cell phones), and interconnection solutions (e.g., protocols, standards, compatibility, interoperability) [1]. In Figure 1, a diagram taken from the Geoinformatics Laboratory of Pittsburgh University shows the main components of the discipline. Geoinformatics is often misunderstood as geomatics. The term geomatics was first coined in 1981 by Michel Paradis, a Canadian photogrammetrist. It refers to “geo”, which stands for “geodesy”, and “matics”, which stands for “mathematics” [1]. It is an engineering discipline using mathematics and engineering for geodesy and mapping. It embraces the more specific disciplines of surveying, geodesy, photogrammetry, remote sensing, cartography, and positioning.
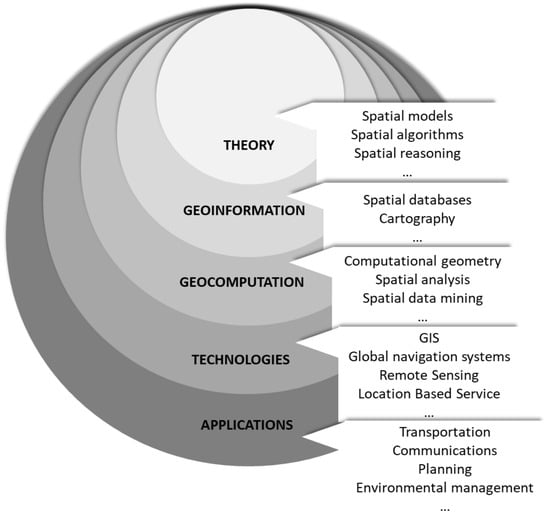
Figure 1.
The traditional representation of the geoinformatics layers (from reference [2], modified). GIS: geographical information systems.
Geoinformatics saw a widespread diffusion after the introduction of the Digital Earth concept [3] and the evolution in the use of geographic content by the technological sector and by society at large. The diffusion of digital globe geo-browsers (e.g., NASA World Wind, Google Earth, and Microsoft’s Bing Maps), together with an increase in the availability of satellite data, mobile devices, and navigation systems have been part of a digital revolution of geography. The interest in Digital Earth itself hence increased, with the introduction not only of enabling tools and technologies, but also of new concepts and perspectives, put forward by an international group of scientists [4] under the umbrella of Next-Generation Digital Earth. This vision fostered several important activities, also dedicated to education, such as the Vespucci Initiative for the Advancement of Geographic Information Science. In this framework, one of the key developments—in addition to geo-browsers, sensor networks, and spatial data infrastructures—is represented by volunteered geographic information (VGI) [5]. Geographical and Earth sciences are currently increasingly relying on digital spatial data acquired from smart phones, social media application programming interfaces, and remotely sensed images, analyzed by means of geographical information systems (GIS) or cloud-based applications, and distributed through complex infrastructures to target an ever-increasing variety of users. The technologies supporting these processes are at the core of current geoinformatics topics. On the one hand, all of the aforementioned changes and related technologies have familiarized citizens with geographic information, and on the other hand, they have changed their role from mere consumers to producers of geographic content.
All of these developments and progresses led to the so-called neogeography [6] to crowdsourced geographic knowledge, and, when created by a community of amateurs for scientific purposes, to geographic citizen science [7]. A good state-of-the-art as regards to data type, definitions, models, trends, and relationships with CS and VGI can be found in reference [8]. CS projects make use of VGI exploit geoinformatics, as we discuss in this paper, and thus need functionalities and strategies for geo-data acquisition, validation, storage, management, analysis, and portrayal, among others.
1.2. Reference Framework
CS is currently a hot topic, as proved by the literature, with several journals’ Special Issues dedicated to the technologies adopted in different application domains (e.g., sustainability [9], public health [10], disaster management [11], geoweb [12]), and a growing number of papers [13] and projects. There are dedicated university courses and classes, seminars, conferences, and educational activities in general (e.g., Conference on Human Factors in Computing Systems, and the Conference on Computer Supported Collaboration and Social Computing, both sponsored by the Association for Computing Machinery). It is also worth mentioning the establishment of national and international initiatives (e.g., the white paper of CS for Europe, the USA government website on CS [14]), as well as the creation of associations (e.g., the American, European, and Australian CS associations, SCA, ESCA, and ASCA [15]), and of international groups of scientists. Finally, the European Commission has founded the Citizen Science COST Action CS-EU-CA-15212 [16] to promote creativity, scientific literacy, and innovation throughout Europe. It explores the potential transformative power of CS for smart, inclusive, and sustainable ends, and provides frameworks for the exploitation of the potential of European citizens for science and innovation. Within this initiative, motivated by the great heterogeneity of CS projects, a working group (Working Group 5—Improve data standardization and interoperability) is dedicated to improving CS data standardization and interoperability. The aim is to define an ontology for CS projects and for the data they created in order to enable CS data sharing and reuse.
The literature regarding the plethora of CS projects and their description is massive. Here, we focus only on those papers dealing with the categorization and analysis of CS, not on the papers describing single initiatives. A few papers have aimed at organizing and providing a reference framework for CS. To this end, they have introduced schemes and models for defining it and describing its characteristics [7,17,18]. Many best practices and guidelines for the implementation of projects have been proposed [19,20,21]. This is particularly important because CS is a multi-disciplinary domain including several different sectors ranging from ecology to social sciences, as outlined in reference [22], where the authors identified common terminology used in CS initiatives, particularly as related to different types of CS contexts. Although CS is a broad domain, very often, CS activities involve tools and processes which properly belong to geomatics, geography, and geoinformation in general. This paper focuses only on the branch related to geoinformatics. Geoinformatics and CS feature a mutual relationship and positive feedback. In principle, geoinformatics can, on one hand, provide CS with powerful tools and structured methodologies for geodata handling at all levels, potentially introducing a revolutionary spread of CS initiatives. On the other hand, CS can offer interesting use cases, asking for solutions in terms of user experience/interaction, publications and sharing, interoperability, semantic awareness, and the management of big, heterogeneous, incomplete, uncertain, and non-authoritative spatial datasets.
A reference work for the present study was reference [23]. Its perspective is broad, since it examines the past, present, and future of CS in terms of its research processes, program and participant cultures, and scientific communities. This paper, published in 2012, emphasizes the potential of emerging technologies in empowering CS projects. It foresees networks, open science, and the use of online computer/video gaming as important tools to engage non-traditional audiences. It stresses the role of mobile applications (apps), wireless sensor networks, and gaming as promising for advancing citizen science. Gaming genres include alternate- and augmented reality games, context-aware games, and games that involve social networking. It states that the use of these technologies will enhance the ability of scientists and practitioners to centrally consolidate scientific information across projects, promote collaborative writing, and create virtual forums and communities.
2. Materials and Methods
We set up our analysis framework and experimental evaluation methodology in order to consistently analyze the wide variety of CS projects from a geoinformatics perspective. We first identified the main activities that take place during the implementation of a CS initiative. For each activity, we identified the principal approaches that can be adopted for its accomplishment. The main activities and related approaches are detailed in Section 2.1. Once the analysis framework was set up, we selected a list of representative CS projects in terms of typologies, scientific domain, and features (this activity is described in Section 2.2). After pruning the initiatives that were not compliant with some criteria from the list (detailed in Section 2.2), we analyzed the remaining ones following the evaluation methodology, hence, by activities and approaches.
2.1. Schema of the Categorization
In this section, we describe the eight activities identified and detailed by means of a set of technical features which implement the distinct approaches. Such features are not limited to technologies for handling geoinformation, but, as far as possible represent, all the aspects covered in an operational CS project.
2.1.1. Recruitment
The recruitment of volunteers is often an awkward task. Some initiatives directly target small groups of experienced—or already trained—volunteers. Many other projects rely on a generic crowd of voluntary participants (crowd-sourcing). Different approaches and technologies are thus needed, depending on the number of participants, the foreseen participants’ preparation, their technological skills, age, geographical provenance, etc. In this research, we considered seven possible recruitment approaches that can be applied individually or in combination. While some approaches have been adopted from the very beginning of citizen science (e.g., recruitment within gentleman associations or scientific networks), some others are quite novel, such as those exploiting Web 2.0 technologies. The main identified approaches were the following:
- Project website-based: This happens when the broadcast of the initiative and the opportunity to join it are mainly entrusted to a project-dedicated website;
- Smart app-based: The opportunity to join to the CS project is offered by means of a mobile application connected to the Internet;
- Web platform-based: The initiative is promoted and supported by thematic web platforms or multi-project websites. Users and visitors of the platform are informed of the existence of many ongoing initiatives. Sometimes they are assisted in selecting suitable initiatives (e.g., based on the user preferences or location) and encouraged to take part. Sometimes the web platform also takes charge of data collection, management, and access, as well as user interactions;
- Social media-based: The use of social networks is the channel to encourage recruitment of volunteers;
- Local facility-based: Participation is not promoted on the web, but in real locations. This typically occurs when visitors of museums, natural oases, or public offices are informed of a CS initiative and encouraged to join it;
- Association/network-based: The recruitment is proposed within associations or relies on the diffusion among collaborators—both professionals and amateurs;
- Education/academia-based: Proposals of participation specifically designed for school or academic classes and their teachers.
2.1.2. Data Generation
The data generation activity regards data capture by human observation, by the collection of field material, by the acquisition of measurements from instruments or sensors, or by means of automatic or even unaware mechanisms. However, it could also include the compilation of meta-information regarding data capture (e.g., position, timespan, author profile, IP address, etc.). While more traditional CS projects were mainly based on a common process for data generation and collection that basically consisted of human observations, instrumental measurements, and written reporting, the current wave of CS initiatives is experiencing a great variety of different generation procedures, significantly relying on modern participative web and geoweb mechanisms. The generation of data for current CS projects takes place in several different ways; it can consist of the acquisition of samples or measurements from sensors and networked devices, or of the compilation of forms for collecting human observations. It includes the production of transcriptions, classifications, tags, geographical features, attributes, or boundaries. In some special cases, there is no direct input action as in participative grid computing projects, serious games, or health monitoring projects based on wearable devices. In order to analyze the data generation activity, we considered the following approaches, which are not mutually exclusive. They offer a significant glimpse into the technological skills required of volunteers and the different ways for acquiring or coding information.
- Field activity: Participants are asked to perform activities in particular places or environments in order to generate data and information (e.g., sample collections, field observations, etc.);
- Guided human observation: Volunteers are asked to report what they see, hear, feel, and experience in a given situation, aided by means of schemas, forms, protocols, conditioned data entry, etc.;
- Transcription: Aimed at producing digital copies of documents (such as museum specimens’ labels or old log-books), or translating documents in a different language, such that data generation consists of a transcription task;
- Sensor observation: Typical for data acquired by sensors and transmitted directly or by volunteer intervention to a cyber-infrastructure;
- Sampling: Used when real objects or specimens should be collected in the field by participants (soil, plants, animals, etc.) and analyzed subsequently by experts;
- Multimedia data capture: Proposed to participants either as a way to create data (or metadata), or even as a token for proving the veracity of the volunteered observation. Multimedia may consist of photographs, videos, or audio files;
- Human analysis or decision: Human skills, logic, or critical thinking are required. In these cases, data derive directly from human deduction or interpretation (e.g., pattern finding, sound/images recognition, object classification, etc.);
- Serious game: Volunteers are enabled to produce data and information just by playing a game. Data are automatically extracted from users’ interactions and decisions made during the game. Serious gamers are often aware of the contribution they are giving to research, but are involved by means of typical gaming mechanisms and environment: competitions, interactive interfaces, stimulating messages, amusing activities, etc. Occasionally, games are used to train volunteers (e.g., to recognize species) instead of producing data, but even in this case, this approach is useful for improving the initiative;
- Georeferencing and geocoding: Used for relating elements to a geographic reference system. Georeferencing can be applied to physical entities (e.g., a lake, a measurement station), to representations of physical entities (e.g., aerial photos), or even to abstract concepts and events as long as they they are related to a geographic location (e.g., nesting area of a bird, point of sighting of a cetacean). Geocoding transforms physical addresses (e.g., buildings centroids, postal code centroids, administrative boundary centroids) into geographic locations represented in numerical coordinates. They are often associated with gazetteers, and can be used effectively in CS to make data “human-readable”, even those with complex spatial relations, to display them, and to make them spatially searchable.
2.1.3. Data Delivery
The delivery of data has undergone a deep transformation in recent decades, following the evolution of communication technologies from the traditional delivery by postal service to the use of emails, which requires network connection and allows almost immediate delivery of data in a digital format, until the more recent delivery strategies that lean on web communication protocols. We envisaged the following most-used data delivery strategies:
- Postal delivery: Used for sending physical contributions in non-digital format (e.g., samples, paper documents, etc.);
- Email delivery: Requires data to be in a digital format (images, numerical, categorical, textual, etc.), within given constraints on attachment dimension in bytes. Both an email address and an Internet connection are required. Unlike postal delivery, email delivery is almost immediate;
- Web delivery: The exchange of digital data by means of standard communication protocols on the Internet, such as FTP and HTTP. In the case of HTTP, the volunteer is usually required to fill web forms or check boxes, or to select features or geographic areas. The volunteer performs this activity on websites or web platforms, or by means of specific web applications. Data delivery via social media messaging and sharing is included in this approach;
- Smart app delivery: A special case of web delivery performed only via mobile applications, without using a web browser. It requires a mobile device (phone/tablet or watch) that is connected to the Internet;
- Unaware delivery: Happens when the (web) contributor is not completely aware of creating data for the project, or is unaware of the specific kind of data he/she is creating. This strategy can be adopted in serious gaming, but also in other contexts, sometimes raising ethical questions on privacy and consensus.
2.1.4. Data Search
Various types of data search can be implemented, depending on a project’s needs and kind of data. The search can be performed on archives of texts in natural language, which might have different structure and length; on multimedia archives of images, audio, and video files; and on archives of geospatial data, as commented by metadata. The search is generally performed by expressing queries either by free terms or controlled keywords, possibly within specific metadata fields (e.g., refined search on a timespan). Alternatively, users can autonomously perform their searches, scrolling through the pages of a website by navigating the links and interactive content, or they can be assisted by dedicated interfaces. Since it is impossible to generate an exhaustive list of all the possible search mechanisms, here, we list some general approaches:
- Discovery service: Enables web users to search for spatial data sets and services by retrieval mechanisms on metadata. Search criteria can be expressed by keywords, geographic references, timespan, and author names, among others;
- Full text search: Indicates the possibility of retrieving documents, web pages, or any piece of data containing text on the basis of the presence of the search terms within it;
- Multimedia search: Allows the retrieval of multimedia information in different formats, such as images, audio files, video, etc. The query can be a text (in this case, the metadata are matched to retrieve the multimedia object), or multimedia content, such as an image (which is used as an example to retrieve similar multimedia contents). It can be implemented by content-based visual or audio information retrieval systems;
- Browsing & navigation: It is very common for users to explore data on the web by navigating dedicated websites guided by menus and interactive lists or maps, links, and action buttons. The browsing and navigation possibilities are encouraged by the availability of mutually linked interactive data and metadata;
- Spatial search: Requires an interactive map, on which users can specify points or areas of interest (e.g., by clicking on a position of the map, or by drawing a bounding box, circle, or polygon) in which to perform the data search. Alternatively, a spatial search can be run by entering spatial queries by means of specific tools and interfaces, which often translate addresses into coordinates (e.g., geocoding tools exploiting gazetteers). The analysis differentiates the cases of punctual queries and range (areal) queries.
2.1.5. Data Visualization and Access
This activity covers the ways in which data and metadata are displayed and made accessible by web services. Indeed, the web enables a number of possibilities in selecting, presenting, organizing, unfolding, and accessing data, having direct consequences on their usability. The following approaches, which are not mutually exclusive, were identified:
- Open access: Refers to the possibility for a generic web user to examine the collected data by any of the following approaches. The policy of open access lets any web user visualize the whole data collection. A restricted policy on data access instead imposes constraints on data consultation. There may be constraints on accessing certain data (e.g., sensitive data related to protected species), or on parts of data and metadata (e.g., occurrence can be provided, but not locations and timespan), or again, data can be made accessible only to logged-in users or those having special access permissions;
- Web portal and tools access: Includes a broad range of web environments used by CS project designers to provide general or dedicated access to data. The dedicated environment can lean on predefined forms, web applications and platforms, specific hardware for 3D and virtual reality fruition, etc.;
- Map visualization: Displays some data content in the form of a map or a virtual globe, depending on the geographic reference associated. Maps can represent each data item separately, for instance, as punctual or polygonal features, clustered as groups, or aggregated information (e.g., a density map). The map can be published as a simple image or as an interactive web map;
- Download: When this feature is enabled, web users can access data by downloading it in one or more data format;
- Standard web services access: It can transfer machine-readable file formats and support interoperable machine-to-machine interaction over the web. This means that multiple standard clients can access the same service, avoiding the duplication of data repositories and fostering their reuse. Specific standard web services for spatial data are the ones provided by the Open Geospatial Consortium (OGC) [24] to access maps, features, coverages, sensor observations, and metadata catalogues.
2.1.6. Operations on Data
This activity focuses on the mechanisms suitable for transforming, modeling, aggregating, or analyzing data and metadata to extract new information and knowledge. Among the many existing methods, we chose the following approaches that we consider to be particularly suitable for handling and displaying geoinformation in CS.
- (Geo)statistics and summaries: Comprehends all processes to organize geodata in order to offer an interpretation through summaries, graphs, indexes and trend indicators, interpolations, and more;
- Spatial analysis and spatial properties calculation: Includes a wide variety of techniques aimed at computing metric and topological properties of geodata sets;
- Spatial clustering: Refers to algorithms that identify groups of spatial data which share some spatial proximity and possibly, similar attributes;
- Map customization: Refers to enabling the customized or personalized representation of geodata on a map by the end user. The personalization can concern the legend styles, the selection/deselection of elements and layers, or other options that modify the data display without modifying the content;
- Map editing: Allows users to make changes directly to the dataset by interacting with the map client (e.g., adding features or modifying the geometry of spatial objects).
2.1.7. Qualification/Validation
There has been a long and still ongoing debate within the scientific community on the questionable quality—and thus usability—of CS data. This has stimulated the development of several techniques for checking and assessing the quality of contributions. Since the pioneering examples of the last century, some supervision has been employed by experts. Recently, however, CS has been able to rely on a great variety of strategies and supporting technologies for improving, assessing, and managing the quality of data and metadata. Quality control methods can be divided into two major groups: ex-ante and ex-post methods. The former acts on the preparation of the volunteer and on the assistance and correction in the data generation phase as a strategy for quality assurance. The latter operates selections, treatments, and fixing after the data delivery phase. Even after the publication of data on the web, mechanisms for enabling users for a collaborative revision can be employed to flag, comment on, and improve contributions. A more detailed description of the ex-ante and ex-post strategies can be found in reference [25,26], while an important analysis of their application in CS projects dates back to 2011 [27]. An interesting aspect of these technologies is the role of the one entrusted for controlling quality. More and more often, automatic mechanisms help technicians to check data and purge weak contributions. At the same time, the community of volunteers is frequently called upon to collaborate in the identification of vices, in the enrichment of the contributions, and in their revision and validation. The integration of automatic and collaborative data control mechanisms is particularly useful in CS projects where the large volume of voluntary contributions, or their geographical scattering, does not allow the expert staff to perform controls on their own. For instance, automatic algorithms can identify data that are missing some important information (e.g., timespan), and geostatistical techniques can identify outlier contributions or unrealistic observations for a given geographical area (e.g., the presence of alien species). The user community, despite having an amateur preparation, has a widespread presence in the territory and can greatly contribute to the validation of local reports. The following approaches can be used as unique strategies, or hybridized to better achieve consistent results:
- Learning material: Consists of providing volunteers with tutorials, interactive guides, or other types of instructions. It is an easy but effective ex-ante strategy to improve the quality of the contributions and prevent misreporting. Nevertheless, it is typically optional, so it does not guarantee a common preparation baseline for all volunteers;
- Compiling assistance: Gathers all techniques that help—and seldom constrain—the volunteer while compiling his/her contribution. They include the use of controlled vocabularies, geographic gazetteers, auto-completion, templates with automatic error-checking capabilities, checklist configuration tools, etc.;
- Assessment: Quality assessment can be performed after the delivery of the contributions by a panel of experts, by automatic techniques, or by the community of volunteers. We took into account who among experts, automatic agents, and community performed the assessment. A special kind of assessment is the auto-assessment. It asks contributors to report their level of confidence in the data generation. This kind of assessment is in fact an ex-ante strategy that enriches the metadata;
- Cross-comparison with authoritative data: An ex-post strategy that is commonly used to identify the accuracy of datasets and to validate geographic data and information. Cross-referencing is performed by comparing VGI with authoritative information from administrative or commercial datasets. Nevertheless, in some cases, the accuracy of crowd-sourced geographic information can exceed that of authoritative information, as reported in reference [28].
2.1.8. User Interaction and Participation
Recent web and mobile technologies have provided users with several tools to interact with. Some of these technologies are strategically employed to attract volunteers, to keep them engaged, and to reward them for their contributions. Web visitors can often explore the project resources, create custom maps, perform analyses and comparisons, share content on various social channels, add comments and ratings, or take part in discussions on message boards. The creation of customized virtual profiles is widely used in CS projects. It enables registered users to keep track of their activities and to apply to reach goals and awards. Virtual profiles can also be useful to the scientific team to identify and make decisions about the users (from rewarding, to credibility, to commitment assignment). Participation can be stimulated even by calling for volunteers for collaboration during the project design phase, and by recognizing their merits in the scientific publications derived from the project. Local meetings also provide positive feedback on participation; they act both by strengthening the community and attracting new volunteers. Serious games are emerging and they look very promising, since they can involve and entertain participants while providing useful information to the research [23]. Here, we summarize the most-used approaches found in CS projects. Even if they are not directly related to geoinformatics, they are worth surveying because some of them are particularly suitable for future integration with geoinformatic functionalities.
- User profiles: Often the participants are encouraged (or asked) to create virtual profiles in order to access data or to deliver contributions. Registered users can keep logs of their activities and reach goals and awards and can share their work both inside and outside the community. User profiles are also useful to the scientific team for contacting the users, requiring clarifications, involving them in local initiatives, sending periodic messages and newsletters, assigning them privileges or tasks, or for producing usage statistics. Encoding user position in a profile can aid the implementation of location-based functionalities;
- Scores and ranking: These techniques are aimed at motivating and honoring the most active and good contributors. They can be specialized in different tasks and different areas and can also be exploited for quality assessment. They require users to register in the project web infrastructure. This approach may also employ geoinformatic techniques, such as assigning the scores depending on the user position;
- Competitions and prizes: As with the previous ones, these produce some healthy competitiveness among the participants, motivating them and rewarding them for the quantity or quality of their contributions. Rewards can be symbolic, or can be award money and prizes;
- Forum: An online discussion site where the community of volunteers can share experiences, ask for help, and search for information. Often some mediators are selected within the administrative and scientific staff or among the most experienced volunteers;
- Social media: Social media act as a megaphone for many CS initiatives, managing to reach many contacts and visualizations immediately. They can even be used to collect contributions, suggestions, or to keep users informed on the project status. Social media capability to share images and multimedia files is often a useful support for projects that would have low dissemination power otherwise. Additionally, in this case, geoinformatics technologies can be exploited to target specific areas;
- Newsletter: An easy way to keep subscribers updated and engaged in the project. It reports project progress, calls for performing particular tasks, highlights important dates and events, and even publicly acknowledges the best contributors. When its automatic delivery is not available, it can be replaced by manual sending to a mailing list;
- Community review: this group includes the different technologies that can be implemented to allow the community to comment, integrate, report, or review the resources shared by the project;
- Meetings and events: periodic social events can be useful in CS projects, not only for performing training and data collection (e.g., during bio blitz), but also for reinforcing bonds among volunteers and to arouse the interest of the local communities;
- Co-authoring: In some cases, especially when professionals, associations, or expert amateurs are involved as volunteers, contributions can be encouraged, recognizing co-authorship in scientific papers, magazine publications, etc.;
- Project definition: This engages citizens right from the project design stage, or gives them the opportunity to independently develop sub-projects. Among the advantages, this strategy allows researchers to better understand the needs of communities, and to more easily obtain the favor of the public or private parties involved;
- Games: The use of games in CS projects is part of the phenomena called gamification and serious gaming, namely, the use of typical game design elements and principles in non-game contexts, not only for entertainment. This use of games, in fact, strengthens participants’ engagement and can be exploited by science both to train volunteers or to encourage them to perform certain tasks while having fun.
2.2. Selection of CS Projects
To perform the analysis following the methodological framework introduced above, a significant dataset of active CS projects had to be found and then filtered in order to obtain those in which geoinformatics plays a role. As no official or complete list of active CS projects exists, in order to find and select a set of projects useful for our purposes, we initially evaluated a couple of possibilities:
- Identifying CS projects by submitting queries such as “CS projects” to search engines and analyzing the first-ranked retrieved web pages;
- Adopting an existing-unofficial-list to start with and then refining it.
The first solution, performed by submitting several different queries to multiple search engines, gave poor results that were affected by weaknesses such as the scarce variety of retrieved projects, bulky presence of off-topic items (“best of” lists, multi-project platforms, CS associations, etc.), the loss of small or local projects, the absence of non-web-based projects, together with lexicon and temporal biases. We then decided to adopt the second approach and started with the projects listed in the dedicated English Wikipedia web page [29] (as released on 10 September 2017). The list of active projects includes 194 projects, disparate in discipline, aim, lifetime, country, and spread (both in terms of technologies and people involved). The voluntary nature of the Wikipedia system does not guarantee full representativeness of the enlisted projects but makes it possible to discover some small or local projects (some not even translated into English) that would not have been considered otherwise and which are not commonly known. This also enabled us to analyze some of the many smaller local realities together with famous and technologically advanced CS projects. Moreover, this choice comprised CS initiatives lacking official web pages and thus not indexed on the web. We initially randomized the items of the list and sorted the first 121 projects enlisted. Then, we filtered out and discarded the projects (i) not involving geoinformation and geoinformatics at all; (ii) apparently non-active and not analyzable; and finally (iii) the duplicated items in the list. The purged selection resulted in 87 projects. They varied—as was our intention—in discipline, geographic area, technology, involved volunteers, dimension, and lifetime (the first started in 1969, and the most recent in 2017). The analysis was carried out on these 87 projects by following the criteria described in Section 2.1 and by going through the projects with the tools and documentation provided by them—considering the projects’ websites, web and mobile applications, user guides and tutorials, social media, press releases, descriptions on CS platforms, and any other non-technical documentation made available on the web. Direct experiencing of the projects was preferred with respect to analyzing scientific literature reporting descriptions. The lists of both accepted and discarded projects is annexed (Appendix A). Figure 2 illustrates the proportion among selected (71.9%) and discarded (28.1%) CS projects. When considering the discarded projects, 21.5% were rejected for being irrelevant to geoinformatics, 5.0% for being no longer active or currently unreachable, and 1.7% for being duplicated items.

Figure 2.
Chart representation of the number of selected and discarded projects within the initial subset.
The high percentage of projects accepted (71.9%) and discarded as not-geo, but still representative of current CS projects, (71.9 + 21.5 = 93.4%) indicates the good consistency and update status of the original Wikipedia list.
We are aware that the collection may be affected by some bias, namely
- Linguistic bias, due to the fact that we adopted the English list (which is the longest one but not necessary the most representative);
- Lexicon bias, due to the many initiatives that are not self-defined as “citizen science”, even if they involve not-expert or not-professional volunteers in contributing to research. These initiatives tended to be excluded from the collection simply for lexical reasons;
- Methodological bias, because we chose to base the selection of the dataset on a single list which was not assumed to be statistically representative of the whole CS realm. We are also aware that non-web-based projects are not included in the selection, since the list requires the availability of some web description of the initiative. This is also necessary for our direct analysis.
- Temporal bias, because the dataset includes only active CS projects and is not representative of completed initiatives, or of past technologies to collect, process, and share geographical information, even if they have been highly fruitful, popular, or significant. Moreover, the analysis was conducted during the period from September 2017 to March 2018 and reports information on the status of the projects at that time. It is possible that further initiatives or those advertised for a very limited timespan were missed.
Considering the above limitations, we do not pretend that our selection is fully representative of the complex setting of geoinformation in CS, nor of the most advanced technologies. Nevertheless, we still believe that the selected dataset reasonably represents a wide part of the CS scene in relation to geotechnology and geoinformation usage in its framework.
3. Results and Discussion
The results of the survey are presented in the form of bar charts and are summarized as frequencies of the different approaches for each activity belonging to the Section 2.1. As any project can adopt more than one approach at the same time (e.g., recruitment can be performed by both social media and smart apps), the sum of the percentages for each activity can exceed 100%. Some examples are reported to better describe the most significant features found.
3.1. Recruitment
The survey of the different recruitment approaches (Figure 3) highlighted how a large part of CS projects rely on a website to present their activities and to call for volunteer contributors (96.6% of the subset). Smart apps, web platforms, and social media were well-represented, but with far lower frequencies (30.3%, 25.8%, and 15.7% respectively). All of these approaches rely on the Internet to gather participants and to crowd-source the project tasks. The projects that addressed the recruitment within academic circuits, pre-existing associations or networks, or by local facilities mainly called for specific groups of users connected by particular interests or circumstances. They accounted for 12.3%, 6.7%, and 5.6%, respectively. Of the many projects considered, only a few used geoinformatics solutions to improve recruitment, despite the existence of several already viable and well-known possibilities. An example of such a solution is offered by SciStarter (https://scistarter.com/), a geoenabled website acting as a project hub where users can filter the CS projects that are active in their areas of interest. Furthermore, with the user’s consent, the site can detect the position of the active IP and use it for suggesting and ranking a list of projects. The Atlas of Living Australia (Figure 4), which hosts geodata from some of the surveyed projects, uses an even more refined mechanism to filter suitable CS projects for its web users. It offers some filters based on administrative levels and the possibility to draw shapes and polygons on a basemap as well as to center the search on a marker or on the detected IP location (https://www.ala.org.au/, https://biocollect.ala.org.au). This kind of solution—a sort of proximity market applied to volunteerism—benefits both the website visitors and the hosted projects. The former are offered a personalized selection, while the latter have the opportunity to make themselves known and to recruit new participants. A similar functionality could even be offered by CS mobile apps, which could detect the GPS position of the device and offer suitable CS activities or tasks.
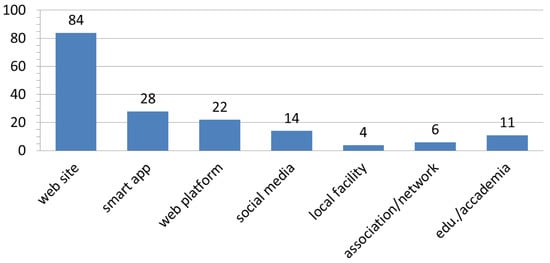
Figure 3.
Summary of the results relative to the recruitment approaches.

Figure 4.
A view of the Citizen Science Project Finder interface implemented in The Atlas of Living Australia website.
3.2. Data Generation
The results (Figure 5) show how commonly CS projects ask volunteers to collect field data. In fact, data came from field activities in 78.6% of projects, and in 77.5% of cases, data were from human observations. In 61.8% of cases, data or metadata generation included the acquisition of multimedia files (photos, video, or audio). Georeferencing and geocoding practices are very well established in projects for the generation of geographic information (89.7%). Nevertheless, it is interesting to see that in a small amount of projects (13.5%), data was derived directly from human inference or interpretation—participants perform analyses and make decisions on their own. In order of frequency, the following infrequent approaches were also found to be used for data generation: transcription (5.6%), sampling (5.6%), serious gaming (5.6%), and sensor observation (2.2%).
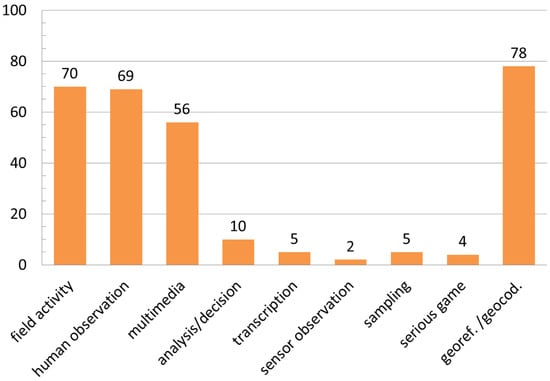
Figure 5.
Summary of the results relative to the data generation approaches.
Interesting cues regarding geoinformatics in data generation could be taken from the investigated projects. For instance, the TreeSnap project (https://treesnap.org/) randomly alters the GPS coordinates in order to face the issue of geodata privacy. As an additional option, the project allows volunteers to hide the geographic components of their sensitive contributions from the shared map. A gaming approach is used in some of the projects proposed in the Geo-Wiki platform (https://www.geo-wiki.org/). FotoQuest-Go (Figure 6, http://fotoquest-go.org), for instance, challenges the participants in a treasure hunt, in which the goal is to reach specific places and photograph them. The mobile application is a location-based service that visualizes the closer target points as markers on an interactive map and in augmented reality environments, leading the users to its destination. An interesting example of the sensor observation approach can be found in the Air Quality Egg (https://airqualityegg.wickeddevice.com/), a commercial initiative enabling CS. The promoting company sells egg-shaped wireless sensor devices to be used to create a community-led air quality sensing network. Data are generated by pollution sensors and shared on a web dashboard.
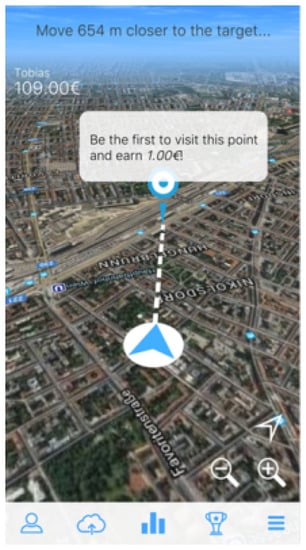
Figure 6.
An image from the FotoQuest-Go mobile app.
3.3. Data Delivery
The web was by far the preferred data delivery medium (86.5%) (see Figure 7), followed by smart applications (31.5%) and email (20.2%). Postal delivery reached fourth place in the ranking (16.9%). Finally, unaware delivery was present only in one project of the dataset. Looking deeper into the results, it can be noted that postal delivery is the only possible approach in projects based on specimen collection (e.g., the Backyard Bark Beetles and the Monarch Health projects, available at http://www.backyardbarkbeetles.org/ and http://www.monarchparasites.org/, respectively), and it was almost exclusively present in projects with a local or national scale, In fact, only one of the projects following this approach had a global dimension, while the other fourteen that used postal delivery were local or national projects. The only detected case of unaware delivery was that of Project Discovery (https://www.eveonline.com/discovery/). This looks like a minigame included in the MMORPG (massively multiplayer online role-playing game) EVE online. Players are called to solve problems for an independent police force, and find themselves indicating possible planetary transits on light curves (diagrams representing long-term measurements of luminosity of distant stars). They do not need to be aware that curves report data from the CoRoT telescope (COnvection ROtation and planetary Transits, operating in space since 2006), nor do they need to understand how and where their performances will be delivered, processed, and used. As stated in the description of the “unaware delivery” approach, contributors can be not completely aware that they are creating data for a scientific project, or not aware of which data they are creating. In a couple of CS projects, four delivery media—postal, email, web, and smart apps—are enabled together. For instance, the initiative launched by the B.C. Cetacean Sightings Network (http://wildwhales.org/sightings/) asks citizens to report cetacean and sea turtle sightings by sending back a hardcopy logbook, by describing the sighting in an email, or even by submitting a detailed web form, or the list of sightings recorded in the mobile apps even when out of mobile reception range. As for geoinformatics usage, in this project, only smart apps implement the automatic geolocation of the device, as well as the geocoding support and the “click on map” option. It must be noted that within the considered list, every project enabling the smart app data delivery includes georeferencing and geocoding functionalities.

Figure 7.
Chart representation of the results relative to the data delivery approaches.
3.4. Data Search, Visualization, and Access
The most frequent approaches for enabling the data search on the web were the navigation of the project website and the related applications (62.1% of projects), and the spatial search (56.2% of projects) (Figure 8). Spatial search was enabled mostly through punctual queries (58.3%). Often, such queries were flanked by mechanisms that allowed spatial areas to be queried (29.2%), for example, by selecting bounding boxes or search radius. Projects allowing areal queries only were less frequent (12.5%). Discovery services, which allow searching by exploiting metadata collected in catalogues, were not as frequent (30.7%), and full-text querying was rarely offered (14.6%). Regarding data visualization and access (Figure 9), open access was available in 37.1% of the cases and downloading was possible in about 29.2% of initiatives. Standard web services were poorly represented (in 8% of projects). The access (even partial or restricted) to data was provided by means of dedicated portals and tools in 69.0% of projects. A map visualization of the geographic data components was provided in 79.3% of projects, while 32.2% let users customize or style the map representation. Only 8.0% of the projects provided map editing tools.

Figure 8.
Chart representation of the results relative to the data search approaches.
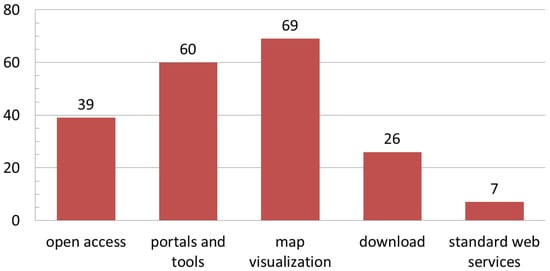
Figure 9.
Chart representation of the results relative to the data visualization and access approaches.
In the surveyed list, some interesting examples were extracted that underline how geoinformation can contribute to the data search, visualization, and access activities. The Globe at Night project (http://globeatnight.fieldscope.org/) relies on the Fieldscope platform (http://www.fieldscope.org) to explore the contributed datasets. This application, developed with the support of the National Science Foundation and the National Geographic Society (USA), enables a number of geodata search, visualization, and graph options, depending on the customization chosen by the staff. Moreover, the main website of the project Globe at Night (http://www.globeatnight.org/) uses geo-based navigation, and provides users with a number of geoinformatic functionalities for searching, visualizing, and accessing geodata. For instance, it can provide web users with a customized star map, indicating to the volunteer which constellation to observe and which position to look for, depending on their IP location. IP localization and geocoding mechanisms allow web users to filter the contributions visualized on interactive maps (e.g., by setting the central point and the search radius). Herpmapper (http://www.herpmapper.org/) and PARS (https://paherpsurvey.org/) are herpetological CS projects standing out from the survey for their rich geosearch and visualization functionalities. The first one offers many search possibilities (at three different administrative regional levels, in addition to the more common search by species and taxa, by user, by date, etc.) and visualizes single or grouped results with hotspot maps, metrics, summaries, temporal graphs, etc. The second project provides, in its homepage, a simple and immediate geographic search system. In fact, it offers an interactive heatmap already divided into counties (as an option, blocks can be shown instead of counties), which can be selected by a click, and can be customized in the mapped data type (atlas data, recent activities, diversity, etc.). The legend underlying the heat map provides qualitative information at first glance. Artportalen (https://www.artportalen.se) is the Swedish Species Observation System, and Artsobservasjoner (http://www.artsobservasjoner.no/) is the analogue Norwegian system. They provide professional functionalities to perform web searches, data visualization, and access to their large observations dataset. Here, we recall only some of the spatial features provided: the drawing or uploading of polygons to perform “search by map”; eight different spatial search parameters (including map accuracy); and five different types of interactive map presentations as the search output. From the homepage, a simplified geographic search for the most recent sightings is made available to users which gives the possibility to filter observations by region, by species group, or by day. The portals collect thousands of sightings a day and publish them openly. Data are also forwarded to the Global Biodiversity Information Facility (GBIF, https://www.gbif.org/). Wakame Watch (http://wakamewatch.org.uk) and the Mitten Crab Watch (http://mittencrabs.org.uk/) are two CS projects fostered by the British Marine Biological Association. They deal with the monitoring of invasive species which currently have limited diffusion in the UK. The projects rely on the vast NBN Atlas (National Biodiversity Network, https://nbnatlas.org/), the country’s largest collection of biodiversity information, so that even such small initiatives can benefit from its complex functionalities. In fact, the NBN Atlas allows project users to search by species record, environment, climate, and soil information, personal biological records, and habitat, either in single or combined database, and makes it possible to download or export maps, reports, and summaries (Figure 10). The NBN Atlas uses OGC web services for the deployment of spatial layers and lets users add further layers from OGC web map services (WMS) to the map client. The Australian Reef Life Survey project (https://reeflifesurvey.com/) coordinates surveys of rocky and coral reefs with the aim of improving the sustainable management of marine resources. The project enables open access to the collected data through its geoportal (http://reeflifesurvey.imas.utas.edu.au/portal/search). It is essentially a metadata catalogue enriched with a map viewer, deploying a wide list of spatial web services: OGC Catalog Service for the Web (CSW), OGC Web Coverage Service (WCS), OGC Web Feature Service (WFS), OGC Web Map Service (WMS), OPeNDAP, THREDDS, etc. These services let users consult metadata, have a preview of the data content, filter, and select the needed data collections and download them freely (Figure 11).

Figure 10.
A view of the National Biodiversity Network (NBN) Atlas analysis portal, showing data collected within the Wakame Watch project.
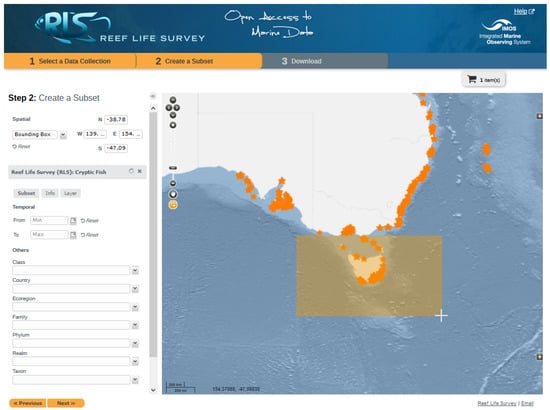
Figure 11.
The selection of data subset on the Reef Life Survey data portal.
3.5. Operations on Data
Geostatistics and summaries are available for 58.6% of projects. Spatial analysis and spatial properties calculation occurred in 21.8% projects, while spatial clustering occurred in 23.0% (Figure 12). Many projects related to biology or life science disciplines (botany, entomology, ornithology, biodiversity, etc.) reported the results obtained from spatial analysis of the collected data on their websites and portals (e.g., zonal occurrence maps, heatmaps, hotspot or gap analysis, spatial and temporal series plots, distribution graphs, etc.). It is less frequent that web users were guided to generate customized analyses with the tools provided by the project. This happened for instance in projects relying on the already-cited Fieldscope platform, such as, for instance, FrogWatch USA (Figure 13, http://frogwatch.fieldscope.org). This system guides users in defining variables and parameters in order to generate a number of graphical analyses on data (scatter plots, histograms, time series plots, range comparison plots, calendars, etc.). Some projects provide toolkits to perform spatial analysis or interactive environments for specific tasks. For instance, Old Weather (https://www.oldweather.org/) has a rich set of navigation tools available online , aimed at assisting users in determining ships’ positions, distance, course, and speed, using bearings and other geographic references. Data from the African MammalMap project (http://mammalmap.adu.org.za) can be accessed and reworked effectively by the Virtual Museum (http://vmus.adu.org.za), a CS platform developed by the Animal Demography Unit from the University of Cape Town. In the Virtual Museum, web visitors can generate customized summaries and distribution maps, coverage maps, four different types of hotspot analysis, and a gap analysis coverage map.

Figure 12.
Summary of the results relative to the approaches for operations on data.

Figure 13.
A view of the Fieldscope graphical analysis interface for the FrogWatch USA project.
3.6. Qualification/Validation
Among the four approaches analyzed within this activity (Figure 14), the first two can be observed as ex-ante strategies for the qualification and validation of data, while the last two are ex-post strategies. As for the ex-ante (preventive) quality control approaches, the most frequent one relies on learning material to prepare and train volunteer collaborators (82.0%), while assistance in the data compilation—aimed to constrain data creation—was made available by fewer initiatives (27.0%). The Ontario Reptile and Amphibian Atlas is an example of an integrated and effective use of ex-ante strategies for data qualification. Its qualification system is made up of different components; its website and mobile app provide users with comprehensive guides, interactive maps useful to make them aware about the ranges of species, and it has a web form for submitting observations with many constrained or assisted compilation fields (automatic data and time detection, species codelist, assisted geocoding and automatic coordinates detection options, overlaying maps consultation, etc.). Concerning the ex-post strategies, in spite of the vast amount of related literature, the cross-comparison between voluntary and authoritative data is performed consistently only in 4.5% of the projects. Moreover, in the surveyed projects, this comparison does not involve the spatial component of the data, probably due to the lack of ground truth data. Nevertheless, in this context, it is worth mentioning a couple of comparison tools found in the survey. LACO-Wiki (https://laco-wiki.net), within the Geo-Wiki project (https://www.geo-wiki.org/), does not provide expert validation on amateur geoinformation. It allows the user to directly compare their own vector and raster maps with a variety of reference layers to generate validation samples and to obtain a customized accuracy assessment report. In this way, all citizens taking part in the Geo-Wiki project as well as any other web users are enabled to qualify their maps. Additionally, the Herbaria@home project (http://herbariaunited.org/atHome/) provides a parser, enabling users to upload their own taxa dataset and grid-references, and returning the comparison among the uploaded records and the known distribution. Regarding ex-post approaches, assessment evaluation of the contributions is used by about half (48.3%) of the projects, mainly relying on experts’ revisions. Automatic data assessment is still a rare choice in CS (Figure 14), although it is a suitable strategy to guarantee uniform and objective evaluation. The iNaturalist platform (Figure 15, https://www.inaturalist.org/) is outstanding for the complex validation functionalities provided. iNaturalist charges the community with the identification/validation of taxa for each naturalistic observation contributed. At the same time, an automatic algorithm calculates the most probable taxon on the basis of those proposed by the community and assigns it to the observation. Moreover, a quality grade is associated to the observation, depending on the number of taxon validations and the fulfillment of a series of quality requirements. In order to assist the identification and the validation of observations, distribution maps, statistics, seasonality data, misidentification tips, and other information are shown for each species.
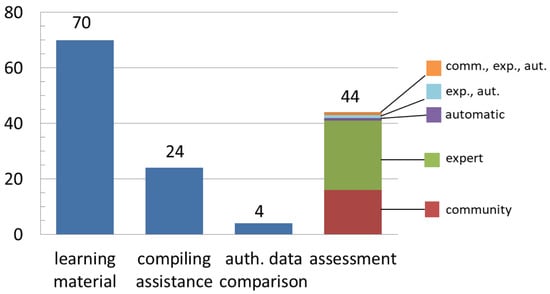
Figure 14.
Summary of the results relative to data qualification and validation categories.

Figure 15.
Some of the identification/validation functionalities provided by the iNaturalist platform.
3.7. User Interaction and Participation
Social media is the most frequent approach to interaction and participation activities (70.1%), followed by the introduction of user profiles (67.8%) (Figure 16). Community participation via reviewing and commenting on the project’s contents (35.6%) and the attribution of scores and ranking (31.0%) appear to be rather widespread practices. Newsletters and local events are used to strengthen interactions and bonds in 29.9% and 14.9% of the projects, respectively. Quite rarely, non-traditional strategies such as competitions, games, user-based project definition, and co-authoring play a role in the user participation possibilities.

Figure 16.
Summary of the results relative to the user interaction and participation approaches.
Looking deeper into the social media accounts of the projects (mainly Facebook and Twitter accounts), it can be seen that they are mostly used to share noteworthy photographs, news, events, thematic publications, achievements, or to make vital contacts with similar communities and stakeholders. The CS project from the North American Field Herping Association is technically a Facebook group (https://www.facebook.com/groups/NAFHA/). In addition to fostering discussions and photo sharing among the community members, it publishes a series of recommended places to perform recreational field herping. We could not report explicit usage of geoinformatic facilities on social media that are aimed at encouraging interaction and participation. Anyway, it is possible that users’ positions are implicitly exploited in the projects. For instance, social account administrators can derive important information on the dissemination of the initiative by using web page usage statistics. We had no possibility in the present work to investigate this kind of usage. User profiles are often enriched with tools for monitoring and managing personal contributions. Among these tools, it is not rare to find personalized maps, metrics, and achievements. This is the case for Digivol (https://volunteer.ala.org.au/), a crowd-sourcing platform developed by the Australian Museum in collaboration with the Atlas of Living Australia (https://www.ala.org.au). Each user is provided with a rich personal webpage, where they can consult their own contribution lists, the current validation stage of contributions, the related summaries and statistics, their distribution on a interactive map, and more. The previously mentioned iNaturalist platform (as well as the customized versions, NatureWatch NZ and Natusfera) offers registered users similar advanced functionalities on personal pages. In addition, the users can subscribe to particular places (and taxa) of interest and receive personalized updates. This is also a nice example of the implementation of the community review approach. In iNaturalist, contributors are extremely active in commenting photos, suggesting identifications and data qualification tips, flagging contents, adding new “places” to the platform of where to focus personal studies (each place page displays all the known species from that place, including information about their abundance, conservation status, and first observers), etc. Moreover, each user can create personal projects, define their geographical extension, taxa list, membership, and observation rules, and customize the fields of the observation form, as well as the graphical items of the web page. Another interesting example in the survey, related to community review and user profile, comes from the Habitat Network project (Figure 17, http://www.habitat.network/, http://content.yardmap.org/), based on the Yardmap web application. The project literally calls on individuals and neighbour communities to draw digital maps of their backyards, parks, farms, schools, and gardens, and enables collaborative mapping of the local landscape. It is aimed at achieving better decisions about how to sustainably manage the local environment. Each registered user can map sites and not only manage their environmental descriptors (site characteristics, habitats, and objects) but also set the possible goals and the actions needed to reach them. A forum and messages let participants communicate and suggest improvements.
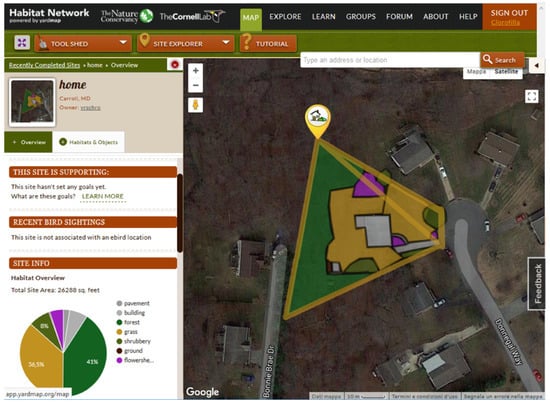
Figure 17.
A view of the habitat network collaborative platform.
3.8. Concluding Remarks
From our analysis, websites emerged as the leading unavoidable framework for recruitment, data delivery, and user interaction activities in particular. The limited employment of smart applications and smartphone facilities is surprising. It could be interpreted as the initial phase of a new trend that is still developing. In contrast, it could be seen as the effect of the affirmation of new ubiquitous computing technologies alternative to the use of smart applications. The popularity of websites and portals as hubs for CS initiatives brings many advantages. Besides, we must consider that the digital divide, caused either by poor communication or poor training/knowledge [30], can limit the participation of many people worldwide in CS initiatives. To obtain statistics, it is interesting to consult the most recent reports provided by the ICT Data and Statistics Division of the Telecommunication Development Bureau, International Telecommunication Union [31] and to consider that the global Internet penetration rate is only 30%, with North America and Europe having 10–70 times more data than the developing world or global South [7]. Moreover, we cannot ignore that in conducting our analysis, mainly based on the availability of web pages, we may have potentially missed many local CS initiatives that do not rely on web technologies or on smart applications.
It is also apparent that contributors’ training is massively performed via traditional methods (i.e., learning material distribution).
Regarding the access, visualization, and processing of geodata, the facilities offered are the basic WebGIS functionalities (access and visualization), and only rarely can implementations of typical features of mature GIS such as styling, analysis, and decision-making be found.
Standards are rarely used. This demonstrates a lack of attention to data exchange, data reuse, and interoperability issues. A lack of both standardization and common guidelines means uneven or duplicated vocabularies and redundant software libraries, applications, and tools, which could cause inefficiency and ineffectiveness, such as
- The disorientation of volunteer contributors and their dispersion within too many proposals;
- The lack of a shared knowledge base;
- The low robustness of project implementation choices.
On the contrary, the most successful collaborative mapping initiatives, such as the extremely popular OpenStreetMap [32] and Google Earth [33], offer harmonized frameworks, where many applications can grow with similar underlying technologies and user interaction characteristics. The use of open source software and libraries also guarantees robustness, since large developer communities are usually involved. With respect to openness, open data proved to still be far from taking the scene with a low possibility of verification by the public and ultimately lower quality.
Users’ interaction approaches can be strengthened and conveniently associated with quality improvement activities. For instance, the user profiling and scores assignment approaches that are typically introduced to increase interactions with users and to reward their participation can even help research staff to detect suitable contributors for performing quality improvement or validation tasks. Once the characteristics and the competencies of users are identified, the staff can assign them specific quality checks or data enhancement operations.
The overall view that emerged from the analysis suggests a landscape populated by initiatives with similar geoinformatics features, although in different application contexts. There has been no dedicated effort to design and propose novel tools or approaches with technological features specific for CS, or differing from the traditional ICT ones.
Many scientific publications [34], as well as reports on social media hitting the headlines [35], have shown that new technologies present still-critical issues, such as privacy and geoprivacy, licensing, intellectual property rights, lack of accuracy, standardization, and interoperability [36]. Another main critical and still disregarded topic is how to interpret “no data values” (i.e., lack of data in some geographic areas) and bias due to both volunteer attitudes and field logistics (e.g., shots of slow-moving animals are more likely to be contributed, because they are easy to catch, while fast-running animal shots are harder; more observations are provided in easily-accessible locations than in remote ones). Nevertheless, strategies and technological means have been proposed to manage such biases, incompleteness, and uncertainty [37,38,39,40].
In summary, the performed analysis shows that what was foreseen five years ago in reference [23] is still true—CS is still in need of improvement, which could be achieved by applying geoinformatics technological advances. Quality and reuse are still priorities. For example, syntactic interoperability can be obtained by adopting standard geoservices which are now uncommon in CS. Furthermore, the adoption of shared vocabularies (and/or domain ontologies) and common metadata schema could help normalize data creation and retrieval and enable semantic interoperability between projects. This would allow a semantic-aware fruition and reuse of CS data [16,37,41]. Extending data quality and interoperability of practices means shifting CS initiatives from the “ghetto” of amateurs to the level of authoritative science.
We advocate that future projects meet two requirements: (1) they have a choice of agreed and shared technological standards; and (2) there is wide international coordination of initiatives. In fact, a lesson could be learned from successful CS experiences—the use of standards, well-recognized platforms, and the adoption of general goals—internationally defined though connected to networks of local contributors—allows for both activities and data to be coordinated, potential contributors to be encouraged and engaged over time, and good practices to be rooted in local communities.
Author Contributions
L.C., G.B., P.C., and M.P. conceived and designed the survey, wrote the paper and revised it; L.C. performed the survey.
Funding
L.C.’s research fellowship was granted by the RITMARE Italian Flagship project of the Italian Ministry of University and Research and by the SATURNO project of Lombardy Region, funded by the European Agricultural Fund for Rural Development.
Acknowledgments
The authors would like to thank the anonymous reviewers for their valuable comments and suggestions to improve the manuscript. Special thanks goes to Cristiano Fugazza who performed the English revision.
Conflicts of Interest
The authors declare no conflict of interest. The founding sponsors had no role in the design of the study; in the collection, analyses, or interpretation of data; in the writing of the manuscript, and in the decision to publish the results.
Appendix A. Selected Projects
Table A1 and Table A2 list the citizen science (CS) projects considered for the analysis, while Table A3 shows those that were discarded.

Table A1.
First half of accepted and analyzed projects.
Table A1.
First half of accepted and analyzed projects.
| Project Name | Area | Began |
|---|---|---|
| Air Quality Eggs | Ithaca, NY, USA | |
| GeoTag-X | Worldwide | 2012 |
| Loss of the Night | Germany | 2013 |
| Globe at Night | Worldwide | |
| CidadĆo Cientista | Brazil | 2004 |
| Geo-Wiki | Worldwide | 2008 |
| BugGuide | USA, Canada | 2003 |
| Manta Matcher | Worldwide | 2012 |
| Whistler Biodiversity Project | Canada | 2004 |
| Citclops | Europe | 2012 |
| Monarch Larva Monitoring Project | Canada, USA | |
| Track a Tree | UK | 2014 |
| Backyard Bark Beetles | USA | 2014 |
| Track My Fish | Canada | 2012 |
| Wakame Watch | UK | 2014 |
| Ontario BioBlitz | Canada (Ontario) | 2012 |
| Natusfera | Europe | 2016 |
| DigiVol | Australia | 2011 |
| Herbonauten | worldwide, Germany | 2016 |
| Herbarium@home | UK | 2006 |
| Agent Exoplanet | Goleta, CA, USA | |
| Great World Wide Star Count | Worldwide | 2007 |
| Big Butterfly Count | UK | 2010 |
| Crowdcrafting | Worldwide | 2011 |
| Observation.org | Worldwide | |
| Cicada Watch | Northeastern America | 2013 |
| NatureWatch NZ | New Zealand | 2006 |
| CyanoTracker | Worldwide | 2014 |
| Pennsylvania Amphibian and Reptile Survey | Pennsylvania, US | |
| BeeSpotter | USA (IL, IN, MO, OH) | 2007 |
| North American Field Herping Association | North America | 2007 |
| Hare Survey | UK | 2015 |
| Big Moss Map | UK | 2015 |
| Hazelnut Project, The | USA | 2000 |
| Mitten Crab Recording Project | UK | |
| NatureWatch | Canada | |
| Landscape Watch Hampshire | Landscape Change Consortium | 2015 |
| Anecdata | Worldwide | 2013 |
| B.C. Cetacean Sightings Network | Canada (British Columbia) | 1999 |
| Project Discovery II | Worldwide | 2017 |
| Teatime4Science | Worldwide | 2016 |
| SciStarter | Worldwide | 2011 |
Table A2.
Second half of accepted and analysed projects.
Table A2.
Second half of accepted and analysed projects.
| Project Name | Area | Began |
|---|---|---|
| Striped AmBASSadors | NS, Canada | 2010 |
| Project Splatter | UK | 2013 |
| Pieris Project | Worldwide | |
| Garden Wildlife Health | UK | 2013 |
| Report-a-weed | Canada | |
| Cape Citizen Science | South Africa | 2015 |
| Portland Urban Coyote Project | Portland, Oregon, USA | 2011 |
| FrogWatch USATM | USA | 1998 |
| Cities at Night | Global | 2014 |
| Reef Life Survey | Australia | |
| eButterfly | USA, Canada | 2010 |
| Floodcrowd | UK | 2015 |
| TreeSnap | USA | 2017 |
| Big Bug Hunt | USA, UK | 2016 |
| Project Roadkill | Worldwide | 2014 |
| Species Observations System | Norway | 2008 |
| Artportalen | Sweden | 1999 |
| MammalMAP | Africa | 2012 |
| Old Weather | Worldwide | |
| Aquila Project | West Kimberley North Western Australia | 2010 |
| Monarch Health | Canada, USA | |
| Habitat Network | North America | 2012 |
| The Shore Thing Project | UK | 2006 |
| iNaturalist | Global | 2008 |
| AppEAR | Argentina, South America | 2015 |
| Bumble Bee Watch | Canada, USA | 2014 |
| Mosquito Alert | Spain | 2013 |
| Local Environmental Observer Network | Worldwide | 2012 |
| Ontario Reptile and Amphibian Atlas | Canada (Ontario) | |
| Massachusetts Herpetological Atlas | USA | 1992 |
| Vermont Reptile and Amphibian Atlas | USA (VT) | 1995 |
| Michigan Herp Atlas Project | USA (MI) | 2004 |
| Herpetological Education and Research Project | North America | 2007 |
| Turtle Survey and Analysis Tools | Australia | 2014 |
| Amphibian Migrations and Road Crossings | New York, USA | |
| HerpMapper | Global | 2013 |
| CrowdWater | Worldwide | 2017 |
| iSeahorse | Global | 2013 |
| Go Viral Study | USA | 2013 |
| Ontario Butterfly Atlas Online | Canada (Ontario) | 1969 |
| Reef Environmental Education Foundation | Key Largo, USA (FL), Worldwide | 1990 |
| Marine Metres Squared | New Zealand | |
| eOceans | Global | 2014 |
| Monarch Watch | Canada, USA | 1992 |
| eShark | Global | 2005 |
Table A3.
List of discarded projects.
Table A3.
List of discarded projects.
| Project name | Area | Began |
|---|---|---|
| Operation Wallacea | UK | 1996 |
| Identify animals | New Zealand | 2015 |
| BioNote | Worldwide | 2016 |
| Flying ant survey | UK | 2012 |
| Science Gossip Biodiversity Heritage Library | Worldwide | 2015 |
| Galaxy Zoo | Worldwide | 2007 |
| Galaxy Explorer | Australia | 2015 |
| Project Soothe | Worldwide | 2014 |
| ARTigo | Worldwide | 2007 |
| VerbCorner | Worldwide | 2013 |
| AgeGuess | Worldwide | 2012 |
| Diver Safety Guardian | Europe and Africa | 1994 |
| Project Dive Exploration | North America | |
| Radio Galaxy Zoo | Worldwide | 2013 |
| Orca Game | Worldwide | 2013 |
| Reading Nature’s Library | UK | |
| Mark2Cure | USA (CA) | 2012 |
| Disk Detective | Worldwide | 2014 |
| Stardust@Home | Worldwide | 2006 |
| VT Fish Diaries | USA (VT) | 2015 |
| Artsobservasjoner | Norway | 2008 |
| Digital Access to a Sky Century @ Harvard | USA | 2001 |
| Weather Detective | Australia | 2014 |
| Clumpy | Worldwide | 2012 |
| theSkyNet | Worldwide | 2011 |
| Smithsonian Transcription Center | USA | 2014 |
| Doing It Together Science DITOs | Europe | 2016 |
| Notes from Nature | Worldwide | |
| Fraxinus | Worldwide | 2013 |
| Cochrane Crowd | Worldwide | 2016 |
| Plankton Project | Worldwide | 2013 |
| Foldit | Worldwide | 2008 |
| SETI@home | Worldwide | 1999 |
| Socientize | Worldwide | 2012 |
References
- Kemp, K. Encyclopedia of Geographic Information Science; SAGE: Thousand Oaks, CA, USA, 2008. [Google Scholar]
- Geoinformatics Laboratory of Pittsburgh University, 2017. Available online: http://gis.sis.pitt.edu/images/GeoinformaticsDiagram.jpg (accessed on 29 March 2018).
- Gore, A. The Digital Earth. Aust. Surv. 1998, 43, 89–91. [Google Scholar] [CrossRef]
- Gould, M.; Craglia, M.; Goodchild, M.F.; Annoni, A.; Camara, G.; Kuhn, W.; Mark, D.; Masser, I.; Maguire, D.; Liang, S.; et al. Next-generation digital earth: A position paper from the vespucci initiative for the advancement of geographic information science. Int. J. Spat. Data Infrastruct. Res. 2008, 43, 146–167. [Google Scholar]
- Goodchild, M.F. Citizens as sensors: the world of volunteered geography. GeoJournal 2007, 69, 211–221. [Google Scholar] [CrossRef]
- Turner, A. Introduction to Neogeography; O’Reilly Media, Inc.: Sebastopol, CA, USA, 2006. [Google Scholar]
- Sui, D.; Elwood, S.; Goodchild, M. Crowdsourcing Geographic Knowledge: Volunteered Geographic Information (VGI) in Theory and Practice; Springer Science & Business Media: Berlin, Germany, 2012. [Google Scholar]
- See, L.; Mooney, P.; Foody, G.; Bastin, L.; Comber, A.; Estima, J.; Fritz, S.; Kerle, N.; Jiang, B.; Laakso, M.; et al. Crowdsourcing, Citizen Science or Volunteered Geographic Information? The Current State of Crowdsourced Geographic Information. ISPRS Int. J. Geo-Inf. 2016, 5, 55. [Google Scholar] [CrossRef]
- Jokar Arsanjani, J.; Vaz, E. Special Issue Editorial: Earth Observation and Geoinformation Technologies for Sustainable Development. Sustainability 2017, 9, 760. [Google Scholar] [CrossRef]
- Arsanjani, J.J. Remote Sensing, Crowd Sensing, and Geospatial Technologies for Public Health: An Editorial. Int. J. Environ. Res. Public Health 2017, 14, 405. [Google Scholar] [CrossRef] [PubMed]
- Pirasteh, S.; Li, J. Global Changes and Natural Disaster Management: Geo-Information Technologies; Springer: Berlin, Germany, 2017. [Google Scholar]
- ISPRS. IJGI, Special Issue Geoweb 2.0, 2015. Available online: http://www.mdpi.com/journal/ijgi/special_issues/geoweb-2.0 (accessed on 29 March 2018).
- Follett, R.; Strezov, V. An analysis of citizen science based research: Usage and publication patterns. PLoS ONE 2015, 10, e0143687. [Google Scholar] [CrossRef] [PubMed]
- The USA Citizen Science Initiative. Available online: https://www.citizenscience.gov/ (accessed on 29 March 2018).
- Australian Citizen Science Association (ACSA). Available online: http://csna.gaiaresources.com.au/ (accessed on 29 March 2018).
- COST_Actions CA15212, Citizen Science to Promote Creativity, Scientific Literacy, and Innovation Throughout Europe, 2016. Available online: http://www.cost.eu/COST_Actions/ca/CA15212 (accessed on 29 March 2018).
- Wiggins, A.; Crowston, K. From conservation to crowdsourcing: A typology of citizen science. In Proceedings of the 2011 44th Hawaii International Conference on System Sciences (HICSS), Kauai, HI, USA, 4–7 January 2011; pp. 1–10. [Google Scholar]
- Serrano Sanz, F.; Holocher-Ertl, T.; Kieslinger, B.; Sanz Garcıa, F.; Silva, C. White Paper on Citizen Science for Europe; Socientize Consortium, European Commission: Brussels, Belgium, 2014. [Google Scholar]
- Roy, H.E.; Pocock, M.J.; Preston, C.D.; Roy, D.B.; Savage, J.; Tweddle, J.; Robinson, L. Understanding cItizen Science and Environmental Monitoring: Final Report on Behalf of UK Environmental Observation Framework; NERC/Centre for Ecology & Hydrology: Wallingford, UK, 2012. [Google Scholar]
- Wiggins, A.; Bonney, R.; Graham, E.; Henderson, S.; Kelling, S.; LeBuhn, G.; Litauer, R.; Lots, K.; Michener, W.; Newman, G. Data Management Guide for Public Participation in Scientific Research; DataONE: Albuquerque, NM, USA, 2013; pp. 1–41. [Google Scholar]
- Law, E.; Williams, A.C.; Wiggins, A.; Brier, J.; Preece, J.; Shirk, J.; Newman, G. The Science of Citizen Science: Theories, Methodologies and Platforms. In Proceedings of the Companion of the 2017 ACM Conference on Computer Supported Cooperative Work and Social Computing, Portland, OR, USA, 25 February–1 March 2017; ACM: New York, NY, USA, 2017; pp. 395–400. [Google Scholar]
- Eitzel, M.; Cappadonna, J.L.; Santos-Lang, C.; Duerr, R.E.; Virapongse, A.; West, S.E.; Kyba, C.C.M.; Bowser, A.; Cooper, C.B.; Sforzi, A.; et al. Citizen science terminology matters: Exploring key terms. Citiz. Sci. Theory Pract. 2017, 2. [Google Scholar] [CrossRef]
- Newman, G.; Wiggins, A.; Crall, A.; Graham, E.; Newman, S.; Crowston, K. The future of citizen science: Emerging technologies and shifting paradigms. Front. Ecol. Environ. 2012, 10, 298–304. [Google Scholar] [CrossRef]
- Open Geospatial Consortium. Available online: http://www.opengeospatial.org/ (accessed on 29 March 2018).
- Bordogna, G.; Carrara, P.; Criscuolo, L.; Pepe, M.; Rampini, A. On predicting and improving the quality of Volunteer Geographic Information projects. Int. J. Digit. Earth 2016, 9, 134–155. [Google Scholar] [CrossRef]
- Criscuolo, L.; Carrara, P.; Bordogna, G.; Pepe, M.; Zucca, F.; Seppi, R.; Oggioni, A.; Rampini, A. Handling quality in crowdsourced geographic information. In European Handbook of Crowdsourced Geographic Information; Capineri, C., Ed.; Ubiquity Press: London, UK, 2016; p. 57. [Google Scholar]
- Wiggins, A.; Newman, G.; Stevenson, R.D.; Crowston, K. Mechanisms for data quality and validation in citizen science. In Proceedings of the 2011 IEEE Seventh International Conference on e-Science Workshops (eScienceW), Stockholm, Sweden, 5–8 December 2011; pp. 14–19. [Google Scholar]
- Goodchild, M.F.; Li, L. Assuring the quality of volunteered geographic information. Spat. Stat. 2012, 1, 110–120. [Google Scholar] [CrossRef]
- Wikipedia Page: List of Citizen Science Projects. Available online: https://en.wikipedia.org/wiki/List_of_citizen_science_projects (accessed on 29 March 2018).
- Ess, C.; Sudweeks, F. On the edge: Cultural barriers and catalysts to IT diffusion among remote and marginalized communities. New Media Soc. 2001, 3, 259–269. [Google Scholar] [CrossRef]
- International Telecommunication Union, ICT Data and Statistics Division of the Telecommunication Development Bureau. Available online: https://www.itu.int/en/ITU-D/Statistics/Documents/facts/ICTFactsFigures2017.pdf (accessed on 29 March 2018).
- OpenStreetMap. Available online: https://www.openstreetmap.org/ (accessed on 29 March 2018).
- Google Earth. Available online: https://earth.google.com/web (accessed on 29 March 2018).
- Campelo, C.; Elízio, C.; Bertolotto, M.; Corcoran, P. Volunteered Geographic Information and the Future of Geospatial Data; IGI Global: Hershey, PA, USA, 2017. [Google Scholar]
- Mirowski, P. Against Citizen Science, 2017. Available online: https://aeon.co/essays/is-grassroots-citizen-science-a-front-for-big-business (accessed on 29 March 2018).
- Sturm, U.; Schade, S.; Ceccaroni, L.; Gold, M.; Kyba, C.; Claramunt, B.; Haklay, M.; Kasperowski, D.; Albert, A.; Piera, J.; et al. Defining principles for mobile apps and platforms development in citizen science. Res. Ideas Outcomes 2017, 3, e21283. [Google Scholar] [CrossRef]
- Bordogna, G.; Frigerio, L.; Kliment, T.; Brivio, P.A.; Hossard, L.; Manfron, G.; Sterlacchini, S. Contextualized VGI Creation and Management to Cope with Uncertainty and Imprecision. ISPRS Int. J. Geo-Inf. 2016, 5, 234. [Google Scholar] [CrossRef]
- Billiet, C.; de Weghe, N.V.; Deploige, J.; Tré, G.D. Visualizing and Reasoning With Imperfect Time Intervals in 2-D. IEEE Trans. Fuzzy Syst. 2017, 25, 1698–1713. [Google Scholar] [CrossRef]
- Rocchini, D.; Foody, G.M.; Nagendra, H.; Ricotta, C.; Anand, M.; He, K.S.; Amici, V.; Kleinschmit, B.; Förster, M.; Schmidtlein, S.; et al. Uncertainty in ecosystem mapping by remote sensing. Comput. Geosci. 2013, 50, 128–135. [Google Scholar] [CrossRef]
- Karam, R.; Favetta, F.; Laurini, R.; Chamoun, R.K. Uncertain Geoinformation Representation and Reasoning: A Use Case in LBS Integration. In Proceedings of the 2010 Workshops on Database and Expert Systems Applications, Bilbao, Spain, 30 August–3 September 2010; pp. 313–317. [Google Scholar] [CrossRef]
- Bastin, L.; Schade, S.; Mooney, P. Volunteered Metadata, and Metadata on VGI: Challenges and Current Practices. In Mobile information Systems leveraging Volunteered Geographic Information for Earth Observation; Bordogna, G., Carrara, P.P., Eds.; Springer: Berlin, Germany, 2018. [Google Scholar]


© 2018 by the authors. Licensee MDPI, Basel, Switzerland. This article is an open access article distributed under the terms and conditions of the Creative Commons Attribution (CC BY) license (http://creativecommons.org/licenses/by/4.0/).