Method of Constructing Point Generalization Constraints Based on the Cloud Platform
by
 and
and
Jiemin Zhou
1,2,3, 
Jie Shen
1,2,4,*,
Shuai Yang
1,2,
Zhenguo Yu
1,2,
Karel Stanek
5 and
Radim Stampach
5 1
Key Laboratory of Virtual Geographic Environment (Nanjing Normal University), Ministry of Education, Nanjing 210023, China
2
School of Geography Science, Nanjing Normal University, Nanjing 210023, China
3
Department of Geoinformatics—Z_GIS, University of Salzburg, 5020 Salzburg, Austria
4
Jiangsu Center for Collaborative Innovation in Geographical Information Resource Development and Application, Nanjing 210023, China
5
Laboratory on Geoinformatics and Cartography, Department of Geography, Faculty of Science, Masaryk University, Kotlarska 2, 61137 Brno, Czech Republic
*
Author to whom correspondence should be addressed.
ISPRS Int. J. Geo-Inf. 2018, 7(7), 235; https://doi.org/10.3390/ijgi7070235
Submission received: 25 May 2018
/
Revised: 10 June 2018
/
Accepted: 18 June 2018
/
Published: 21 June 2018
Abstract
:As an important part of spatial data, the point feature has always been an essential element in web maps and navigation maps. With the development of location-based services and the rapid increase in volunteered geographic information and social media data, the amount of point data is increasing day by day, resulting in inevitable problems of overlay and congestion during visualization. Map generalization provides multiple algorithms that can be used to select, aggregate and make typification of points or point clusters. For the generalization of point data, however, the traditional stand-alone computing environment has difficulty with real-time realization. Currently, the rapid development of cloud computing technology provides a powerful support for improving the efficiency of map generalization. However, compared with the stand-alone environment, the data decomposition and the real-time display of point generalization in the cloud platform imposes higher requirements on the point generalization constraints, which play an important role in point-generalized process control. Based on the computational characteristics of the cloud platform, this paper analyzes the changes in point generalization constraints. In addition, our work proposes the constraints of point generalization based on the cloud platform and its construction method, builds a prototype system based on the Hadoop cloud platform. Our prototype system is tested using typical experimental data. Its efficiency and the quality of its results is examined. The results show that the efficiency and quality of point selection can be significantly improved by controlling the point generalization process with the generalization constraints in the cloud computing environment proposed in this paper. This paper provides a possible way for the realization of map generalization in the cloud computing environment. Its usability with real data and with many users accessing it will be the focus of further research.
1. Introduction
Point information is an important feature that needs to be visualized in current web maps, mobile maps and even maps with special purposes, such as crisis management [1]. Recently, point data has become a very important part of special big data. In the era of big data, with the development and popularization of social media, the Internet of Things, sensor networks and so forth, the types and numbers of point data have grown dramatically. At the same time, along with the expansion of mobile phone terminal map applications and the increase in wireless network bandwidth, the number of point data displayed by mobile phones is also increasing rapidly. When displaying a large number of point features, many visual problems are inevitably encountered [2]. For example, when performing zooming operations, crowding and overlay between symbols can easily occur. This outcome is even more important in the case of maps for visually impaired users, where the usable map load is much more limited [3]. Using a smaller version of map symbols is a solution only in the case of a small difference between the original and target scale. Online filtering alleviates this problem to some extent, but it only acts as a solution for computer problems and cannot reflect the spatial relationship between the features.
Cartographic generalization is an indispensable technique for transferring or changing the scale of digital maps [4]. It is an important means of modelling and understanding geographical phenomena [5]. Map generalization provides many algorithms to retain the important feature points, or groups of statistics, topics, topological and geometric information [6,7,8,9], to improve the readability of the map [10]. When manually carried out, map generalization can be a very long task for a cartographer, so its automation has been studied by scholars and practitioners for years [11]. Automatic map generalization processes are computationally intensive, and usually they are unable to deal with the size of real region-wide or countrywide geographical datasets [12]. Meanwhile, in order to meet the needs of web maps, on-the-fly generalization, denotes the use of automated generalization techniques in real-time [13], has also become a research hotspot. But all demonstrations of fully automated generalization from a single large scale database are either quite limited in the range of generalization operations that can be performed or not performed in a time that is applicable to online applications [14]. Therefore, it is urgent to further study the real-time realization of map generalization. Some scholars have put forward the methods of establishing a spatial index [15], a progressive integrated strategy [16,17], and constructing a multi-scale spatial database [18] to improve the efficiency of map generalization. Although these methods improve the implementation efficiency of map generalization to some extent, the traditional stand-alone processing approach has reached a bottleneck [19].
Some scholars have also proposed the use of deep learning and data mining techniques to enhance the computational efficiency of map generalization in stand-alone environments. For example, Daoud et al. [20] presented a new model of automated cartographic generalization using spatial data mining and neural networks. Karsznia & Weibel [21] used data enrichment and machine learning to improve the settlement selection for a small-scale map. Lee et al. [22] applied a variety of algorithms in machine learning to building classification to improve the accuracy of automatic map generalization. Although these methods have advantages of rapidly processing large amounts of data and ensuring high accuracy in a stand-alone environment, they also have disadvantages. The algorithms performance gradually varying depending on the data quality [22]. Transfer learning, such as that proposed in [23], transfers the learned and trained model parameters to a new model to help train the new model. Therefore, they can obtain suitable models faster using less training data. In this way, the influence of data quality on these algorithms based on deep learning can be circumvented to some extent. However, their application in map generalization remains to be further studied.
In recent years, new technologies in computer science continue to emerge, such as grid computing, distributed computing, cloud computing and other high-performance computing technologies, that are revolutionary for computational efficiency in the field of spatial information science. Chaowei Yang gave a detailed review of the opportunities and challenges that cloud computing brings to the Digital Earth under the era of big data [24]. Many scholars have conducted research in the area of efficient processing of geographic data [25,26], urban land use [27] and geostatistics [28] in the cloud environment. With the continuous development of cloud computing, high-performance computing of vector-based map generalization has attracted the attention of scholars in this field. Many institutes, such as the Leibniz University Hannover in Germany, have discussed the efficiency optimization of map generalization using Grid computing [29]. Foerster et al. [30] used Grid Computing to increase the efficiency of automated map generalization. Neun et al. [31] and Zhang et al. [32] have discussed and experimented on the application of Multiple Agents in map generalization. Some Chinese scholars have carried out the optimized algorithm of map generalization in the aspects of vector data segmentation [33,34,35] and serial algorithm parallelization [19,36]. However, as a new study direction in the field of automatic generalization, the study of point generalization based on the cloud platform is still in its infancy.
The goal of combining point generalization and the cloud platform is to improve the point generalization efficiency and realize the real-time processing and visualization of a large amount of point data. However, most of the point generalization algorithms only consider the impact of partial constraints on the point generalization process. For example, the residential area ratio algorithm [37] in the point simplification operator only considers the feature point reservation constraint, and the circle growth algorithm [38] only considers the scale and feature point reservation constraints. These algorithms can successfully simplify point features in a stand-alone environment, but they are not suitable for real-time processing in the cloud platform and cannot guarantee that the simplified results are suitable for visualization. This occurs because data decomposition, which is an essential part of data processing in the cloud platform, will cause some global point generalization constraints no longer adapt to the local point generalization calculation, such as the point load. At the same time, the display of real-time point generalization results needs more constraints to be considered, such as the size of the point feature symbol, the nearest neighbor distance between the point features and the spatial topological relationship between the points and other features.
Therefore, this paper studies the constraints of point generalization in the cloud platform, analyzes the relationship between data decomposition and point generalization constraints, explores the changes of constraints in the cloud platform, and proposes point generalization constraints suitable for controlling point generalization parallelization based on the cloud platform. Our work intends to use typical experimental data in the prototype system to implement the circle growth algorithm selected from the point selection operator. This paper provides a possible way for the realization of map generalization in the cloud computing environment. Its usability with the real data (e.g., OpenStreetMap) on the real map server with many accessing users will be the focus of further research.
The rest of the paper is structured as follows: first, the impact of the cloud platform on point generalization constraints is presented in Section 2. In Section 3, the construction method of generalization constraints in the cloud platform is explained, and the experimental testing and its results and discussion are shown in Section 4. Finally, the conclusion and future works are described in Section 5.
2. Impact of the Cloud Platform on Point Generalization Constraints
2.1. The Traditional Point Generalization Constraints
In the traditional manual map generalization, map generalization constraints have always played an important role, and they are the important basis for cartographers to operate and evaluate the results. Map generalization constraints are expressions of map readability conditions, and they represent the general term for mapping methods that use map models to reflect the geographical pattern of regional point features. These map models are usually built through scientific summaries and abstractions by cartographers, based on the purpose of the map, the scale and the geographical pattern of the point features to complete the map generalization task. Weibel [39], Harrie [40] and Ruas [41] argued that the constraints must satisfy three conditions: they are contained within a certain spatial range, they are related to a certain part (such as related to potential topological relations, or the spatial or semantic structure), and they play a specific role in the process of map generalization. Many cartographers have categorized the general constraints of cartography. Among them, Weibel and Dutton [39], who classify the constraints according to the effects of the constraints, are widely recognized. These authors categorized the constraints into five types: graphical constraints, topological constraints, structural constraints, Gestalt constraints, and process constraints. Based on the map generalization knowledge system, this paper summarizes the constraints in the traditional point generalization process by analyzing different algorithms of point generalization, as shown in Table 1.
2.2. The Impact of Data Decomposition and Real-Time Visualization on the Point Generalization Constraints
The overall realization of the point generalization process in the cloud platform is primarily carried out on the server side. In brief, the front end sends the parameters of the display requirements and content (such as the display resolution requirement, display area and display scale) to the server side. The server-side retrieves the needed data, finds the data, and then implements point generalization. Due to the change in the calculation environment in the whole process of point generalization, the point generalization constraints based on the cloud platform not only include the traditional generalization constraints but also have the unique generalization constraints in the cloud platform. Among them, the most important constraint is that the data decomposition in the cloud platform will affect the calculation of the point load in the point generalization constraints.
In a parallel computing framework for the cloud platform, data decomposition is an important factor that affects cloud-computing performance. In the parallel computing framework, data decomposition refers to the method of data storage in network nodes. With this storage, the data are typically copied completely and decomposed independently. In the process of classical cartography computation, such as point generalization, there is a high demand for the spatial distribution of data and spatial topological correlation, which is slightly different from that of the parallel computing framework for the cloud platform. In the first data decomposition, therefore, the spatial relationship and the subsequent calculation of point generalization should be taken into account to avoid more input/output (I/O) costs. However, the data decomposition in the cloud platform poses a challenge to the calculation of the point load in the traditional constraints.
The traditional point loads are primarily calculated based on Töpfer’s law [42]. This method can only calculate the global point load of the map. If it is applied to the point generalization in the cloud platform, the point features will be generated with a fixed ratio in the data-partitioned data blocks. However, the law of the global point load does not necessarily apply to the local point load. Because it only considers the overall carrying capacity of the map, the law of the global point load does not consider the differences in the data-carrying capacity of different local parts. In this case, an area with a very large number of point features is likely to cause a problem because the number of point features after the generalization will likely still be excessive.
Therefore, considering the requirements for data segmentation and real-time front-end display in cloud computing environments, this paper proposes a method to construct the point generalization constraints based on the cloud platform. With the calculation of the local point load, which is the point load of each data block, as a medium, this paper considers the traditional point generalization constraints. These constraints can include the minimum feature size, the minimum distance between features, the topological relations between points and routes, the reservation of feature points, the division of data and the number of nodes as well as other cloud-platform-specific point generalization constraints. These are optimized to achieve high-efficiency and high-quality results of point generalization in the cloud platform.
3. Construction Method of Point Generalization Constraints Based on the Cloud Platform
3.1. Deficiencies of Töpfer’s Law in the Cloud Platform
The number of features that can be maintained at the small scale is an indicator of how much content the map should hold. This number can be used as a direct basis for various studies of map generalization. People’s visual ability is limited, which leads to a limited load on the map. If this limit is exceeded, the readability of the map will be greatly reduced; if the load is too small, it will not successfully meet the needs of the reader. Considering these two aspects, a suitable load is crucial. The calculation of the number of features that can be maintained in a small scale has been studied in-depth previously [42,43]. To describe the change in the number of features with a change in the scale, an important model of map generalization is often used, called Töpfer’s law. The formula is as follows:
where Nf is the number of features on the target map, Ns is the number of features on the original map, Ms is the denominator of the original map scale, and Mf is the denominator of the target map scale. This formula can be used to calculate the number of features that satisfy the map load demand at the target scale.
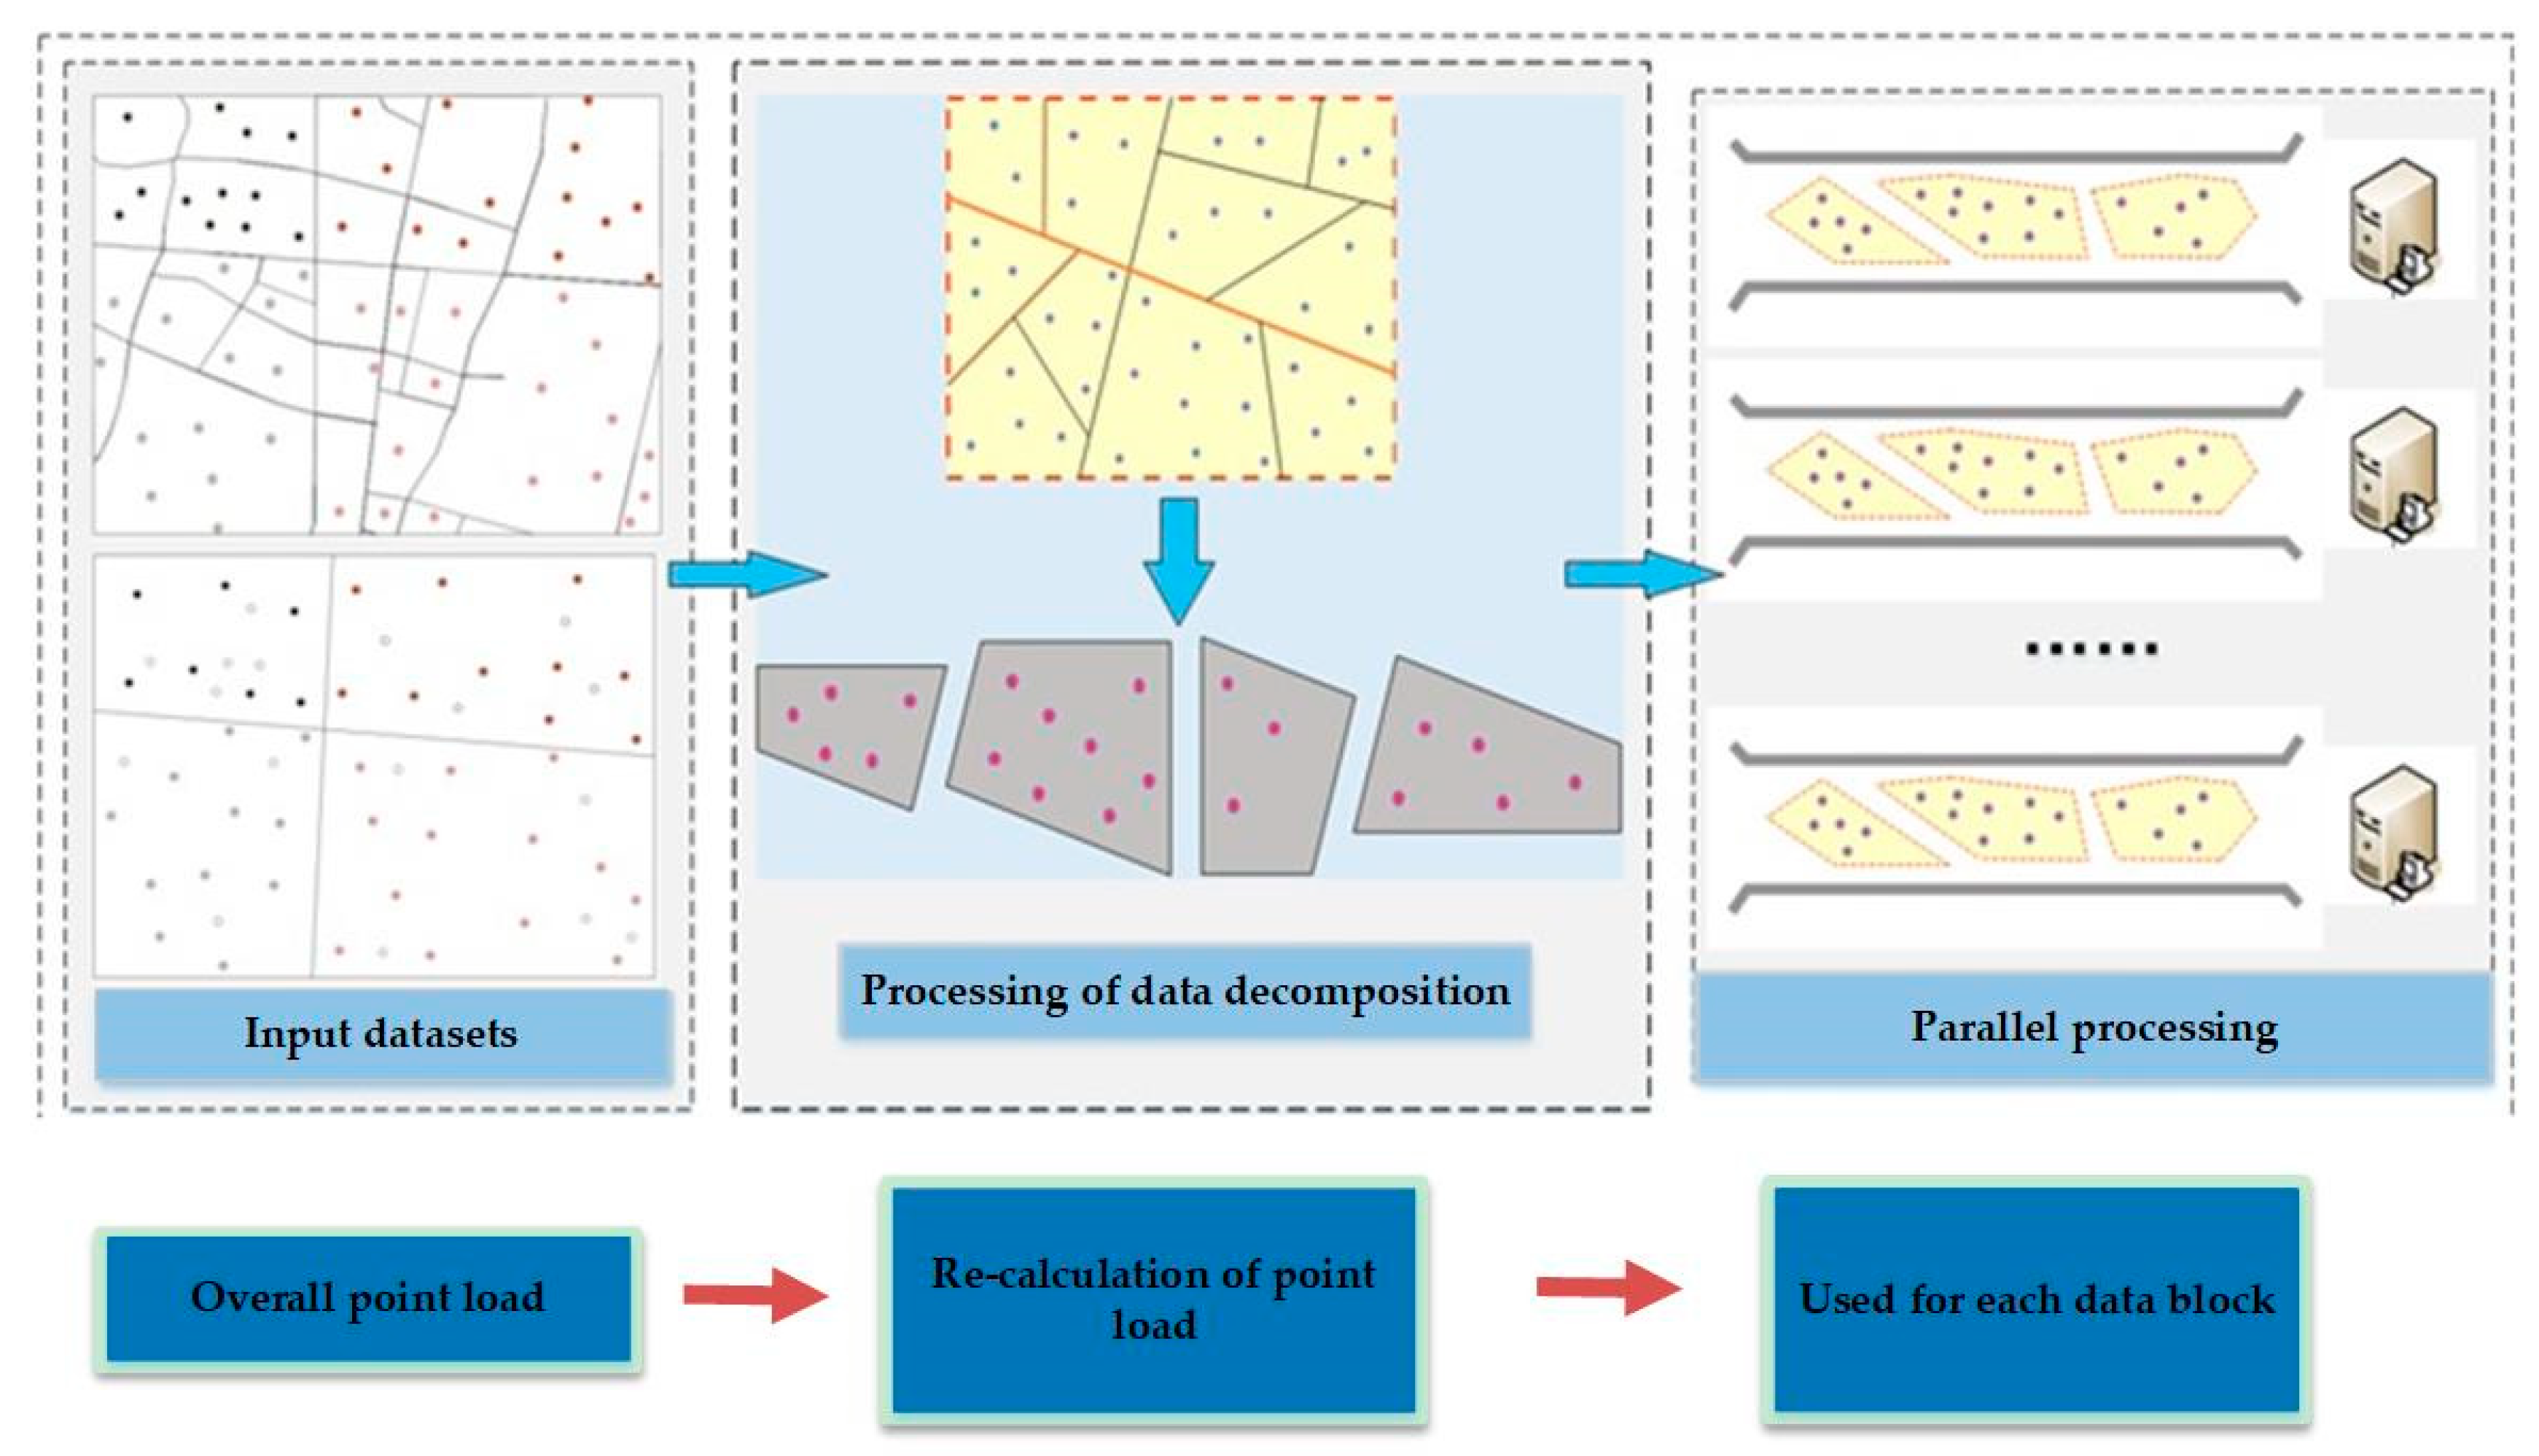
From Equation (1), we can see that the traditional point load calculation method can only calculate the overall point load of the map. However, in the cloud platform, after the point decomposition, the traditional Töpfer’s law cannot satisfy the calculation of each block. It is also difficult to maintain the spatial distribution of point groups after map generalization. Figure 1 shows the impact of data decomposition on the point load calculation of the map. This paper attempts to comprehensively consider the constraint effect of the route meshes and Töpfer’s law on the point load, to maintain the spatial distribution characteristics of point group while meeting the requirements of the MapReduce parallel computing framework. It is important to note that the route mesh must also be generalized appropriately for the target scale. A possible solution can be found in [44].
3.2. The Capacity of Route Meshes—The Local Point Load
In some maps, routes and route meshes have natural topological and geometric constraints on point features. On the one hand, for the point features in the route mesh, the size of the route mesh and the living space of the point features (the minimum of which is defined by the size constraints of the point features symbol plus the minimum distance between the points) jointly determine the number of point features that the mesh can hold and clearly render. On the other hand, for the point features that are distributed outside the route mesh, the geometric constraints of the route to point features limit the number of point features that can be clearly expressed on both sides of the road section. That is, the length of a road section should be greater than or equal to the sum of all the point symbol diameters plus the minimum interval on the road side. Therefore, the calculation of the local point load must be divided into two parts: the point load within the mesh and the point load outside of the mesh. The algorithm flow is shown in Figure 2, and the detailed process is described in the subsections below.
3.2.1. Point Load Calculation within the Mesh
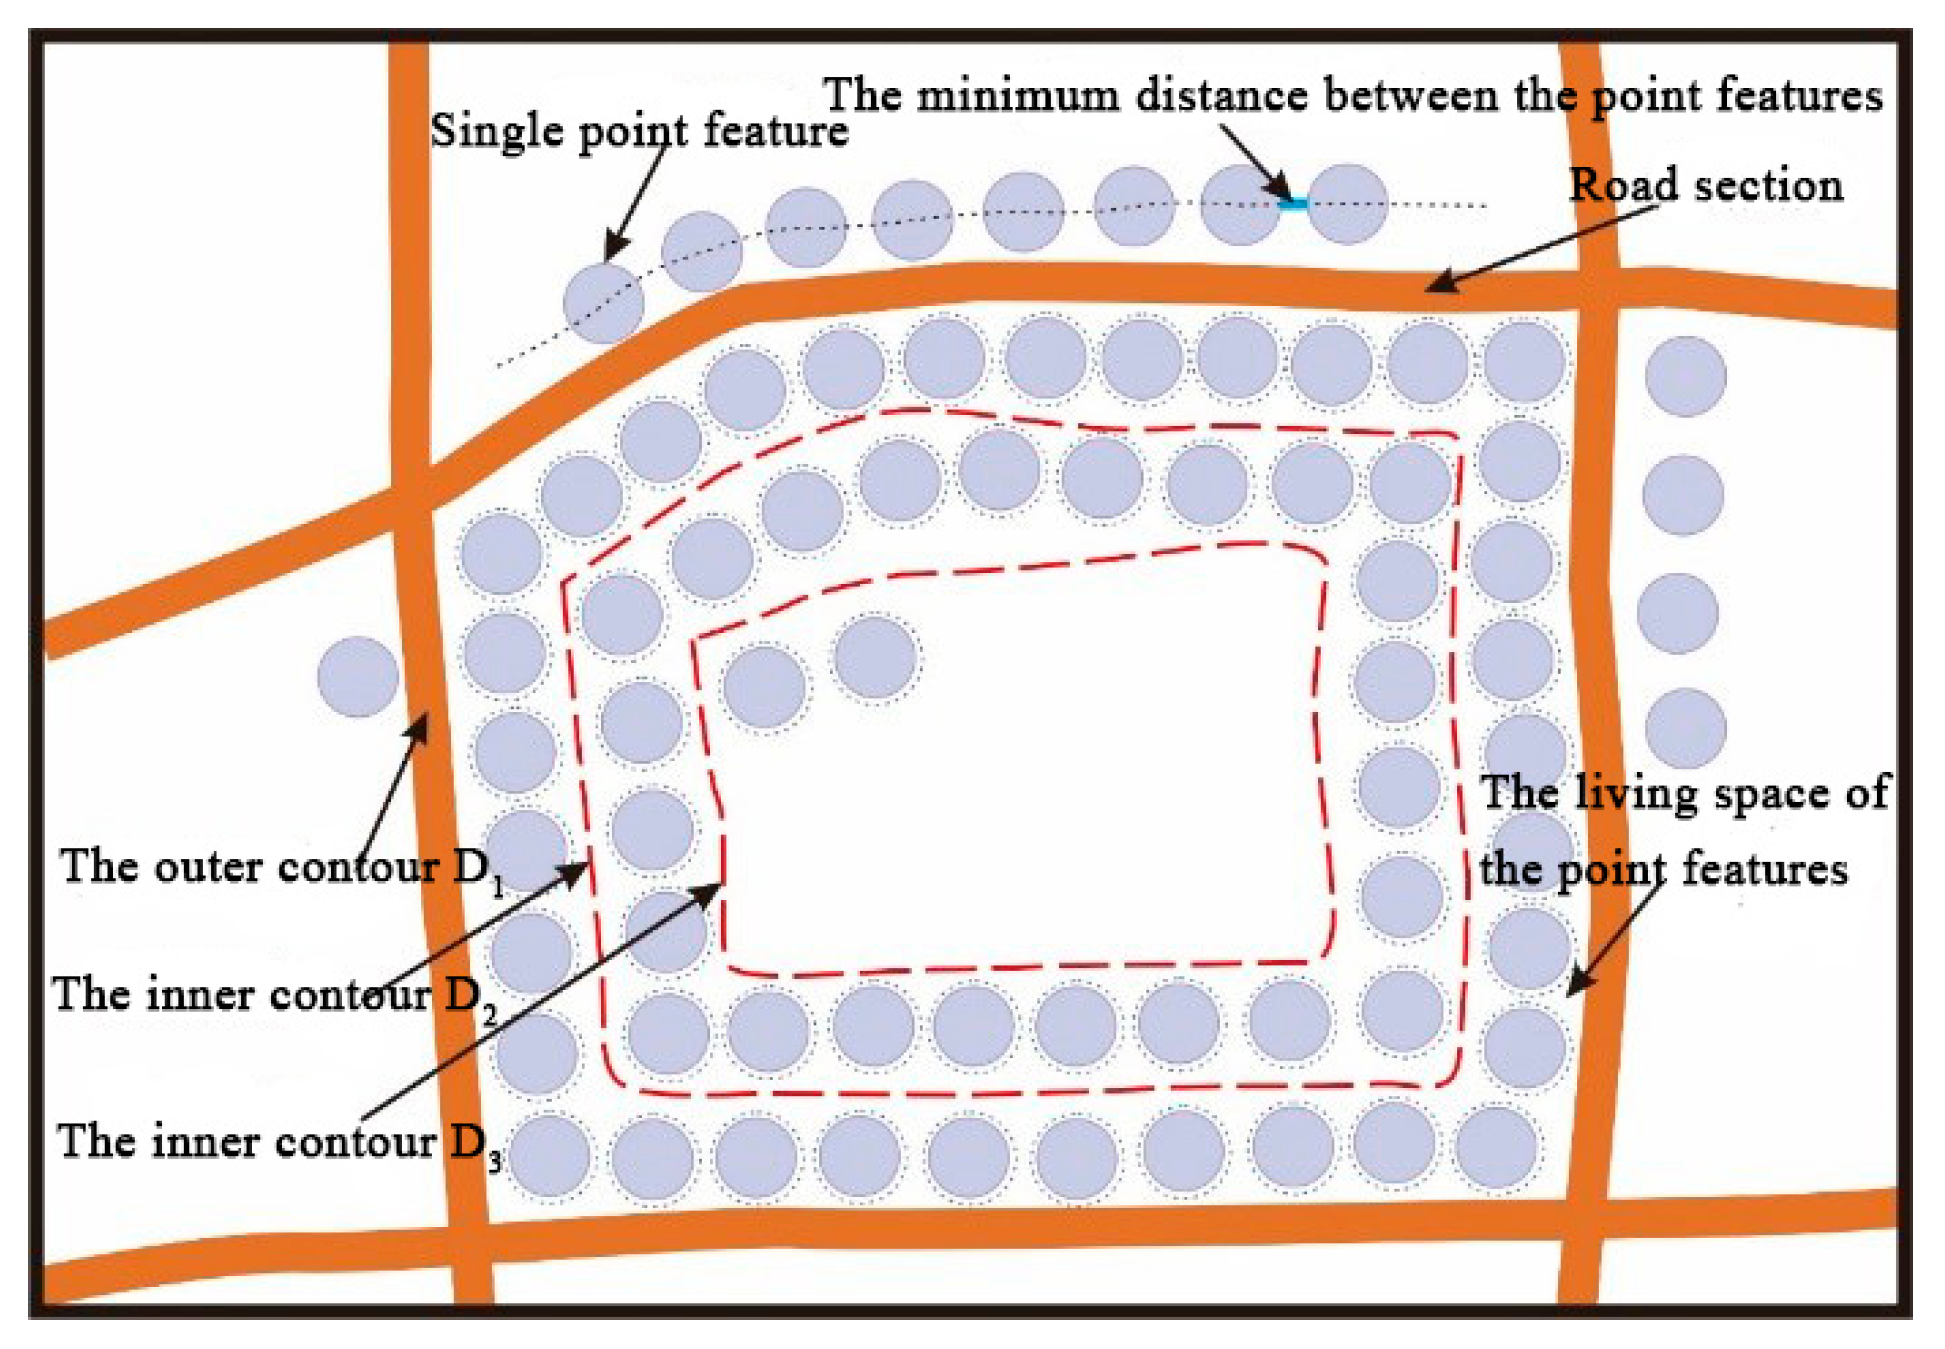
As shown in Figure 3, there is a geometrical constraint relation between the route meshes and the point features. Let D1 denote the outer contour of the mesh and D2 denote the inner contour of points that fill a circle along D1. The same method can be used for D3, D4, D5, and so on. E1 is the number of points that fill a circle along D1 and E2 is the number of points that fill a circle along D2. The total number of points, Nump_mesh, in a data block is calculated as follows:
where Pi is the number of points in i-th route mesh, and N is the number of route meshes.
The number of Ei is determined by the edges that make up Di. The constraints of each edge on the points are similar to the constraints of road sections on points. The formula to calculate Ei can be given as:
where l is the actual length of each road section of the polygon that constitutes the Di contour, Mf is the denominator of the target scale, Ne is the number of sides of the polygon, r is the radii of the point features and d is the minimum distance between the point features. In this section, the minimum distance between the point symbols, the size of the point symbol required for front-end rendering and the geometry and topological constraints of route mesh to point features, are taken into account to calculate the maximum number of point features that the route mesh can accommodate.
3.2.2. Point Load Calculation Outside of the Mesh
In the previous subsection, the number of point features within the route network was calculated. On a map, however, there are always point features at the edge that cannot be included in the route meshes. To calculate the number of these point features requires the constraint of routes to point features, where the length of the road section should be greater than or equal to the sum of the point symbol diameters plus the minimum distance between point features located on one side of the route. Therefore, the number of point features, Nump_road, controlled by the road section constraint is as follows:
where LR represents the actual total length of all sections in a local area. Because both sides of the road are distributed with point features, a constant of 2 is added to the formula.
3.2.3. The Local Point Load
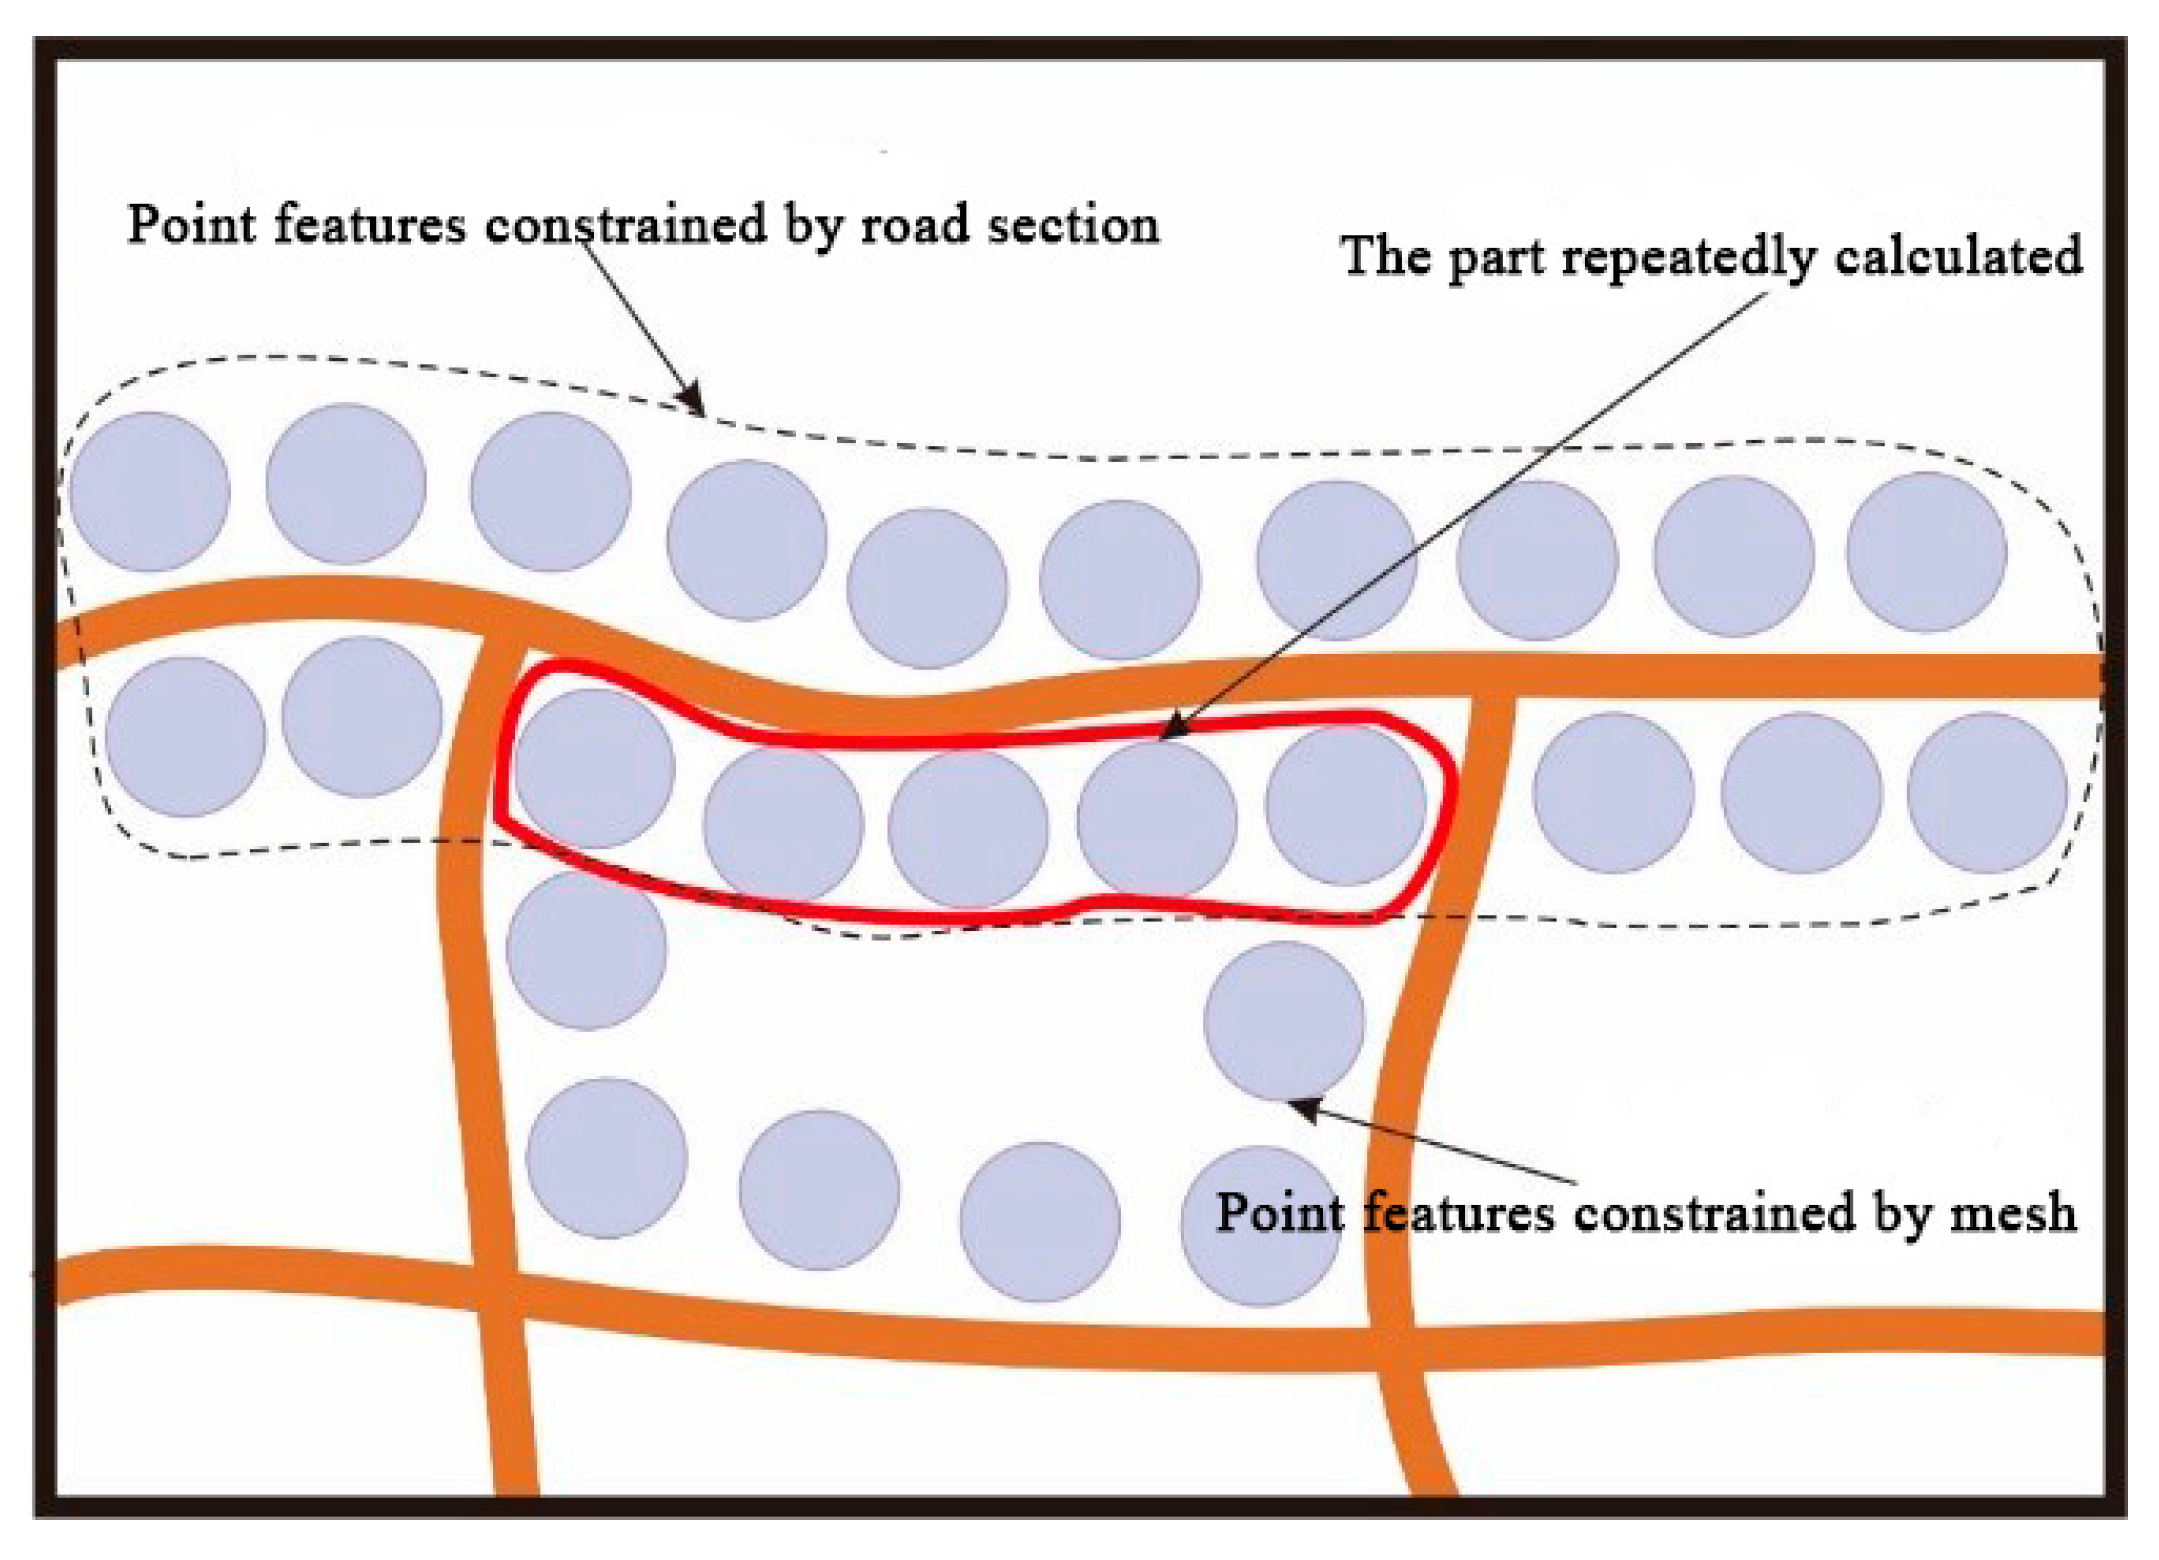
In the previous two subsections, the number of point features inside and outside of the road mesh was calculated, and the local point load is the sum of the two results. However, in comparing the two parts of the calculation process, it is not difficult to find that the number of point features located on the side of the road and belonging to the route mesh is calculated twice, as shown in Figure 4. Therefore, the number of points constrained by the mesh edge needs to be recalculated. The method for calculating the number of points constrained by the mesh edge is similar to that of the road section, and the formula is as follows:
where Qi denotes the number of points under the constraint of the routes (mesh edges) that constitute each mesh, and Li denotes the actual length of the mesh edge of each mesh.
From Equations (2)–(5), the local point load (LPL) formula can be written as follows:
where Nump_mesh is the number of points that can be clearly displayed within the mesh, Nump_road is the number of points constrained by the road section, and Nump_repeated is the number of points constrained by the mesh edges.
According to Equation (6), the local point load can be calculated. However, this result is in fact the maximum value of the local point load limited by the geometric and topological constraints of the road and route mesh to the point elements, and the minimum distance between the point element symbol size and the point elements. Because of this, problems will arise when the number of local point features before point generalization is smaller than that calculated in Equation (6), and the point features will not be generalized. Such a result is likely to violate Töpfer’s law based on the number of point features in the entire map after point generalization. Therefore, the result of Equation (6) will be compared with the Töpfer’s law calculation result for the data block of each local region, and then the smaller of the two will be used as the local point load for the data block.
According to the above method, the point load within a data block can be calculated accurately. In the process of calculating the local point load, the constraints of the route meshes on the points, the size of the point features, the minimum adjacent distance between point features, the map scale and other constraints are all taken into account to form a complete construction method of point generalization constraints based on the cloud platform. This method can control not only the process of point generalization in the cloud platform but can also generate point generalization results that meet the requirements of the front-end display and achieve real-time processing and display of the point generalization.
4. Experiments and Discussion
4.1. Design of Experiment
4.1.1. Experimental Platform
To validate the above method, we designed and implemented a point generalization prototype system based on the Hadoop cloud platform and selected the circle growth algorithm, which is one of the important point generalization selection algorithms to achieve. The framework of the prototype system is shown in Figure 5. The Hadoop cluster contains nine nodes. Each node corresponds to a virtual machine in the VMware software that runs a CentOS 7 system, and each virtual machine has 4 GB of Random Access Memory (RAM), a dual-core single-processor and a 20 GB hard drive. The host computer for the virtual machines is a server running Windows Server 2000 with an Intel Xeon processor X5650, 96 GB of RAM and a 2 TB hard drive. The entire point selection process with suggested constraints is based on the MapReduce parallel computing framework of the Hadoop cloud platform and is written in the JAVA language.
As a control group, a stand-alone computing environment was also used in the experiment. The stand-alone station, just like a cluster node, is a virtual machine in VMware, whose host computer is the same as mentioned above. Similarly, it runs CentOS 7, and has 4 GB of RAM, a dual-core single-processor and a 20 GB hard drive.
The circle growth algorithm was implemented for each data block in the cloud platform, and the number of preserved points is controlled by the constraints suggested in Section 3.2. As a control group, the circle growth algorithm was also implemented in stand-alone computing environment, but the number of preserved points is calculated by the Töpfer’s law. Both the computational efficiency and the calculation results were compared to verify the effect of the proposed method on the efficiency and quality.
4.1.2. The Circle Growth Algorithm
In the circle growth algorithm [7,38], a circle is drawn around each point in the point group. The radius of the circle is proportional to the importance of its corresponding point, the proportional coefficient is C, and the formula is described as C × Wi = Ri (Wi is the weight value of i-th point feature, Ri is the radius of the circle for i-th point.). The initial of C is set such that no circle will overlap. Then the value of C is increased so that one or more circles of less important points will be contained by the circle of a more important point. The one covered by a larger circle is given a lower ranking, while the one with a larger circle is assigned a higher ranking. This process is repeated until the most important circle remains. In the end, points with low ranking will be deleted based on the number of points to be preserved and other special selection rules.
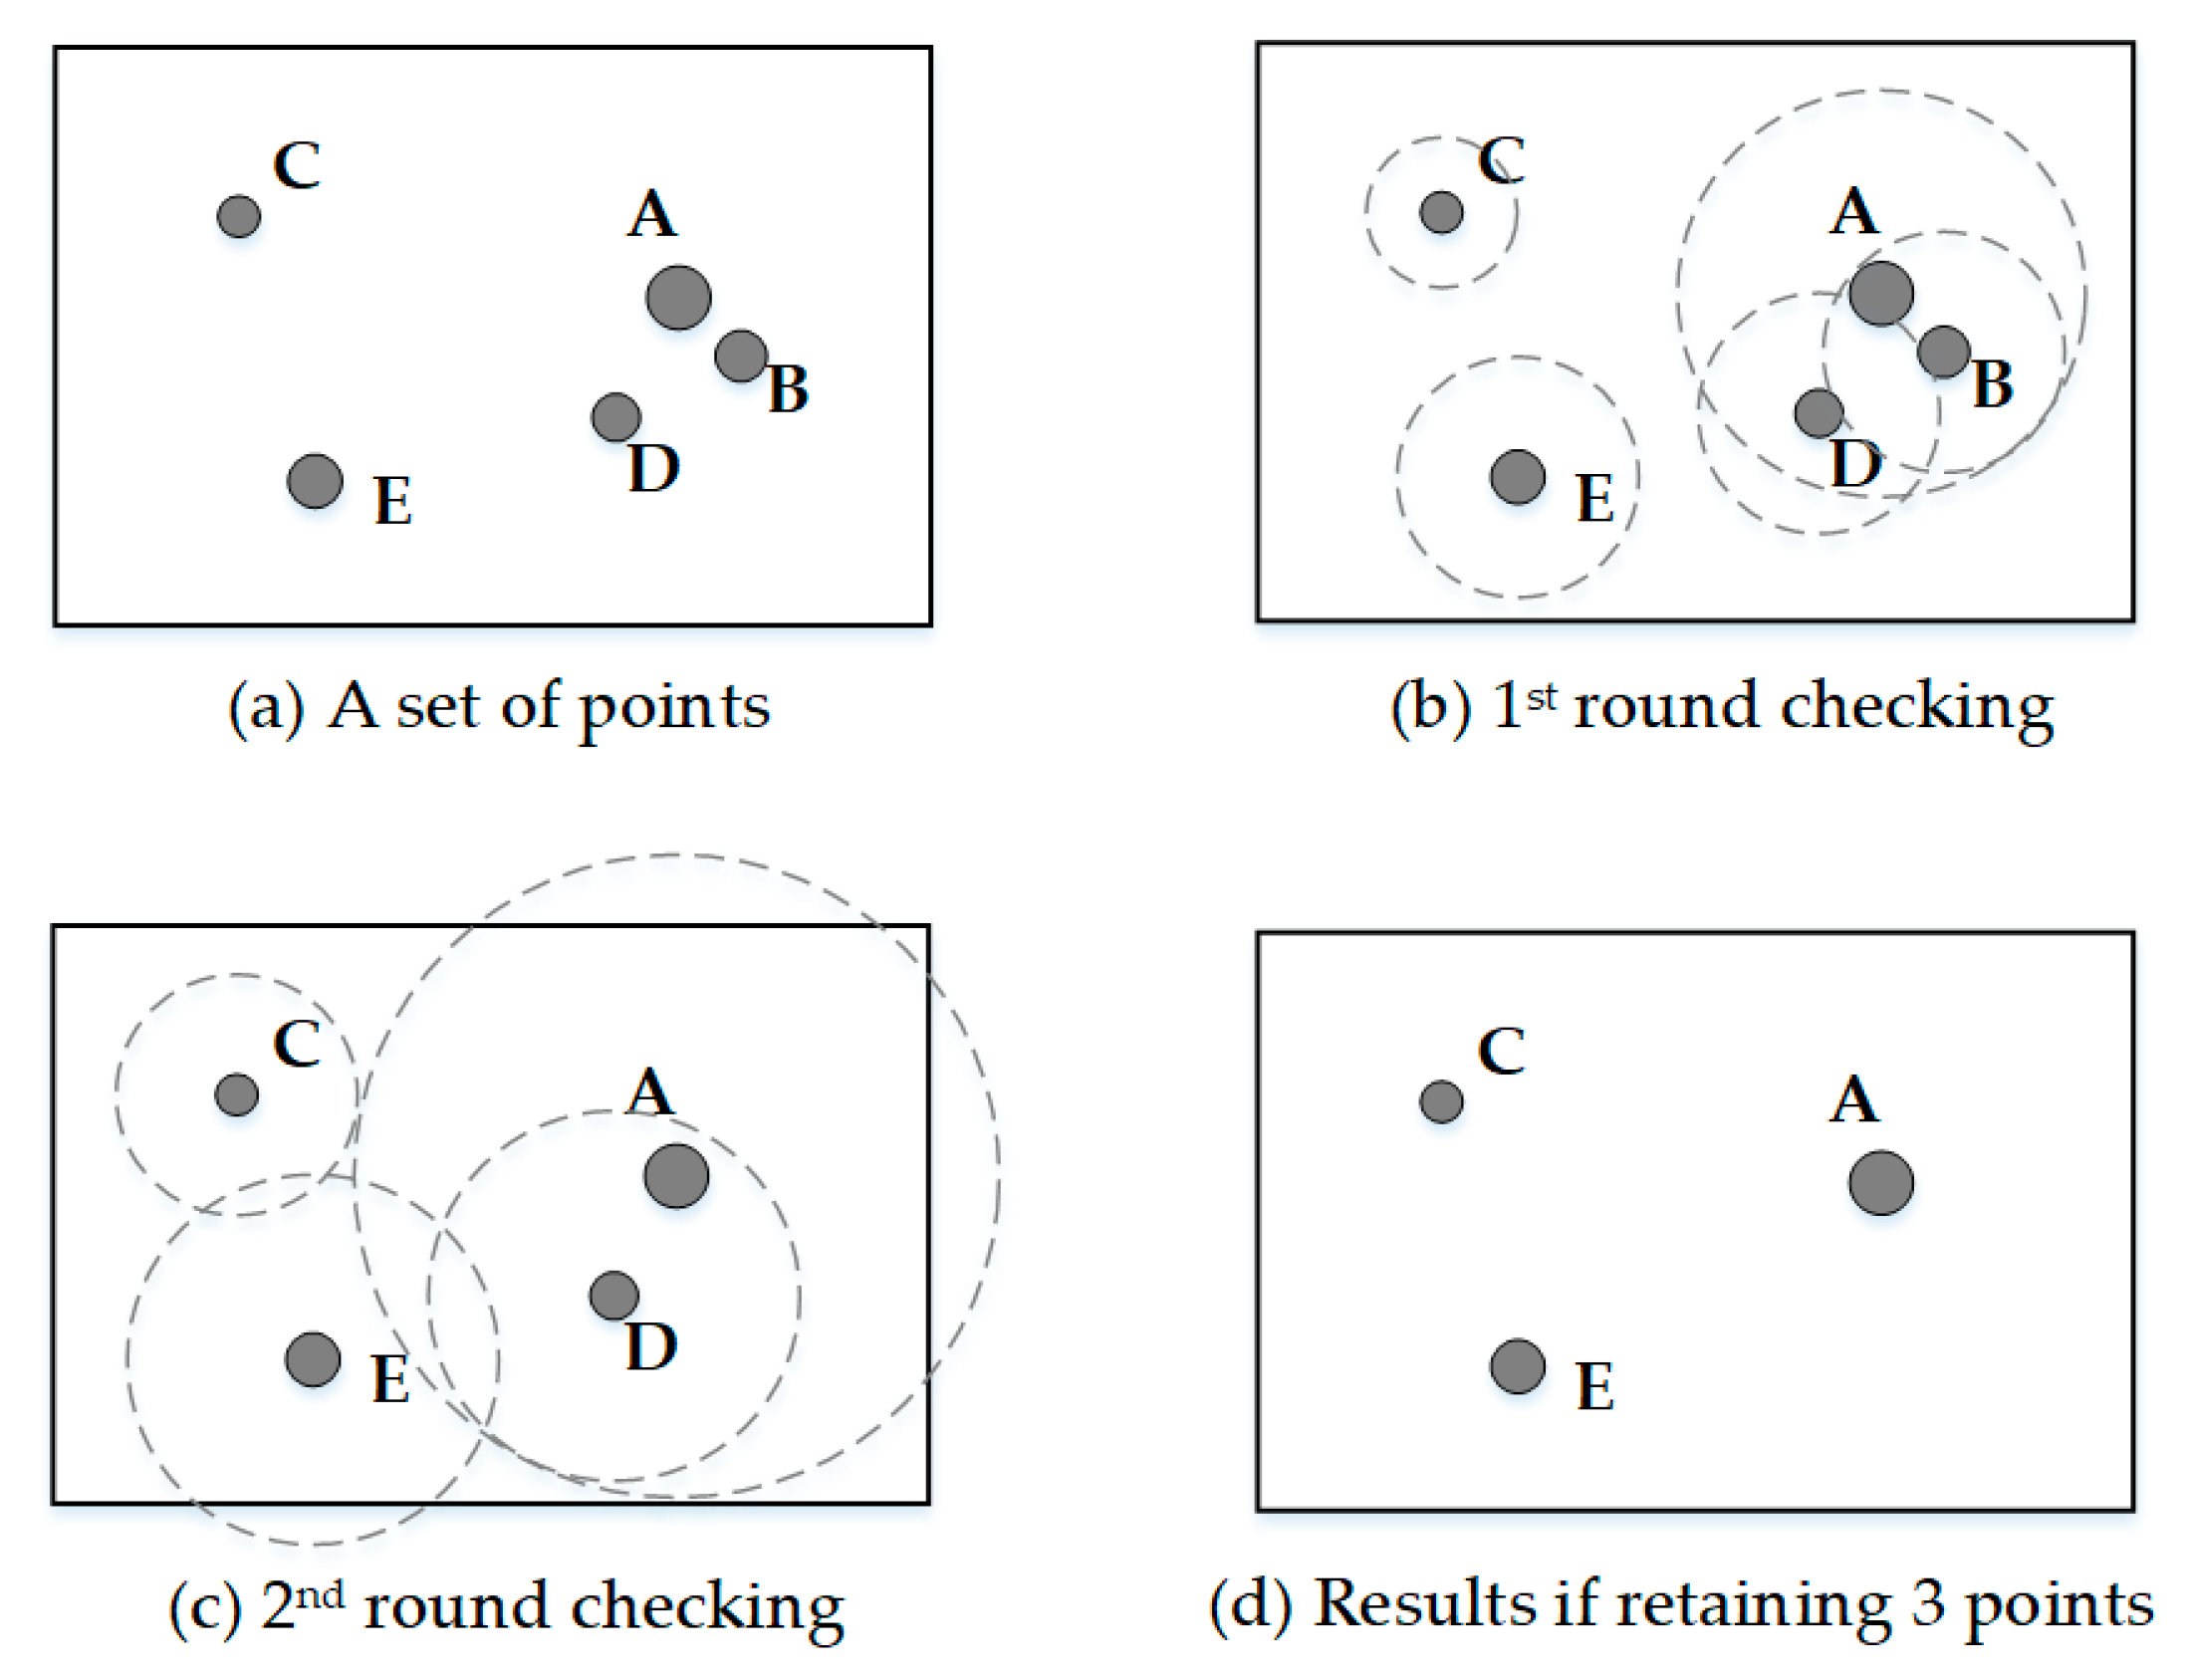
Figure 6 shows a selection process by circle growth algorithm. Figure 6a shows a set of five points with three different levels of importance. Figure 6b shows the first round of circle growth so that the circle of point A first covers that of point B. Point B is then given the lower ranking and is the first removed. Figure 6c shows the second round of circle growth so that the circle of point A first covers that of point D. Point D is then given the lower ranking and is removed if appropriate. This process continues until the last point remains. Figure 6d shows the result if one decided to select three points from the set of data [7].
Because there are no other special point selection rules in this experiment, we have made an appropriate simplification of the algorithm, that is, when the number of point data given the lower ranking reaches the number of points not to be preserved, the algorithm ends. The simplified algorithm was implemented in both cloud and stand-alone environments. The only difference is that the number of reserved points in each data block in the cloud platform is calculated by the method proposed in this paper, and the number of reserved points in a stand-alone environment is calculated by Töpfer’s law.
4.1.3. Experimental Data
In the experiment, we used the point data of three cities with different road network structures: the Xinjiekou District in Nanjing, Xi’an and Beijing. Because the measured data are only from the Nanjing, Xi’an and Beijing datasets and because their data volumes are relatively small, they cannot fully reflect the impact of different magnitudes of data on the efficiency of the point selection algorithm under the control of the cloud platform point generalization constraints. Therefore, ArcGIS 10.2 was used to generate a large number of points randomly in the Xi’an urban area to form 6 simulated point datasets of 10,000, 300,000, 500,000, 1 million, 2 million and 3 million points. The experimental data are in an Environmental Systems Research Institute (ESRI) Shapefile format, and the detailed information is shown in Table 2.
4.2. Experimental Results
4.2.1. Results of the Algorithm Efficiency under the Control of the Constraints
To analyze the operating efficiency and the quality of the point generalization results, the circle growth algorithm was realized with the experimental data of Nanjing, Xi’an and Beijing in stand-alone station (with number of reserved points calculated by the Töpfer’s law without constraints suggested in this paper) and in the cloud platform with the number of reserved points calculated with constraints suggested in this paper. Table 3 shows the processing time of 1 node, 3 nodes, 6 nodes and 9 nodes in the Hadoop cloud platform and the processing time in stand-alone stations. For the point selection calculation with a large amount of points, the computational time in the environment using generalization with suggested constraints is significantly smaller than that in the environment using generalization without suggested constraints (Table 3).
To check the processing efficiency of the point selection algorithm based on the Hadoop cloud platform, the point selection algorithm was implemented with the six simulated datasets in the environment using generalization with suggested constraints. The experimental results are shown in Table 4. A higher number of nodes means shorter time but only in case of a higher amount of data. In case of small data, a higher number of nodes does not bring any improvement.
4.2.2. Preservation of Spatial Pattern under the Control of the Constraints
Figure 7a,b show the measured route data and the point data of Xi’an City. Although the points are distributed throughout the urban area, they are more concentrated in the center of the city. Figure 7c shows the results of the circle growth algorithm in the stand-alone computing environment and Figure 7d shows the results of the circle growth algorithm in the point generalization prototype system. Comparing the three, we find that the distribution of points after the point selection in the serial computing environment is relatively loose and uniform, the distribution density of the points in each region is not much different. However, the distribution of the points calculated with the constraints in the cloud platform is more concentrated in the center, and the point distribution is more and more sparse towards the suburbs. This maintained the spatial distribution characteristics of the original point group relatively well.
4.3. Discussion
4.3.1. Efficiency Analysis
Speedup is an indicator that is commonly used in evaluating parallel computing performance, and it is calculated as follows:
where TS is the execution time of the algorithm in the serial computing environment, TP is the execution time of the algorithm in the parallel computing environment.
Table 5 shows the speedup of the point selection algorithm with 1, 3, 6, and 9 nodes. These results show that the point generalization efficiency in the cloud platform increases steadily as the number of computing nodes increases. Similarly, computational efficiency increases with the amount of data.
Although the hardware configuration of 1 node and the stand-alone environment is the same, the computational efficiency in 1 node is still greatly improved. This is because the point generalization process in 1 node is controlled by the constraints suggested in this paper. With the control of the constraints, fewer points are preserved while guaranteeing the spatial distribution of the points to ensure the readability of the map. According to the description of the simplified circle growth algorithm in Section 4.1.2, therefore, the calculation process of point generalization will be greatly shortened. Moreover, the efficiency will increase significantly with the increase of the original data volume.
With the increase in the number of computer nodes, the increase in computational efficiency is more dependent on the proper ratio between the number of nodes and the amount of data. To clearly reflect the impact of multi-nodes in the environment using generalization with suggested constraints on computational efficiency, the ratio of the runtime of 1 node to the runtime of multiple nodes is calculated (R = RT1/RTn. RT1 represents the runtime of 1 node, and RTn represents the runtime of n nodes.) as shown in Figure 8. It can be seen from the Figure 8 that although more computing nodes can obtain relatively better computational efficiency, as the number of computing nodes increases, the corresponding computational efficiency tends to be stable. Especially in case of small data, a higher number of nodes does not bring any improvement.
However, it is important to say that our tests used only experimental data, and the relationship between the number of computing nodes and the computational efficiency has not been investigated. Complex tests with real data (e.g., OpenStreetMap) and with a simulation of thousands of users must be done to evaluate if this prototype could be used in a real map server with real data. These will be a focus of further study.
4.3.2. Quality Analysis
The efficiency of the algorithm described in Section 4.3.1 is important, however in case of map generalization, the quality of the result is more important than the efficiency. In the results of the point selection algorithms, the maintenance of the spatial distribution of point clusters can be said to be one of the most intuitive quality-evaluation indicators. The maintenance of spatial distribution characteristics can enable readers to intuitively understand the degree of spatial aggregation of current elements at each level of detail, and help them not miss some hot spots. As shown in Figure 7, the comparison between (b), (c) and (d) shows that the point generalization process in the environment using generalization with constraints suggested in our paper can better maintain the spatial distribution characteristics of point groups. While reducing the user’s visual burden, the spatial topology of point clusters is preserved to the maximum extent.
This is because the point generalization constraints proposed in this paper provide a calculation method of the local point load. In the process of calculating the local point load, more traditional point generalization constraints are also added. The algorithm of circle growth in the experiment no longer only relies on the calculation of the point load and feature point preservation, but also on the scale, the size of the point features, the minimum neighboring distance between the point features and the topological relations between the points and the routes. The circle growth algorithm itself is limited to every route mesh, which ensures the consistency of the topological relations between points within the route mesh. In addition, the topological relations among the data blocks remain unchanged because of the transmission of routes. In other words, the topology between overall point group and other features will be consistent after the point generalization, because the topological relations between the point groups within the meshes and the routes remain unchanged after the point generalization and the routes themselves are not changed.
Kreveld et al. [37] presented that a big drawback of the circle growth algorithm is that it is difficult to preserve density locally. Although the method proposed in this paper is not specifically proposed for the circle growth algorithm, from the experimental results, the circle growth algorithm controlled by the method can well compensate this problem. Our method provides a possible solution for some point generalization algorithms [45] that are difficult to be directly applied to network mapping, because their results quality is flawed due to limited constraints considered.
It is worth noting that, although compared with Figure 6c, Figure 6d omits the points in the sparse and blank area, this does not affect the practicality of the point generalization results. On the one hand, the point generalization results controlled by this method can provide readers with the overall distribution of point features so that they can find popular areas. This is one of the most common purposes for map users. On the other hand, the proposed method comprehensively considers a variety of traditional point generalization constraints including the Töpfer’s law, so the results of the point generalization controlled by this method in the large scale and relatively sparse areas are not much different from those in a stand-alone environment. Therefore, readers can choose different levels of details to find the goals they want. At the same time, all points in the experiment are given the same weight. In actual use, different weights will cause more important point features to be retained in the sparse areas for readers to find.
5. Conclusions
The combination of the cloud platform and point generalization can effectively solve the various problems of massive point data visualization, such as overlay, congestion and other issues. However, compared with the stand-alone environment, the data decomposition and the real-time display of point generalization in the cloud platform imposes higher requirements on the point generalization constraints. Data decomposition makes partial global constraints difficult to adapt to local point generalization calculations. For example, the global point load calculation method based on Töpfer’s law in the stand-alone environment cannot guarantee the correctness of the point load in each data block after data partitioning. In addition, the real-time display of point generalization results requires more front-end display constraints to be taken into account to ensure a clear display of point generalization results, including the size of the point feature symbol, the nearest neighbor distance between the point features and the spatial topological relationship between the points and other features.
This paper presented the constraints of point generalization based on the computational characteristics of the cloud platform and its construction method. The method of calculating the local point load of each data block was used as an intermediary to integrate a variety of point generalization constraints, including the minimum feature size, the minimum distance between features and the topological relations between points and routes while reserving feature points, data decomposition and the number of nodes. This method not only comprehensively considered various kinds of point generalization constraints but also aligned it with the cloud computing platform.
To verify the effectiveness and efficiency of the method, this paper used the data from test areas and implemented a point selection algorithm controlled by the point generalization constraints in the Hadoop cloud platform. The results based on experimental data of different regions proved that the point generalization constraints proposed in this paper can serve the same constraint role for the point generalization process of different data. Compared with the stand-alone computing environment using generalization without constraints, the computational efficiency can be greatly improved, and more importantly the spatial distribution characteristics of the points after the point generalization can be better maintained. In addition, the constraints brought by the front-end visualization requirements also make the point generalization results directly applicable to front-end display.
Hadoop is used as a research entry point and experimental platform in this paper, but the proposed method is not limited to use in Hadoop. It can be applied to Spark or other parallel processing frameworks. Although this method can also be used in a stand-alone environment, it is not the main application target of this method. This study may have great application value in real-time map generalization in the era of big data. It provides a possible way for the realization of map generalization in the cloud computing environment.
However, our approach is still limited. The first limitation is that our tests of the prototype using constraints suggested in our paper used only experimental data. Complex tests with real data and with a simulation of thousands of users must be done to evaluate if this prototype could be used in real map server with real data. These will be a focus of further study.
The second limitation is that the constraints of route meshes play a very important role in the algorithm. This method is, therefore, more suitable for urban areas or other maps that contain many roads, such as initial step to next processing on Points of Interest (POIs) in special purpose topographic maps or the multiscale extension of the dot maps. Additionally, map generalization includes not only point generalization but also line and polygon generalization, among which there are a large number of algorithm operators. Further study is needed to determine how to extend the present generalization constraints so that these algorithms can be implemented in the cloud platform.
Author Contributions
J.S. designed the concept and experiments. J.Z. conducted the experiments and analyzed the results, and wrote the main part of the paper. S.Y. and Z.Y. were in charge of developing the prototype system. R.S. and K.S. helped analyze the experimental results. All the authors contributed in writing and revising the paper.
Funding
The research work presented in this paper is supported by the National Key R&D Program of China (2016YFE0131600), the National Natural Science Foundation of China project No. 41671457, the project of Ministry of Education, the Key Laboratory of Geological Information Technology, Ministry of Land and Resources, Beijing, China under Contract (2016305), and the project of the Ministry of Education, Youth and Sports of the Czech Republic (project No. LTACH-17002).
Conflicts of Interest
The authors declare no conflict of interest.
References
- Staněk, K.; Friedmannová, L.; Kubíček, P.; Konečny, M. Selected issues of cartographic communication optimization for emergency centers. Int. J. Digit. Earth 2010, 3, 316–339. [Google Scholar] [CrossRef] [Green Version]
- McKenzie, G.; Janowicz, K.; Gao, S.; Yang, J.-A.; Hu, Y. POI pulse: A multi-granular, semantic signature—Based information observatory for the interactive visualization of big geosocial data. Cartogr. Int. J. Geogr. Inf. Geovisualization 2015, 50, 71–85. [Google Scholar] [CrossRef]
- Stampach, R.; Kubicek, P.; Herman, L. Dynamic visualization of sensor measurements: Context based approach. Quaest. Geogr. 2015, 34, 117–128. [Google Scholar] [CrossRef]
- Park, W.; Yu, K. Hybrid line simplification for cartographic generalization. Pattern Recognit. Lett. 2011, 32, 1267–1273. [Google Scholar] [CrossRef]
- Mackaness, W.; Burghardt, D.; Duchêne, C. Map generalisation: Fundamental to the modelling and understanding of geographic space. In Abstracting Geographic Information in a Data Rich World; Springer: Berlin, Germany, 2014; pp. 1–15. [Google Scholar]
- Timpf, S. Abstraction, levels of detail, and hierarchies in map series. In Lecture Notes in Computer Science (including Subseries Lecture Notes in Artificial Intelligence and Lecture Notes in Bioinformatics); Springer: Berlin, Germany, 1999; Volume 1661, pp. 125–140. [Google Scholar]
- Li, Z. Algorithmic Foundation of Multi-Scale Spatial Representation; CRC Press: Boca Raton, FL, USA, 2006. [Google Scholar]
- Scott, D.W. Multivariate Density Estimation: Theory, Practice, and Visualization; John Wiley & Sons: Hoboken, NJ, USA, 1992; Volume 156, ISBN 0471547700. [Google Scholar]
- Peters, S. Quadtree- and octree-based approach for point data selection in 2D or 3D. Ann. GIS 2013, 19, 37–44. [Google Scholar] [CrossRef]
- Edwardes, A.; Burghardt, D.; Weibel, R. Portrayal and generalisation of point maps for mobile information services. In Map-Based Mobile Services: Theories, Methods and Implementations; Springer: Berlin, Germany, 2005; pp. 11–30. ISBN 3540230556. [Google Scholar]
- Foerster, T.; Stoter, J.; Kraak, M.-J. Challenges for Automated Generalisation at European Mapping Agencies: A Qualitative and Quantitative Analysis. Cartogr. J. 2010, 47, 41–54. [Google Scholar] [CrossRef]
- Touya, G.; Berli, J.; Lokhat, I.; Regnauld, N. Experiments to Distribute and Parallelize Map Generalization Processes. Cartogr. J. 2017, 54, 322–332. [Google Scholar] [CrossRef]
- Ziouel, T.; Amieur-Derbal, K.; Boukhalfa, K. SOLAP on-the-fly generalization approach based on spatial hierarchical structures. In IFIP Advances in Information and Communication Technology; Springer: Berlin, Germany, 2015; Volume 456, pp. 279–290. [Google Scholar]
- Jones, C.B.; Ware, J.M. Map generalization in the Web age. Int. J. Geogr. Inf. Sci. 2005, 19, 859–870. [Google Scholar] [CrossRef]
- van Oosterom, P. A storage structure for a multi-scale database: The reactive-tree. Comput. Environ. Urban Syst. 1992, 16, 239–247. [Google Scholar] [CrossRef]
- Guo, Q.S.; Huang, Y.L.; Zheng, C.Y.; Cai, Y.X. Spatial reasoning and progressive map generalization 2007.
- Šuba, R.; Meijers, M.; Oosterom, P. Continuous Road Network Generalization throughout All Scales. ISPRS Int. J. Geo-Inf. 2016, 5, 145. [Google Scholar] [CrossRef]
- Wang, Y.; Li, X.; Gong, H. The Basic Problems of Multi-scale Geographical Elements Expression. Sci. China 2006, 36, 38–44. [Google Scholar]
- Shen, J.; Guo, L.; Zhu, W.; Gu, N. Parallel computing suitability of contour simplification based on MPI. Cehui Xuebao 2013, 42, 621–628. [Google Scholar]
- Daoud, J.J.A.; Doytsher, Y. An automated cartographic generalization process: A pseudo-physical model. In Proceedings of the XXI Congress of the International Society for Photogrammetry and Remote Sensing (ISPRS 2008), Beijing, China, 3–11 July 2008; pp. 419–424. [Google Scholar]
- Karsznia, I.; Weibel, R. Improving settlement selection for small-scale maps using data enrichment and machine learning. Cartogr. Geogr. Inf. Sci. 2018, 45, 111–127. [Google Scholar] [CrossRef]
- Lee, J.; Jang, H.; Yang, J.; Yu, K. Machine Learning Classification of Buildings for Map Generalization. ISPRS Int. J. Geo-Inf. 2017, 6, 309. [Google Scholar] [CrossRef]
- Li, X.; Grandvalet, Y.; Davoine, F. Explicit Inductive Bias for Transfer Learning with Convolutional Networks. arXiv, 2108; arXiv:1802.01483. [Google Scholar]
- Yang, C.; Huang, Q.; Li, Z.; Liu, K.; Hu, F. Big Data and cloud computing: Innovation opportunities and challenges. Int. J. Digit. Earth 2017, 10, 13–53. [Google Scholar] [CrossRef]
- Li, Z.; Yang, C.; Liu, K.; Hu, F.; Jin, B. Automatic Scaling Hadoop in the Cloud for Efficient Process of Big Geospatial Data. ISPRS Int. J. Geo-Inf. 2016, 5, 173. [Google Scholar] [CrossRef]
- Li, Z.; Hu, F.; Schnase, J.L.; Duffy, D.Q.; Lee, T.; Bowen, M.K.; Yang, C. A spatiotemporal indexing approach for efficient processing of big array-based climate data with MapReduce. Int. J. Geogr. Inf. Sci. 2017, 31, 17–35. [Google Scholar] [CrossRef]
- Guan, Q.; Shi, X. Opportunities and challenges for urban land-use change modeling using high-performance computing. In Modern Accelerator Technologies for Geographic Information Science; Springer: Boston, MA, USA, 2013; pp. 227–236. ISBN 9781461487456. [Google Scholar]
- Guan, Q.; Kyriakidis, P.C.; Goodchild, M.F. A parallel computing approach to fast geostatistical areal interpolation. Int. J. Geogr. Inf. Sci. 2011, 25, 1241–1267. [Google Scholar] [CrossRef] [Green Version]
- Guercke, R.; Brenner, C.; Sester, M. Data Integration and Generalization for SDI in a Grid Computing Framework. In Proceedings of the International Archives of the Photogrammetry, Remote Sensing and Spatial Information Sciences, Beijing, China, 3–11 July 2008. [Google Scholar]
- Foerster, T.; Stoter, J.E.; Morales Guarin, J.M. Enhancing cartographic generalization processing with grid computing power and beyond. GIS Sci. Z. Geoinform. 2009, 3, 98–101. [Google Scholar]
- Neun, M.; Burghardt, D.; Weibel, R. Automated processing for map generalization using web services. Geoinformatica 2009, 13, 425–452. [Google Scholar] [CrossRef] [Green Version]
- Zhang, J.; Wu, C.; Wang, L. A Conceptual Framework for the Automated Generalization of Geological Maps Based on Multiple Agents and Workflow. IEEE Access 2016, 4. [Google Scholar] [CrossRef]
- Yi, F.; Li, Q.; Yang, W. Parallel Algorithm of Delaunay Triangulation Dividing. Minimicro Syst. 2001, 22, 450–452. [Google Scholar]
- Bing, Z.; Zhonghui, F.; Hexing, W. The Study of Parallel Clustering Algorithm for Cluster System. Comput. Sci. 2007, 34, 4–16. [Google Scholar]
- Jianjun, L.; Zhaoyang, L. Parallel Algorithm for Delaunay Triangulation and Its Implementation on Computer Clusters. J. Northeast For. Univ. 2008, 10, 32. [Google Scholar]
- Li, H.; Zhai, J. A parallel algorithm for topological sort in directed graphs. Yantai Norm. Univ. J. 2005, 21, 168–171. [Google Scholar]
- Langran, G.E.; Poiker, T.K. Integration of name selection and name placement. In Proceedings of the Second International Symposium on Spatial Data Handling, Seattle, WA, USA, 5–10 July 1986. [Google Scholar]
- Van Kreveld, M.; Van Oostrum, R.; Snoeyink, J. Efficient settlement selection for interactive display. In Proceedings of the Auto Carto 13, Seattle, WA, USA, 7–10 April 1997; pp. 287–296. [Google Scholar]
- Weibel, R.; Dutton, G. Constraint-based automated map generalization. In Proceedings of the 8th International Symposium on Spatial Data Handling, Vancouver, BC, Canada, 11–15 July 1998; pp. 214–224. [Google Scholar]
- Harrie, L. An Optimisation Approach to Cartographic Generalisation; Department of Technology and Society, Lund University: Lund, Sweden, 2001. [Google Scholar]
- Ruas, A.; Plazanet, C. Strategies for automated generalization. In Advances in GIS Research II, Proceedings of the 7th International Symposium on Spatial Data Handling, Delft, The Netherlands, 12–16 August 1996; TU Delft: Delft, The Netherlands, 1996; pp. 319–336. [Google Scholar]
- Töpfer, F.; Pillewizer, W. The principles of selection. Cartogr. J. 1966, 3, 10–16. [Google Scholar] [CrossRef]
- Srnka, E. The analytical solution of regular generalization in cartography. Int. Yearb. Cartogr. 1970, 10, 48–62. [Google Scholar]
- Štampach, R.; Mulíčková, E. Automated generation of tactile maps. J. Maps 2016, 12, 532–540. [Google Scholar] [CrossRef] [Green Version]
- Yan, H.; Wang, J. A generic algorithm for point cluster generalization based on Voronoi diagrams. J. Image Graph. 2005, 10, 633–636. [Google Scholar]
Figure 1.
Impact of data decomposition on the calculation of the point load.

Figure 2.
The flowchart of calculating the local point load.
Figure 3.
Geometric constraints of road meshes on the point features.

Figure 4.
Repeated areas in the process of the point load calculation.

Figure 5.
The framework for the point generalization prototype system based on the Hadoop cloud platform.
Figure 5.
The framework for the point generalization prototype system based on the Hadoop cloud platform.
Figure 6.
Select procession of points by circle growth algorithm, Source: [7] (p. 83).
Figure 6.
Select procession of points by circle growth algorithm, Source: [7] (p. 83).

Figure 7.
Xi’an measured data and the results of point selection in different computing environments: (a) road data of Xi’an; (b) point and road data of Xi’an; (c) results of the circle growth algorithm in the environment using generalization without suggested constraints; and (d) results of the circle growth algorithm in the environment using generalization with suggested constraints.
Figure 8.
With different amounts of data, the ratio of the runtime of 1 node to the runtime of more nodes.
Figure 8.
With different amounts of data, the ratio of the runtime of 1 node to the runtime of more nodes.

Table 1.
Traditional point generalization constraints.
| Type of Constraints | Name of Constraints | Description |
|---|---|---|
| Geometric constraints | Minimum size | The minimum symbol size for point features at a given scale |
| Minimum distance of abutment | Graphic restrictions on point features at a certain scale | |
| Topological constraints | Relations between points and routes | The spatial attachment between point features and route features |
| Relations between points and route meshes | Route meshes contain the point group | |
| Adjacent point | The number of points in a group that has a contiguous relationship with a given point | |
| Structural constraints | Reserving feature points | The number of important points reserved |
| Number of clusters | Changes of points distribution characters | |
| Contour of clusters | Changes in the region of points distribution | |
| Point load | A measure of how many points can be held on the map | |
| Regional absolute density | Parameters describing point group metrics information | |
| Regional relative density | The point density changes after point generalization |
Table 2.
Measured data and simulation data for the experiment in this study.
| Datasets | The Number of Features | Data Volume |
|---|---|---|
| Point data of Xinjiekou Nanjing | 12,006 | 9.91 MB |
| Road data of Xinjiekou Nanjing | 70 | 26.5 KB |
| Point data of Xian | 59,650 | 49.6 MB |
| Road data of Xian | 513 | 362 KB |
| Point data of Beijing | 207,710 | 171 MB |
| Road data of Beijing | 1292 | 314 KB |
| Simulation point data of Xian_1 | 10,000 | 8.5 MB |
| Simulation point data of Xian_2 | 300,000 | 189 MB |
| Simulation point data of Xian_3 | 500,000 | 240 MB |
| Simulation point data of Xian_4 | 1,000,000 | 495 MB |
| Simulation point data of Xian_5 | 2,000,000 | 1331.2 MB |
| Simulation point data of Xian_6 | 3,000,000 | 5427.2 MB |
Table 3.
The run time of point generalization in the environment using generalization without suggested constraints and in the environment using generalization with suggested constraints.
Table 3.
The run time of point generalization in the environment using generalization without suggested constraints and in the environment using generalization with suggested constraints.
| Datasets | Nanjing | Xian | Beijing |
|---|---|---|---|
| Input data size | 9.91 MB | 49.6 MB | 171 MB |
| Output data size | 2.48 MB | 2.79 MB | 2.36 MB |
| Total data size | 12.39 MB | 52.39 MB | 173.36 MB |
| Processing time of the stand-alone environment | 51″ | 3′30″ | 44′30″ |
| Processing time of the cloud platform | |||
| 1 node | 32″ | 52″ | 4′11″ |
| 3 nodes | 33″ | 45″ | 3′11″ |
| 6 nodes | 29″ | 30″ | 2′14″ |
| 9 nodes | 28″ | 21″ | 1′03″ |
Table 4.
Processing time of point generalization with different data sizes.
| Datasets | Simulation Point Data of Xi’an_1 | Simulation Point Data of Xi’an_2 | Simulation Point Data of Xi’an_3 | Simulation Point Data of Xi’an_4 | Simulation Point Data of Xi’an_5 | Simulation Point Data of Xi’an_6 |
|---|---|---|---|---|---|---|
| Input data size | 8.5 MB | 189 MB | 240 MB | 495 MB | 1331.2 MB | 5427.2 MB |
| Number of point features | 10,000 | 300,000 | 500,000 | 1,000,000 | 2,000,000 | 3,000,000 |
| Processing time of the cloud platform | ||||||
| 1 node | 33″ | 4′57″ | 9′53″ | 23′17″ | 1:10′46″ | 2:25′22″ |
| 3 nodes | 35″ | 4′38″ | 8′31″ | 18′23″ | 45′55″ | 1:27′50″ |
| 6 nodes | 30″ | 3′47″ | 6′50″ | 15′24″ | 38′12″ | 1:15′34″ |
| 9 nodes | 29″ | 2′23″ | 4′53″ | 13′11″ | 26′36″ | 41′17″ |
Table 5.
Comparison of the speedup between different numbers of nodes.
| Number of Nodes | Nanjing | Xi’an | Beijing | |||
|---|---|---|---|---|---|---|
| ISpeedup | ISpeedup/V 1 | ISpeedup | ISpeedup/V | ISpeedup | ISpeedup/V | |
| 1 node | 1.59375 | 0.128632 | 4.230769 | 0.080755 | 10.63745 | 0.06136 |
| 3 nodes | 1.545455 | 0.124734 | 4.888889 | 0.093317 | 13.97906 | 0.080636 |
| 6 nodes | 1.758621 | 0.141939 | 7.333333 | 0.139976 | 19.92537 | 0.114936 |
| 9 nodes | 1.821429 | 0.147008 | 10.47619 | 0.199965 | 42.38095 | 0.244468 |
1 V represents the data volume.
© 2018 by the authors. Licensee MDPI, Basel, Switzerland. This article is an open access article distributed under the terms and conditions of the Creative Commons Attribution (CC BY) license (http://creativecommons.org/licenses/by/4.0/).
Share and Cite
MDPI and ACS Style
Zhou, J.; Shen, J.; Yang, S.; Yu, Z.; Stanek, K.; Stampach, R. Method of Constructing Point Generalization Constraints Based on the Cloud Platform. ISPRS Int. J. Geo-Inf. 2018, 7, 235. https://doi.org/10.3390/ijgi7070235
AMA Style
Zhou J, Shen J, Yang S, Yu Z, Stanek K, Stampach R. Method of Constructing Point Generalization Constraints Based on the Cloud Platform. ISPRS International Journal of Geo-Information. 2018; 7(7):235. https://doi.org/10.3390/ijgi7070235
Chicago/Turabian StyleZhou, Jiemin, Jie Shen, Shuai Yang, Zhenguo Yu, Karel Stanek, and Radim Stampach. 2018. "Method of Constructing Point Generalization Constraints Based on the Cloud Platform" ISPRS International Journal of Geo-Information 7, no. 7: 235. https://doi.org/10.3390/ijgi7070235
Note that from the first issue of 2016, this journal uses article numbers instead of page numbers. See further details here.