Article

Efficient Method for POI/ROI Discovery Using Flickr Geotagged Photos

1
Research Center for Humanities and Social Sciences, Academia Sinica, Taipei 115, Taiwan
2
Institute of History and Philology, Academia Sinica, Taipei 115, Taiwan
3
Institute of Geography, Heidelberg University, 69120 Heidelberg, Germany
*
Author to whom correspondence should be addressed.
ISPRS Int. J. Geo-Inf. 2018, 7(3), 121; https://doi.org/10.3390/ijgi7030121
Submission received: 17 January 2018 / Revised: 14 February 2018 / Accepted: 12 March 2018 / Published: 16 March 2018

Abstract

:
In the era of big data, ubiquitous Flickr geotagged photos have opened a considerable opportunity for discovering valuable geographic information. Point of interest (POI) and region of interest (ROI) are significant reference data that are widely used in geospatial applications. This study aims to develop an efficient method for POI/ROI discovery from Flickr. Attractive footprints in photos with a local maximum that is beneficial for distinguishing clusters are first exploited. Pattern discovery is combined with a novel algorithm, the spatial overlap (SO) algorithm, and the naming and merging method is conducted for attractive footprint clustering. POI and ROI, which are derived from the peak value and range of clusters, indicate the most popular location and range for appreciating attractions. The discovered ROIs have a particular spatial overlap available which means the satisfied region of ROIs can be shared for appreciating attractions. The developed method is demonstrated in two study areas in Taiwan: Tainan and Taipei, which are the oldest and densest cities, respectively. Results show that the discovered POI/ROIs nearly match the official data in Tainan, whereas more commercial POI/ROIs are discovered in Taipei by the algorithm than official data. Meanwhile, our method can address the clustering issue in a dense area.

Graphical Abstract

1. Introduction

With the advanced development of web technologies and the rapid emergence of social networks, tremendous user-generated content (UGC), such as text, images, videos, and volunteered geographic information (VGI) [1], are continuously contributed by people via various web platforms. Flickr [2], a popular social media website, allows users to share photos with locations and tags that describe their focus. Those shared photos directly show specific phenomena, scenes, or status of reality. Undoubtedly, the treasure-like geotagged photos have opened a considerable opportunity for discovering valuable geographic information (GI) and realizing changes in reality with time [3,4,5,6,7,8].
Point of interest (POI) and region of interest (ROI) (also called area of interest [AOI] [9]) are “a specific point location that is of interest [10]” and “an area within an urban environment which attracts people’s attention [9]”, respectively. Both data are significant GI that are often used in the geographic information system (GIS) field or relevant applications, such as spatial recognition, orientation identification, navigation, and spatial analysis. Currently, widely used POIs/ROIs can come from commercial companies, such as Google Places API and Yahoo! GeoPlanet [11], an open consortium, such as OGC [12], or government open data, such as the New York City government in the USA (NYC OpenData [13]) and the Tainan City government in Taiwan (Tainan City POI [14]). However, regardless of the provider, the time-consuming and expensive data collection and update of POI/ROI is a major obstacle. In the big data era, low-cost and efficient approaches to producing and updating POIs/ROIs based on data reuse are still expected.
Previous studies have discussed how to create or discover POI/ROI from certain UGCs, such as social media, crowdsourced data, and VGI data [9,15,16,17,18,19,20,21]. According to the types of resources and the discovery procedure, the developed approaches can be classified into two types: top–down and bottom–up. In a top–down approach, the discovered POI and ROI from an existing POI/ROI repository or database, such as check-in data or yellow pages, are frequently used or fit for a specific subject or purpose [15,16,17]. In a bottom–up approach, the POIs/ROIs are discovered from raw data, such as geotagged photos or digital footprints with implicit GI, such as latitude and longitude with metadata, to construct a new database or dataset [9,18,19,20,21]. In general, bottom–up approaches are more complicated than top–down ones because discovering POIs/ROIs involves several considerations, such as data quality assessment, point clustering, and naming. Nevertheless, bottom–up approaches are still worth exploiting because they have considerable potential in discovering new POIs and ROIs with time and facilitate trend analysis for prediction. Methods developed for the POI/ROI discovery of bottom–up approaches have been widely discussed. The main processing steps, such as point clustering for POI/ROI discovery, usually adopt well-known algorithms or approaches, such as spatial clustering, that focus on a specific property process of either pure location [22] or location combined with other properties, such as non-duplicated users [23], tags [20] or temporal property and tags [9]. Indeed, a comprehensive discussion of the spatial and temporal properties and attributes of data is necessary for a precise POI/ROI result.
Compared with other UGC resources, such as Twitter [24], Facebook [25], and Instagram [26], Flickr geotagged photos have the highest accessibility via its developed API [27] and the greatest advantage for long-term investigation with spatial and noted information(e.g., location, tags). Furthermore, shared photos from Flickr attract people to take photos from a personal perspective. Thus, Flickr geotagged photos are adopted in this research. The fundamental challenges of discovering POIs/ROIs from tremendous/big user-contributed Flickr geotagged photos are removing noises and biases from active users, retrieving valid photos efficiently for POI/ROI discovery, and identifying clusters with local maximum, which helps distinguish the POI/ROI in a dense area. Hence, we propose a workflow that can retrieve attractive footprints (each geotagged photo taken at a specific timestamp for a certain object or phenomenon is called a footprint.) from geotagged photos and perform clustering to discover POI/ROI simultaneously. A POI indicates the most popular location for appreciating an attraction, whereas an ROI presents a better region for appreciating attractions in this research. We claim that a discovered ROI can be an attractive region for a specific POI. The meaning of a discovered ROI differs from that of an ROI [28,29] contains many POIs or activities but not be distinguished for specifics POIs further. Our major contributions are three-fold.
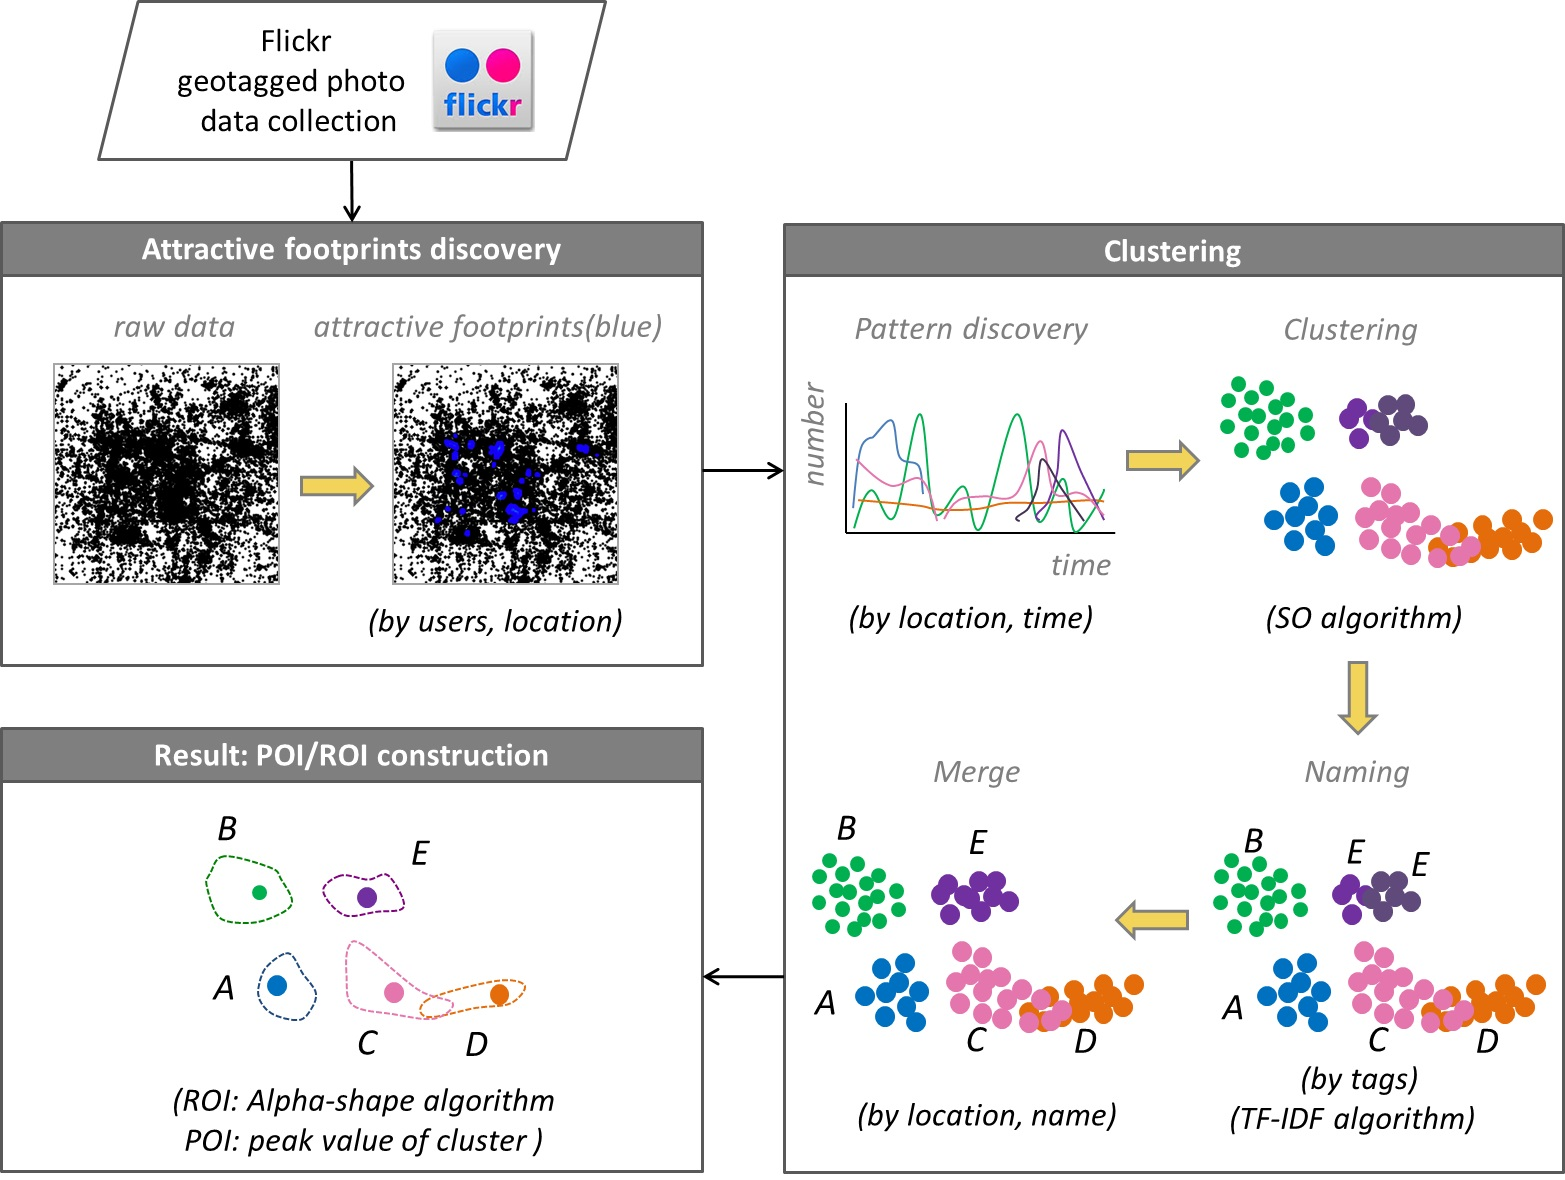
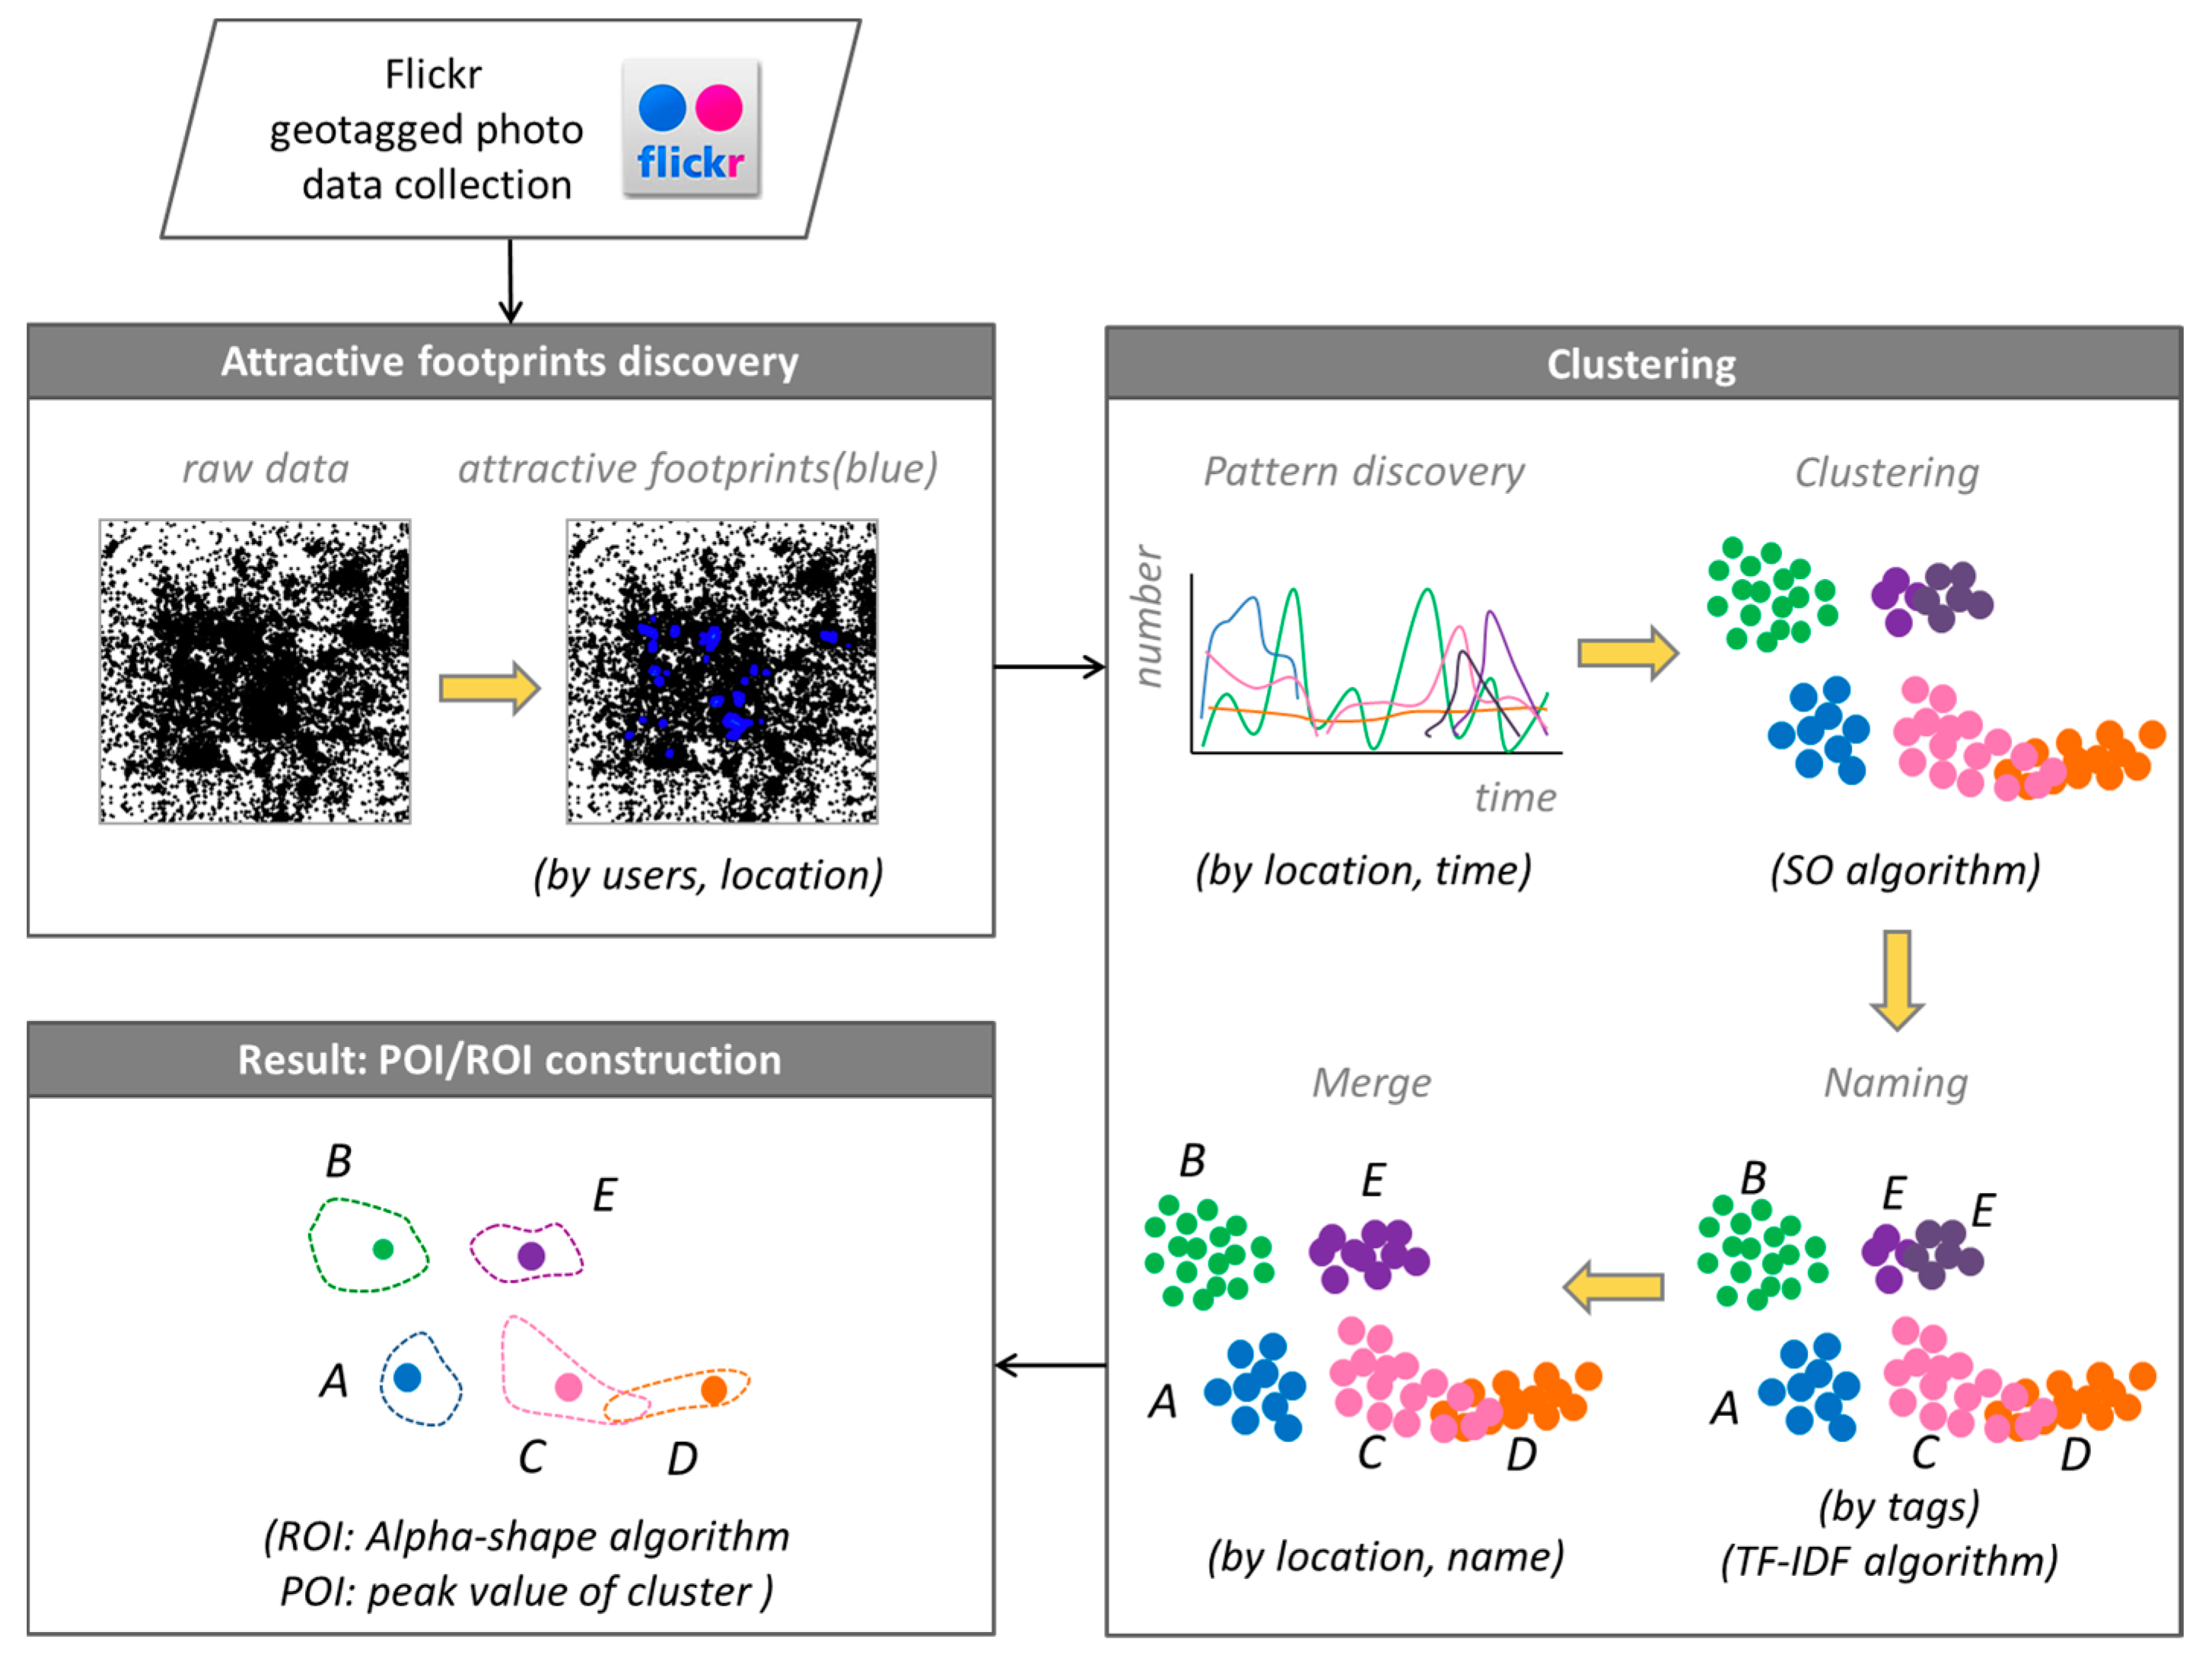
  • An efficient method of eliminating noises among collected footprints and selecting attractive footprints with a local maximum for delineating POIs and ROIs is proposed.
  • An effective clustering toward pattern discovery that involves spatial and temporal properties and attributes, such as tags, with a spatial overlap (SO) algorithm is exploited. The discovered ROIs are particularly spatial overlap available that the satisfied region of ROIs can be shared for appreciating attractions.
  • A POI and an ROI with peak value that indicate the most popular location and range for appreciating attractions, respectively, are uncovered.
The remainder of this paper is organized as follows. Section 2 presents related work. Section 3 introduces the proposed method. Section 4 discusses the implementation results and evaluation. Finally, Section 5 presents the conclusion and directions for future work.

2. Related Work

Most bottom–up POI/ROI discovery approaches consist of three major steps: (1) addressing popular regions via a point clustering method; (2) constructing polygons for an ROI; and (3) naming and clarifying semantics for the POI/ROI [9,30]. DBSCAN, a density-based clustering method [22], is widely used for point clustering and eliminating noises efficiently by setting two parameters: radius (Eps) and minimum neighbors (MinPts). To accomplish the task, several studies have proposed improved clustering methods based on DBSCAN, such as P-DBSCAN clusters points that adopt non-duplicated owners [23]; C-DBSCAN that sets the constraints of background knowledge at the instance-level [31]; ST-DBSCAN that involves spatial, non-spatial and temporal values [32]; and C-DBSCANO that sets the constraints of geographical knowledge by combining the C-DBSCAN method and ontology [33]. However, fixed density clustering is a common limitation of DBSCAN-based approaches. The issue is resolved by calculating the distance of spatial and non-spatial attributes and the density factor in ST-DBSCAN, and setting the Eps and MinPt by domain experts in C-DBSCANO. Yang and Gong [34] proposed a self-tuning spectral clustering approach to process the distance, density, and visit sequence, without subjective parameters, for identifying the POI. However, the ST-DBSCAN analysis focuses only on consecutive time units. The pattern or relation of objects within a time unit cannot be indicated between clusters, such as seasonal clusters. Furthermore, the noise cannot be filtered in the self-tuning spectral clustering approach, and the C-DBSCANO approach is more suitable for a limited amount of points with complete GI than for big data. On the other hand, HDBSCAN [35], a density-based hierarchical clustering method is proposed by the improvement and integration of DBSCAN and OPTICS [36]. Significant clusters with different thresholds in the constructed hierarchy can be extracted via set of a single parameter value, the minimum size of points (mpts), Korakakis et al. [8] applied HDBSCAN for AOI extraction. However, clusters may not be distinguished easily in a dense area that contains multiple POIs with ROIs. In general, the main limitation of DBSCAN approaches is adjacent clustering. A high demand for generating overlapped clusters exists. That is, points should be clustered into multiple groups when they satisfy the set conditions of clusters.
Another clustering type is a grid-based approach. Laptev et al. [37] mapped points onto a grid and set the time constraints for AOI discovery. Shirai et al. [30] used a grid approach to determine the shape of polygons with high density. Spyrou et al. [19] detected AOIs based on merging tiles according to the same semantics determined by tags. Encalada et al. [38] identified tourist places of interest from a regular grid of hexagons aggregating tourists photos. Additionally, a common spatial clustering method widely used is a fractal-based approach that benefits in an efficient computation and visualization for big geospatial data analysis [7]. However, evident disadvantages of a grid-based approach or a fractal-based approach are that varying the initial size of the grid varies the clustering results and more detailed information like AOIs with boundaries that fit to reality become undiscoverable.
A convex hull is used to construct the polygon or range for a given cluster of points and present the outer polygon upon given points [39]. To fit the boundary and reduce the emptiness of a constructed polygon, the alpha-shape [40] and concave hull [41] methods are widely adopted. The alpha-shape method provides a flexible polygon construction approach that allows the generation of a convex hull when the alpha value is zero. In application, Yahoo’s Flickr applies the alpha shape to address the approximate boundary of a province, city, or town on the basis of Where On Earth IDs (WOEIDs) [42] of points. Hu et al. [9] used the chi-shape (also called concave hull) to set a normalized length parameter λp for constructing polygons.
The other research on discovering POI/ROI is based on textual content with GI, such as tags, map annotations, or metadata. Keßler et al. [43] retrieved geotagged photos with specific place names and performed clustering via Delaunay triangulation. The group-cognitive center (centroid) calculated by the mean of points in the cluster was the POI. Mummidi and Krumm [44,45] discovered the POI by grouping nearby pushpins as a cluster and naming the cluster via the term frequency-inverse document frequency (TF-IDF) method [46]. Rattenbury and Naaman extracted place semantics from Flickr tags [47] which helps the construction of place gazetteer data, and even POI. Hollenstein and Purves [48] considered the quality of tags and explored administrative cores with various granularity settings and specific places derived from reliable tags. Skovsgaard et al. [20] proposed a clustering method, CLUSTO, to discover POI clusters from tags of collected Microblog Posts. Vu et al. [21] estimated social POI boundaries called GeoSocialBound based on POI and its tags. Additionally, Lim et al. [49] proposed a PERSTOUR algorithm that aligned Flickr tags to the Wiki POI database and identified popular POIs visited by tourists and user interest preferences for a personalized trip recommendation. According to above discussion, two issues are notable: (1) the quality of tags in the text-based method for discovering POI or ROI is crucial to the eventual result; and (2) discovering POI/ROIs from tags or texts based on existing POI databases will lead to hard of new POI/ROIs discovery.
For the workflow or framework for uncovering POI/ROI, a coherent framework with three layers that uses geotagged photos to uncover an ROI (called urban AOI in the study) was proposed by Hu et al. [9]. They discussed the entire procedure of uncovering ROI, from data pre-processing, point clustering, to area construction, and applications that were based on the uncovered spatiotemporal ROI. Their proposed framework is complete. However, temporal filtering is the first priority for data from the same year. The results are easily affected by the quality of analyzed resources, such as insufficient time information.
The aforementioned review shows that the bottom–up approach based on point clustering, which involves the qualitative properties of geospatial data, has great potential for discovering valuable POIs/ROIs, particularly in this big data era. The present study proposes an efficient approach and workflow with a novel algorithm that processes spatial properties, temporal properties, attributes, semantics, and data quality issues and allows users to adjust the parameters’ flexibly in processing for discovering user interests, POI and ROI.

3. Method

A proposed workflow for POI/ROI discovery is illustrated in Figure 1, which shows three main processing steps: attractive footprints discovery, clustering, and POI/ROI construction. To address where a POI/ROI may be located, attractive footprints discovery is first conducted to eliminate noises and select valid footprints with a local maximum, which is helpful for distinguishing the POI/ROI in a high-density area. This step processing data from a pure spatial perspective can maintain completeness of footprints for making round ROIs and avoid excluding a large amount of footprints at the beginning because of footprints without information like time or tags. Second, the clustering of attractive footprints is performed by processing spatial, temporal properties and attributes with four substeps for further POI/ROI construction: pattern discovery, clustering with the SO algorithm, naming, and merging. Pattern discovery is used to rapidly group attractive footprints with the same properties in terms of spatial and non-spatial properties, such as location and time. Based on the ROI definition, a discovered ROI can be an attractive region for a specific POI, mentioned in the introduction, ROIs of various POIs may be spatially overlapped in the real world, which enables the appreciation of multiple POIs from an intersection area, especially in a dense area. Therefore, next, the SO algorithm conducting marginal attractive footprints regrouping is utilized for making spatially-overlapped clusters. Furthermore, the naming step is performed to determine the name of cluster from tags, while the merging step aims to spatially merge close clusters with the same name. This approach can successfully make a round ROI shape and delineate the broken polygons around. Finally, the POI that indicates the most attractive location for a certain attraction is retrieved from the PV within the individual clusters, whereas the ROI, which presents a better extent for appreciating interests, is constructed using the alpha-shape algorithm [40] in the POI/ROI construction step. Additional details are provided in the following subsections.

3.1. Attractive Footprints Discovery

Geotagged photos taken by people are shared on the site. The issue of POI/ROI discovery from numerous geotagged photos is first dependent on the POI/ROI location. An acceptable assumption is that a POI/ROI appears where people gather and receive significant attention. Thus, discovering attractive footprints that receive significant attention from different people from a Flickr geotagged photo pool is mainly processed in this step. Attractive footprints not only eliminate the noise footprint efficiently, but also initially delineate the range of POI/ROI with a local maximum, which is beneficial for clustering footprints in the next step. To discover attractive footprints, we obtain the voting value (υ) using Equation (1) that involves different users within a search radius (r), for example, 50 m, referring to an average distance between POIs in a study area, to each footprint. In Equation (1), υ is the summation of the weight function (ω) between the calculated footprint and its neighbors from different users within r. The ω based on the Gaussian function that distant neighbors use weights smaller than near ones is adopted to make a smooth weight upon distance. Furthermore, the voting value bias caused by active users must be avoided, thus, while many footprints are contributed by one user, only the nearest one belonging to that user is calculated:
υ p i = i = 1 j ω i j ,   ω i j = e i j 2 2 σ 2
where υ p i is the voting value that summarizes the ω calculated by different people and P j , j ∈ are the neighbour footprints of P i within r.
The higher the voting value of a footprint, the more people gather around (within r). Attractive footprints are retrieved by a set threshold (T1) for POI/ROI discovery. We claim that a footprint with a υ that is greater than or equal to T1 is an attractive footprint. The noises among footprints are, hence, eliminated efficiently by the set T1 as well. Meanwhile, an expected number of people around an attractive point can be easily achieved by the set T1 because at least 100 people are around, whereas υ is set as 100, for example.

3.2. Clustering

As attractive footprints are uncovered, the main aim of the next step is to make group of attractive footprints for further POI/ROI construction. This is a clustering question, thus, the main idea of clustering is forming groups of attractive footprints with the same pattern and content and then assigning names by processing spatial and temporal properties and attributes. The clustering step is performed with the following four sub-steps: pattern discovery, clustering with a SO algorithm, naming, and merging. Additional details are provided in the following sections.

3.2.1. Pattern Discovery

Pattern discovery helps identify the attractive footprints that belong to the same cluster, that is, attractive footprints in the same cluster have the same pattern in terms of spatial and temporal properties and attributes. Isolating the pattern discovery as a substep at the beginning of clustering step gives a great potential and a possibility for other resources to involve more attributes for a more wide application.
For Flickr data, pattern discovery starts from processing temporal properties with basic descriptive statistics (see Algorithm 1 pattern function) by summarizing the calculated footprint’s number of neighboring attractive footprints with legitimate temporal properties (other resources may have attributes e.g., elevation or focus length of devices, etc., these attributes then can be involved for basic descriptive statistics, for example, an attractive footprints with legitimate temporal properties and attributes, then it can be processed.) within r (r is set in the attractive footprint discovery step.), which follows a certain time criterion, such as 12 months. The result of basic descriptive statistics is that each footprint has 12 values from summation of attractive footprints based on the same month.
However, the number of attractive footprints shows only the summation of attractive footprints from different people within r. A data quality issue that is associated with the spatial distribution of attractive footprints exists and should be checked. Thus, we utilize an area validation approach (see Algorithm 1 validation function) to select legitimate attractive footprints with a valid spatial distribution for the pattern discovery process. In area validation, if the number based on a time unit of calculated attractive footprint (e.g., number calculated to each month with the specific time criteria is 12 months) is not zero, but the area formed by the attractive footprints is, then it is considered an illegitimate attractive footprint according to the uncertainty principle that the attractive footprints contributed by different people should not be exactly the same. This kind of illegitimate phenomena is supposed to be an internal error caused by the dataset itself.
Then, attractive footprints are going to be discovered with the same pattern that have similar curve shape depicted from the number obtained from the above statistics via a difference calculation (see Algorithm 1 patternDiff function). To make the difference calculation based on the same scale, that is, to reduce the bias caused by high-density areas, normalization is performed. The normalization is expressed in Equation (2). Therefore, the value (X) of each attractive footprint is located between 0 and 1 as XN. Then, the Euclidean distance (Pdiff) between footprints is derived using Equation (3), which indicates the difference of the normalized number of attractive footprints in a time unit by the Euclidean distance, such as the summation of the difference of each pair of months from January to December. Pdiff is normalized to P d i f f N , which is between 0 and 1.
Theoretically, a normalized difference value of 0 between two attractive footprints indicates that they have the same pattern. However, as the number of neighboring attractive footprints for an attractive footprint is constructed by its neighbors within a radius, distant attractive footprints will have greater difference values. To cope with the phenomenon in which the normalized difference value P d i f f N to a POI could be a Gaussian distribution [50] and determine a proper extent fitting to its ROI, threshold T2 is set for pattern discovery. Meanwhile, if P d i f f N that is smaller than or equal to T2 between attractive footprints, then these attractive footprints have the same pattern (see Algorithm 1, findSimlarPatternPoints function).
X N = ( X X m i n ) ( X m a x X m i n ) ,   X N [ 0 , 1 ]
where XN is the normalized value of the number of neighboring attractive footprints.
P d i f f N = ( P d i f f P d i f f m i n ) ( P d i f f m a x P d i f f m i n ) ,   P d i f f = i = 1 j ( X N i Y N i ) 2 ,   P d i f f N [ 0 , 1 ]
where P d i f f N is the normalized difference value between two attractive footprints.
Algorithm 1: Pattern discovery.
def validation(Available_Points):          #area validation
  S=[]
  for n in Available_Points:
    m = month of n
    S[m].append(n)
  area=0
  for s in S
    area+=s.area()
  return area>0
def pattern(p,r):                             #pattern calculation
  N=Neighbours(p,r)
  Available_Points=[]
  for n in N:                                       #find nearest unique users
    if n.user_id not in Available_Points:
      Available_Points[n.user_id]=n;
    else:
      if distance(p,n)<distance(p,Available_Points[n.user_id]):
        Available_Points[n.user_id]=n;
  if validation(Available_Points):
    X = []
    for n in Available_Points:
      m = month of n
      X[m]++                                        #pattern calculation based on set time
    return vector_normalization(X)             #pattern normalization
  else:
    return null
def patternDiff(a,b):                        #pattern difference calculation
  Pdiff=[]
  for m in range(1,12)
    Pdiff[m]=|a.XN[m]-b.XN[m]|
  return vector_normalization(Pdiff)           #pattern difference normalization
def findSimlarPatternPoints(p,afs):       #find points with similar pattern
  S=[]
  for q in afs:
    if q.XN!=null:
      PdiffN=patternDiff(p.XN,q.XN)
      if PdiffN<=T2:
	    S.append(q)
  return S
def main:                                      #main function
  for p in afs:
    p.XN=pattern(p,r)
  for p in afs:
    if p.XN !=null:
       p.S=findSimlarPatternPoints(p,afs)
	   

3.2.2. Clustering with a Spatial Overlap Algorithm (SO Algorithm)

Traditional cluster methods aim to group points with the same pattern split. Clusters can be adjacent or disjointed, that is, while a processed point belongs to a group, it does not belong to another one. However, there is a scenario that people expect to appreciate multiple POIs within various ROIs from an intersection area generated by ROIs in a dense area. Thus, the SO algorithm, a novel idea for making spatial overlap clusters is proposed. With the SO algorithm, not only can the spatial extent for appreciating POIs be clearly depicted, but the moderate location for taking photos or admiring various POIs simultaneously can also be addressed.
Algorithm 2 shows the pseudo code for the clustering with a SO algorithm starting from the attractive footprint with rank No. 1 according to voting value that assists in processing attractive footprints that are highly related to a popular target among attractive footprints with the same pattern set by T2. To aid in generating the spatially overlapped clusters mentioned above, threshold T3 is set to provide a buffer setting that makes some of the processed attractive footprints be processed again; that is, attractive footprints with P d i f f N between T2T3 and T2 are in the buffer area and will be processed again for clustering. Attractive footprints with P d i f f N between 0 and T2T3 are marked and will not be processed anymore. As the clustering is from attractive footprints with rank No. 1, significant clusters with a local maximum of voting value (called peak value, PV) can be generated.
In general, the clustering result can be obtained by above proposed method, however, the result should be further clustered as a possible scenario in which the major cluster with PV has a pattern that is similar with those of distant clusters (spatially discrete) such that all clusters are derived from a processed PV-ranked attractive footprint because similar activities may occur or the visiting pattern from users are similar. To deal with this issue, we adopt the search radius proposed in the attractive footprint discovery, that is, 50 m, to distinguish clusters. Then, the major cluster that contains the processed PV-ranked attractive footprint and other distinguished clusters are the clustering result.
Algorithm 2: Clustering with a SO algorithm.
def clustering:
  sortByPeakValue(afs)                   #order by peakValue DESC of afs
  unmark_all(afs)                         #unmark all point of afs
 
  clusters=[]
  for p in afs
    if p.XN!=null and is_unmark(p):
      cluster=[]                          #create new cluster
      cluster.append(p)
      for q in p.S                        #PdiffN<=T2
        if is_unmark(q):
          cluster.append(q)
          PdiffN=patternDiff(p.XN,q.XN)
          if PdiffN<=T2-T3:
            mark(q)
      clusters.append(cluster)
  return clusters
              

3.2.3. Naming

Clusters with spatial overlap can be successfully determined by the previous clustering with SO algorithm. After addressing the cluster location, given the name of clusters is then conducted. Meanwhile, each cluster is composed of attractive footprints with tags. The naming step indicates the representative term for each cluster. TF-IDF is a commonly used term weighting method. We adopt a naming method with smoothing techniques on the basis of the TF-IDF in Equation (4) introduced in [51]:
a i j = log ( t f i j + 1.0 ) l o g ( N + 1.0 n j )
where a i j denotes the weight of term j in cluster i, t f i j denotes the frequency of term j in cluster i, N is the total number of clusters, and n j denotes the number of term j that appears in all clusters.

3.2.4. Merge

Clustering with the SO algorithm is performed by grouping attractive footprints with the same pattern on the basis of their spatial and temporal properties and attributes. However, as mentioned in Section 3.2.2, besides the major cluster, distant clusters with the same pattern as the major cluster may be generated as well. To make a round ROI shape and delineate the crispy polygons around, we conduct a processing to merge clusters with the same name and spatially close (e.g., the distance between the two PVs of a group is less than two times the search radius) or overlap while the major cluster and distant clusters have assigned representative names in the previous step. After the merging process, the clustering of attractive footprints is accomplished.

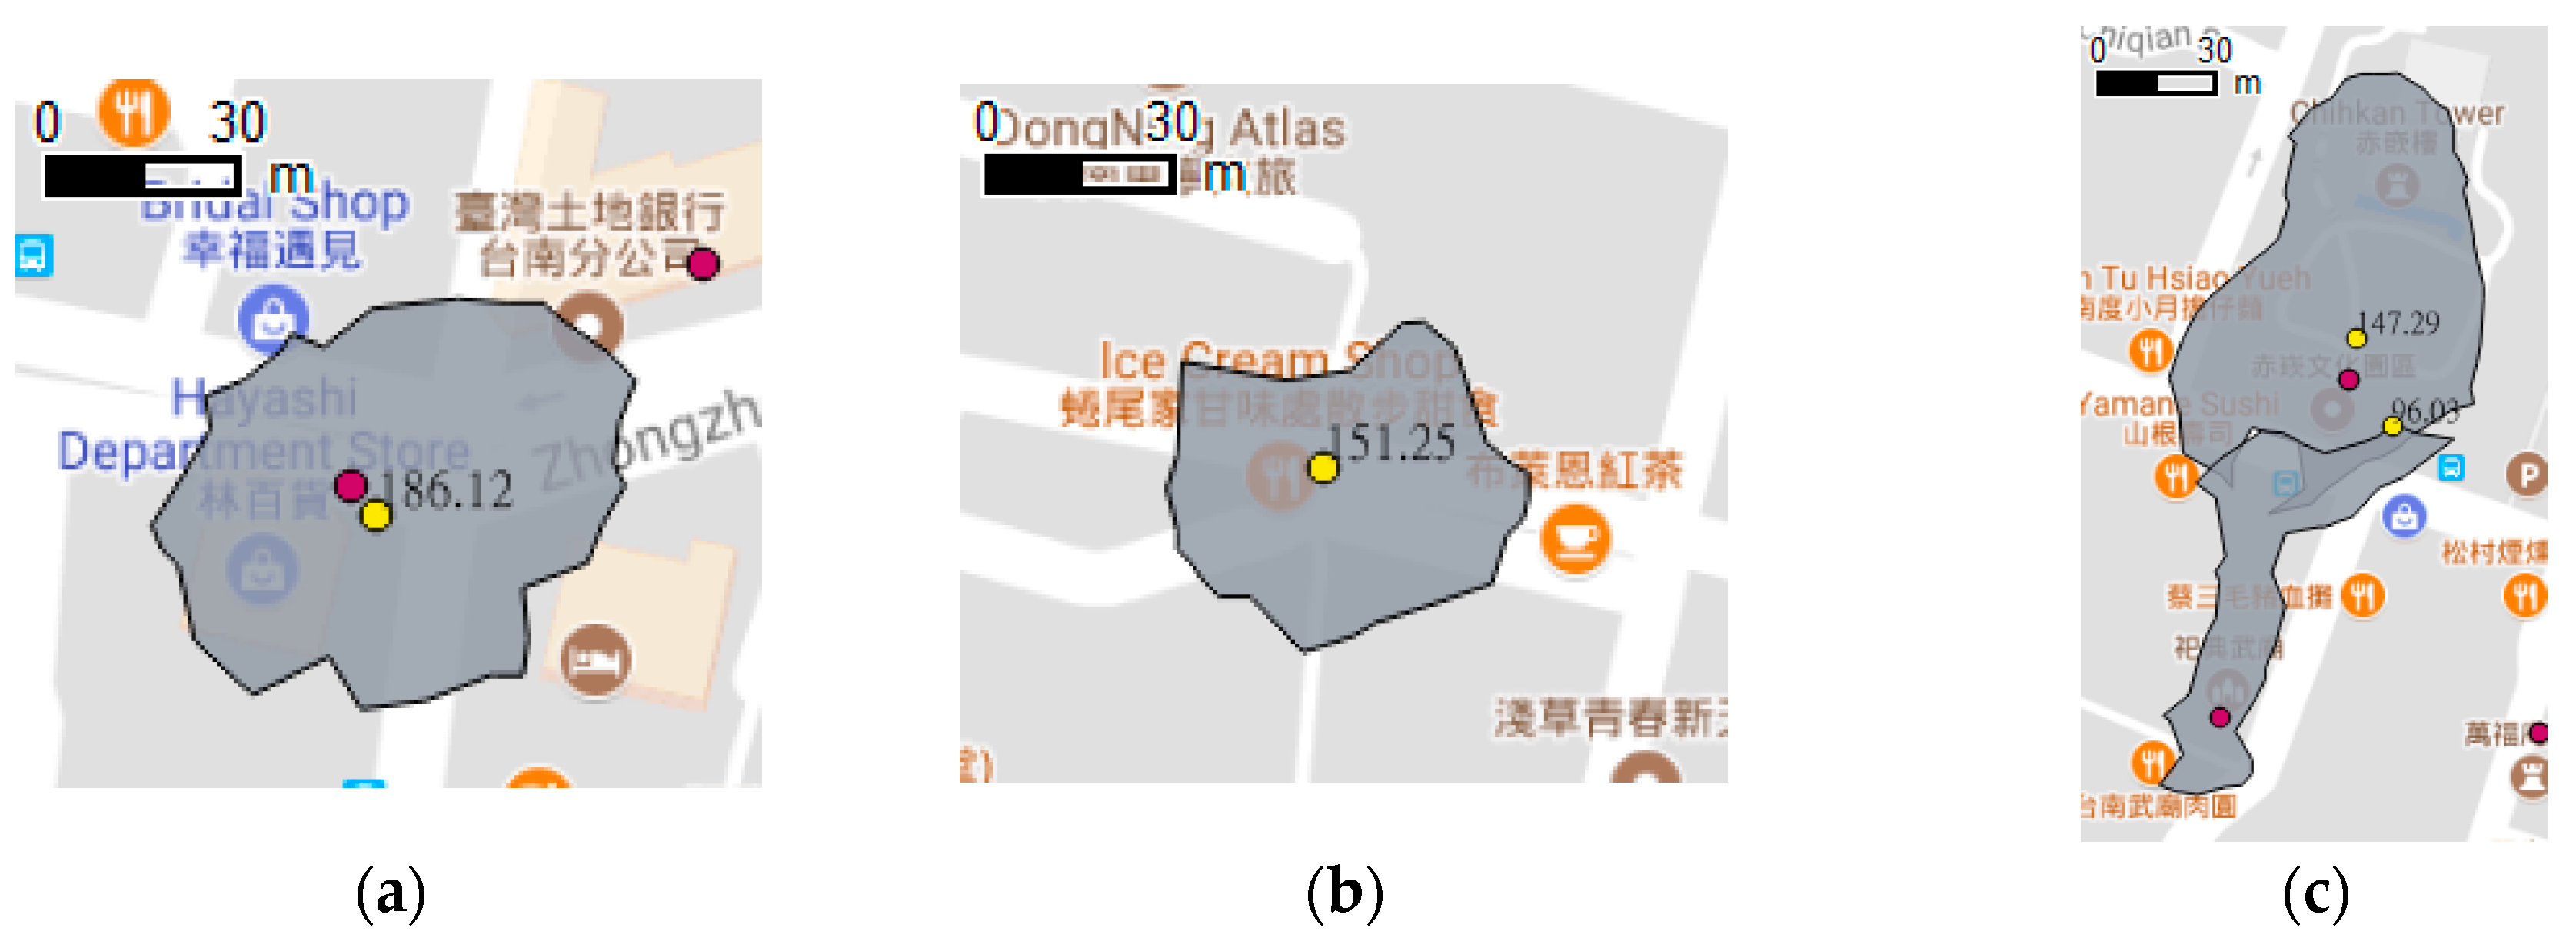
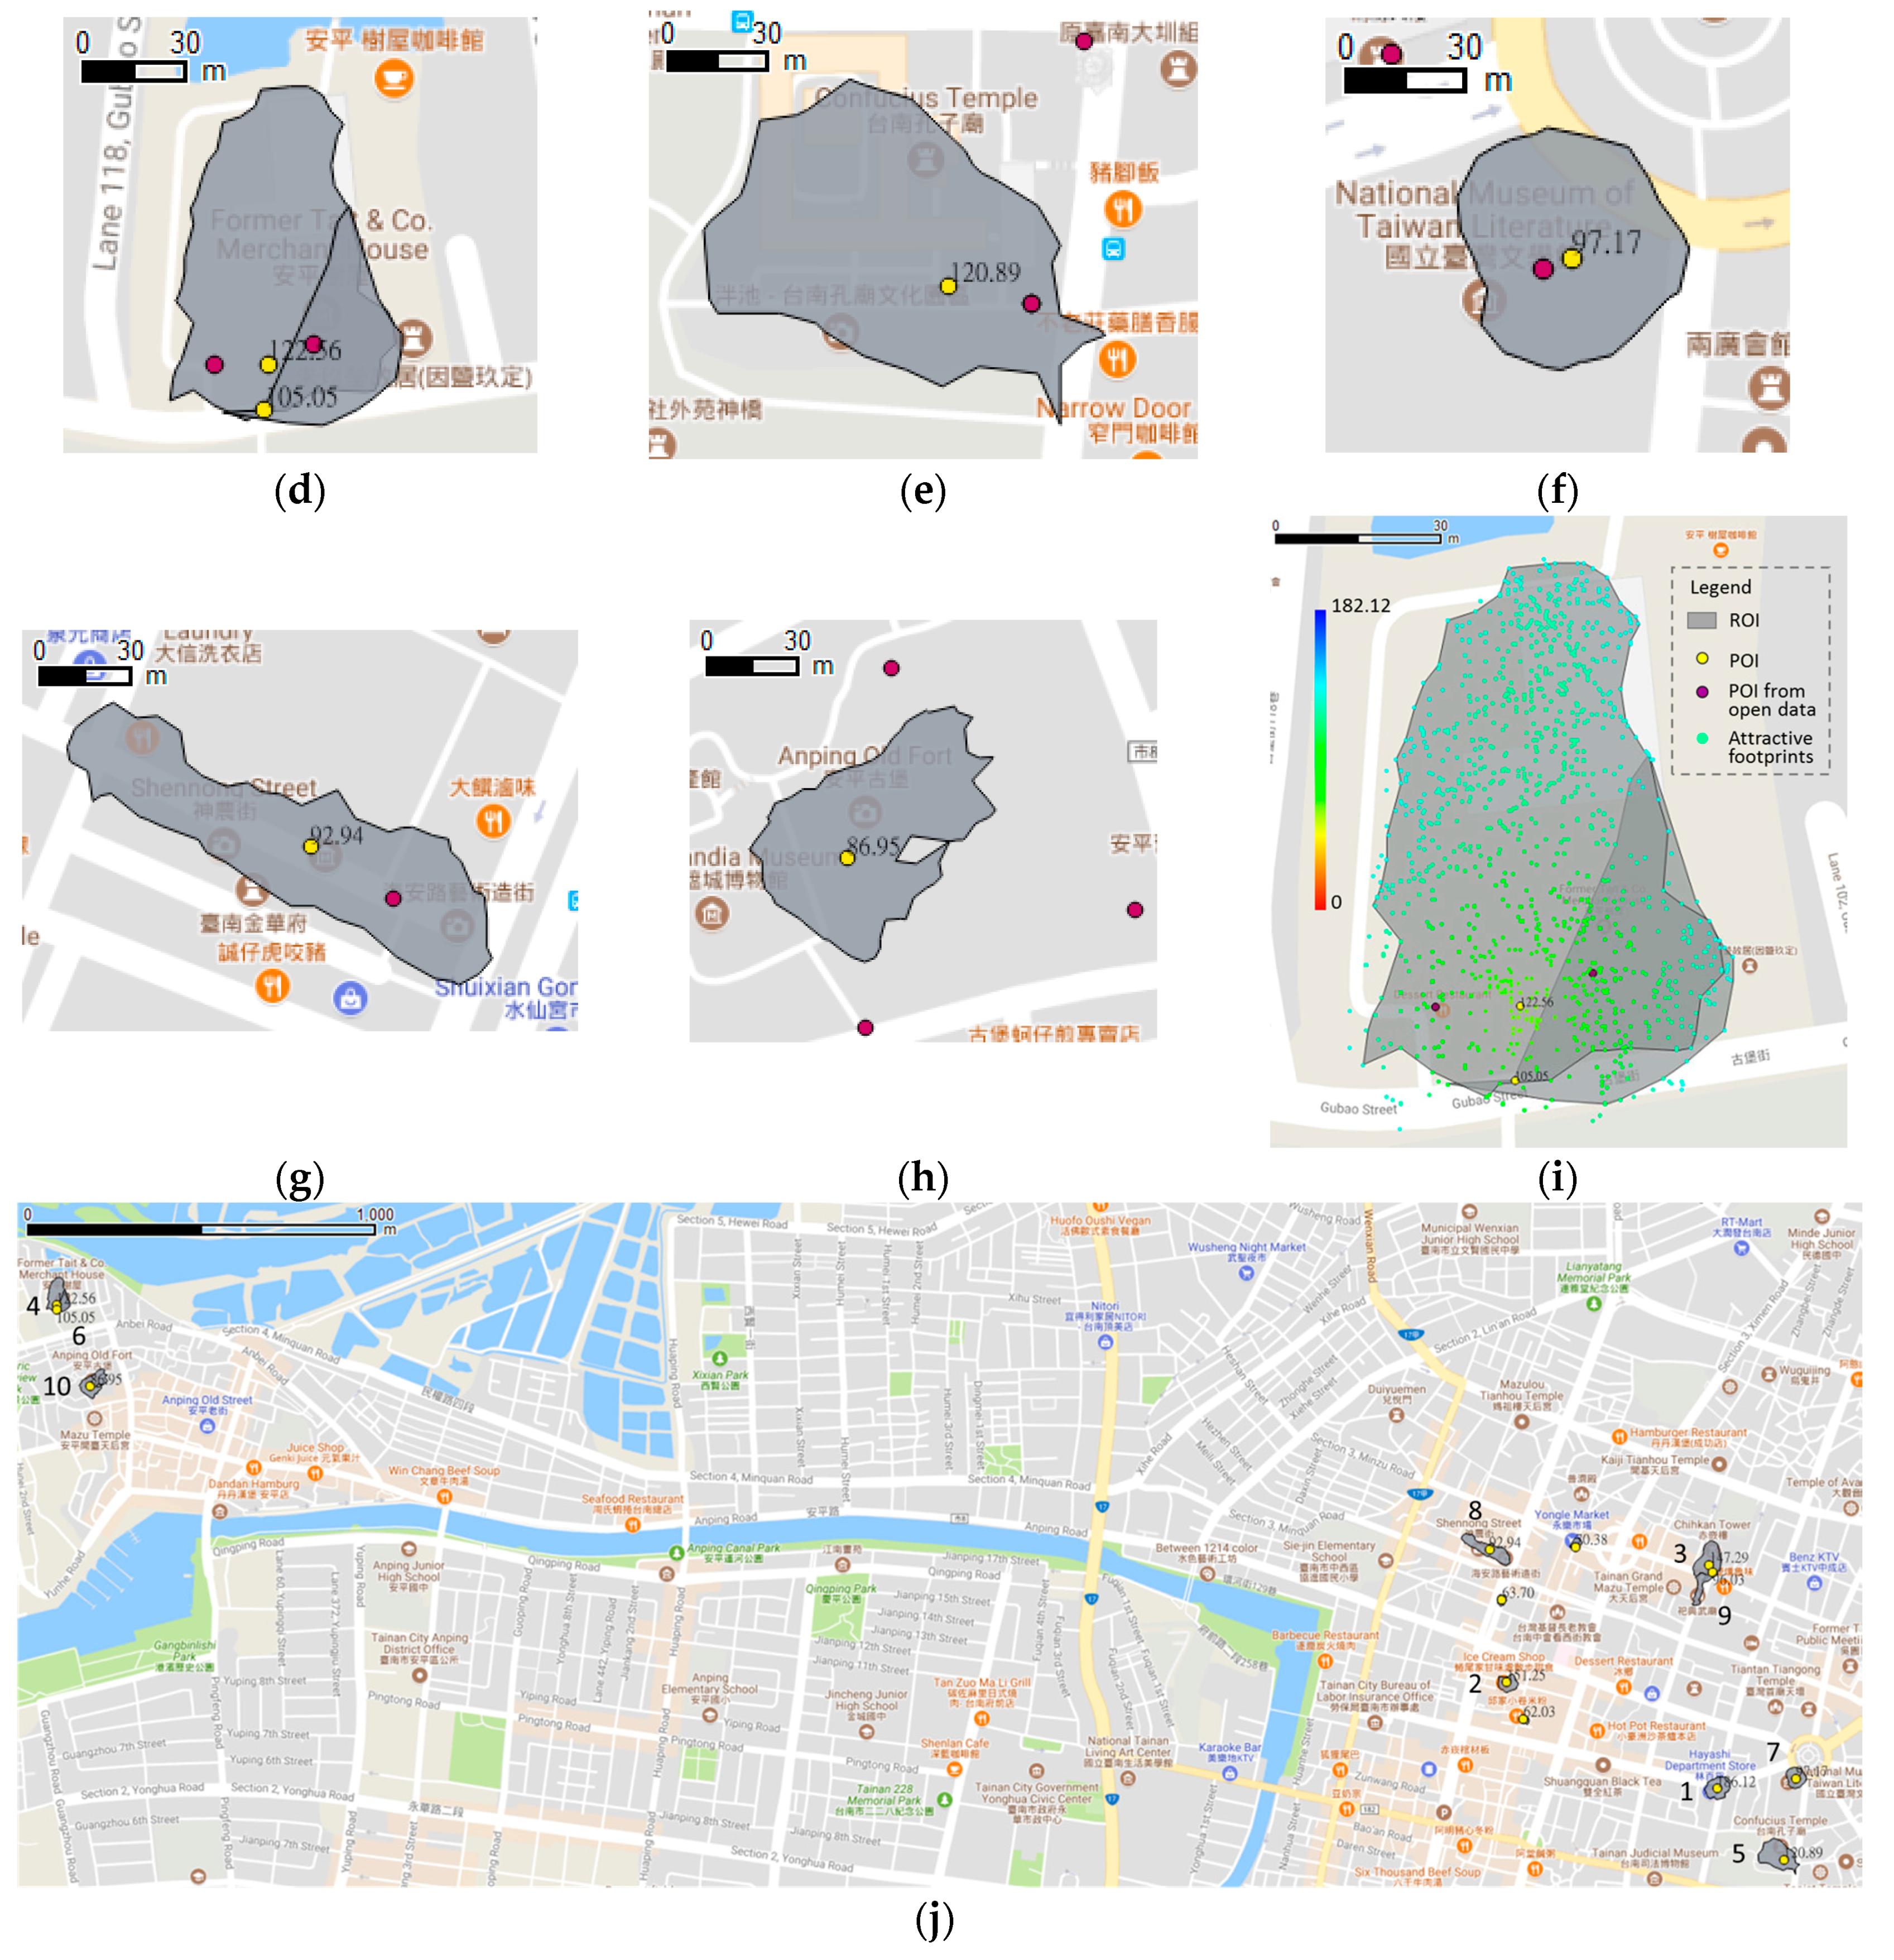
3.3. POI and ROI Determination

After clustering, the shape of the users’ interest is delineated as the last step. According to the definition of POI and ROI mentioned in the previous section, on the one hand, the POI that indicates the most attractive location for a certain attraction is retrieved from the PV of each individual cluster. In other words, the POI is the most popular location for appreciating a certain attraction. On the other hand, the ROI, which is a better spatial extent for appreciating attractions, is constructed by the alpha-shape algorithm [40], which enables the construction of a region as a convex or concave hull by flexible parameter setting. An alpha value set to each cluster adopts a value, half maximum length of a minimum bounding rectangle (MBR) of cluster, to avoid generating crispy polygons.

4. Implementation

This section presents the study areas and materials, shows the experiment results, and provides evaluation and discussion that are based on the proposed approach.

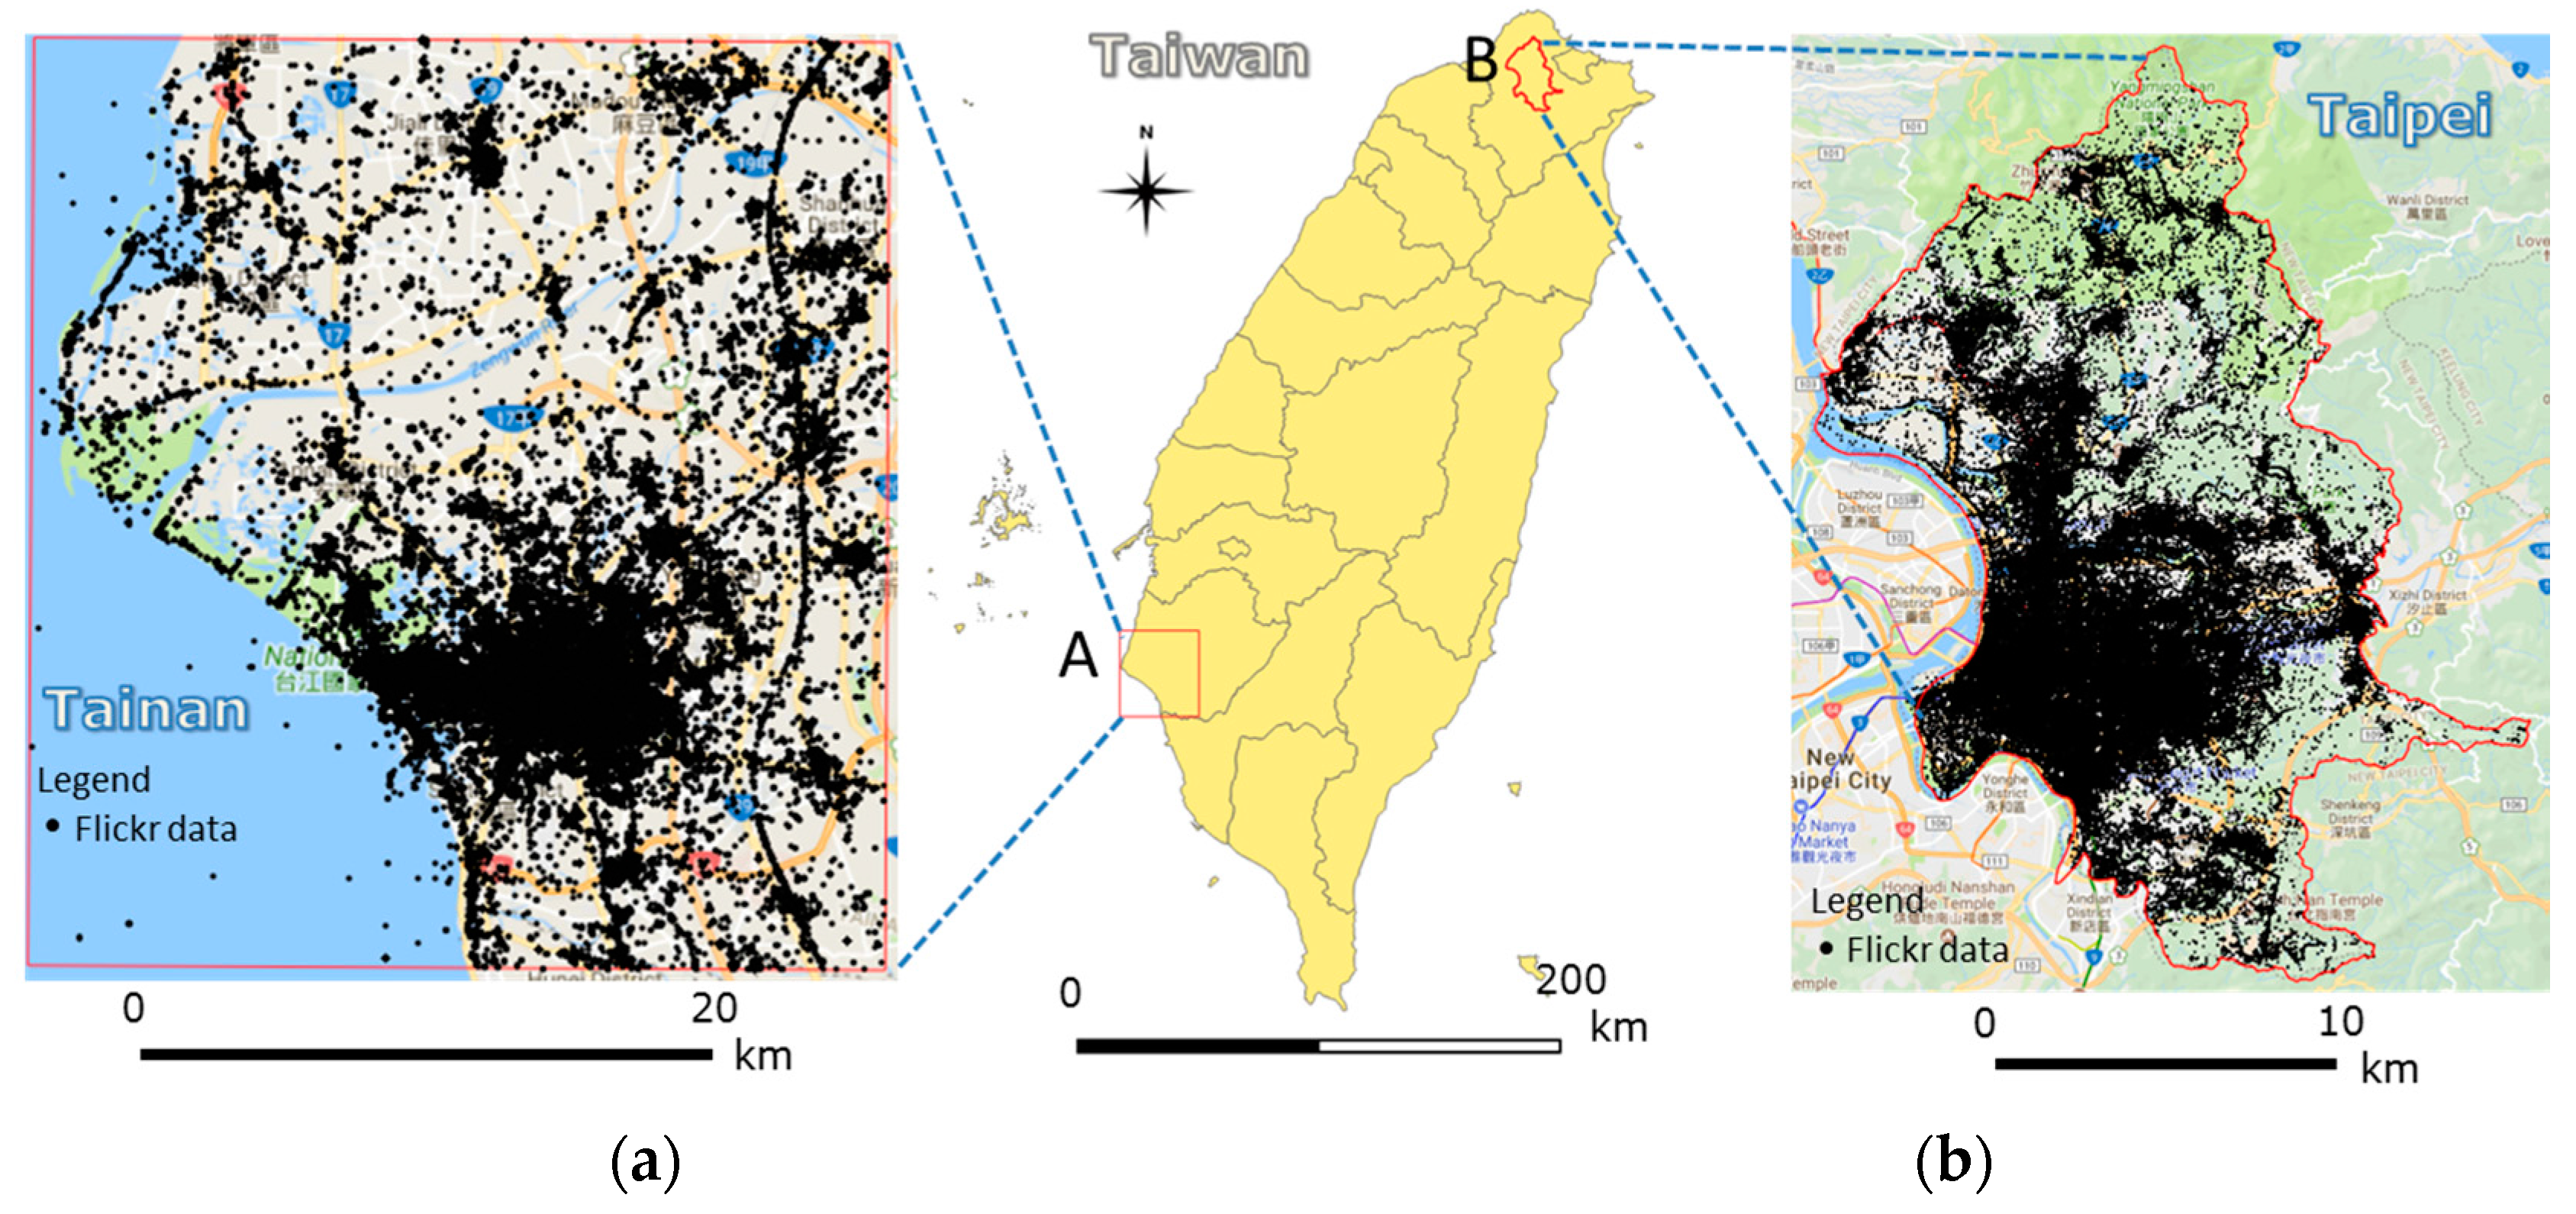
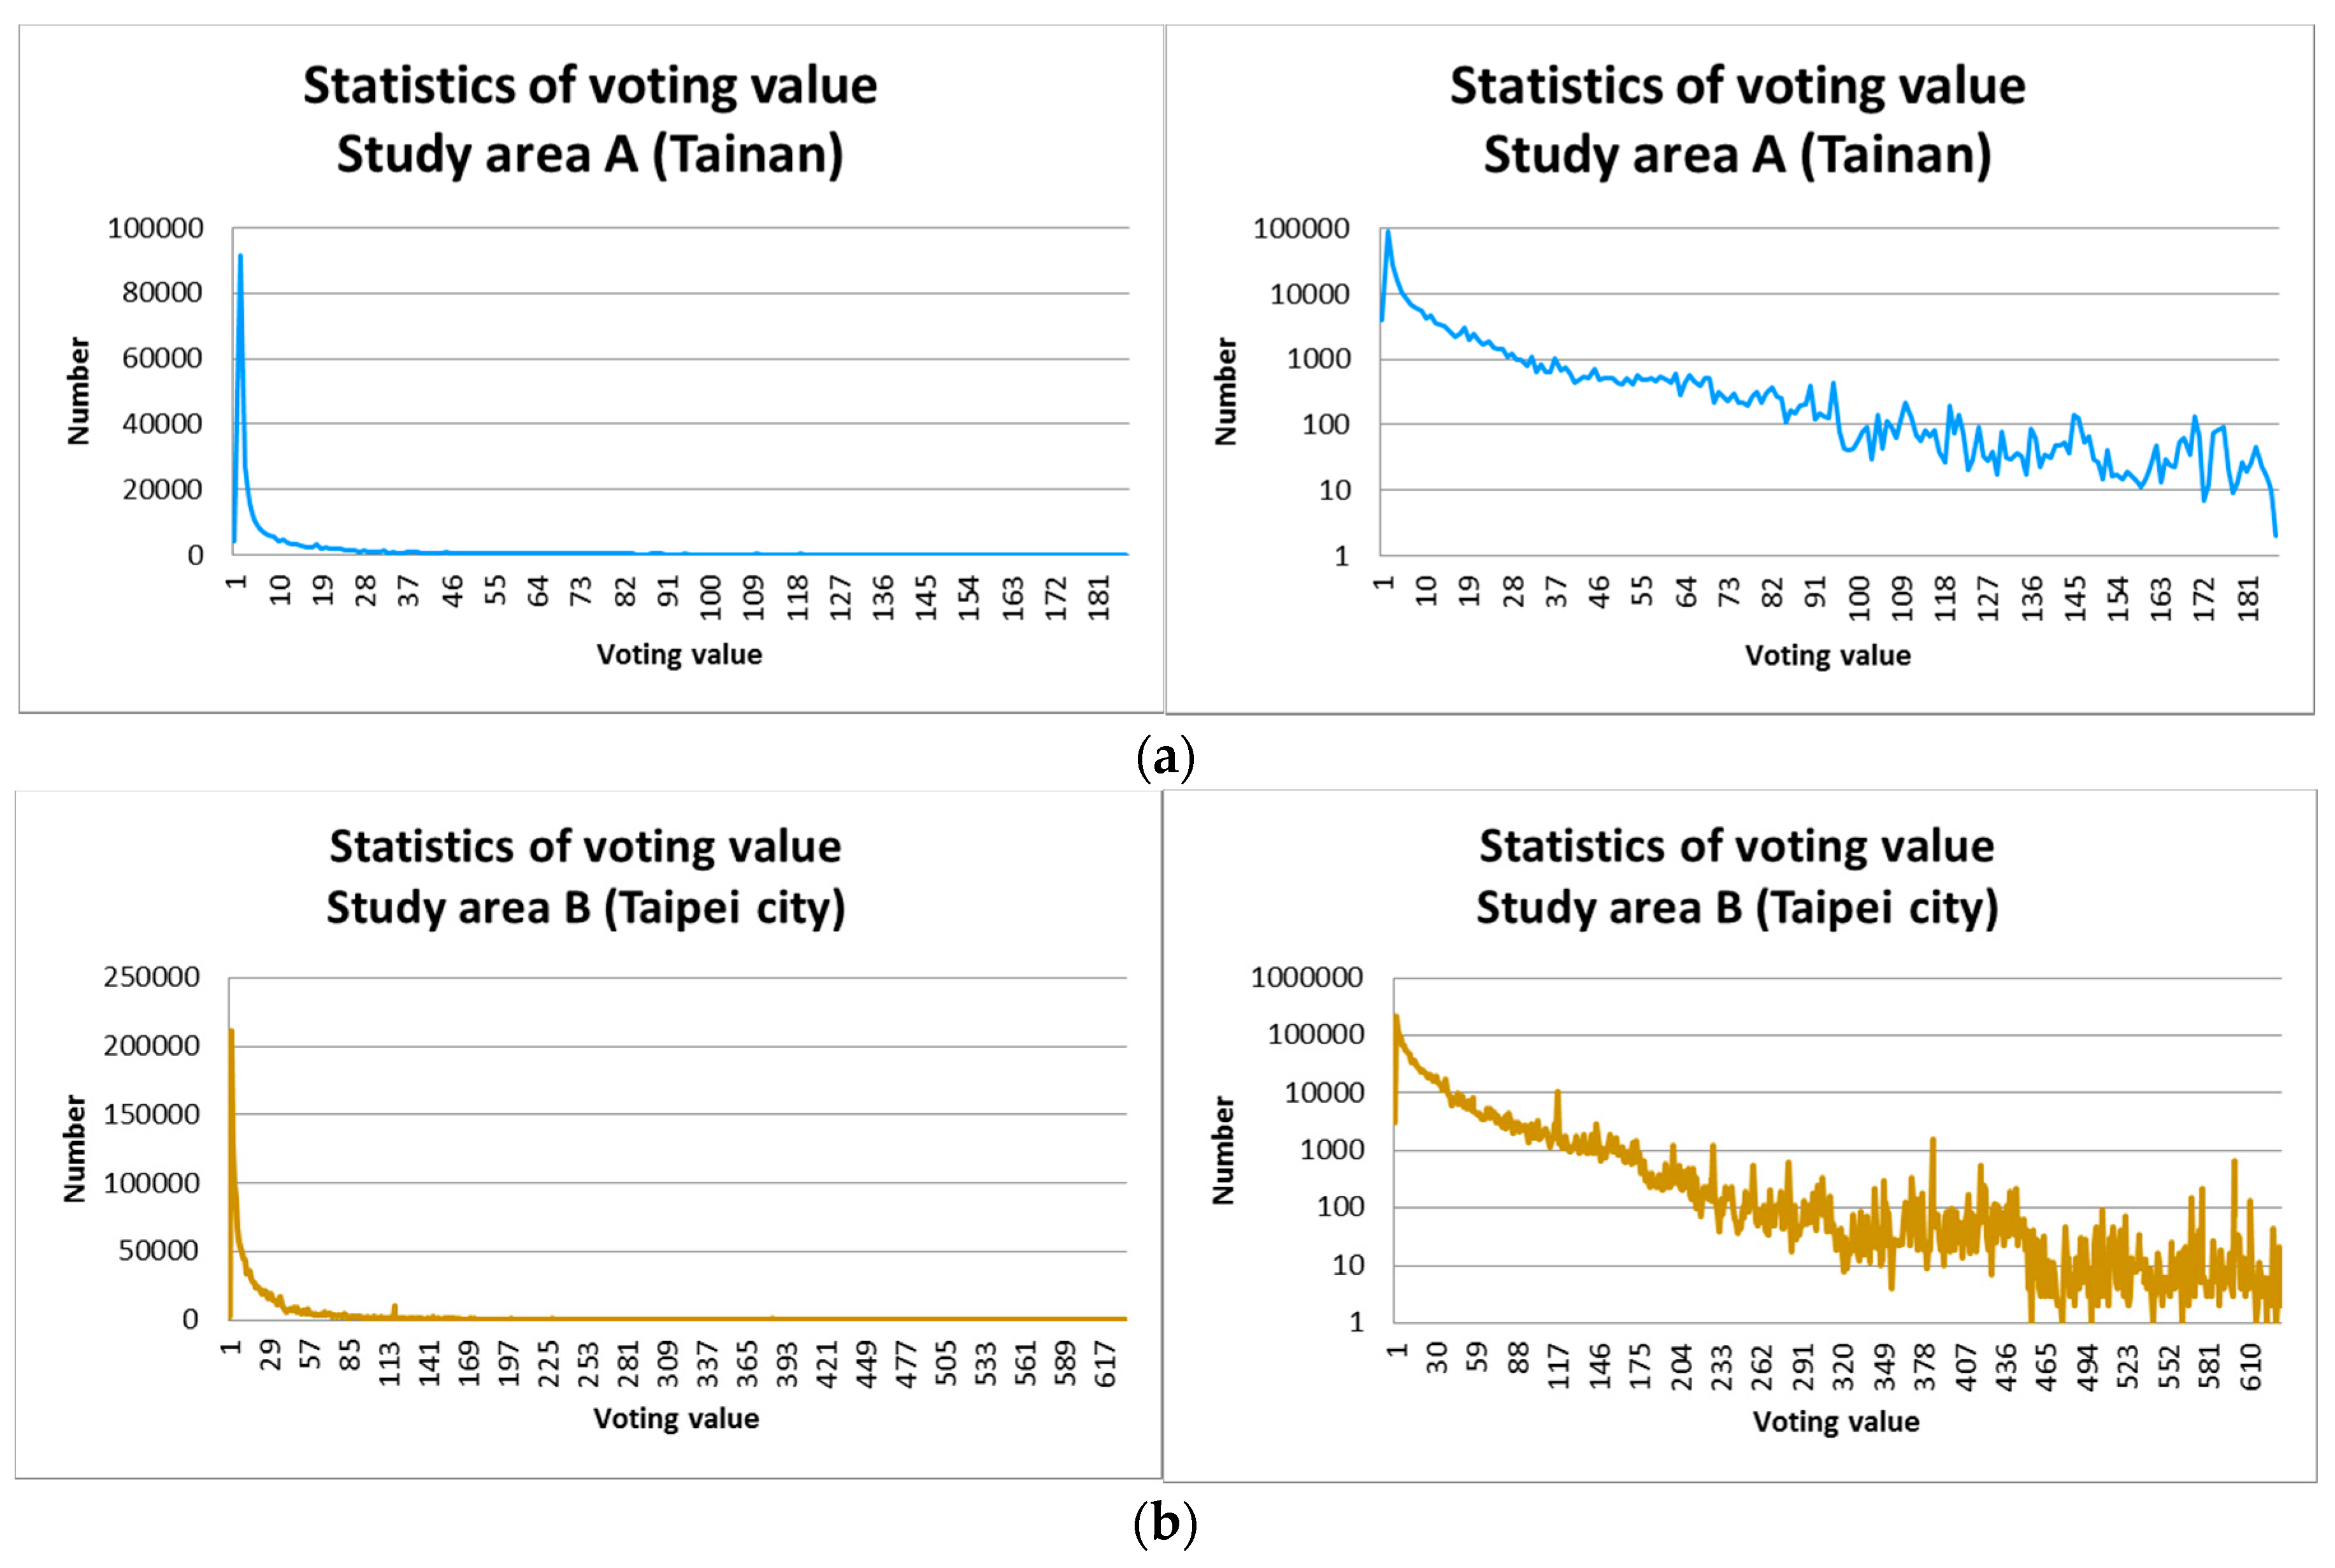
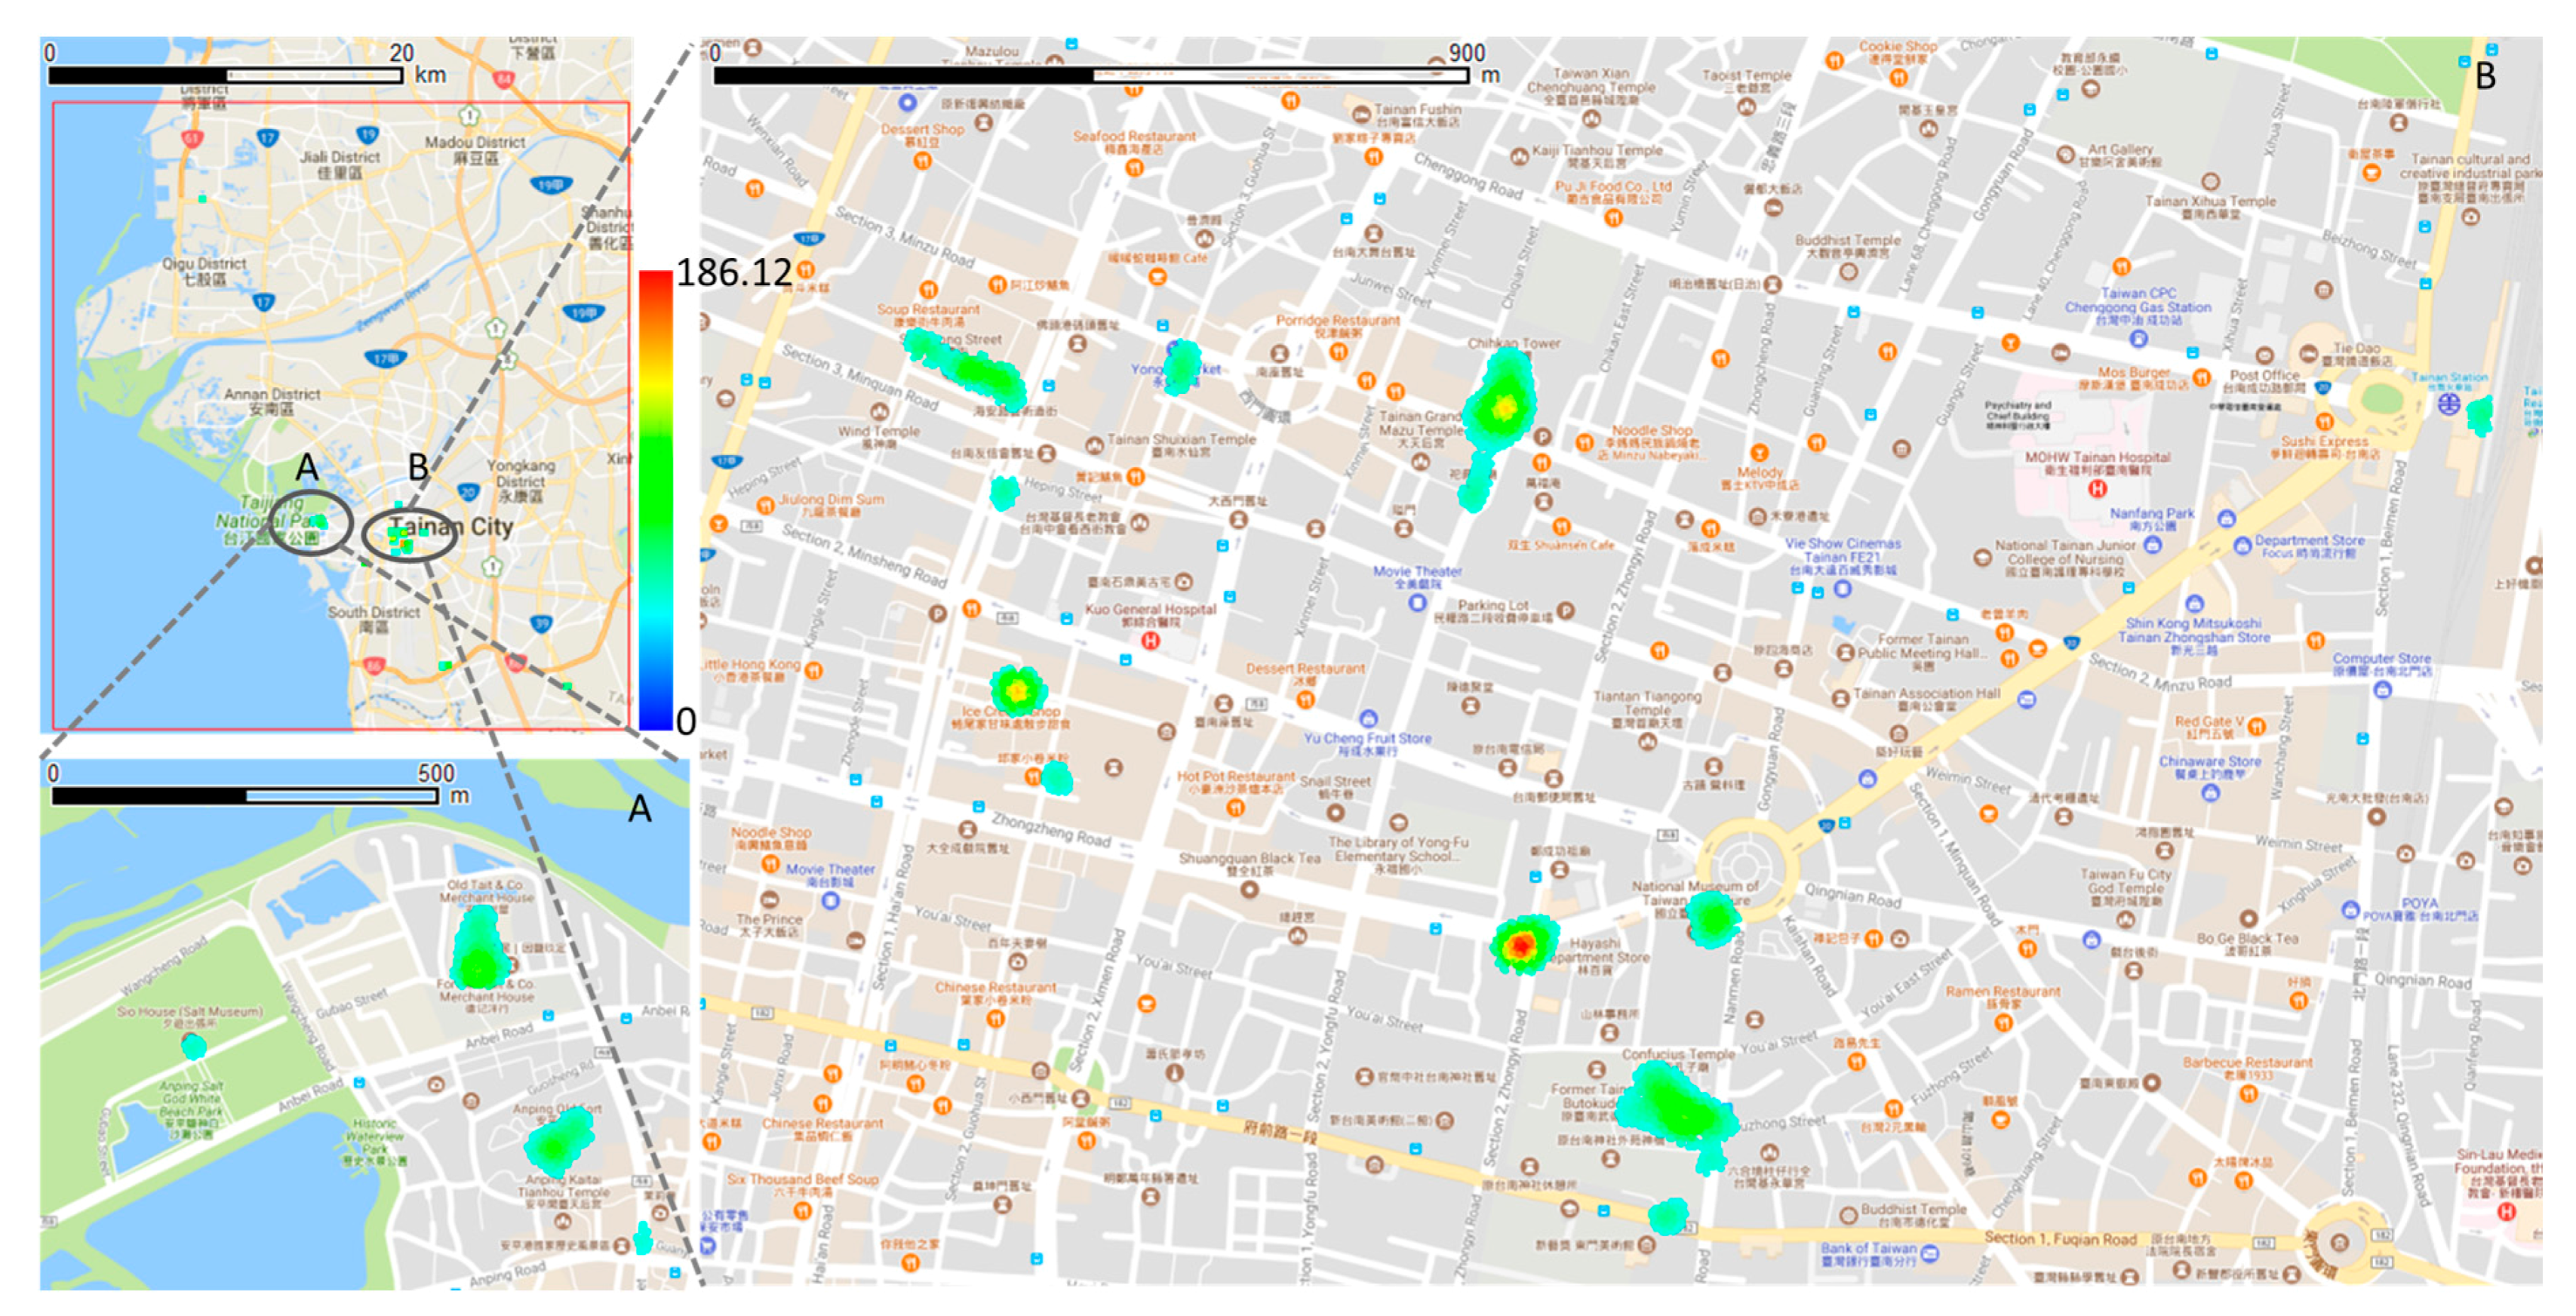
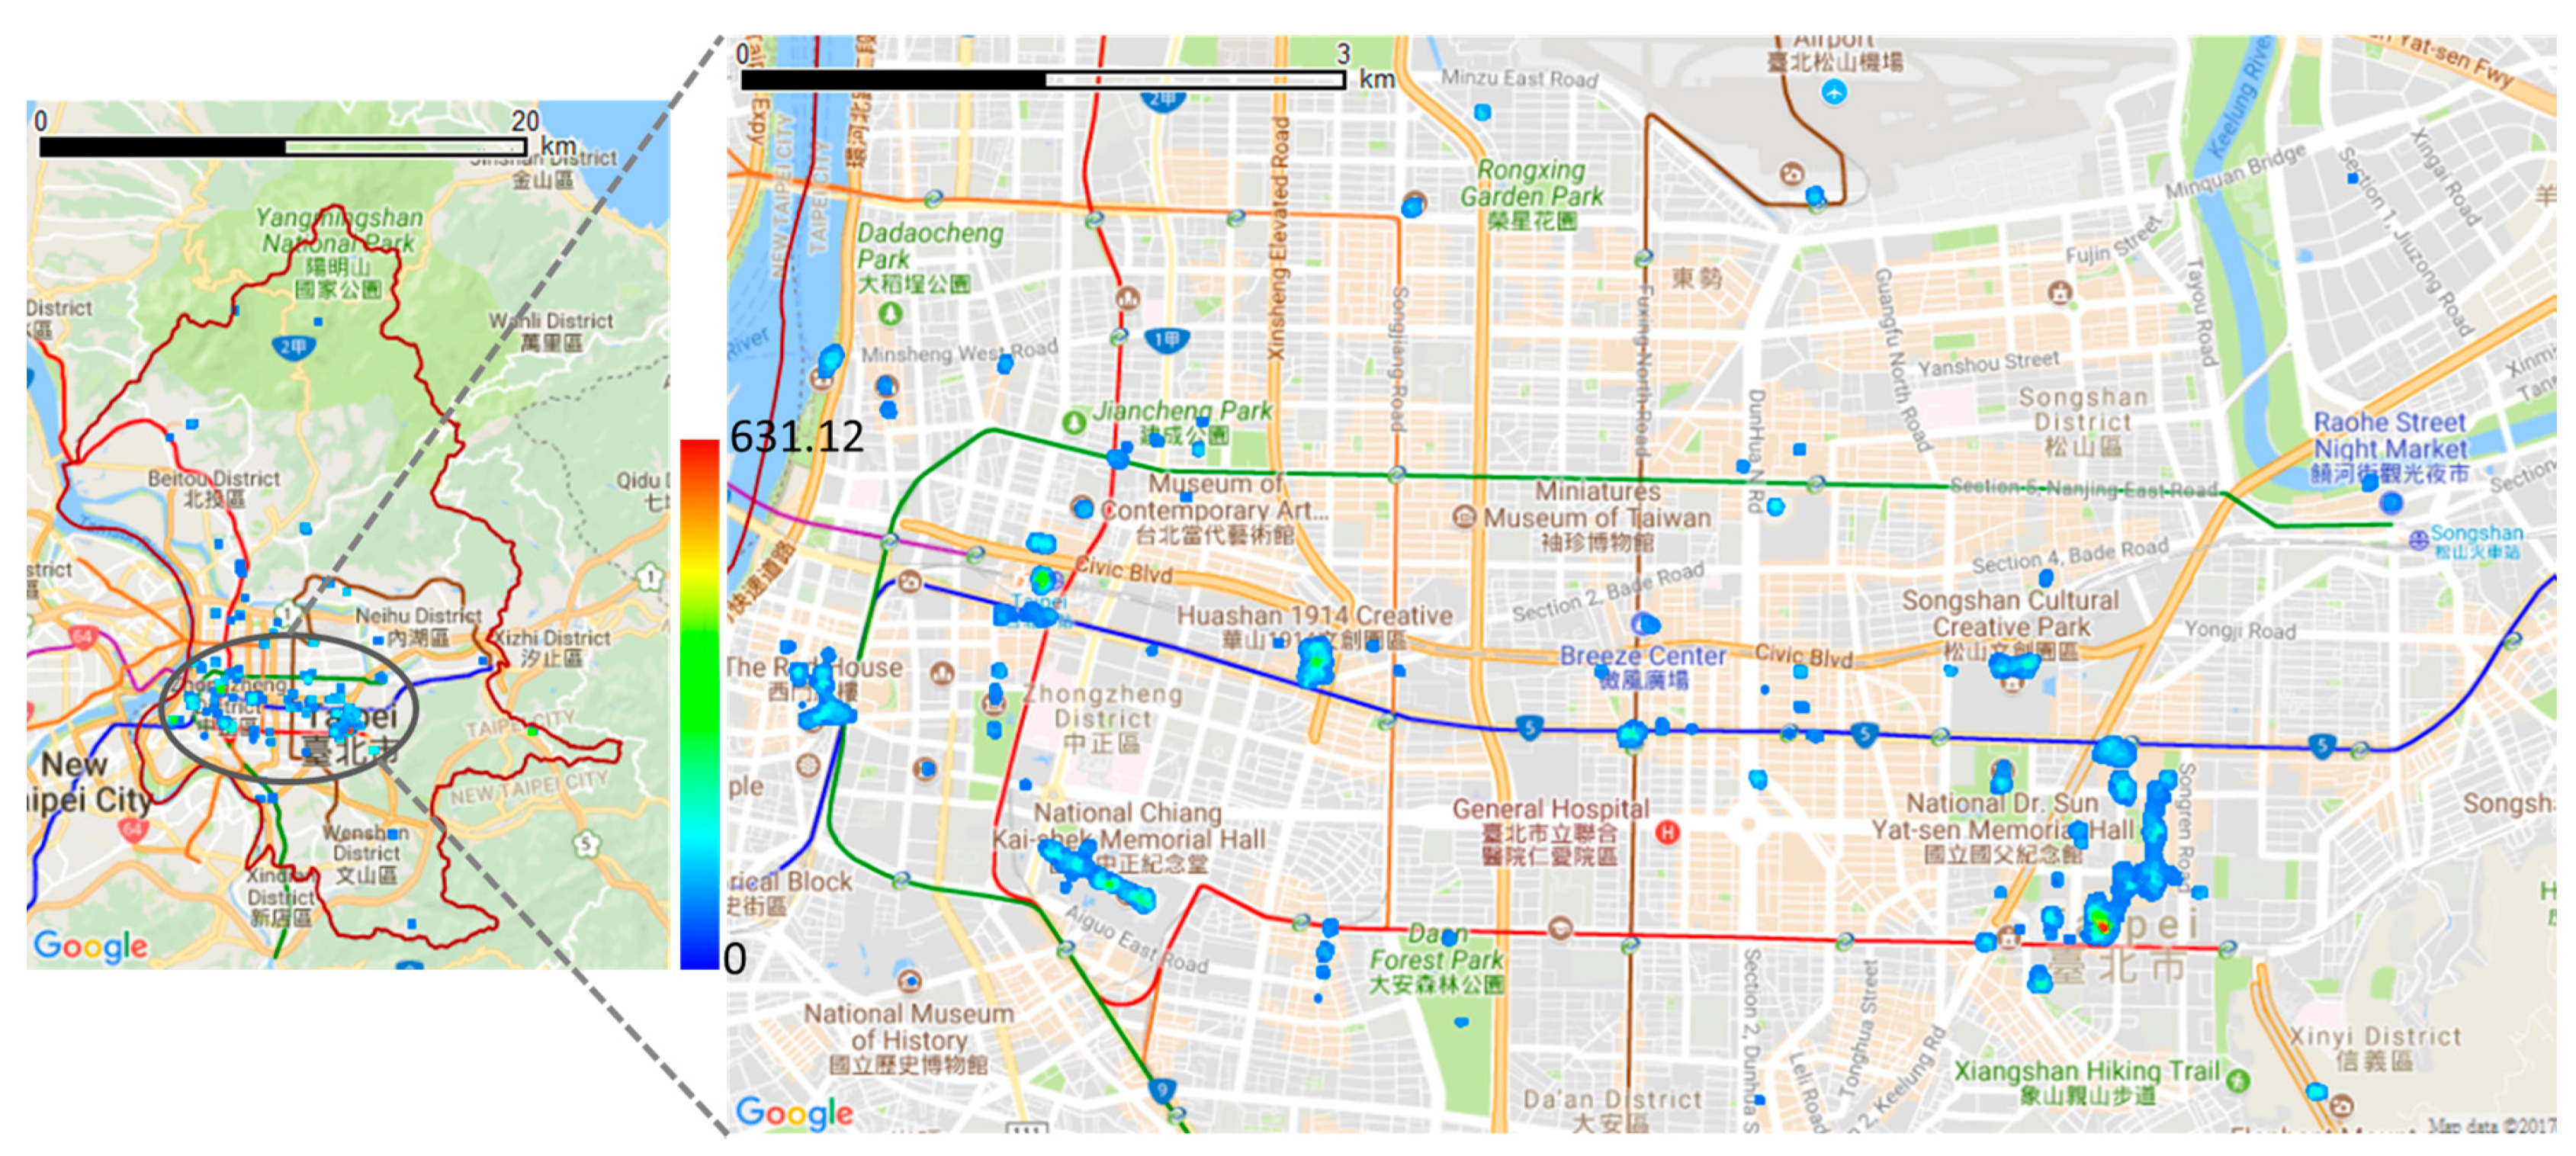
4.1. Study Areas and Materials

Two study areas are presented as two red areas, area A (ca. 991 km2) and area B (ca. 272 km2), in Figure 2. The areas are in Tainan City and Taipei City in Taiwan. Tainan City is known as the “ancient capital city” and has a good reputation for its cultural heritage, old construction, and traditional food. Taipei City is the capital of Taiwan and has the highest population density (ca. 651 people per km2), a convenient public transportation, cultural buildings and activities, and modern constructions. Meanwhile, Tainan City is the oldest city with historic attractions. Taipei City is the most modern city with the representative attractions of Taiwan (impression of Taiwan). Tourism is a major industry in Taiwan, and Taipei and Tainan are two of the most popular cities among tourists.
The data collection of Flickr geotagged photos is accomplished by a self-developed tool, FlickrPhotoCrawler [53] through the Flickr API [27]. This application fetches photos with rich information, such as photo ID, owner ID, title of photos, and location (longitude and latitude), and accuracy via the flickr.photos.search method, retrieves EXIF files with rich time information, such as original datetime, modified datetime, and GPS datetime via the flickr.photos.getExif method, and further collects tags, such as auto and user tags, for content description via the flickr.tags.getListPhoto method. Totals of 276,018 and 1,956,980 geotagged photos were collected from areas A and B, accounting for approximately 3.44% and 24.36% (the number of collected geotagged photos from the entire Taiwan through 20 October 2017 is 8,032,766.), respectively. Details about the collected data are shown in Table 1.

4.2. Result

Two important data pre-processes in terms of spatial property and tags are performed for data quality enhancement. To remove collected geotagged photos with low position accuracy that may result in imprecise POI/ROI, we extract Flickr geotagged photos with accuracy 12 to 16 (street level, according to a given definition from Flickr [54], the range of accuracy is 1 to 16, world level is 1, country is ~3, region is ~6, city is ~11, street is ~16) for a street-level POI/ROI discovery as our test data. Thus, 256,149 geotagged photos from 5792 distinct users and 1,895,042 geotagged photos from 20,566 distinct users are extracted in study areas A and B, respectively. Second, the naming of POI/ROI is mainly determined by the content of user tags rather than auto tags because the auto tags assigned by the machine are too general to provide the proper name of an attraction, such as outdoors and building. To eliminate the biases caused by user tags that are not relevant to the POI/ROI, we exclude user tags with digits, such as temporal related tags (e.g., 20110809102326) and serial numbers generated by devices; devices or camera parameters, such as nikonafs300mmf4difed; and resource information (e.g., flickriosapp:filter = newsprint, foursquare: venue = 16779486, and filename extension, such as jpg, bmp). Meanwhile, to solve the semantic issue, we manually establish a mapping table to create a synonym and translation of a term, such as “赤崁樓 (Chihkan Tower)”, which equals “赤嵌樓 (Chihkan Tower)” and “Chihkan Tower” for naming the POI/ROI; that is, naming is performed by synonym conversion.
According to the rule of construction and the spatial distribution of POI in Taiwan, the average distance between POIs is approximately 150 m. Therefore, we set the search radius to 50 m for the voting value calculation for each footprint. After the voting value calculation, the maximum voting value in study areas A and B are 186.12 and 631.12, respectively. Figure 3 shows the voting value statistics in study areas A and B. Approximately 32,705 (accounting for 12.77%) and 536,089 (accounting for 28.29%) footprints with voting values appear above or equal to 30 in study areas A and B, respectively, because we claim that at least 30 distinct people surround and focus on the footprints with voting values equal to or greater than 30, and attractive footprints and POI/ROIs will appear among these identified attractive footprints. As mentioned in Section 3, T1, T2, and T3 are set to discover the POI/ROI. T1 is helpful for clarifying what the attractive or interesting footprints are, T2 (pattern difference) gathers attractive footprints with the same pattern, and T3 (buffer setting) allows the attractive footprints on the border of ROIs to be regrouped. By setting T3, it helps achieve the goal of generating spatially-overlapped ROIs.
Various numbers of POI/ROI can be discovered by setting various T1, T2, and T3. Meanwhile, the greater the T1, the smaller the number of POIs/ROIs that can be found because only a few attractive footprints can be applied in POI/ROI discovery. To determine the most suitable T1, T2, and T3 for our study areas, we perform a complete test and assess the precision and recall of the top 10 discovered POIs/ROIs compared to the selected top 10 POIs/ROIs in study areas A and B. Precision and recall is commonly used to evaluate discovery accuracy [55]. Precision is the fraction of discovered POIs/ROIs that are relevant to the retrieved POIs/ROIs, whereas recall is the fraction of relevant POIs/ROIs that have been retrieved over the total number of relevant POIs/ROIs, in our case, the total number of relevant POIs/ROIs equals to that of selected POIs/ROIs, 10.
In study area A (in Tainan City), according to statistics from the Tourism Bureau of Tainan City Government [56], the top 10 POI/ROIs are Hayashi Department Store, Chikan Towers, Anping Treehouse, Anping Fort, Tainan Sacrificial Rites Martial Temple, Tainan Confucius Temple, ChiMei Museum, Old Shennong Street, Old Tait & Co. Merchant House, and the National Museum of Taiwan Literature (previously Tainan Prefecture Hall). In our experiments, curve F, T1, T2, and T3 set as 50, 0.2, and 0.1, respectively has a much better performance while various T1 (30, 50, 70), T2 (0.1, 0.2, 0.3), and T3 (0, 0.1) are tested (Figure 4a). T1 is set as 50, and the top 10 POI/ROI can be successfully found (refer to Figure 5 for the discovered attractive footprints with voting values equal to or greater than 50.).
In study area B (Taipei City), according to statistics from the Department of Information and Tourism, Taipei City Government [57], the top 10 POI/ROIs are National Chiang Kai-shek Memorial Hall, National Sun Yat-sen Memorial Hall, National Palace Museum, Songshan Cultural and Creative Park, Huashan 1914 Cultural and Creative Industry Park, Taipei Zoo, Taipei 101, Ximending, Longshan Temple, and Xiangshan. T1 is set as 70 (curves D, E, and F), a better performance occurs through a comprehensive test of T1 (50, 70, 100), T2 (0.1, 0.2, 0.3), and T3 (0, 0.1) (Figure 4b). Although curve D (50, 0.2, 0) without buffer setting presents a slightly better result than curve E with buffer setting (50, 0.2, 0.1), curve E performs better than curve D as a popular POI/ROI (Ding Tai Fung restaurant) can be discovered, but not in the selected top 10 (refer to Figure 6 for the discovered attractive footprints with voting values equal to or greater than 70).
Additional details about the discovered top 10 POI/ROI in study area A are depicted in Figure 7 (Only study area A is shown due to space limitation). The ranks of Figure 7a–i are determined by the voting value. In these figures, the light gray region represents the range of ROI that is the most suitable area for appreciating what people are interested in, and the bright yellow point is the POI derived from the PV that is the most popular location for an ROI. The name of each discovered ROI/POI is determined by a TF-IDF weighting approach mentioned in Section 3.2.3 and translated to English. The top 10 discovered POI/ROIs that are sorted according to the voting value in the area are (noted in Figure 7: (1) Hayashi Department Store (in Figure a); (2) Zhengxing Café (in Figure b); (3) Chikan Tower (in Figure c, the bright yellow point with voting value: 147.29 and the upper light gray region); (4) Anping Treehouse (in Figure d, the bright yellow point with voting value: 122.56 and the big light gray region); (5) Tainan Confucius Temple (Figure e); (6) Old Tait & Co. Merchant House (Figure d, the bright yellow point with voting value: 105.05 and the small light gray region); (7) National Museum of Taiwan Literature (previously Tainan Prefecture Hall) (in Figure f); (8) Old Shennong Street (in Figure g); (9) Tainan Sacrificial Rites Martial Temple (in Figure c, the bright yellow point with voting value: 96.03 and the bottom light gray region); and (10) Anping Fort(Figure h).
A significant advantage of our proposed approach in buffer setting is that it allows us to distinguish POIs and identify ROIs with spatial overlap even if the POIs are quite near. Figure 7i presents an example. The ROI of Anping Treehouse (big light gray region) overlaps with that of the Old Tait & Co. Merchant House (small light gray region). These two POI/ROIs can be successfully distinguished even if the distance of POIs is only approximately 30 m. Via the proposed approach, the attractive regions and the most popular attractive point among range of square, street, building, and heritage can be discovered successfully. Furthermore, the discovered POIs via Flickr geotagged photos are close to the location of existing POIs from the open data shown as Figure 7 (dark purple dots are open data POIs). Our approach provides an efficient approach to recommend and indicates the representative location for a POI.

4.3. Discussion and Evaluation

Discovering POI and ROI from user-contributed Flickr geotagged photos is the main goal in this study. The discovery of POI/ROI toward the assessment of spatial and temporal properties and attributes can be performed via the set of three thresholds, T1, T2, and T3, POIs/ROIs can be discovered successfully. In Tainan, Curve F (50_0.2_0.1) in Figure 3 performs best with the largest area under the precision-recall curve among the 10 tests, with various T1 (30, 50, 70), T2 (0.1, 0.2, 0.3), and T3 (0, 0.1) for the top 10 POIs/ROIs test. Particularly, the POIs are in a dense area, and their ROIs can be successfully distinguished (Figure 7i). In the 10 tests, a sharp drop occurs at the second discovered POI/ROI, Zhengxing Café, because it is a popular POI/ROI, but does not belong to the ones selected by official perspective. In addition, Curve F (50_0.2_0.1) performs better in terms of spatial evaluation. Meanwhile, others, especially Curves C, G, and J with T2 set as 0.3, have a loose similarity setting and may generate broad ranges of ROI, even across blocks.
Meanwhile, the precision–recall curves in Taipei City (density of footprints: ca. 6967 km2) are longer than those in Tainan City (density of footprints: ca. 258.5 km2) because of many popular hotspots, transportation sites, landmarks, shopping districts, or traditional communities with local features, famous establishments, such as the Taipei train station, Four Four South Village, Eslite bookstore, Qsquare, Vieshow Cinemas, Dadaocheng, Addiction Aquatic Development, Taipei Arena, Miramar, Xingtian Temple, Songshan Airport, and Ningxia Night Market, but do not belong to the ones officially selected. Nevertheless, Curve E (70_0.2_0.1) performs the best among the nine tests of various T1 (50, 70, 100), T2 (0.2, 0.3), and T3 (0, 0.1) for the top 10 POIs/ROIs test, whereas a popular restaurant is discovered but not in Curve D.
Tags play a crucial role in determining the name of POIs/ROIs. From our observation, the percentages of footprints with user tags in study areas A (Tainan City) and B (Taipei City) are approximately 52.26% and 20.77%, respectively. Furthermore, the average percentage between the groups is approximately 12.06%. The sharp decrease in tag number obviously leads to a significant drop in data and may derive a representative issue if the discovery process of POIs/ROIs purely starts from the footprints with tags. Thus, our proposed approach first discovers attractive footprints that enable the strengthening of the spatial relationship between footprints and make the ROI round from the spatial perspective, and then via the pattern discovery in terms of temporal properties and tag analysis for achieving POI/ROI discovery rather than using the tag-based approach [43] directly. Creating a mapping table for naming of POI/ROI is another core step in our approach. The mapping table facilitates the identification of the semantics of the user-generated terms that do not follow any predefined tagging standard. Currently, we manually make a bridge of synonyms, abbreviations, and translations of terms through a mapping table. This also opens a discussion on how various terms with the same semantics share the same space and how to generate a mapping table automatically from these terms in the future.
The POI/ROI discovery from Flickr is intrinsically a clustering problem. Two typical clustering methods, DBSCAN [22] and P-DBSCAN [23] are, therefore, conducted for testing and comparison. Figure 8a shows the result of clusters using DBSCAN with Eps = 50 and MinPts = 100. Therefore, 283 clusters are obtained in study area A. Furthermore, considering the users, Figure 8b presents the 81 clusters obtained using P-DBSCAN with Eps = 50 and People = 30 (people in the neighborhood). An evident problem in the DBSCAN-based approach reveals that clusters cannot be successfully distinguished, especially in dense areas, such as the Anping District (where the Anping Treehouse and the Old Tait & Co. Merchant House are located) and West Central District (where nearly all the top 10 POIs/ROIs are located). In Figure 8b, two enlarged areas A and B show that 10 POIs/ROIs are discovered by our method successfully, but only two large clusters with magenta and orange, respectively, are constructed by P-DBSCAN. This finding indicates that our proposed approach may address the clustering issue in a dense area and discover popular POIs/ROIs that receive significant attention successfully.

5. Conclusions and Future Work

We have developed an efficient method with a novel algorithm that involves the spatial and temporal properties and attributes of Flickr geotagged photos for discovering POIs/ROIs, which are significant reference data that are widely used in relevant spatial analysis and applications. The proposed method can efficiently eliminate noises and address attractive footprints with a local maximum that are helpful for identifying POIs/ROIs in dense areas. Pattern discovery is combined with the SO algorithm to assist in attractive footprint clustering and make spatially-overlapped ROI for appreciating attractions. The discovered POI is derived from the PV of an ROI, and the ROI then indicates the most popular location and range of attraction appreciation. Experimental results show a promising success in two dense cities, Tainan and Taipei in Taiwan. The discovered POIs/ROIs nearly match the selected official data in Tainan, whereas more commercial POI/ROIs are discovered in Taipei by the algorithm than official data. In addition to Flickr, other resources with spatial and temporal properties can also be applied and integrated simultaneously in our method. Particularly, our proposed method toward pattern discovery opens an opportunity to involve additional attributes, such as elevation, direction, human emotions (Antoniou et al., 2016), for a three-dimensional or emotional ROI/POI discovery. Furthermore, automatically establishing a semantic mapping table for the POI/ROI naming from tags that occupy the same space will be further discussed in the future.

Acknowledgments

This work was supported by the Postdoctoral Research Abroad Program (PRAP) (grant no. 105-2917-I-564-025) sponsored by the Ministry of Science and Technology, Taiwan (R.O.C.) and by a grant from Academia Sinica (Multidisciplinary Health Cloud Research Program: Technology Development and Application of Big Health Data).

Author Contributions

Chiao-Ling Kuo, Ta-Chien Chan, I-Chun Fan, and Alexander Zipf contributed ideas to the research. Chiao-Ling Kuo conducted the experiments and analysis; and Chiao-Ling Kuo wrote the paper.

Conflicts of Interest

The authors declare no conflict of interest.

References

  1. Goodchild, M.F. Citizens as sensors: The world of volunteered geography. GeoJournal 2007, 69, 211–221. [Google Scholar] [CrossRef]
  2. Flickr: Find Your Inspiration. Available online: https://www.flickr.com/ (accessed on 20 October 2017).
  3. Kisilevich, S.; Keim, D.; Andrienko, N.; Andrienko, G. Towards acquisition of semantics of places and events by multi-perspective analysis of geotagged photo collections. In Geospatial Visualisation; Springer: Berlin, Germany, 2013; pp. 211–233. [Google Scholar]
  4. Dunkel, A. Visualizing the perceived environment using crowdsourced photo geodata. Landsc. Urban Plan. 2015, 142, 173–186. [Google Scholar] [CrossRef]
  5. Kennedy, L.; Naaman, M.; Ahern, S.; Nair, R.; Rattenbury, T. How Flickr Helps Us Make Sense of the World: Context and Content in Community-Contributed Media Collections; ACM: New York, NY, USA, 2007; pp. 631–640. [Google Scholar]
  6. Li, L.; Goodchild, M.F. Constructing Places from Spatial Footprints; ACM: New York, NY, USA, 2012; pp. 15–21. [Google Scholar]
  7. Li, S.; Dragicevic, S.; Castro, F.A.; Sester, M.; Winter, S.; Coltekin, A.; Pettit, P.; Jiang, B.; Haworth, J.; Stein, A.; et al. Geospatial big data handling theory and methods: A review and research challenges. ISPRS J. Photogramm. Remote Sens. 2016, 115, 119–133. [Google Scholar] [CrossRef] [Green Version]
  8. Korakakis, M.; Spyrou, E.; Mylonas, P.; Perantonis, S.J. Exploiting social media information toward a context-aware recommendation system. Soc. Netw. Anal. Min. 2017, 7, 42. [Google Scholar] [CrossRef]
  9. Hu, Y.; Gao, S.; Janowicz, K.; Yu, B.; Li, W.; Prasadd, S. Extracting and understanding urban areas of interest using geotagged photos. Comput. Environ. Urban Syst. 2015, 54, 240–254. [Google Scholar] [CrossRef]
  10. Terminology-POI WG Terminology Glossary. Available online: https://www.w3.org/2010/POI/wiki/Terminology (accessed on 14 February 2017).
  11. Yahoo! GeoPlanet. Available online: https://developer.yahoo.com/geo/geoplanet/ (accessed on 20 October 2017).
  12. Openpois. Available online: http://openpois.ogcnetwork.net/ (accessed on 20 October 2017).
  13. NYC OpenData. Available online: https://nycopendata.socrata.com/ (accessed on 20 October 2017).
  14. Tainan City POI. Available online: http://data.tainan.gov.tw/dataset/landmark2 (accessed on 20 October 2017).
  15. Chuang, H.-M.; Chang, C.-H.; Kao, T.-Y.; Cheng, C.-T.; Huang, Y.-Y.; Cheong, K.-P. Enabling maps/location searches on mobile devices: Constructing a POI database via focused crawling and information extraction. Int. J. Geogr. Inf. Sci. 2016, 30, 1405–1425. [Google Scholar] [CrossRef]
  16. Jonietz, D.; Zipf, A. Defining fitness-for-use for crowdsourced points of interest (POI). ISPRS Int. J. Geo-Inf. 2016, 5, 149. [Google Scholar] [CrossRef]
  17. Rousell, A.; Hahmann, S.; Bakillah, M.; Mobasheri, A. Extraction of landmarks from OpenStreetMap for use in navigational instructions. In Proceedings of the 18th AGILE International Conference on Geographic Information Science, Lisbon, Portugal, 9–12 June 2015. [Google Scholar]
  18. Cheng, Z.; Caverlee, J.; Lee, K.; Sui, D.Z. Exploring Millions of Footprints in Location Sharing Services. ICWSM 2011, 2011, 81–88. [Google Scholar]
  19. Spyrou, E.; Korakakis, M.; Charalampidis, V.; Psallas, A.; Mylonas, P. A Geo-Clustering Approach for the Detection of Areas-of-Interest and Their Underlying Semantics. Algorithms 2017, 10, 35. [Google Scholar] [CrossRef]
  20. Skovsgaard, A.; Jensen, C.S. A clustering approach to the discovery of points of interest from geo-tagged microblog posts. In Proceedings of the 2014 IEEE 15th International Conference on Mobile Data Management (MDM), Brisbane, Australia, 14–18 July 2014; pp. 178–188. [Google Scholar]
  21. Vu, D.D.; To, H.; Shin, W.-Y.; Shahabi, C. GeoSocialBound: An Efficient Framework for Estimating Social POI Boundaries Using Spatio—Textual Information; ACM: New York, NY, USA, 2016; p. 3. [Google Scholar]
  22. Ester, M.; Kriegel, H.-P.; Sander, J.; Xu, X. A density-based algorithm for discovering clusters in large spatial databases with noise. In Proceedings of the Second International Conference on Knowledge Discovery and Data Mining, Portland, Oregon, 2–4 August 1996; pp. 226–231. [Google Scholar]
  23. Kisilevich, S.; Mansmann, F.; Keim, D. P-DBSCAN: A Density Based Clustering Algorithm for Exploration and Analysis of Attractive Areas Using Collections of Geo-Tagged Photos; ACM: New York, NY, USA, 2010; p. 38. [Google Scholar]
  24. Twitter. Available online: https://twitter.com/ (accessed on 20 October 2017).
  25. Facebook. Available online: https://www.google.com.tw/ (accessed on 20 October 2017).
  26. Instagram. Available online: https://www.instagram.com/ (accessed on 20 October 2017).
  27. flickr App Garden. Available online: https://www.flickr.com/services/api/ (accessed on 20 October 2017).
  28. Discover the Action around You with the Updated Google Maps. Available online: https://blog.google/products/maps/discover-action-around-you-with-updated/ (accessed on 20 October 2017).
  29. Liu, J.; Huang, Z.; Chen, L.; Shen, H.T.; Yan, Z. Discovering Areas of Interest with Geo-Tagged Images and Check-Ins; ACM: New York, NY, USA, 2012; pp. 589–598. [Google Scholar]
  30. Shirai, M.; Hirota, M.; Ishikawa, H.; Yokoyama, S. A method of Area of Interest and Shooting Spot Detection using Geo-tagged Photographs. In Proceedings of the First ACM Sigspatial International Workshop on Computational Models of Place, Orlando, FL, USA, 5–8 November 2013; pp. 34–41. [Google Scholar]
  31. Ruiz, C.; Spiliopoulou, M.; Menasalvas, E. C-Dbscan: Density-Based Clustering with Constraints; Springer: Heidelberg, Germany, 2007; pp. 216–223. [Google Scholar]
  32. Birant, D.; Kut, A. ST-DBSCAN: An algorithm for clustering spatial-temporal data. Data Knowl. Eng. 2007, 60, 208–221. [Google Scholar] [CrossRef]
  33. Du, Q.; Dong, Z.; Huang, C.; Ren, F. Density-Based Clustering with Geographical Background Constraints Using a Semantic Expression Model. ISPRS Int. J. Geo-Inf. 2016, 5, 72. [Google Scholar] [CrossRef]
  34. Yang, Y.; Gong, Z. Identifying, Points of Interest Using Heterogeneous Features. ACM Trans. Intell. Syst. Technol. 2015, 5, 68. [Google Scholar] [CrossRef]
  35. Campello, R.J.; Moulavi, D.; Sander, J. Density-Based Clustering Based on Hierarchical Density Estimates; Springer: Berlin, Germany, 2013; pp. 160–172. [Google Scholar]
  36. Ankerst, M.; Breunig, M.M.; Kriegel, H.-P.; Sander, J. OPTICS: Ordering Points to Identify the Clustering Structure; ACM: New York, NY, USA, 1999; pp. 49–60. [Google Scholar]
  37. Laptev, D.; Tikhonov, A.; Serdyukov, P.; Gusev, G. Parameter-Free Discovery and Recommendation of Areas-of-Interest; ACM: New York, NY, USA, 2014; pp. 113–122. [Google Scholar]
  38. Encalada, L.; Boavida-Portugal, I.; Cardoso Ferreira, C.; Rocha, J. Identifying Tourist Places of Interest Based on Digital Imprints: Towards a Sustainable Smart City. Sustainability 2017, 9, 2317. [Google Scholar] [CrossRef]
  39. Graham, R.L. An efficient algorith for determining the convex hull of a finite planar set. Inf. Process. Lett. 1972, 1, 132–133. [Google Scholar] [CrossRef]
  40. Edelsbrunner, H.; Kirkpatrick, D.; Seidel, R. On the shape of a set of points in the plane. IEEE Trans. Inf. Theory 1983, 29, 551–559. [Google Scholar] [CrossRef]
  41. Moreira, A.; Santos, M.Y. Concave hull: A k-nearest neighbours approach for the computation of the region occupied by a set of points. In Proceedings of the International Conference on Computer Graphics Theory and Applications (GRAPP), Barcelona, Spain, 8–11 March 2007; pp. 61–68. [Google Scholar]
  42. Find Your WOEID. Available online: http://www.woeidlookup.com/ (accessed on 13 March 2018).
  43. Keßler, C.; Maué, P.; Heuer, J.T.; Bartoschek, T. Bottom-up Gazetteers: Learning from the Implicit Semantics of Geotags; Spring: Heidelberg, Germany, 2009; pp. 83–102. [Google Scholar]
  44. Mummidi, L.N.; Krumm, J. Discovering points of interest from users’ map annotations. GeoJournal 2008, 72, 215–227. [Google Scholar] [CrossRef]
  45. Krumm, J.C.; Mummidi, L.N. Discovering Points of Interest from Users Map Annotations. U.S. Patent 8,401,771, 19 March 2013. [Google Scholar]
  46. Salton, G.; Buckley, C. Term-weighting approaches in automatic text retrieval. Inf. Process. Manag. 1988, 24, 513–523. [Google Scholar] [CrossRef]
  47. Rattenbury, T.; Naaman, M. Methods for extracting place semantics from Flickr tags. ACM Trans. Web 2009, 3, 1. [Google Scholar] [CrossRef]
  48. Hollenstein, L.; Purves, R. Exploring place through user-generated content: Using Flickr tags to describe city cores. J. Spat. Inf. Sci. 2010, 2010, 21–48. [Google Scholar]
  49. Lim, K.H.; Chan, J.; Leckie, C.; Karunasekera, S. Personalized trip recommendation for tourists based on user interests, points of interest visit durations and visit recency. Knowl. Inf. Syst. 2017, 1–32. [Google Scholar] [CrossRef]
  50. Yang, Y.; Gong, Z. Identifying Points of Interest by Self-Tuning Clustering; ACM: New York, NY, USA, 2011; pp. 883–892. [Google Scholar]
  51. Liu, M.; Yang, J. An improvement of TFIDF weighting in text categorization. Int. Proc. Comput. Sci. Inf. Technol. 2012, 47, 44–47. [Google Scholar]
  52. Google Maps. Available online: https://www.google.com.tw/maps/ (accessed on 20 October 2017).
  53. Yan, Y.; Eckle, M.; Kuo, C.-L.; Herfort, B.; Fan, H.; Zipf, A. Monitoring and Assessing Post-Disaster Tourism Recovery Using Geotagged Social Media Data. ISPRS Int. J. Geo-Inf. 2017, 6, 144. [Google Scholar] [CrossRef]
  54. Flickr APP Garden-flickr.photos.search. Available online: https://www.flickr.com/services/api/flickr.photos.search.html (accessed on 20 October 2017).
  55. Perry, J.W.; Kent, A.; Berry, M.M. Machine literature searching x. machine language; factors underlying its design and development. J. Assoc. Inf. Sci. Technol. 1955, 6, 242–254. [Google Scholar] [CrossRef]
  56. Tourism Bureau of Tainan City Government. Available online: https://www.twtainan.net/en-us (accessed on 20 October 2017).
  57. Department of Information and Tourism, Taipei City Government. Available online: http://english.tpedoit.gov.taipei/ (accessed on 17 January 2018).
Figure 1. Workflow of POI/ROI discovery.
Ijgi 07 00121 g001
Figure 2. Study areas and materials. (a) Study area A is in Tainan City; (b) Study area B is in Taipei City) (the base map is from Google Maps [52]).
Ijgi 07 00121 g002
Figure 3. Statistics of voting value (left: normal scale; right: log scale). (a) Study area A (in Tainan City); (b) Study area B (in Taipei City).
Ijgi 07 00121 g003
Figure 4. Precision and recall of study areas for top 10 POIs/ROIs. (a) study area A (in Tainan City); (b) study area B (in Taipei City).
Ijgi 07 00121 g004
Figure 5. Footprints with voting values equal to or greater than 50 in Tainan City.
Ijgi 07 00121 g005
Figure 6. Footprints with voting values equal to or greater than 70 in Taipei City.
Ijgi 07 00121 g006
Figure 7. Results of top 10 discovered ROIs/POIs (ah,j) and an example of spatially overlapped ROIs (i) (Name of ROI/POI is determined by TF-IDF from tags and then translated to English.) in study area A (in Tainan City). (a) Hayashi Department Store (rank No. 1); (b) Zhengxing Café (rank No. 2) (note that the discovered POI/ROI is different from the one shown in the Google maps, the light grey region and the yellow point is the ROI and POI of Zhengxing Café); (c) Chikan Tower (rank No. 3, the upper light gray region and the bright yellow point with voting value: 147.29) and Tainan Sacrificial Rites Martial Temple (rank No. 9, the bottom light gray region and the bright yellow point with voting value: 96.03); (d) Anping Treehouse (rank No. 4, the big light gray region and the bright yellow point with voting value: 122.56) and Old Tait & Co. Merchant House (rank No. 6, the small light gray region and the bright yellow point with voting value: 105.05); (e) Tainan Confucius Temple (rank No. 5); (f) National Museum of Taiwan Literature (previously Tainan Prefecture Hall) (rank No. 7); (g) Old Shennong Street (rank No. 8); (h) Anping Fort (rank No. 10); (i) Anping Treehouse (big light gray region) and the Old Tait & Co. Merchant House (small light gray region); and (j) an overview of 10 discovered ROIs/POIs.
Ijgi 07 00121 g007aIjgi 07 00121 g007b
Figure 8. DBSCAN-based approach for clustering in study area A (in Tainan City) via (a) DBSCAN; (b) P-DBSCAN (discovered ROI/POIs (light gray polygon: ROI; yellow point: POI) overlay P-DBSCAN result).
Ijgi 07 00121 g008
Table 1. Collected data in study areas A and B (through 20 October 2017).
ItemStudy Area AStudy Area B
Total number of photos276,0181,956,980
Percentage of photos in Taiwan3.44%24.36%
Distinct contributed users6,74922,886
User tags (total/distinct)925,761/34,1402,918,749/97,803
Photos with user tags144,249406,461

