Impacts of Street-Visible Greenery on Housing Prices: Evidence from a Hedonic Price Model and a Massive Street View Image Dataset in Beijing

Abstract
1. Introduction
2. Study Area and Data Acquisition
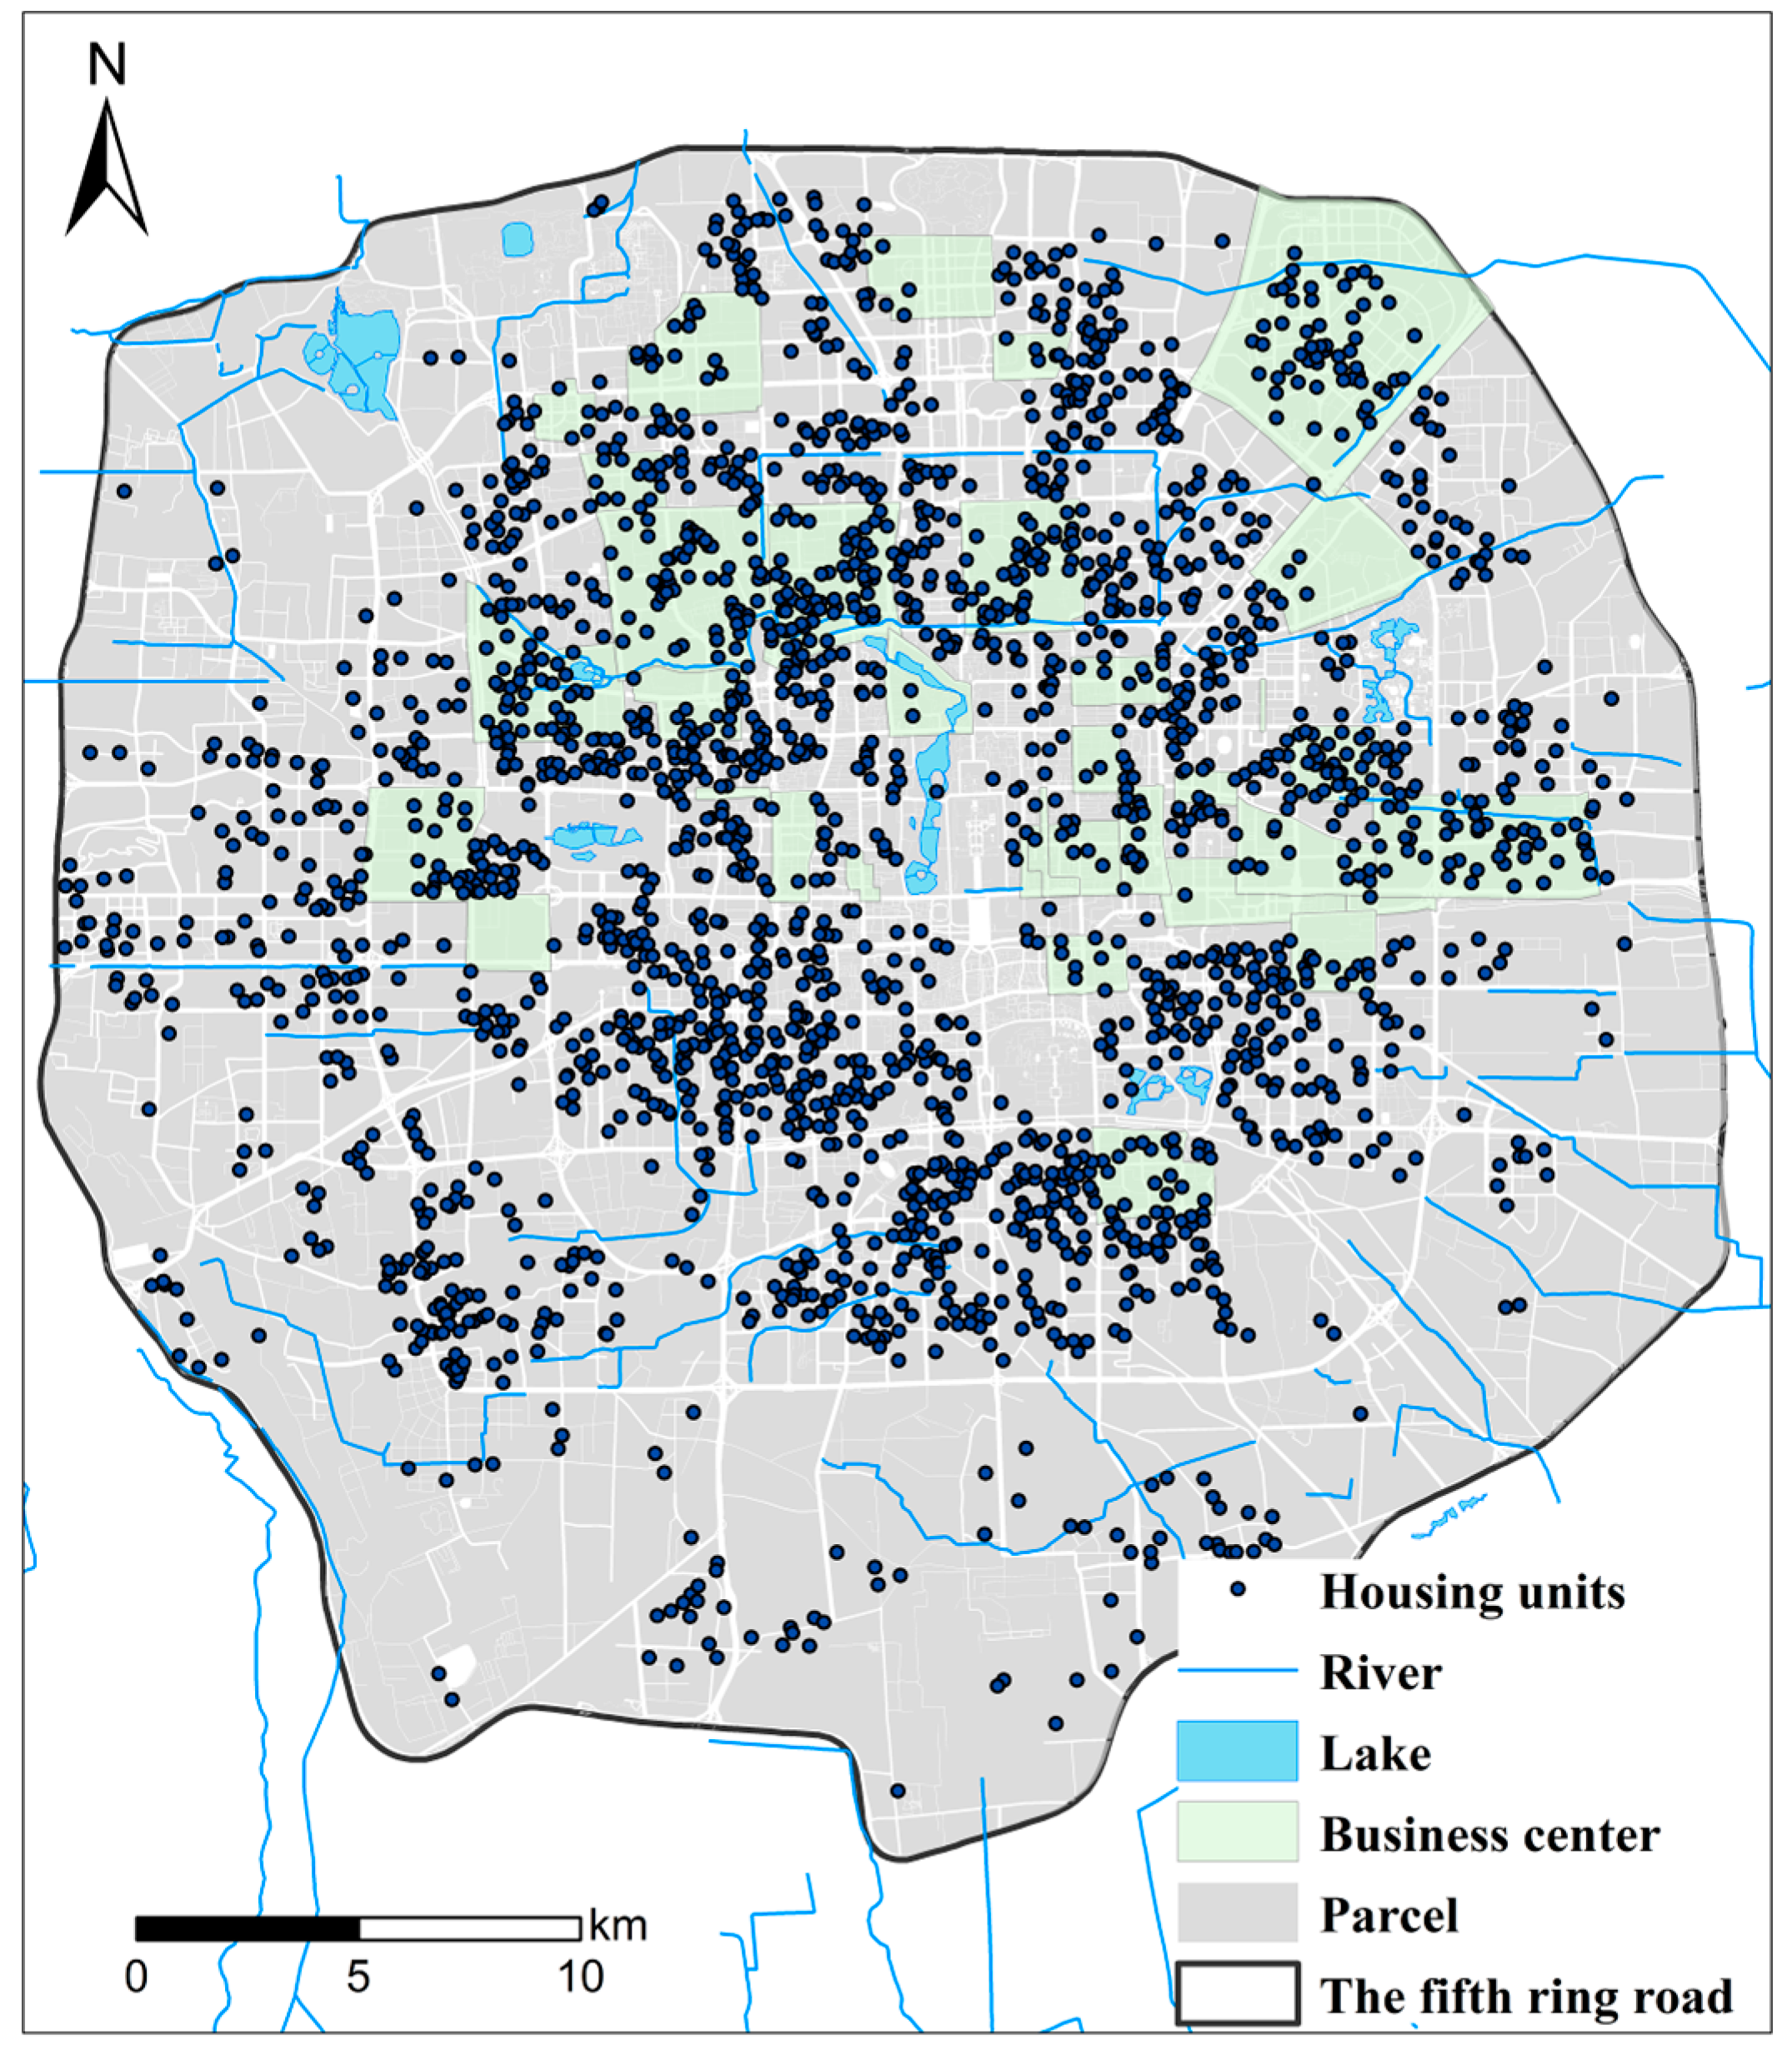
2.1. Study Area
2.2. Data Acquisition
3. Methods
3.1. Hedonic Pricing Model
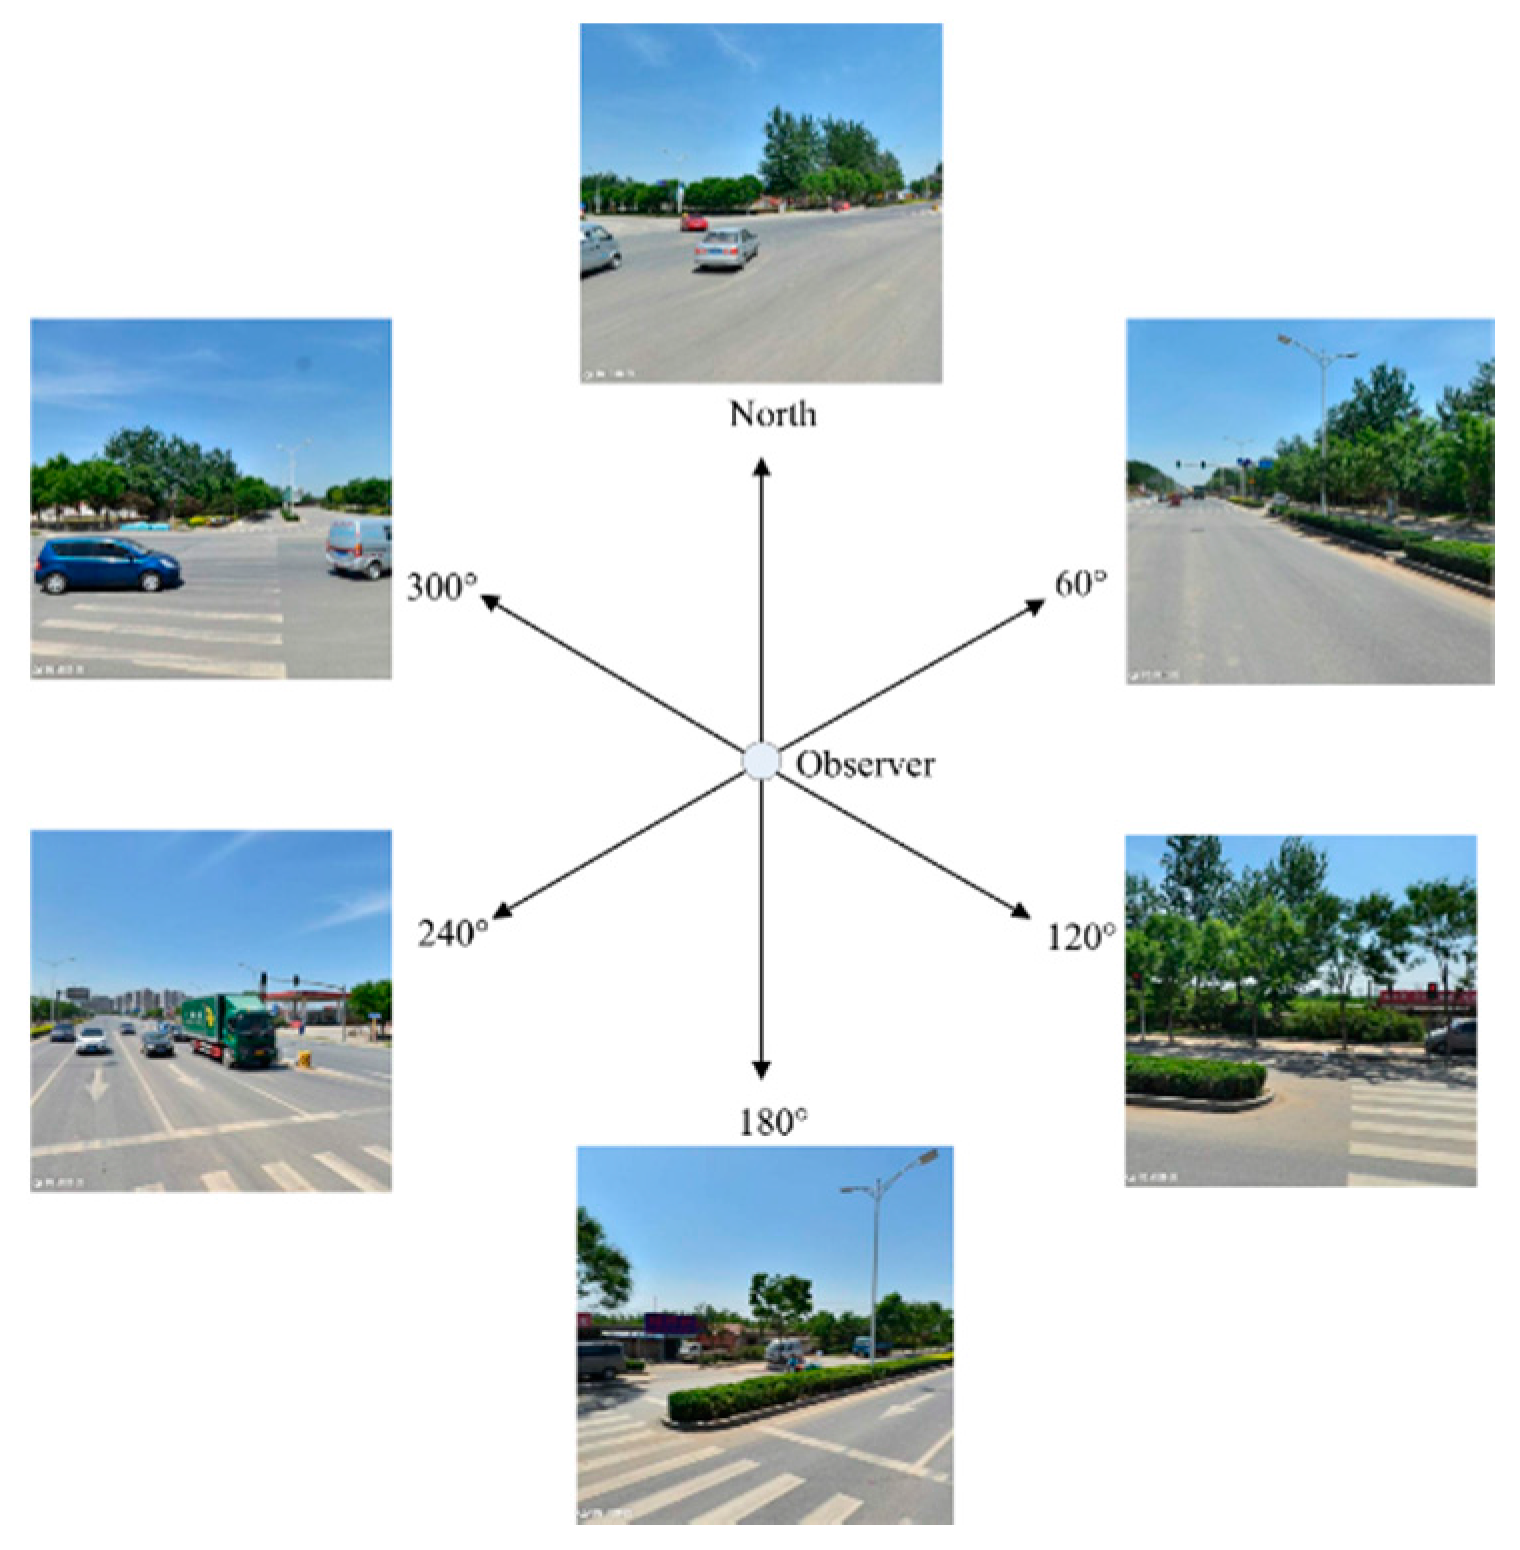
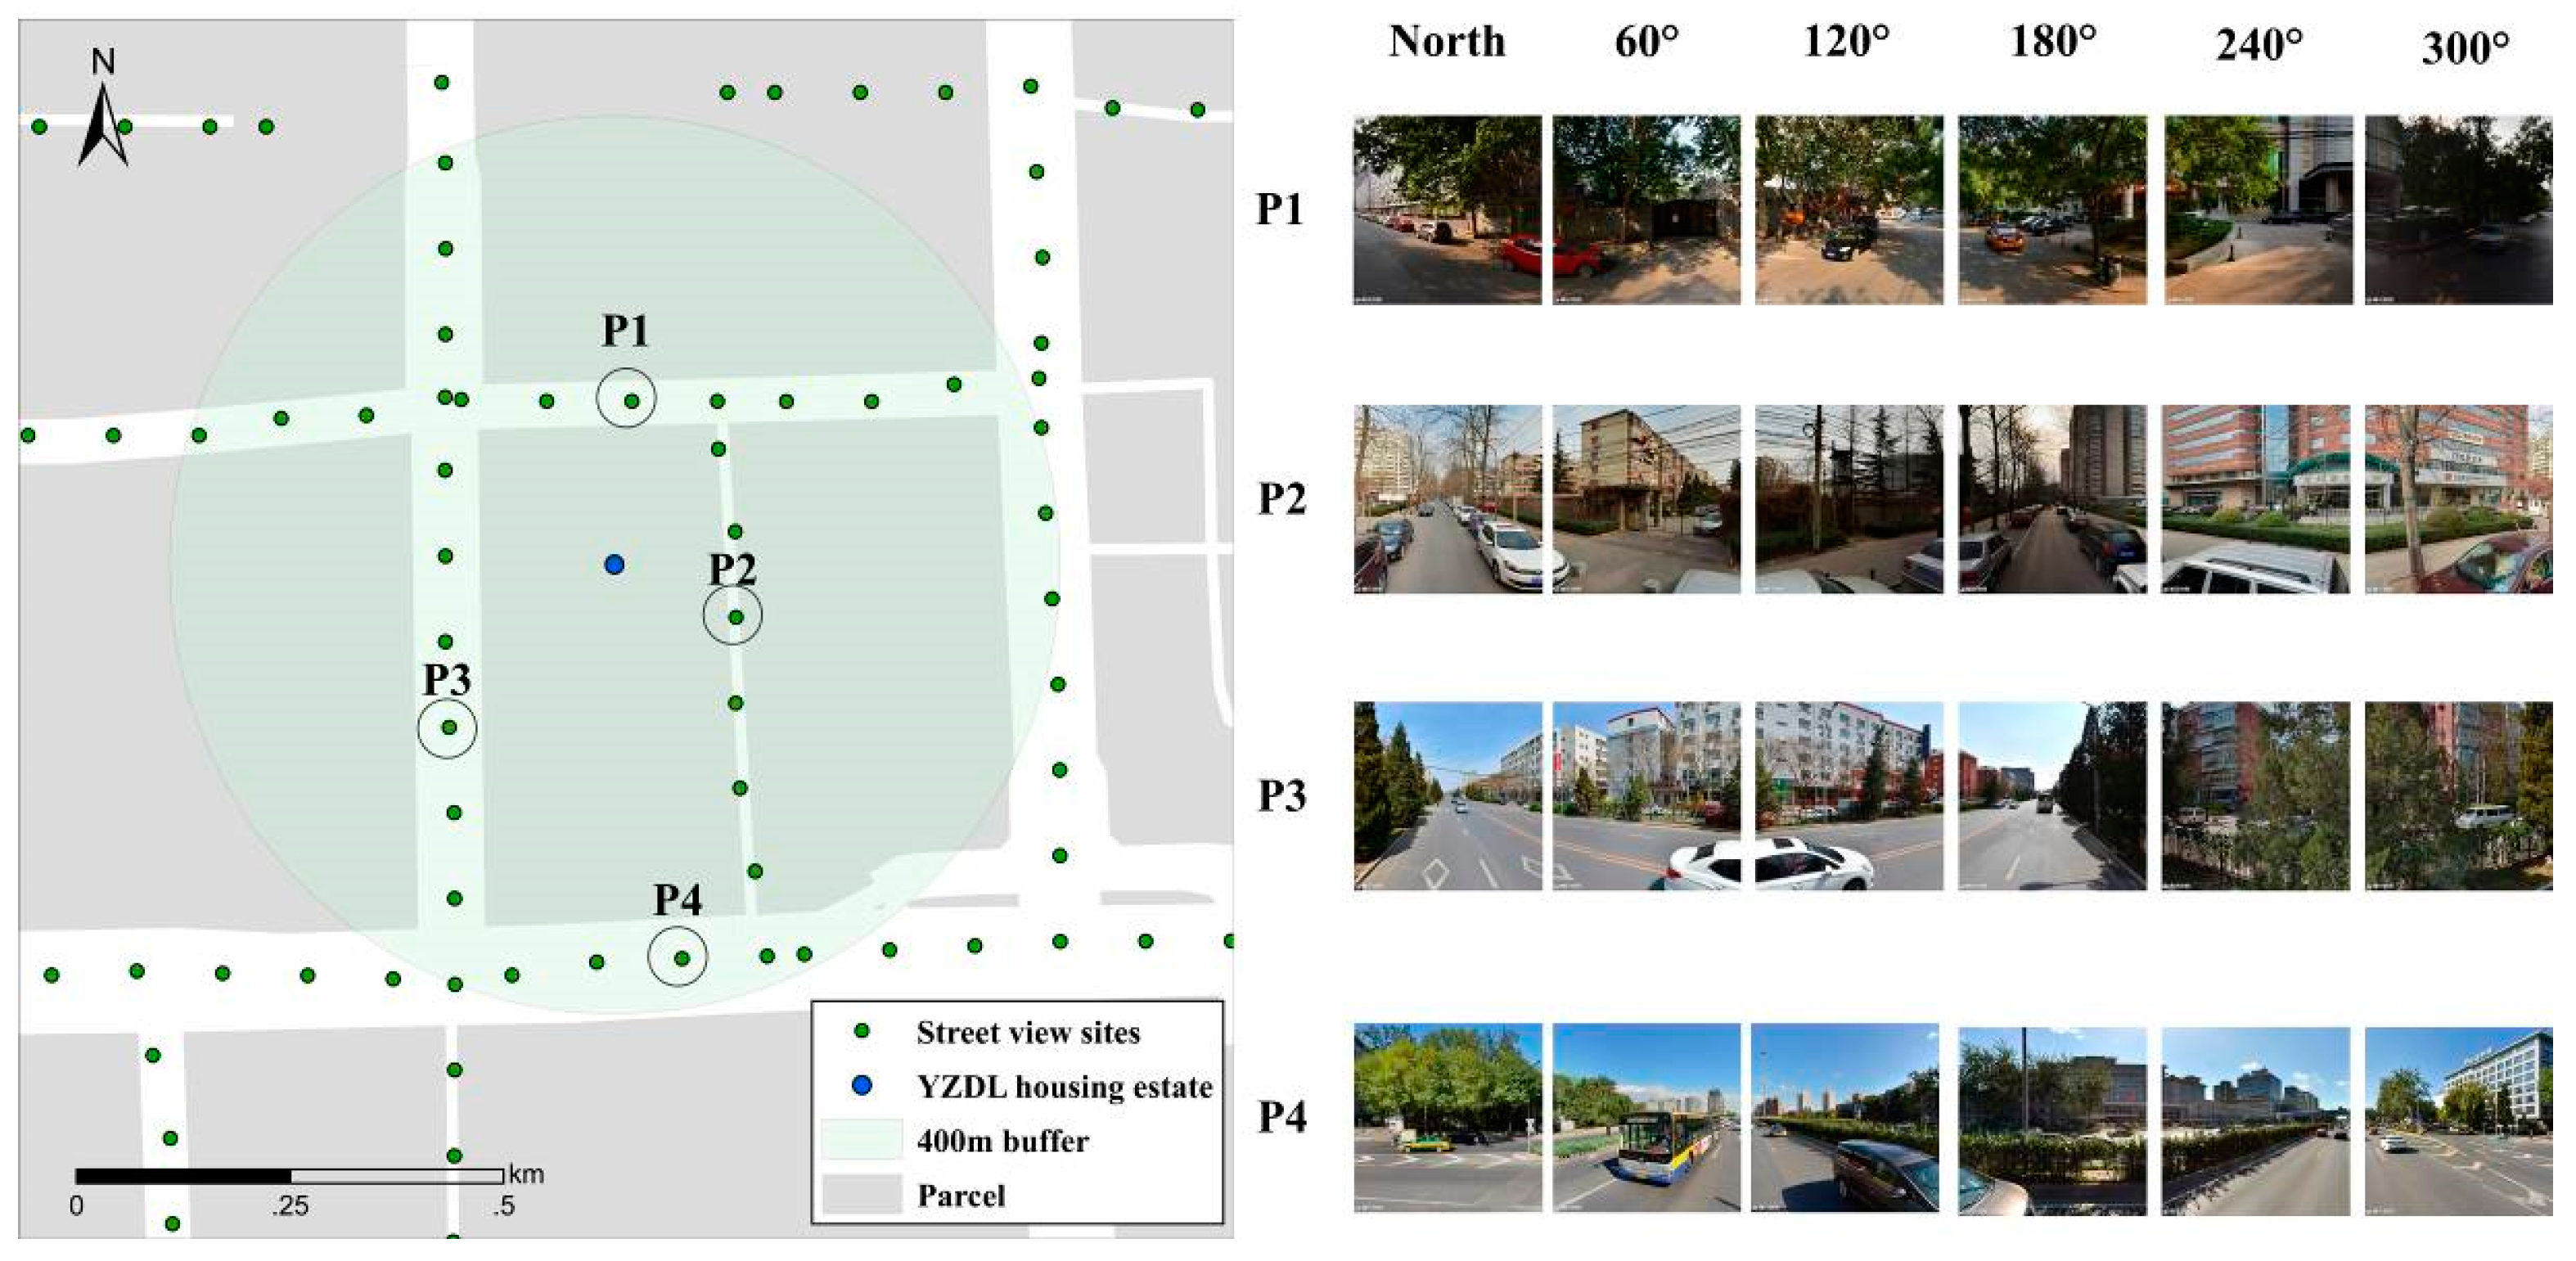
3.2. Equation of the Horizontal Green View Index
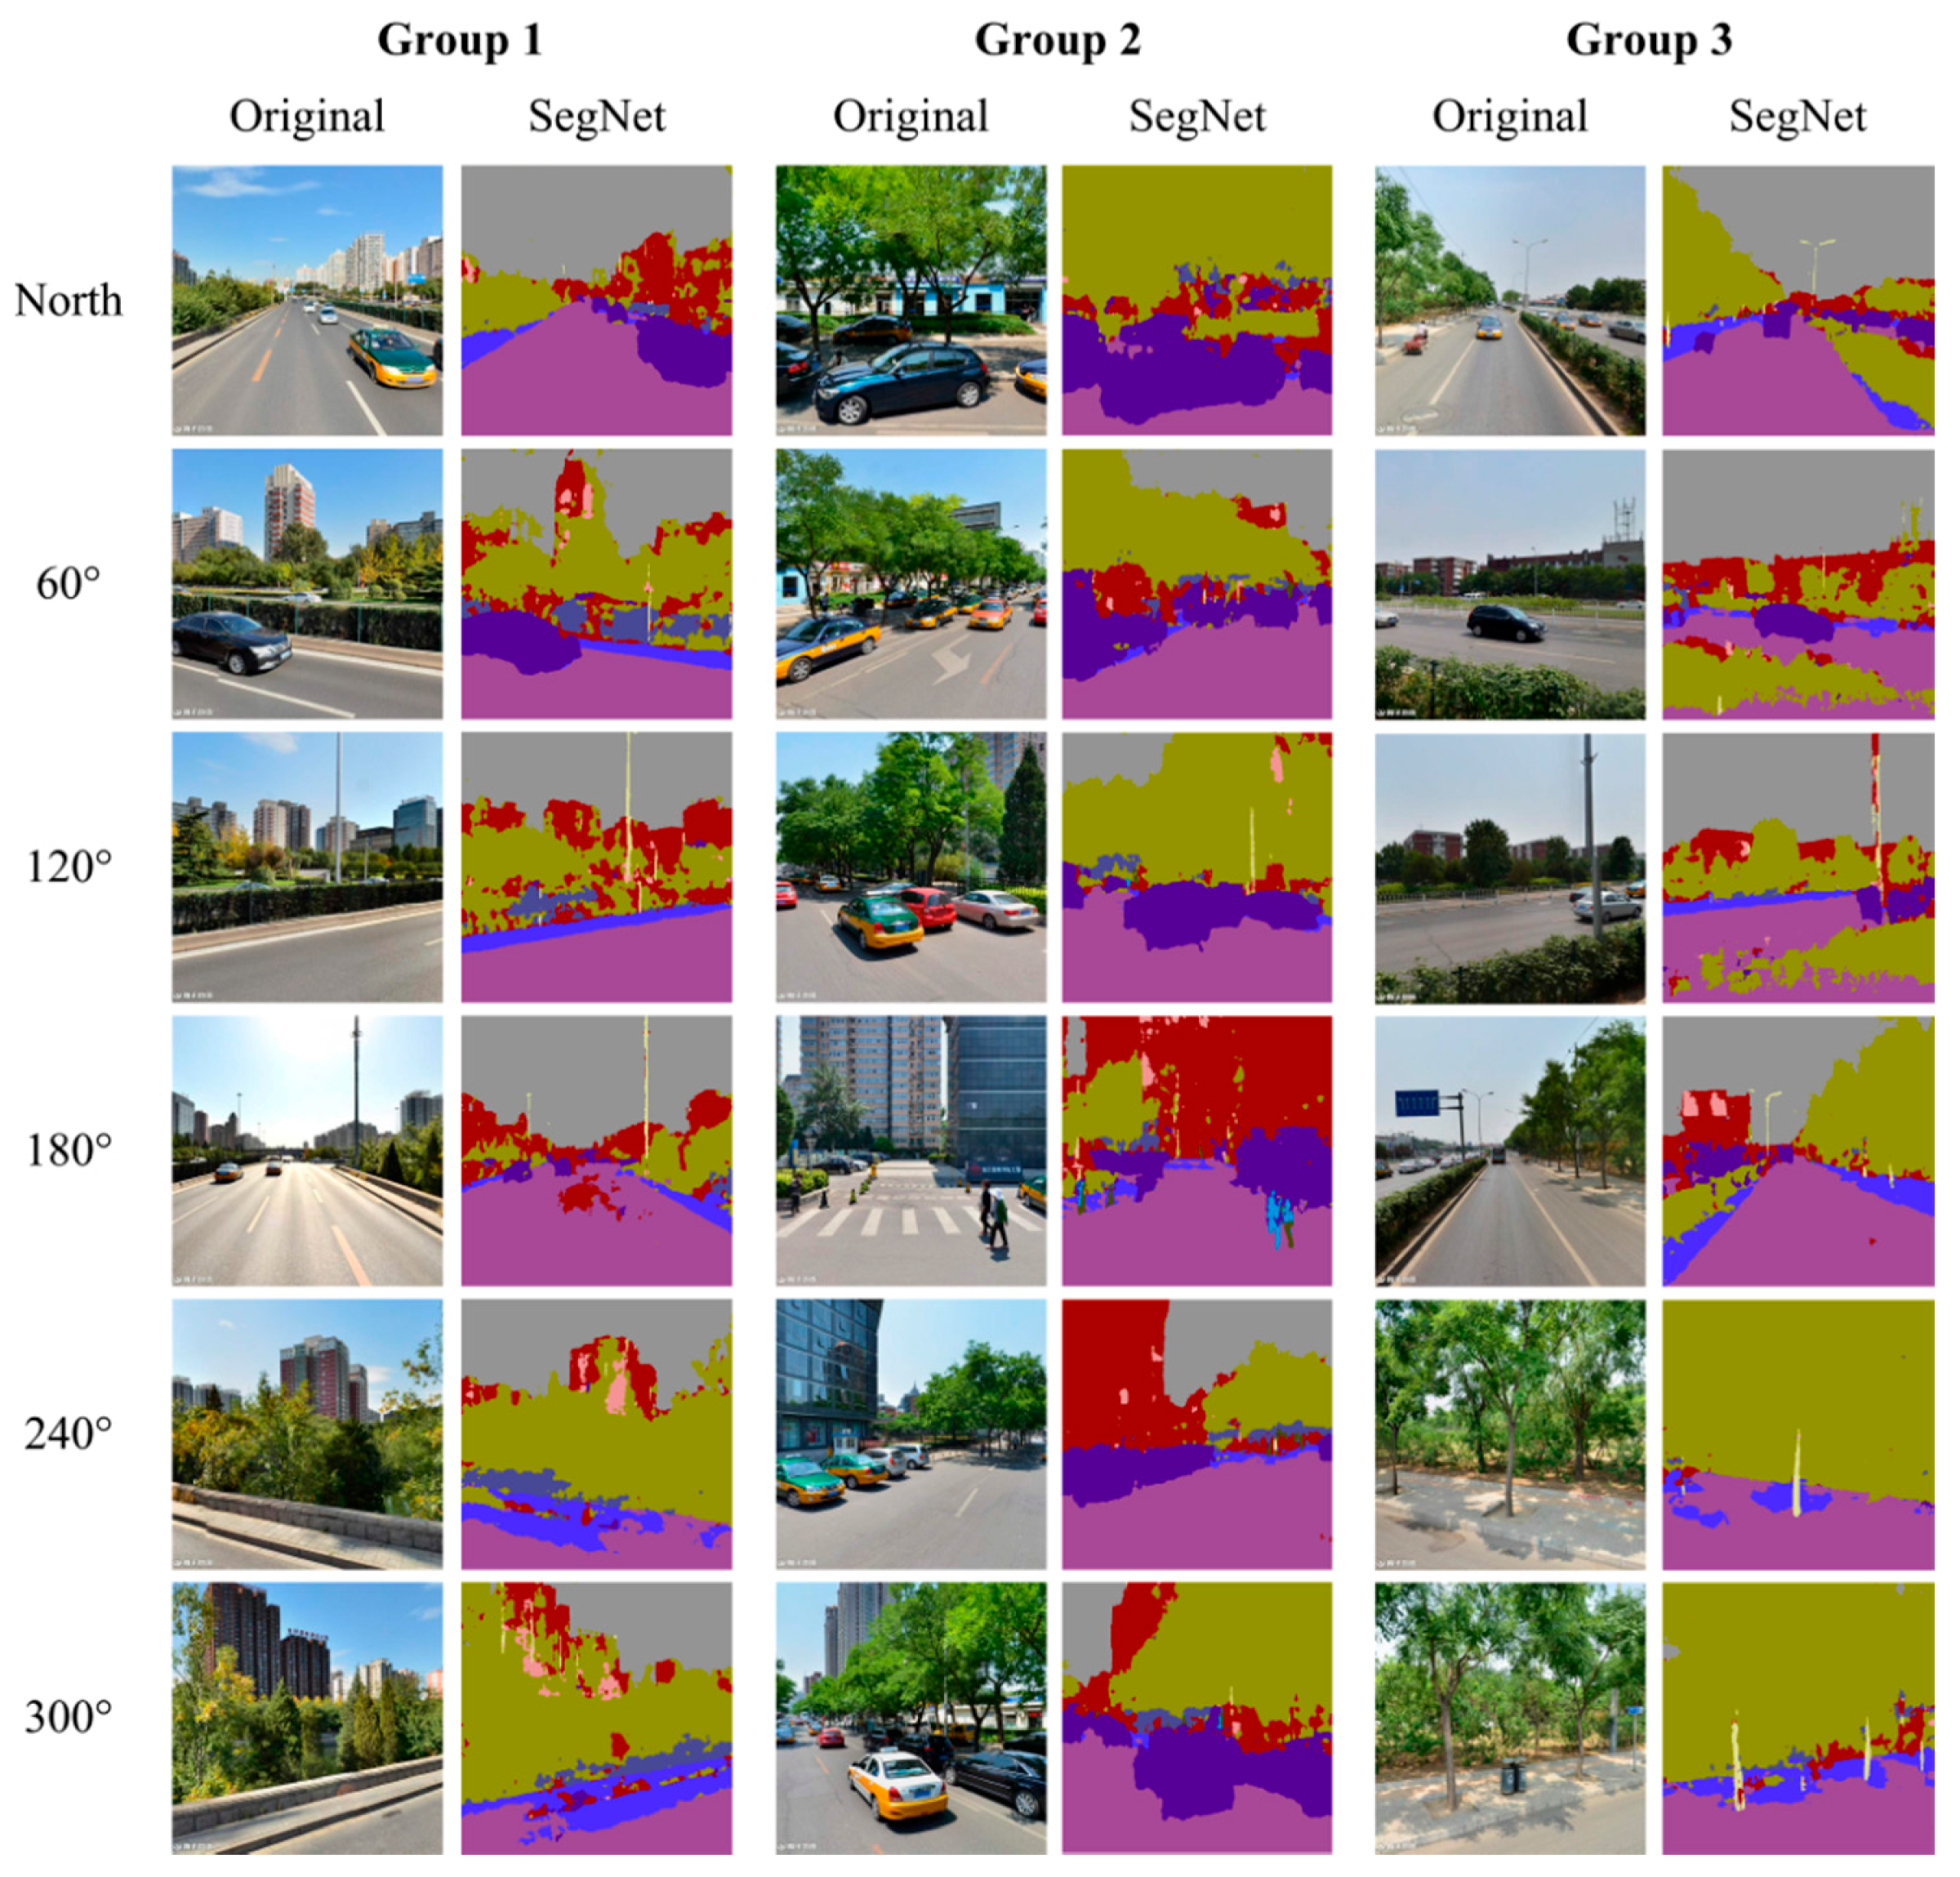
3.3. Calculating HGVI Based on SegNet
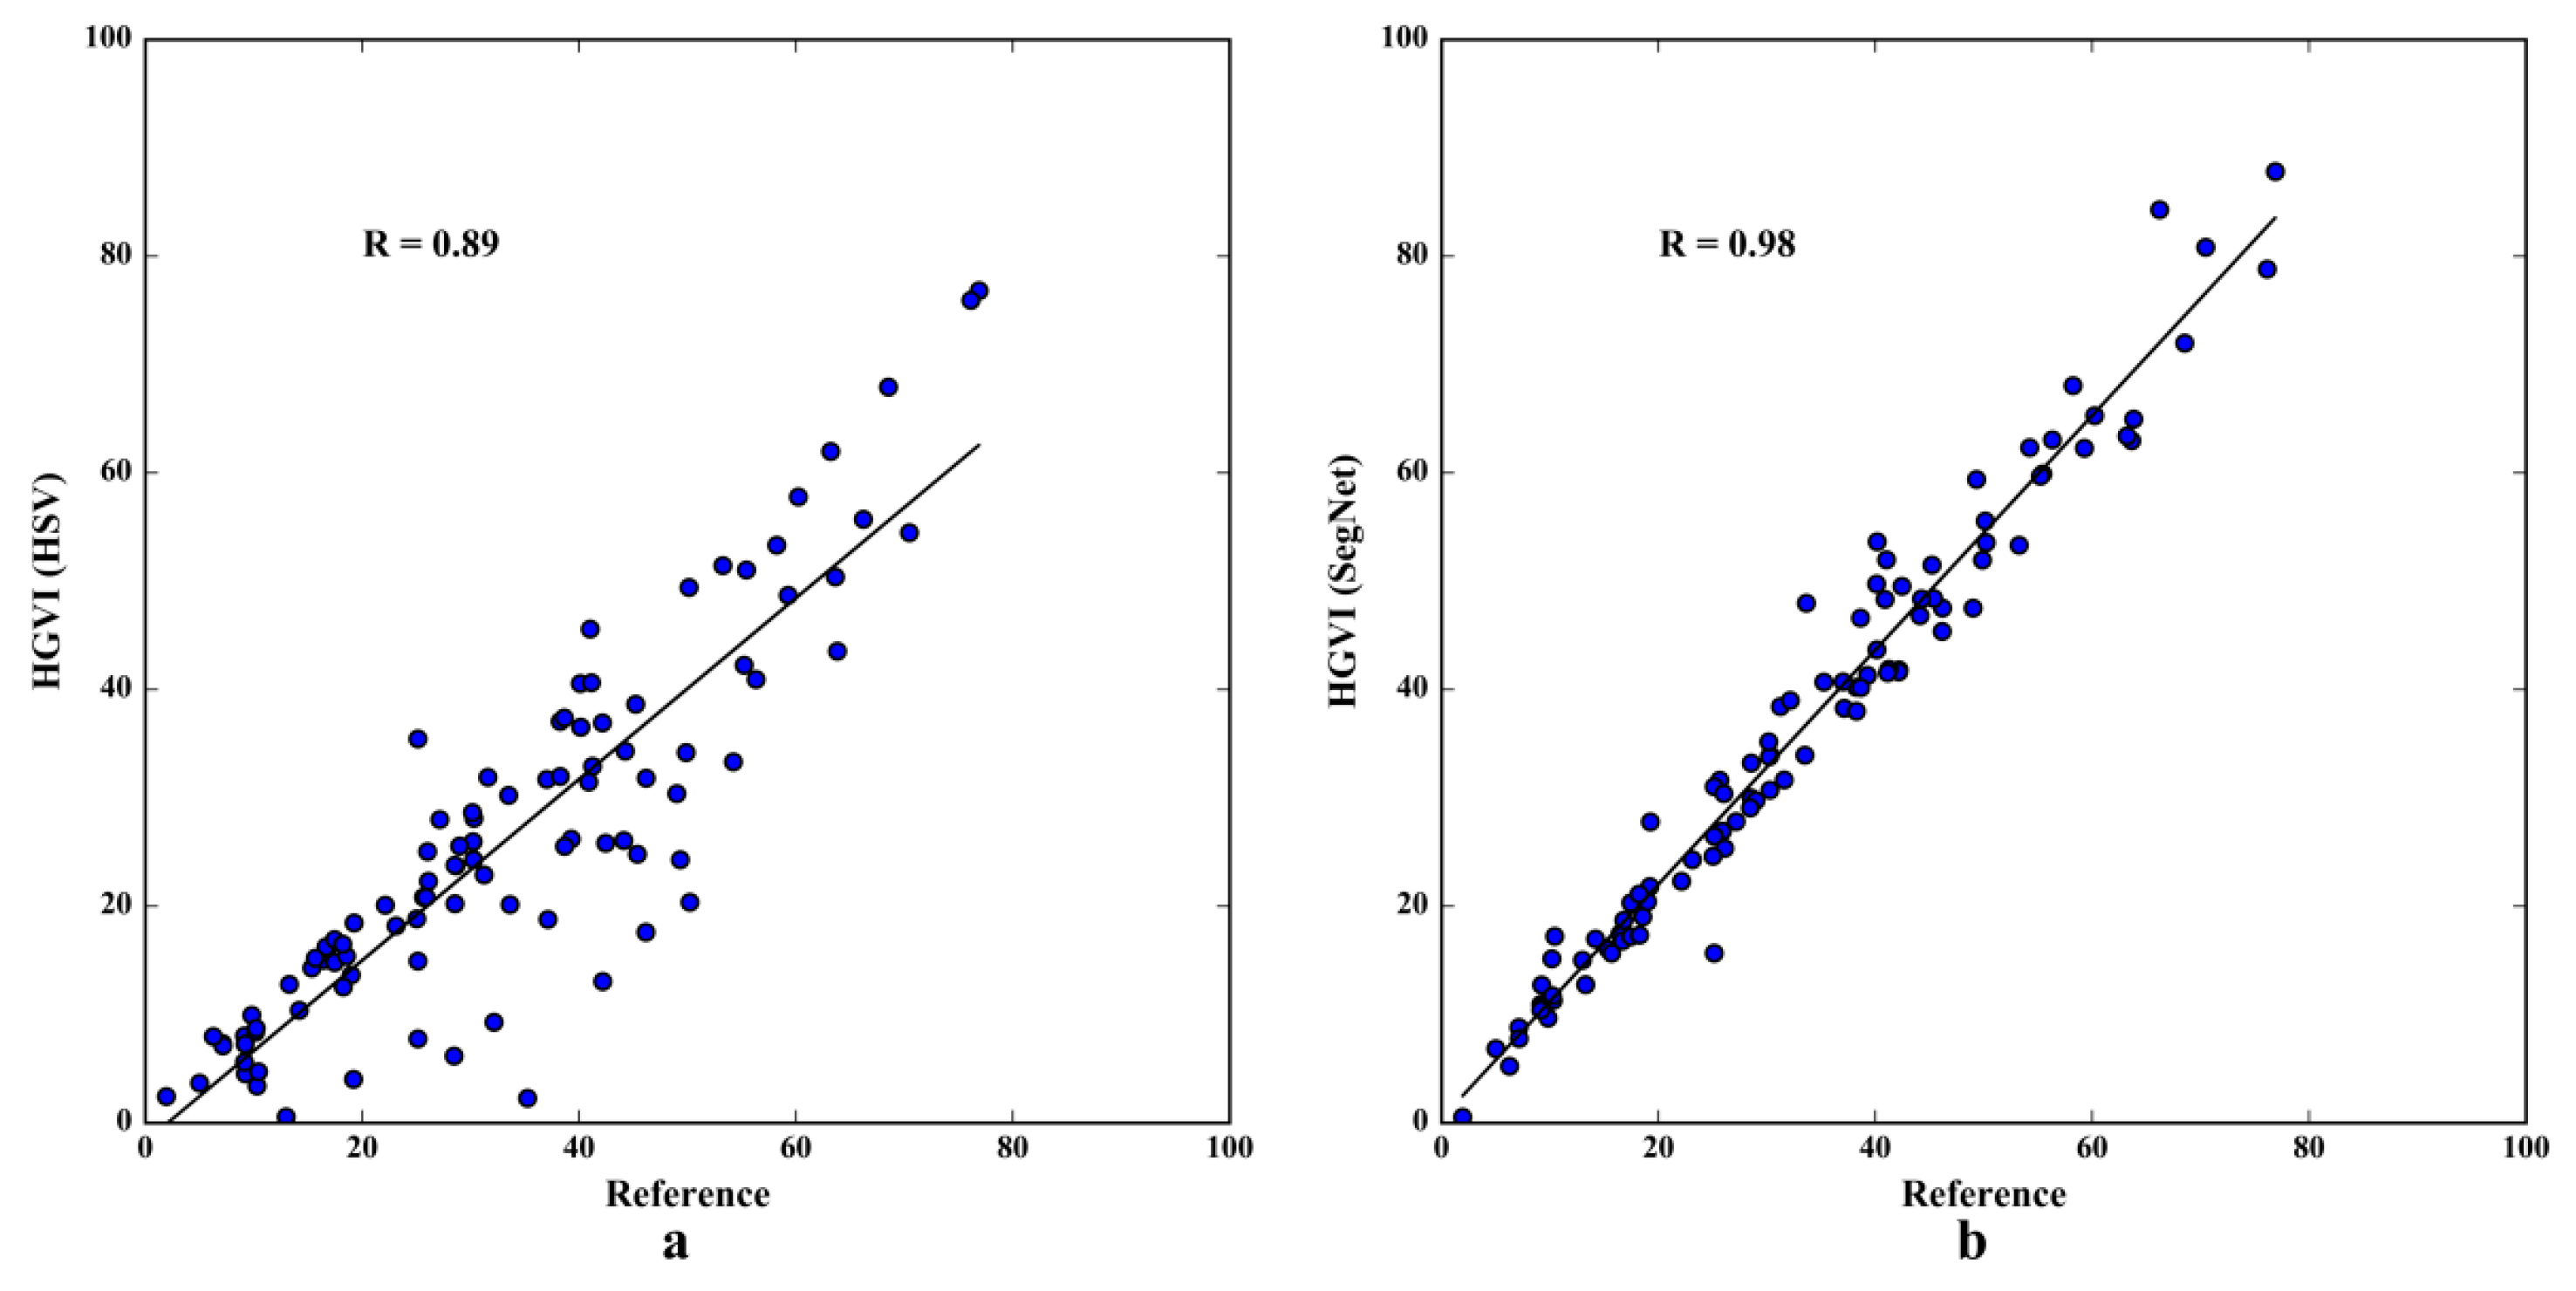
3.4. Verifying HGVI
4. Results
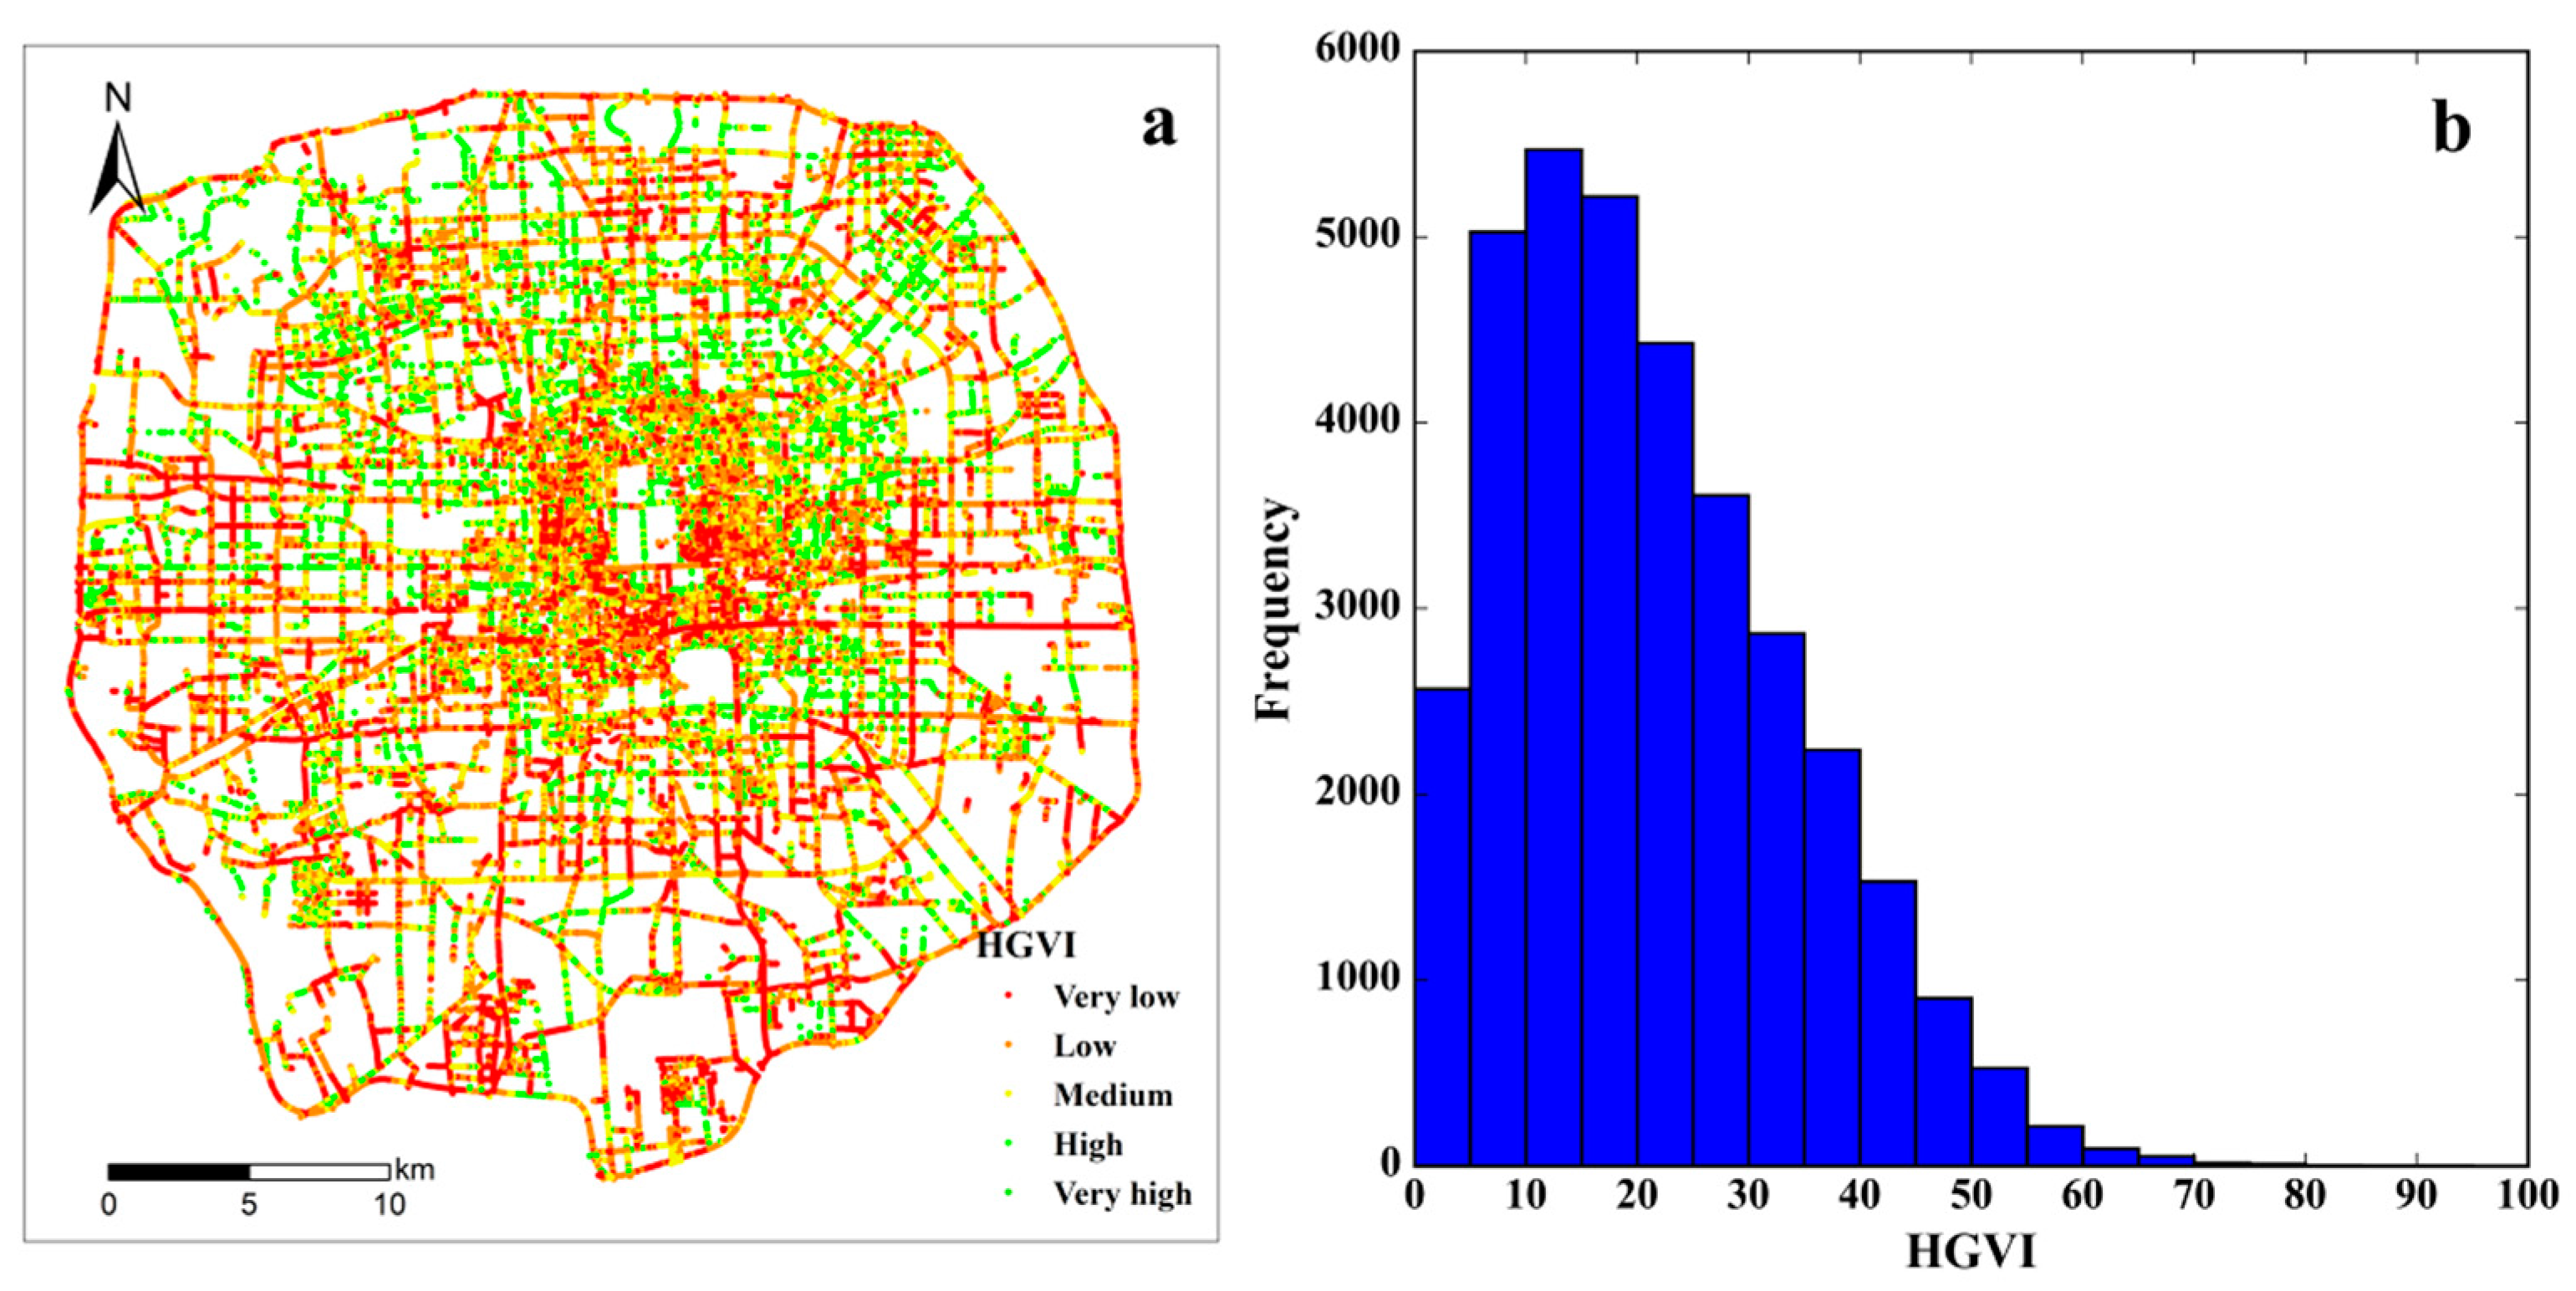
4.1. Distribution of HGVI in the Study Area
4.2. OLS Regression Results
4.3. The Regression Results for Location Characteristics
4.4. The Regression Results for Housing Characteristics
4.5. The Regression Results for Neighbourhood Characteristics
5. Discussion
5.1. Impact of Location Characteristics on Housing Prices
5.2. Impact of Housing Characteristics on Housing Prices
5.3. Impact of Green Landscapes on Housing Prices
5.4. Impact of Other Landscapes on Housing Prices
5.5. Impact of Traffic and Educational Facilities on Housing Prices
5.6. The Advantages of Using Street View Images and Computer Vision
5.7. Policy Guidance and Recommendations
5.8. Limitations and Future Research
6. Conclusions
Acknowledgments
Author Contributions
Conflicts of Interest
References
- Wu, J. Urban ecology and sustainability: The state-of-the-science and future directions. Landsc. Urban Plan. 2014, 125, 209–221. [Google Scholar] [CrossRef]
- Qian, Y.; Zhou, W.; Yu, W.; Pickett, S.T.A. Quantifying spatiotemporal pattern of urban greenspace: New insights from high resolution data. Landsc. Ecology 2015, 30, 1165–1173. [Google Scholar] [CrossRef]
- Asgarzadeh, M.; Koga, T.; Hirate, K.; Farvid, M.; Lusk, A. Investigating oppressiveness and spaciousness in relation to building, trees, sky and ground surface: A study in Tokyo. Landsc. Urban Plan. 2014, 131, 36–41. [Google Scholar] [CrossRef]
- Asgarzadeh, M.; Lusk, A.; Koga, T.; Hirate, K. Measuring oppressiveness of streetscapes. Landsc. Urban Plan. 2012, 107, 1–11. [Google Scholar] [CrossRef]
- Ulrich, R. View through a window may influence recovery from surgery. Science 1984, 224, 420–421. [Google Scholar] [CrossRef] [PubMed]
- Takano, T.; Nakamura, K.; Watanabe, M. Urban residential environments and senior citizens’ longevity in megacity areas: The importance of walkable green spaces. J. Epidemiol. Community Health 2002, 56, 913–918. [Google Scholar] [CrossRef] [PubMed]
- Ben-Joseph, E.; Lee, J.S.; Cromley, E.K.; Laden, F.; Troped, P.J. Virtual and actual: Relative accuracy of on-site and web-based instruments in auditing the environment for physical activity. Health Place 2013, 19, 138–150. [Google Scholar] [CrossRef] [PubMed]
- Hillsdon, M.; Panter, J.; Foster, C.; Jones, A. The relationship between access and quality of urban green space with population physical activity. Public Health 2006, 120, 1127–1132. [Google Scholar] [CrossRef] [PubMed]
- Richardson, E.A.; Pearce, J.; Mitchell, R.; Kingham, S. Role of physical activity in the relationship between urban green space and health. Public Health 2013, 127, 318. [Google Scholar] [CrossRef] [PubMed]
- Rosen, S. Hedonic Prices and Implicit Markets: Product Differentiation in Pure Competition. J. Political Econ. 1974, 82, 34–55. [Google Scholar] [CrossRef]
- Palmquist, R.B. Estimating the Demand for the Characteristics of Housing. Rev. Econ. Stat. 1984, 66, 394–404. [Google Scholar] [CrossRef]
- Chen, W.Y.; Jim, C.Y. Amenities and disamenities: A hedonic analysis of the heterogeneous urban landscape in Shenzhen (China). Geogr. J. 2010, 176, 227–240. [Google Scholar] [CrossRef]
- Hanushek, E.; Yilmaz, K. The complementarity of Tiebout and Alonso. J. Hous. Econ. 2007, 16, 243–261. [Google Scholar] [CrossRef]
- Hanushek, E.A.; Yilmaz, K. Household Location and Schools in Metropolitan Areas with Heterogeneous Suburbs; Tiebout, Alonso, and Government Policy. NBER Working Paper No. 15915. Soc. Sci. Electron. Publ. 2010, 40, 102–106. [Google Scholar]
- Hanushek, E.A.; Yilmaz, K. Schools and Location: Tiebout, Alonso, and Governmental Finance Policy. J. Public Econ. Theory 2013, 15, 829–855. [Google Scholar] [CrossRef]
- Powe, N.A.; Garrod, G.D.; Willis, K.G. Valuation of urban amenities using an hedonic price model. J. Prop. Res. 1995, 12, 137–147. [Google Scholar]
- Huang, H.; Yin, L. Creating sustainable urban built environments: An application of hedonic house price models in Wuhan, China. J. Hous. Built Environ. 2014, 30, 1–17. [Google Scholar] [CrossRef]
- Bolitzer, B.; Netusil, N.R. The impact of open spaces on property values in Portland, Oregon. J. Environ. Manag. 2000, 59, 185–193. [Google Scholar] [CrossRef]
- Lutzenhiser, M.; Netusil, N.R. The Effect of Open Spaces on a Home’s Sale Price. Contemp. Econ. Policy 2001, 19, 291–298. [Google Scholar] [CrossRef]
- More, T.A.; Stevens, T.; Allen, P.G. Valuation of urban parks. Landsc. Urban Plan. 1988, 15, 139–152. [Google Scholar] [CrossRef]
- Tyrväinen, L.; Miettinen, A. Property prices and urban forest amenities. J. Environ. Econ. Manag. 2000, 39, 205–223. [Google Scholar] [CrossRef]
- Jim, C.Y.; Chen, W.Y. Impacts of urban environmental elements on residential housing prices in Guangzhou (China). Landsc. Urban Plan. 2006, 78, 422–434. [Google Scholar] [CrossRef]
- Morancho, A.B. A hedonic valuation of urban green areas. Landsc. Urban Plan. 2003, 66, 35–41. [Google Scholar] [CrossRef]
- Jim, C.Y.; Chen, W.Y. Value of scenic views: Hedonic assessment of private housing in Hong Kong. Landsc. Urban Plan. 2009, 91, 226–234. [Google Scholar] [CrossRef]
- Zheng, S.; Cao, J.; Kahn, M.E. China’s Rising Demand for “Green Cities”: Evidence from Cross-City Real Estate Price Hedonics. Nber Work. Pap. 2011. [Google Scholar] [CrossRef]
- Xiao, Y.; Chen, X.; Li, Q.; Yu, X.; Chen, J.; Guo, J. Exploring Determinants of Housing Prices in Beijing: An Enhanced Hedonic Regression with Open Access POI Data. Int. J. Geo-Inf. 2017, 6, 358. [Google Scholar] [CrossRef]
- Donovan, G.H.; Butry, D.T. Trees in the city: Valuing street trees in Portland, Oregon. Landsc. Urban Plan. 2010, 94, 77–83. [Google Scholar] [CrossRef]
- Donovan, G.H.; Butry, D.T. The effect of urban trees on the rental price of single-family homes in Portland, Oregon. Urban For. Urban Green. 2011, 10, 163–168. [Google Scholar] [CrossRef]
- Mcpherson, E.G.; Simpson, J.R.; Xiao, Q.; Wu, C. Million trees Los Angeles canopy cover and benefit assessment. Landsc. Urban Plan. 2011, 99, 40–50. [Google Scholar] [CrossRef]
- Plant, L.; Rambaldi, A.; Sipe, N. Evaluating Revealed Preferences for Street Tree Cover Targets: A Business Case for Collaborative Investment in Leafier Streetscapes in Brisbane, Australia. Ecol. Econ. 2017, 134, 238–249. [Google Scholar] [CrossRef]
- Sander, H.; Polasky, S.; Haight, R.G. The value of urban tree cover: A hedonic property price model in Ramsey and Dakota Counties, Minnesota, USA. Ecol. Econ. 2010, 69, 1646–1656. [Google Scholar] [CrossRef]
- Landry, S.M.; Chakraborty, J. Street trees and equity: Evaluating the spatial distribution of an urban amenity. Environ. Plan. A 2009, 41, 2651–2670. [Google Scholar] [CrossRef]
- Yang, J.; Zhao, L.; McBride, J.; Gong, P. Can you see green? Assessing the visibility of urban forests in cities. Landsc. Urban Plan. 2009, 91, 97–104. [Google Scholar] [CrossRef]
- Li, X.; Zhang, C.; Li, W.; Ricard, R.; Meng, Q.; Zhang, W. Assessing street-level urban greenery using Google Street View and a modified green view index. Urban For. Urban Green. 2015, 14, 675–685. [Google Scholar] [CrossRef]
- Li, X.; Zhang, C.; Li, W. Does the Visibility of Greenery Increase Perceived Safety in Urban Areas? Evidence from the Place Pulse 1.0 Dataset. ISPRS Int. J. Geo-Inf. 2015, 4, 1166–1183. [Google Scholar] [CrossRef]
- Li, X.; Zhang, C.; Li, W.; Kuzovkina, Y.A. Environmental inequities in terms of different types of urban greenery in Hartford, Connecticut. Urban For. Urban Green. 2016, 18, 163–172. [Google Scholar] [CrossRef]
- Li, X.; Zhang, C.; Li, W.; Kuzovkina, Y.A.; Weiner, D. Who lives in greener neighborhoods? The distribution of street greenery and its association with residents’ socioeconomic conditions in Hartford, Connecticut, USA. Urban For. Urban Green. 2015, 14, 751–759. [Google Scholar] [CrossRef]
- Long, Y.; Liu, L. How green are the streets? An analysis for central areas of Chinese cities using Tencent Street View. PLoS ONE 2017, 12, e0171110. [Google Scholar] [CrossRef] [PubMed]
- Seiferling, I.; Naik, N.; Ratti, C.; Proulx, R. Green streets—Quantifying and mapping urban trees with street-level imagery and computer vision. Landsc. Urban Plan. 2017, 165, 93–101. [Google Scholar] [CrossRef]
- Naik, N.; Kominers, S.D.; Raskar, R.; Glaeser, E.L.; Hidalgo, C.A. Computer vision uncovers predictors of physical urban change. Proc. Nat. Acad. Sci. USA 2017, 114, 7571. [Google Scholar] [CrossRef] [PubMed]
- Shen, Q.; Zeng, W.; Ye, Y.; Arisona, S.M.; Schubiger, S.; Burkhard, R.; Qu, H. StreetVizor: Visual Exploration of Human-Scale Urban Forms Based on Street Views. IEEE Trans. Vis. Comput. Graph. 2018, 24, 1004–1013. [Google Scholar] [CrossRef] [PubMed]
- Cai, G.; Du, M.; Xue, Y. Monitoring of urban heat island effect in Beijing combining ASTER and TM data. Int. J. Remote Sens. 2011, 32, 1213–1232. [Google Scholar] [CrossRef]
- Tang, R.; Ma, K.; Zhang, Y.; Mao, Q. The spatial characteristics and pollution levels of metals in urban street dust of Beijing, China. Appl. Geochem. 2013, 35, 88–98. [Google Scholar] [CrossRef]
- Xia, X.; Yang, L.; Bu, Q.; Liu, R. Levels, distribution, and health risk of phthalate esters in urban soils of Beijing, China. J. Environ. Qual. 2011, 40, 1643. [Google Scholar] [CrossRef] [PubMed]
- Badrinarayanan, V.; Kendall, A.; Cipolla, R. SegNet: A Deep Convolutional Encoder-Decoder Architecture for Scene Segmentation. IEEE Trans. Pattern Anal. Mach. Intell. 2017, 2481–2495. [Google Scholar] [CrossRef] [PubMed]
- Liang, J.; Gong, J.; Sun, J.; Zhou, J.; Li, W.; Li, Y.; Liu, J.; Shen, S. Automatic Sky View Factor Estimation from Street View Photographs—A Big Data Approach. Remote Sens. 2017, 9, 411. [Google Scholar] [CrossRef]
- Kong, F.; Nakagoshi, N. Spatial-temporal gradient analysis of urban green spaces in Jinan, China. Landsc. Urban Plan. 2006, 78, 147–164. [Google Scholar] [CrossRef]
- Geoghegan, J. The value of open spaces in residential land use. Land Use Policy 2002, 19, 91–98. [Google Scholar] [CrossRef]
- Jim, C.Y.; Chen, W.Y. Consumption preferences and environmental externalities: A hedonic analysis of the housing market in Guangzhou. Geoforum 2007, 38, 414–431. [Google Scholar] [CrossRef]
- Kang, H.B.; Reichert, A.K. An Evaluation of Alternative Estimation Techniques and Functional Forms in Developing Statistical Appraisal Models. J. Real Estate Res. 1987, 2, 1–29. [Google Scholar]
- Haab, T.C.; Mcconnell, K.E. Valuing Environmental and Natural Resources; Edward Elgar: Northampton, MA, USA, 2003; pp. 529–530. [Google Scholar]
- Laurice, J.; Bhattacharya, R. Prediction performance of a hedonic pricing model for housing. Theappraisalinstitute 2005, 73, 198–209. [Google Scholar]
- Malpezzi, S. Hedonic Pricing Models: A Selective and Applied Review. Wis.-Madison CULER Work. Pap. 2003, 10, 67–89. [Google Scholar]
- Brostow, G.J.; Shotton, J.; Fauqueur, J.; Cipolla, R. Segmentation and Recognition Using Structure from Motion Point Clouds. In Proceedings of the 10th European Conference on Computer Vision, ECCV 2008, Marseille, France, 12–18 October 2008; pp. 44–57. [Google Scholar]
- Krizek, K.J.; Johnson, P.J. Proximity to Trails and Retail: Effects on Urban Cycling and Walking. J. Am. Plan. Assoc. 2006, 72, 33–42. [Google Scholar] [CrossRef]
- Jiao, L.M.; Liu, Y.L. Geographic Field Model based hedonic valuation of urban open spaces in Wuhan, China. Landsc. Urban Plan. 2010, 98, 47–55. [Google Scholar] [CrossRef]
- Stock, J.H.; Watson, M.W. Introduction to econometrics. Am. Stat. 2007, 45, 223–226. [Google Scholar]
- Yang, Z. An application of the hedonic price model with uncertain attribute—The case of the People’s Republic of China. Prop. Manag. 2001, 19, 50–63. [Google Scholar] [CrossRef]
- Shin, K.; Washington, S.; Choi, K. Effects of Transportation Accessibility on Residential Property Values: Application of Spatial Hedonic Price Model in Seoul, South Korea, Metropolitan Area. Trans. Res. Rec. J. Trans. Res. Board 2007, 1994, 66–73. [Google Scholar] [CrossRef]
- Chen, J.; Hao, Q. The impacts of distance to CBD on housing prices in Shanghai: A hedonic analysis. J. Chin. Econ. Bus. Stud. 2008, 6, 291–302. [Google Scholar] [CrossRef]
- Mcleod, P.B. The Demand for Local Amenity: An Hedonic Price Analysis. Environ. Plan. A Econ. Space 1984, 16, 389–400. [Google Scholar] [CrossRef]
- Bae, C.H.C.; Jun, M.J.; Park, H. The impact of Seoul’s subway Line 5 on residential property values. Trans. Policy 2003, 10, 85–94. [Google Scholar] [CrossRef]
- Richardson, H.W.; Gordon, P.; Jun, M.J.; Heikkila, E.; Peiser, R.; Dalejohnson, D. Residential Property Values, the CBD, and Multiple Nodes: Further Analysis. Environ. Plan. A 1990, 22, 829–833. [Google Scholar] [CrossRef]
- Sun, C.; Meng, X.; Peng, S. Effects of Waste-to-Energy Plants on China’s Urbanization: Evidence from a Hedonic Price Analysis in Shenzhen. Sustainability 2017, 9, 475. [Google Scholar] [CrossRef]
- Saphoresabcc, J.D. Estimating the value of urban green areas: A hedonic pricing analysis of the single family housing market in Los Angeles, CA. Landsc. Urban Plan. 2012, 104, 373–387. [Google Scholar] [CrossRef]
- Luttik, J. The value of trees, water and open space as reflected by house prices in the Netherlands. Landsc. Urban Plan. 2000, 48, 161–167. [Google Scholar] [CrossRef]
- Pearson, L.J.; Tisdell, C.; Lisle, A.T. The Impact of Noosa National Park on Surrounding Property Values: An Application of the Hedonic Price Method. Econ. Anal. Policy 2002, 32, 155–171. [Google Scholar] [CrossRef]
- Ren, Y.; Xu, Z.; Zhang, X.; Wang, X.; Sun, X.; Ballantine, D.J.; Wang, S. Nitrogen pollution and source identification of urban ecosystem surface water in Beijing. Front. Environ. Sci. Eng. 2014, 8, 106–116. [Google Scholar] [CrossRef]
- Li, H. Spatial-Temporal Analysis of Heavy Metal Water Pollution and the Impact on Public Health in China. J. Plant. Res. 2015, 116, 455–460. [Google Scholar]
- Zheng, S.; Hu, W.; Wang, R. How Much Is a Good School Worth in Beijing? Identifying Price Premium with Paired Resale and Rental Data. J. Real Estate Financ. Econ. 2016, 53, 184–199. [Google Scholar] [CrossRef]
- Daniel, T.C. Whither scenic beauty? Visual landscape quality assessment in the 21st century. Landsc. Urban Plan. 2001, 54, 267–281. [Google Scholar] [CrossRef]
- Lange, E.; Hehl-Lange, S.; Brewer, M.J. Scenario-visualization for the assessment of perceived green space qualities at the urban-rural fringe. J. Environ. Manag. 2008, 89, 245–256. [Google Scholar] [CrossRef] [PubMed]


| Variable | Description | Mean | Standard Deviation |
|---|---|---|---|
| Dependent variable | |||
| LSPRICE | Log selling price in 10,000 RMB (Chinese currency, US $1 = RMB 6.5) | 5.73 | 0.43 |
| Location characteristics | |||
| BC_DIS | Road distance to the nearest business centre (km) | 3.95 | 3.27 |
| C_DIS | Road distance to the geometric centre (km) | 11.91 | 4.74 |
| Housing characteristics | |||
| AREA | Average usable area in the apartment (m2) | 79.74 | 34.68 |
| YEAR | 2018 minus the construction time of building | 19.93 | 13.40 |
| ORI | Dummy variable, 1 if it has windows facing north | 0.24 | 0.43 |
| HS | Household numbers | 1371 | 1751 |
| PR | Plot ratio | 2.71 | 1.61 |
| PF | Property fee (RMB/m2 per month) | 1.74 | 1.20 |
| GR | Green coverage rate (%) | 31.40 | 7.05 |
| TOWER | Dummy variable, 1 if the building type is tower | 0.16 | 0.37 |
| SLAB | Dummy variable, 1 if the building type is slab | 0.57 | 0.53 |
| Neighbourhood characteristics | |||
| BUS_DIS | Road distance to the nearest bus station (km) | 0.28 | 0.23 |
| BUS_5H | Number of bus stations within 0.5 km (road distance) | 7.48 | 8.07 |
| BUS_1T | Number of bus stations within 1 km (road distance) | 28.29 | 17.43 |
| SUB_DIS | Road distance to the nearest subway station entrance (km) | 1.49 | 1.16 |
| SUB_5H | Number of subway station entrances within 0.5 km (road distance) | 0.35 | 1.47 |
| SUB_1T | Number of subway station entrances within 1 km (road distance) | 1.47 | 2.93 |
| SCH_DIS | Road distance to the nearest school (km) | 0.29 | 0.26 |
| SCH_5H | Number of schools within 0.5 km (road distance) | 2.08 | 3.24 |
| SCH_1T | Number of schools within 1 km (road distance) | 8.83 | 10.03 |
| PARK_DIS | Road distance to the nearest park (km) | 1.33 | 0.83 |
| LAKE_DIS | Road distance to the nearest lake (km) | 5.53 | 3.60 |
| LAKE_AREA | Area of the nearest lake (km2) | 0.26 | 0.19 |
| RIVER_DIS | Road distance to the nearest river (km) | 1.99 | 1.39 |
| HGVI_LN | Mean horizontal green view index within 400 m in logarithm | 3.07 | 0.20 |
| Model 1 | Model 2 | |||||
|---|---|---|---|---|---|---|
| Variables | Unstandardized Coefficients | Standard Error | VIF | Unstandardized Coefficients | Standard Error | VIF |
| Constant | 4.78 *** | 0.09 | 4.78 *** | 0.087 | ||
| BC_DIS | −0.033 *** | 0.0028 | 3.65 | −0.031 *** | 0.0015 | 1.51 |
| C_DIS | −0.017 *** | 0.0013 | 1.96 | −0.016 *** | 0.001 | 1.28 |
| AREA | 0.01 *** | 2.9 × 10⁻⁴ | 1.46 | 0.01 *** | 2.9 × 10⁻⁴ | 1.42 |
| YEAR | −0.0012 ** | 4.6 × 10⁻⁴ | 1.15 | −0.0012 *** | 4.5 × 10⁻⁴ | 1.15 |
| ORI | −0.01 | 0.011 | 1.07 | |||
| HS | 3.02 × 10⁻⁶ | 2.3 × 10⁻⁶ | 1.08 | |||
| PR | −0.0065 * | 0.0034 | 1.14 | −0.0065 * | 0.0034 | 1.13 |
| PF | 0.022 *** | 0.0052 | 1.36 | 0.022 *** | 0.0052 | 1.35 |
| GR | 9.82 × 10⁻⁴ ** | 4.8 × 10⁻⁴ | 1.06 | 0.001 ** | 4.7 × 10⁻⁴ | 1.05 |
| TOWER | −0.065 *** | 0.014 | 1.38 | −0.071 *** | 0.012 | 1.12 |
| SLAB | 0.011 | 0.009 | 1.38 | |||
| BUS_DIS | 0.0083 | 0.023 | 1.38 | |||
| BUS_5H | −0.0017 ** | 7 × 10⁻⁴ | 1.97 | −0.0018 *** | 6.8 × 10⁻⁴ | 1.77 |
| BUS_1T | −0.001 *** | 3.6 × 10⁻⁴ | 1.90 | −0.001 *** | 3.5 × 10⁻⁴ | 1.85 |
| SUB_DIS | −0.0099 * | 0.0057 | 1.93 | −0.011** | 0.0054 | 1.65 |
| SUB_5H | −0.0077 *** | 0.0029 | 1.41 | −0.0076 *** | 0.0029 | 1.40 |
| SUB_1T | 0.01 *** | 0.002 | 1.60 | 0.01 *** | 0.002 | 1.58 |
| SCH_DIS | 0.047 ** | 0.019 | 1.22 | 0.041 ** | 0.019 | 1.14 |
| SCH_5H | 0.0025 | 0.0017 | 1.77 | |||
| SCH_1T | 0.0016 *** | 5.5 × 10⁻⁴ | 1.80 | 0.002 *** | 4.4 × 10⁻⁴ | 1.22 |
| PARK_DIS | 6.74 × 10⁻⁴ | 0.0061 | 1.34 | |||
| LAKE_DIS | 0.003 | 0.0029 | 4.18 | |||
| LAKE_AREA | 0.17 *** | 0.025 | 1.10 | 0.17 *** | 0.025 | 1.09 |
| RIVER_DIS | −0.004 | 0.0035 | 1.17 | |||
| HGVI_LN | 0.14 *** | 0.026 | 1.40 | 0.14 *** | 0.026 | 1.23 |
| F ratio | 148.14 | 201.74 | ||||
| Adjusted R2 | 0.7544 | 0.7536 | ||||
| Durbin-Watson | 1.66 | 1.65 | ||||
© 2018 by the authors. Licensee MDPI, Basel, Switzerland. This article is an open access article distributed under the terms and conditions of the Creative Commons Attribution (CC BY) license (http://creativecommons.org/licenses/by/4.0/).
Share and Cite
Zhang, Y.; Dong, R. Impacts of Street-Visible Greenery on Housing Prices: Evidence from a Hedonic Price Model and a Massive Street View Image Dataset in Beijing. ISPRS Int. J. Geo-Inf. 2018, 7, 104. https://doi.org/10.3390/ijgi7030104
Zhang Y, Dong R. Impacts of Street-Visible Greenery on Housing Prices: Evidence from a Hedonic Price Model and a Massive Street View Image Dataset in Beijing. ISPRS International Journal of Geo-Information. 2018; 7(3):104. https://doi.org/10.3390/ijgi7030104
Chicago/Turabian StyleZhang, Yonglin, and Rencai Dong. 2018. "Impacts of Street-Visible Greenery on Housing Prices: Evidence from a Hedonic Price Model and a Massive Street View Image Dataset in Beijing" ISPRS International Journal of Geo-Information 7, no. 3: 104. https://doi.org/10.3390/ijgi7030104
APA StyleZhang, Y., & Dong, R. (2018). Impacts of Street-Visible Greenery on Housing Prices: Evidence from a Hedonic Price Model and a Massive Street View Image Dataset in Beijing. ISPRS International Journal of Geo-Information, 7(3), 104. https://doi.org/10.3390/ijgi7030104