Assessment of Tangible Direct Flood Damage Using a Spatial Analysis Approach under the Effects of Climate Change: Case Study in an Urban Watershed in Hanoi, Vietnam


 , and
, and
Abstract
1. Introduction
2. Materials and Methods
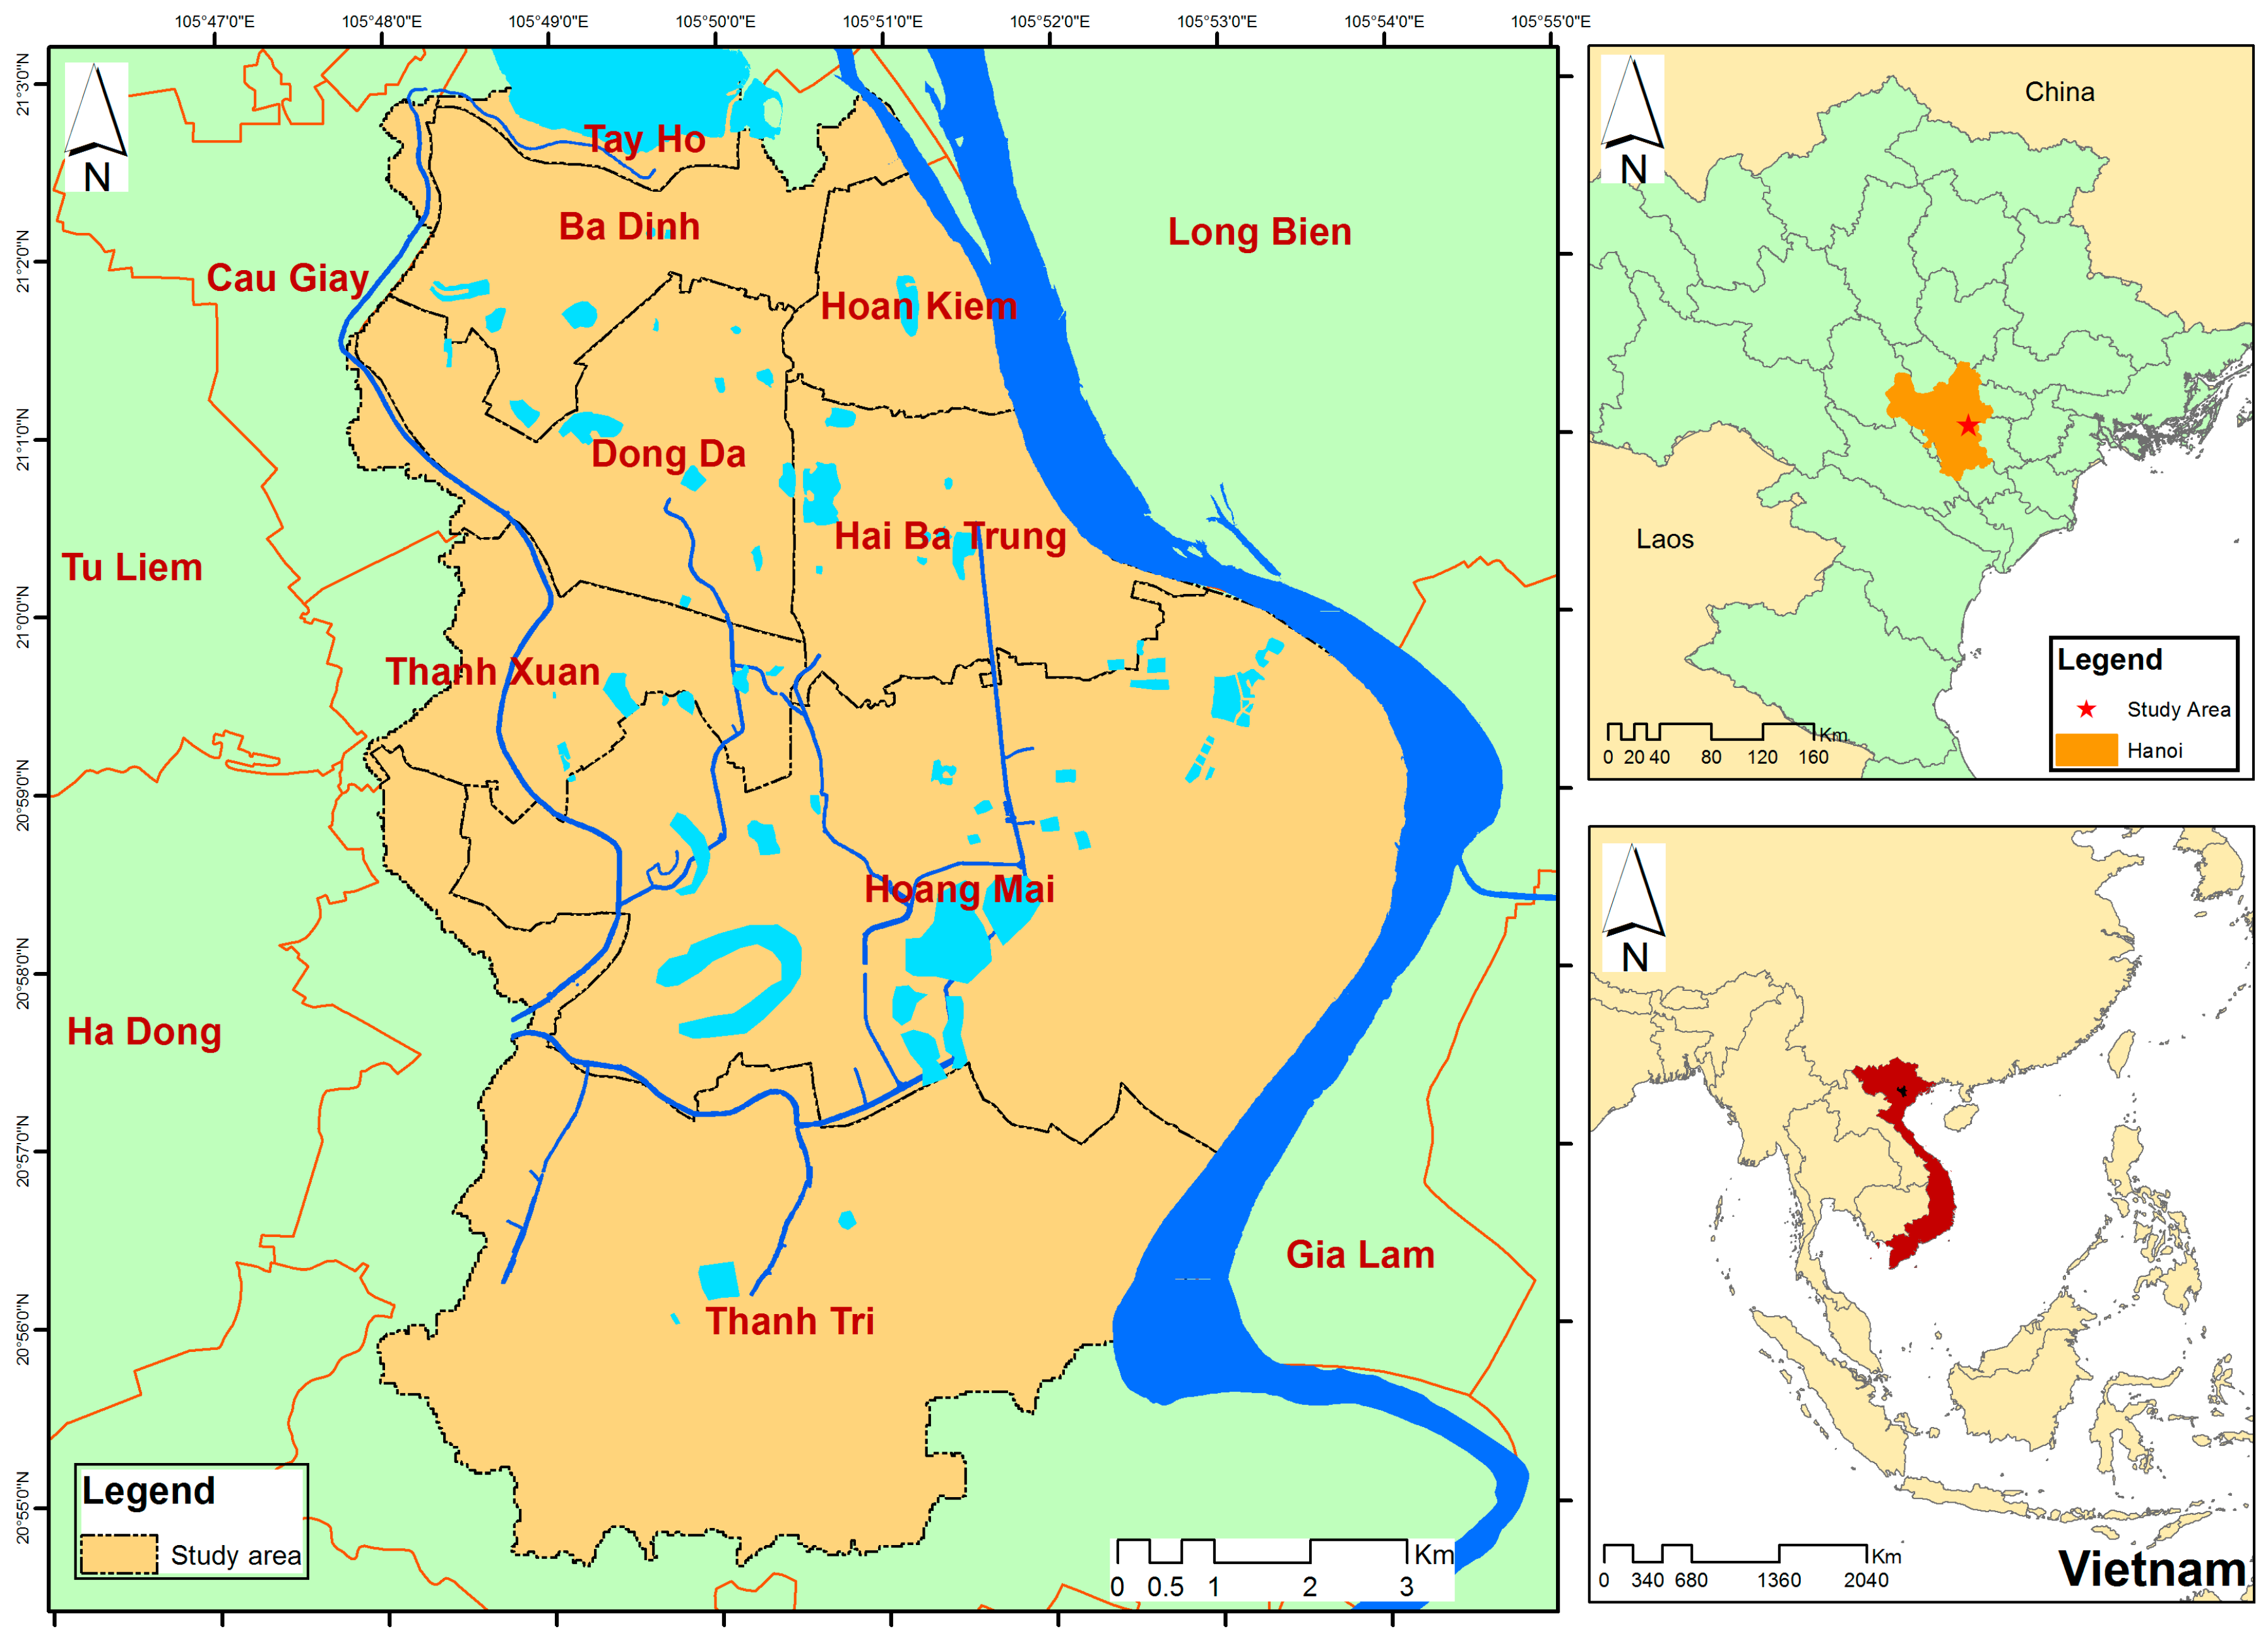
2.1. Study Area
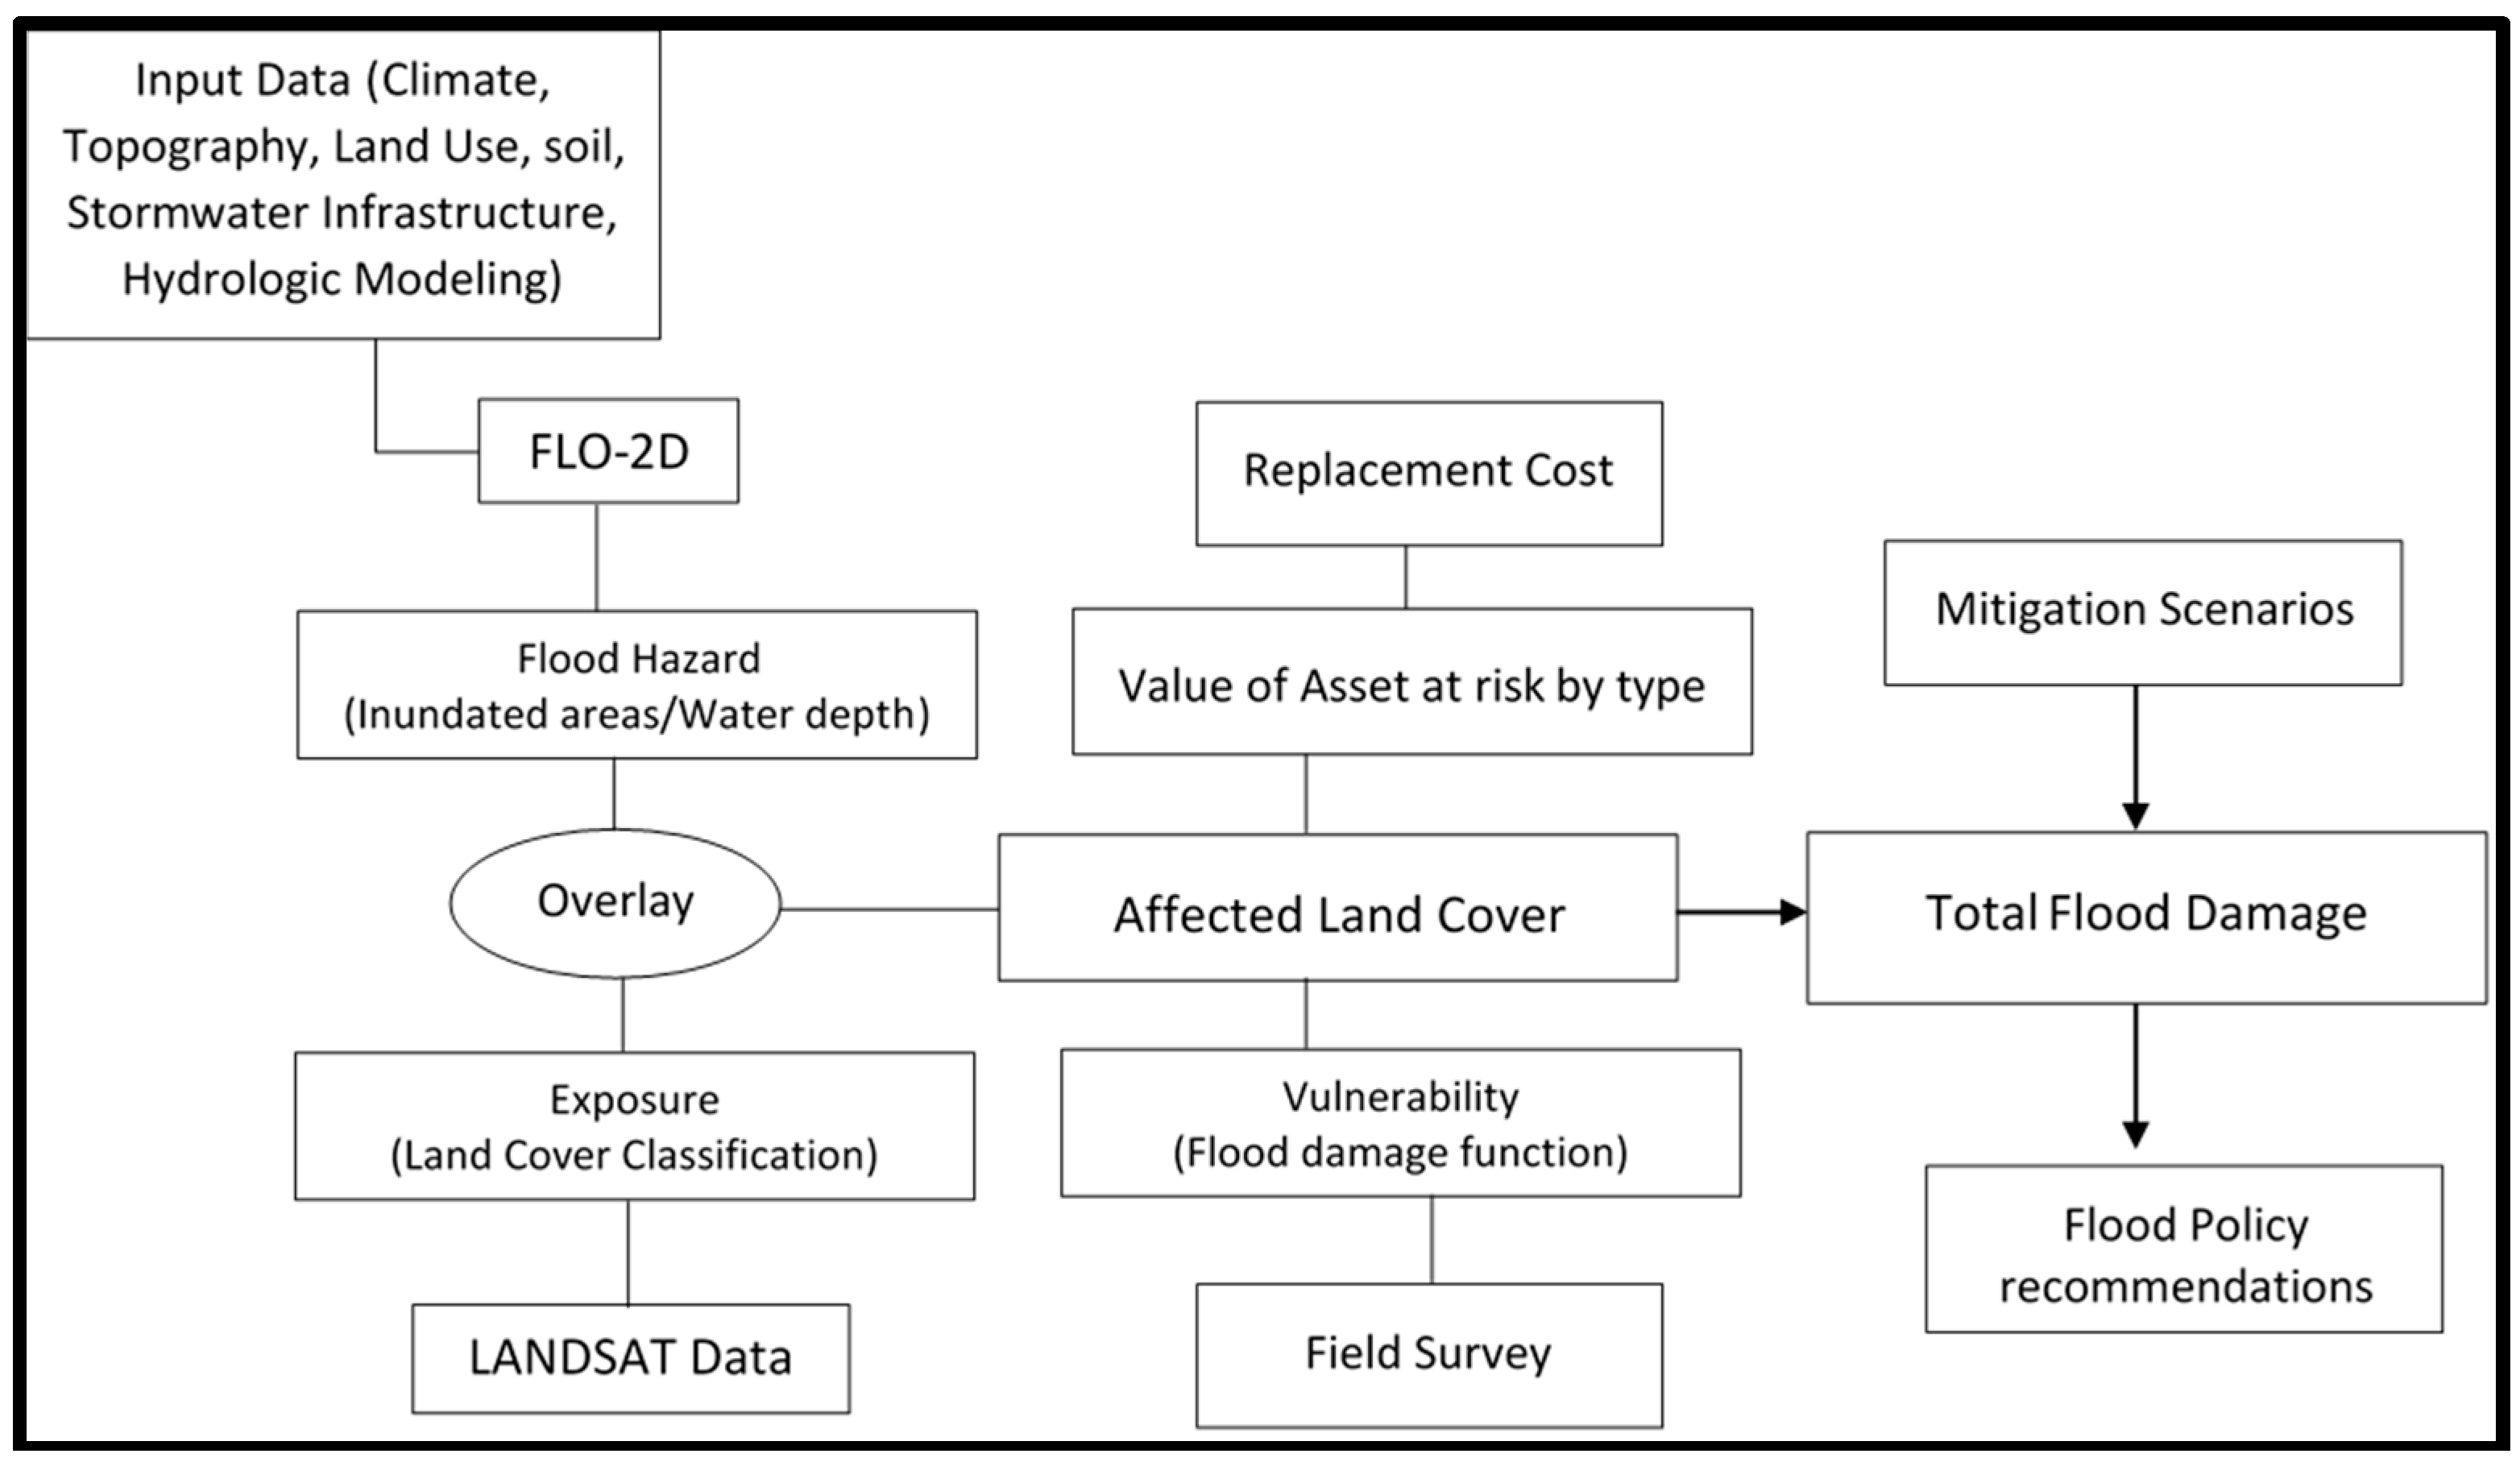
2.2. Flood Risk Assessment
2.2.1. Flood Hazard
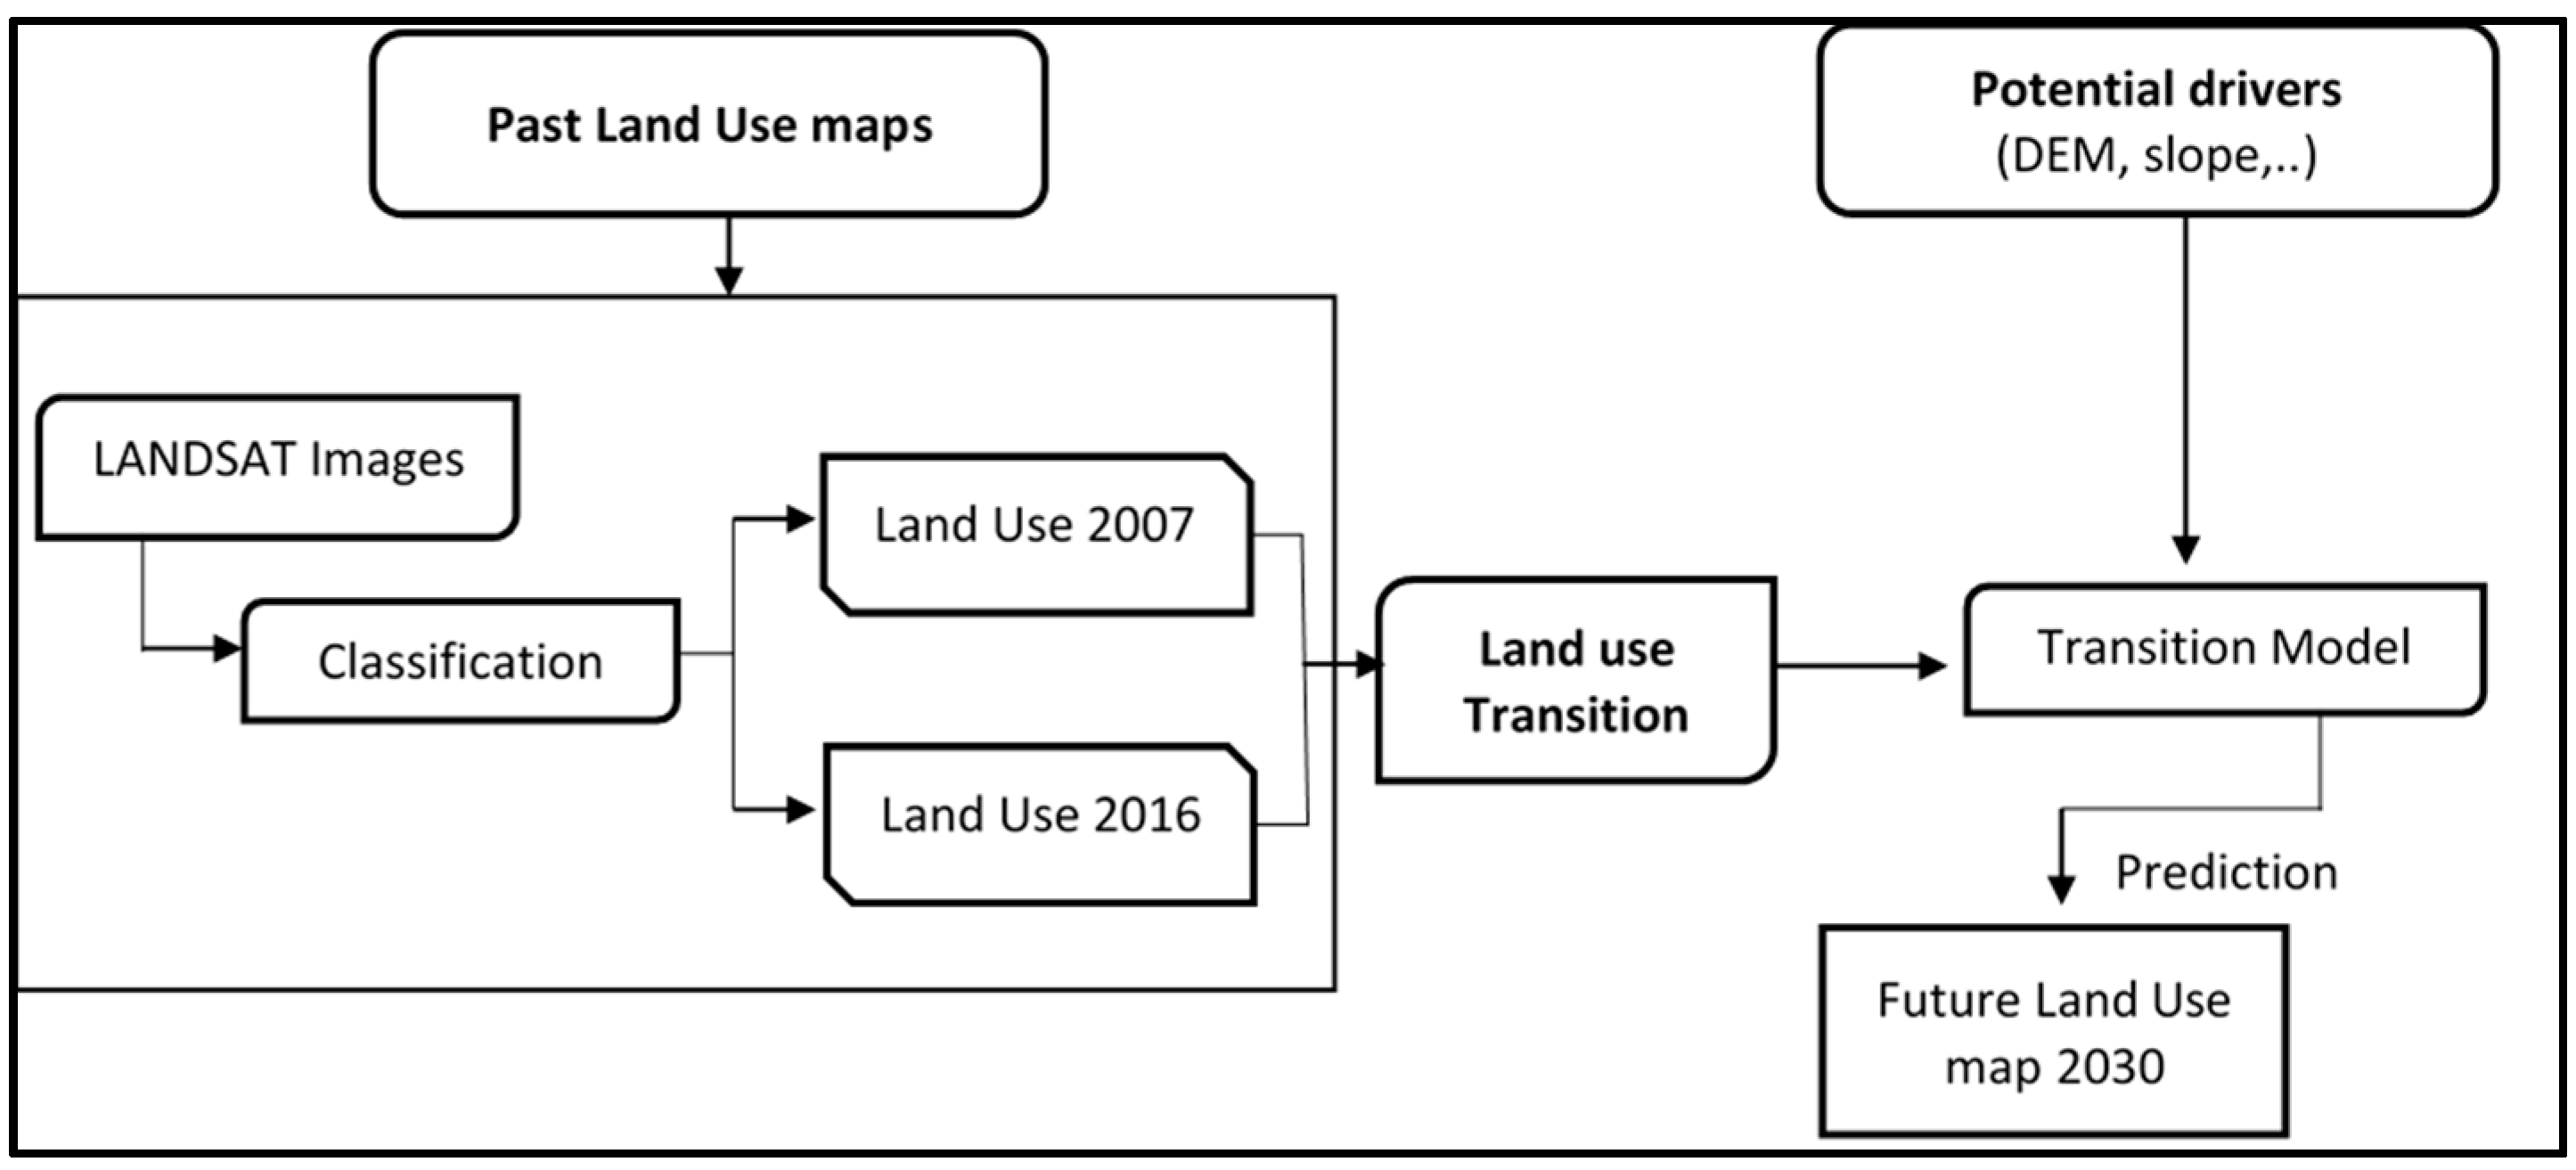
2.2.2. Exposure
2.2.3. Vulnerability
2.3. Scenarios Analysis
2.4. Field Survey
3. Results and Discussion
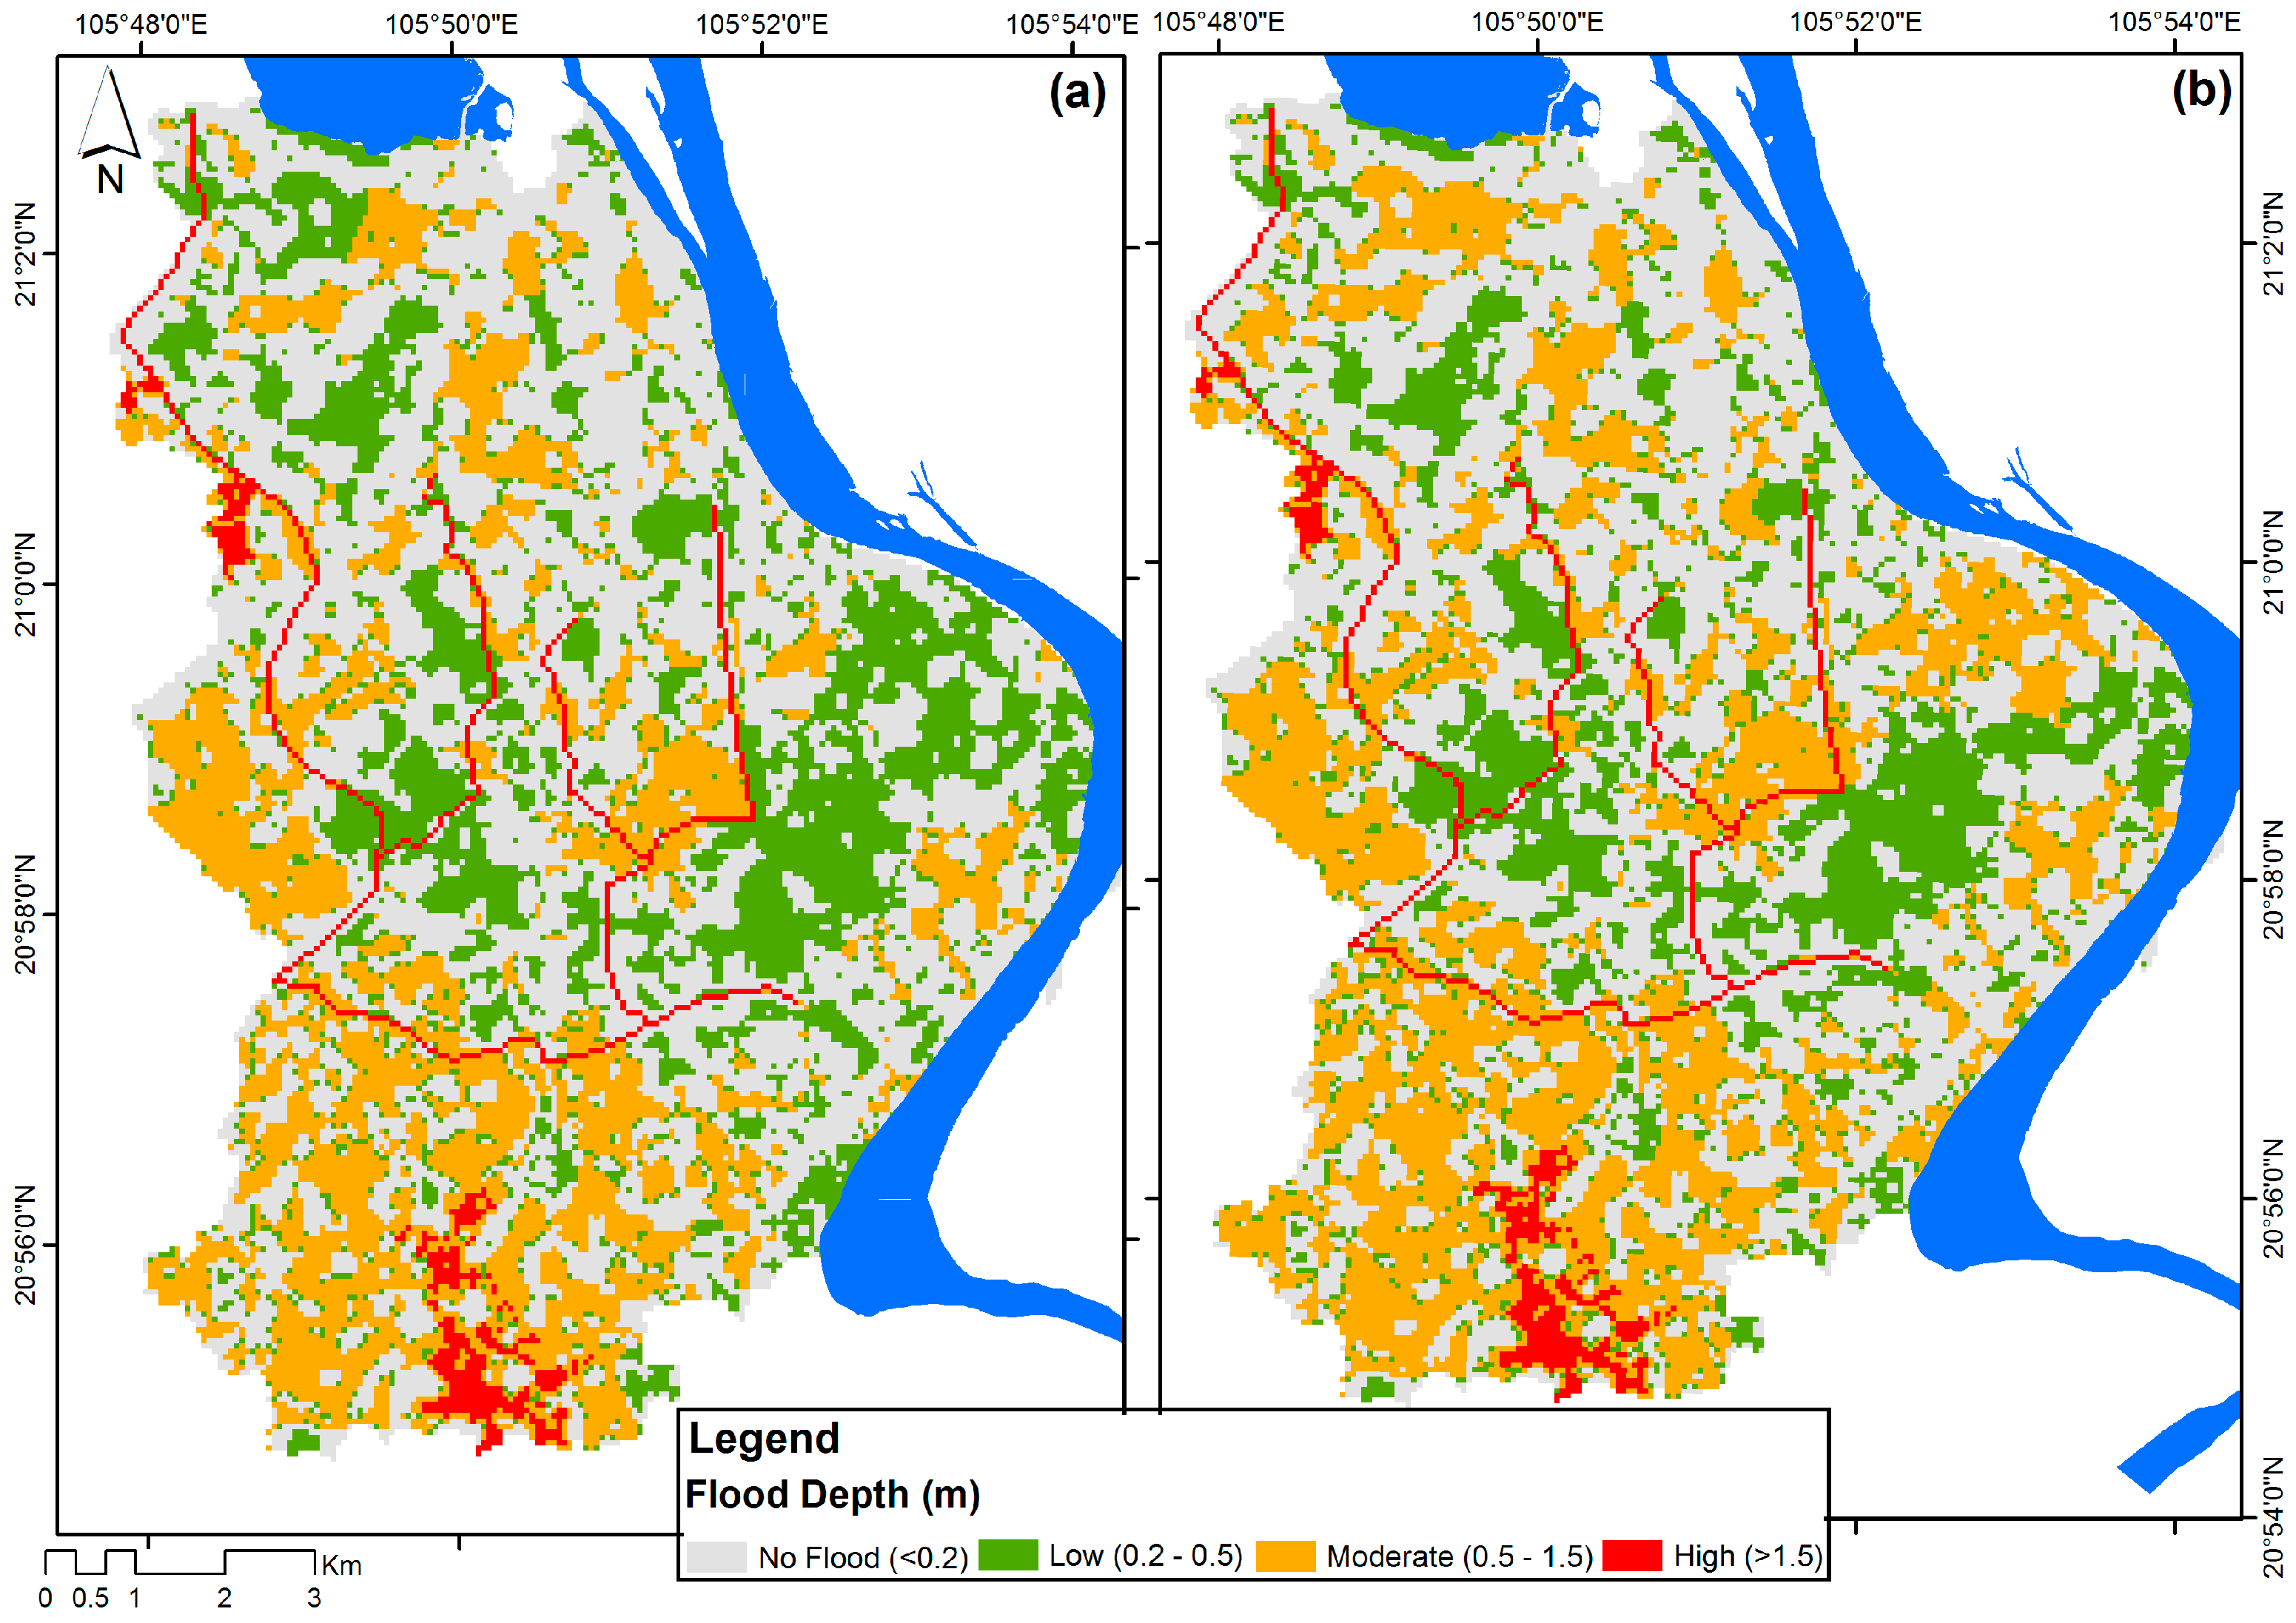
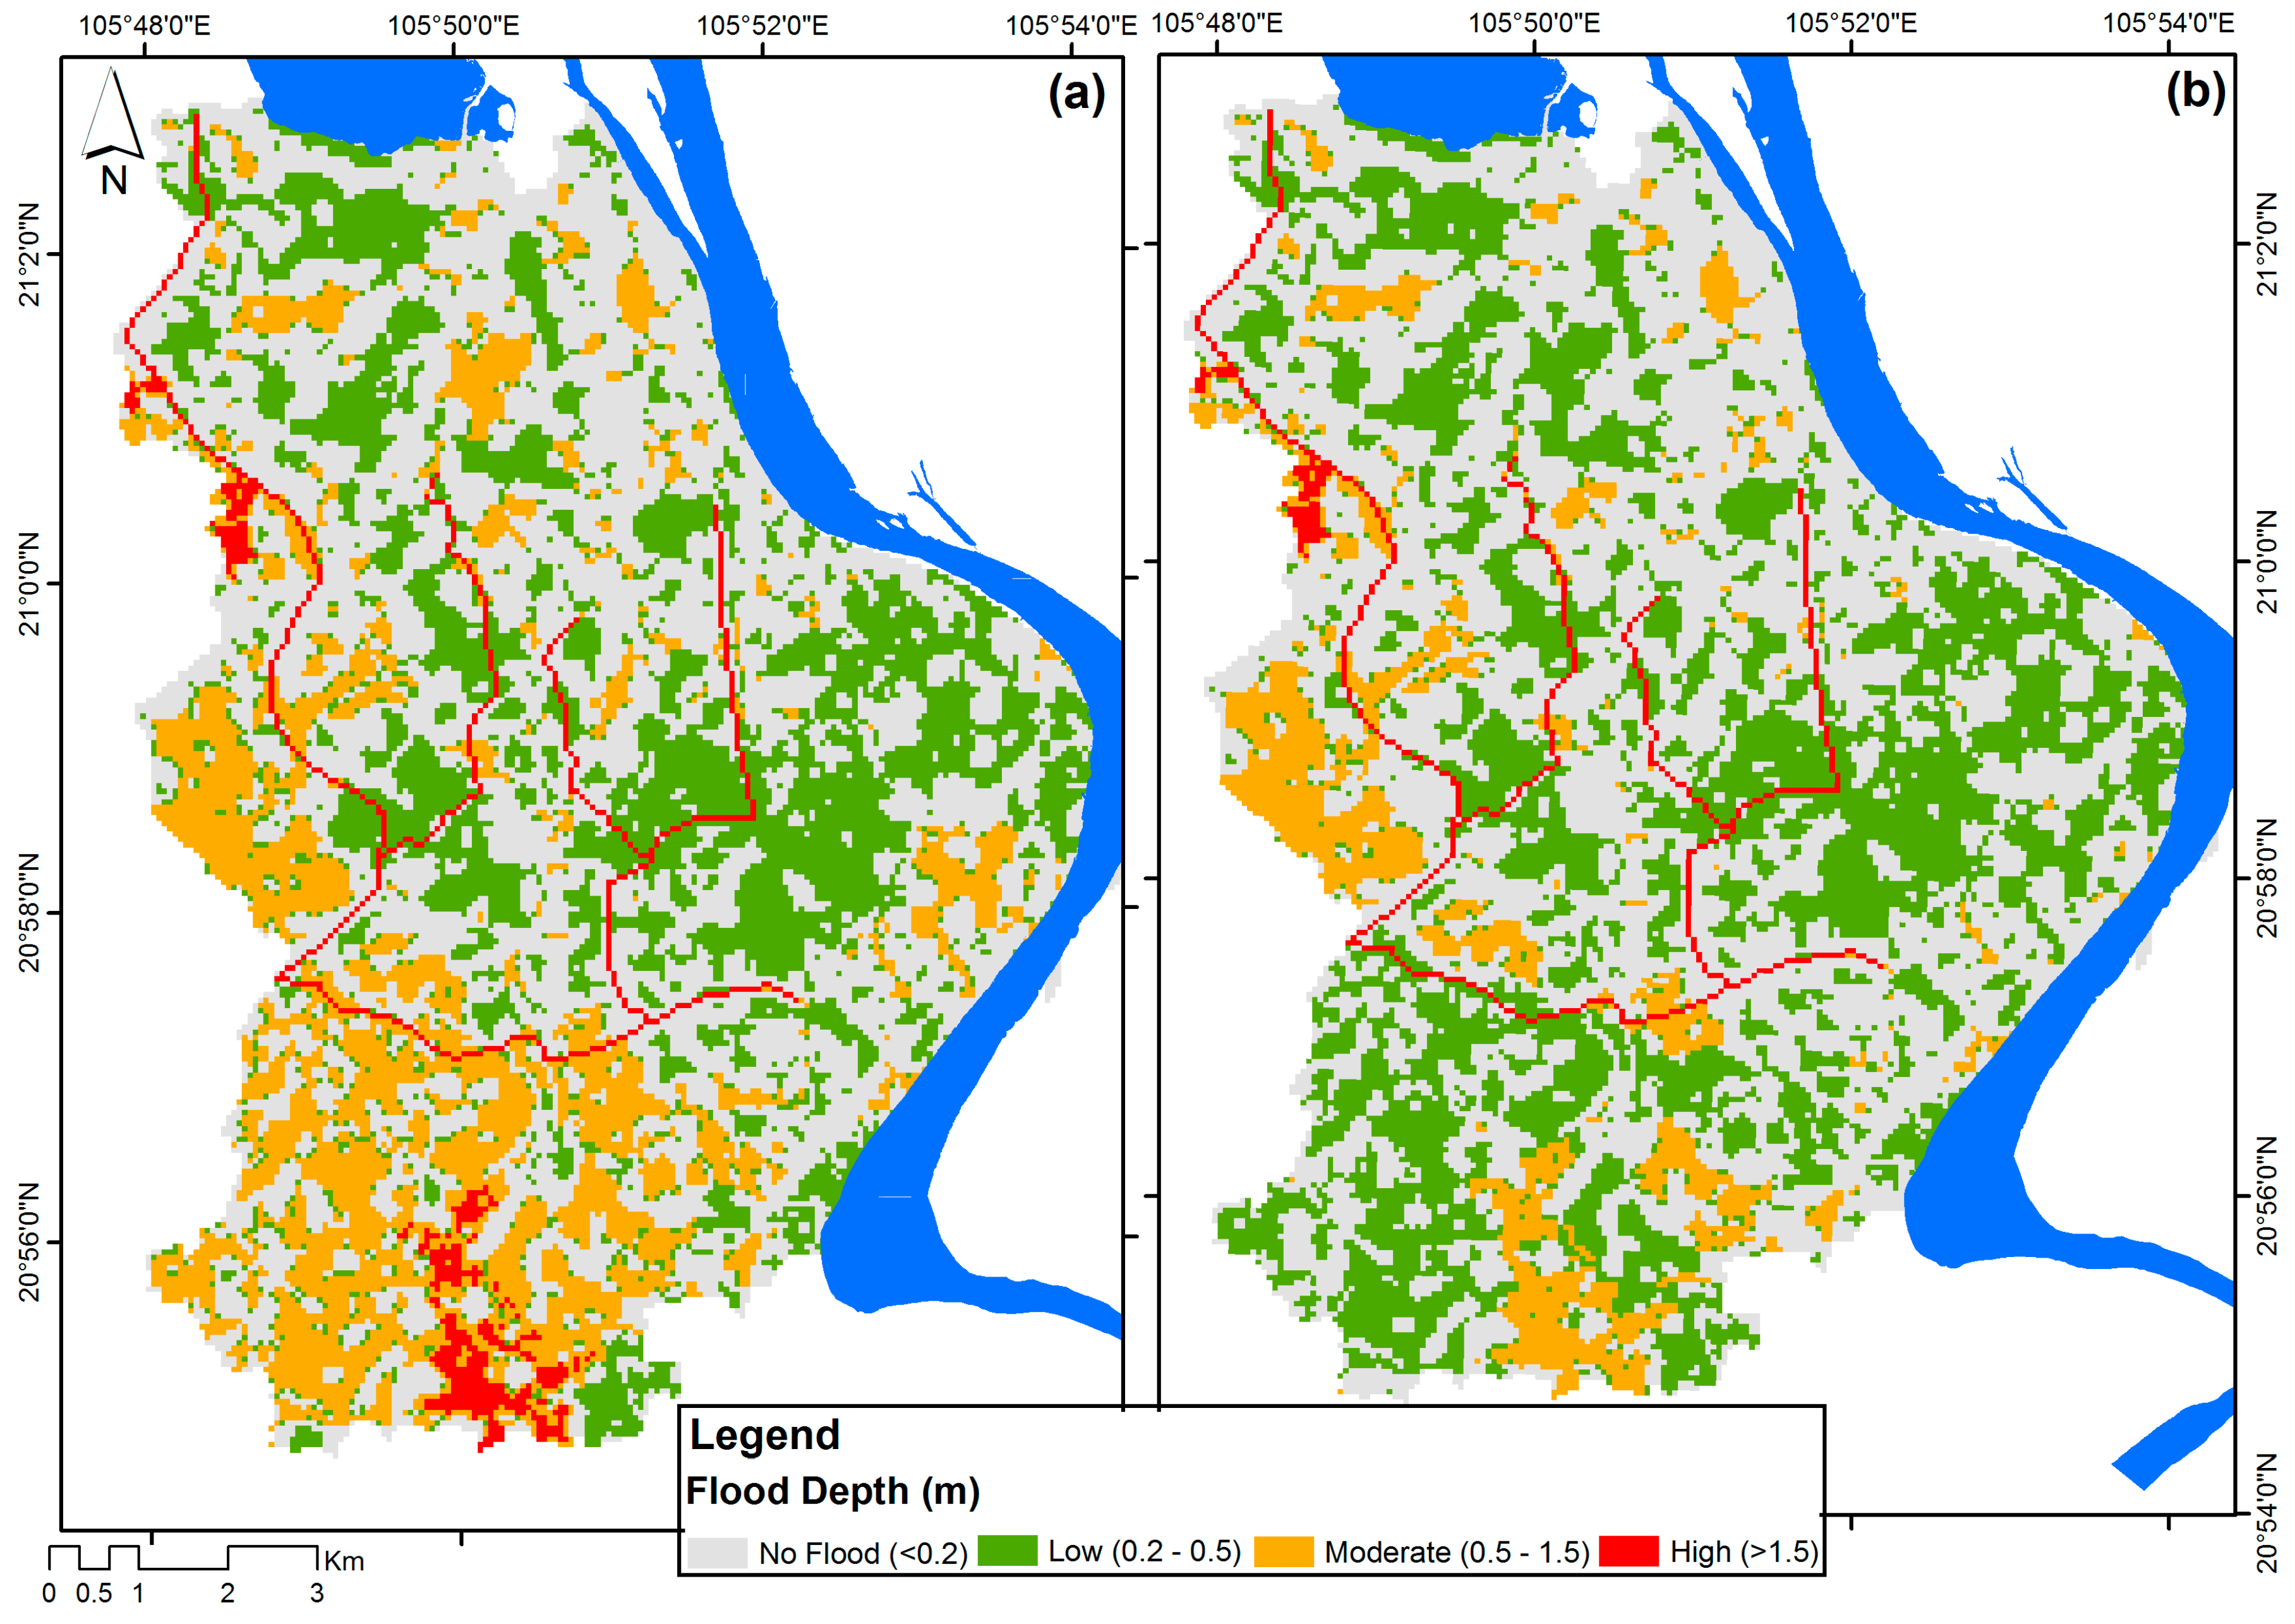
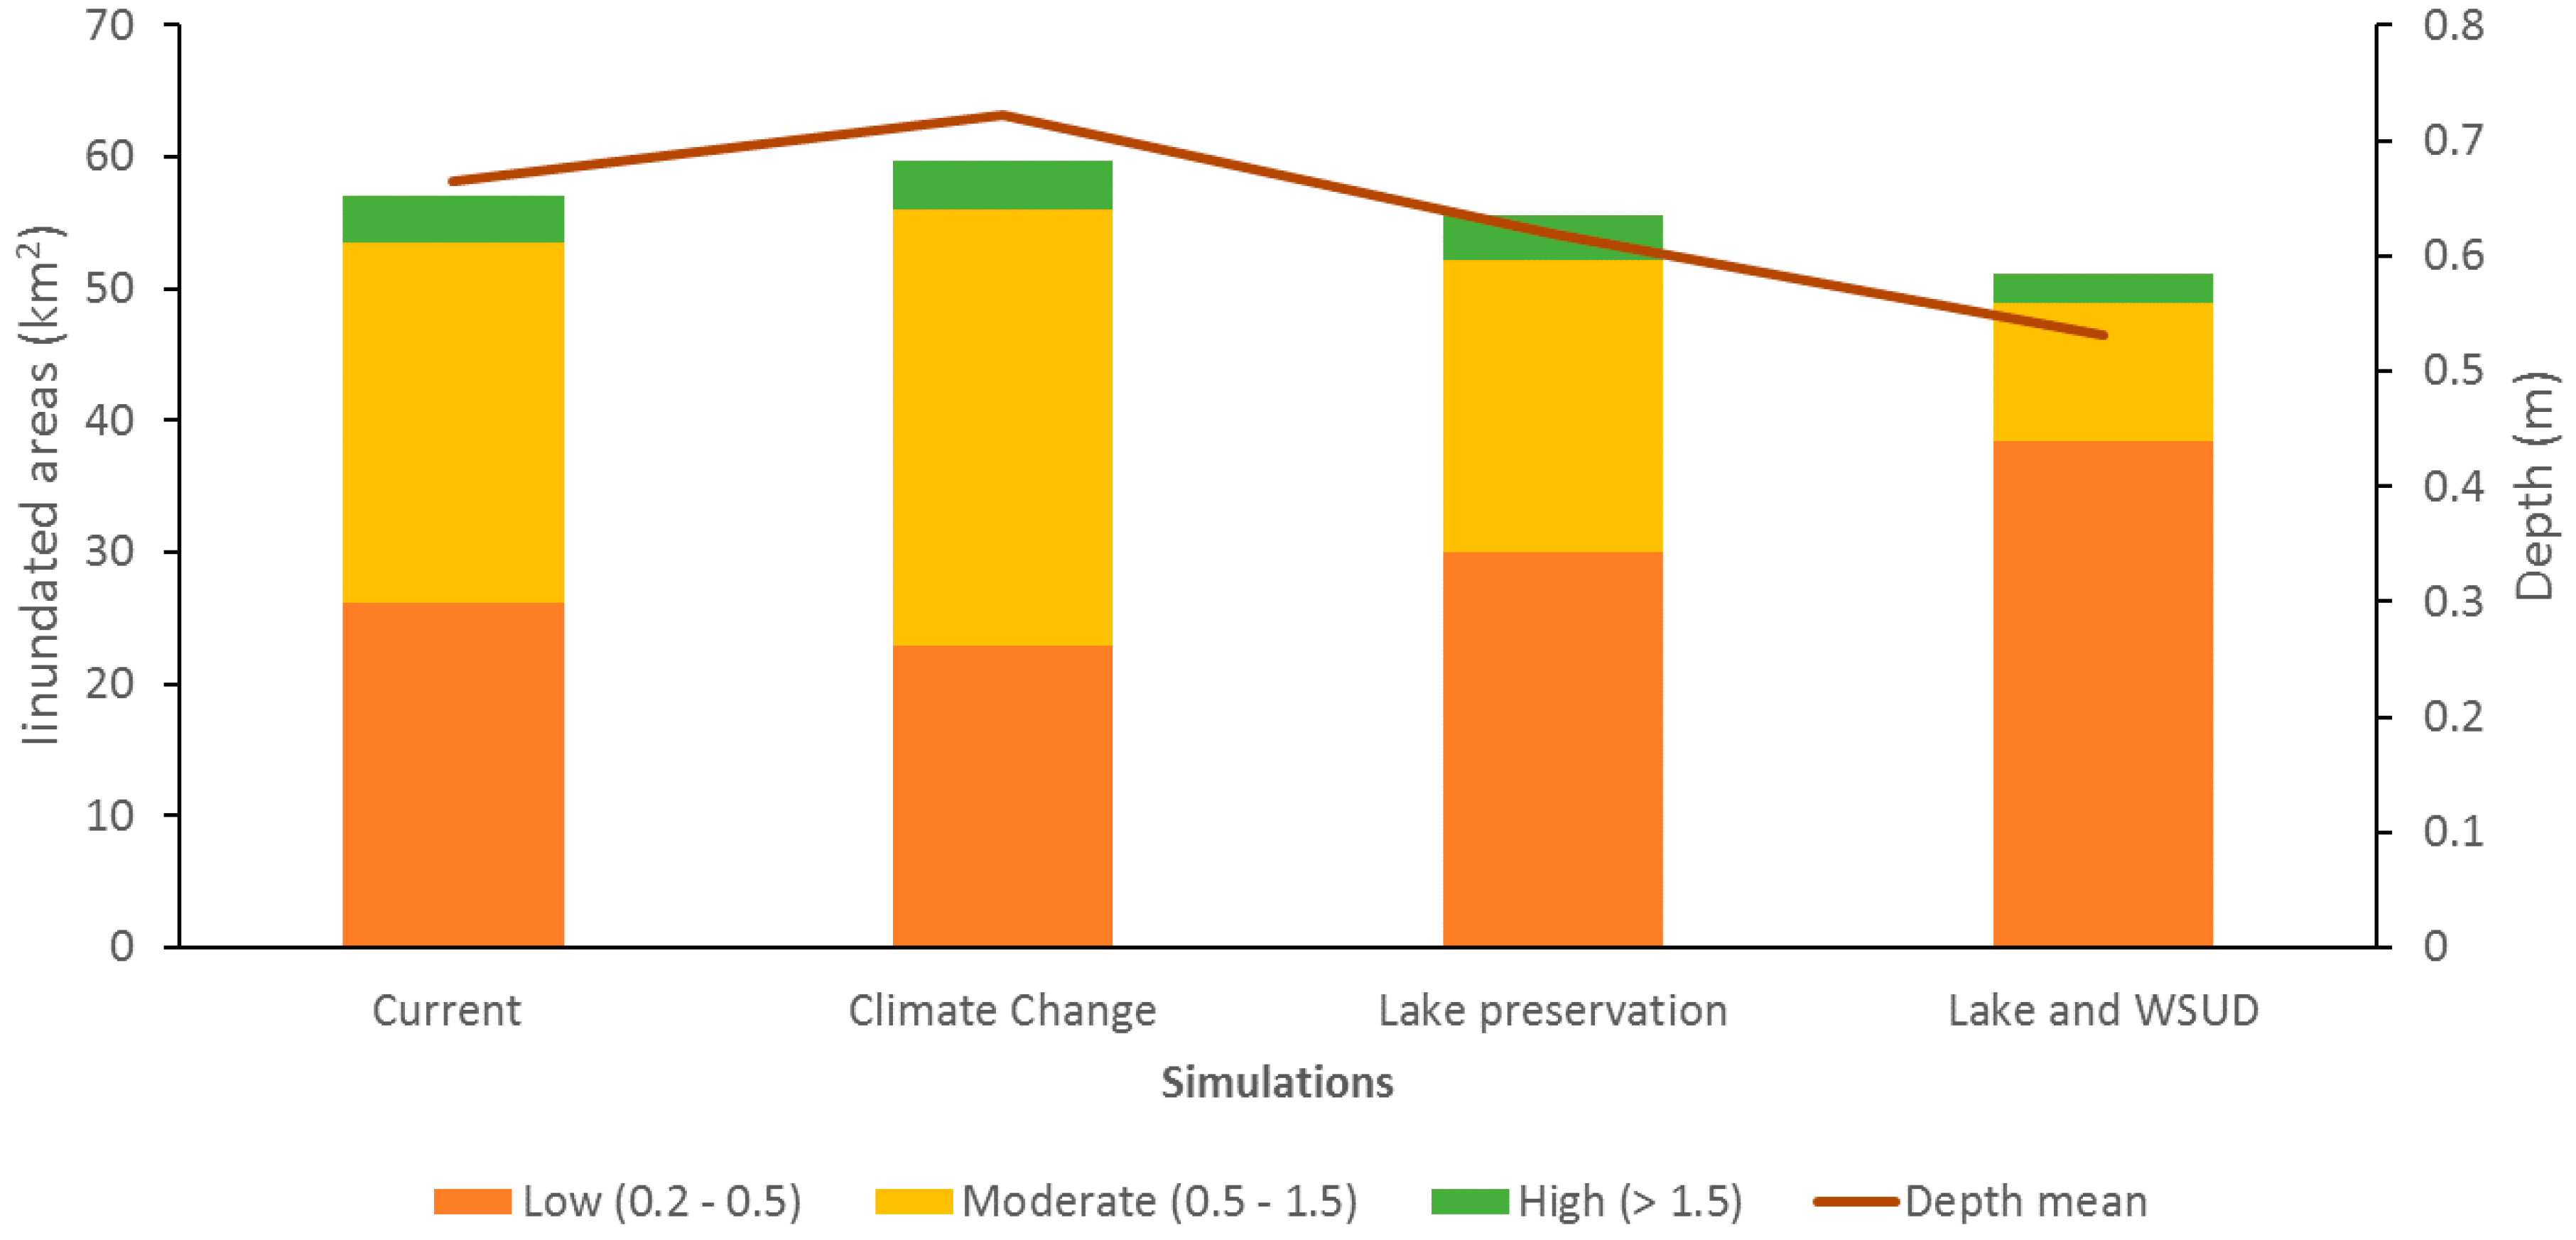
3.1. Flood Hazard Simulation
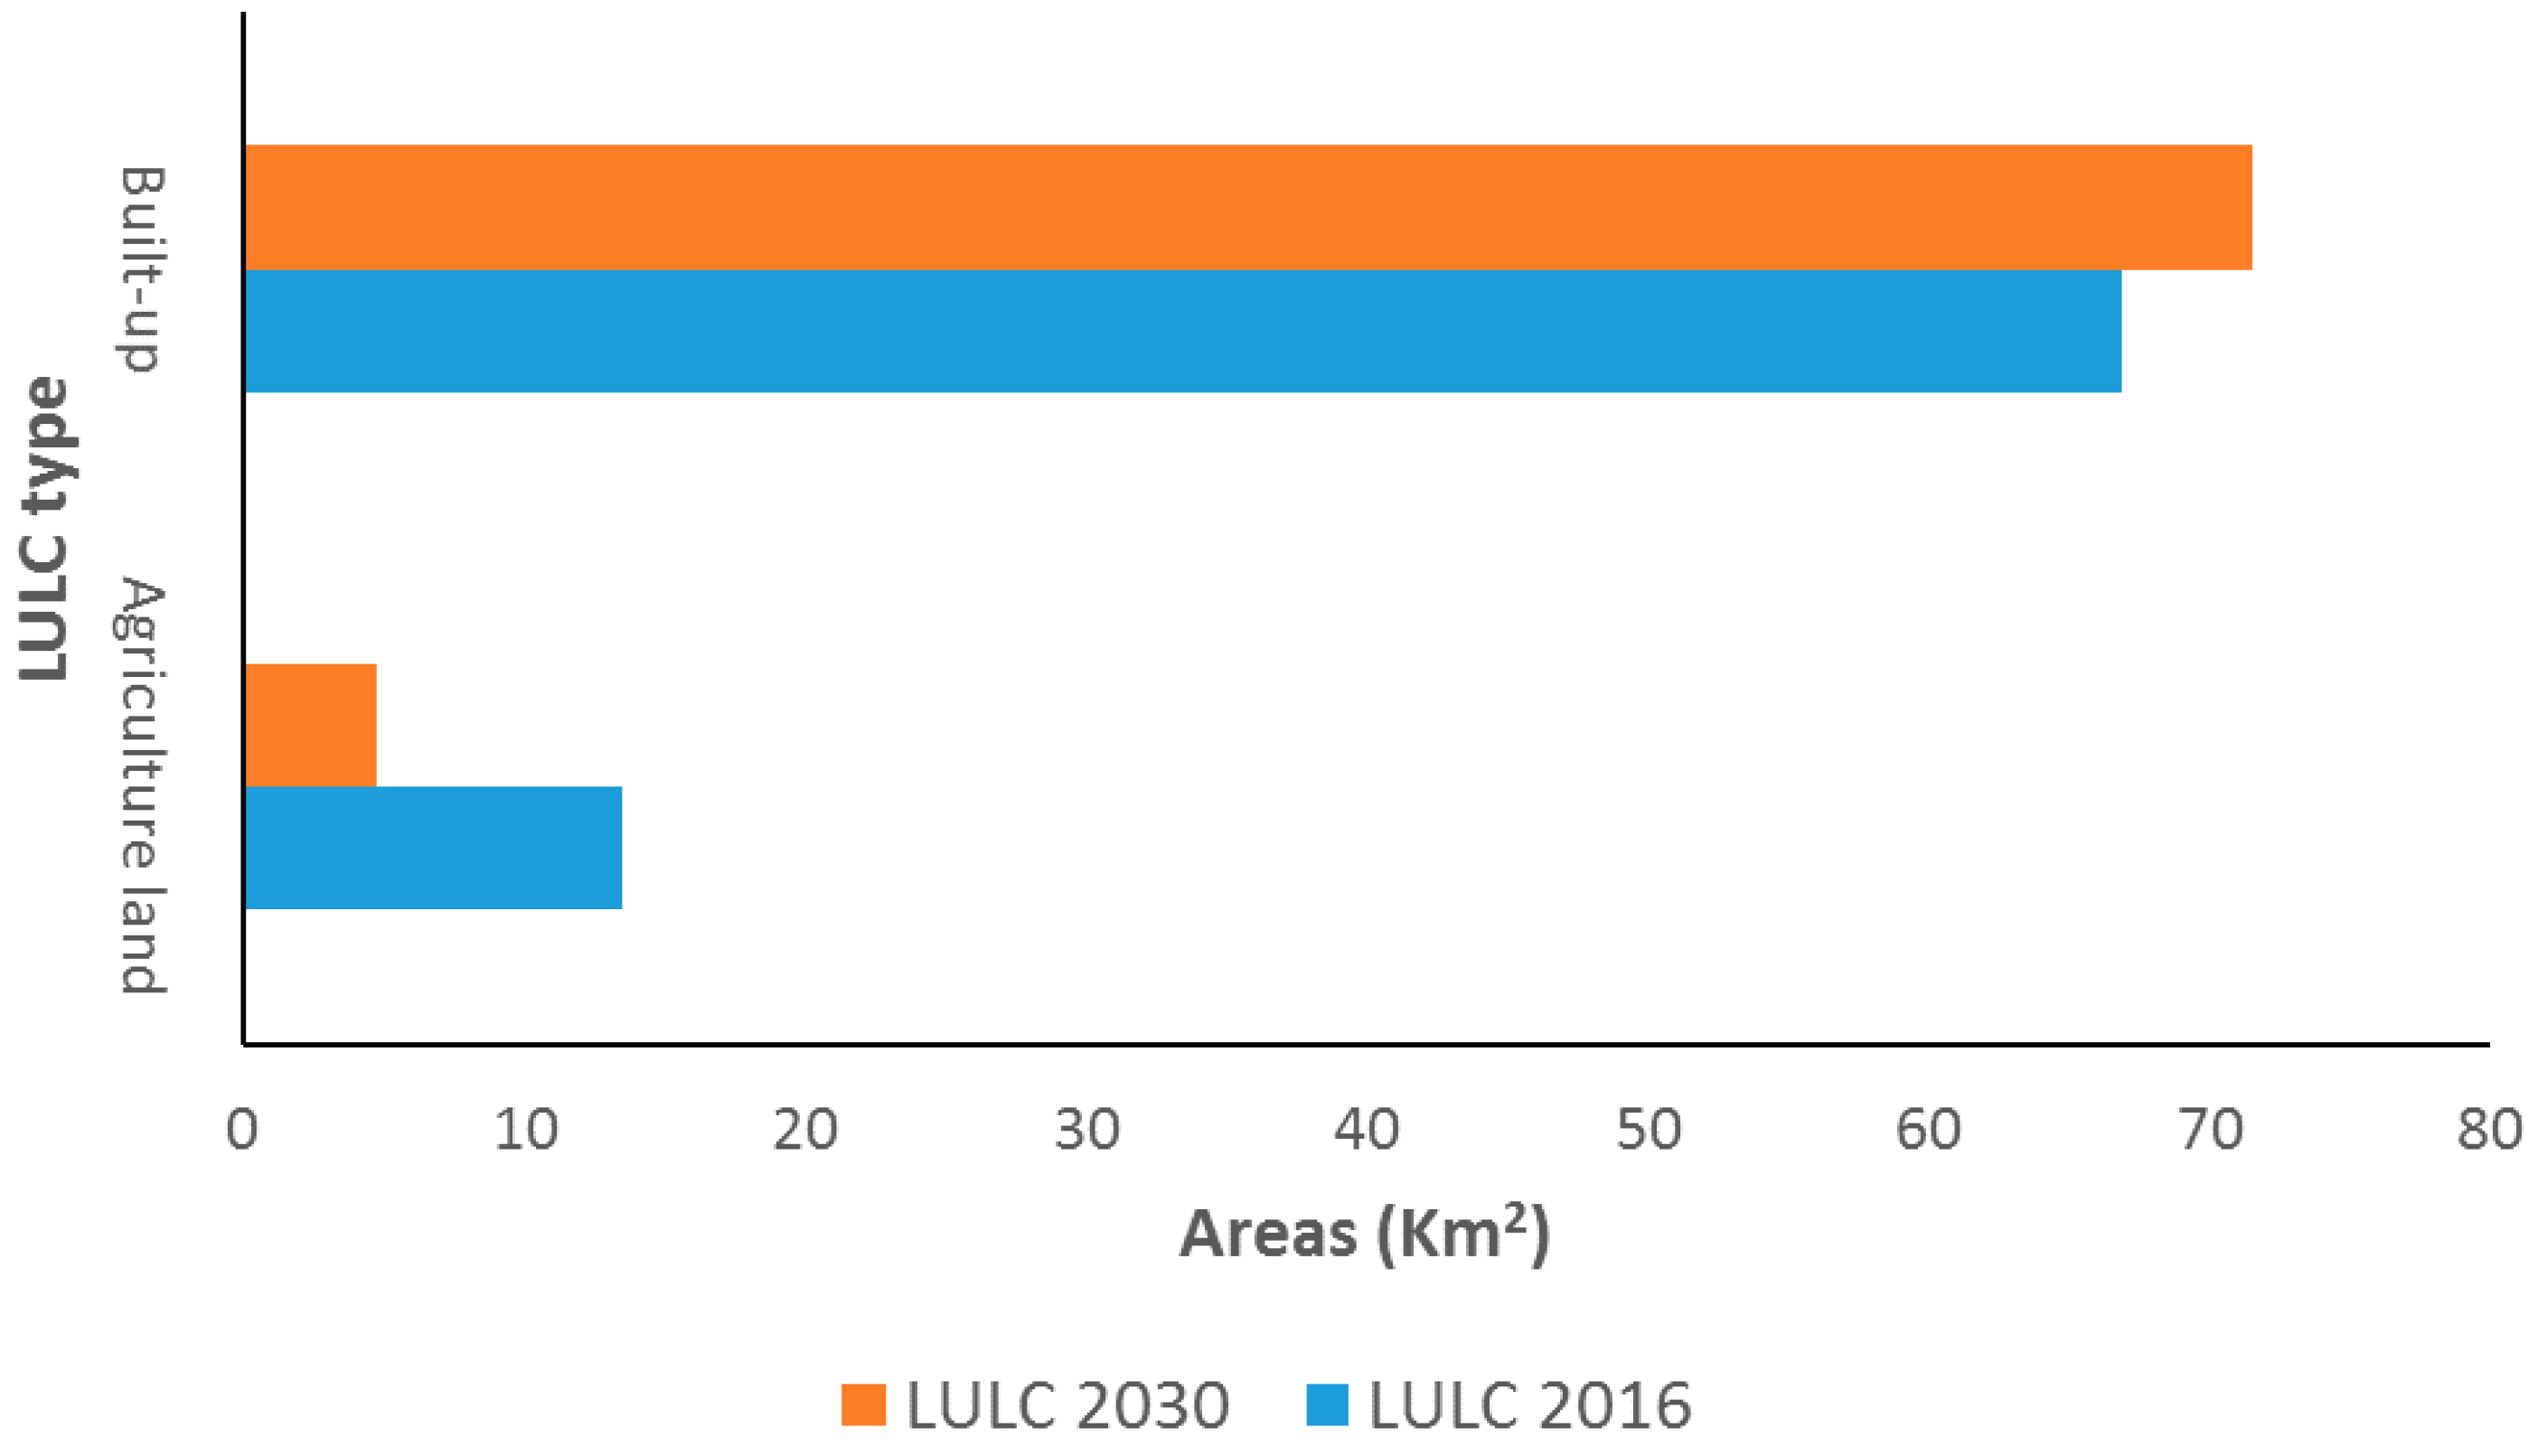
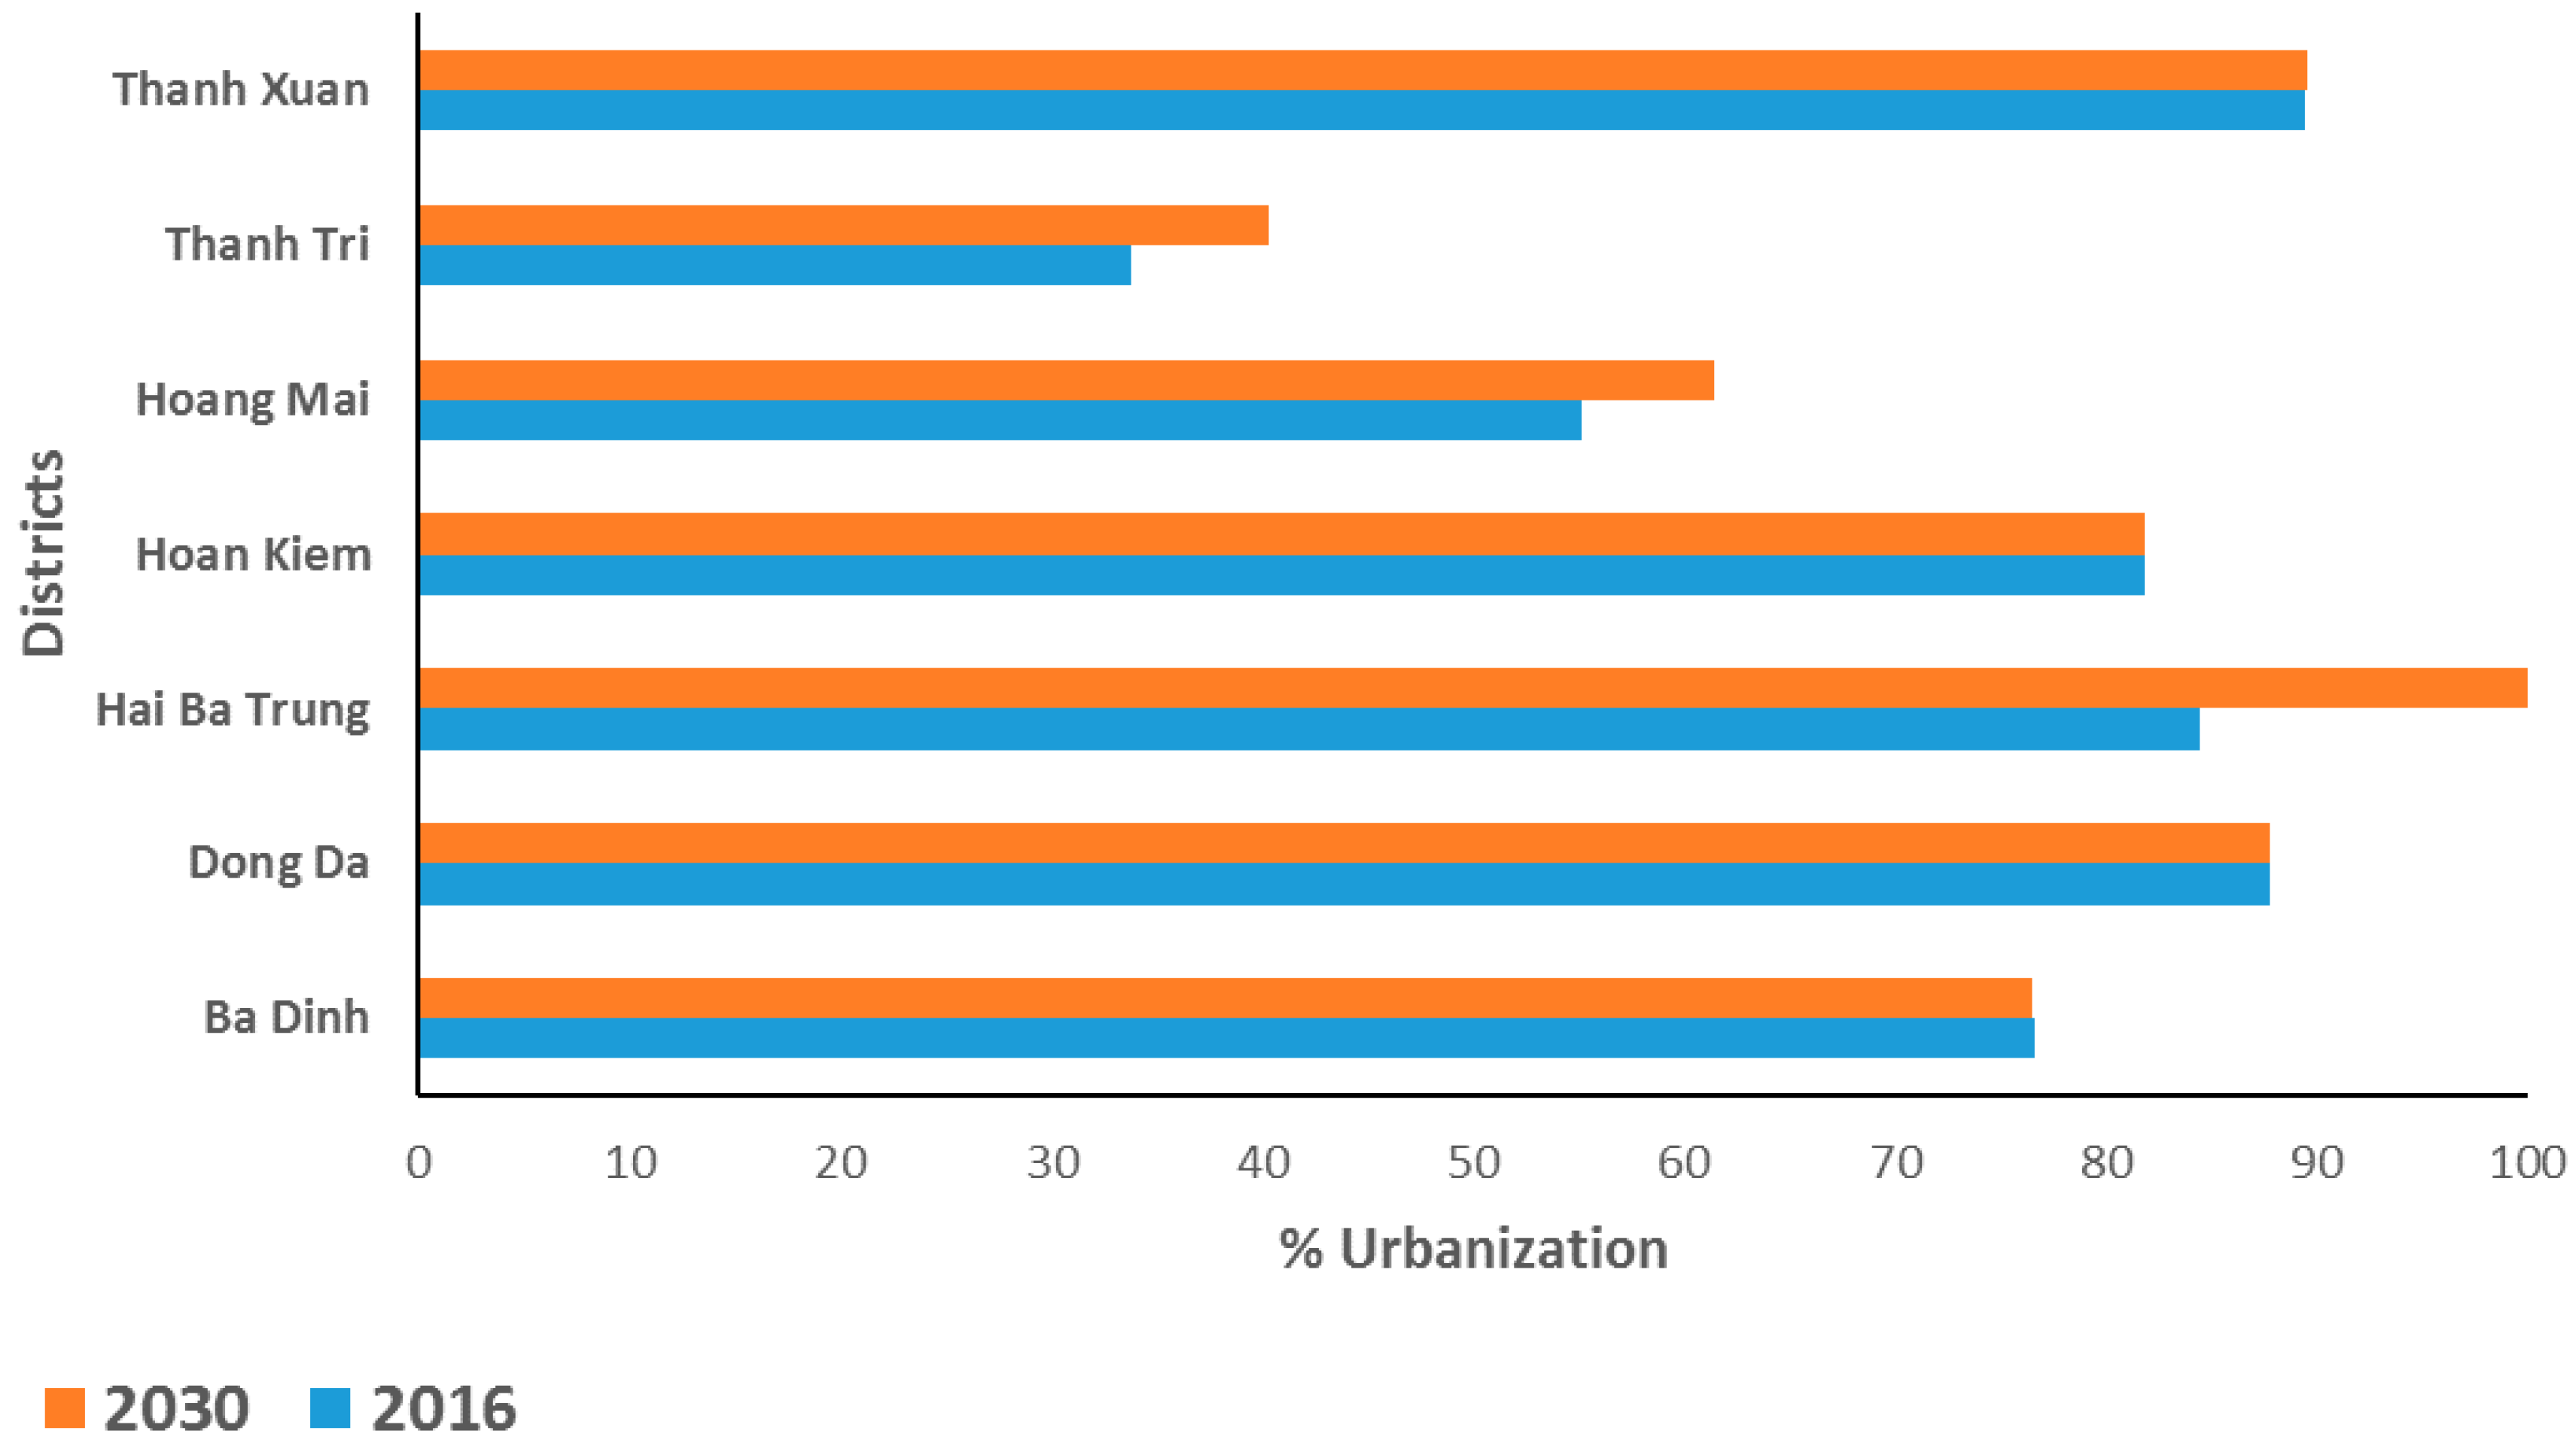
3.2. Land-Use Land Cover Change
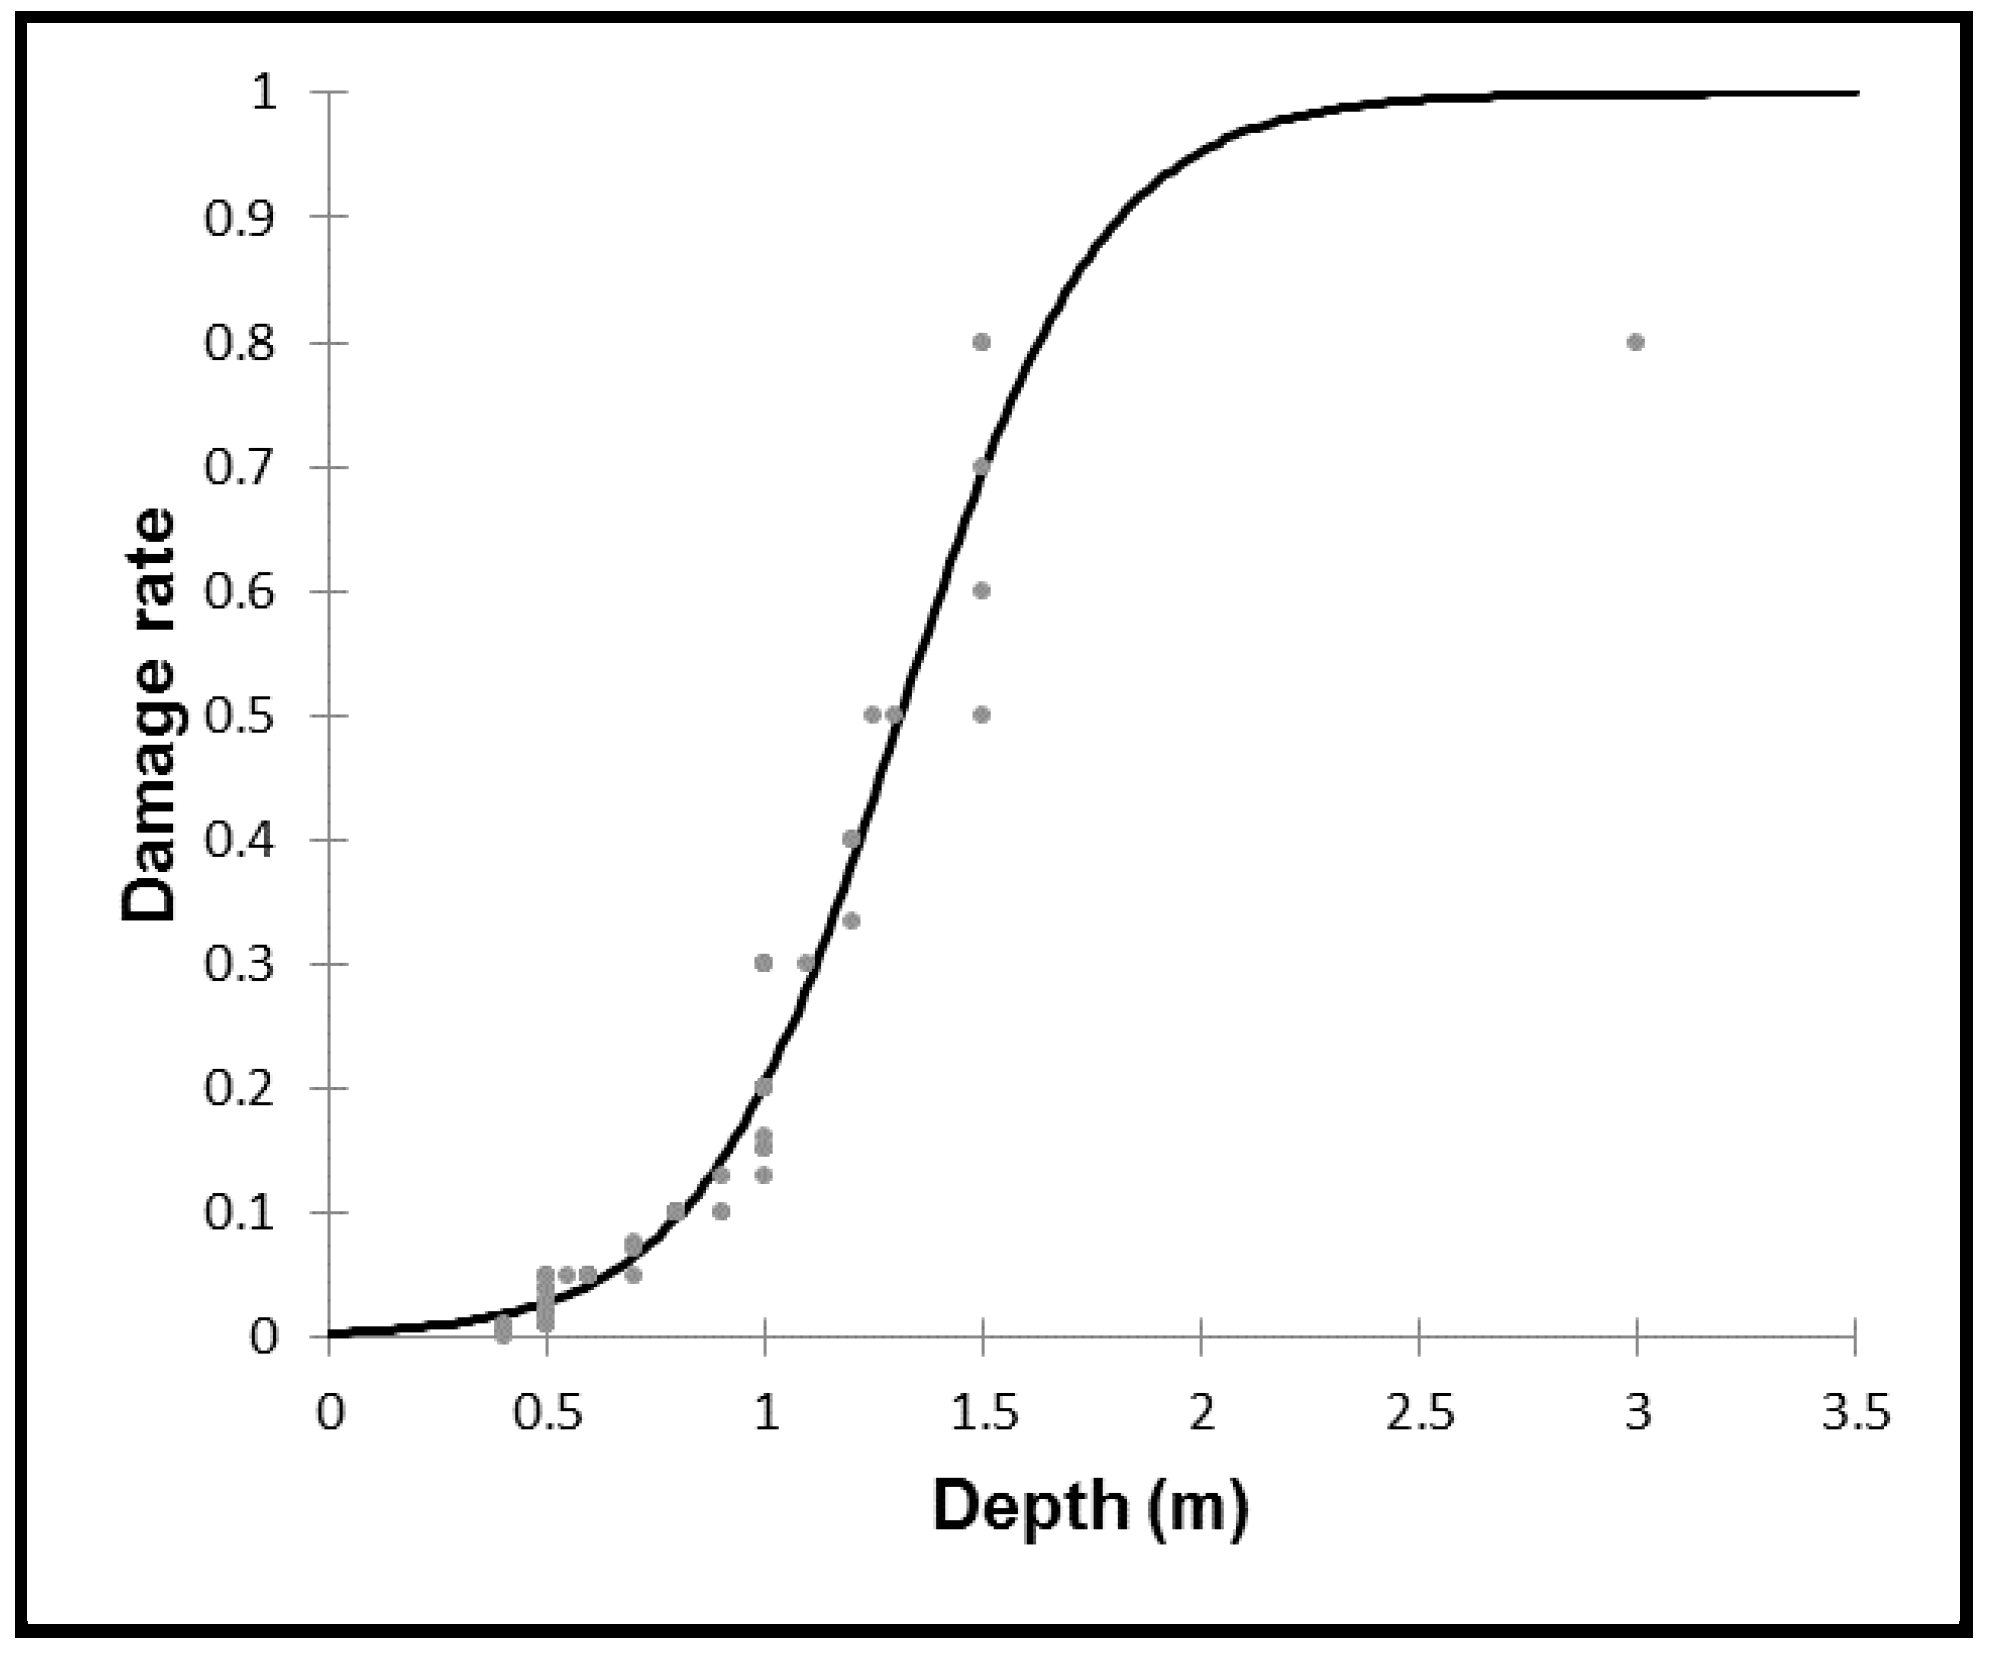
3.3. Flood Depth Damage Function
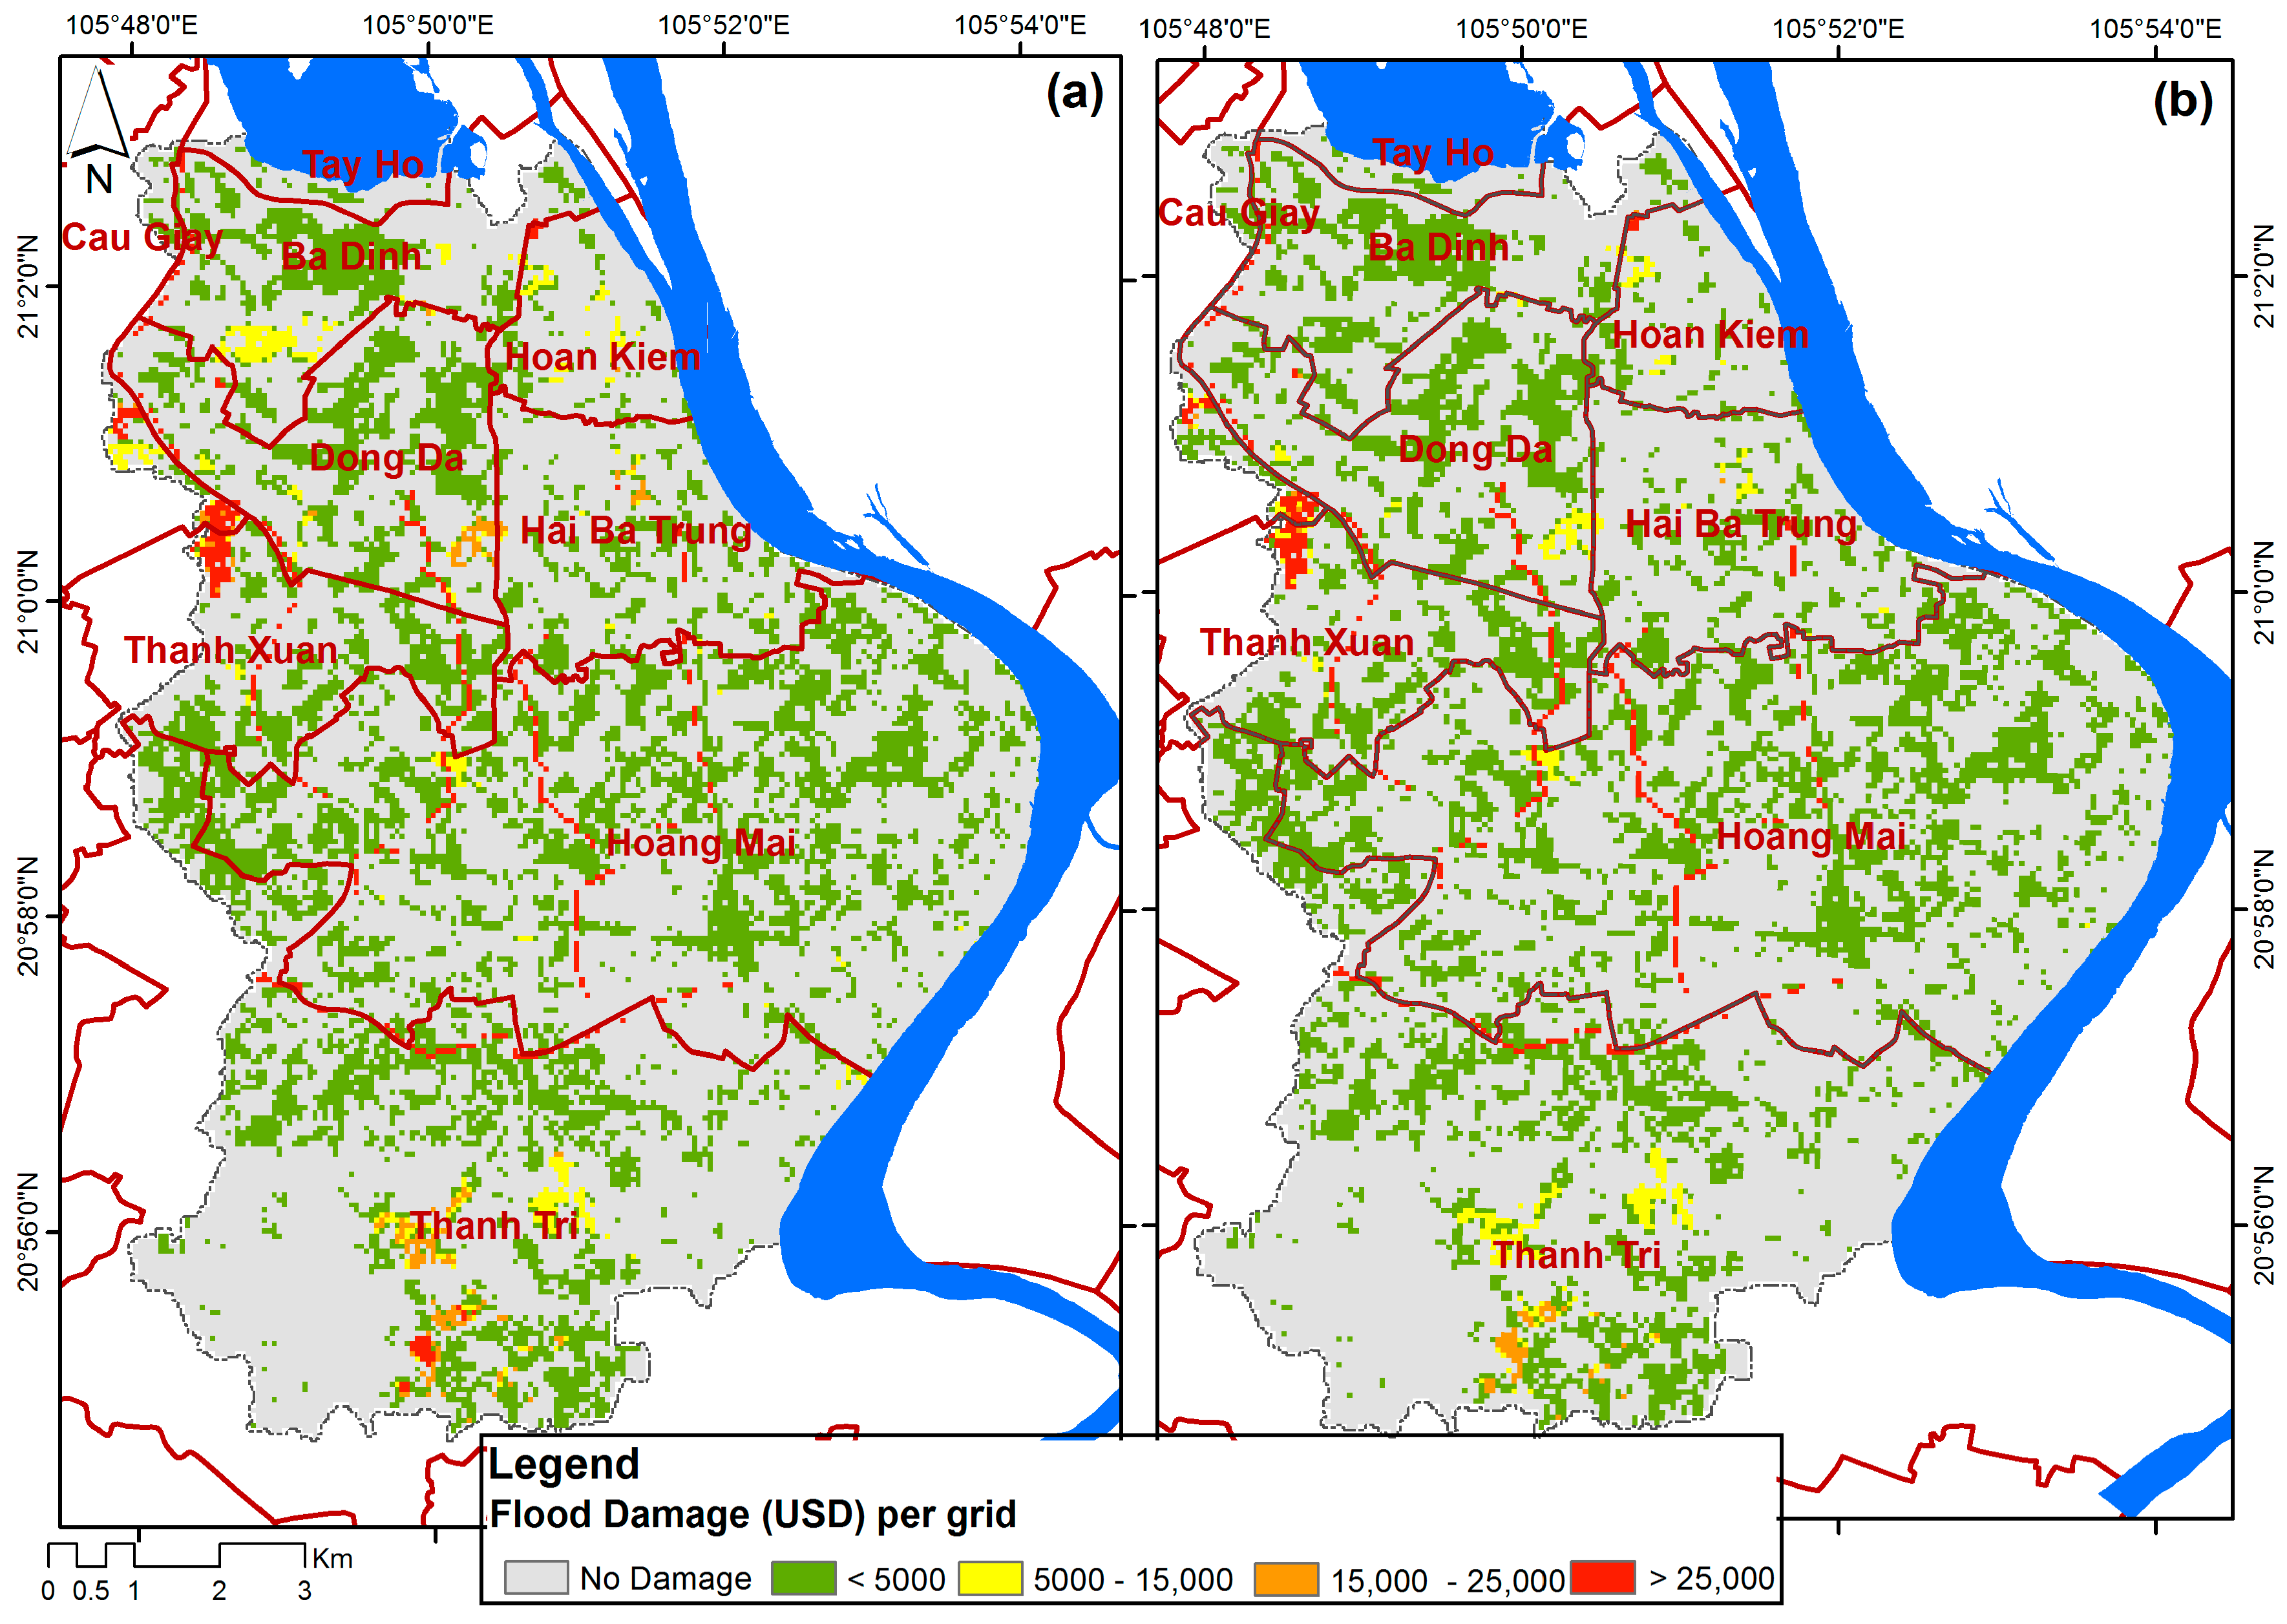
3.4. Damage Assessment
3.5. Perception of People
4. Conclusions
Acknowledgments
Author Contributions
Conflicts of Interest
References
- Bosher, L.; Chmutina, K. Disaster Risk Reduction for the Built Environment; Willey Blackwell: Oxford, UK, 2017. [Google Scholar]
- Felbermayr, G.; Groschl, J. Naturally negative: The growth effects of natural disasters. J. Dev. Econ. 2014, 111, 92–106. [Google Scholar] [CrossRef]
- Munich, R.E. Overview of Natural Catastrophe in 2016. Available online: https://www.munichre.com/topics-online/en/2017/topics-geo/overview-natural-catastrophe-2016 (accessed on 25 November 2017).
- Munich, R.E. Topics Geo 2016, Natural Catastrophes 2016: Analyses, Assessments, Positions. Available online: https://www.preventionweb.net/publications/view/52360 (accessed on 25 November 2017).
- IPCC. Managing the risks of extreme events and disasters to advance climate change adaptation. In A Special Report of Working Groups I and II of the Intergovernmental Panel on Climate Change; Field, C.B.V., Barros, T.F., Stocker, D., Qin, D.J., Dokken, K.L., Ebi, M.D., Mastrandrea, K.J., Mach, G.-K., Plattner, S.K., Allen, M., et al., Eds.; Cambridge University Press: Cambridge, UK; New York, NY, USA, 2012. [Google Scholar]
- Mechler, R. Reviewing estimates of the economic efficiency of disaster risk management: Opportunities and limitations of using risk-based cost-benefit analysis. Nat. Hazards 2016, 81, 2121–2147. [Google Scholar] [CrossRef]
- Mishra, B.K.; Herath, S. Assessment of future floods in the Bagmati River Basin of Nepal using bias-corrected daily GCM precipitation data. J. Hydrol. Eng. 2014, 20. [Google Scholar] [CrossRef]
- Dasgupta, S.; Roy, S.; Sarraf, M. Urban flooding in a changing climate: Case study of Kolkata, India. Asian-Afr. J. Econ. Econ. 2012, 12, 135–158. [Google Scholar]
- Jongman, B.; Kreibich, H.; Barredo, J.I.; Bates, P.D.; Feyen, L.; Gericke, A.; Neal, J.; Aerts, J.C.J.H.; Ward, P.J. Comparative flood damage model assessment: Towards a European approach. Nat. Hazards Earth Syst. Sci. 2012, 12, 3733–3752. [Google Scholar] [CrossRef]
- De Moel, H.; Aerts, J.C.J.H. Effect of Uncertainty in land use, damage models and inundation depth on flood damage estimates. Nat. Hazards 2011, 58, 407–425. [Google Scholar] [CrossRef]
- Merz, B.; Thieken, A.H. Flood risk curves and uncertainty bounds. Nat. Hazards 2009, 51, 437–458. [Google Scholar] [CrossRef]
- Meyer, V.; Haase, D.; Scheuer, S. Flood risk assessment in european river basins—Concept, methods, and challenges exemplified at the mulde river. Integr. Environ. Assess. Manag. 2009, 5, 17–26. [Google Scholar] [CrossRef] [PubMed]
- Wagenaar, D.J.; De Bruijn, K.M.; Bouwer, L.M.; De Moel, H. Uncertainty in flood damage estimates and its potential effect on investment decisions. Nat. Hazards Earth Syst. Sci. 2016, 16, 1–14. [Google Scholar] [CrossRef]
- Jonkman, S.N.; Bockarjova, M.; Kok, M.; Bernardini, P. Integrated hydrodynamic and economic modelling of flood damage in the Netherlands. Ecol. Econ. 2008, 66, 77–90. [Google Scholar] [CrossRef]
- Kelman, I.; Spence, R. An overview of flood actions on buildings. Eng. Geol. 2004, 73, 297–309. [Google Scholar] [CrossRef]
- Romali, N.S.; Sulaiman, M.A.K.; Yusop, Z.; Ismail, Z. Flood Damage Assessment: A Review of Flood Stage–Damage Function Curve; Abu Bakar, S., Tahir, W., Wahid, M., Mohd Nasir, S., Hassan, R., Eds.; Springer: Singapore, 2015. [Google Scholar]
- Pistrika, A.; Tsakiris, G.; Nalbantis, I. Flood depth-damage functions for built environment. Environ. Process. 2014, 1, 553–572. [Google Scholar] [CrossRef]
- Smith, D.I. Flood Damage estimation–A review of Urban Stage-Damage curves and loss functions. Water SA 1994, 20, 231–238. [Google Scholar]
- Handmer, J. The chimera of precision: Inherent uncertainties in disaster loss assessment. Int. J. Mass Emerg. Disasters 2002, 20, 325–346. [Google Scholar]
- Thieken, A.H.; Olschewski, A.; Kreibich, H.; Kobsch, S.; Merz, B. Development and evaluation of FLEMOps–A new flood loss estimation model for the private sector. In Flood Recovery, Innovation and Response; Proverbs, D., Brebbia, C.A., Penning-Rowsell, E., Eds.; WIT Press: Southampton, UK, 2008; pp. 315–324. [Google Scholar]
- Scawthorn, C.; Flores, P.; Blais, N.; Seligson, H.; Tate, E.; Chang, S.; Mifflin, E.; Thomas, W.; Murphy, J.; Jones, C.; et al. Hazus-MH flood loss estimation methodology. II. damage and loss assessment. Nat. Hazards Rev. 2006, 7, 72–81. [Google Scholar] [CrossRef]
- Glas, H.; Jonckheere, M.; Mandal, A.; James-Williamson, S.; De Maeyer, P.; Deruyter, G. A GIS-based tool for flood damage assessment and delineation of a methodology for future risk assessment: Case study for Annotto Bay, Jamaica. Nat. Hazards 2017. [Google Scholar] [CrossRef]
- Albano, R.; Sole, A.; Adamowski, J.; Mancusi, L. A GIS-based model to estimate flood consequences and the degree of accessibility and operability of strategic emergency response structures in urban areas. Nat. Hazards Earth Syst. Sci. 2014, 14, 2847–2865. [Google Scholar] [CrossRef]
- Haq, M.; Akhtar, M.; Muhammad, S.; Paras, S.; Rahmatullah, J. Techniques of remote sensing and GIS for flood monitoring and damage assessment: A case study of Sindh province, Pakistan. Egypt. J. Remote Sens. Space Sci. 2012, 15, 135–141. [Google Scholar] [CrossRef]
- Albano, R.; Mancusi, L.; Sole, A.; Adamowski, J. Collaborative strategies for sustainable EU flood risk management: FOSS and geospatial tools–Challenges and opportunities for operative risk analysis. ISPRS Int. J. Geo-Inf. 2015, 4, 2704–2727. [Google Scholar] [CrossRef]
- Albano, R.; Mancusi, L.; Sole, A.; Adamowski, J. FloodRisk: A collaborative free and open-source software for flood risk analysis. Geomat. Nat. Hazard Risk 2017, 8, 1812–1832. [Google Scholar] [CrossRef]
- Arrighi, C.; Rossi, E.; Rudari, R.; Ferraris, L.; Brugioni, M.; Franceschini, S.; Castelli, F. Quantification of Flood risk mitigation benefits: A building-scale damage assessment through the RASOR platform. J. Environ. Manag. 2018, 207, 92–104. [Google Scholar] [CrossRef] [PubMed]
- ADB (Asian Development Bank). The Rise of Natural Disasters in Asia and the Pacific: Learning from ADB’s Experience; ADB: Mandaluyong, Philippines, 2013. [Google Scholar]
- General Statistics office of Vietnam. Statistical Yearbook of Vietnam 2016; Statistical Publishing House: Hanoi, Vietnam, 2017.
- Hoan, P.T.T. (United Nations University Institute for the Advanced Study of Sustainability Hanoi City, Vietnam). Unpublished work. 2015.
- Grunthal, G.; Thieken, A.H.; Schwarz, J.; Radtke, K.S.; Smolka, A.; Merz, B. Comparative risk assessment for the city of cologne-storms, flood, earthquakes. Nat. Hazards 2006, 38, 21–44. [Google Scholar] [CrossRef]
- Foudi, S.; Oses-Eraso, N.; Tamayo, I. Integrated spatial flood risk assessment; the case of Zaragoza. Land Use Policy 2015, 42, 278–292. [Google Scholar] [CrossRef]
- Messner, F.; Penning-Rowsell, E.; Green, C.; Meyer, V.; Tunstall, S.; Van der Veen, A. Evaluating Flood Damages: Guidance and Recommendations on Principles and Methods; FLOODsite Integrated Flood Risk Analysis and Management Methodologies Report T09-06-01; HR Wallingford: Oxfordshire, UK, 2007. [Google Scholar]
- Skovgård Olsen, A.; Zhou, Q.; Linde, J.J.; Arnbjerg-Nielsen, K. Comparing methods of calculating expected annual damage in urban pluvial flood risk assessments. Water 2015, 7, 255–270. [Google Scholar] [CrossRef]
- Teng, J.; Jakeman, A.J.; Vaze, J.; Croke, B.F.W.; Dutta, D.; Kim, S. Flood inundation modelling: A review of methods, recent advances and uncertainty analysis. Environ. Model. Softw. 2017, 90, 201–216. [Google Scholar] [CrossRef]
- Mishra, B.K.; Rafiei Emam, A.; Masago, Y.; Kumar, P.; Regmi, R.K.; Fukushi, K. Assessment of future flood inundations under climate and land use change scenarios in the Ciliwung River Basin, Jakarta. J. Flood Risk Manag. 2017. [Google Scholar] [CrossRef]
- Elliott, A.H.; Trowsdale, S.A. A review of models for low impact urban stormwater drainage. Environ. Model. Softw. 2007, 22, 394–405. [Google Scholar] [CrossRef]
- Wu, Y.H.; Liu, K.F.; Chen, Y.C. Comparison between FLO-2D and Debris-2D on the application of assessment of granular debris flow hazards with case study. J. Mt. Sci. 2012, 10, 293–304. [Google Scholar] [CrossRef]
- Samadi, S.Z.; Sagareswar, G.; Tajiki, M. Comparison of general circulation models: Methodology for selecting the best GCM in Kermanshah Synoptic Station, Iran. Int. J. Global Warm. 2010, 2, 347–365. [Google Scholar] [CrossRef]
- Akinyemi, F.O. Land Change in the Central Albertine rift: Insights from analysis and mapping of land use-land cover change in north-western Rwanda. Appl. Geogr. 2017, 87, 127–138. [Google Scholar] [CrossRef]
- Clark Labs. Land Change Modeller for ArcGIS (Brochure). Available online: https://clarklabs.org/land-change-modeler-for-arcgis/ (accessed on 25 November 2017).
- Tu Vu, T.; Ranzi, R. Flood risk assessment and coping capacity of floods in central Vietnam. J. Hydro-Environ. Res. 2017, 14, 44–60. [Google Scholar] [CrossRef]
- HENRD (Hanoi Environment and Natural Resources Department). Property Value Price. Available online: http://www.tnmtnd.hanoi.gov.vn/ (accessed on 1 March 2017).
- Messner, F.; Meyer, V. Flood Damage, Vulnerability and Risk Perception–Challenges for Flood Damage Research; UFZ Discussion Paper 13/2005; Department of Economics: Leipzig-Halle, Germany, 2005. [Google Scholar]
- Moench, M.; Mechler, R.; Stapelton, S. The Costs and Benefits of Disaster Risk Management and Cost Benefit Analysis. Available online: http://www.unisdr.org/files/1084_InfoNote3HLdialogueCostsandBenefits.pdf (accessed on 25 November 2017).
- Nguyen, H.; Do Trung, H.; Dang Kinh, B.; Doan Thu, P. Assessment of flood hazard in Hanoi City. VNU J. Earth Environ. Sci. 2013, 29, 26–37. [Google Scholar]
- Bathrellos, G.D.; Skilodimou, H.D.; Chousianitis, K.; Youssef, A.M.; Pradhan, B. Suitability estimation for urban development using multi-hazard assessment map. Sci. Total Environ. 2017, 575, 119–134. [Google Scholar] [CrossRef] [PubMed]
- Arnell, N.W.; Gosling, S.N. The impacts of climate change on river flood risk at the global scale. Clim. Change 2016, 134, 387–401. [Google Scholar] [CrossRef]
- Zhang, S.; Na, X.; Kong, B.; Wang, Z.; Jiang, H.; Yu, H.; Zhao, Z.; Li, X.; Liu, C.; Dale, P. Identifying wetland change in China’s Sanjiang plain using remote sensing. Wetlands 2009, 29, 302–313. [Google Scholar] [CrossRef]
- Merz, B.; Kreibich, H.; Schwarze, R.; Thieken, A. Assessment of economic flood damage. Nat. Hazards Earth Syst. Sci. 2010, 10, 1697–1724. [Google Scholar] [CrossRef]
- Diakakis, M.; Pallikarakis, A.; Katsetsiadou, K. Using a Spatio-Temporal gis database to monitor the spatial evolution of urban flooding phenomena. The case of athens metropolitan area in greece. ISPRS Int. J. Geo-Inf. 2014, 3, 96–109. [Google Scholar] [CrossRef]
- Komi, K.; Amisigo, B.A.; Diekkruger, B. Integrated flood risk assessment of rural communities in the Oti River Basin, West Africa. Hydrology 2016, 3, 42. [Google Scholar] [CrossRef]
- Du, J.; Qian, L.; Rui, H.; Zuo, T.; Zheng, D.; Xu, Y.; Xu, C.-Y. Assessing the effects of urbanization on annual runoff and flood events using an integrated hydrological modeling system for Qinhuai River basin, China. J. Hydrol. 2012, 464–465, 127–139. [Google Scholar] [CrossRef]
- Dutta, D.; Herath, S.; Musiake, K. A mathematic model for loss estimation. J. Hydrol. 2003, 227, 24–29. [Google Scholar] [CrossRef]
- Vietnam Central Committee for Flood and Storm Control (VCCFSC). Damage Situation Caused by Flood at Provinces in November 2008 (Annex 2); VCCFSC: Hanoi, Vietnam, 2008. [Google Scholar]
- Neal, J.C.; Bates, P.D.; Fewtrell, T.J.; Hunter, N.M.; Wilson, M.D.; Horritt, M.S. Distributed whole city water level measurements from the Carlisle 2005 urban flood event and comparison with hydraulic model simulations. J. Hydrol. 2009, 368, 42–55. [Google Scholar] [CrossRef]
- Rafiei Emam, A.; Mishra, B.K.; Kumar, P.; Masago, Y.; Fukushi, K. Impact assessment of climate and land-use changes on flooding behavior in the Upper Ciliwung River, Jakarta, Indonesia. Water 2016, 8, 559. [Google Scholar] [CrossRef]
- Ramos, H.M.; Perez-Sanchez, M.; Franco, A.B.; Lopez-Jimenez, P.A. Urban floods adaptation and sustainable drainage measures. Fluids 2017, 2, 61. [Google Scholar] [CrossRef]
- Bathrellos, G.D.; Gaki-Papanastassiou, K.; Skilodimou, H.D.; Papanastassiou, D.; Chousianitis, K.G. Potential suitability for urban planning and industry development using natural hazard maps and geological-geomorphological parameters. Environ. Earth Sci. 2012, 66, 537–548. [Google Scholar] [CrossRef]
- Kousky, C.A. Discussion of the national flood insurance program. In Resources for the Future RFF—Policy Brief 17–01; Wharton University of Pennsylvania: Philadelphia, PA, USA, 2017. [Google Scholar]


| No. | Path/Row | Data Set | Acquisition Data | Cloud Cover |
|---|---|---|---|---|
| 1 | 127/045 | Landsat 5 TM C1 Level 1 | 08/05/2007 | 7% |
| 2 | 127/045 | Landsat 8 OLI/TIRS C1 Level 1 | 01/06/2016 | 13% |
| Designation | Value |
|---|---|
| pr1 | −5.721 |
| pr2 | 4.367 |
| R2 | 0.948 |
| No | Flood Measures | Residential (Percentage %) | Non-Residential (Percentage %) |
|---|---|---|---|
| 1 | Construction of structural/hard measures | 18 | 13 |
| 2 | Improvement of drainage system | 54 | 44 |
| 3 | Evacuation plan | 0.5 | 6 |
| 4 | Updated flood information | 18.5 | 25 |
| 5 | NGO/people contribution | 6.8 | 7 |
| 6 | Disaster training/education | 1.8 | 4 |
| 7 | Disaster insurance | 1 | 1 |
© 2018 by the authors. Licensee MDPI, Basel, Switzerland. This article is an open access article distributed under the terms and conditions of the Creative Commons Attribution (CC BY) license (http://creativecommons.org/licenses/by/4.0/).
Share and Cite
Kefi, M.; Mishra, B.K.; Kumar, P.; Masago, Y.; Fukushi, K. Assessment of Tangible Direct Flood Damage Using a Spatial Analysis Approach under the Effects of Climate Change: Case Study in an Urban Watershed in Hanoi, Vietnam. ISPRS Int. J. Geo-Inf. 2018, 7, 29. https://doi.org/10.3390/ijgi7010029
Kefi M, Mishra BK, Kumar P, Masago Y, Fukushi K. Assessment of Tangible Direct Flood Damage Using a Spatial Analysis Approach under the Effects of Climate Change: Case Study in an Urban Watershed in Hanoi, Vietnam. ISPRS International Journal of Geo-Information. 2018; 7(1):29. https://doi.org/10.3390/ijgi7010029
Chicago/Turabian StyleKefi, Mohamed, Binaya Kumar Mishra, Pankaj Kumar, Yoshifumi Masago, and Kensuke Fukushi. 2018. "Assessment of Tangible Direct Flood Damage Using a Spatial Analysis Approach under the Effects of Climate Change: Case Study in an Urban Watershed in Hanoi, Vietnam" ISPRS International Journal of Geo-Information 7, no. 1: 29. https://doi.org/10.3390/ijgi7010029
APA StyleKefi, M., Mishra, B. K., Kumar, P., Masago, Y., & Fukushi, K. (2018). Assessment of Tangible Direct Flood Damage Using a Spatial Analysis Approach under the Effects of Climate Change: Case Study in an Urban Watershed in Hanoi, Vietnam. ISPRS International Journal of Geo-Information, 7(1), 29. https://doi.org/10.3390/ijgi7010029