3.1. Data
The Consejo General del Poder Judicial (General Council of the Judiciary, or CGPJ) and the Instituto Nacional de Estadística (National Institute of Statistics, or INE) are the only organizations that provide official data on the geographic distribution of mortgage foreclosures and evictions in Spain. Data from CGPJ have been available to the general public since 2009 and are aggregated by judicial district, of which there are 431 across the whole country, with almost all of these supra-municipal). INE has published aggregated data on the number of evictions and mortgage foreclosures for each of Spain’s 51 provinces since 2014. Neither data source allows the disaggregation of data at the city, neighborhood, district, or census tract level. As a result, these data sources do not serve the requirements of the present study. This is a relevant deficit because evictions, like any other socioeconomic phenomenon, should be analyzed with respect to their territorial patterns. To overcome the limited scale of analysis permitted by the available official data, we use alternative (non-official), secondary data sources. More precisely, we use information about housing units in the hands of financial entities (housing units owned by banks, or HOBs) as a proxy for evictions associated with mortgage foreclosures. This stock comprises housing acquired by banks via mortgage foreclosures that resulted in the eviction of the former residents.
The rapid growth in the number of foreclosures in Spain as a result of the mortgage crisis means that banks have emerged as the largest property owners. As a result, Spain’s main banks have created specialized property subsidiaries to manage and sell their property assets. This strategy was also a consequence of banks’ objective to transfer toxic assets to other companies and belongs to the wider financial strategy of sanitizing the Spanish banking sector. This, in itself, forms part of a wider framework aimed at rescuing the Spanish banking sector, which is governed by the agreement contained in the Memorandum of Understanding signed with the European Commission in 2012. These property subsidiaries use their respective web pages to promote and sell the housing stock that banks accumulated as a result of mortgage foreclosures. The web page of each property company contains a list of all the housing stock available for sale. Moreover, an extensive list of individual advertisements provides highly detailed information that includes the specific characteristics of each property.
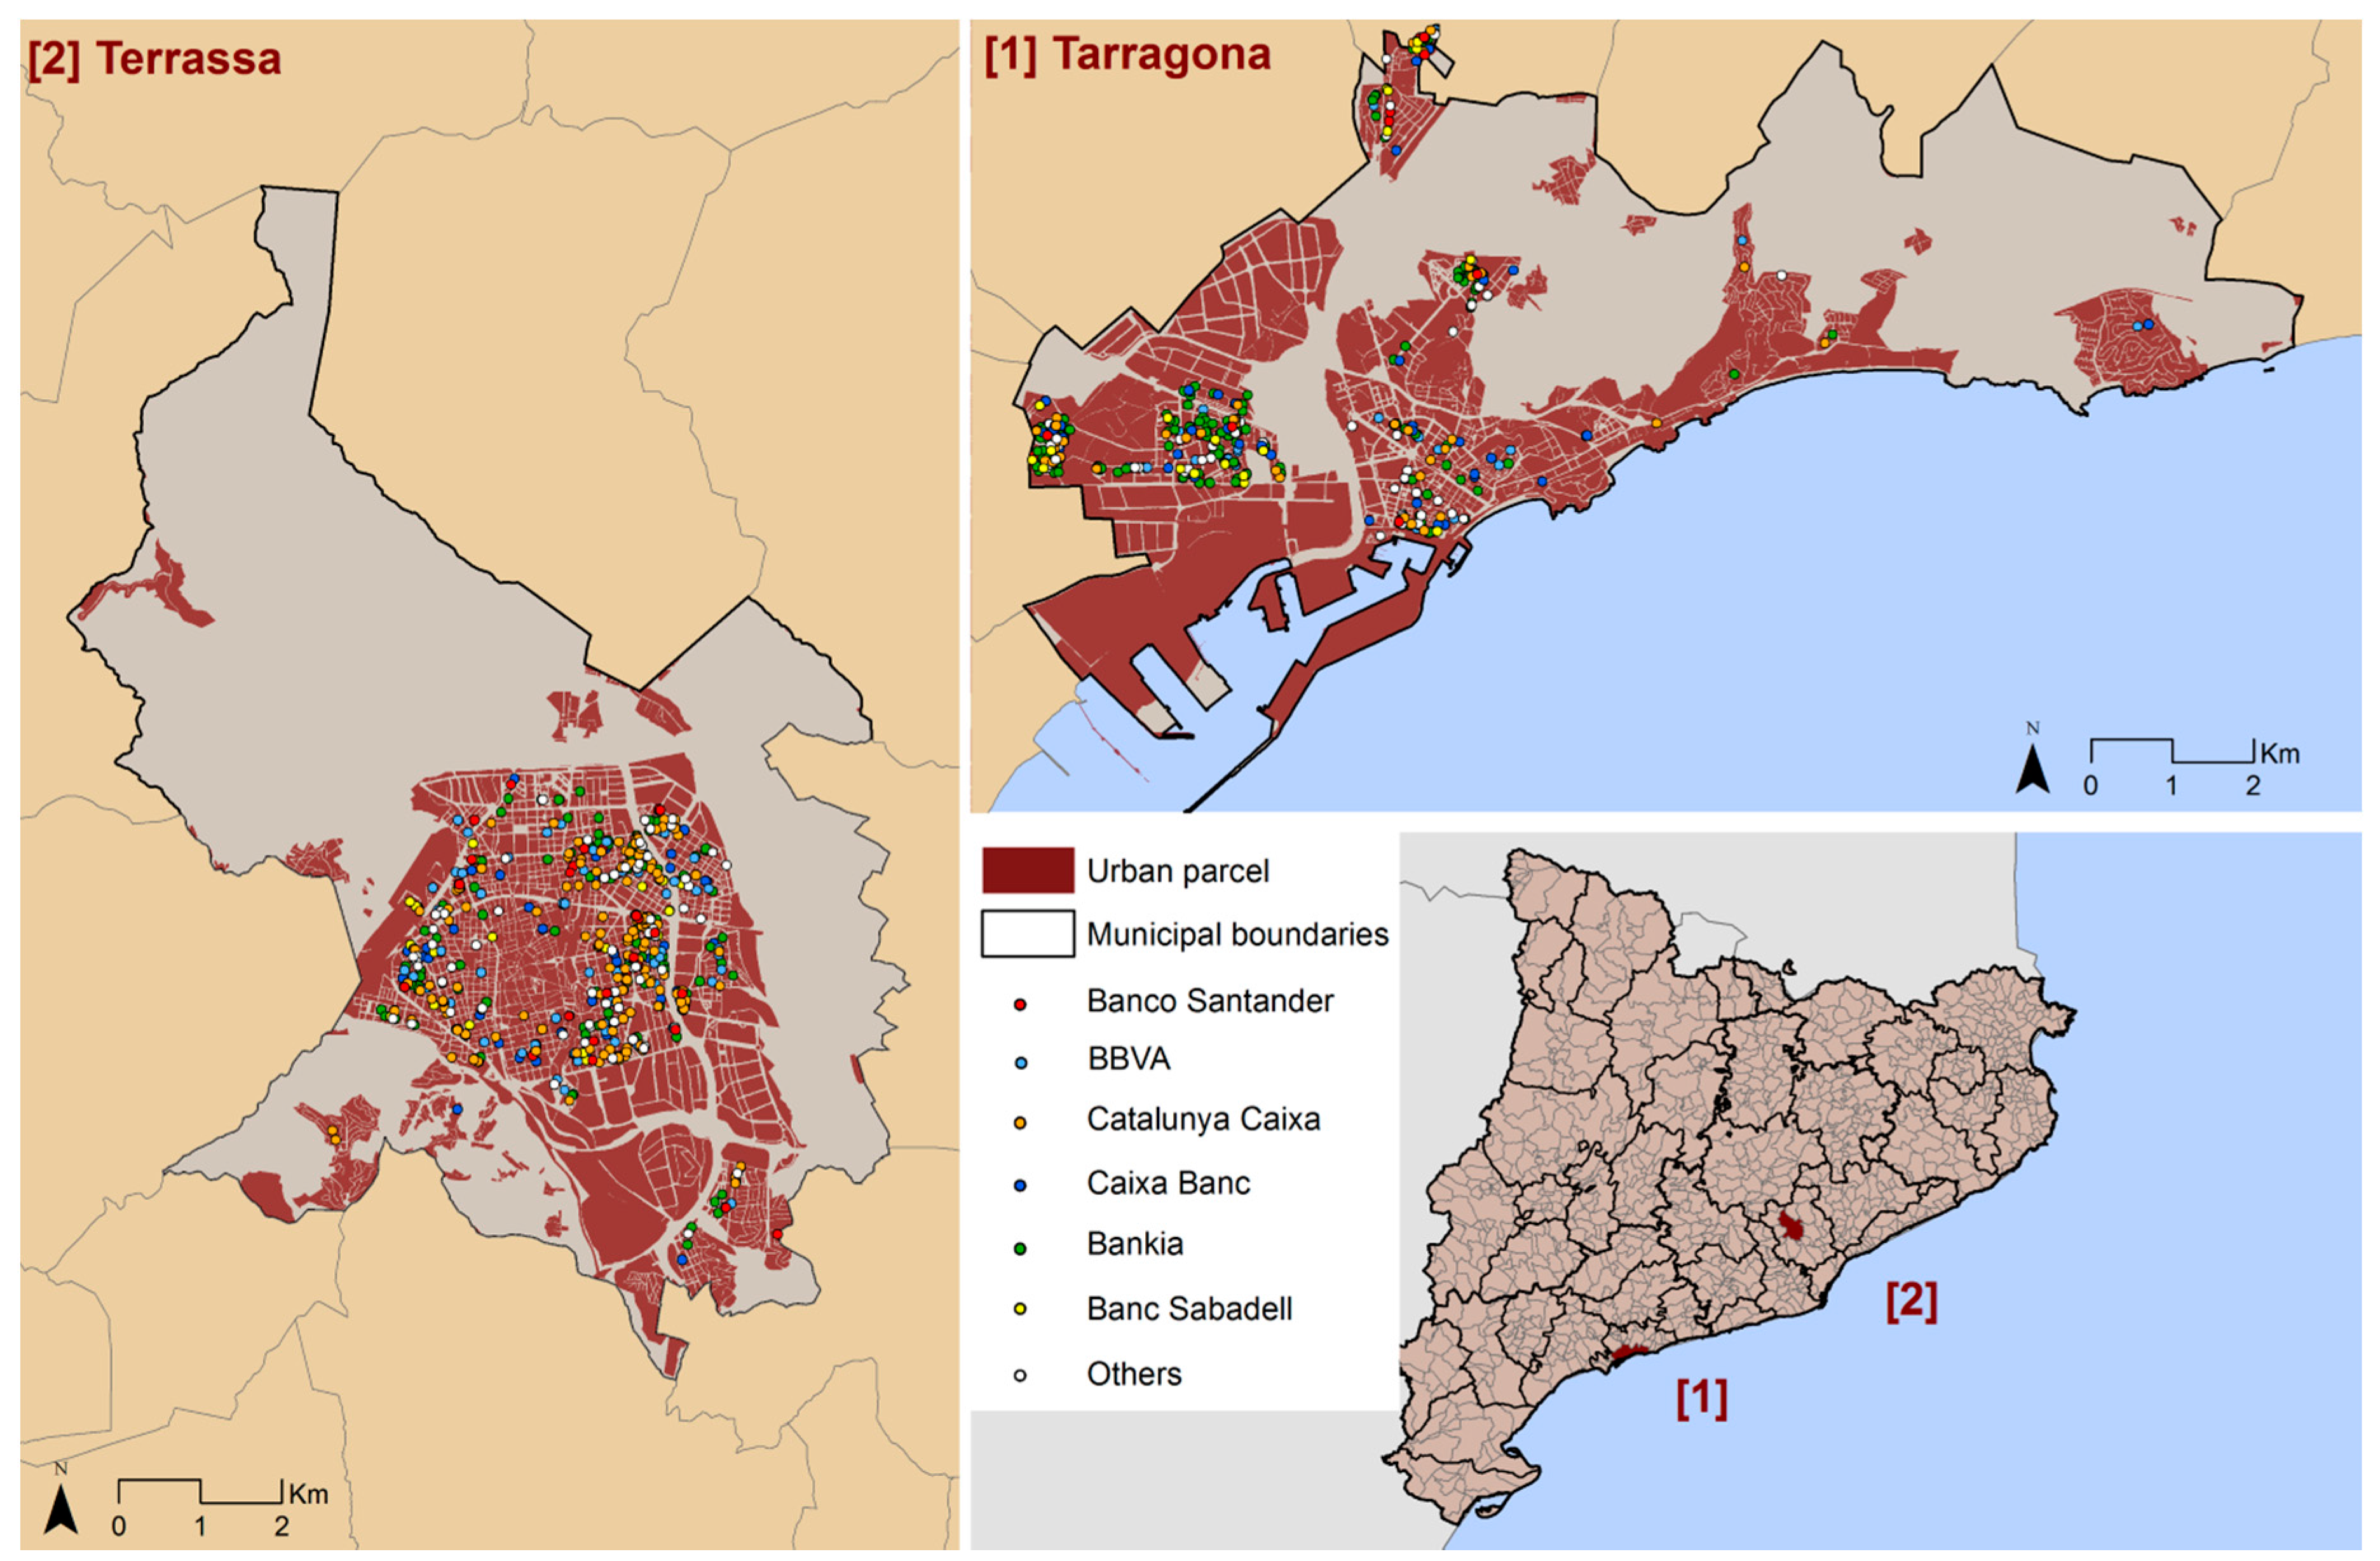
We obtained the data used in this study by systematically collecting relevant information from the websites of property subsidiaries belonging to the 17 most important financial entities in Catalonia (CaixaBank, Bankia, Banco Santander, Banc Sabadell, BBVA, CatalunyaCaixa, NovaGalicia, Banco Popular, Grupo BMN, Banesto, IberCaja, Barclay’s, Bankinter, CajaMar-CajaRural, Kutxa-Bank, Deutsche Bank, and BNP Paribas). We carried out this operation between February and May 2014. We identified 471 HOBs in the city of Tarragona and 594 in Terrassa. Following this procedure, we created a database in which each item (each HOB) was listed with information about its location (full postal address) and main characteristics (e.g., year of construction, surface area, number of rooms, market price, and the bank that owned it). We obtained these data from the individual advertisements for properties for sale via the property subsidiaries’ webpages. It is important to underline that this information was not readily available from any other direct or indirect source. Moreover, while the data were collected during four months in 2014, this does not imply that they cover only this period. The dataset includes all the housing units accumulated by these 17 banks (and on sale on the web) during the mortgage crisis through June 2014. Finally, using this source, we produced a geolocated record of HOBs associated with the database of individual characteristics (see
Figure 1 for the spatial distribution of HOBs for each case study).
As we built this database using secondary sources, it is necessary to mention some of the limitations of these sources. We must firstly underline the fact that the database includes housing offered for both sale and rent by financial entities, as well as different types of housing: flats, apartments, and single-family detached houses. Secondly, it should be made clear that no new housing stock offered for either sale or rent by financial entities was considered in this study. This is because such housing would not have been associated with eviction processes, as it would never have been occupied. New housing that was never sold would have ended up in the hands of the bank as a result of the inability of builders and promoters to return credit obtained from banks. This was a recurrent problem following the bursting of the Spanish property bubble in 2007; when the property market collapsed, the number of property development companies that went bankrupt soared. Thus, used housing stock owned by banks corresponds to housing previously occupied by evicted families, while new housing stock refers to blocks of empty housing, which have proliferated on urban peripheries as a consequence of the apparent overproduction of housing during the property boom. These two very different scenarios had to be addressed in a disaggregated way. The current study is focused on used housing units from which former residents were evicted as a result of mortgage foreclosures. Accordingly, new empty housing units were excluded.
Finally, it is necessary to underline two of the particularities of the database. Firstly, our source provided data focused on evictions due to mortgage foreclosures, but did not provide data about evictions resulting from the non-payment of rent. For this reason, the research objectives of this study are centered on evictions specifically related to the mortgage crisis. Secondly, these data do not cover all the evictions associated with mortgage foreclosures that were carried out in a given city, nor do they include all of those carried out within a specific period. Instead, as mentioned previously, they reflect the total accumulated stock of foreclosed properties held by the main banks as of June 2014. Given all of these conditional factors, we were unable to determine the total number of mortgage foreclosures and evictions in Tarragona and Terrassa from our source. However, we were able to identify the main characteristics of foreclosed housing and spatial distribution patterns based on a highly representative sample. Thus, our HOB sample corresponds to between 25% and 30% of the total number of mortgage foreclosures officially reported by the CGPJ during the 2008–2015 period in both cities.
In addition to this dataset, we used data from the 2011 Spanish population and housing census. This source was used to calculate the ratios of HOBs per 1000 inhabitants or 1000 housing units in the study area. These ratios allowed a comparative analysis between neighborhoods and cities. Moreover, census data were used to describe the socioeconomic profile of each study area (both whole cities and neighborhoods).
3.2. Study Area
We chose two medium-sized Catalan cities as case studies: Tarragona (population of 132,000 in 2014) and Terrassa (population of 215,000 in 2014). The housing units were first identified, characterized, and geolocated using the previously mentioned sources. A total of 471 HOBs were recorded in Tarragona and 594 in Terrassa. Their spatial distribution is shown in
Figure 1.
These selected case studies allowed us to analyze two different urban and territorial realities. Terrassa is one of the largest cities in the metropolitan area of Barcelona and is characterized by its compact urban structure and high population density. In contrast, Tarragona is the capital of the second largest urban region in Catalonia and has a fragmented urban structure characterized by clear discontinuities between the city center and its peripheral neighborhoods.
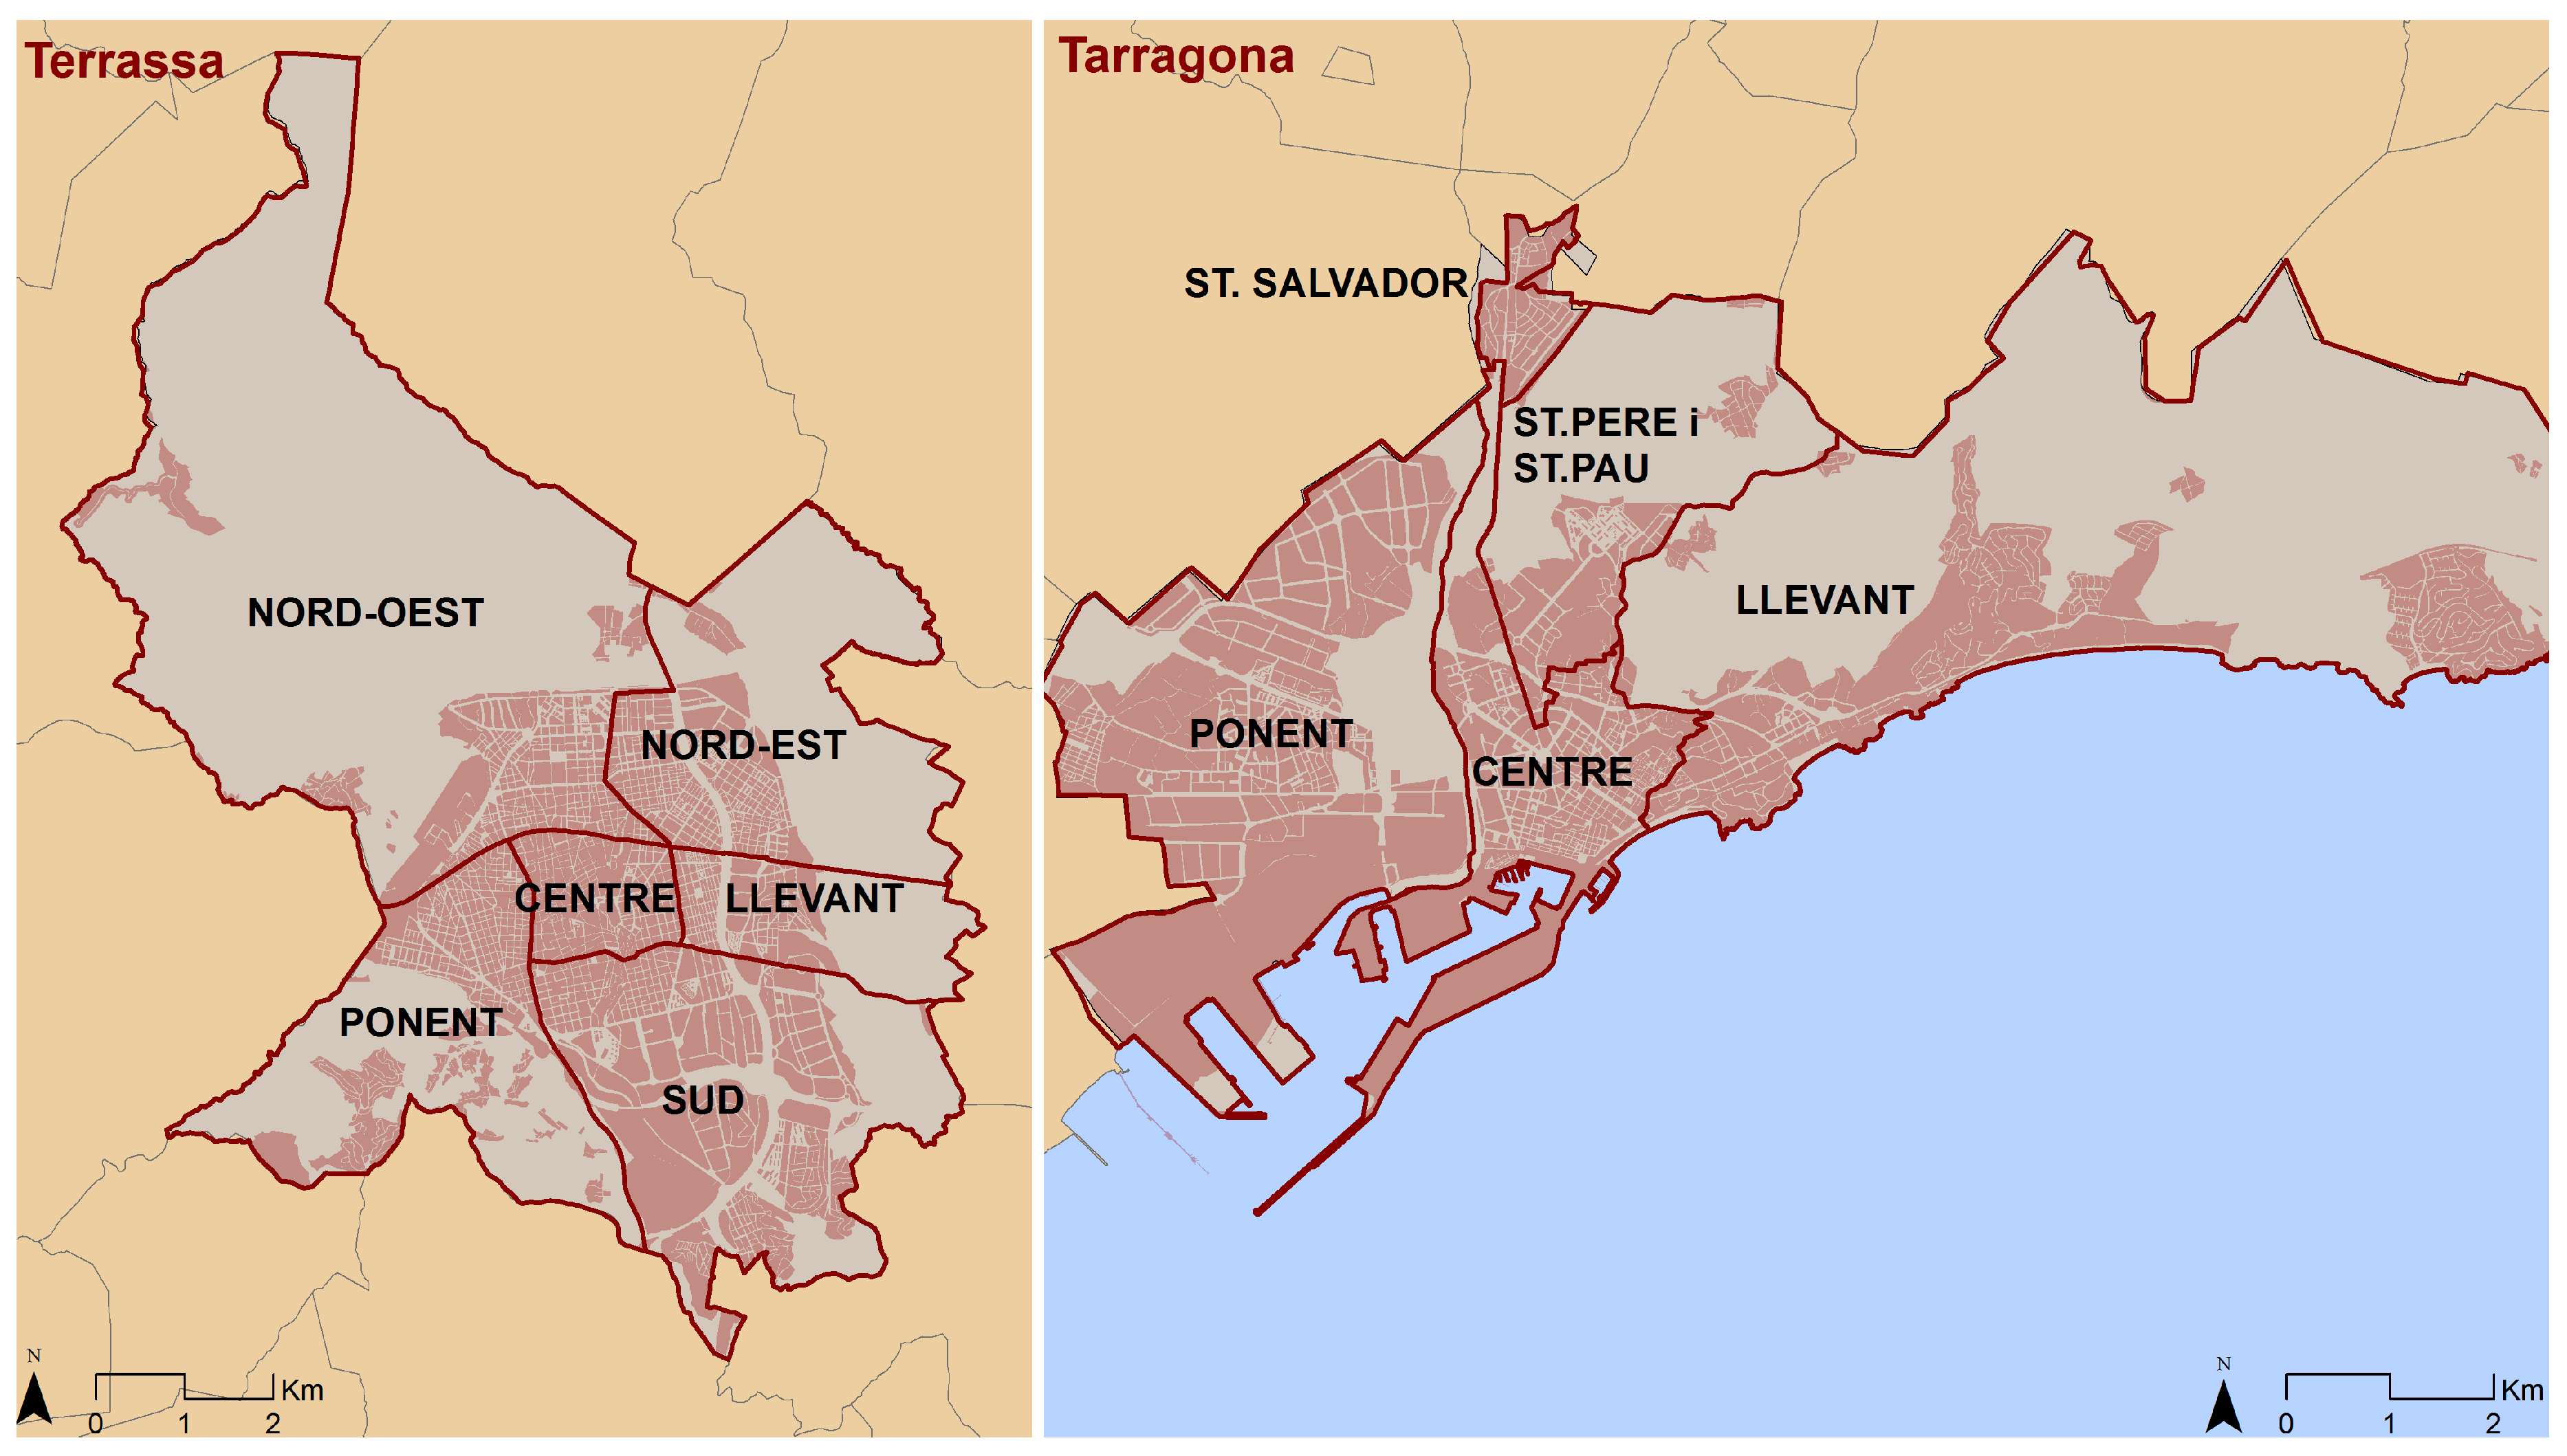
The neighborhood was used as the basic territorial level at which all the relevant calculations and derived spatial analysis were conducted. Based on local council definitions, Tarragona has five neighborhoods and Terrassa has six. These were used as the main units for our spatial analysis. As shown in
Figure 2, based on these divisions we conducted a disaggregated analysis for the city centers, their immediate surrounding areas, and (in the case of Tarragona) their peripheral neighborhoods. We then calculated the spatial patterns of HOBs at the infra-municipal scale.
3.3. Methods
We used a point pattern approach to check whether evictions resulting from foreclosures tend to cluster in certain parts of the cities, or—on the contrary—whether they are randomly spread across the whole urban area [
57]. Point pattern analyses have been applied to a large variety of events, including the location of diseases [
58], the location of particular tree species [
59], property prices [
60], and the location of companies [
61]. They may also be used for the analysis of any other georeferenced (point) event. To perform the point pattern analysis, we first geolocated and identified each HOB as a single point. More specifically, we were interested in analyzing whether there was any evidence of clustering in the spatial pattern of evictions. Our assumption is that if these distances between HOBs were shorter than those predicted for a random distribution (i.e., if all the evictions were randomly distributed across the whole city), then these evictions could be regarded as clustered. To do this, we carried out a Nearest-Neighbor Index (NNI) analysis and computed the Ripley’s K(d) function.
The NNI compares the mean value of the observed distance between each reference point (in this case, each eviction site) and its nearest neighbor with the expected mean distance assuming a random distribution. It can be expressed as:
Here, the observed average distance and expected average distance can be computed as follows:
where
d is the distance,
n is the number of neighboring links, and
A is the total area of the region considered. It is important to note that this index is sensitive to the definition of the area of study. It is, thus, normal to expect larger areas to be associated with longer distances. Nevertheless, we can (at least partially) control for this by computing
A as the minimum area that would include all the existing points (i.e., those representing evictions due to foreclosures). The same procedure was followed using both NNI and Ripley’s K.
Accordingly, NNI values close to 0 indicate a clustered pattern (as the observed distances are shorter than expected and HOBs are closer to each other), values close to 1 indicate a random pattern (as the observed distances are quite similar to those expected) and values of around 2.149 indicate a dispersed pattern (as the observed distances are longer than expected).
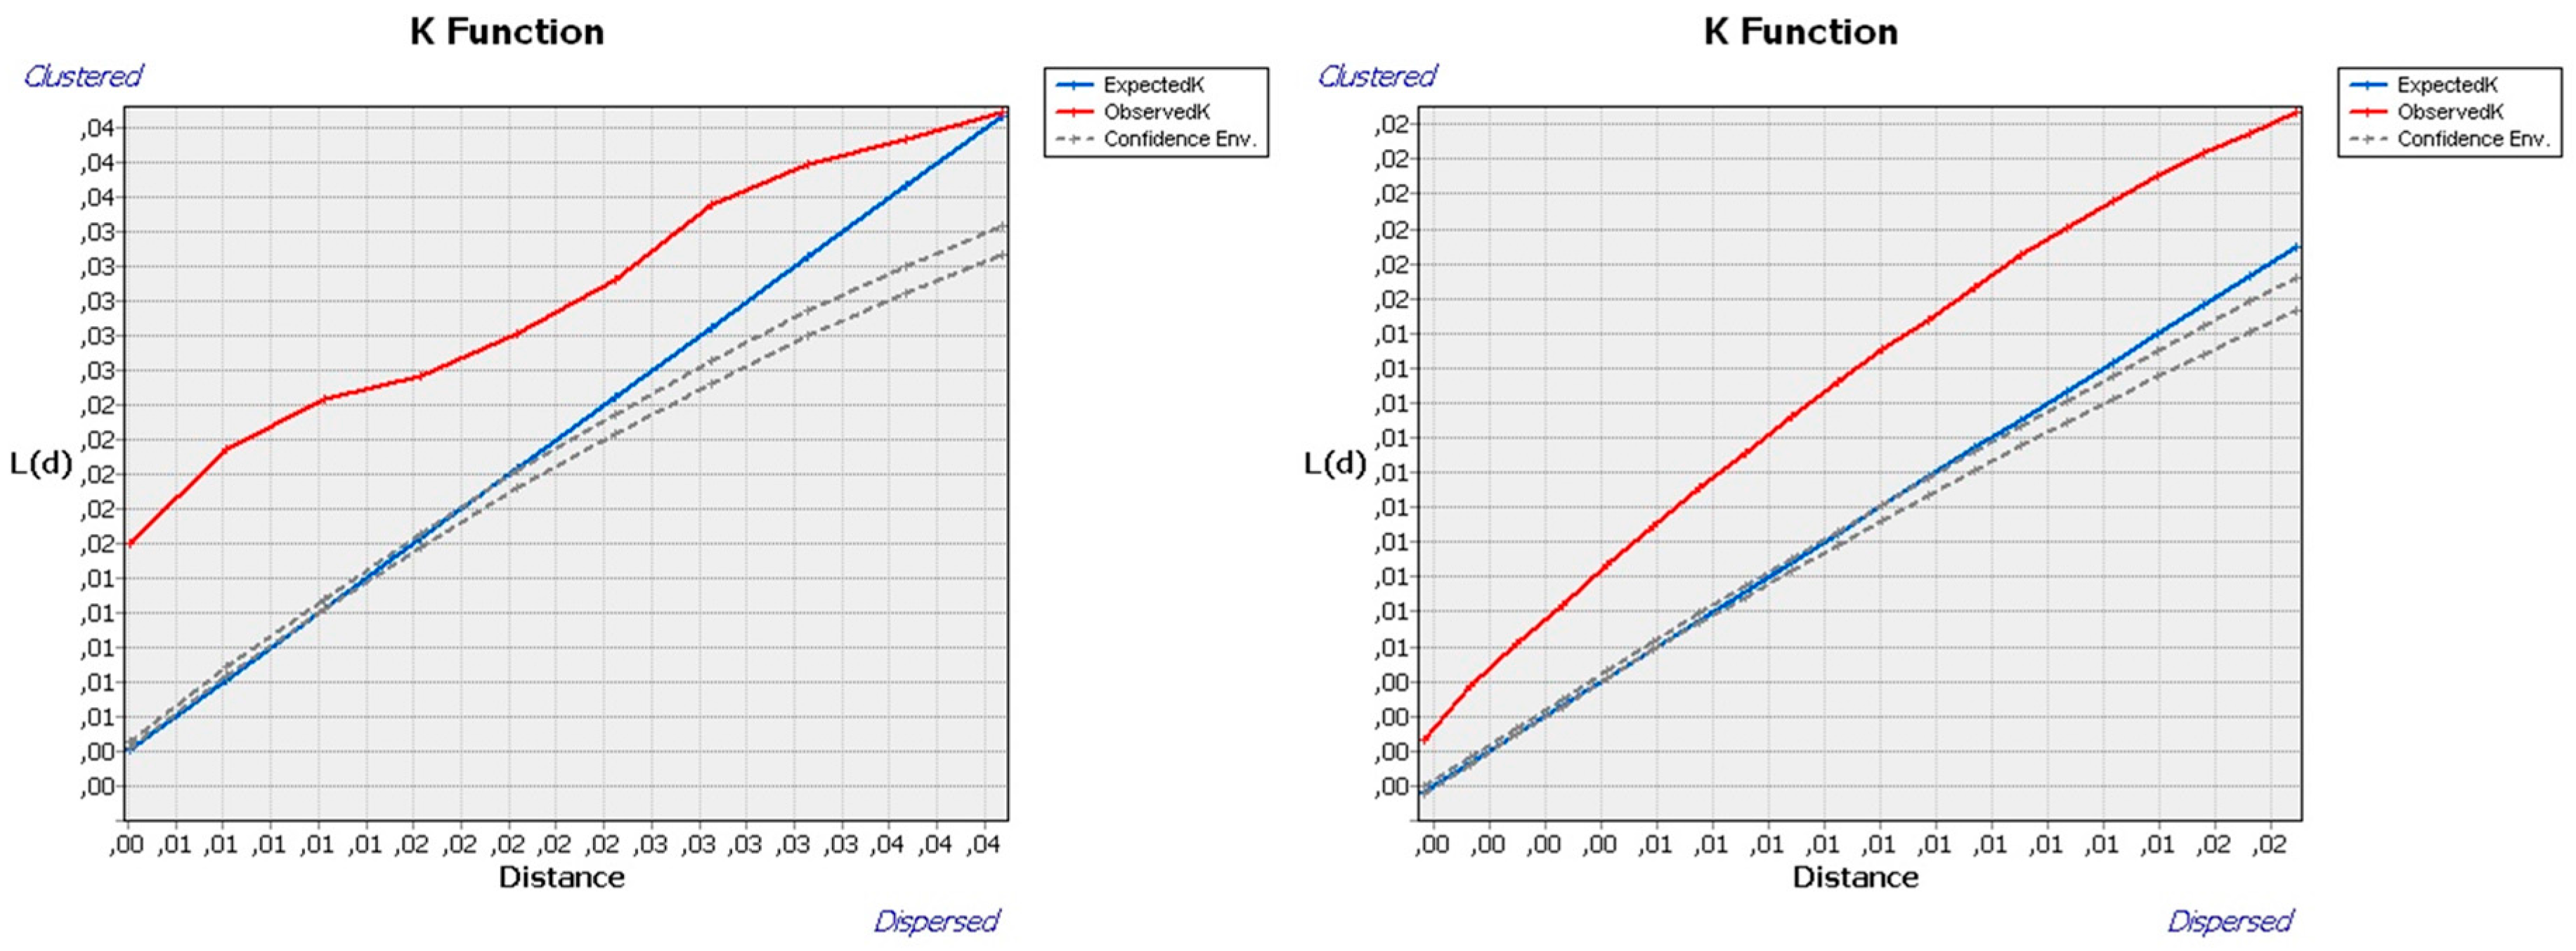
Ripley’s K function [
62] computes the density of any set of points (in this case HOBs) for a particular radius (i.e., distance) around each reference point and is used to establish whether there is evidence of clustering within a certain distance. More specifically, distance radii are calculated around every point, with
K(
d) being the mean density of points for each radius distance (
d) divided by the mean density of points (
n) in the whole area (
a):
n/
a. The interpretation of Ripley’s K is quite similar to that of NNI as the expected random values are compared with the observed values. If the observed values (i.e., the density of points) exceed the expected values, there is a clustered pattern, whereas if the observed values are lower than the expected values, the result is a dispersed pattern.
It should be noted that both NNI and Ripley’s K help avoid the modifiable areal unit problem (MAUP) [
63]. As these functions treat space as continuous, without constraining data within administrative boundaries, they avoid statistical bias caused by using statistical data aggregated by territorial units. Their use is not, therefore, subject to the typical constraints associated with spatial aggregation. Even so, we did not neglect the administrative units as we also used data on evictions within the administrative boundaries of Tarragona and Terrassa. The methodology selected does not, therefore, represent a source of potential bias in our results.
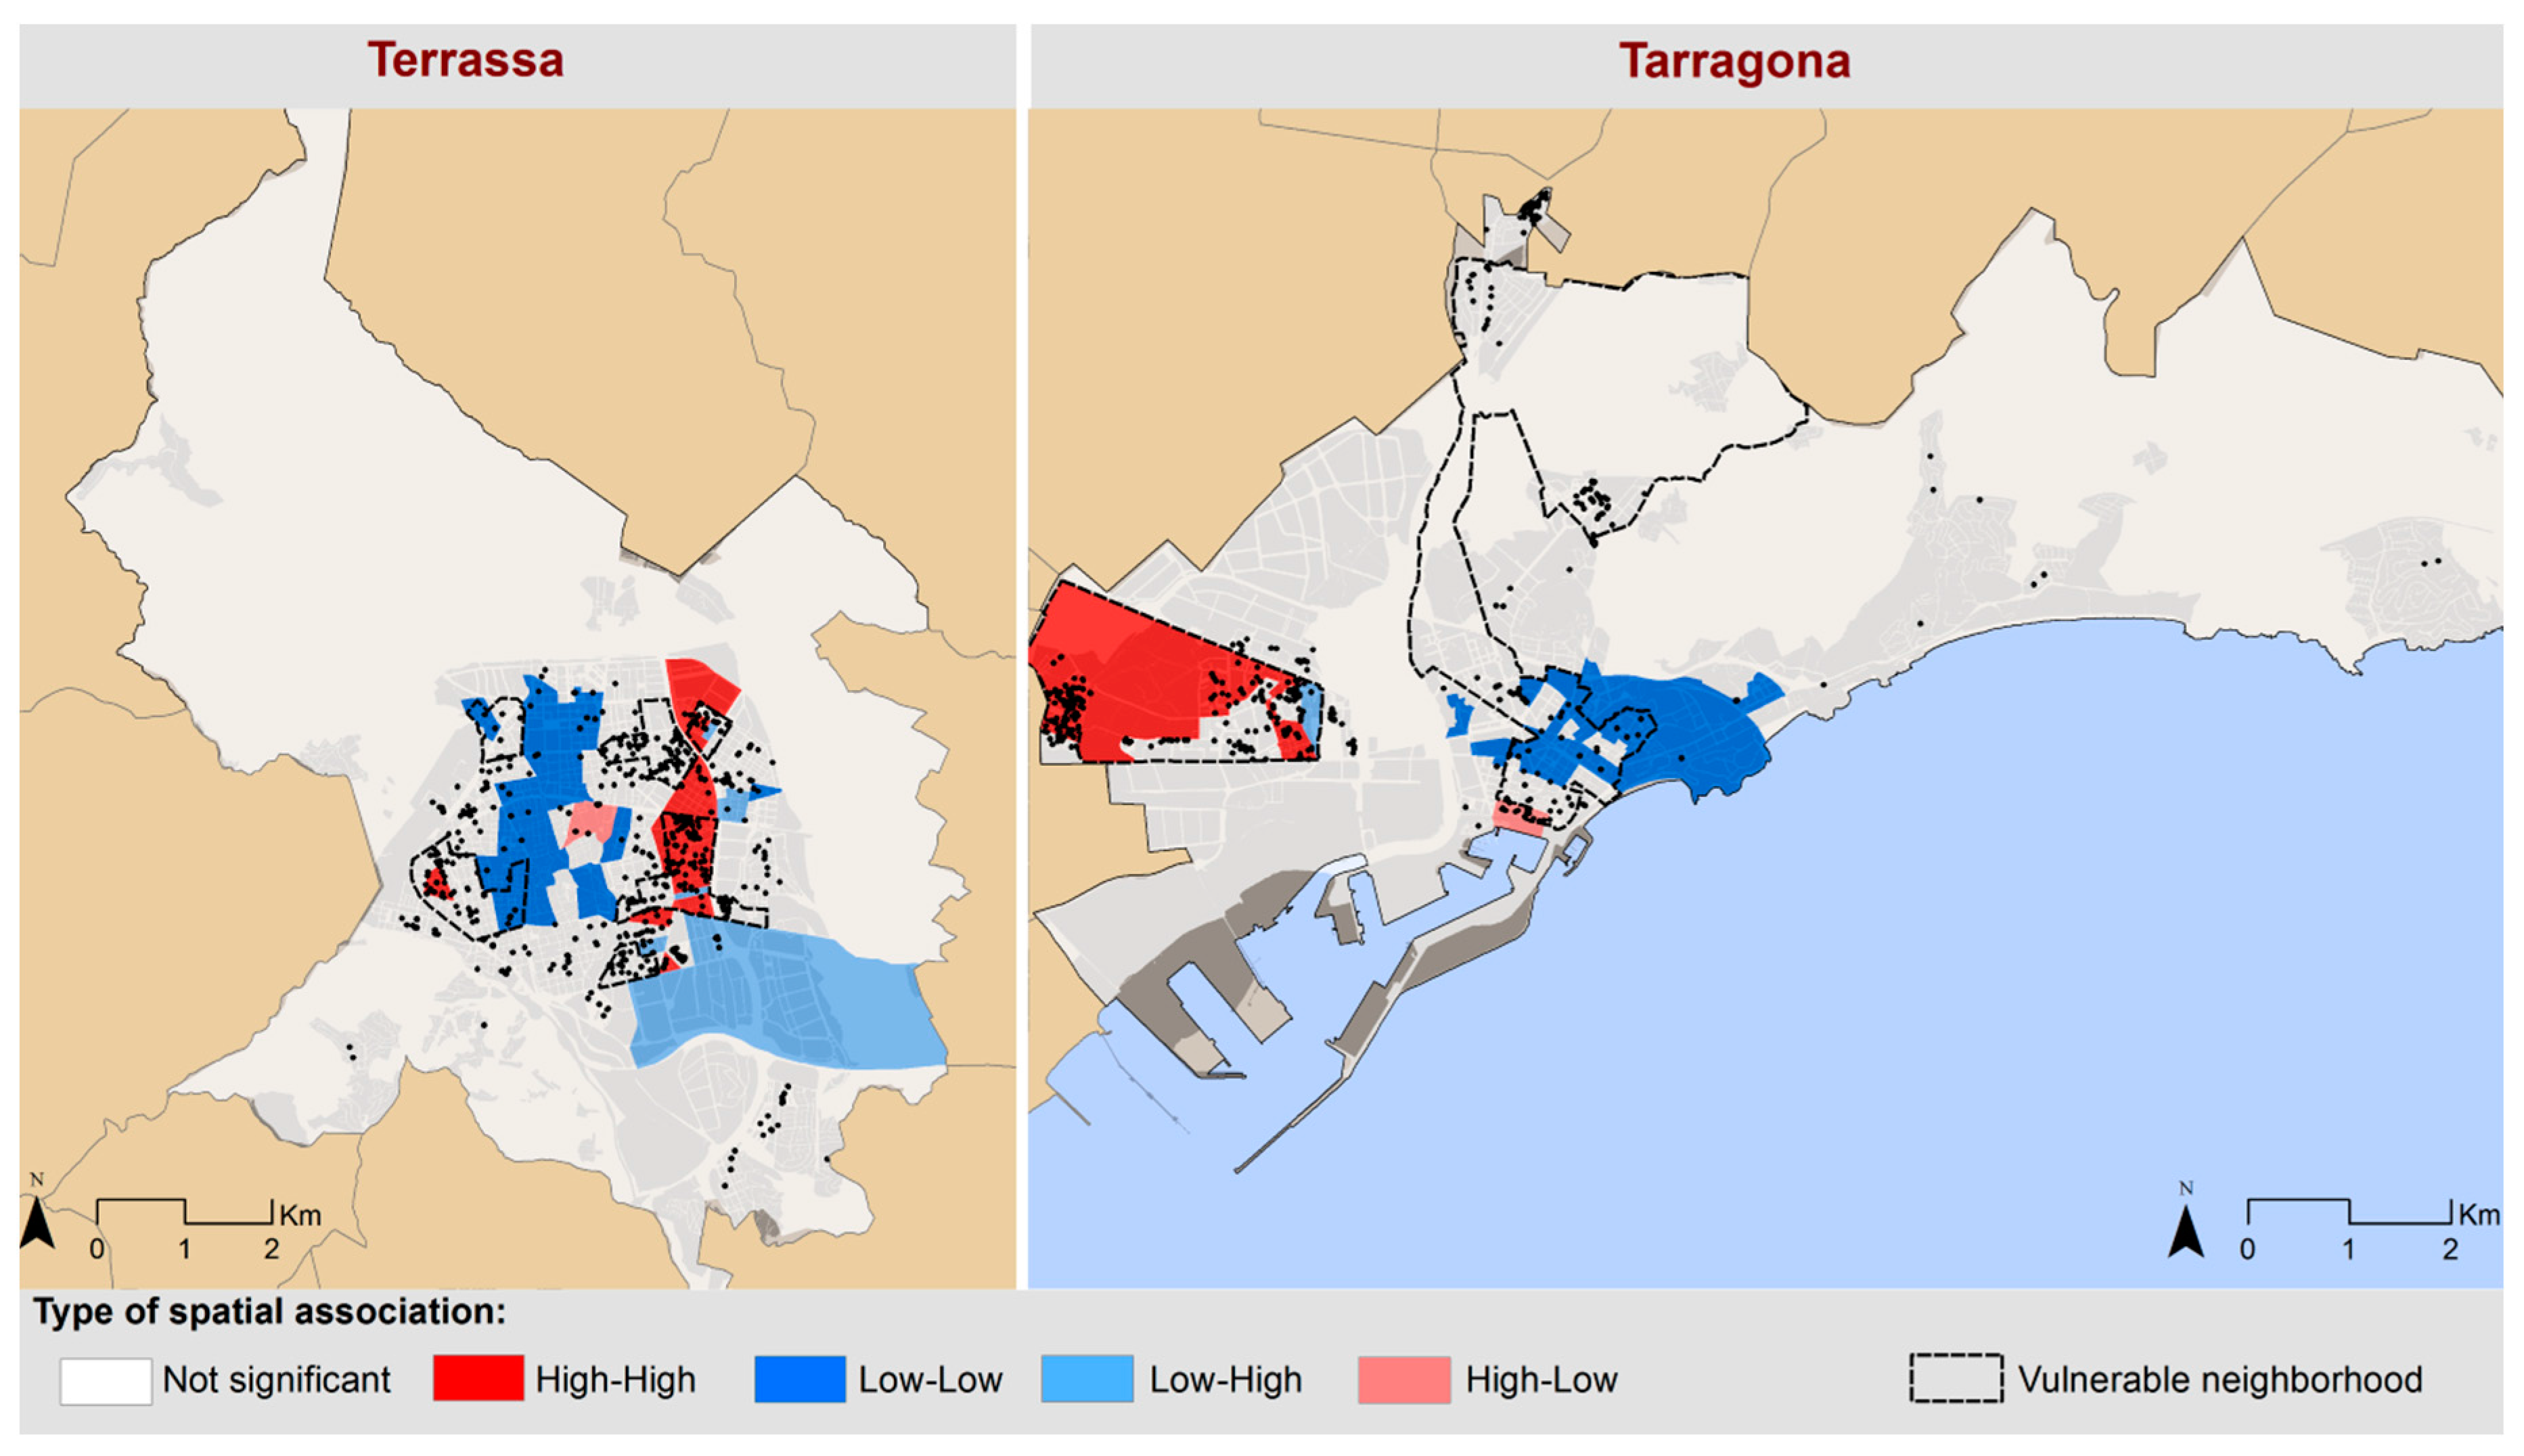
Once we identified global clustering patterns at the point level, we used the local version of the Moran’s I calculation to identify the spatial autocorrelation of HOBs [
64]. This is defined as:
where
N is the number of observations,
i and
j are spatial units, μ is the average of variable and:
Using Local Indicators of Spatial Association (LISA) maps, the Local Moran’s I indicator makes it possible to identify areas in which high and low values of a determined variable are concentrated. It also makes it possible to discard elements that are not statistically significant [
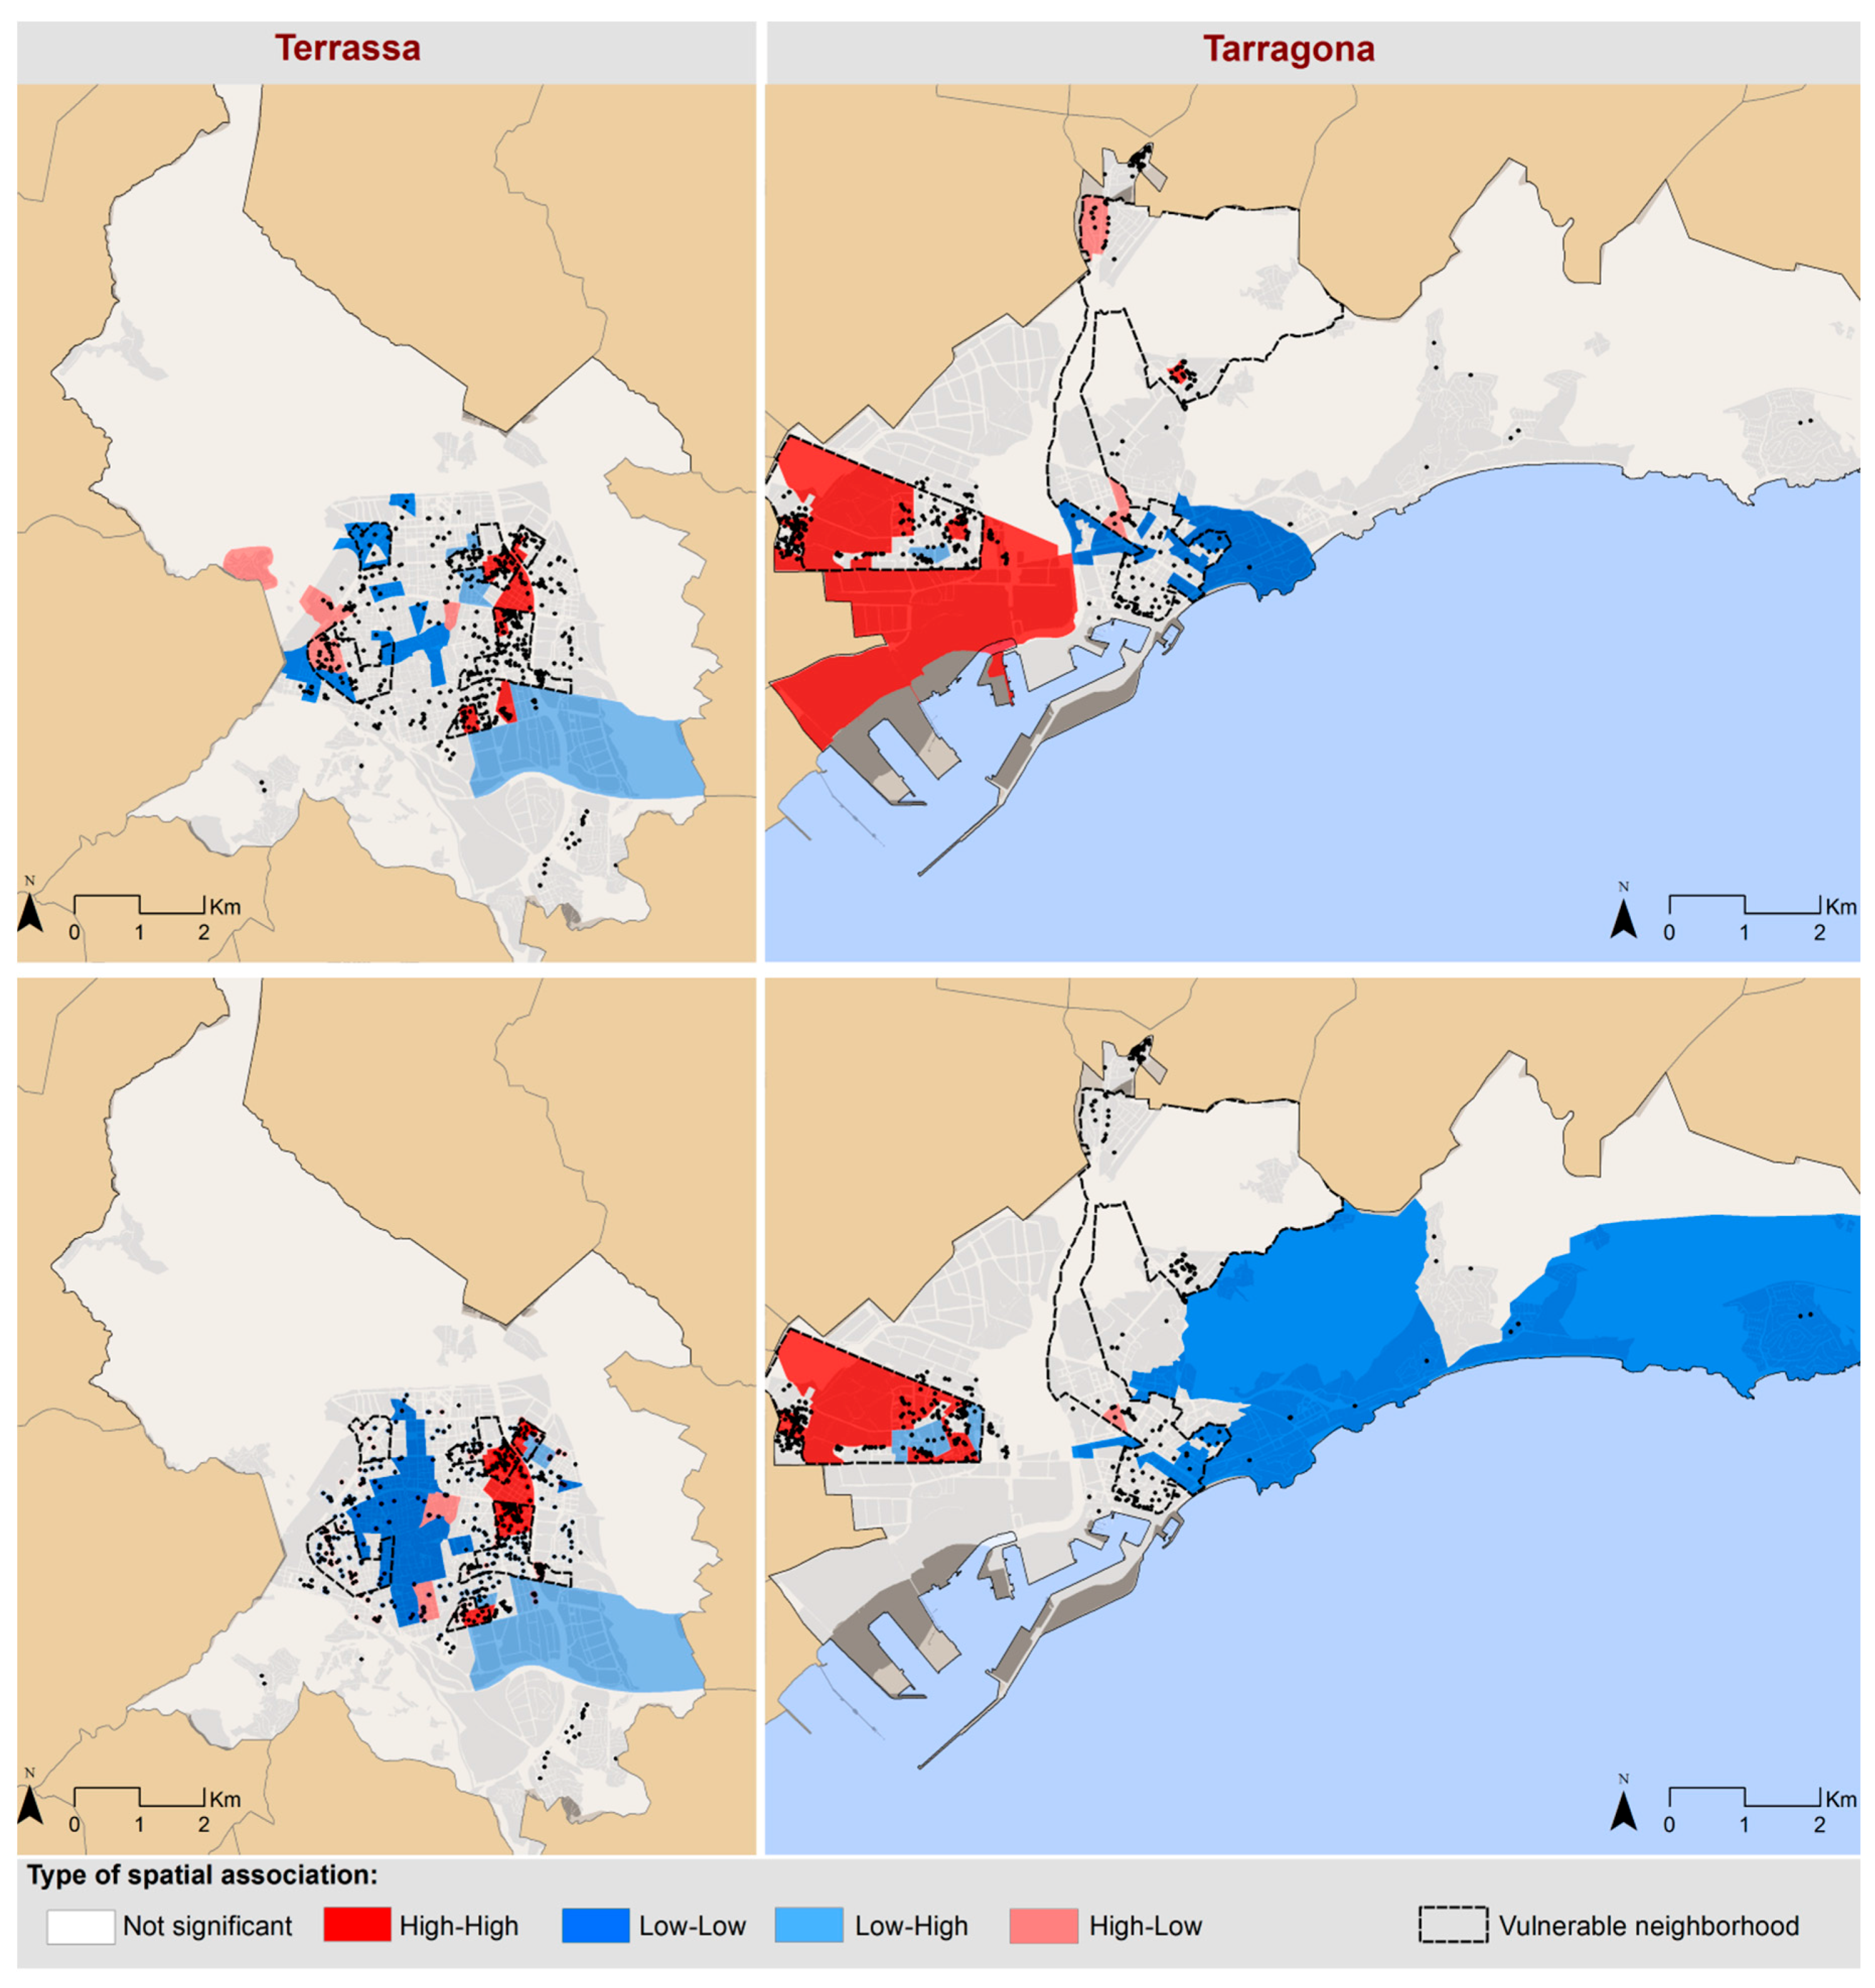
65]. We used the aggregation of HOBs by census tracts weighted for the total number of housing units in each census tract as the reference variable to establish the number of HOBs per 1000 housing units for each census tract in both cities. After defining the HOB clusters, the bivariate version of the Local Moran’s I allowed us to determine the spatial correlation of the HOB distribution with different socioeconomic indicators at the census tract level. The unemployment rate and the percentage of the resident population without primary education (data from the 2011 Spanish population census) were used as indicators of the socioeconomic vulnerability of each area.
With respect to the question of whether the results obtained from the three indicators can be interpreted together, it is important to note that while NNI considers only location of the nearest neighbor, Ripley’s K function computes information for all neighbors. In the case of Moran’s I, we used the different levels of point concentration by census tract and then census tracts as the unit of clustering analysis. These methods do not approach clustering in the same way and, thus, when combined, they can be used to proxy neighboring links among different points.


