
Modeling the Hourly Distribution of Population at a High Spatiotemporal Resolution Using Subway Smart Card Data: A Case Study in the Central Area of Beijing

Abstract
:1. Introduction
2. Data and Method
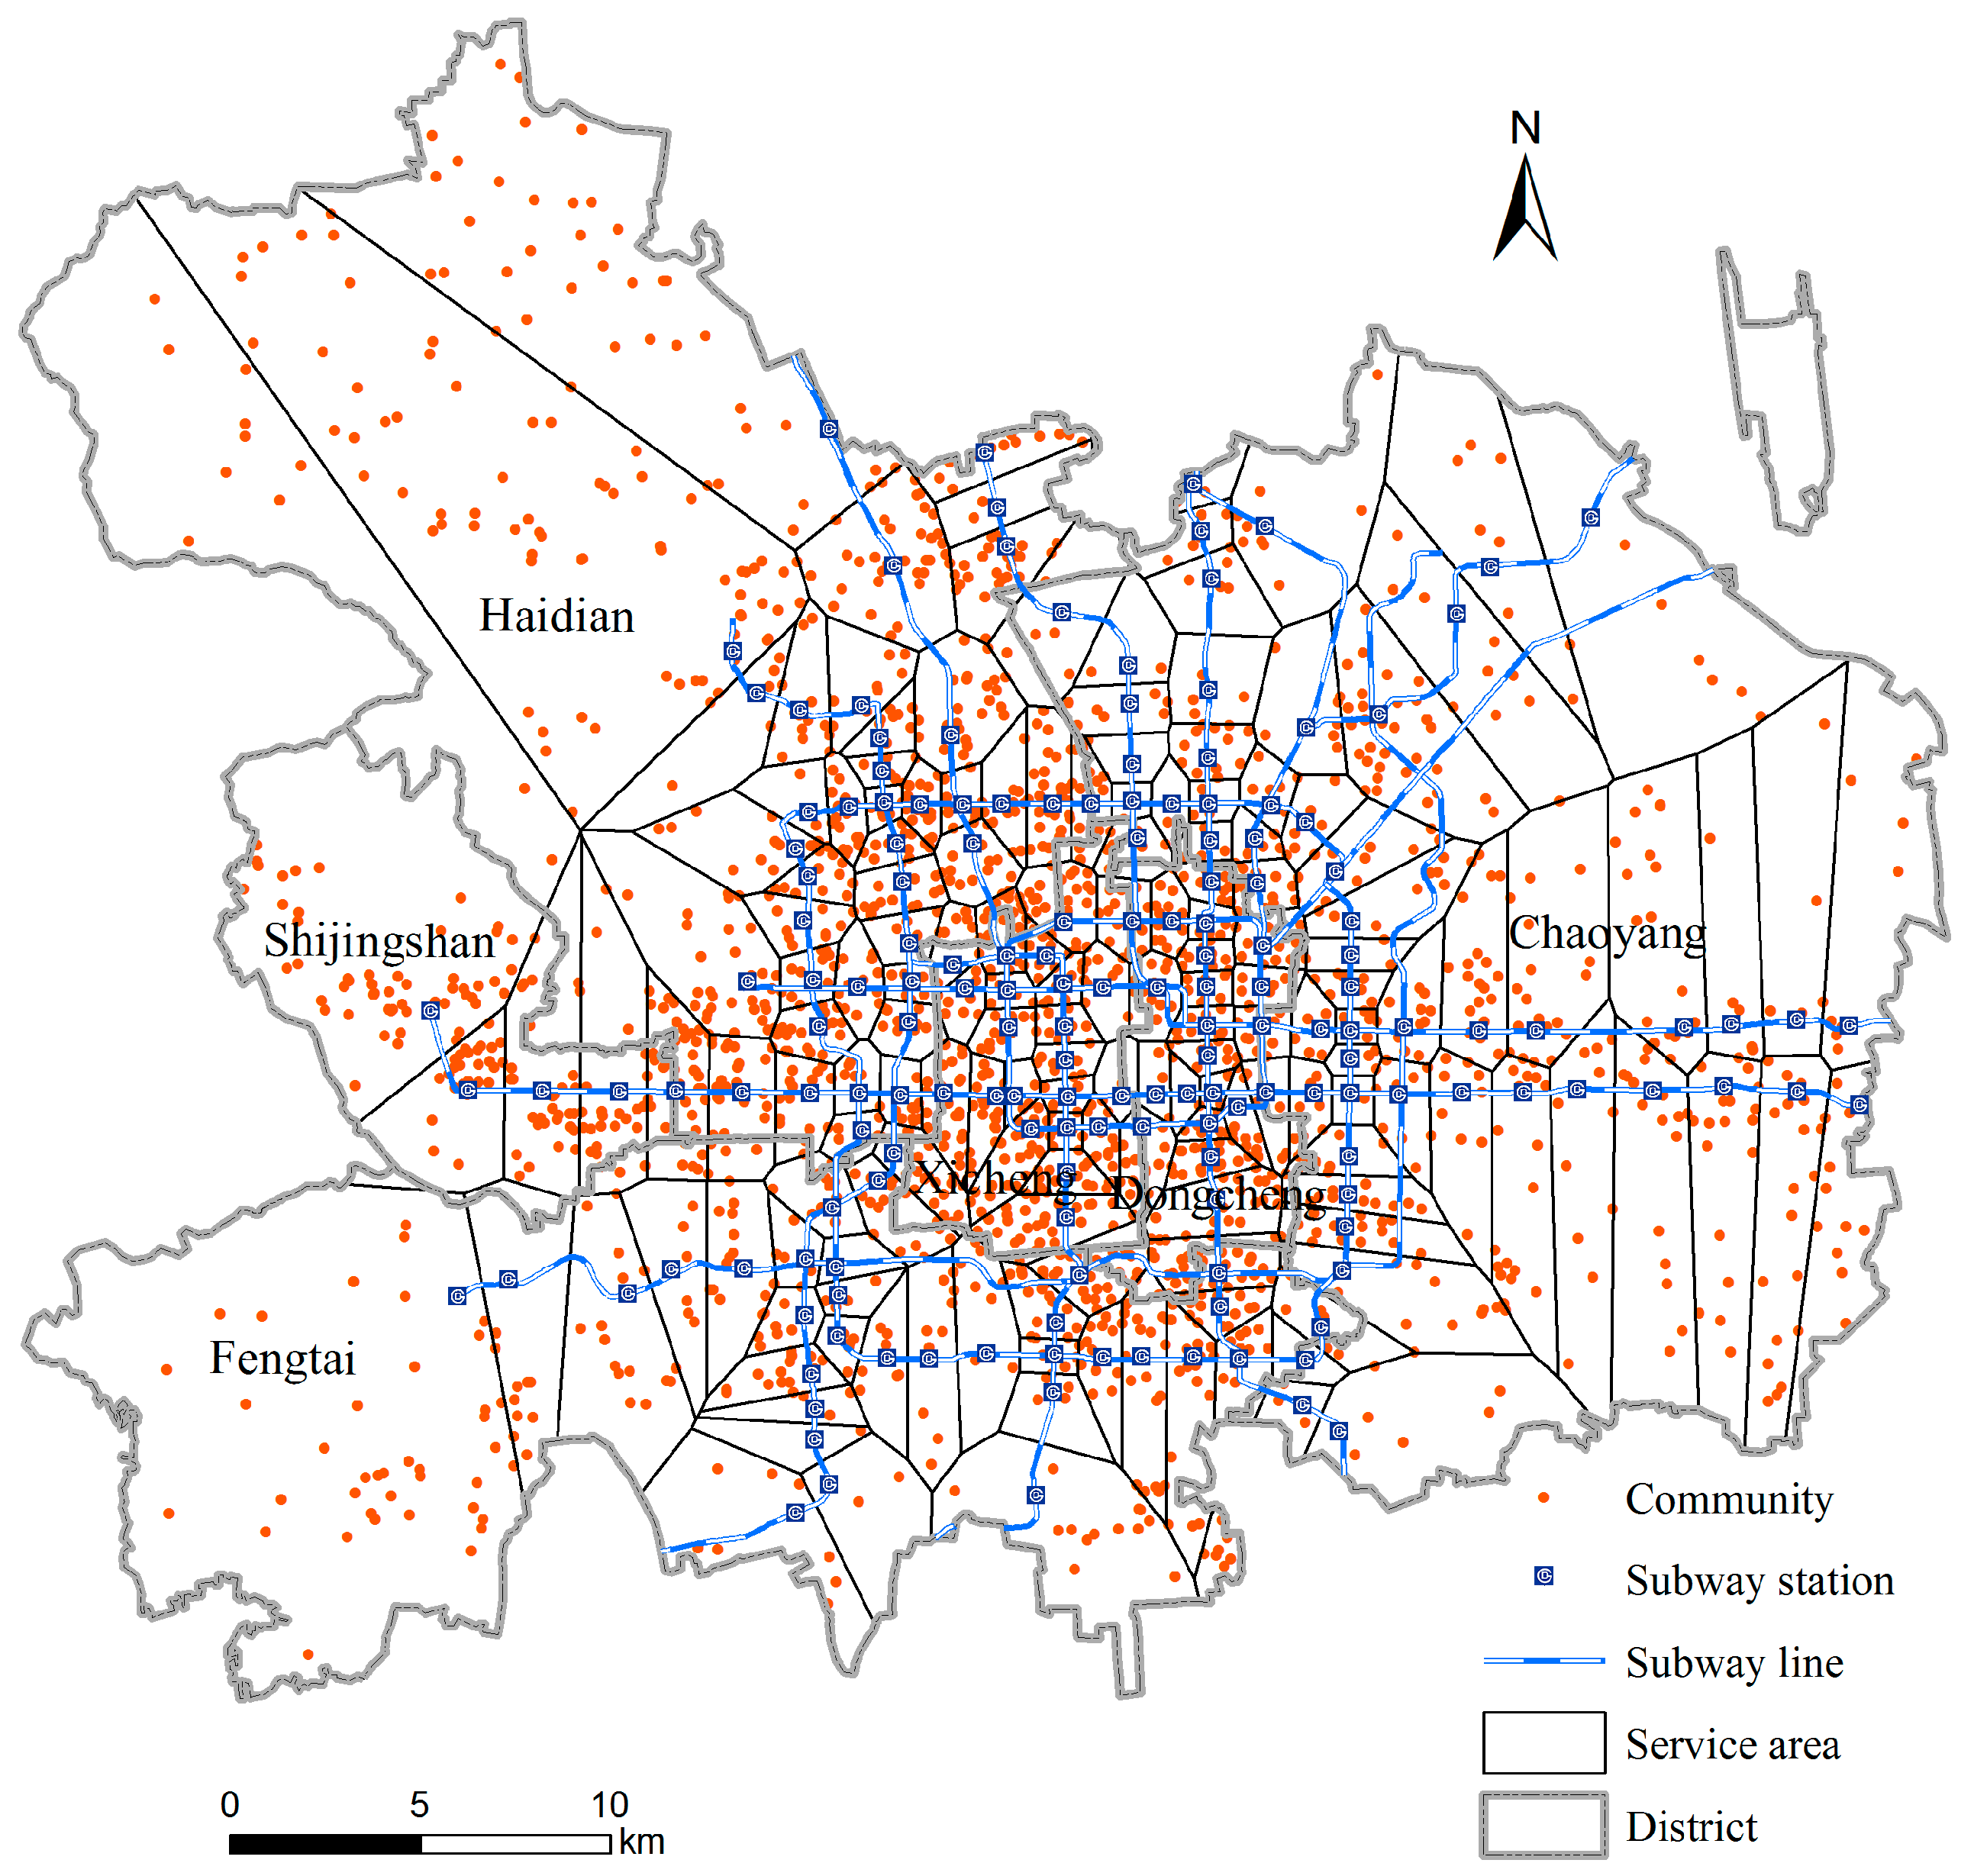
2.1. Study Area and Datasets
2.2. Method
Dynamic Daytime Population Estimation Model
3. Results
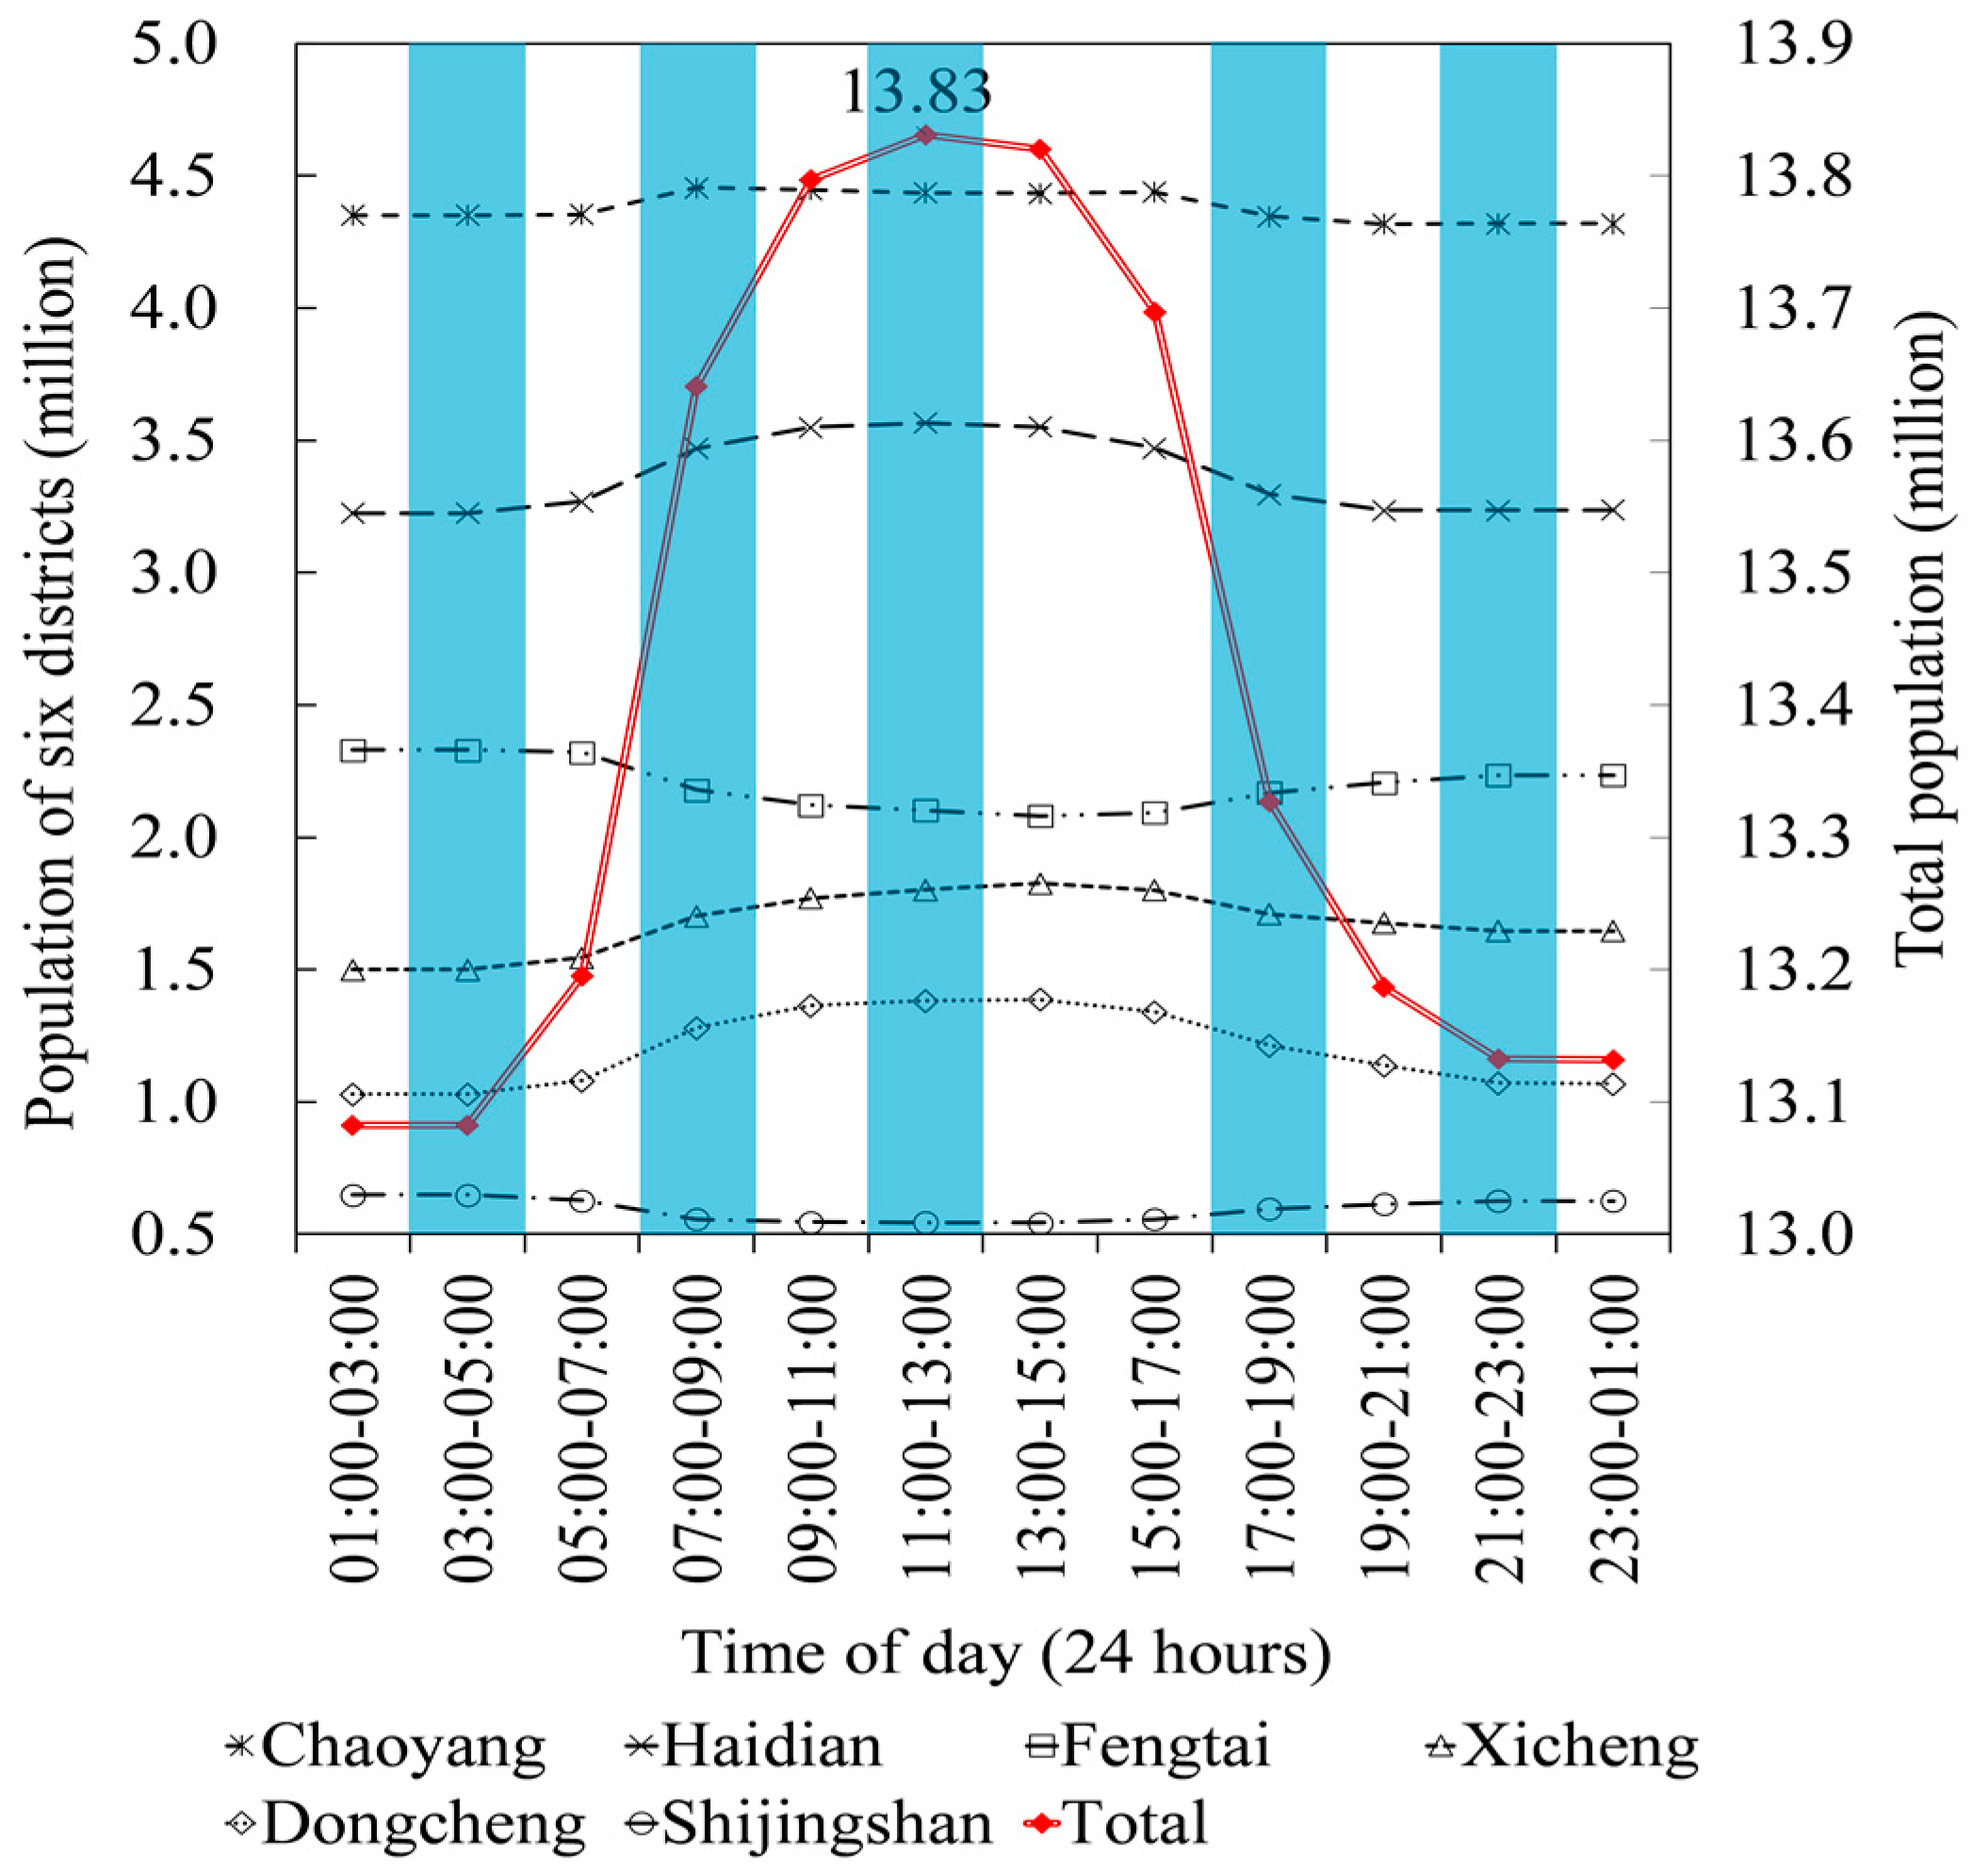
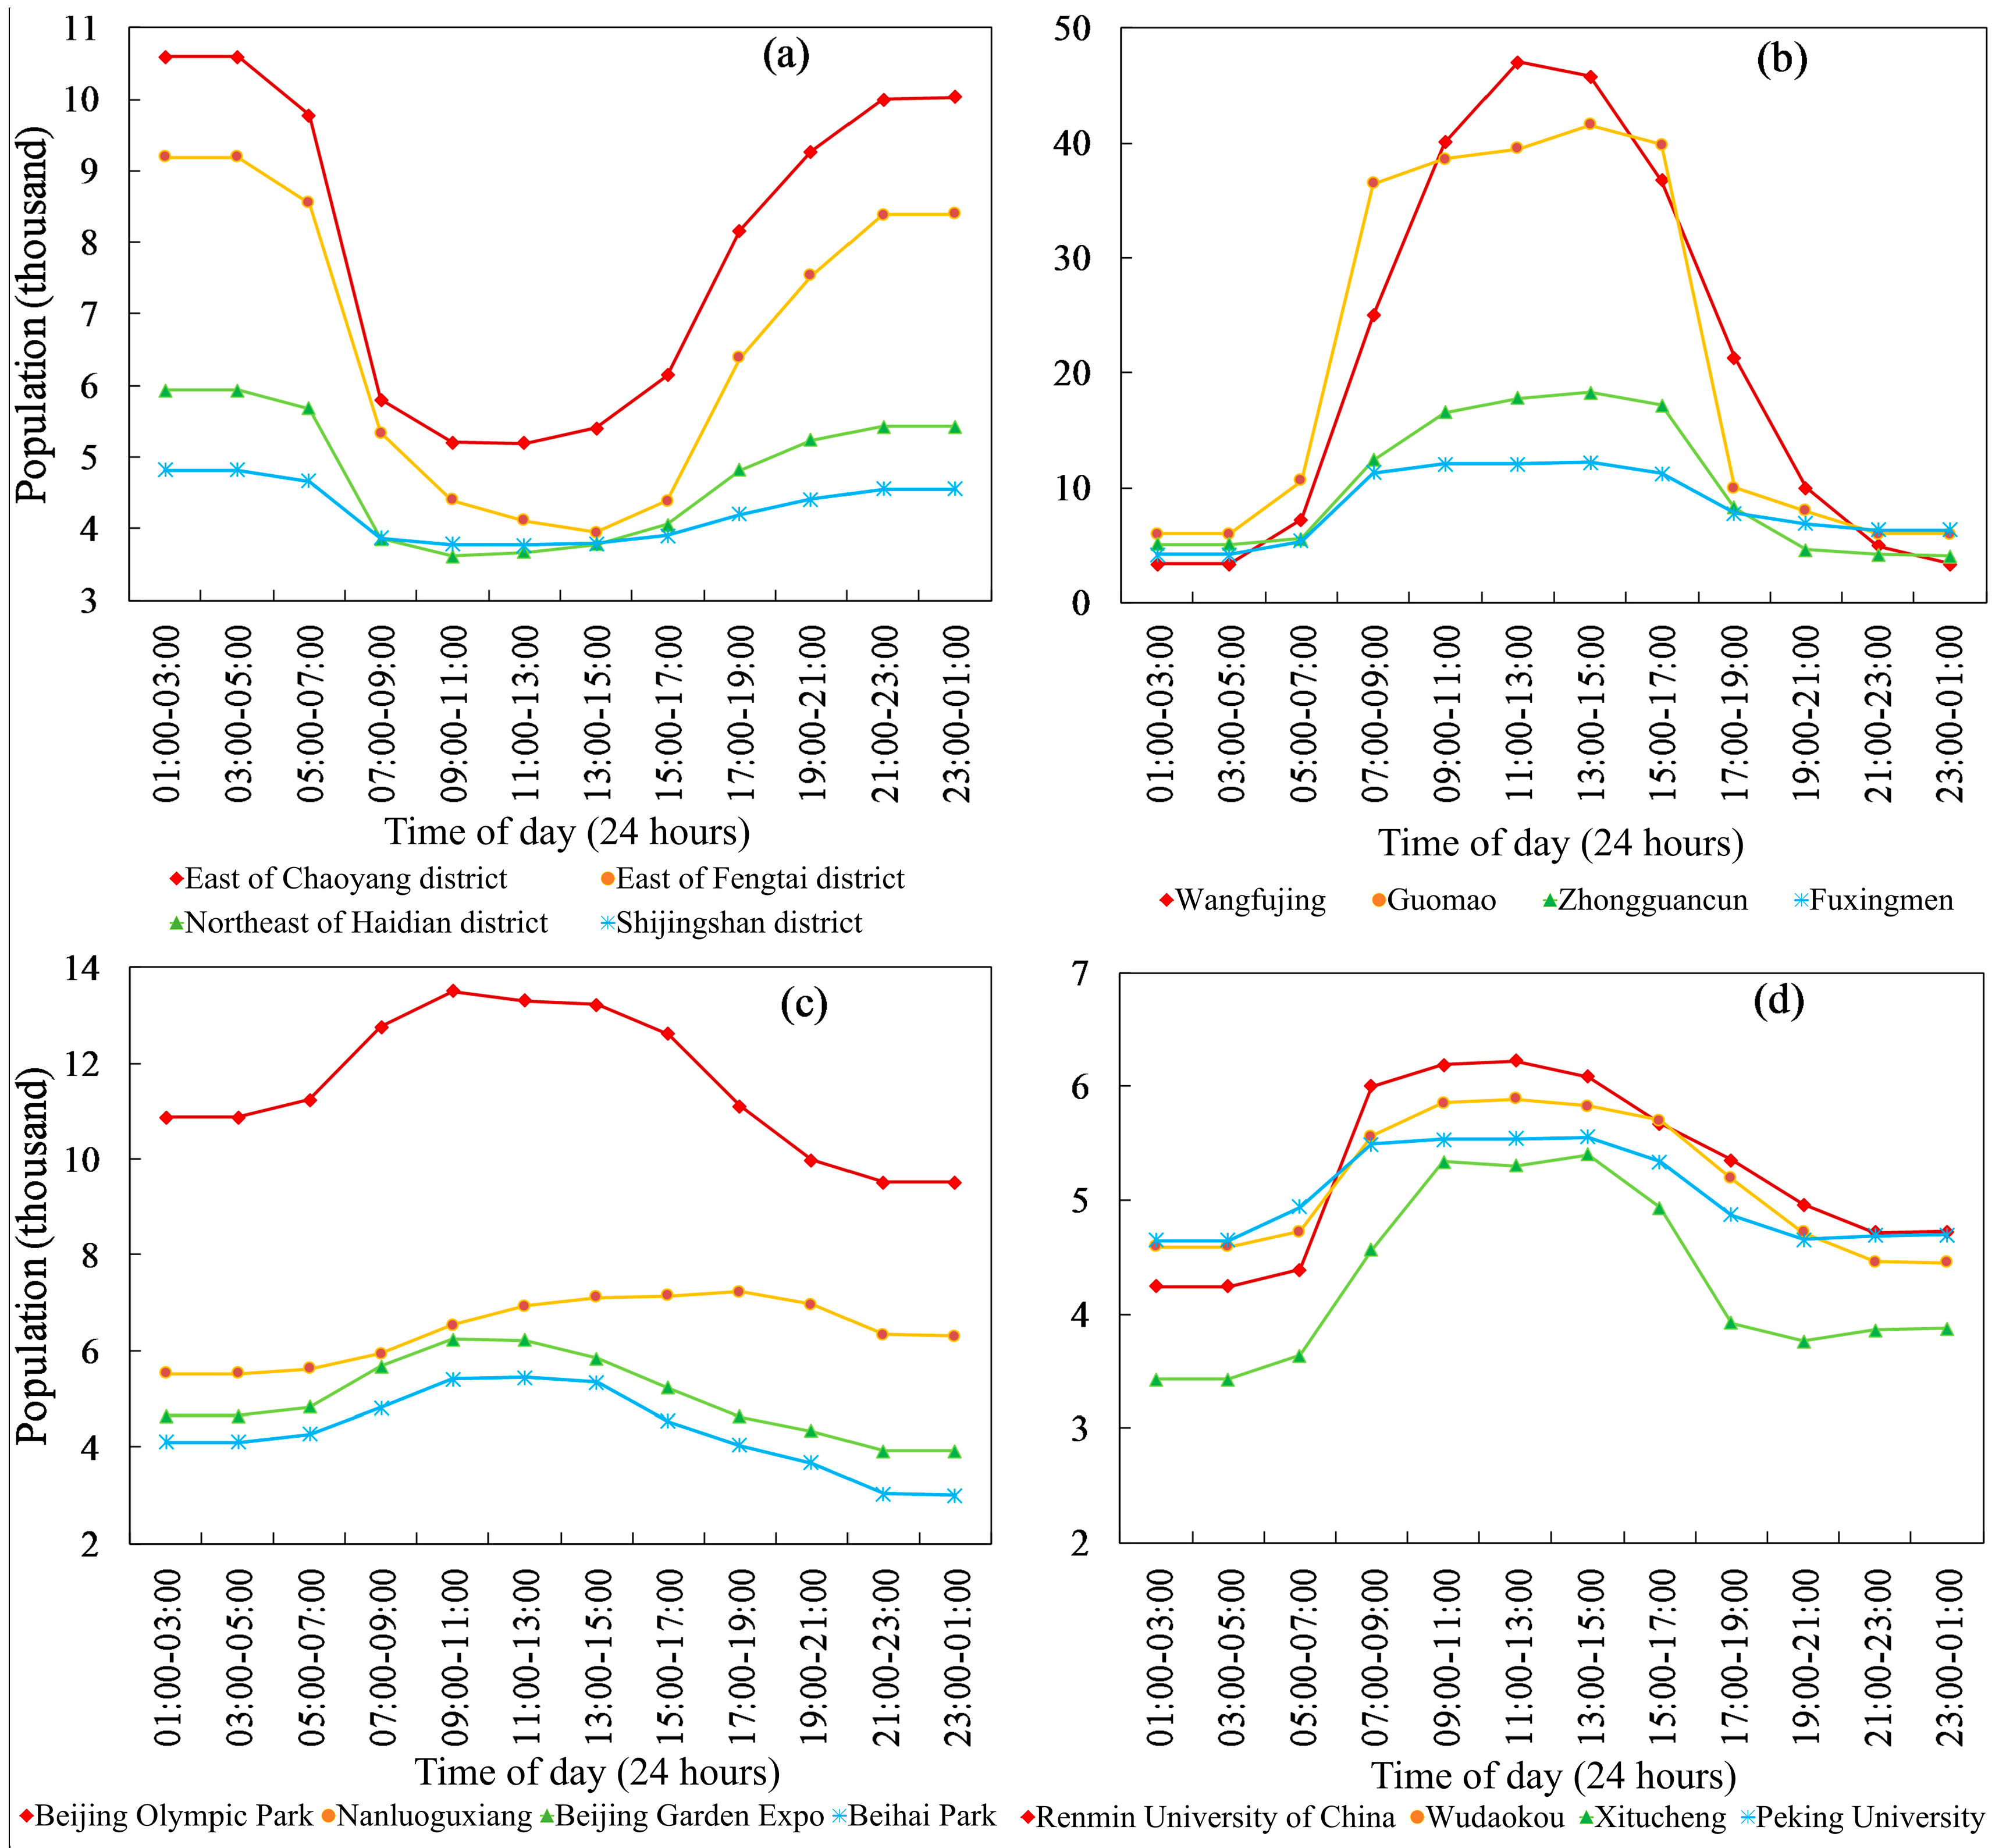
3.1. Population Changes at the District Level
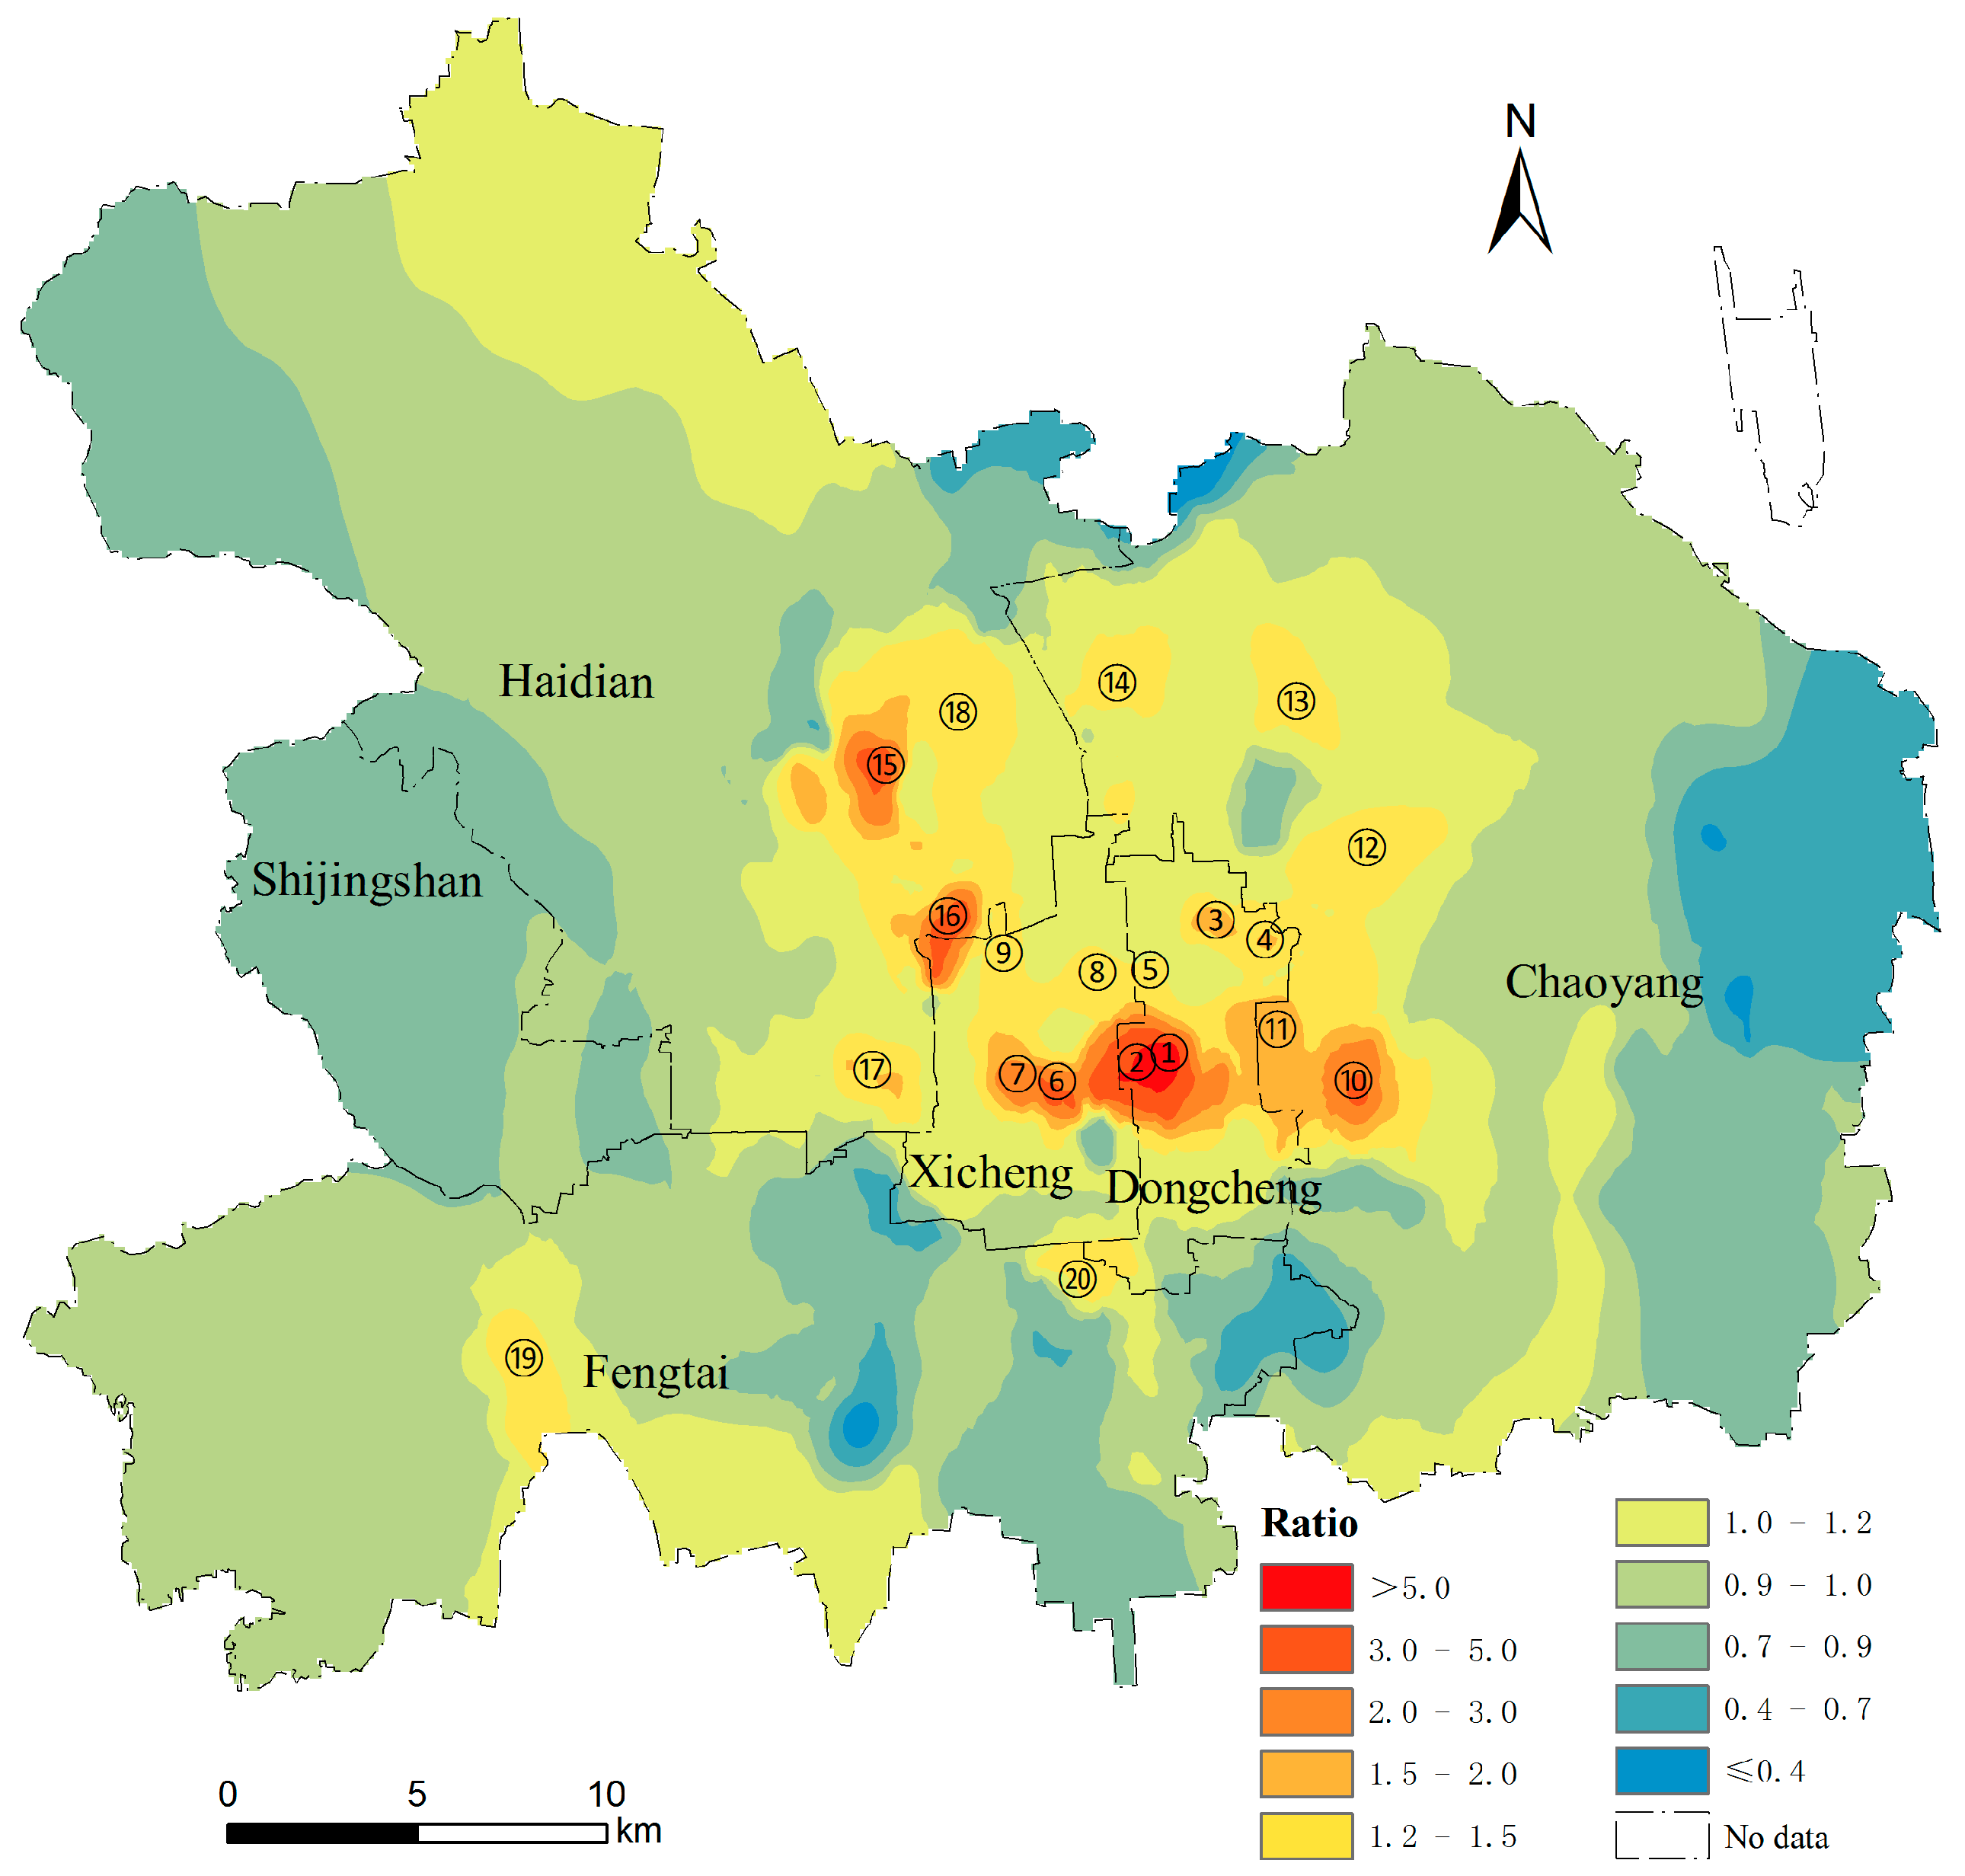
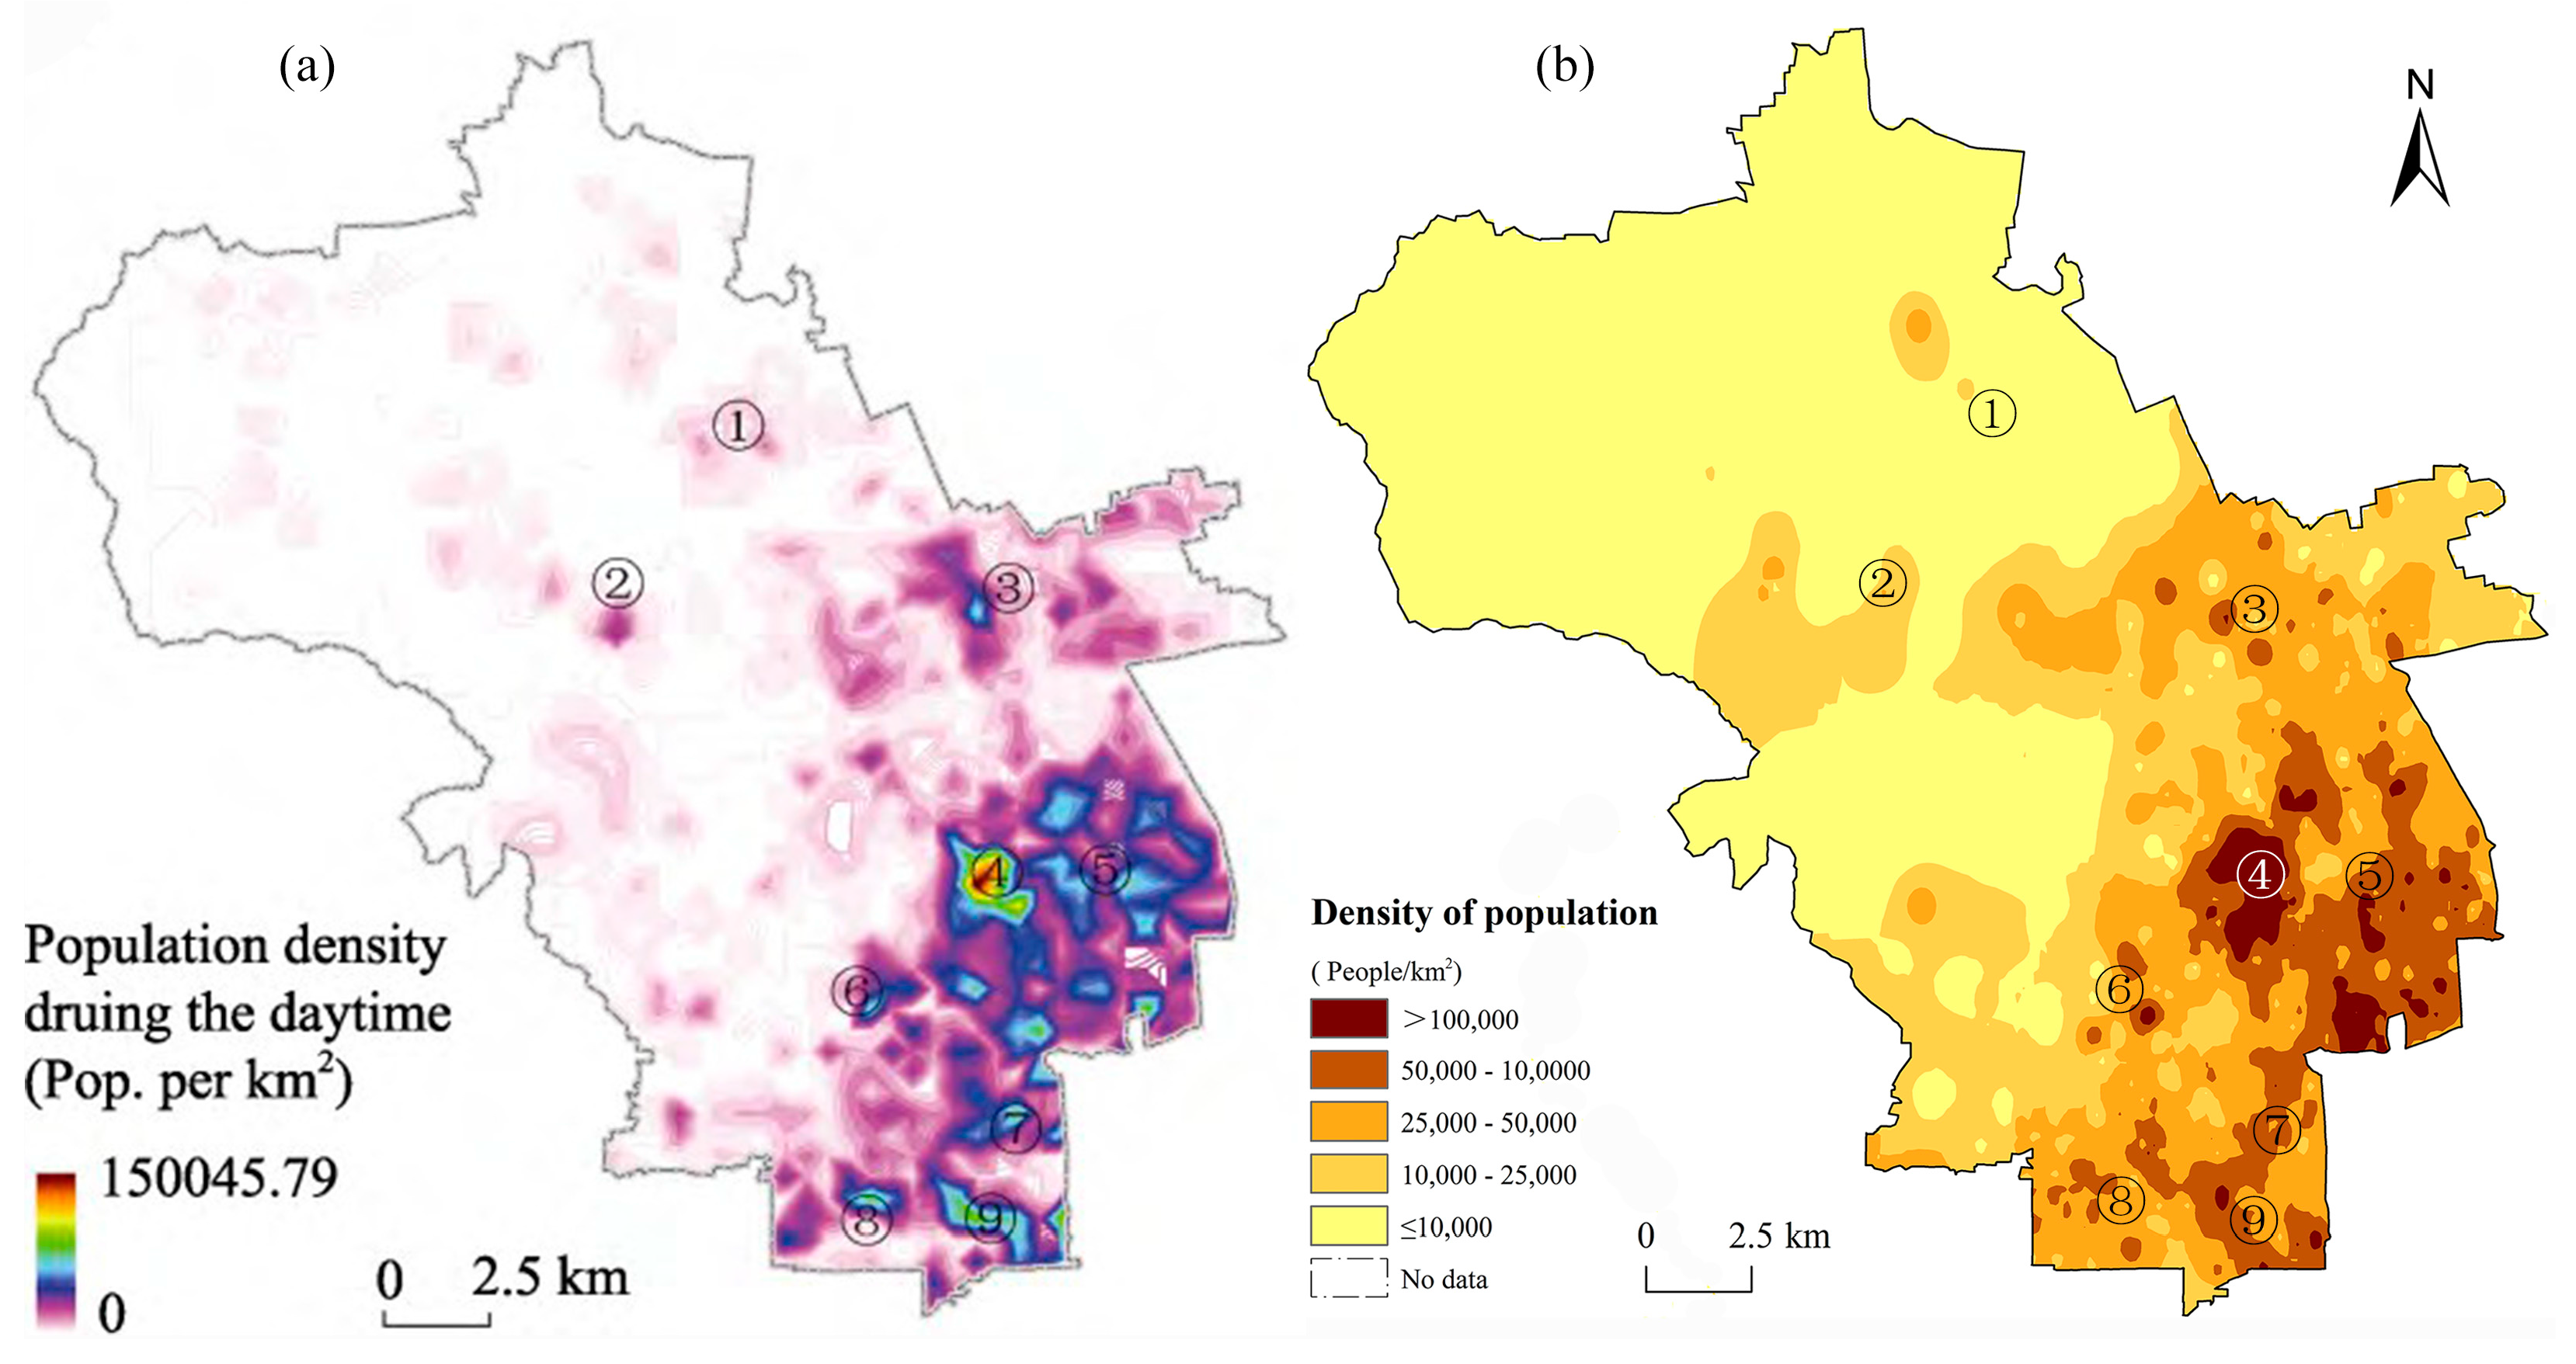
3.2. Spatial Distribution of Population Ratio of Day to Night
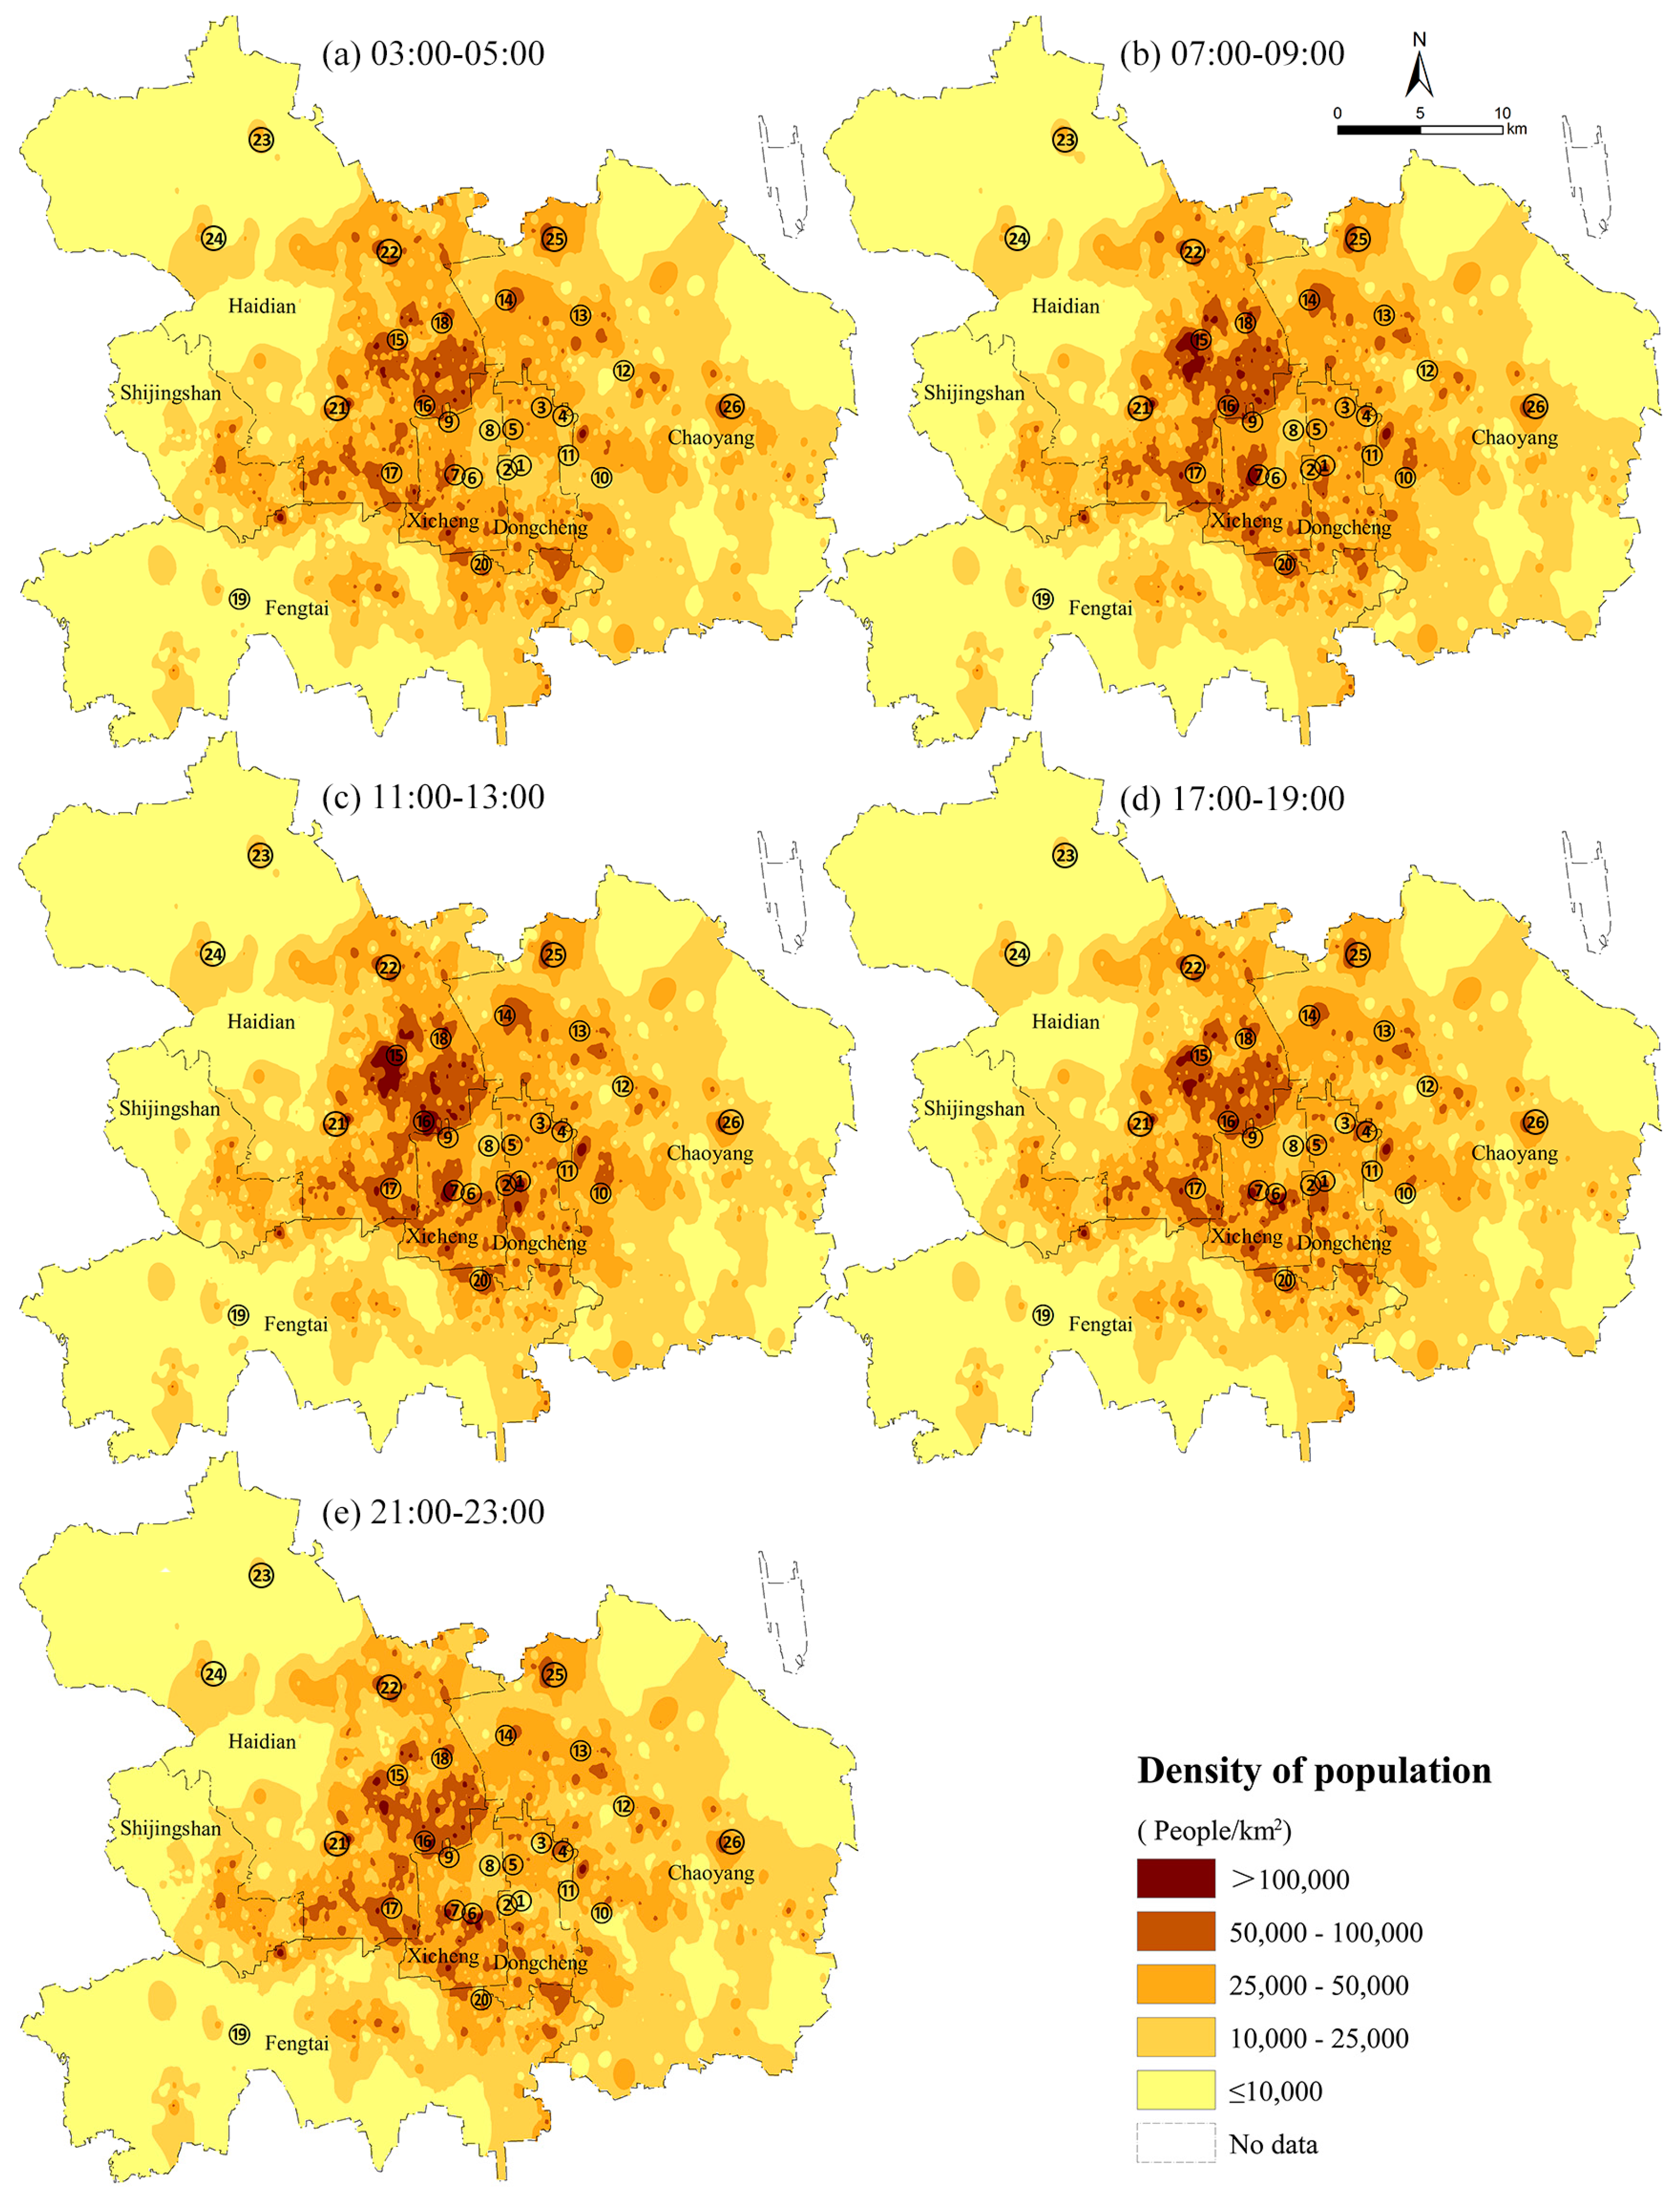
3.3. Temporal and Spatial Structure of the Dynamic Population Distribution
3.4. Population Variation of Typical Communities
3.4.1. Residential Areas
3.4.2. Business Areas
3.4.3. Tourist Areas
3.4.4. University Areas
3.4.5. Summary of Population Mobility
4. Discussion
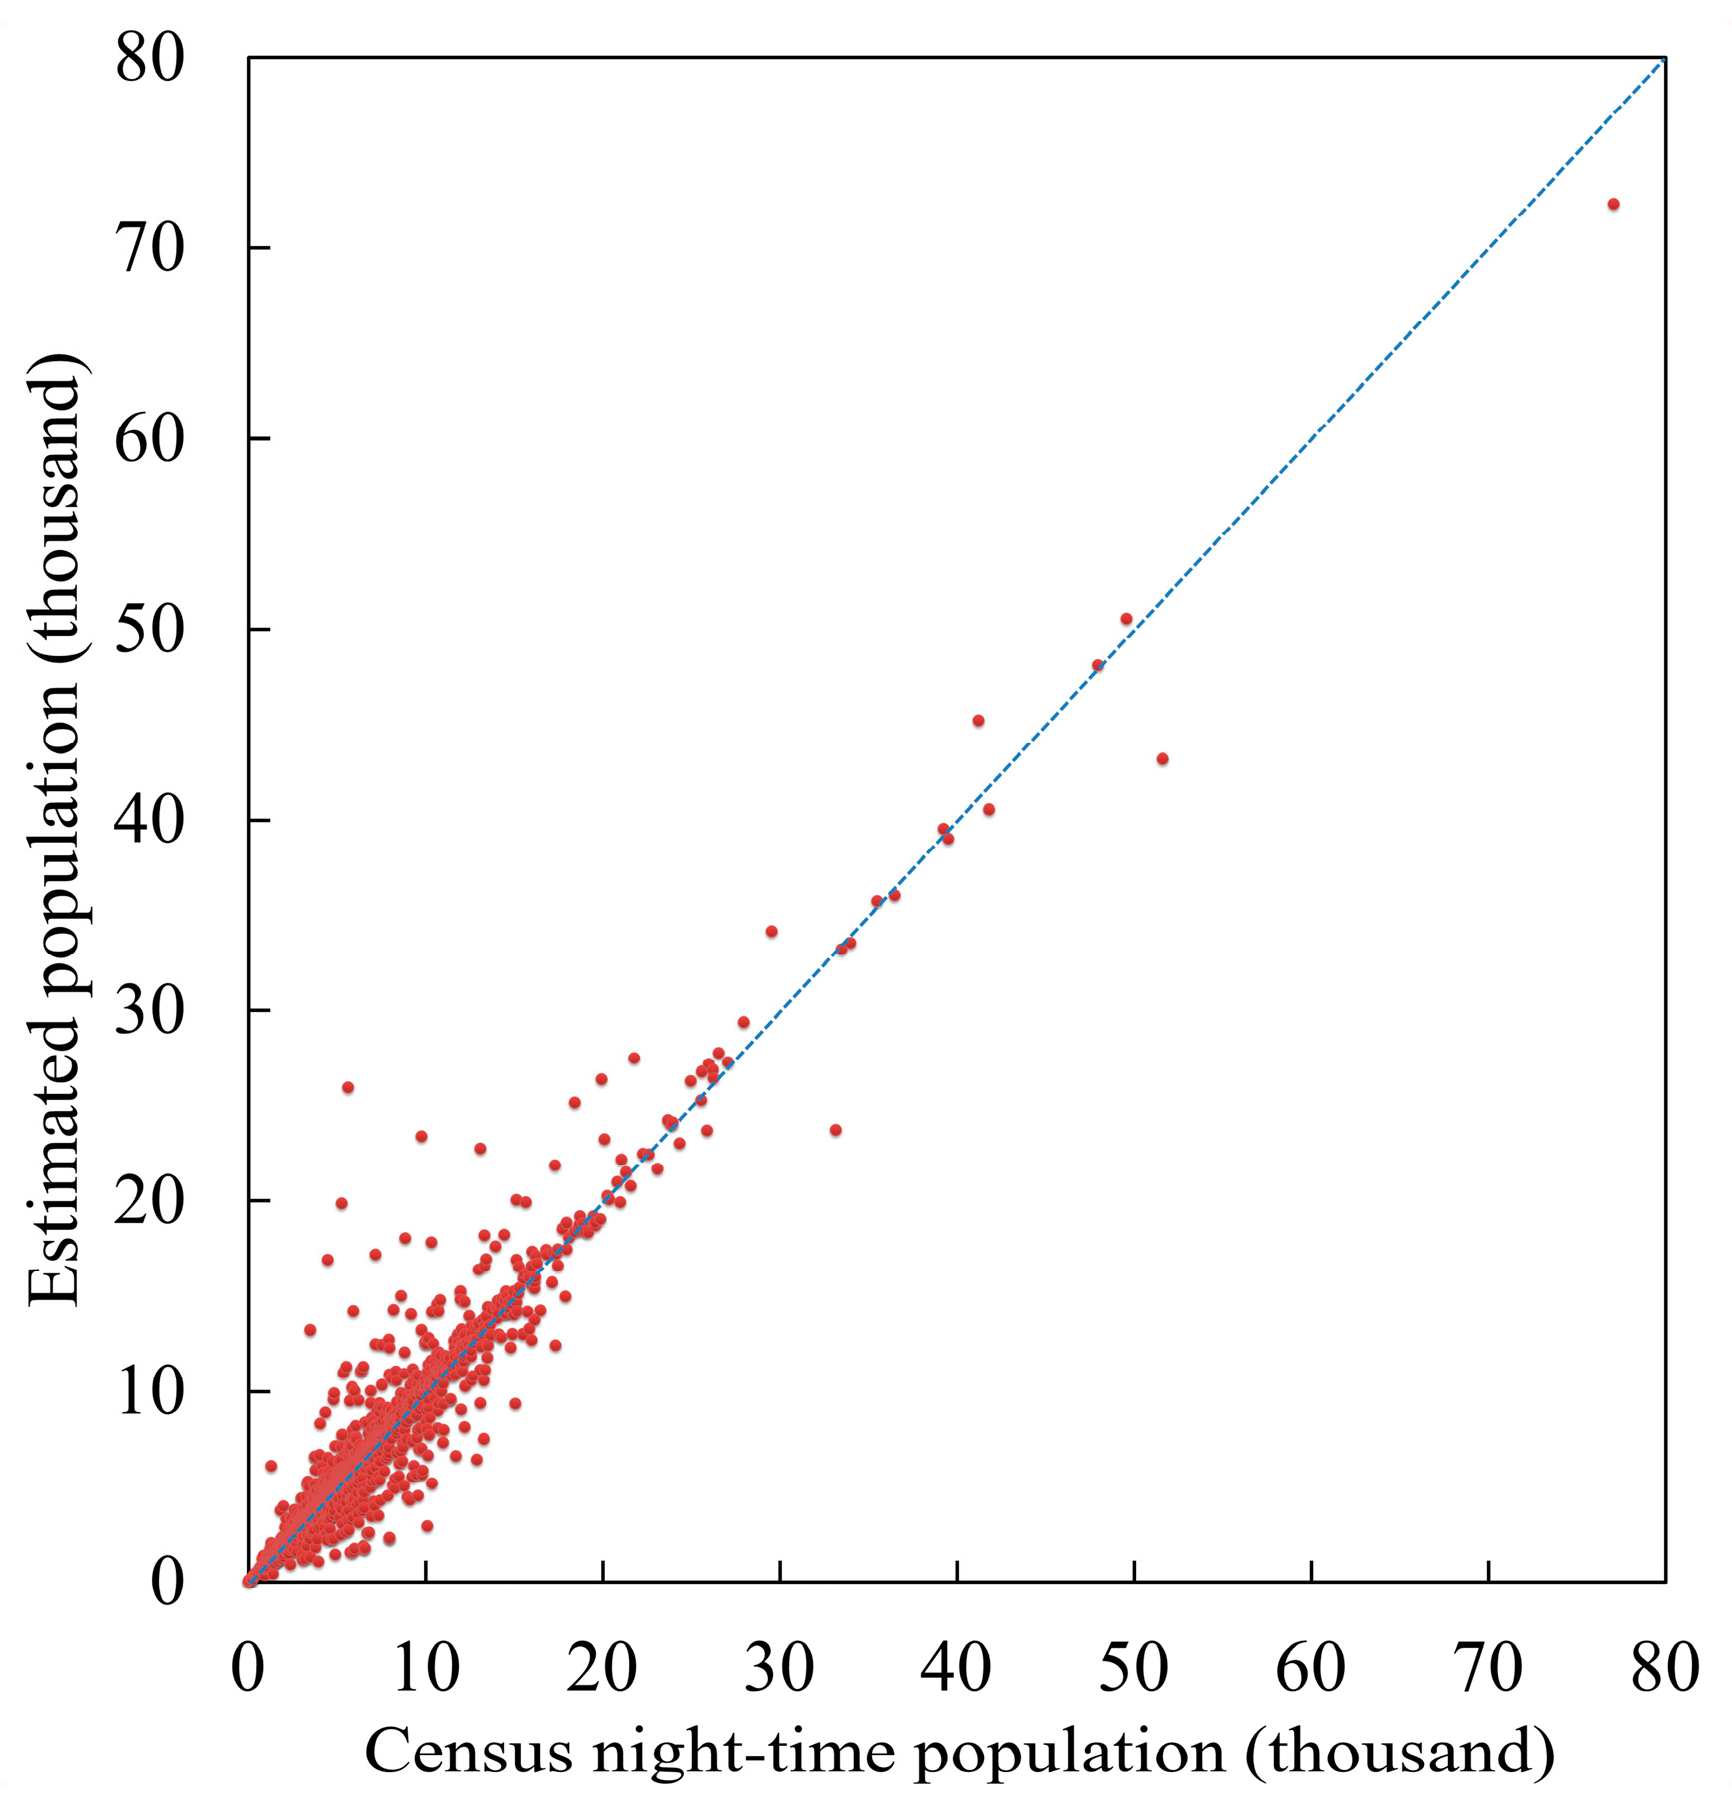
4.1. Evaluation for the Night-Time Population
4.2. Evaluation for the Daytime Population
4.3. Future Work
5. Conclusions
Acknowledgments
Author Contributions
Conflicts of Interest
References
- Gonzalez, M.C.; Hidalgo, C.A.; Barabasi, A. Understanding individual human mobility patterns. Nature 2008, 453, 779–782. [Google Scholar] [CrossRef] [PubMed]
- Bhaduri, B.; Bright, E.; Coleman, P.; Urban, M.L. LandScan USA: A high-resolution geospatial and temporal modeling approach for population distribution and dynamics. GeoJournal 2007, 69, 103–117. [Google Scholar] [CrossRef]
- Yu, C.; Chang, H. Personalized location-based recommendation services for tour planning in mobile tourism applications. In Proceedings of the International Conference on Electronic Commerce and Web Technologies, Linz, Austria, 1–4 September 2009; pp. 38–49. [Google Scholar]
- McPherson, T.N.; Brown, M. Estimating daytime and nighttime population distributions in US cities for emergency response activities. In Proceedings of the Symposium on Planning, Nowcasting, and Forecasting in the Urban Zone, Seattle, WA, USA, 10–12 January 2004. [Google Scholar]
- Aubrecht, C.; Freire, S.; Neuhold, C.; Curtis, A.; Steinnocher, K. Introducing a temporal component in spatial vulnerability analysis. Disaster Adv. 2012, 5, 48–53. [Google Scholar]
- Eubank, S.; Guclu, H.; Kumar, V.A.; Marathe, M.V.; Srinivasan, A.; Toroczkai, Z.; Wang, N. Modelling disease outbreaks in realistic urban social networks. Nature 2004, 429, 180–184. [Google Scholar] [CrossRef] [PubMed]
- Gariazzo, C.; Pelliccioni, A.; Bolignano, A. A dynamic urban air pollution population exposure assessment study using model and population density data derived by mobile phone traffic. Atmos. Environ. 2016, 131, 289–300. [Google Scholar] [CrossRef]
- Wirth, L. Urbanism as a way of life. Am. J. Soc. 1938, 44, 1–24. [Google Scholar] [CrossRef]
- Breese, G.W. The Daytime Population of the Central Business District of Chicago: With Particular Reference to the Factor of Transportation; University of Chicago Press: Chicago, IL, USA, 1949. [Google Scholar]
- Quinn, J.A.; Breese, G.W. The daytime population of the central business district of Chicago. Am. Soc. Rev. 1950, 15, 827–828. [Google Scholar] [CrossRef]
- Foley, D.L. The daily movement of population into central business districts. Am. Soc. Rev. 1952, 17, 538–543. [Google Scholar] [CrossRef]
- Foley, D.L. Urban daytime population: A field for demographic-ecological analysis. Soc. Forces 1954, 32, 323–330. [Google Scholar] [CrossRef]
- Akkerman, A. The urban household pattern of daytime population change. Ann. Reg. Sci. 1995, 29, 1–16. [Google Scholar] [CrossRef] [PubMed]
- Akkerman, A.; Hwang-Kurylyk, Y.W. The origin-destination matrix as an indicator of intrahousehold travel allocation. Transp. Plan Techn. 2004, 27, 285–314. [Google Scholar] [CrossRef]
- Fulton, P.N. Estimating the daytime population with the urban transportation planning package. Transp. Res. Rec. 1984, 981, 25–27. [Google Scholar]
- Roddis, S.M.; Richardson, A.J. Construction of daytime activity profiles from household travel survey data. Transp. Res. Rec. J. Transp. Res. Board 1998, 1625, 102–108. [Google Scholar] [CrossRef]
- Statistics Bureau Home Page/Daytime Population. Available online: http://www.stat.go.jp/english/data/kokusei/2000/jutsu1/00/01.htm (accessed on 22 March 2016).
- Bhaduri, B. Population Distribution during the Day; Springer: Berlin, Germany, 2008; pp. 880–885. [Google Scholar]
- Huang, R. The regional structure of Beijing. Chin. J. Popul. Sci. 2003, 5, 49–55. [Google Scholar]
- Langford, M.; Harvey, J.T. The use of remotely sensed data for spatial disaggregation of published census population counts. In Proceedings of the IEEE/ISPRS Joint Workshop on Remote Sensing and Data Fusion over Urban Areas, Roma, Italy, 8–9 November 2001. [Google Scholar]
- Harvey, J.T. Population estimation models based on individual TM pixels. Photogramm. Eng. Remote Sens. 2002, 68, 1181–1192. [Google Scholar]
- Yue, T.X.; Wang, Y.A.; Chen, S.P.; Liu, J.Y.; Qiu, D.S.; Deng, X.Z.; Liu, M.L.; Tian, Y.Z. Numerical simulation of population distribution in China. Popul. Environ. 2003, 25, 141–163. [Google Scholar] [CrossRef]
- Yue, T.X.; Wang, Y.A.; Liu, J.Y.; Chen, S.P.; Qiu, D.S.; Deng, X.Z.; Liu, M.L.; Tian, Y.Z.; Su, B.P. Surface modelling of human population distribution in China. Ecol. Model 2005, 181, 461–478. [Google Scholar] [CrossRef]
- Qi, W.; Liu, S.; Gao, X.; Zhao, M. Modeling the spatial distribution of urban population during the daytime and at night based on land use: A case study in Beijing, China. J. Geogr. Sci. 2015, 25, 756–768. [Google Scholar] [CrossRef]
- Sleeter, R.; Wood, N. Estimating daytime and nighttime population density for coastal communities in Oregon. In Proceedings of the Urban and Regional Information Systems Association Annual Conference, Vancouver, BC, Canada, 26–29 September 2006. [Google Scholar]
- Ahas, R.; Mark, Ü. Location based services—New challenges for planning and public administration? Futures 2005, 37, 547–561. [Google Scholar] [CrossRef]
- Mao, X.; Xu, R.; Li, X.; Wang, Y.; Li, C.; Zeng, B.; He, Y.; Liu, J. Fine grid dynamic features of population distribution in Shenzhen. Acta Geogr. Sin. 2010, 65, 443–453. [Google Scholar]
- de Montjoye, Y.; Hidalgo, C.A.; Verleysen, M.; Blondel, V.D. Unique in the crowd: The privacy bounds of human mobility. Sci. Rep. 2013, 3, 1376. [Google Scholar] [CrossRef] [PubMed]
- Wesolowski, A.; Buckee, C.O.; Pindolia, D.K.; Eagle, N.; Smith, D.L.; Garcia, A.J.; Tatem, A.J. The use of census migration data to approximate human movement patterns across temporal scales. PLoS ONE 2013, 8, e52971. [Google Scholar] [CrossRef] [PubMed]
- Yang, X.; Fang, Z.; Xu, Y.; Shaw, S.; Zhao, Z.; Yin, L.; Zhang, T.; Lin, Y. Understanding spatiotemporal patterns of human convergence and divergence using mobile phone location data. ISPRS Int. J. Geoinf. 2016, 5, 177. [Google Scholar] [CrossRef]
- Lu, S.; Fang, Z.; Zhang, X.; Shaw, S.; Yin, L.; Zhao, Z.; Yang, X. Understanding the representativeness of mobile phone location data in characterizing human mobility indicators. ISPRS Int. J. Geoinf. 2017, 6, 7. [Google Scholar] [CrossRef]
- Yuan, J.; Zheng, Y.; Xie, X. Discovering regions of different functions in a city using human mobility and POIs. In Proceedings of the 18th ACM SIGKDD International Conference on Knowledge Discovery and Data Mining, New York, NY, USA, 12–16 August 2012. [Google Scholar]
- Tang, J.; Liu, F.; Wang, Y.; Wang, H. Uncovering urban human mobility from large scale taxi GPS data. Phys. Stat. Mech. Appl. 2015, 438, 140–153. [Google Scholar] [CrossRef]
- Vazquez-Prokopec, G.M.; Bisanzio, D.; Stoddard, S.T.; Paz-Soldan, V.; Morrison, A.C.; Elder, J.P.; Ramirez-Paredes, J.; Halsey, E.S.; Kochel, T.J.; Scott, T.W. Using GPS technology to quantify human mobility, dynamic contacts and infectious disease dynamics in a resource-poor urban environment. PLoS ONE 2013, 8, e58802. [Google Scholar] [CrossRef] [PubMed]
- Zhang, F.; Zhu, X.; Guo, W.; Ye, X.; Hu, T.; Huang, L. Analyzing urban human mobility patterns through a thematic model at a finer scale. ISPRS Int. J. Geoinf. 2016, 5, 78. [Google Scholar] [CrossRef]
- Lenormand, M.; Louail, T.; Cantú-Ros, O.G.; Picornell, M.; Herranz, R.; Arias, J.M.; Barthelemy, M.; Miguel, M.S.; Ramasco, J.J. Corrigendum: Influence of sociodemographic characteristics on human mobility. Sci. Rep. 2015, 5. [Google Scholar] [CrossRef] [PubMed]
- Sobolevsky, S.; Sitko, I.; Tachet Des Combes, R.; Hawelka, B.; Murillo Arias, J.; Ratti, C. Money on the move: Big data of bank card transactions as the new proxy for human mobility patterns and regional delineation. The case of residents and foreign visitors in spain. In Proceedings of the 2014 IEEE International Congress on Big Data, Anchorage, AK, USA, 27 June–2 July 2014. [Google Scholar]
- Hasan, S.; Schneider, C.M.; Ukkusuri, S.V.; González, M.C. Spatiotemporal patterns of urban human mobility. J. Stat. Phys. 2013, 151, 304–318. [Google Scholar] [CrossRef]
- Roth, C.; Kang, S.M.; Batty, M.; Barthélemy, M. Structure of urban movements: Polycentric activity and entangled hierarchical flows. PLoS ONE 2011, 6, e15923. [Google Scholar] [CrossRef] [PubMed]
- Gong, Y.; Lin, Y.; Duan, Z. Exploring the spatiotemporal structure of dynamic urban space using metro smart card records. Comput. Environ. Urban Syst. 2017, 64, 169–183. [Google Scholar] [CrossRef]
- McKenzie, G.; Janowicz, K. Where is also about time: A location-distortion model to improve reverse geocoding using behavior-driven temporal semantic signatures. Comput. Environ. Urban Syst. 2015, 54, 1–13. [Google Scholar] [CrossRef]
- McKenzie, G.; Janowicz, K.; Gao, S.; Gong, L. How where is when? On the regional variability and resolution of geosocial temporal signatures for points of interest. Comput. Environ. Urban Syst. 2015, 54, 336–346. [Google Scholar] [CrossRef]
- Wu, L.; Zhi, Y.; Sui, Z.; Liu, Y. Intra-urban human mobility and activity transition: Evidence from social media check-in data. PLoS ONE 2014, 9, e97010. [Google Scholar] [CrossRef] [PubMed]
- Jurdak, R.; Zhao, K.; Liu, J.; AbouJaoude, M.; Cameron, M.; Newth, D. Understanding human mobility from Twitter. PLoS ONE 2015, 10, e131469. [Google Scholar] [CrossRef] [PubMed]
- Yin, J.; Du, Z. Exploring multi-scale spatiotemporal twitter user mobility patterns with a visual-analytics approach. ISPRS Int. J. Geoinf. 2016, 5, 187. [Google Scholar] [CrossRef]
- Li, Y.; Li, Q.; Shan, J. Discover patterns and mobility of Twitter users—A study of four US college cities. ISPRS Int. J. Geoinf. 2017, 6, 42. [Google Scholar] [CrossRef]
- Luo, F.; Cao, G.; Mulligan, K.; Li, X. Explore spatiotemporal and demographic characteristics of human mobility via Twitter: A case study of Chicago. Appl. Geogr. 2015, 70, 11–25. [Google Scholar] [CrossRef]
- Cheng, Z.; Caverlee, J.; Lee, K.; Sui, D.Z. Exploring millions of footprints in location sharing services. ICWSM 2011, 2011, 81–88. [Google Scholar]
- Li, L.; Goodchild, M.F.; Xu, B. Spatial, temporal, and socioeconomic patterns in the use of Twitter and Flickr. Cartogr. Geogr. Inf. Sci. 2013, 40, 61–77. [Google Scholar] [CrossRef]
- Arai, A.; Fan, Z.; Matekenya, D.; Shibasaki, R. Comparative perspective of human behavior patterns to uncover ownership bias among mobile phone users. ISPRS Int. J. Geoinf. 2016, 5, 85. [Google Scholar] [CrossRef]
- Kang, C.; Liu, Y.; Ma, X.; Wu, L. Towards estimating urban population distributions from mobile call data. J. Urban Technol. 2012, 19, 3–21. [Google Scholar] [CrossRef]
- Wesolowski, A.; Eagle, N.; Noor, A.M.; Snow, R.W.; Buckee, C.O. Heterogeneous mobile phone ownership and usage patterns in Kenya. PLoS ONE 2012, 7, e35319. [Google Scholar] [CrossRef] [PubMed]
- Wesolowski, A.; Eagle, N.; Noor, A.M.; Snow, R.W.; Buckee, C.O. The impact of biases in mobile phone ownership on estimates of human mobility. J. R. Soc. Interf. 2013, 10, 20120986. [Google Scholar] [CrossRef] [PubMed]
- Deville, P.; Linard, C.; Martin, S.; Gilbert, M.; Stevens, F.R.; Gaughan, A.E.; Blondel, V.D.; Tatem, A.J. Dynamic population mapping using mobile phone data. Proc. Natl. Acad. Sci. USA 2014, 111, 15888–15893. [Google Scholar] [CrossRef] [PubMed]
- The Traffic Trip Proporion of Public Transportation of Beijing in 2013. Available online: http://www.baogaochina.com/News/2014–02/2013NianBeiJingDeGongGongJiaoTon.html (accessed on 17 April 2016).
- Beihang Interest Group on SmartCity (BIGSCity). Available online: http://www.smartcity-buaa.org/ (accessed on 6 April 2016).
- Mapinfo Daytime Population Canada. Available online: http://www.pitneybowes.com/us/location-intelligence/gis-data-sets/daytime-population-canada.html (accessed on 24 May 2016).
- Menzler, F. An estimate of the day-time population of London. J. Town Plan. Inst. 1952, 38, 116–120. [Google Scholar]
- Huang, R. Population redistribution in the context of urbanization in Beijing since 1980s. Popul. Res. 2005, 29, 19–27. [Google Scholar]
- Kang, W. On the Character of Downtown Daytime Population and Its’ Impacts on Regional Development: A Case Study in Luwan District, Shanghai; East China Normal University: Shanghai, China, 2006. [Google Scholar]
- Long, Y.; Zhang, Y.; Cui, C. Identifying commuting pattern of Beijing using bus smart card data. Acta Geogr. Sin. 2012, 67, 1339–1352. [Google Scholar]
- Miyazaki, H.; Nagai, M.; Shibasaki, R. Reviews of geospatial information technology and collaborative data delivery for disaster risk management. ISPRS Int. J. Geoinf. 2015, 4, 1936–1964. [Google Scholar] [CrossRef]
- Freire, S.; Aubrecht, C. Integratig population dynamics into mapping human exposure to seismic hazard. Nat. Hazards Earth Sys. Sci. 2012, 12, 3533–3543. [Google Scholar] [CrossRef]


| Database | Source | Year | Data Description |
|---|---|---|---|
| Community population data | Beijing Municipal Bureau of Civil Affairs | 2012 | Total population |
| Subway smart card data | Beihang Interest Group on SmartCity | 2013 | Bi-hourly population flow at each subway station |
| Geospatial data | Key Laboratory of Environmental Change and Natural Disaster of Ministry of Education, Beijing Normal University | 2014 | Location of communities and subway stations |
| District | Function | Night-Time Population | Maximum Daytime Population | Population Ratio of Day to Night |
|---|---|---|---|---|
| Dongcheng | Administrative and commercial | 1,029,408 | 1,386,270 | 1.35 |
| Xicheng | Administrative and commercial | 1,499,466 | 1,825,688 | 1.22 |
| Haidian | Mixed | 3,224,669 | 3,565,169 | 1.11 |
| Chaoyang | Mixed | 4,350,650 | 4,435,670 | 1.02 |
| Fengtai | Mixed | 2,329,916 | 2,081,075 | 0.89 |
| Shijingshan | Residential | 648,559 | 543,074 | 0.84 |
| Average | 13,082,668 | 13,836,946 | 1.06 |
| ID | Station | District | Type | Population Ratio of Day to Night |
|---|---|---|---|---|
| 1 | Wangfujing | Dongcheng | Business area | 13.80 |
| 2 | Tian’anmen | Dongcheng | Tourist area | 6.08 |
| 3 | Yonghegong Lama Temple | Dongcheng | Tourist area | 1.89 |
| 4 | Dongzhimen | Dongcheng | Business area | 1.51 |
| 5 | Nanluoguxiang | Dongcheng | Tourist area | 1.25 |
| 6 | Xidan | Xicheng | Business area | 4.53 |
| 7 | Fuxingmen | Xicheng | Business area | 2.88 |
| 8 | Beihai North | Xicheng | Tourist area | 1.33 |
| 9 | Xizhenmen | Xicheng | Business area | 1.31 |
| 10 | Guomao | Chaoyang | Business area | 6.56 |
| 11 | Chaoyangmen | Chaoyang | Business area | 1.90 |
| 12 | Sanyuanqiao | Chaoyang | Business area | 1.44 |
| 13 | Wangjing West | Chaoyang | Business area | 1.30 |
| 14 | Beijing Olympic Park | Chaoyang | Tourist area | 1.23 |
| 15 | Zhongguancun | Haidian | Business area | 3.50 |
| 16 | Beijing Zoo | Haidian | Tourist area | 3.54 |
| 17 | Gongzhufen | Haidian | Business area | 1.50 |
| 18 | Wudaokou | Haidian | University area | 1.28 |
| 19 | Beijing Garden Expo | Fengtai | Tourist area | 1.33 |
| 20 | Beijing South Railway Station | Fengtai | Railway station | 1.28 |
| Population Density of Community (People/km2) | 03:00–05:00 | 07:00–09:00 | 11:00–13:00 | 17:00–19:00 | 21:00–23:00 | Mode of Change |
|---|---|---|---|---|---|---|
| ≤10,000 | 534/73.96 | 532/73.95 | 537/74.62 | 539/74.64 | 536/73.81 | Not obvious |
| 10,000–25,000 | 555/15.77 | 533/15.15 | 526/14.52 | 553/14.80 | 553/15.67 | ↘↗ |
| 25,000–50,000 | 582/7.97 | 545/7.87 | 547/7.69 | 543/7.64 | 564/7.78 | ↘↗ |
| 50,000–100,000 | 314/2.13 | 353/2.75 | 338/2.74 | 336/2.65 | 324/2.49 | ↗↘ |
| >100,000 | 54/0.17 | 76/0.28 | 91/0.43 | 68/0.27 | 62/0.25 | ↗↘ |
© 2017 by the authors. Licensee MDPI, Basel, Switzerland. This article is an open access article distributed under the terms and conditions of the Creative Commons Attribution (CC BY) license (http://creativecommons.org/licenses/by/4.0/).
Share and Cite
Ma, Y.; Xu, W.; Zhao, X.; Li, Y. Modeling the Hourly Distribution of Population at a High Spatiotemporal Resolution Using Subway Smart Card Data: A Case Study in the Central Area of Beijing. ISPRS Int. J. Geo-Inf. 2017, 6, 128. https://doi.org/10.3390/ijgi6050128
Ma Y, Xu W, Zhao X, Li Y. Modeling the Hourly Distribution of Population at a High Spatiotemporal Resolution Using Subway Smart Card Data: A Case Study in the Central Area of Beijing. ISPRS International Journal of Geo-Information. 2017; 6(5):128. https://doi.org/10.3390/ijgi6050128
Chicago/Turabian StyleMa, Yunjia, Wei Xu, Xiujuan Zhao, and Ying Li. 2017. "Modeling the Hourly Distribution of Population at a High Spatiotemporal Resolution Using Subway Smart Card Data: A Case Study in the Central Area of Beijing" ISPRS International Journal of Geo-Information 6, no. 5: 128. https://doi.org/10.3390/ijgi6050128
APA StyleMa, Y., Xu, W., Zhao, X., & Li, Y. (2017). Modeling the Hourly Distribution of Population at a High Spatiotemporal Resolution Using Subway Smart Card Data: A Case Study in the Central Area of Beijing. ISPRS International Journal of Geo-Information, 6(5), 128. https://doi.org/10.3390/ijgi6050128