1. Introduction
For residents that live in the cities north of Taiwan, a current major problem within their residential environment is a lack of appropriate urban planning, resulting in a lack of comfortable, safe and convenient walking spaces and transportation services. Although the major cities in Taiwan have already implemented the concept of transit-oriented development (TOD), their focus was often only on the development of mass rapid transit (MRT), leading to the transportation network service being confined to certain areas. This causes the traffic flow in areas that lack MRT stations to greatly increase during rush hours, consequently causing worse urban congestion and increased air pollution.
Regarding the TOD living environment characteristics, Jing
et al. (2010) [
1] indicated that the higher density of development, mixed land use, pleasant walking space environment and high quality of public highway transportation services are what the TOD living environment characteristics feature. Sung
et al. (2011) [
2], however, argued that the provisions of transportation services, land use, street networks and urban design are indispensable conditions. Mu and Jong (2012) [
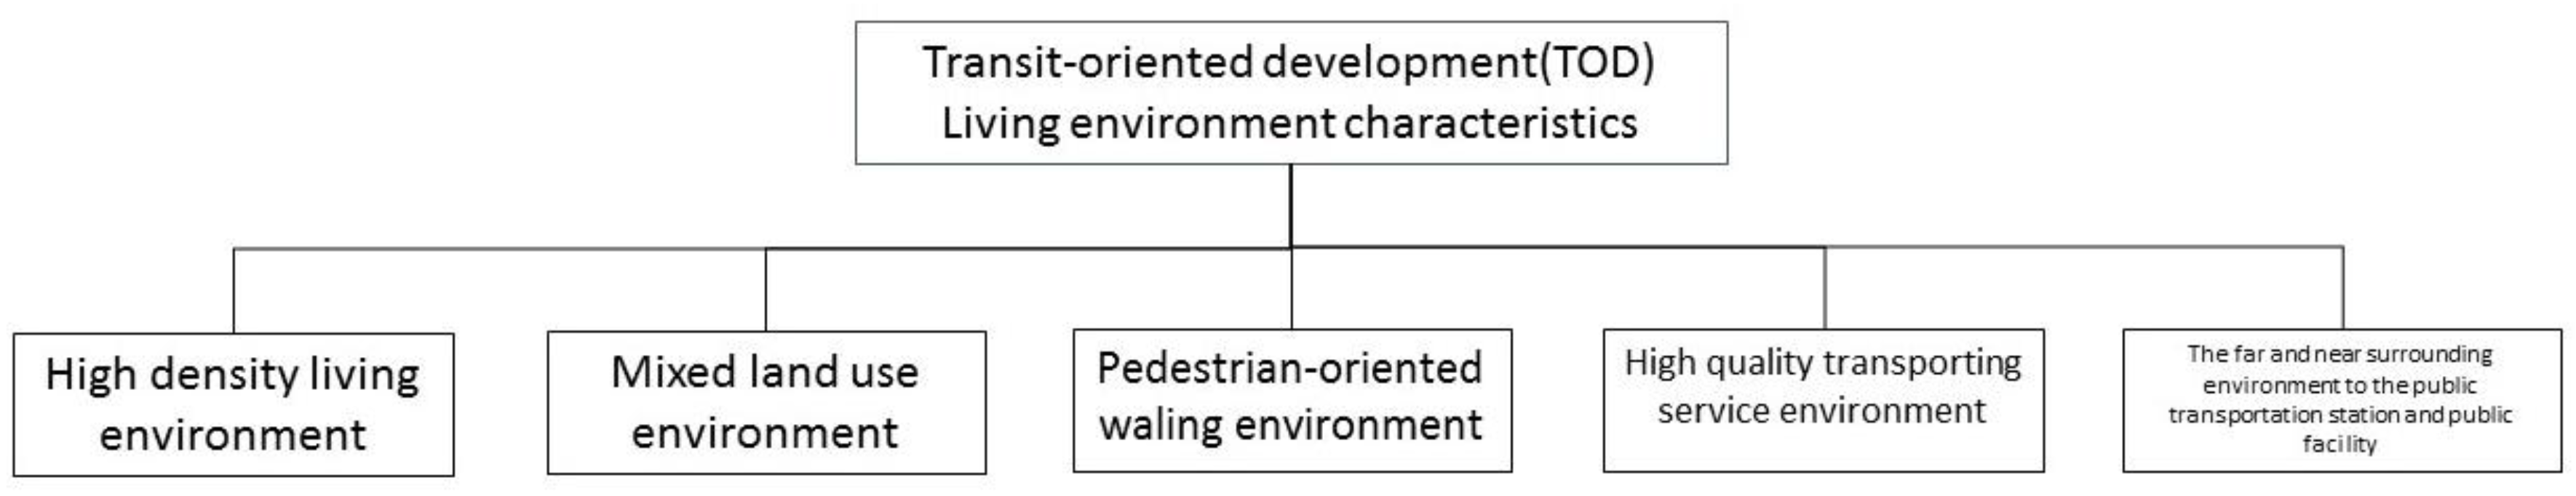
3] emphasized that urban design, governing design, land use, restriction of car use, transportation services and real estate shall instead serve as the evaluation criteria for TOD living environment characteristics. This study integrates the above ideas and suggests that the TOD living environment characteristics shall contain five major aspects, including a high-density living environment, mixed land use environment, pedestrian-oriented environment for pleasant walking, a high-quality transport services environment and the far and near surrounding environment to the public transport stations and public facilities. The purpose of higher density land development is to upgrade the development density to increase land use efficiency. The purpose of a mixed land use environment is to provide a wide variety of convenient services for residents, such as shops, banks, shopping centers/malls, parks,
etc. The TOD model focuses on the comfortable walking environment, which is due to a belief that the provision of a comfortable, safe, convenient and human-based walking environment is of significant importance. A high-quality transport services environment and the far and near surrounding environments to the public transport stations and public facilities can both increase convenience for residents and increase their satisfaction. In recent years, TOD studies have largely been focused on discussing the effect that TOD has on land use or economic development issues. Currently, most TOD concept designs in Taiwan are produced from the perspective of planners, without studying any correlations between the TOD surrounding living environments and resident satisfaction. Hence, it is important to discuss resident satisfaction, given the knowledge gap in the literature.
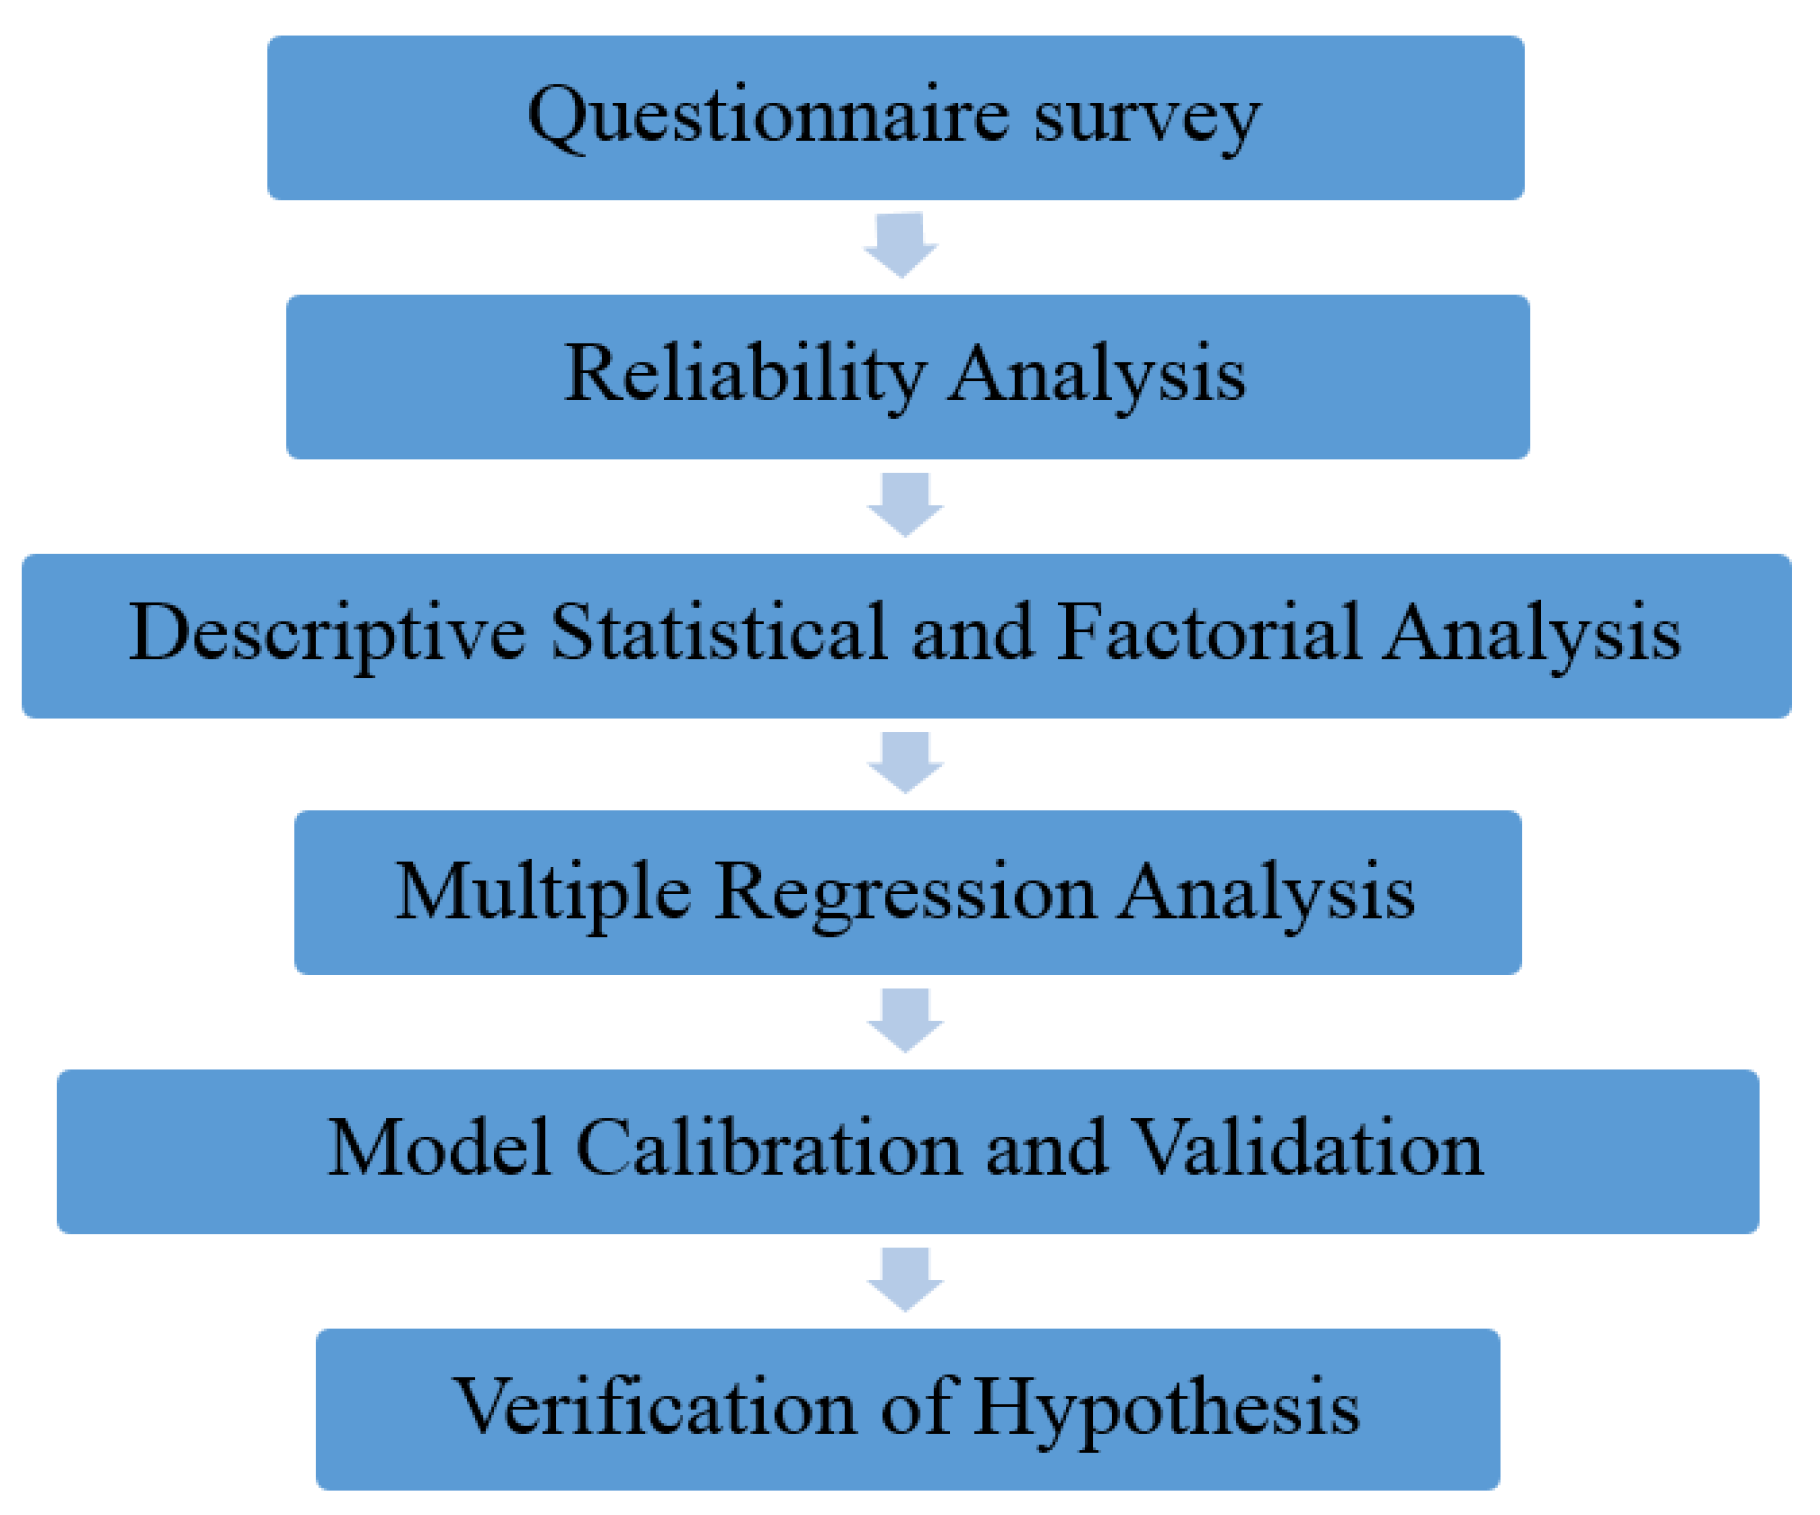
Recently, the government has been proactive in developing the New Banqiao Station special district to be a composite four-railroad system station (high-speed rail, heavy rail, mass rapid rail and light rail) and wants it to serve as the new city center. Thus, this study shall take the MRT (mass rapid transit system) Banqiao Station as the case study focus, using 25 TOD living environment characteristics collected from reviewing the literature to serve as the measuring factors. First, it engages a reliability analysis to ensure the results of the questionnaire surveys. Then, based on those descriptive statistics, it intends to determine what the residents feel most satisfied or unsatisfied with in terms of TOD living environment characteristics. Once the descriptive statistics are completed, the 25 TOD living environment characteristics are categorized by using factor analysis; verification by a multiple regression analysis, the study intends to identify the connection between TOD living environment characteristics and resident satisfaction, while simultaneously inputting individual resident characteristics, such as gender, age, job, education level and salary, in order to see if the individual resident characteristics have any influence on resident satisfaction. In the end, it is the sincere wish of the author that the findings of this study can serve as a reference and resource for the government and academia in formulating urban development and transport policies.
2. Literature Review
The basic characteristics of the TOD model shall include higher density development, mixed land use, a comfortable walking environment and high-quality public transport services. The density of development is mainly intended to increase the public transport use rate through high-density development of the areas surrounding the station. The main purpose of mixed land use is to increase convenience and the willingness of citizens to use public transportation. The human-oriented urban space is intended to create a comfortable transit environment for walking and additional public space, while also enhancing the service of transfer buses. The high-quality public transport service shall attract existing and potential passengers.
The living characteristics of TOD include the provision of transportation services, land use, street network and urban design. Sung
et al. [
2] believe that good TOD planning can create a transport-based city. The primary objective of TOD is not to continuously pursue increased density development, but instead, to foster the utility structure of the land surrounding the train station, in addition to adjusting the street network, urban design and a friendly pedestrian environment to serve as an adaptive strategy for the enhancement of a transportation service network.
Mu and Jong (2012) [
3] believe that TOD provides a broad future perspective for development by introducing the faster urbanization phenomenon to many other areas, including cities in mainland China, through the TOD model, following a sustainable development model to foster city development. With the development of TOD, urban expansion and citizen accessibility become possible, and issues of improving the railway and bus transfer system shall become feasible, as well. Meanwhile, the government is strongly advised to upgrade the urban landscape and pedestrian environment. The TOD shall be accompanied by an intensive and diversified land use pattern to provide quality transportation services and restrict the use of automobiles and cars. Mu and Jong (2012) [
3] propose the TOD evaluation criterion characteristics, which include urban design, governing design, land use, restriction of car use, transportation services and real estate, to serve as measurement elements to determine whether Dalian is equipped with the prerequisites of a city. Taking the governing design as an example, the original transportation system and urban planning of Dalian were unable to achieve governing/administering conditions. The planners only focused on the major regions, which caused a lack of coordination within the planning of the urban traffic system, including a lack of public institutes to coordinate the different transport service schedules, transport route maps and passenger fare lists. After introducing the TOD concept to Dalian City, general urban planning and rapid railway transit planning began. The TOD also produced several satellite programs for railway transit and connection with new towns.
The majority of the literature on TOD studies has focused on exploring the effect of TOD on land use. In recent years, many cities in the U.S. have begun to discuss the economic development that is brought forth by the surrounding areas of transport system stations. Denver as an example, by probing the causes of Denver’s urbanization. Their findings show that from 1997–2010, Denver adopted TOD characteristics to engage in a railway transport system and high-density, mixed-use development, which greatly upgraded the average level of Denver’s urbanization density. The influence resulted in an increase of 180,000 residential housing units, 5,300,000 square feet of retail space, 5,400,000 square feet of office space and 6,200,000 square feet of medical space [
4]. Ratner and Goetz (2013) [
4] believe that the five major characteristics of a successful TOD model include location, rich mix of choices, value, place-making and transit stations. Location refers to the relative location of the transportation stations to living areas, workplaces, offices, shopping areas, entertainment spots, parks and other local infrastructure. If the station is closer to the above locations, people are more likely to use walking and bike-riding areas, as well as public transportation services. The rich mix of choices refers to a maximum combination of all surrounding living areas, transportation stations and shopping centers/malls, which aim to allow the people living around the TOD stations to enjoy traveling, even in a thoroughly trafficked area, as well as shopping convenience [
4]. Value is centered on living areas, shops, offices, shopping centers/malls, entertainment spots, parks,
etc., within 500 m of the TOD station, amounting to a solid value or the sum of the abstract value of people’s comfortableness produced by the introduction of the TOD concept. Place-making refers to the importance of selecting a station’s location. The old, first-generation transport systems, such as those in Washington D.C., San Francisco and Chicago, have significant and inherent restrictions to developing the TOD concept. For example, the transit stations influence employment, living areas, culture, entertainment, shopping facilities and, consequently, the city’s economy.
One of the basic TOD characteristics is the high development-density of land, the purpose of which is to increase land use efficiency by fostering development density. An increase in development density can not only increase the flow of passengers using the public transportation infrastructure and increase the revenue of the transport service providers, but can also increase the number of people in the commercial centers within the region, thus raising the commercial value of such a region. Cervero and Kockelman (1997) [
5] mainly adopted the development density, mixed land use and urban design of creating a pedestrian-friendly environment near the transit center as the main TOD planning model. Cervero
et al. (2009) [
6] used dwelling units per hectare, percentage of land area occupied by buildings, average building floor height and plot ratio as the factors to conduct their research. Sung
et al. (2011) [
2] considered Seoul as an example to perform a case study on a TOD high-density city. In their study, they also used the sum of residential density, commercial density and office density to estimate the building floor area of land use. The study used building density, architectural volume, residential population, employed population, employment and the percentage of land area occupied by buildings to serve as the density characteristics to estimate the TOD environment characteristics.
The TOD concept provides many types of convenient services, such as stores, banks, shopping centers/malls, parks/public green spaces,
etc., to meet the needs of the residents. Mixed land use can be implemented not just by ground area or multiple buildings within an area, but also within the same building, which is called vertical-mixed land use. Cervero
et al. (2009) [
6] used the entropy index of land use mix, the proportion of buildings vertically mixed and the proportion of buildings and the double use of total buildings in relation to the total building area to estimate the mixed-use characteristics of TOD environment characteristics. Sung
et al. (2011) [
2] used land use mix to estimate mixed use and to separate it into two different types for estimation. One type is to use resident and non-resident area to estimate index and land use type. The other is to estimate the diversity by using resident type, commercial type, office type and other types of land use.
Deng and Nelson (2013) [
7] believe that if the government has its own budget limit concern, the government can adopt the economical BRT (bus rapid transit) system to solve the problem. The BRT system contains a high-quality transportation service and a cost-effective advantage, such as the BRT Number 1 in Beijing, which significantly increased convenience for the communities close to the city along the BRT highway road network, greatly improving traffic problems in the southern areas. Hence, the author proposes three conclusions from the findings on the basis of the BRT Number 1 project: first, BRT can provide a higher passenger-carrying capacity in faster, more reliable and more comfortable conditions, as compared to conventional bus routes; second, the BRT system can accelerate a change in travel behavior, while the BRT can also serve as important transit locations for improving local transportation; third, an important BRT transit station can produce a positive attraction effect on the residential industry. In addition, the author also suggests that the design of the BRT station itself needs to improve. Using the Beijing station as an example, BRT stations often provide safe pedestrian overhead bridges or underground passages and are equipped with escalators. However, lacking barrier-free accessible elevators, the BRT station becomes inconvenient for special groups of people, such as bicycle riders, the disabled, pregnant women, children and the elderly trying to enter or exit.
Jun
et al. (2012) [
8] used Seoul as an example for their study. Their findings show that the higher employed population and level of mixed land use help foster better public transportation development. The solution to the high frequency of automobile use is to upgrade the public transport services for local residents, encourage TOD to extend its development to the urban outskirts and encourage citizens to change their behavior patterns when using transportation, such as changing from driving cars to taking public transportation systems. Jun
et al. (2012) [
8] suggest that the government can implement incentivizing measures to attain a balance between resident area and employment status, which can benefit the factories and enterprises that moved to the urban outskirts and lower the use of personal transportation vehicles.
The TOD model attaches importance to the walking environment, as the TOD spatial scale is mainly measured by the use of walking distance. Thus, the walking environment must be human-based, allowing people to enjoy a comfortable, safe and convenient pedestrian space. Calthorpe (1999) [
9] believes that a good walking environment constitutes the most important part of the TOD. Hence, there is a need to create a comfortable walking environment at all starting and stopping points for all of the transport routes and passages. We also need to plant trees along both sides of roads and streets and doors for buildings, which will truly allow the walking environment to become more pedestrian-friendly and foster the TOD.
Frank and Devlin (2010) [
10] point out that when living in a community with a good walking environment, one only needs to walk or use public transportation two to three times or more to reduce the use of automobiles by 58%. Furthermore, street connectivity and land use mix can also influence the willingness of residents to walk. Sung
et al. (2011) [
2] use different types of streets and building patterns to evaluate the degree of convenience for pedestrians and drivers.
Litman (2012) [
11] suggests that living in a community with pedestrian and bicycle-riding convenience can help reduce the use of automobiles and improve traffic congestion, greatly contributing to more converged mixed-land development. Jiang
et al. (2012) [
12] use protection, comfort, enjoyment and directness to serve as indicators for evaluating the BRT. One of the indicators refers to traffic safety risks. It is used to evaluate whether or not pedestrians are safe while walking on the pedestrian sidewalk. The findings prove that less than one-third of citizens believe that walking on the sidewalk is safe. Comfort means convenient walking by the pedestrians, including the barrier-free accessibility concept, quality of sidewalk construction and the cleanness and tidiness of the road/street. The findings point out that about 67% of the citizens in Jinan are satisfied with the comfort of the sidewalks of Jingshi Boulevard. Enjoyment refers to the aesthetic standard, and about 70% of citizens are satisfied with Jingshi Boulevard’s sidewalks. Directness refers to the curvature of the pedestrian sidewalk, the measured data of which comes from a direct survey and on-site collection regarding the curvature of the pedestrian sidewalk and engineering measurement means. The findings indicate that the average coefficient of the BRT sidewalks on Jingshi Boulevard is 1.59; the boulevard itself is 1.36, and the expressway corridor of the BRT is 1.33, which means that pedestrians need to spend 17%–20% more time to reach the BRT station.
The most important core of TOD will be transport services. Successful TOD relies on the attractiveness of the transport services. Generally, railway transport is the main means of transportation, while road transport is the second most important. In the TOD planning area, land development and transport operation are interdependent. Therefore, the quality of the transport services depends not only on the frequency of dispatching trains and operational efficiency, but also on the design of the bus stop or the building design of the bus transit station, route indicator and schedule coordination between different kinds of transportation means/vehicles. These factors can influence the quality of transportation services. Cervero
et al. (2009) use the quantity of public schools, hospitals, public libraries, shopping centers, churches and banks to serve as the indicators for evaluation, while Sung
et al. (2011) use the travel time of automobiles or trains from one area to another and the average travel time of taking a train or taxi cab from a specific area to the other CBDs for evaluation [
2,
6].
The accessibility of public transportation is represented by service quality and convenience for citizens when taking public transportation to a certain location. The study by Cervero
et al. (2009) indicates that TOD can decrease the percentage of citizens using personal transportation means, such as cars. The far and near public infrastructure facility environment represents the service quantity of the public infrastructure facilities that can be reached within a certain time unit or the degree of accessibility from the activity or work location to the nearby local public infrastructure facilities. Therefore, the accessibility degree of the location has a huge influence on the distance of travel. People who live far from the public infrastructure facilities tend to be more willing to drive than people living near the public infrastructure facilities. Cervero
et al. (2009) [
6] use BRT numbers, the shortest distance to the BRT station and the BRT shuttle bus station numbers for measurement reference bases, while Sung
et al. (2011) [
2] use a fixed train station area for a case study in order to explore the quality of public transportation services and to discuss the connection between the stations and the passengers. For example, the average allocation time for the bus route schedule, the operating number of buses at a speed of less than 20 kilometers per hour, the number of exits of one railroad station and the distance to nearby stations are all considered.
In addition, Olaru and Smith (2011) [
13] take the cities of west Australia as the research subject for their case study. The author uses stores, schools, medical centers, entertainment facilities and public transportation facilities for empirical analysis to discuss the factors that make TOD attractive to residents. The findings show that residential locations and transportation facilities closer to the city appear more attractive to residents. However, the study only focuses on the transportation environment and does not explain the real reason that the residents want to continue to live in such locations. Hence, this study shall use the built environment to discuss the degree of satisfaction of residents toward the current TOD living environment characteristics.
According to the above literature regarding the TOD living environment characteristic density in this study, it adopts building density, building volume, resident population, employed population, employment and the percentage of land area occupied by buildings as the density characteristics of evaluating the TOD environment characteristics. On the part of the mixed use or the diversity in this study, it adopts mix use, vertical mixing and the balance between residency and business. As for the design, it adopts walking environment, bicycle-riding environment, parking space, parks, green spaces and safety to serve as the design characteristics for evaluating the TOD environment characteristics. As for the high-quality traffic transport service environment, it adopts schooling, medical treatment, office work, leisure and shopping to serve as element factors for measuring the design characteristics of TOD environment characteristics. As for the transferring distance between the public transportation systems, this study uses the bus stops, coach transfer stations, train stations, MRT (subway/metro) stations and taxi stops to serve as the transferring distance characteristics of public transportation for evaluating the TOD environment characteristics.
While studies of TOD and the implementation of TOD have been popular topics in America, Taiwan was stagnating in the reverse planning strategy of “land development guiding public transportation”. That is, the location of public transportation systems is determined by the demand of land development, which has further accelerated the arbitrary land development and low-efficiency disposition of land use, forming the developing model of “transit-adjacent development (TAD)”. Moreover, current land development in Taiwan is based on “car-oriented development”, which generates urban sprawl, and the role of public transportation has accelerated the deterioration of this phenomenon. Because the experience of the development process of metropolitan and transportation policies in Taiwan is similar to that of other countries, Taiwan has recently urged for a policy shift to TOD, in an attempt to solve the current crisis of urban development. Since the first TOD study conducted in Taiwan, there have been more relevant studies proposing the concept and strategy of TOD development. However, there has not been any study of the appropriate target system of TOD in Taiwan; without a common target, TOD becomes a multi-headed strategy and fails to fulfill its fundamental meaning.
In the past, urban development in Taiwan concentrated on road construction, where it encountered similar difficulties. According to the National Energy Conference in 2006, greenhouse gas emissions revealed by the Ministry of Transportation and Communications have been increasing in recent years, and road travel is responsible for 85% of the emissions in the entire transport division. It is estimated that these emissions will grow four-fold from 1990–2025. Energy consumption accounted for 15.1% of national energy consumption in 2003 and is the second-largest energy consumption division in Taiwan, but it is worst in terms of the achievement rate of saving energy, at only 28%. Further observation shows that the energy consumption of the road system accounts for 93.4% of the entire transportation division, while the rail transportation system takes up less than 2%. With regard to road transportation, private cars and motorcycles accounted for a large percentage of energy consumption; the number of small private cars in Taiwan increased significantly from 1971–2003, but the annual growth rate shows a generally descending trend. The high growth rate of the use of automobiles and motorcycles will cause numerous issues, such as an increase in the excessive consumption of fossil fuels, greenhouse and pollution gas emissions and traffic congestion. In addition, in response to the “Kyoto Protocol”, which came into effect on 16 February 2005, the issue of the use and possession of private transportation should be the major concern in our country.
Recently, Taiwan has started considering the development of public transportation (particularly a mainstream rail transportation system), such as the Mass Rapid Transit Act in 1988 and the Regulation of Encouraging Public Transportation Development in 2002. However, none of the regulations and related policies mention integration plans for public transportation and land use to resolve the problems. When making policies, the government takes into account the American experience of implementing TOD through the improvement of planning policies and systems to change the previous demand-oriented, unplanned developmental style of land and public transportation, in order to achieve the following policy goals: prevention of unreasonable and inefficient urban expansion, saving public financial expenditure, promoting the effective use of land development, protection of environmental resources, reconstruction of the use of urban space and providing high quality residential environments in the urban space.
This study refers to the TOD literature proposed by Sung
et al. (2011), Mu and Jong (2012) and Ratner and Goetz (2013) [
2,
3,
4]. This study believes that the above-mentioned 25 TOD living environment characteristics represent five major aspects, including a high-density living environment, mixed land use environment, pedestrian-oriented walking environment, high-quality transporting services environment and the far and near surrounding environments to the public transportation station and public facilities, as shown in
Figure 1.
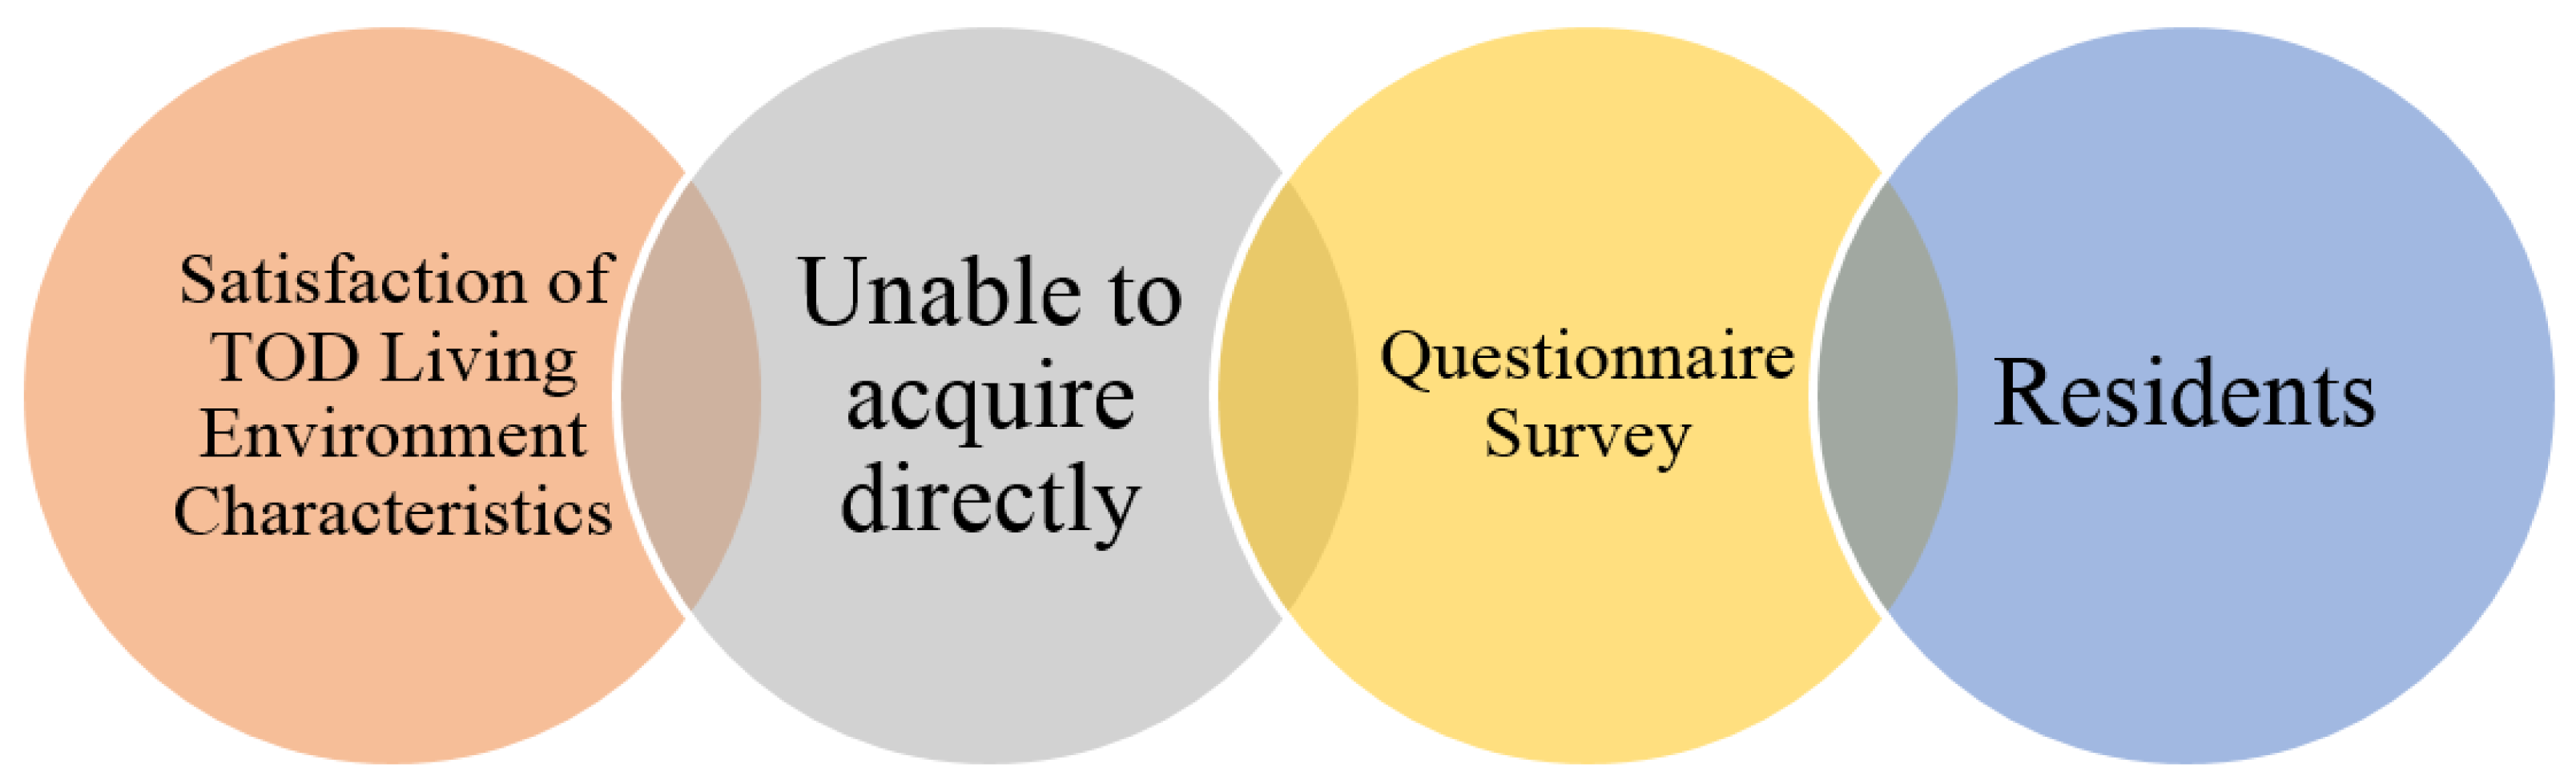
Currently, most of the TOD literature has been aimed at the present city situations and is based on the actual land status characteristics, such as the percentage of land area occupied by buildings, the floor area of the buildings, land use structure entropy index, street density, etc., under which direct enquiries of residents regarding their feelings about their current living environment rarely occur. In city planning, the opinions and thoughts of the residents are very important. Therefore, this study focuses on the perspective of the residents and uses 25 TOD living environment characteristics to understand the satisfaction level of the residents living with such environment characteristics.
4. Questionnaire Design
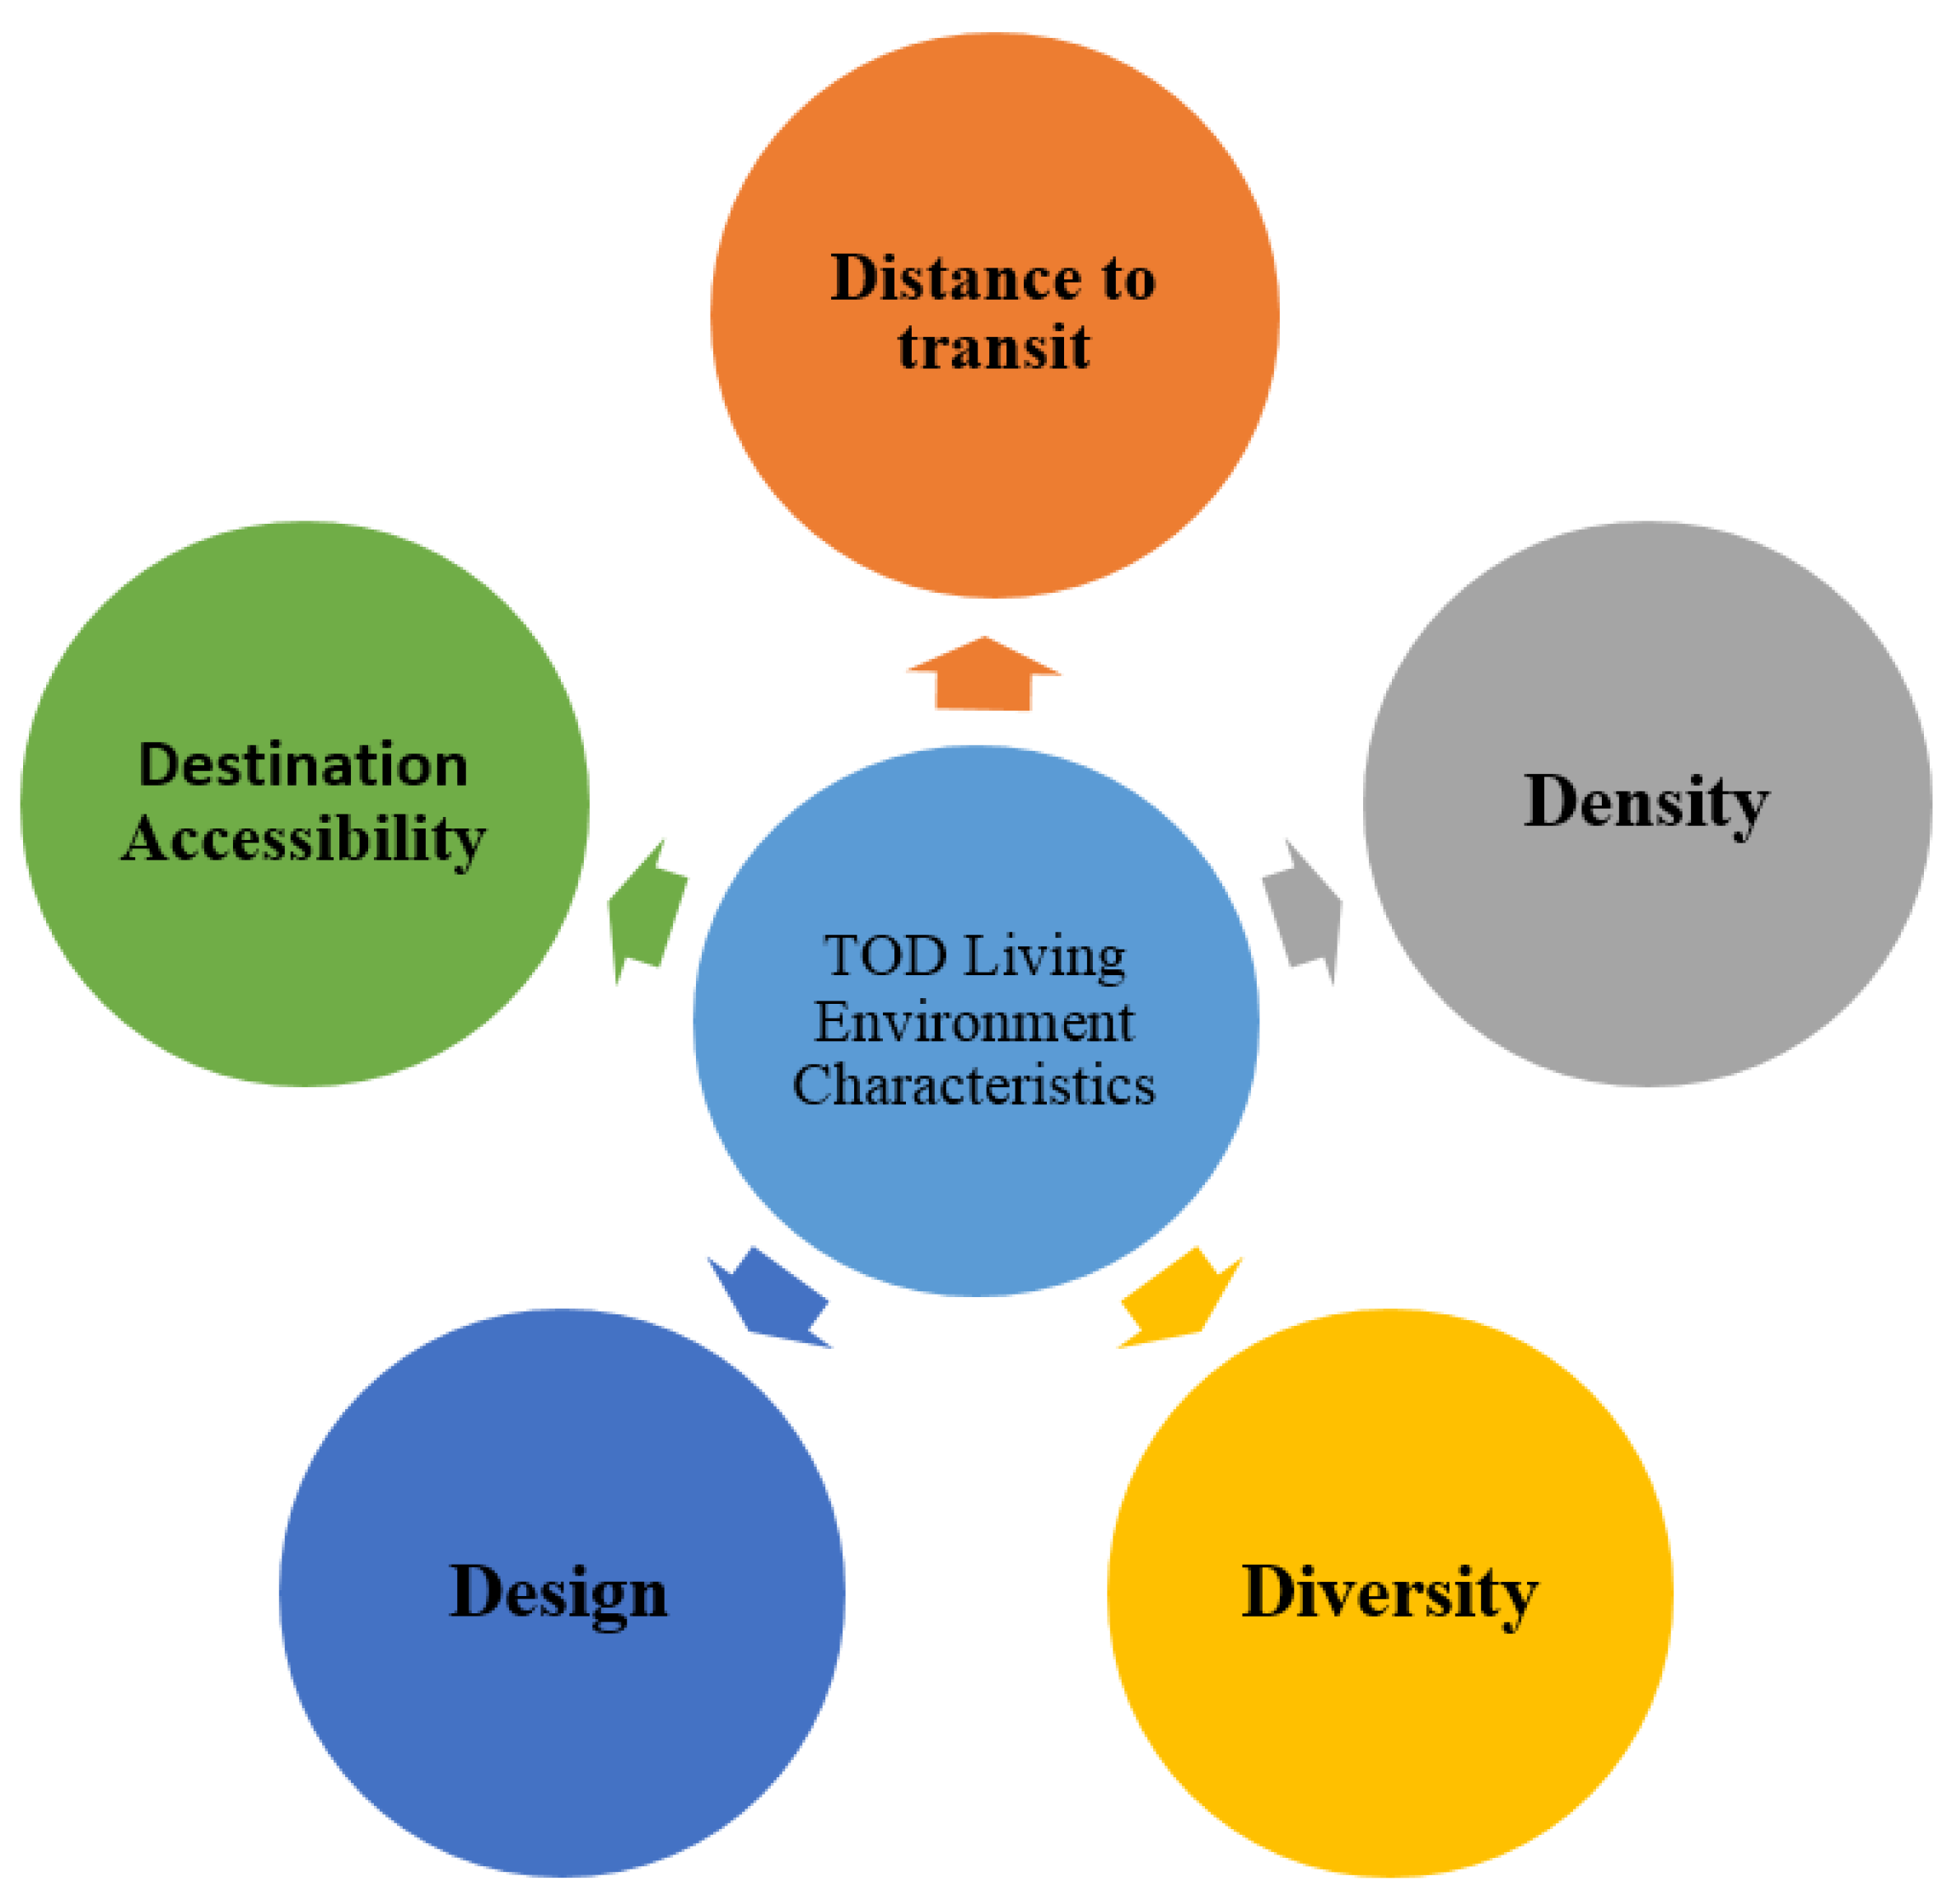
This study mainly targets TOD living environment characteristics. Therefore, it is necessary to conduct questionnaire interviews. Accordingly, it is important to determine an appropriate questionnaire design and an information framework on the following 5D (density, diversity, design, destination accessibility, distance to transit) in order to truly reflect the actual thinking of the residents and to collect the necessary information materials. Please refer to
Figure 4 for the information collection framework.
This study focuses on the specific area within a 500-meter radius around the new Banqiao Station of the Banqiao District of New Taipei City. First, we determine the exact names of the streets/roads where the above center is located, e.g., Mingchuan Road, Gongguan Street, Xinchan Road, Chanchien Road, for the facilitation of an on-site questionnaire survey. The major questionnaire interview subjects are focused on the local residents. We start from the actual address (i.e., xx Section of xx Road/Street) where the residents reside. We introduce ourselves first, then ask passers-by whether they are local residents and then ask if they would agree to participate in our questionnaire interview. The questionnaire comprises statistical analysis and a five-point Likert scale and quantity table for further research. The questionnaire is divided into three parts: the first part serves as a satisfaction inquiry and investigation to understand to what extent the residents are satisfied with various local TOD living environment characteristics; each question is divided into five levels, from very dissatisfied (one point), to very satisfied (five points), as well as acceptable (three points). The second part is an investigation of overall satisfaction and asks hypothesis questions about the following five subjects, “traffic transportation environment”, “living environment”, “working environment”, “leisure environment” and “schooling environment”, to see if the residents are satisfied with the overall living environment. The third part is basic information collection from the interviewees, including their gender, age, job, educational background and monthly income, for follow-up statistical information analysis.
This study mainly explores the impact of TOD environment characteristics on resident satisfaction. The data source has to be collected firsthand through questionnaire interviews in order to conduct a complete analysis. TOD environment characteristics mainly derive from previous literature. The TOD environment characteristics include high-density living environment, mixed land use environment, pedestrian-oriented walking environment, high-quality traffic transport services and the far and near distance environment to mass transit/transport station or public infrastructure facilities.
Cervero
et al. (2009) and Sung
et al. (2011) conducted studies aimed at TOD issues, but most scholars have only focused on the investigation of the current status of urban land use [
2,
6]. Taking density for example, scholars only calculated the occupied land area by actual buildings, floor area ratio, commercial density,
etc. None of the studies ever centered on the viewpoints of the residents, despite the fact that residents’ comments and viewpoints constitute a very important part of urban planning and deserve attention. How to plan a living environment that is tailored to the local residents is a very important issue. Therefore, what this study focuses on is not what previous scholars have adopted, which are the values of actual land characteristics for measurement; instead, this study translates such measured values into residents’ acknowledgement and satisfaction with land characteristics where they currently reside and explores residents’ actual satisfaction. The questionnaire questions and measurement definitions are displayed as follows, in
Table 1.
5. Model Analysis
5.1. Statistical Result of Basic Questionnaire Survey Data
The total number of people that were interviewed under the questionnaire survey of the Banqiao MRT station was 370, of which there were 364 valid samples and six invalid samples. There were 171 male interviewees, accounting for 47% of the total interviewees, and 193 female interviewees, accounting for 53%. Fifteen-point-one percent of interviewees were less than 18 years old; 22% of interviewees were between 19 and 25 years old; 31% of interviewees were between 26 and 35 years old; 8% of interviewees were between 36 and 49 years old; 11% of interviewees were between 50 and 64 years old; and 12.9% of interviewees were more than 65 years old. In terms of occupation, 30.8% of interviewees were students; while 12.1% of interviewees were involved in public services; 9.9% of the interviewees were from the service sector; and 15% of the interviewees worked in other occupations. As for the level of educational background, 54% of interviewees were of college level, and 14% of interviewees held a master’s degree or higher. Concerning income, 28% of interviewees earned 20,000 TWD/month; 24% of interviewees earned between 20,001 TWD and 30,000 TWD; and 18% of interviewees earned an income between 30,001 TWD and 40,000 TWD.
5.2. Questionnaire Reliability Analysis
This study expects to discover the quality of the questionnaire survey design through reliability analysis. Therefore, the first part of the questionnaire, survey satisfaction X1–X25, and the second part, overall satisfaction Y1, were verified by using Cronbach’s alpha model. The result shows that the total reliability coefficient was 0.871, confirming that the internal consistency of the questionnaire survey is good enough to support the results of this research.
5.3. Average Satisfaction of 25 TOD Characteristics
Table 2 is the satisfaction descriptive statistics table of 25 TOD living environment characteristics, which allow us to know whether the resident is dissatisfied with some current TOD characteristics and also allow us to improve those dissatisfying conditions beforehand, if there are any.
Using 5D categorization to differentiate the top three characteristics, with regard to density, the residents proved more satisfied with building volume, resident population and building density in terms of TOD environment characteristics; on the part of mixed use, the residents proved more satisfied with a balanced residency/business combination, the ratio of entertainment centers and parks and a vertical mix of TOD environment characteristics; on the part of design, the residents are more satisfied with parks/green spaces, parking space and bike-riding TOD environment characteristics; on the part of accessibility, the residents are more satisfied with shopping, schooling and medical care; on the part of distance, the residents are more satisfied with city bus stop, taxi stand and coach transfer station TOD environment characteristics. Therefore, if the government or the planning sector wants to conduct improvements or planning efforts toward individual 5D characteristics, they should be aimed at the improvement and planning of the fourth and fifth ranking places, where the residents are more dissatisfied with the characteristics.
The residents are most dissatisfied with the railway station, MRT (sub/metro) stations, coach transfer station, taxi calling stand, mixed-use, business, walking and bike-riding environments, as well as parking and the walking space. If the government or the planning sector wants to conduct improvements or planning efforts toward all of the TOD characteristics, the first efforts should be made on the above dissatisfaction characteristics.
5.4. The Factor Analysis
Since there are many satisfactory items from the 25 living environment characteristics, we use factor analysis to simplify them via principal components analysis and varimax and then extract an eigenvalue of greater than one. The 25 living environment characteristics represent a good result after factor analysis. Furthermore, the Bartlett test value attains a significant level of 0.000, indicating that these items are suitable for factor analysis.
In addition, from the total variation explaining scale, we understand that of the 25 living environment characteristics, there are six satisfactory components, which are different from this study’s five desired components. Therefore, we need to delete more questions, namely questions from the rightmost factors in the statement paper sheet. We delete the sixth component, which states that “the people reside here more than the people who work here in your neighborhood”, with the highest factor load of 0.675. Then, we ran the factor analysis again, getting the KMO (measured by the Kaiser-Meyer-Olkin) statistic value of 0.840 on the remaining 24 living environment characteristics, representing a normal status. Cronbach’s alpha values are shown in
Table 3.
5.5. Stepwise Regression Analysis
A stepwise regression analysis is adopted to forecast the living environment satisfaction of the residents living in the area surrounding Banqiao Station via TOD living environment characteristics and the residents’ personal characteristics. We further establish this study’s forecast model of residential satisfaction, as described below.
Here, we set the dependent variable as
then we set five major factors of TOD living environment characteristics as independent variables using stepwise regression analysis (predictive regression method), and the data results are shown in
Table 4.
This study adopts a stepwise analysis approach to select an optimal combination of independent variables, and the computer will automatically select the relevant independent variables to enter into the model, which can temporarily avoid collinearity problems.
Land use and transportation design of the first-stage factors can explain 16% variance values (F change amount of 68.786, p = 0.000). After adjustment, R-squared proves to have 15.7% of explanatory power. Through the gradual analysis approach, we discovered that the coefficients possess only one independent variable and no collinearity problems, which means that the factors of land use and transportation design are independent of other factors’ interference.
The second selected independent variable is Factor 5 for density, which can explain 19.2% variance values (F change amount of 14.211,
p = 0.000), satisfying the selection criteria. Model 2 has common factors: land use and transportation design and Factor 5: density’s two independent variables. After it is adjusted, it can explain 18.7% of the variance values, verified with F test results, of which the explanatory power possesses statistical significance.
Table 5 shows the regression coefficient table for TOD living environment and living environment satisfaction.
After the VIF test, either Model 1 or 2, the variable VIF values are less than 10 and show that there is no significant overlap between the independent variables. The last equation contains two independent variables. The equation is as follows: the residential satisfaction of TOD living environment = 0.926 + 0.604 Factor 1 for land use and transportation design +0.267 Factor 5 for density.
By using this equation, we are able to forecast the residential satisfaction of the actual living environment, with an estimated standard deviation of 0.930. Through the equation’s regression coefficients, we can also understand that the greatest impact is Factor 1 for land use and transportation design on the residential satisfaction with the living environment, which is followed by Factor 5 for density.
5.6. Personal Characteristics and TOD Living Environment
Here, we use a forced entry of variance approach to input residents’ personal characteristics, gender, age, occupation, level of education and income into the regression model test. Since the personal characteristics of residents belong to the category variables, we must then use the categorical variables, with gender referring to
women variable for the reference category; as to the age, we refer to
above 65 years old variable as the reference category; for occupation, we refer to
other variable for the reference category; for the educational level, we refer to
graduate school and above variable for the reference category; for income, we refer to more than NT$80,001 for the reference category. Meanwhile, we set the dependent variable as
The independent variables use Factor 1 for design, Factor 2 for high-quality transportation services, Factor 3 for accessibility, Factor 4 for mixed-use and Factor 5 for density.
Table 6 summarizes the residential satisfaction of residents’ personal characteristics and TOD living environment characteristics.
For gender, we adopt a forced entry approach to engage variable analysis. By doing so, we will discuss all of the variables. Through the forced entry multiple regression equation, we can test each independent variable for the dependent variables’ explanatory power. The findings show that if we add a gender-visualized variable into the regression analysis, it significantly enhances the explanatory power. Gender and five TOD living environment characteristic factors have an impact on residential satisfaction, with an overall R-squared interpretation of 0.204, indicating that five TOD living environment characteristic factors can explain the residential satisfaction of 20.4% in variance values. After adjustment, the R-squared value is 19.0% in the interpretation ratio. The model test results point out that the regression effect reaches F change value of 15.202 with statistical significance.
We reviewed two important papers. Firstly, Amérigo and Aragonés (1997) [
15] present a theoretical and methodological approach to the study of residential satisfaction, and they seek to give a general view of the relationships established between a person and his/her residential environment.Bonaiuto
et al. (1999) [
16] test a path model in which residential satisfaction, operationalized in terms of multidimensional perceived residential environment quality (PREQ), predicts neighborhood attachment, which is considered as the final criterion. Socio-demographic (age, sex, socio-economic level) and residential (length of residence both in a neighborhood and in Rome and the number of persons living together) variables are also included in the theoretical model as predictors of both PREQ and neighborhood attachment. Age is an important variable for residential satisfaction, which is highly correlated with occupancy.
Age and five TOD living environment characteristic factors have an impact on residential satisfaction, with an overall R-squared interpretation of 0.206, indicating that five TOD living environment characteristic factors can explain residential satisfaction effects of 18.1% in the variance values. After adjustment, the R-squared interpretation ratio is 18.1%. Model test results point out that the regression effect reaches F change values of 8.303, p = 0.000, with statistical significance. Of the six age-visualized variables, no significant factor is attained, indicating that different ages have no impact on the residential satisfaction evaluation.
When an occupational-visualized variable is added to the regression analysis, it proves that it significantly enhances the explanatory power. Occupation and five TOD living environment characteristic factors have an impact on residential satisfaction, with an overall R-squared explanatory power of 0.225, indicating that five TOD living environment characteristic factors can explain the residential satisfaction effect by 22.5% of the variance values. After adjustment, the R-squared values possess 19.2% of the interpretation ratio. The model test results point out that the regression effect reaches F change values of 6.740, p = 0.000, with statistical significance.
When the education level-visualized variable is added to the regression analysis, it proves that the explanatory power has significantly improved. The educational level and five TOD living environment characteristic factors have an impact on residential satisfaction, with an overall R-squared interpretation of 0.213, indicating that five TOD living environment characteristic factors can explain the residential satisfaction effect by 21.3% of the variance values. After adjustment, the R-squared ratio possesses 19.3% of the explanatory power. The model test results point out that the regression effect reaches F change values of 10.618, p = 0.000, with statistical significance.
When the salary variable and the income-visualized variable are added to the regression analysis, they significantly enhance the explanatory power. Monthly salary income and five TOD living environment characteristic factors have an impact on residential satisfaction, with an overall R-squared interpretation of 0.239, indicating that five TOD living environment characteristic factors can explain the residential satisfaction effect by 23.9% of the variance values. After adjustment, the R-squared explanatory ratio is 21.5%. The model test results point out that the regression effect reaches F change values of 10.044, p = 0.000, with statistical significance.
Furthermore, with the test of individual independent variables afterwards, we can understand the optimal explanation.
Table 7 shows the residents’ satisfaction regression coefficient table for residents’ personal characteristics and the residential satisfaction of TOD living environment characteristics.
Regarding gender, we refer to
women as the reference category and then further engage afterwards the test of individual independent variables. The coefficient estimates point out that Factor 1 for land use and transportation design has the best explanatory power of the beta coefficient up to 0.384, indicating that if Factor 1 for land use and transportation design in terms of TOD characteristics of the living environment increases, residents’ satisfaction will rise. Secondly, regarding Factor 5 for density, we get a beta coefficient of 0.174, indicating that if we increase the density of Factor 5 and the TOD living environment characteristics, it will also enhance residents’ satisfaction. The last equation will contain six independent variables as follows in
Table 7.
In terms of age, we refer to 65 years old and above variable for the reference category. When we further conduct tests on individual independent variables, we get the coefficient estimate results, which indicate that Factor 1 for land use and transportation design has the best explanatory power, with a beta coefficient as high as 0.383, indicating that if we can increase the TOD residential characteristics of Factor 1 for land use and transportation design for TOD living environment characteristics, we will enhance the residents’ satisfaction; this is followed by Factor 5 for density, with a beta coefficient of 0.165, indicating that if we increase the TOD living environment characteristics of Factor 5 for density, residents’ living satisfaction will be raised.
Regarding occupation, which refers to the other category, the results point out that further tests on the individual independent variable are useful; the coefficient estimates indicate that Factor 1 for land use and transportation design has the best explanatory power, with a beta coefficient as high as 0.383, showing that if we increase Factor 1 for land use and transportation design for TOD characteristics of the living environment, residents’ living satisfaction will improve. This is followed by Factor 5 for density, with a beta coefficient of 0.167, indicating that if we increase the TOD living environment characteristics of Factor 5 for density, it will also enhance residents’ living satisfaction.
Regarding educational level, we refer to graduate level and above. Furthermore, we test the individual independent variable afterwards, and the coefficient estimates point out that Factor 1 for land use and transportation design has the best explanatory power, with a beta coefficient as high as 0.380, indicating that if we increase the TOD living environment characteristics of Factor 1 for land use and transportation design, the residents’ living satisfaction will be enhanced; this is followed by Factor 5 for density, with a beta coefficient of 0.167, indicating that if we increase the TOD living environment characteristics of Factor 5 for density, we will enhance residents’ living satisfaction.
In terms of income, we refer to more than NT$80,001 for the reference category. Further tests afterwards on individual independent variables prove that the coefficient estimate results indicate that Factor 1 for land use and transportation design has the best explanatory power, with a beta coefficient as high as 0.398, showing that if we can increase the TOD living environment characteristics of Factor 1 for land use and transportation design, we will enhance residents’ living satisfaction. Next, this is followed by Factor 5 for density, with a beta coefficient of 0.167, indicating that if we increase the TOD living environment characteristics of Factor 1 for density, we will also enhance residents’ living satisfaction.
6. Conclusions
This study found that residents within a 10-min walking distance to the stores of TOD living environment characteristics are the most satisfied with the living environment; residents within a 10-min walking distance to the railway station of TOD living environment characteristics are the least satisfied. If ranking the arrangement of five major TOD characteristics, density, residents’ viewpoints toward building volume, residents’ viewpoints toward resident population and building density of TOD living environment characteristics are more satisfactory; regarding mixed-use, the residents’ viewpoints toward a balanced ratio of residency and businesses, the ratio of entertainment centers and parks, and a vertical mix of TOD living environment characteristics are more satisfactory; regarding design, residents’ viewpoints toward parks, green spaces, parking and the bike-riding environment of TOD living environment characteristics are more satisfactory; regarding accessibility, residents’ viewpoints on shopping, schooling and medical treatment, the TOD living environment characteristics are more satisfactory; regarding distance, residents’ viewpoints toward urban bus stops, taxi-calling stands, and coach transfer stations of TOD living environment characteristics are more satisfactory. If we use all of the TOD living environment characteristics for satisfaction sorting order, the least satisfactory for the residents includes train station, MRT stations, coach transfer station, taxi-calling stand, mixed-use, office, walking, bike-riding, parking and Vitasphere. Assuming that the future effort for the government or planning departments is to improve the living environment for TOD characteristics, it is recommended that the first efforts target the least satisfied 5D characteristics or what the residents consider the least satisfactory characteristics.
By using factor analysis, we get five major factors for TOD living environment characteristics, including Factor 1 for land use and transportation design, named “design”, with eight TOD living environment characteristics, such as “sufficient parking spaces for automobiles”, “bike-riding environment”, “comfortable pedestrian sidewalks with no motorcycles illegally parked nearby”, “collision of bikes and motorcycles”, “not too converged buildings”, “buildings are not too high or too big”, “parks are enjoyable and attractive” and “the area of the park is larger than that of the entertainment center.”
Since Factor 2 concerns public transportation, it has been named “distance to transit”, with six TOD living environment characteristics, including 10-min walking distance to the “coach transfer station”, “railway station”, “subway station”, “taxi-calling stand”, “the municipal government and district office”, “libraries, concert halls”, etc. Factor 3 concerns offices and business and is hence named “destination accessibility”, including four TOD living environment characteristics, such as 10-min walking distance to “stores or market”, “bus stop”, “school” and “hospital or clinic.” Factor 4 concerns shopping and is hence named “diversity”, with two TOD living environment characteristics, including “shopping centers and entertainment centers” and “shopping, residential, leisure and entertainment businesses or homes.” Factor 5 concerns density and is therefore named “density”, with four TOD living environment characteristics, including “nine-to-five workers”, “residents”, “buildings” and “offices and business buildings.”
After factor analysis, we used a forecast regression model and found that of the TOD living environment characteristics, only Factor 1 for land use and transportation design and Factor 5 for density are significant. The residential satisfaction of TOD living environment characteristics = 0.926, +0.604 Factor 1 for land use and transportation design, +0.267 Factors 5 for density. Therefore, if government departments want to engage in efforts to improve the living environment for TOD characteristics, it is recommended that they target Factor 1 for land use and transportation design characteristics, which include eight TOD living environment characteristics for their priority improvement strategy.
If we include the resident characteristics and adopt a forced entry approach for validation, we can only get Factor 1 for land use and transportation design and Factor 5 for density, which can attain a significant level and are positively correlated. In terms of other residents’ personal characteristics, they prove insignificant. Our findings are generalized in
Table 8.
The scope of research shall center on the newly-assigned Banqiao District of New Taipei City (Xin-Ban Special District) within a 500-meter radius from the center. The so-called Xin-Ban Specific District Area features a combination construction of integrated four-railroad systems, containing an area of 10,000 hectare of parks, one large square, the Grand Taipei Opera House, the Convention & Exhibition Center, tourist hotels and shopping complex centers or shopping malls. Compared to other cities and counties of the current development type, this area possesses considerable advantages. Therefore, in the research planning stage, it is highly recommended that appropriate importance be attached to the local development characteristics in order to avoid inconsistency in the area’s development, which may in turn cause inappropriate misinterpretations or mistakes for urban and rural development planning.


