
Typification for Façade Structures Based on User Perception

Abstract
:1. Introduction
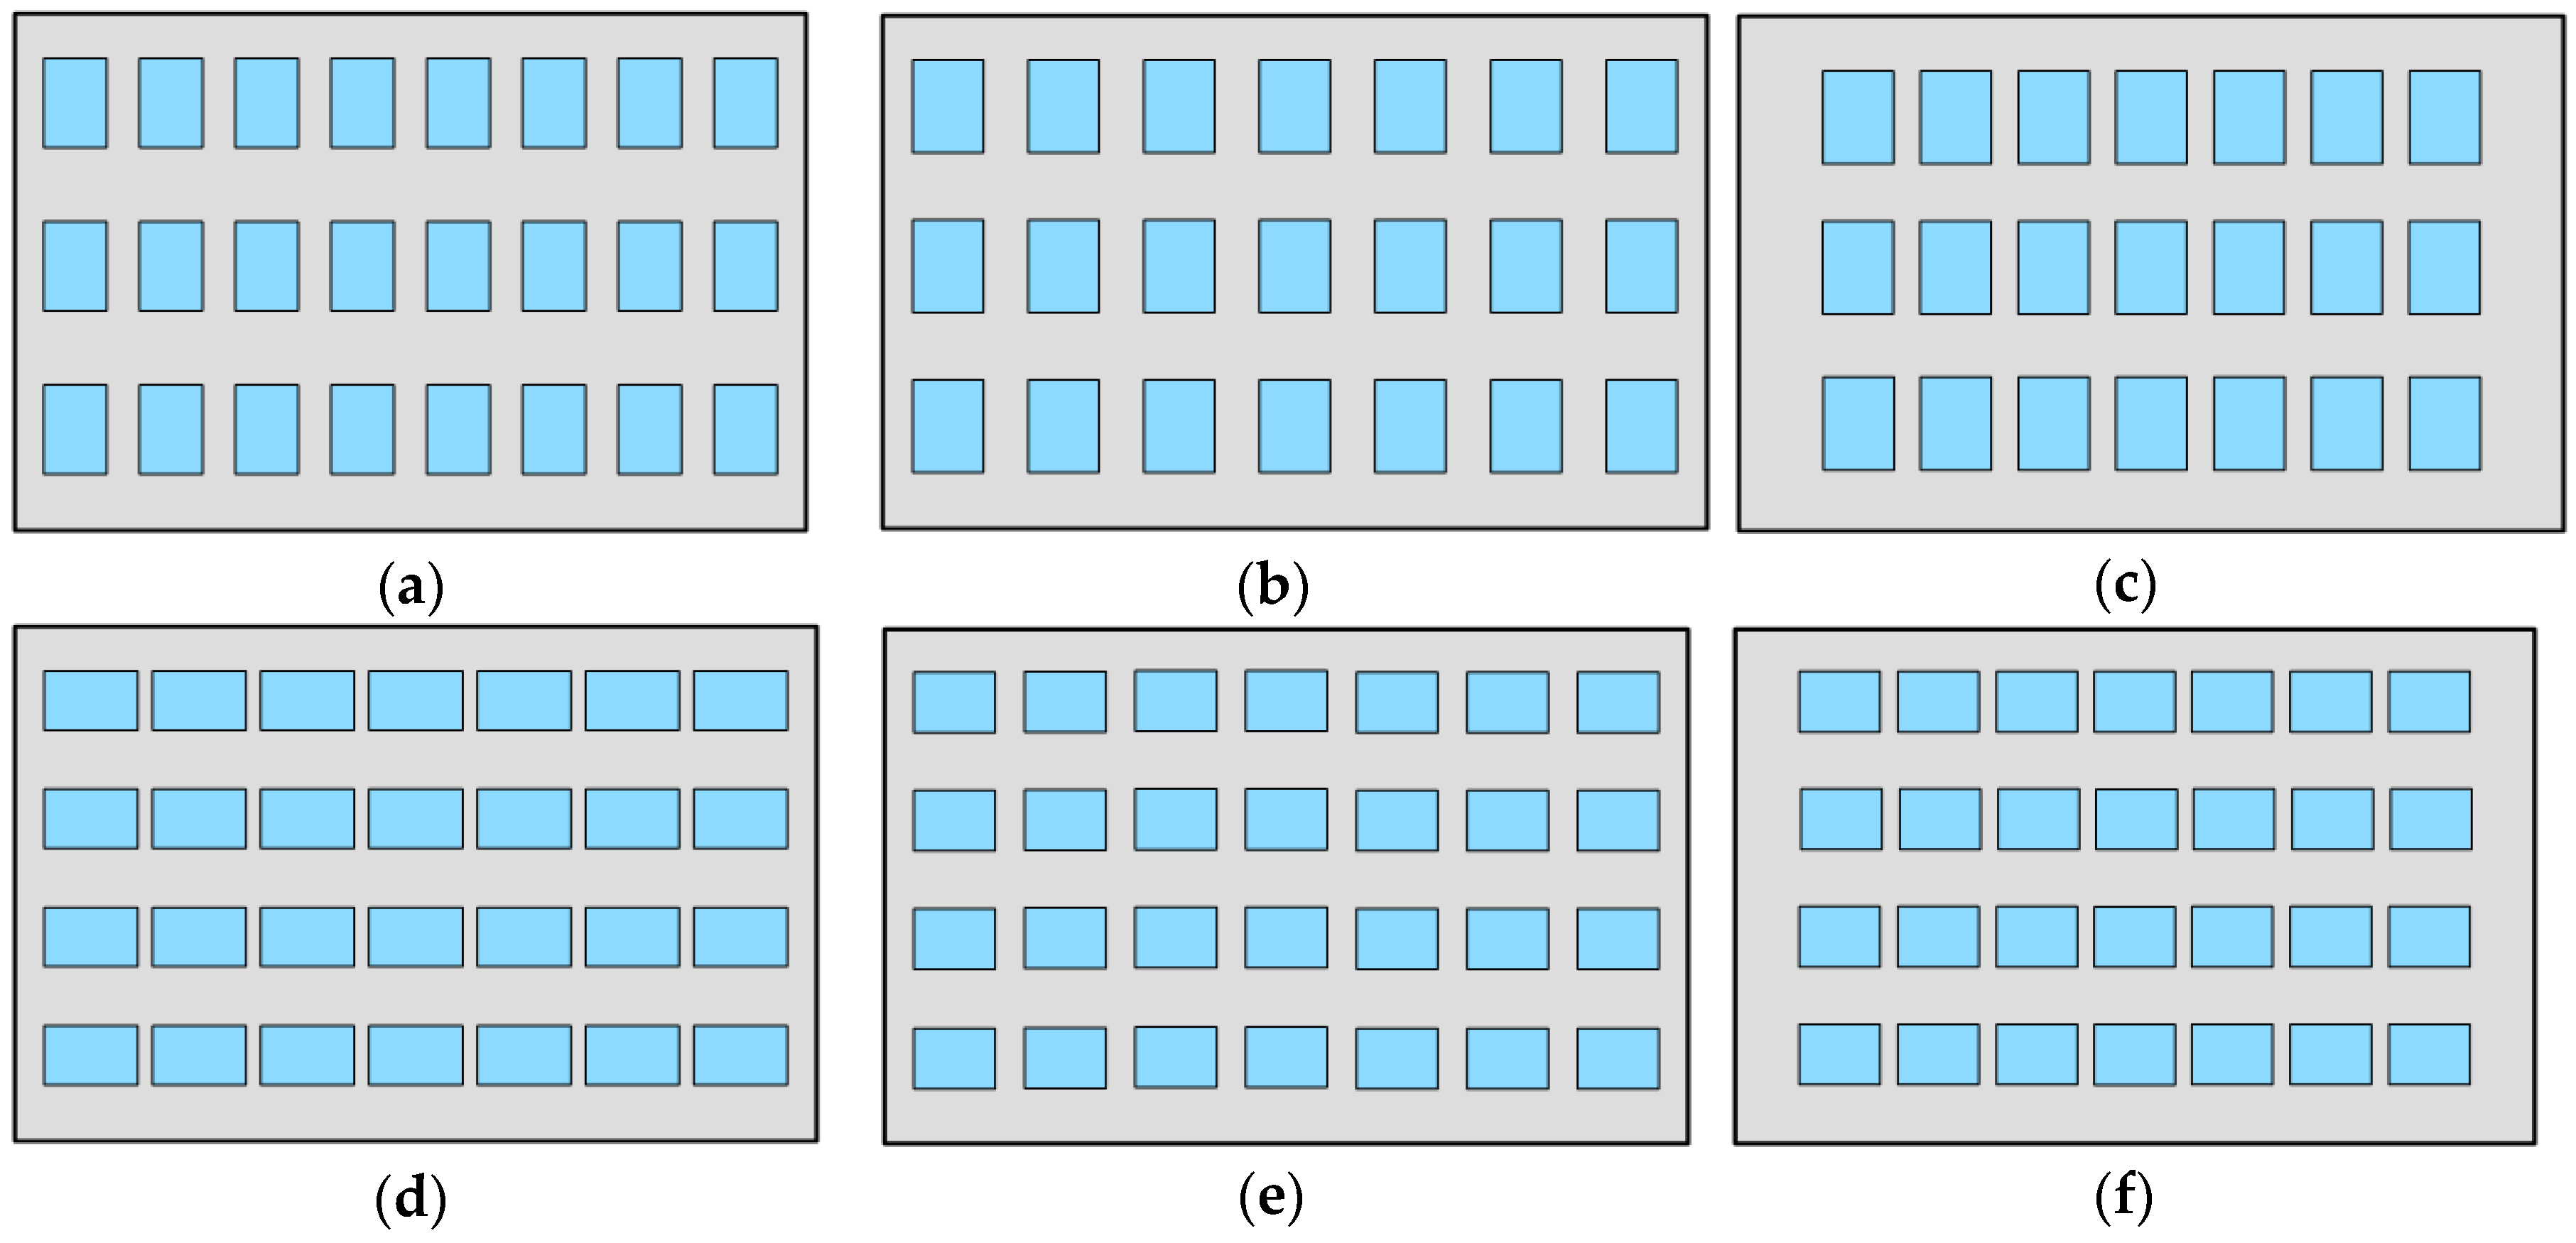
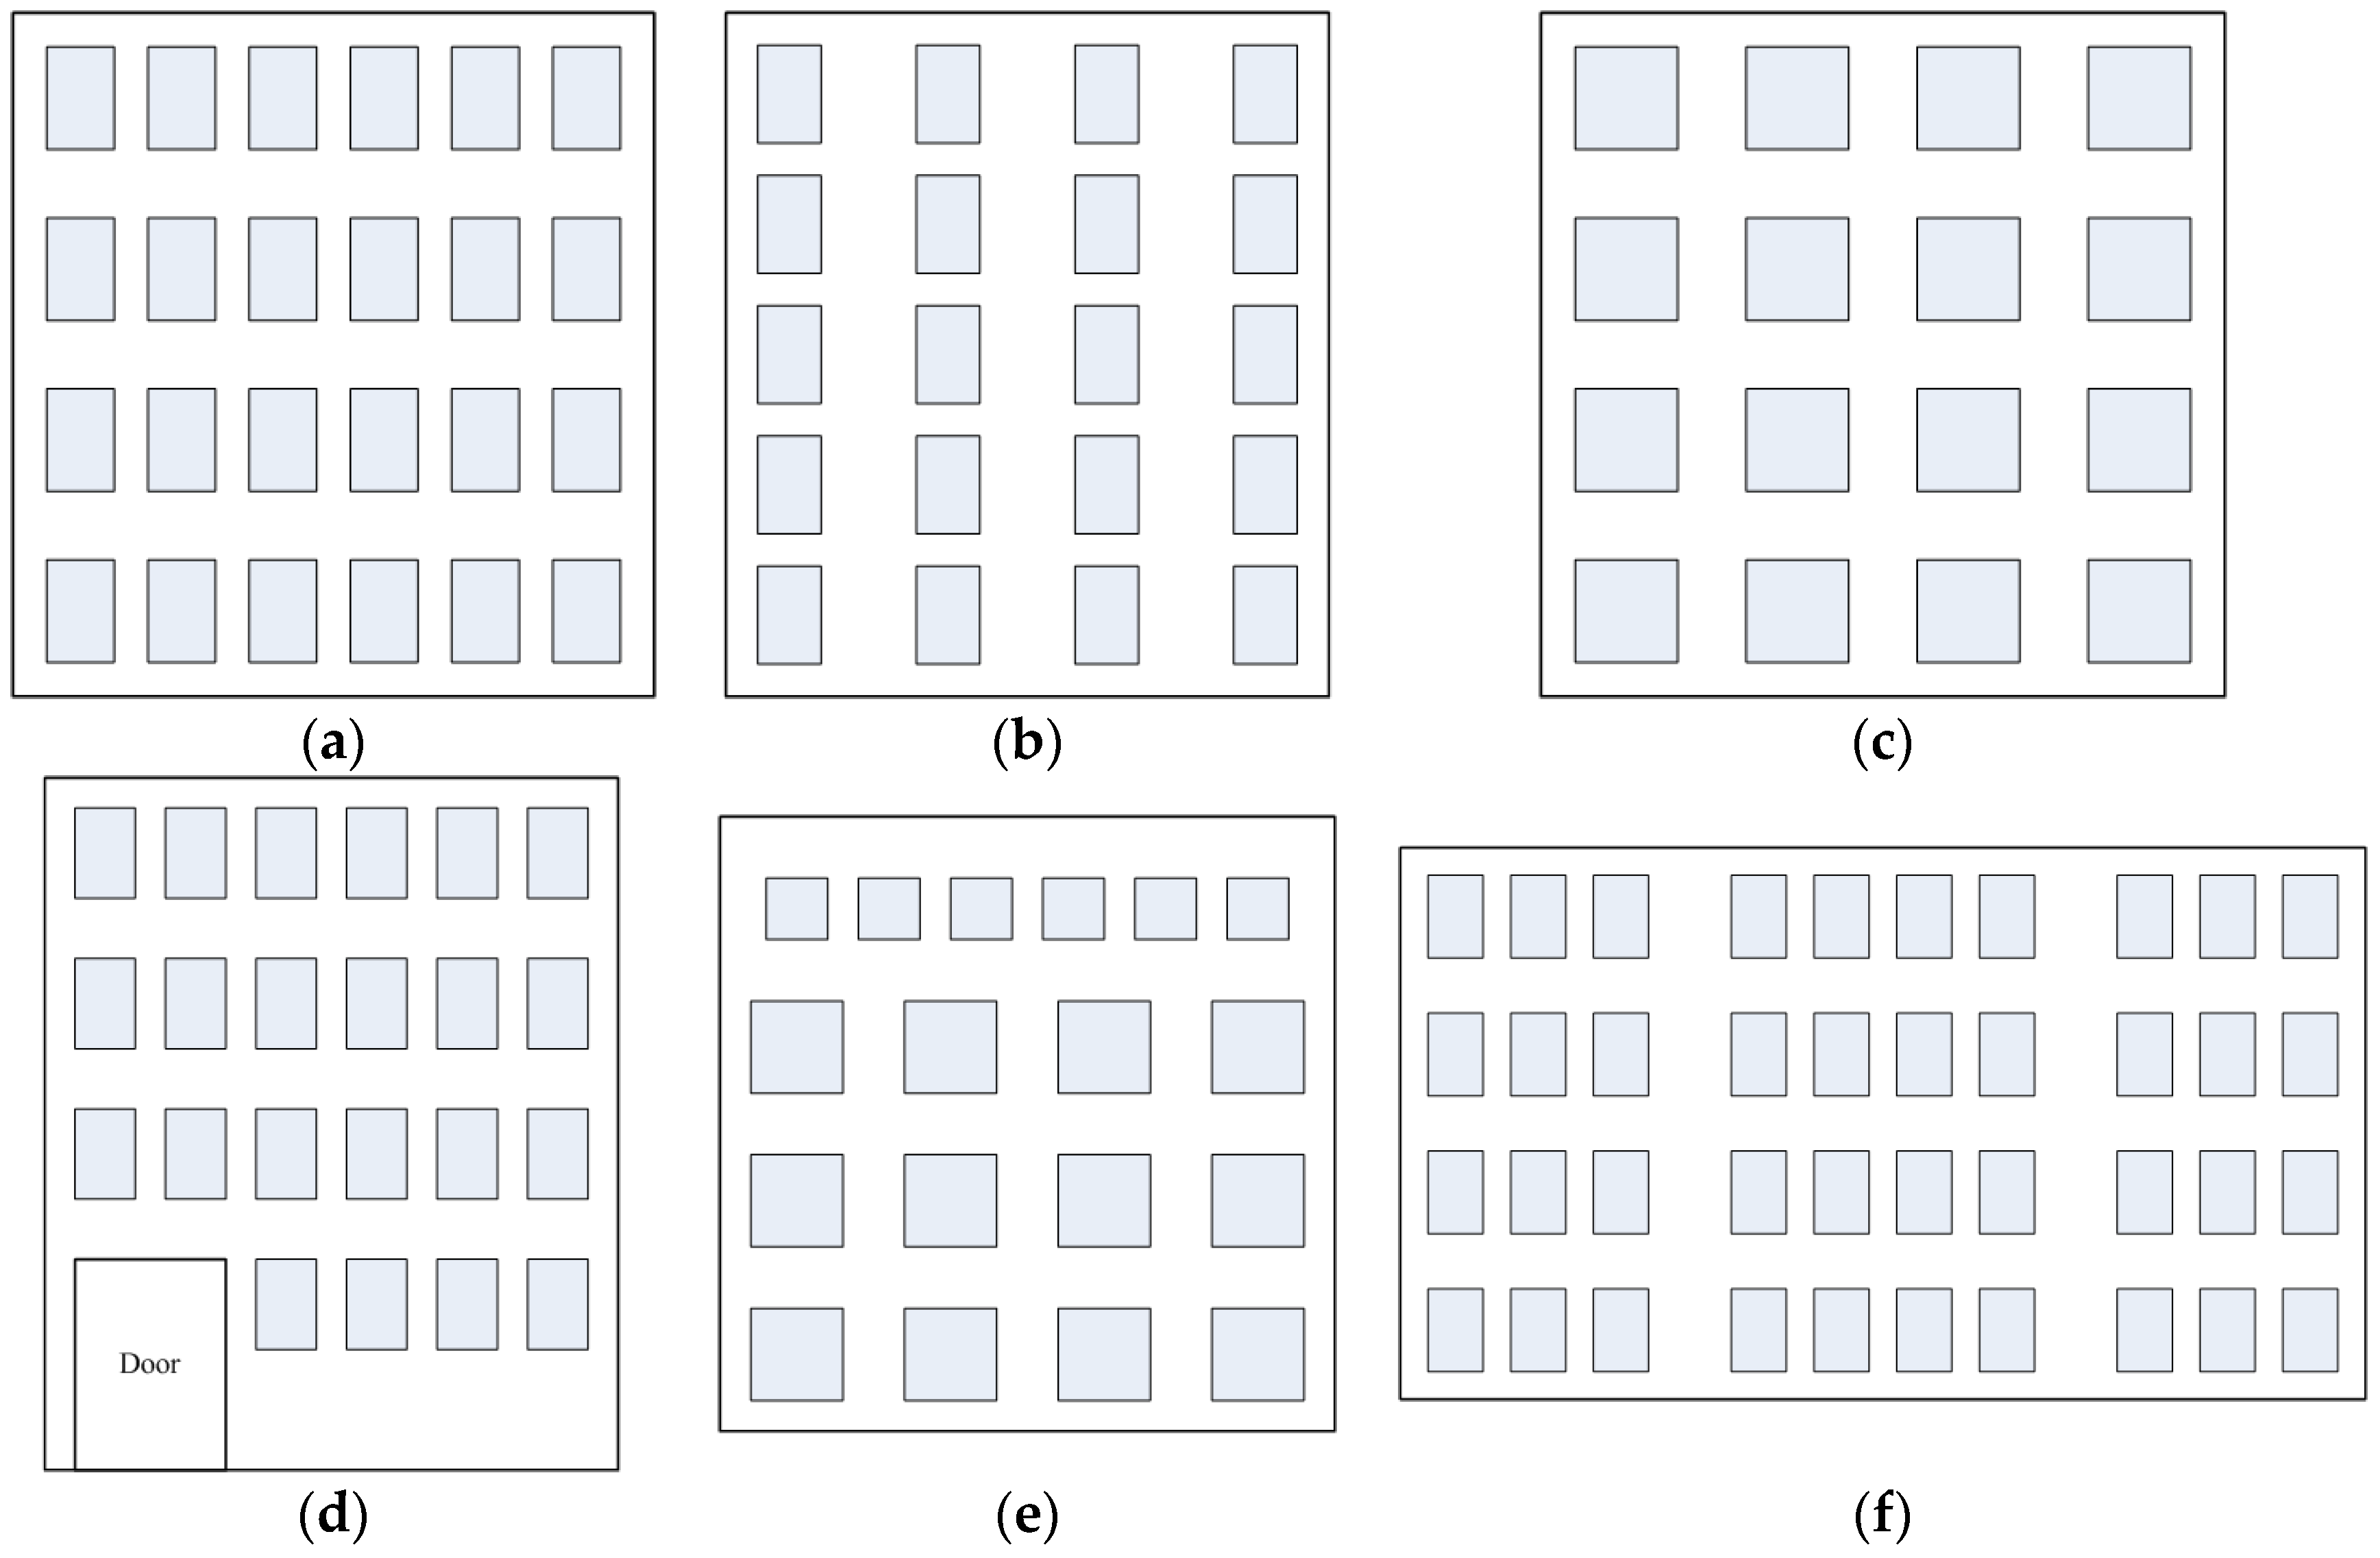
2. A User Survey for Typification
2.1. Constraints of Typification
- keeping the area covered by windows,
- keeping the ratio between the height and the width of the windows,
- keeping the distances between windows,
- keeping the distances between windows and the outline of the façade,
- keeping windows distributed in the tendency direction.
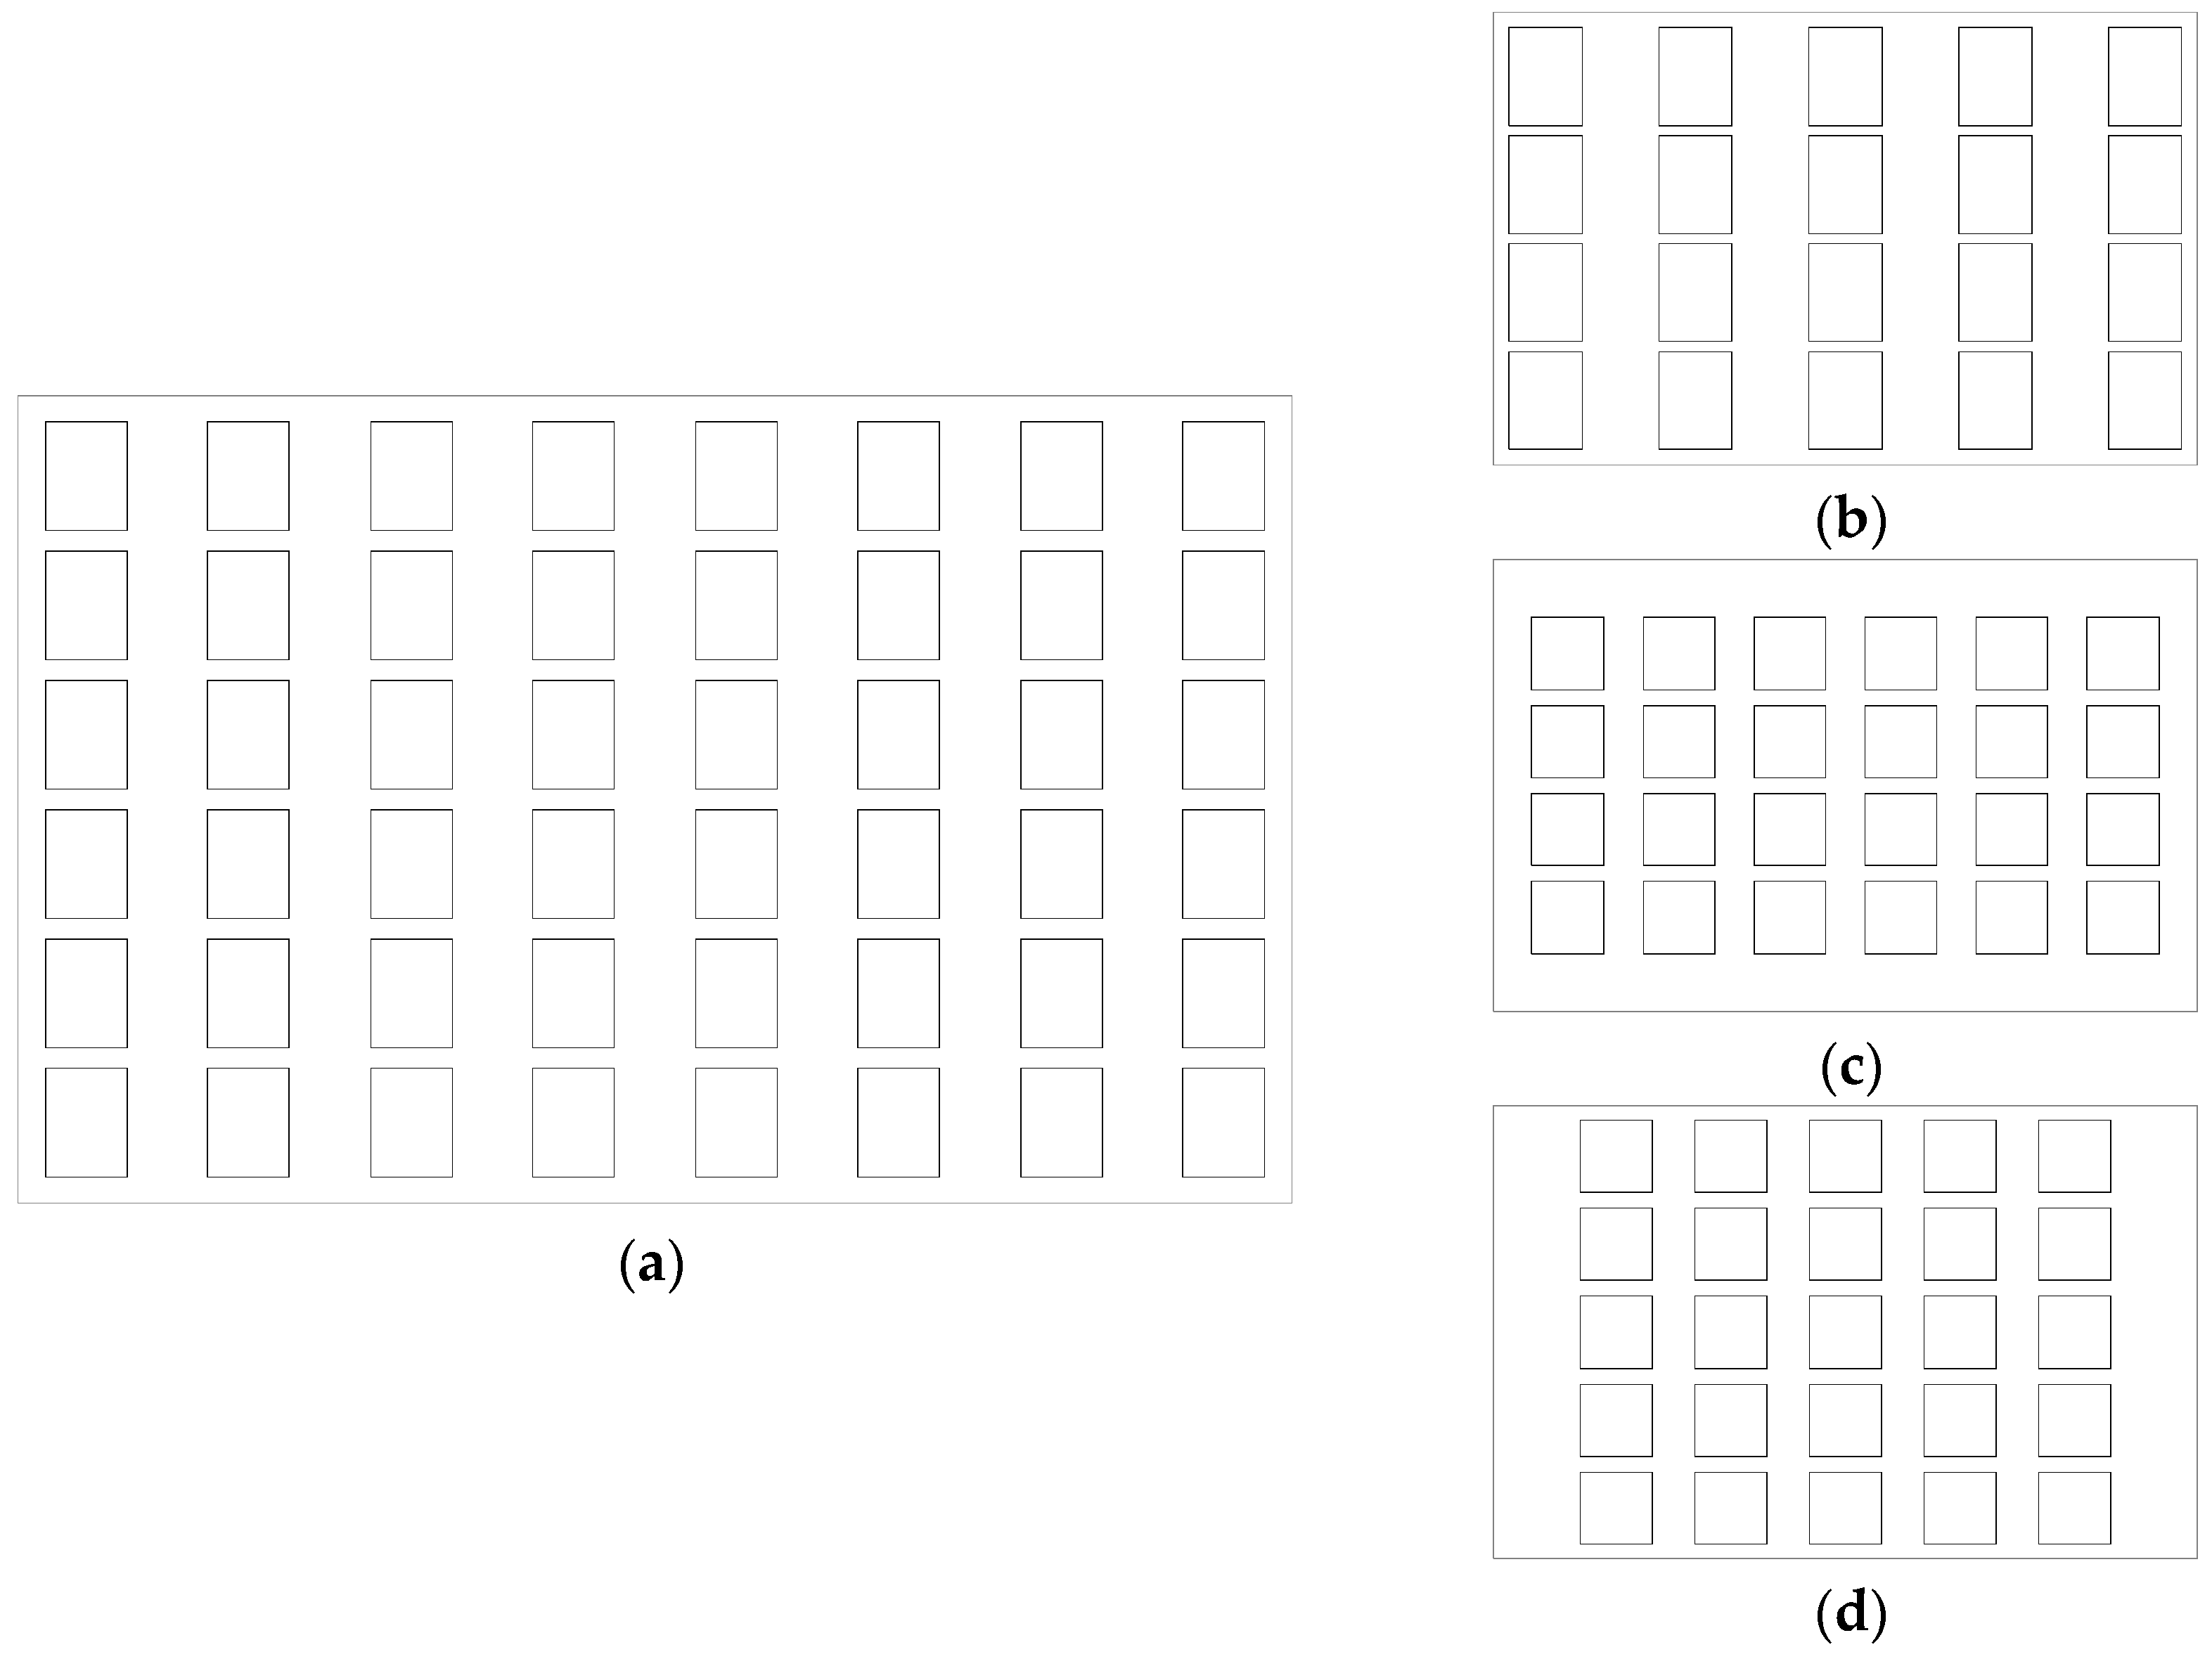
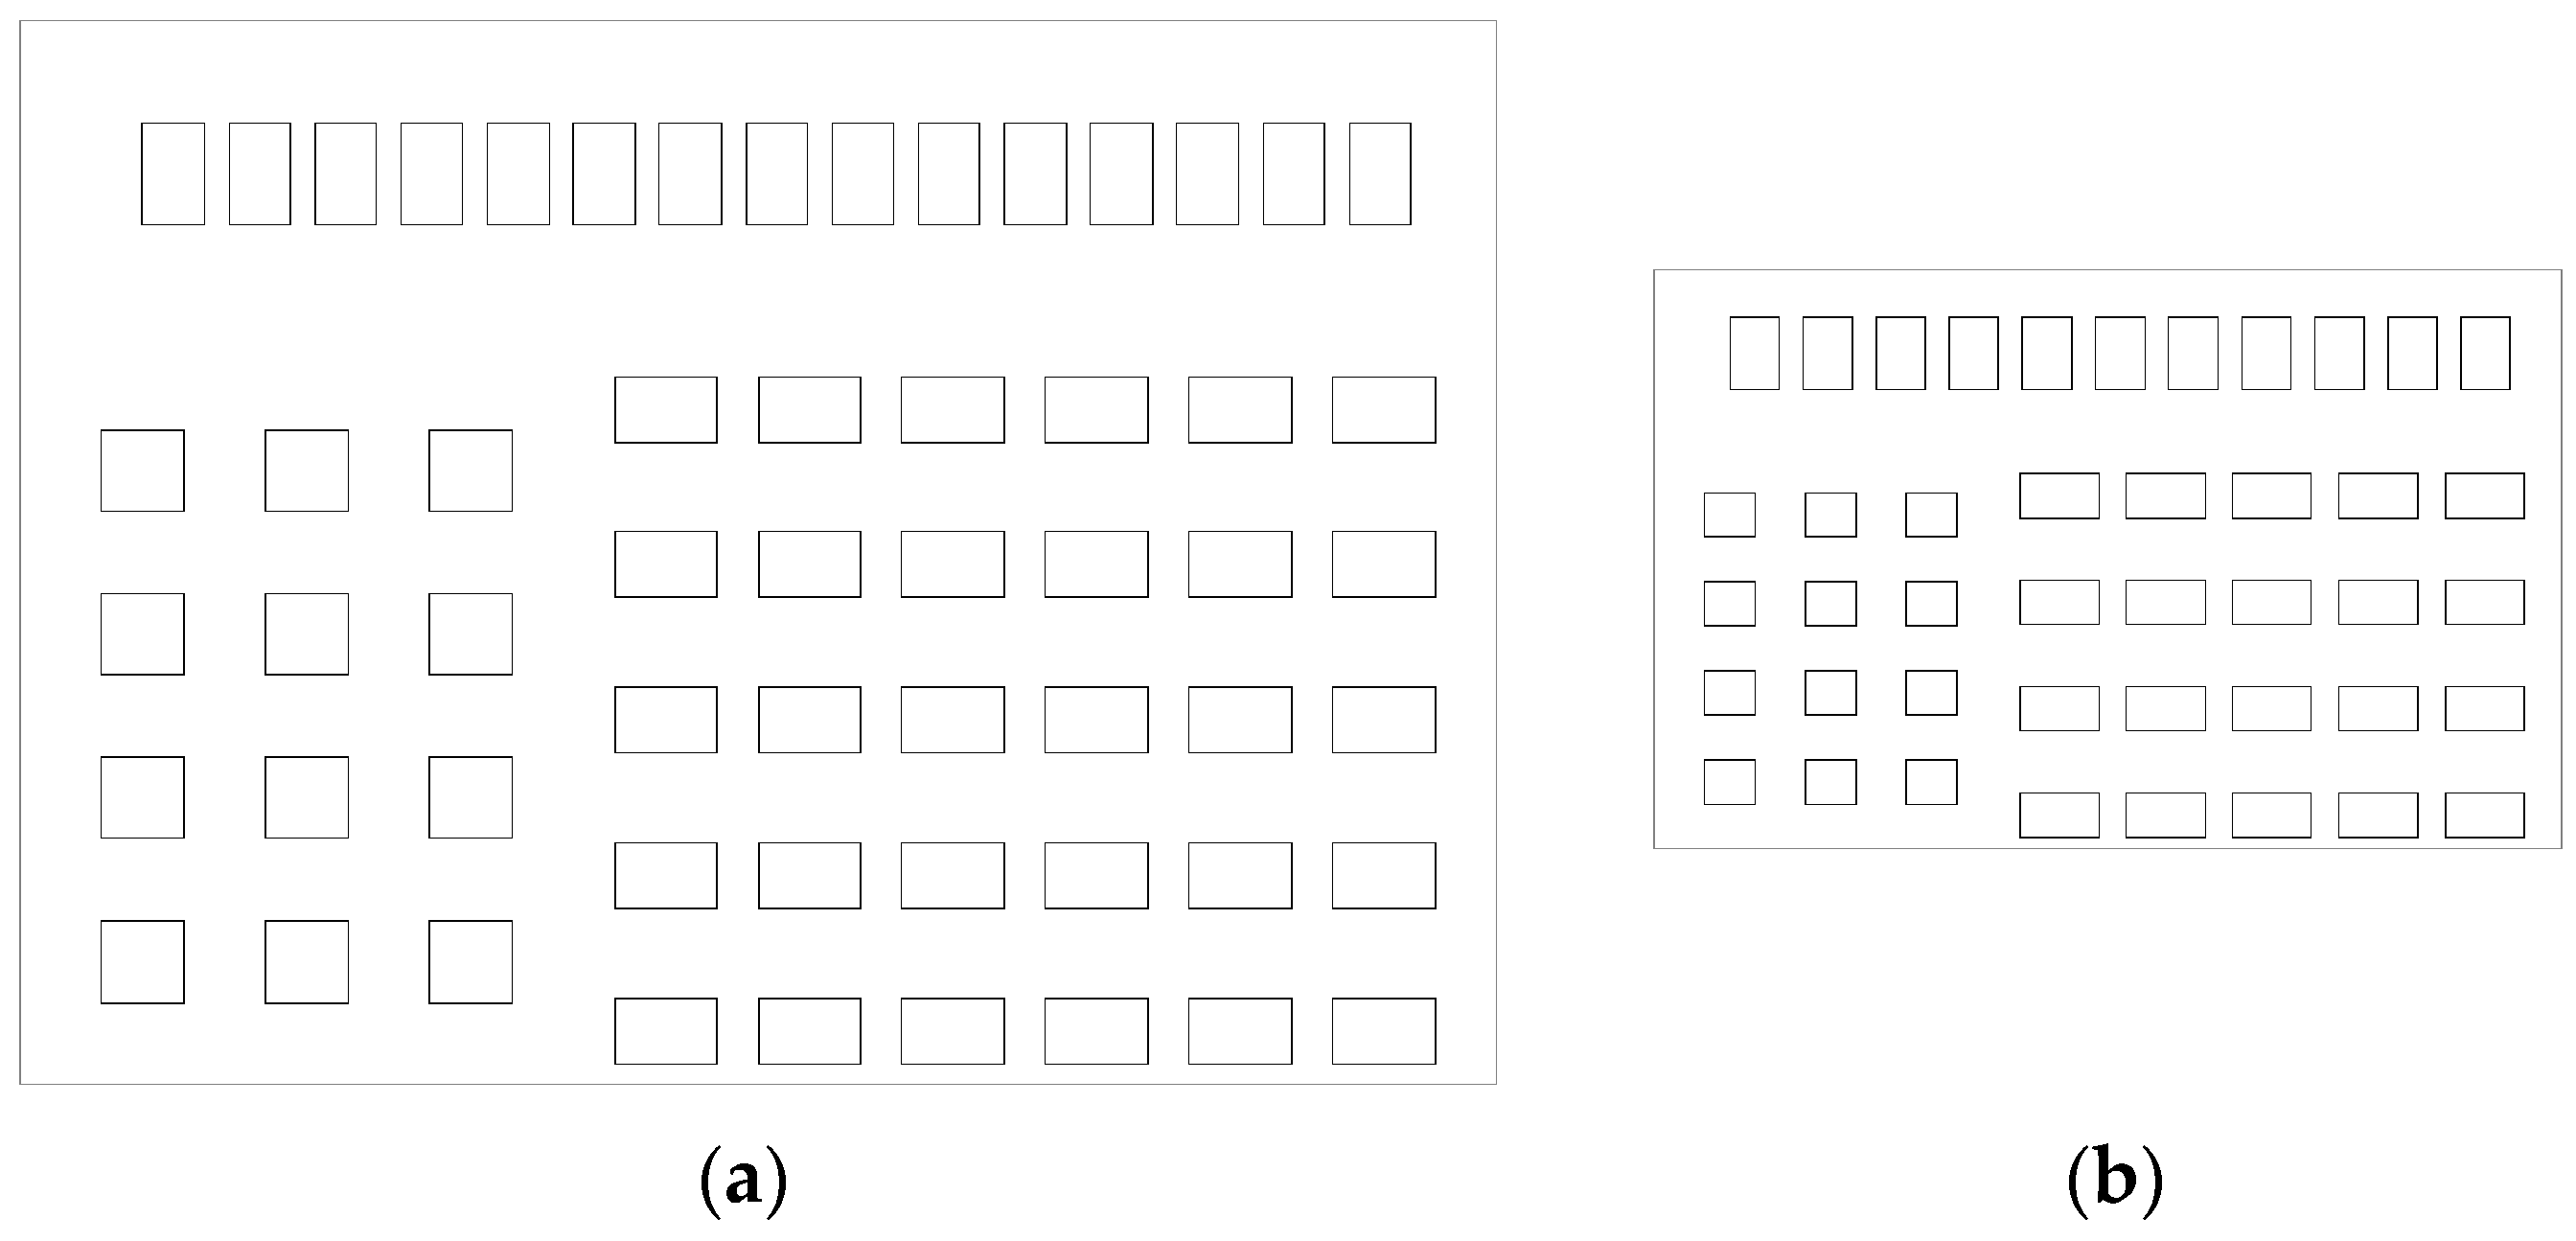
2.2. User Survey and the Results
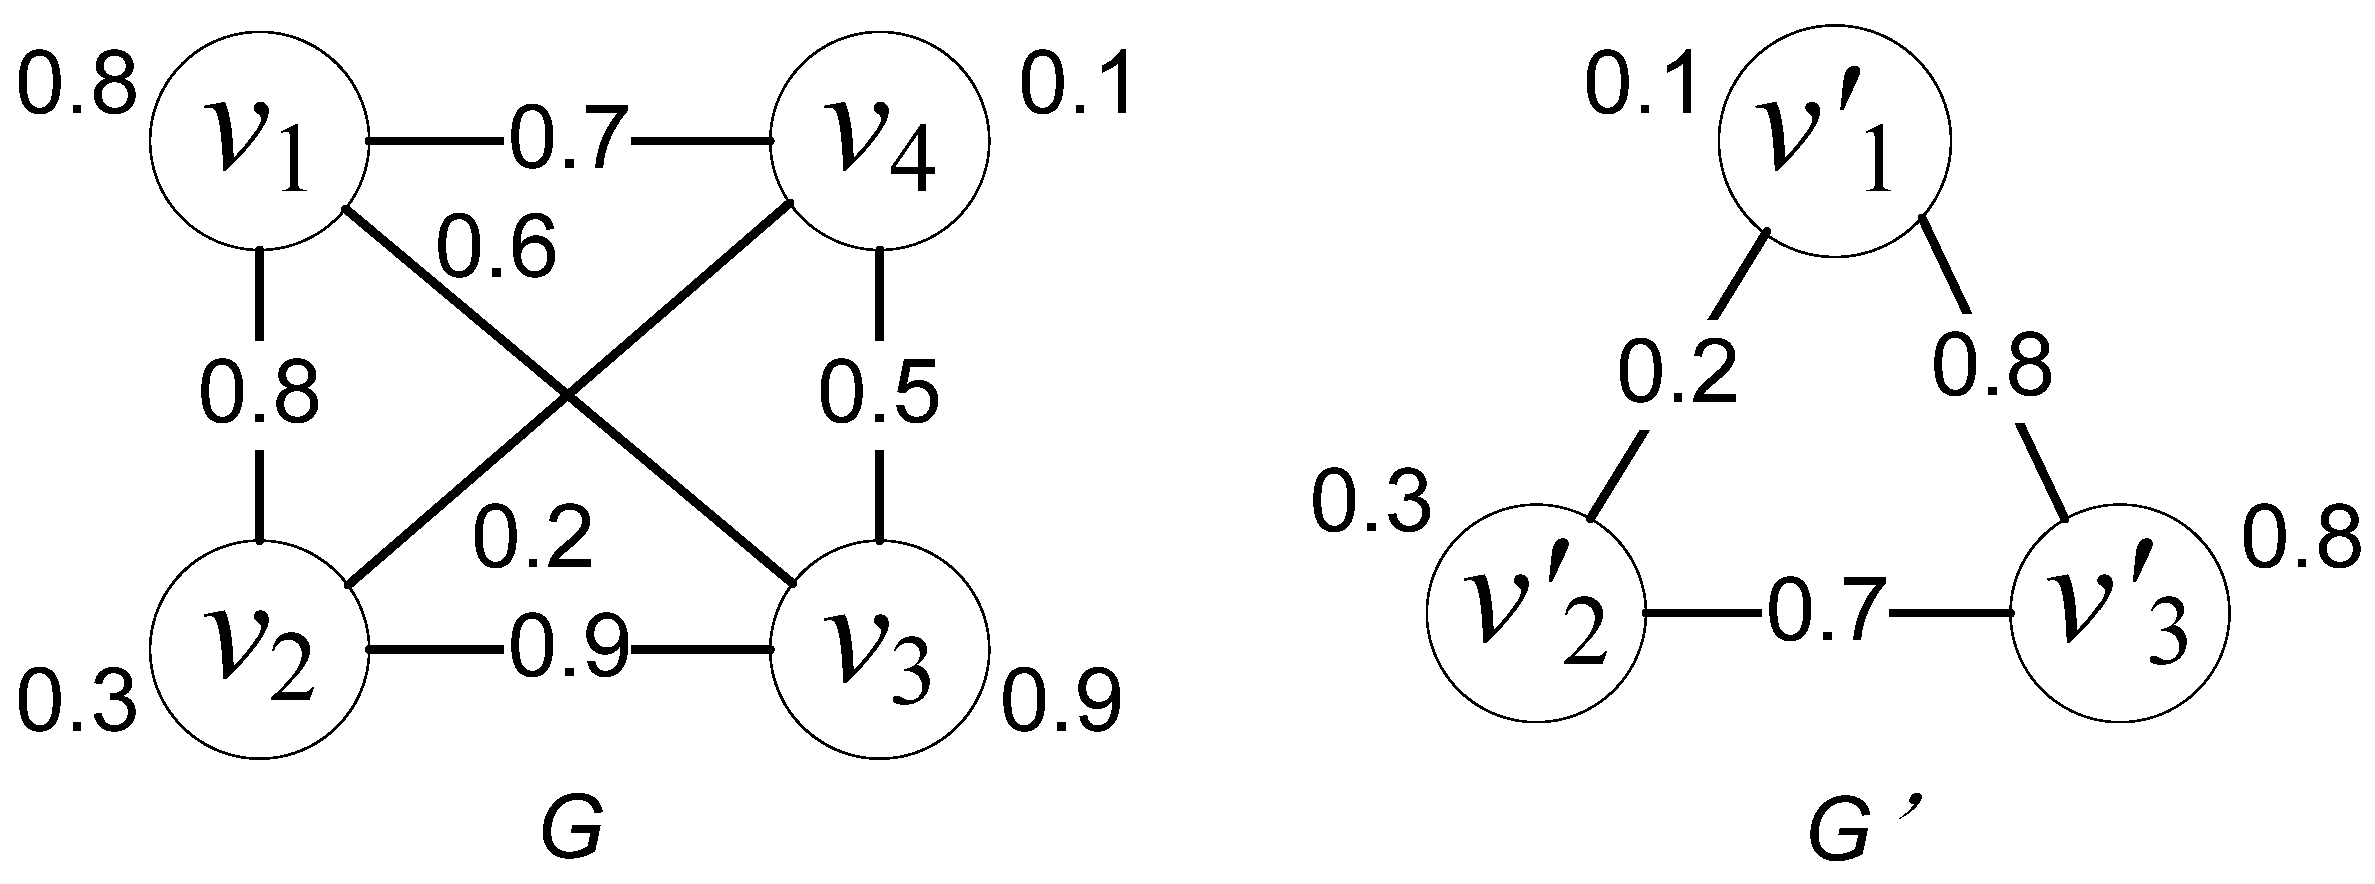
3. Verification of the User Survey Using ARG and NEMD Algorithm
3.1. ARG Generation
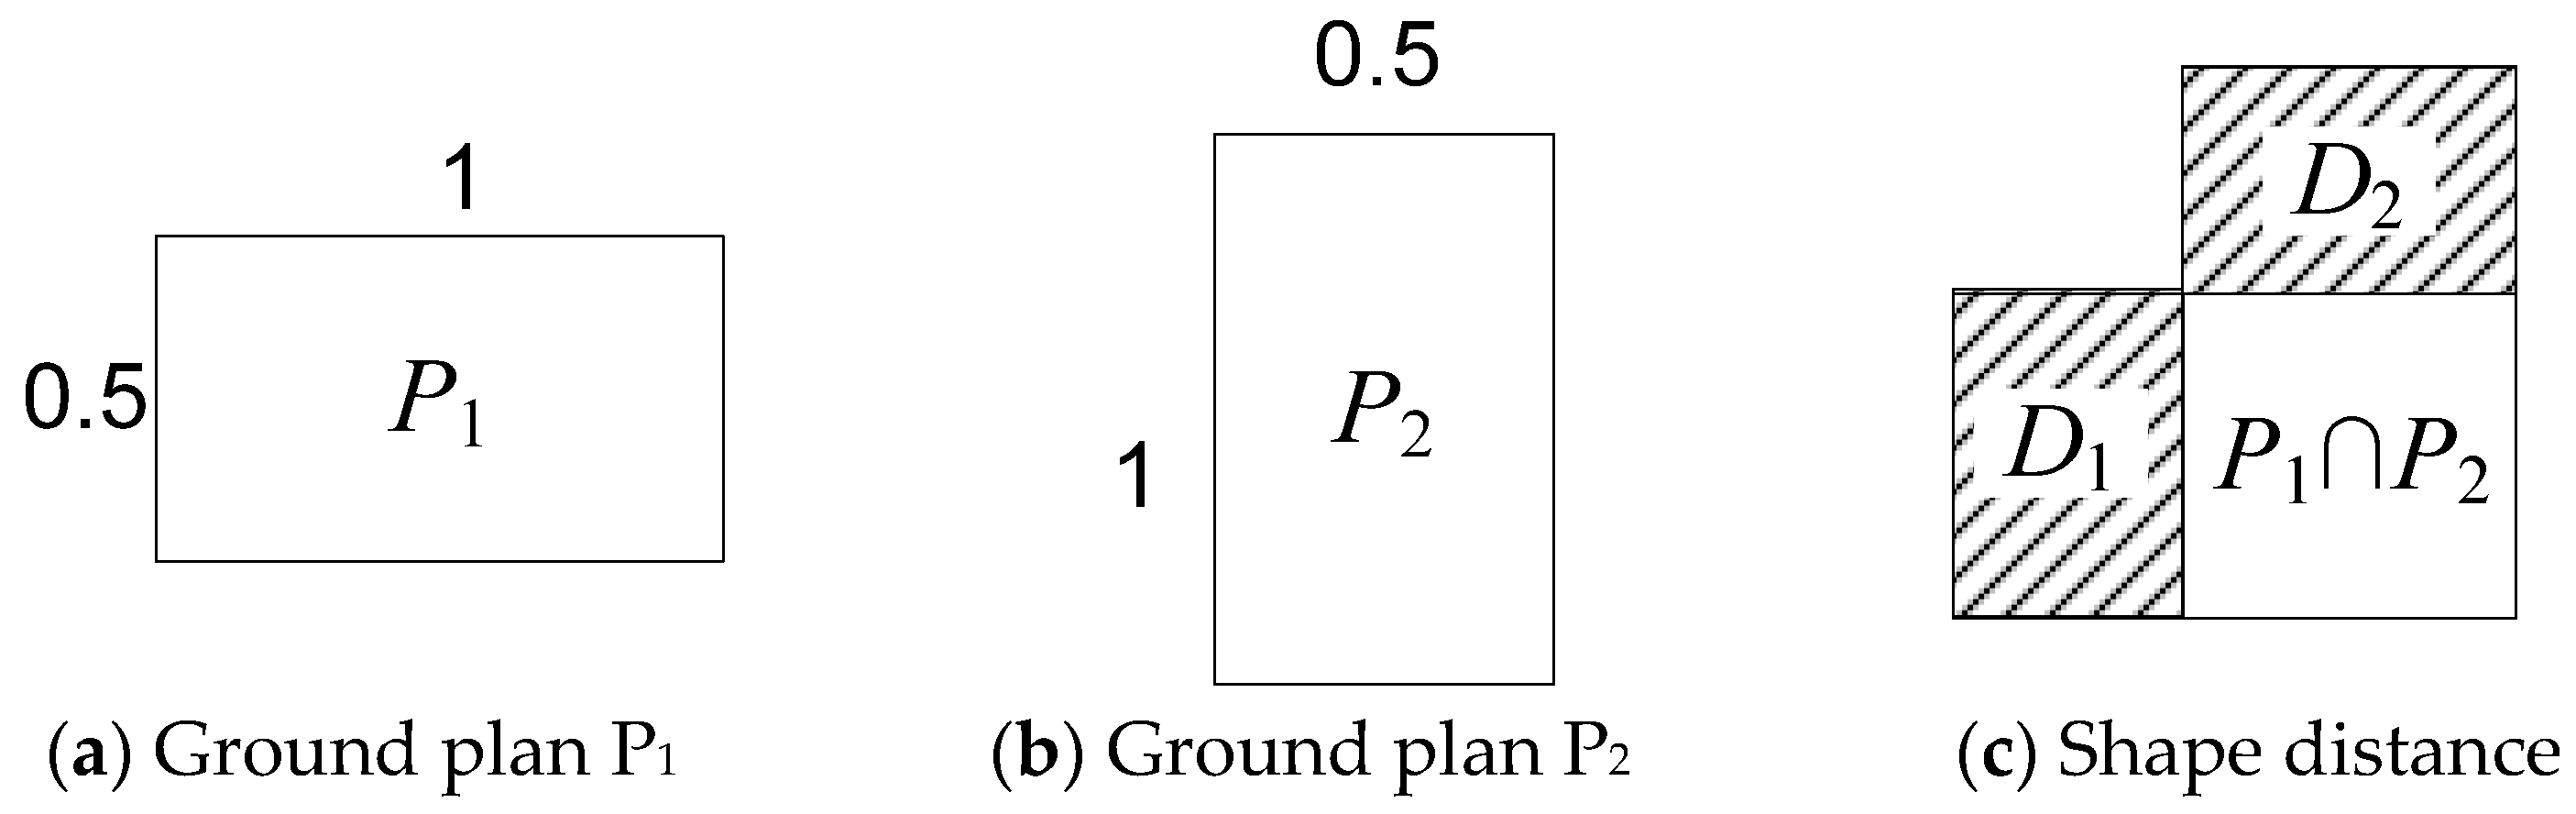
3.2. Distance Definition
3.3. Similarity Values
4. The Automatic Approach of Typification
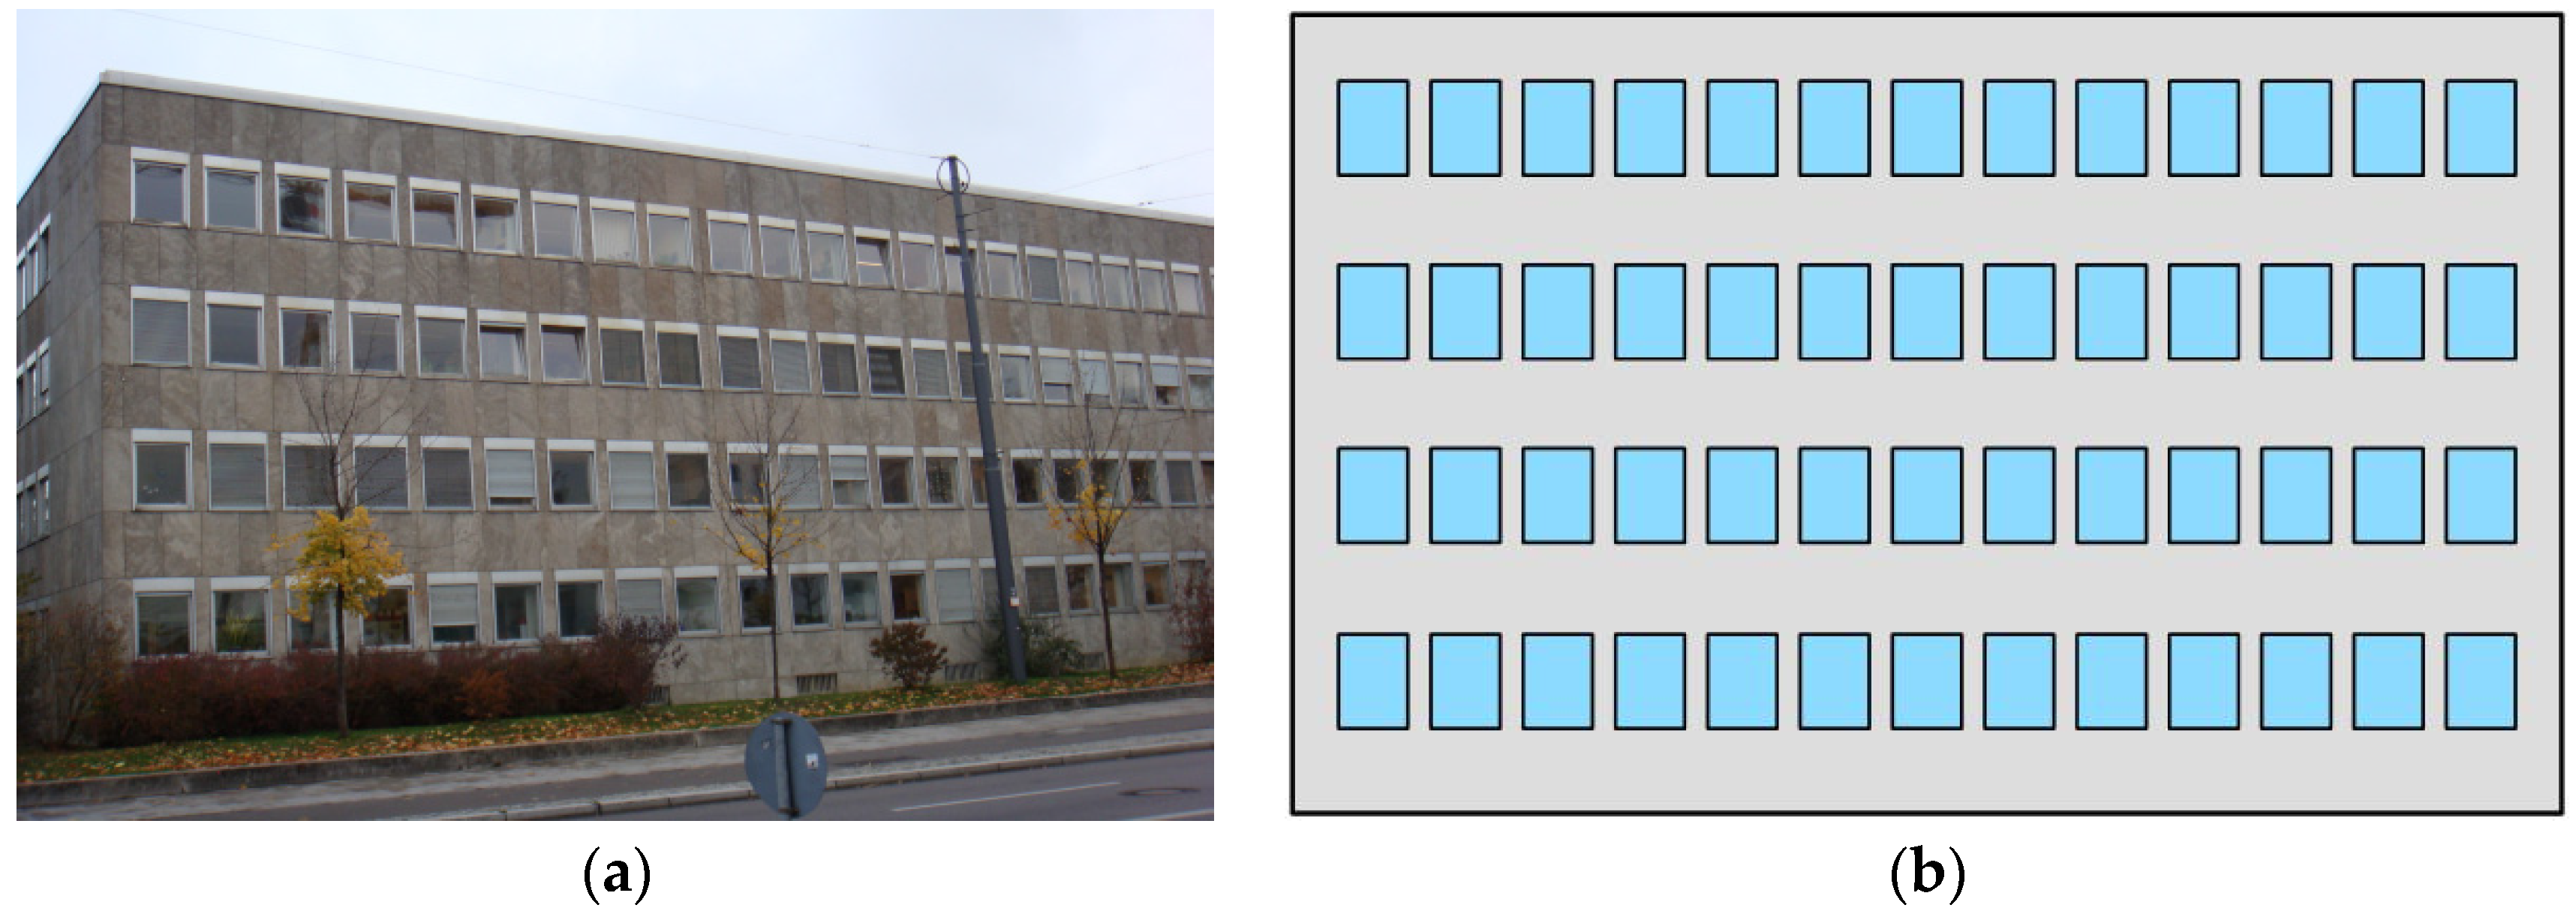
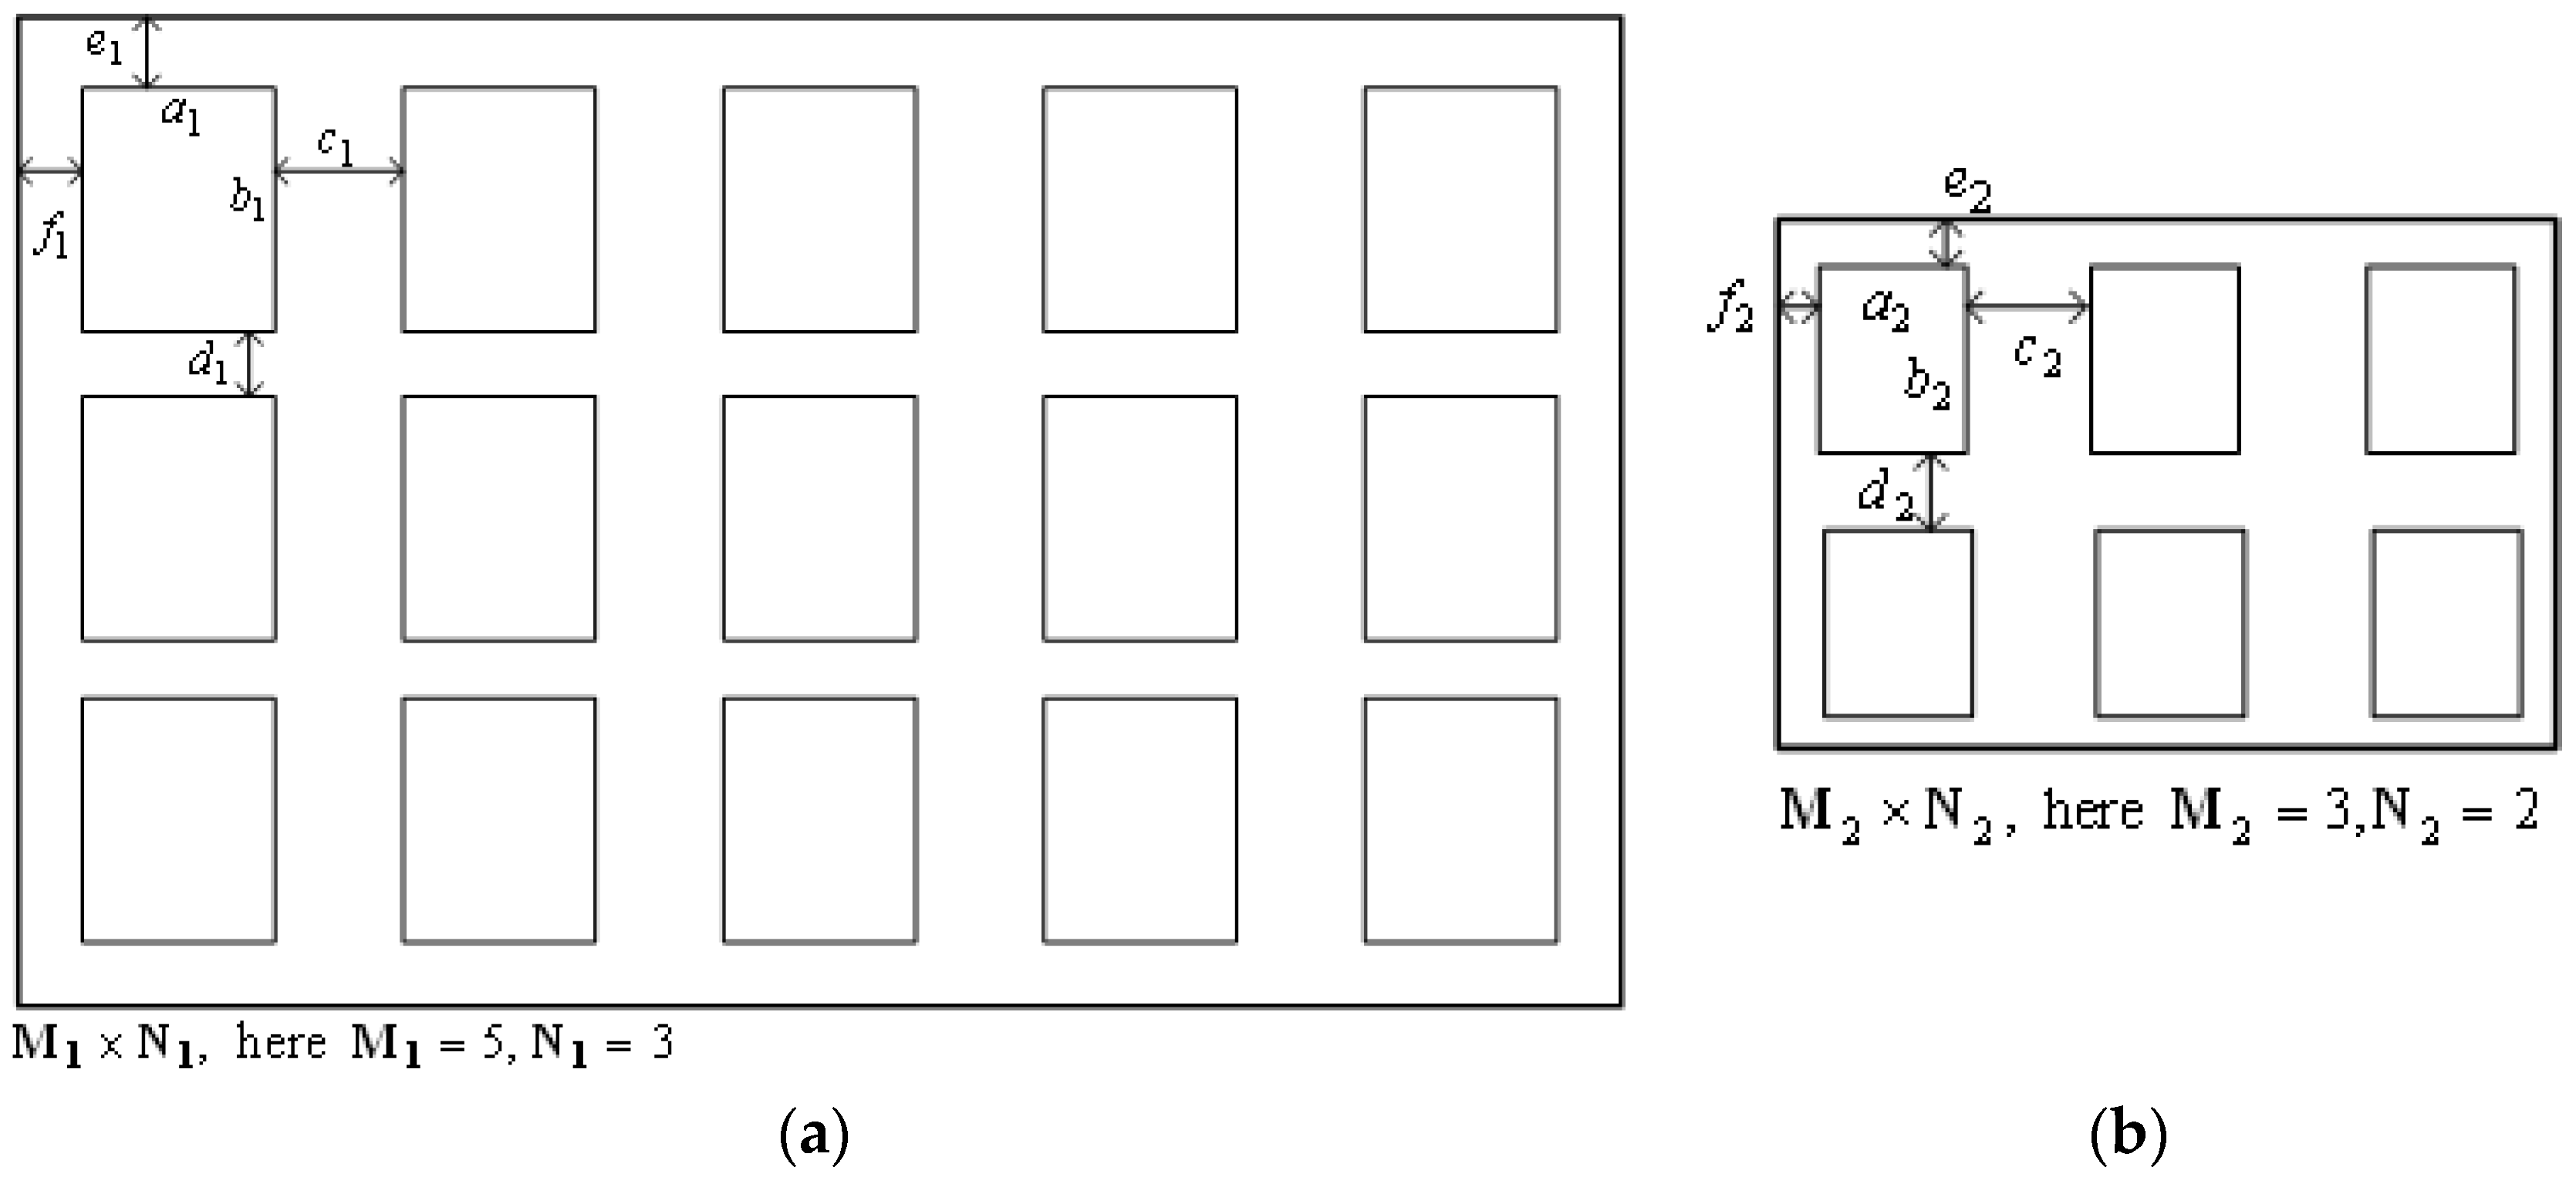
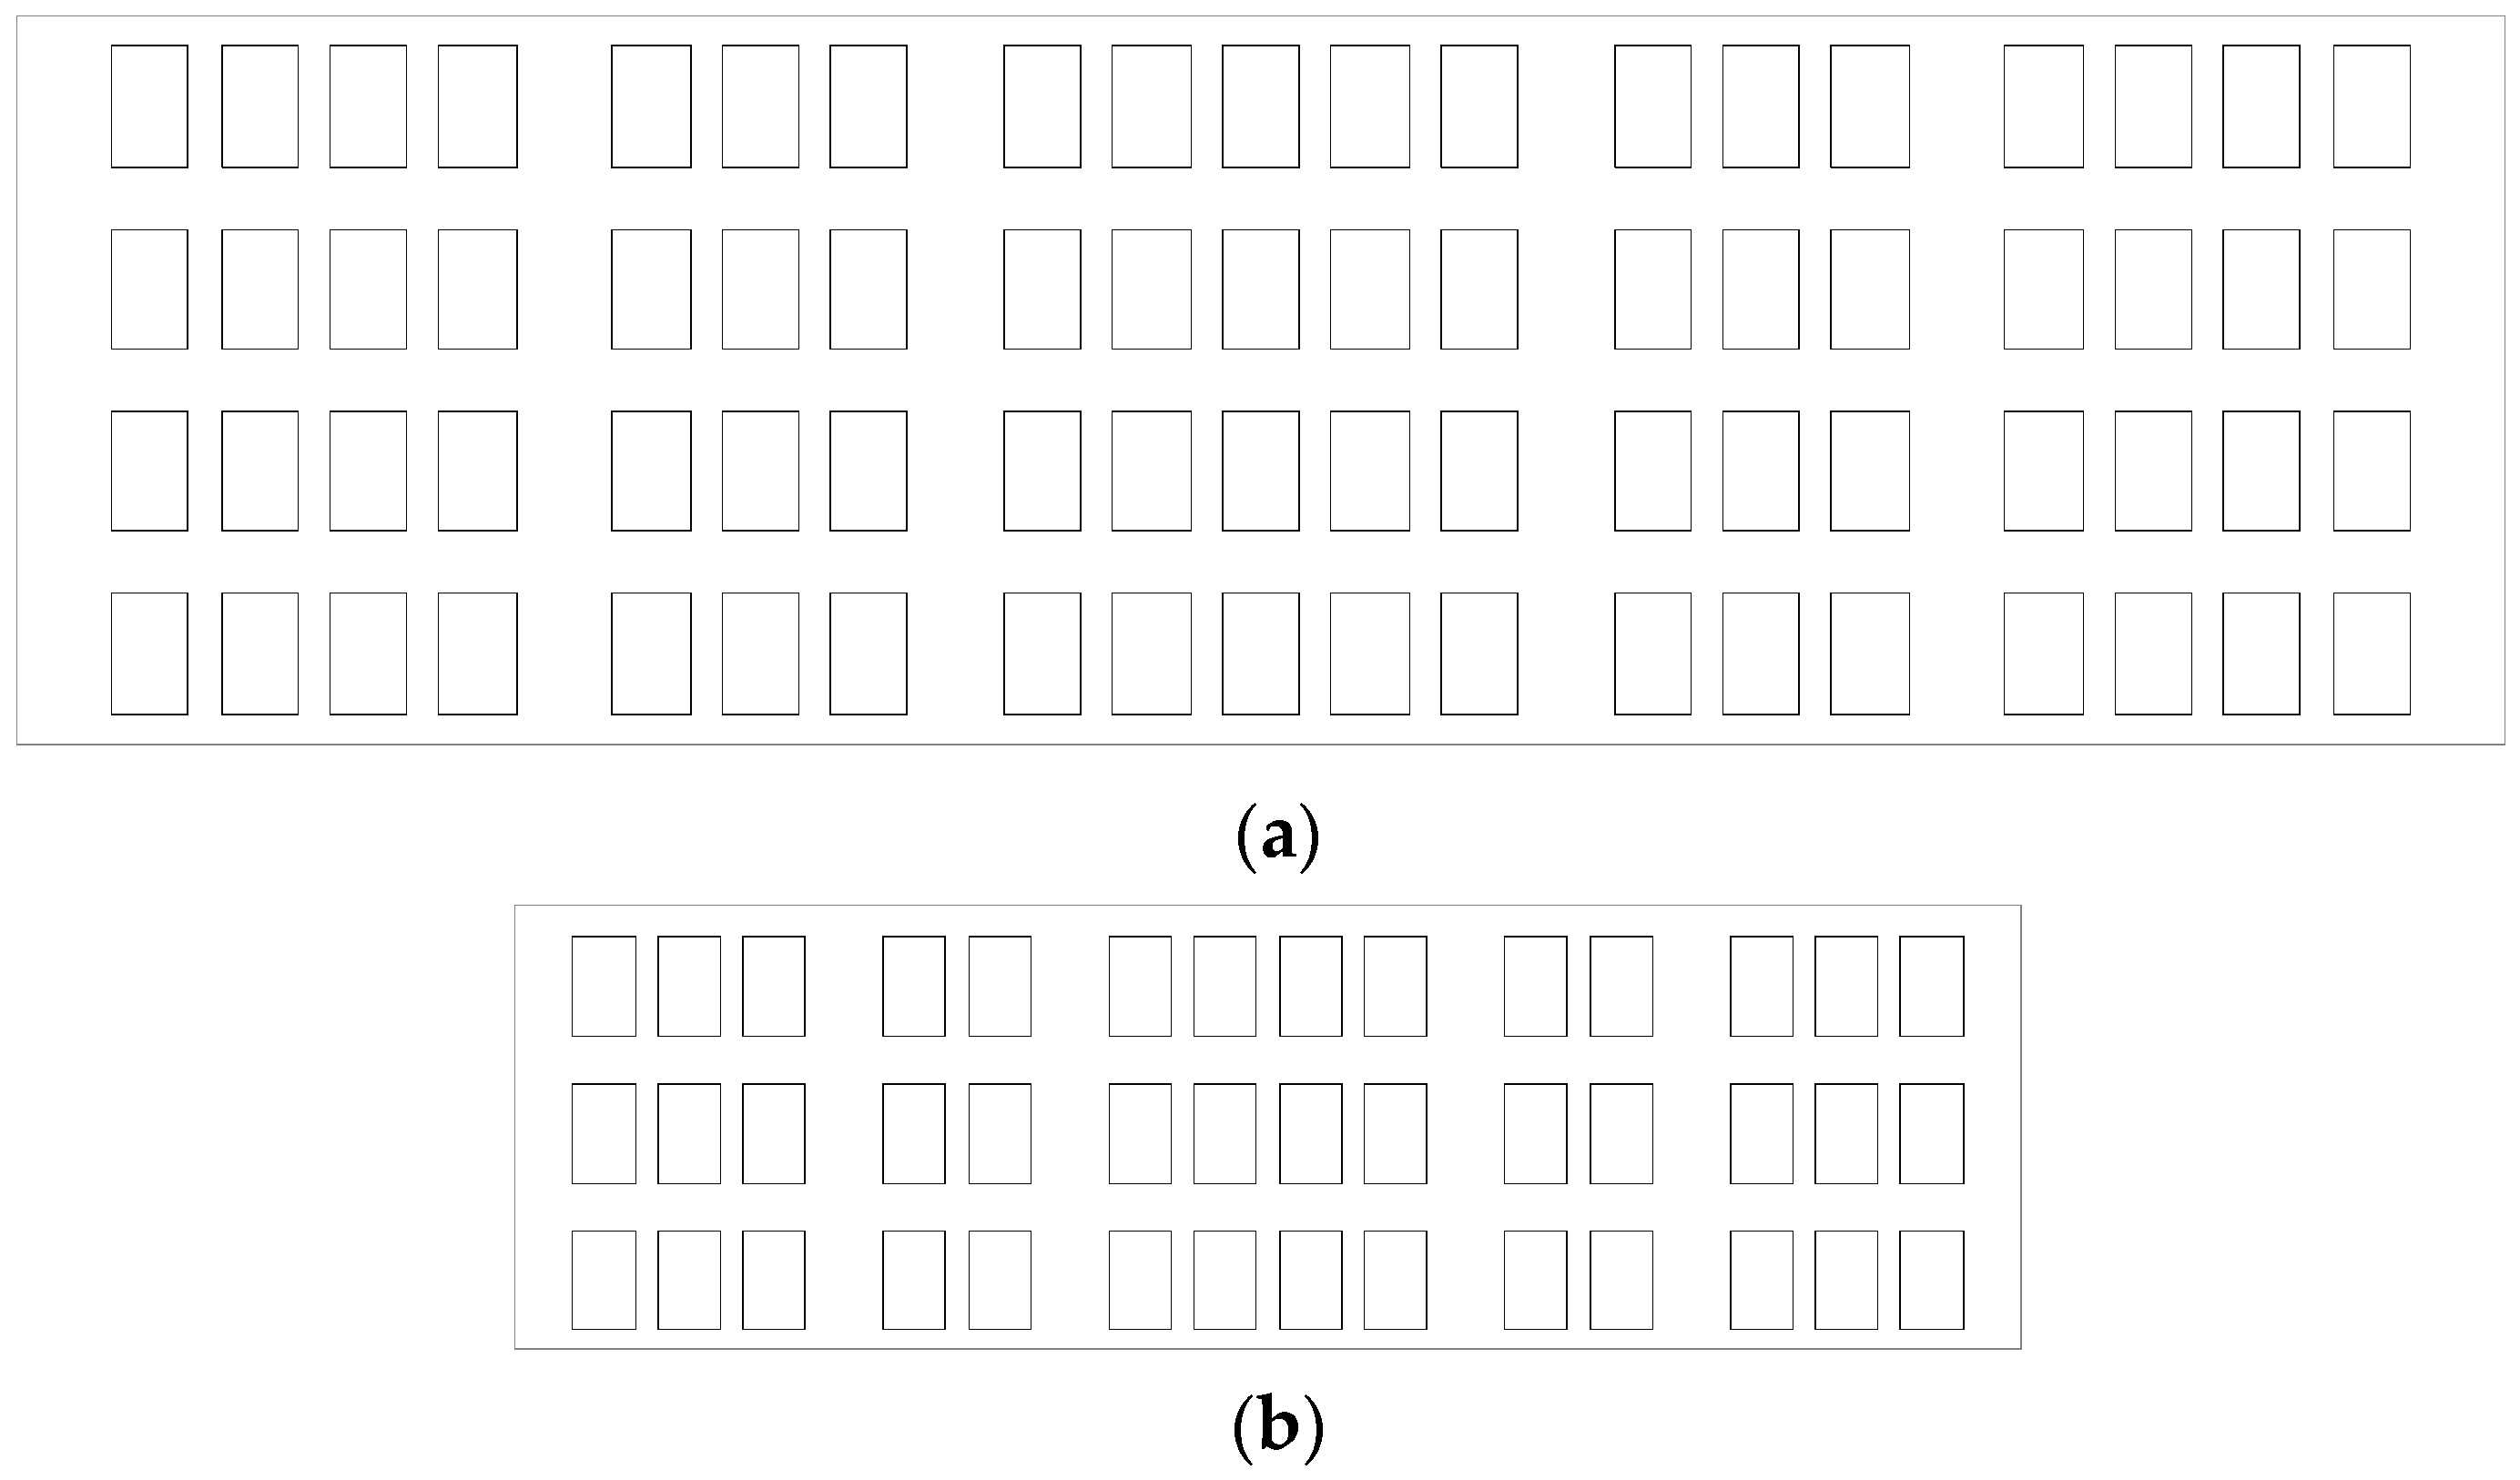
4.1. Typical Distribution of Windows on a Façade
4.2. The Process of Typification
- (1)
- The initial step: let the constraint significances equal one. Then the sides of window can be set initially according to the change of distances among windows: , and .
- (2)
- Put the initial values into Equations (17) and (18), and the number of windows in row and column can be then calculated by:
- (3)
- and are rounded to the nearest integer. The differences between the calculated values , and their nearest integer can be utilized to judge whether the process should terminate or not. In our work and were set as the thresholds below which the process will be terminated.
- (4)
- If the threshold is not yet reached, will be increased by 0.01, i.e., . Then the new and will be calculated. If the threshold is reached, the process will terminate; otherwise it will go on to the subsequent step.
- (5)
- will be increased by 0.01, i.e., . Then the new and will be calculated. If the threshold is reached, the process will terminate, otherwise it will go on to the subsequent step.
- (6)
- will be increased by 0.01, i.e., . Then the new and will be calculated. If the threshold is reached, the process will terminate, otherwise it will go back to step 4.
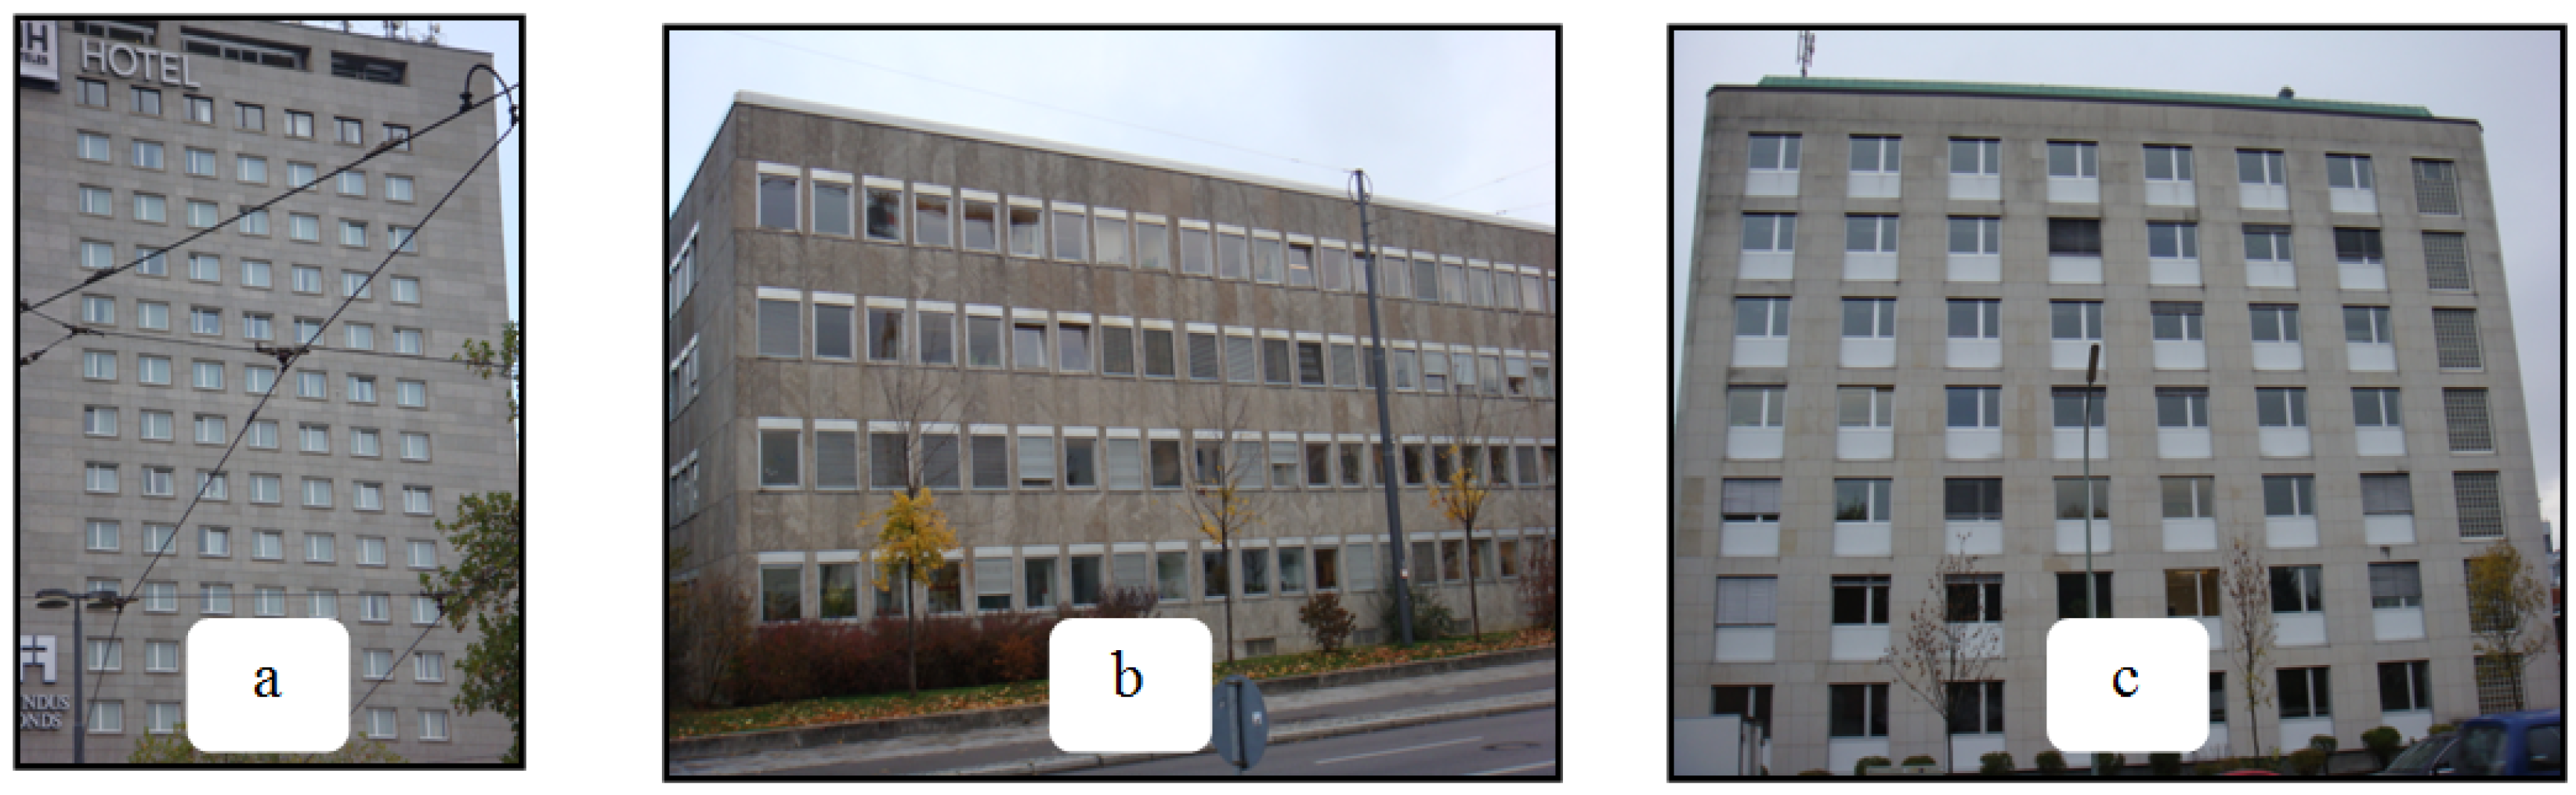
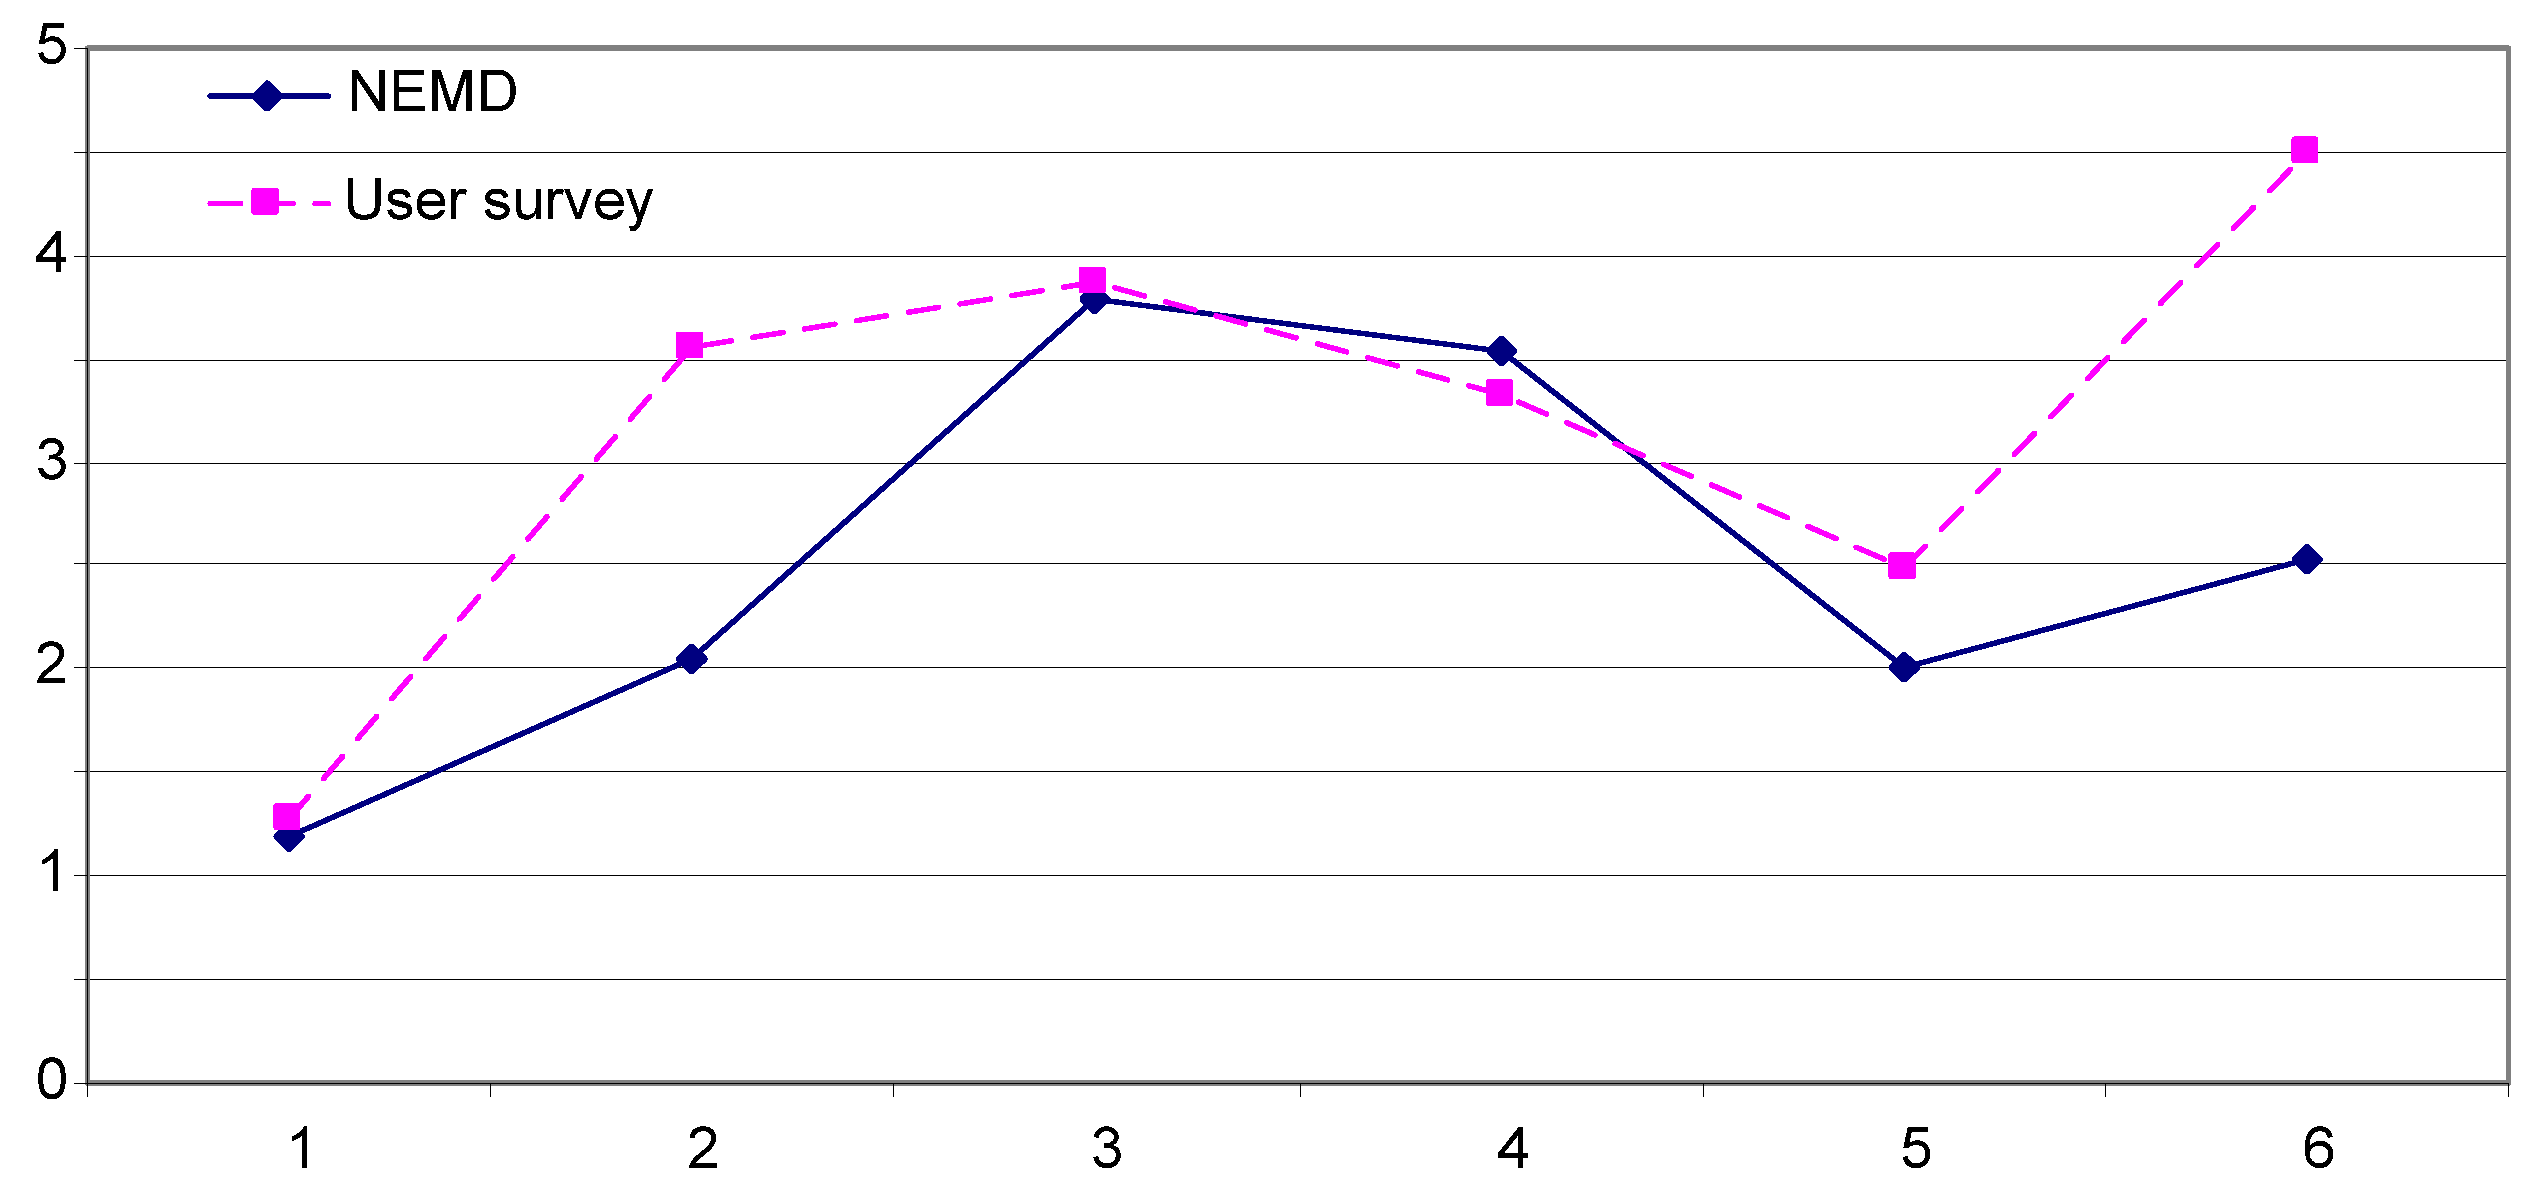
5. Experiments and Evaluation
6. Conclusions and Further Works
Acknowledgments
Author Contributions
Conflicts of Interest
References
- Staufenbiel, W. Zur Automation der Generalisierung Topographischer Karten Mit Besonderer Berücksichtigung Großmaßstäbiger Gebäudedarstellungen. Ph.D. Thesis, Wissenschaftliche Arbeiten der Fachrichtung Vermessungswesen der Universität Hannover (51), Hannover, Gemany, 1973. [Google Scholar]
- Lamy, S.; Ruas, A.; Demazeau, Y.; Jackson, M.; Mackaness, W.; Weibel, R. The application of agents in automated map generalization. In Proceedings of the 19th International Cartographic Conference of the ICA, Ottawa, ON, Canada, 14–21 August 1999.
- Rainsford, D.; Mackaness, W. Template matching in support of generalization of rural buildings. In Proceedings of the Joint International Symposium on “Geospatial Theory, Processing and Applications” (ISPRS Commission IV SDH2002), Ottawa, ON, Canada, 8–12 July 2002.
- Regnauld, N. Contextual building typification in automated map generalization. Algorithmica 2001, 30, 312–333. [Google Scholar] [CrossRef]
- Van Kreveld, M. Smooth generalization for continuous zooming. In Proceedings of the ICC, Beijing, China, 6–10 August 2001.
- Sester, M. Generalization based on least squares adjustment. In International Archives of Photogrammetry and Remote Sensing; ISPRS: Amsterdam, The Netherlands, 2000; pp. 931–938. [Google Scholar]
- Meyer, U. Generalisierung der Siedlungsdarstellung in Digitalen Situationsmodellen. Ph.D. Thesis, Wissenschaftliche Arbeiten der Fachrichtung Vermessungswesen der Universität Hannover, Hannover, Gemany, 1989. [Google Scholar]
- Lal, J.; Meng, L. Rules and constraints for 3D generalization of urban area. J. Geogr. Sci. 2001, 11, 17–28. [Google Scholar] [CrossRef]
- Kada, M. Automatic generalization of 3D building models. In Proceedings of the Joint International Symposium on Geospatial Theory, Processing and Applications, Ottawa, ON, Canada, 9–12 July 2002.
- Ribelles, J.; Hechbert, P.S.; Garland, M.; Stahovich, T.F. Finding and removing features from polyhedra. In Proceedings of DETC’01, ASME Design Engineering Technical Conference, Pittsburgh, PA, USA, 9–12 September 2001.
- Thiemann, F. Generalization of 3D building data. In The International Archives of the Photogrammetry, Remote Sensing and Spatial Information Science; International Archives Of Photogrammetry Remote Sensing and Spatial Information Sciences: Göttingen, Germany, 2002; pp. 286–290. [Google Scholar]
- Thiemann, F.; Sester, M. Segmentation of buildings for 3D generalization. In Proceedings of the ICA Workshop on Generalisation and Multiple Representation, Leicester, UK, 20–21 August 2004.
- Kada, M. 3D building generalization based on half-space modeling. In Proceedings of the ISPRS Workshop on Multiple Representation and Interoperability of Spatial Data, Hannover, Germany, 22–24 February 2006.
- Kada, M. 3D building generalization by roof simplification and typification. In Proceedings of the 23rd International Cartographic Conference, Moscow, Russia, 4–10 August 2007.
- Sester, M. 3D visualization and generalization. In Photogrammetric Week 07; Wichmann: Stuttgart, Germany, 2007; pp. 285–295. [Google Scholar]
- Meng, L.; Forberg, A. 3D building generalization. In Challenges in the Portrayal of Geographic Information: Issue of Generalization and Multi Scale Representation; Mackaness, W., Ruas, A., Sarjakoski, T., Eds.; Elsevier Science Ltd.: Amsterdam, The Netherlands, 2007; pp. 211–232. [Google Scholar]
- Sester, M.; Brenner, C. Continuous generalization for visualization on small mobile devices. In Developments in Spatial Data Handling; Springer: Berlin/Heidelberg, Germany, 2004; pp. 469–480. [Google Scholar]
- Burghardt, D.; Cecconi, A. Mesh simplification for building typification. Int. J. Geogr. Inf. Sci. 2007, 21, 283–298. [Google Scholar] [CrossRef]
- Follin, J.M.; Bouju, A.; Bertrand, F.; Boursier, P. Visualization of multi-resolution spatial data in mobile system. In Proceedings of 1st International Workshop on Ubiquitous GIS, Gävle, Sweden, 7–9 June 2004.
- Li, Z.; Yan, H.; Ai, T.; Chen, J. Automated building generalization based on urban morphology and Gestalt theory. Int. J. Geogr. Inf. Sci. 2004, 18, 513–534. [Google Scholar] [CrossRef]
- Li, H.; Guo, Q.; Liu, J. Rapid algorithm of building typification in web mapping. In Proceedings of the International Symposium on Spatio-Temporal Modelling, Spatial Reasoning, Analysis, Data Mining and Data Fusion, Beijing, China, 27–29 August 2005.
- Li, Z. Algorithm Foundation of Multi-Scale Spatial Representation; CRC Press of Taylor & Francis Group: Boca Raton, FL, USA; London, UK; New York, NY, USA, 2007. [Google Scholar]
- Töpfer, F.; Pillewizer, W. The principles of selection. Cartogr. J. 1966, 3, 10–16. [Google Scholar] [CrossRef]
- Anders, K.H. Level of detail generation of 3D building groups by aggregation and typification. In Proceedings of the XXII International Cartographic Conference 2005, A Coruňa, Spain, 11–16 July 2005.
- Luyten, K.; Creemers, B.; Coninx, K. Multi-Device Layout Management for Mobile Computing Devices; Technical Report TR-LUC-EDM-0301; Limburgs Univeristair Centrum-Expertise Centre for Digital Media: Hasselt, Belgium, 2003. [Google Scholar]
- Kim, D.H.; Yun, I.D.; Uk Lee, S. A new attributed relational graph matching algorithm using the nested structure of earth mover’s distance. In Proceedings of the 17th International Conference on Pattern Recognition (ICPR’04), Cambridge UK, 23–26 August 2004.
- Barrow, H.G.; Popplestone, R.J. Relational descriptions in picture processing. Mach. Intell. 1971, 6, 377–396. [Google Scholar]
- Gold, S.; Rangarajan, A. A graduated assignment algorithm for graph matching. IEEE Trans. Pattern Anal. Mach. Intell. 1996, 18, 377–388. [Google Scholar] [CrossRef]
- Wyk, M.A.; Clark, J. An algorithm for approximate least-squares attributed graph matching. In Problems in Applied Mathematics and Computational Intelligence; World Scientific and Engineering Society Press: London, UK, 2000; pp. 67–72. [Google Scholar]
- Mao, B.; Fan, H.; Harrie, L.; Ban, Y.; Meng, L. City model generalization quality assessment using nested structure of earth mover’s distance. In Proceedings of the 13th Workshop of the ICA Commission on Generalisation and Multiple Representation, Zurich, Switzerland, 12–13 September 2010.
- Ripperda, N.; Brenner, C. Reconstruction of facade structures using a formal grammar and RjMCMC. In Proceedings of the 28th Annual Symposium of the Geman-Association-for-Pattern-Recognition, Berlin, Germany, 12–14 September 2006.
- Becker, S. Generation and application of rules for quality dependent facade reconstruction. ISPRS J. Photogramm. Remote Sens. 2009, 64, 640–653. [Google Scholar] [CrossRef]


| Options | 1 | 2 | 3 | 4 | 5 | 6 |
|---|---|---|---|---|---|---|
| Values | 8.72 | 6.45 | 6.14 | 6.67 | 7.54 | 5.50 |
| Value | Constraint | |
|---|---|---|
more significant less significant | 10.0 | Keeping ratio of height and width of the windows |
| 7.0 | Keeping the distances between windows and the outline of the façade, and keeping the distances among windows at the same time | |
| 5.3 | Keeping the distances between windows and the outline of the façade | |
| 4.7 | Keeping the distances between windows | |
| 4.6 | Typification in tendency direction | |
| 3.9 | Keeping the area covered by windows |
| Options | 1 | 2 | 3 | 4 | 5 | 6 |
|---|---|---|---|---|---|---|
| NEMD | 43.5 | 47.8 | 56.5 | 55.2 | 47.5 | 50.1 |
| User survey | 8.72 | 6.45 | 6.14 | 6.67 | 7.54 | 5.50 |
© 2016 by the authors; licensee MDPI, Basel, Switzerland. This article is an open access article distributed under the terms and conditions of the Creative Commons Attribution (CC-BY) license (http://creativecommons.org/licenses/by/4.0/).
Share and Cite
Shen, J.; Fan, H.; Mao, B.; Wang, M. Typification for Façade Structures Based on User Perception. ISPRS Int. J. Geo-Inf. 2016, 5, 239. https://doi.org/10.3390/ijgi5120239
Shen J, Fan H, Mao B, Wang M. Typification for Façade Structures Based on User Perception. ISPRS International Journal of Geo-Information. 2016; 5(12):239. https://doi.org/10.3390/ijgi5120239
Chicago/Turabian StyleShen, Jie, Hongchao Fan, Bo Mao, and Menghe Wang. 2016. "Typification for Façade Structures Based on User Perception" ISPRS International Journal of Geo-Information 5, no. 12: 239. https://doi.org/10.3390/ijgi5120239
APA StyleShen, J., Fan, H., Mao, B., & Wang, M. (2016). Typification for Façade Structures Based on User Perception. ISPRS International Journal of Geo-Information, 5(12), 239. https://doi.org/10.3390/ijgi5120239