Article

Towards a Protocol for the Collection of VGI Vector Data

1
Department of Computer Science, Maynooth University, Maynooth, Co. Kildare W23 F2H6, Ireland
2
Department of Civil and Environmental Engineering, Politecnico di Milano, Como Campus, Via Valleggio 11, Como 22100, Italy
3
Finnish Geospatial Research Institute, Geodeetinrinne 2, Masala 02430, Finland
4
Hellenic Military Geographical Service, Evelpidon 4, Athens 11362, Greece
5
Univ. Paris-Est, LASTIG COGIT, IGN, ENSG, F-94160 Saint-Mande, France
6
School Of Rural and Surveying Engineer, National Technical University of Athens, Heroon Polytechniou 9, Zografou 15780, Greece
*
Author to whom correspondence should be addressed.
ISPRS Int. J. Geo-Inf. 2016, 5(11), 217; https://doi.org/10.3390/ijgi5110217
Submission received: 23 September 2016 / Revised: 28 October 2016 / Accepted: 11 November 2016 / Published: 17 November 2016
(This article belongs to the Special Issue Volunteered Geographic Information)

Abstract

:
A protocol for the collection of vector data in Volunteered Geographic Information (VGI) projects is proposed. VGI is a source of crowdsourced geographic data and information which is comparable, and in some cases better, than equivalent data from National Mapping Agencies (NMAs) and Commercial Surveying Companies (CSC). However, there are many differences in how NMAs and CSC collect, analyse, manage and distribute geographic information to that of VGI projects. NMAs and CSC make use of robust and standardised data collection protocols whilst VGI projects often provide guidelines rather than rigorous data collection specifications. The proposed protocol addresses formalising the collection and creation of vector data in VGI projects in three principal ways: by manual vectorisation; field survey; and reuse of existing data sources. This protocol is intended to be generic rather than being linked to any specific VGI project. We believe that this is the first protocol for VGI vector data collection that has been formally described in the literature. Consequently, this paper shall serve as a starting point for on-going development and refinement of the protocol.

1. Introduction

Volunteered Geographic Information (VGI) [1] is now an important component in GIS research and in geomatics in general. Interest in VGI has grown quickly in the past decade and it is now a growing area of research. The collection, management and dissemination of geographic information by citizens, who are in general not trained as professional geographic surveyors, presents interesting challenges [2]. VGI data collection can include activities such as collection of point-based data using GPS devices, manual vectorisation of digital map sources or imagery, import and conversion of openly accessible geographic data from other systems, services, providers, etc. In more advanced cases, it can include the extraction of VGI data from ambient sources such as Twitter, Foursquare and other social media where geographic information is implicitly embedded in social media posts and messages [3,4]. Overall, it is the transformation of the World Wide Web and the current availability of a vast range of consumer-grade hardware devices and software solutions capable of collecting, managing and distributing geographic data and information which have had the greatest impact on the popularity of VGI [5]. Crowdsourcing of geographic information through popular VGI projects such as OpenStreetMap (OSM) has also been a major factor in the rise of VGI [6].
The literature has shown VGI quality to be comparable to data from National Mapping Agencies (NMAs) and Commercial Surveying Companies (CSC), at least in selected geographic areas (see, e.g., [7,8,9,10]). Initial fears about using VGI as an alternative or complement to authoritative data have subsided. There are many examples of where VGI is being used in real world contexts, some of which will be presented later in the paper. However, while NMAs and CSC make use of robust and standardised protocols that govern and guide the collection of geographic data, VGI projects often lack protocols or they just provide loose guidelines and suggestions rather than strict specifications. Although VGI can theoretically reach high standards of quality without rigorous protocols, their absence is often a major source of errors in the data and frequently represents a barrier to its wider diffusion and reuse.
The need to establish standards and protocols for VGI projects is not a novelty. When VGI began appearing in the literature, researchers warned about the threats for community and society posed by lack of protocols [11]. Recently, other authors mentioned the relevance of protocols for VGI projects and suggested to define protocols in order to ensure high data quality [12,13]. From this perspective, some research works proved that proposing a recommendation system to guide contributors enhance the quality of contributions [14,15]. Protocols are also crucial to facilitate and widen the reuse of VGI for purposes and applications others than the one it was originally collected for. For example, a geotagged photo contributed for fun to a photo sharing site like Flickr may be used afterwards to investigate the evolution of the territory and its land use and land cover; similarly, a building or a road added to OSM may be then used for disaster response, for planning activities or for the update of official cartography. In this paper, we propose a protocol for the collection of vector data in VGI projects. Although all kinds of geo-tagged information can be considered as vector data (e.g., a set of geo-tagged photograph can be considered as a point-encoded layer), in this study, we refer to the basic geometric primitives that can be used to form topographic maps (i.e., points, lines and polygons). We provide a rationale to support why this would be advantageous and can help both new and existing VGI projects produce high quality vector data. This paper aims to be the first step towards providing a standardised and rigorous protocol for the collection of geographic vector data in VGI projects. This protocol is intended to be generic rather than linked to any specific VGI project. It attempts to balance the needs for rigorous data collection strategies and the motivation for VGI project participants to follow the protocol. For many citizens involved in VGI projects there is a sense of fun attached to their involvement. These citizens are usually collecting VGI on their own leisure time, which is one of their most precious resources [16]. Thus, we believe a protocol that causes VGI participants to become frustrated or demotivated should be avoided.
The research contributions are summarised as follows:
  • A generic protocol has been developed which can be applied by new or existing VGI projects. It can also be used retrospectively on existing data and information in current VGI projects or it can be the starting point for case-specific protocols.
  • The protocol aims to be inclusive of all participants to VGI projects from new to experienced VGI contributors. Speilman [2] (p. 123) argues that systems for VGI and user-generated maps should be designed to “foster conditions known to produce collective intelligence rather than privileging particular contributions/contributors”. The protocol only assumes a basic working knowledge of geographic information science with basic file and data handling skills from information technology.
  • The protocol has been developed in a bidirectional fashion. We have carefully studied mapping practices in bottom-up approaches (VGI for example) and top-down approaches (NMAs). In this way, we feel that this protocol is positioned in an intersection of the space between these two opposing approaches to the generation and collection of geographic information.
The remainder of the paper is outlined as follows. In Section 2, we provide motivation for the requirement for a VGI vector data protocol. In Section 3, a description of the vector data protocol is provided. In Section 4, we provide the details about the protocol implementation. A brief discussion of the software implementation driven by the protocol is then given. Section 5 provides a discussion and an evaluation of the proposed protocol outlining research directions and issues for future work. Finally, Appendix A, Appendix B and Appendix C provide complete examples and use cases of the proposed protocol.

2. Assessing the Benefits of a VGI Vector Data Protocol

2.1. Motivation

The current literature on VGI quality has a focus on comparing quality elements such as accuracy (position, temporal, thematic, etc.), completeness, thematic similarity, and logical consistency of VGI with authoritative data from NMAs and CSC [5,17,18,19,20]. For a complete review of data quality assessment methods, see [21]. However, there has been little work documented in the literature in how VGI is actually collected “in the field”. There are many differences in how NMAs and CSC collect, analyse, manage and distribute geographic information to that of VGI projects. NMAs and CSC use robust and standardised protocols considered as “terrain nominal” (i.e., an abstract concept defined by a cartographic representation perfectly compliant with data specification) [21], which govern and guide their collection of geographic data. Whilst VGI projects often provide guidelines to their contributors on how to collect and survey geographic data, these guidelines are often flexible and can lack professional geographical survey rigour. Moreover, volunteers are only encouraged—but not actually forced—to use these guidelines, and it often happens that they collect data without studying the VGI project recommendations. The lack of adoption and implementation of rigorous collection and survey strategies in VGI causes concern to users, and potential users, of VGI.

2.2. Protocols in Geomatics and Citizen Science

Protocols usually specify how data should be collected and various other elements such as the area of scope, preferred methodology, best practises, and common pitfalls. Protocols must define a formal design or action plan for data collection that will allow observations made by multiple participants in many locations to be comparable and to be combined for analysis. In this section, we provide a brief discussion of protocols that already exist in geomatics and citizen science domains. This amplifies the need for protocols in VGI.
Other areas of geomatics rely heavily upon the use of protocols for the collection, management and production of geographic data. Within NMAs and CSC, there are protocols for how reference and survey data are modelled, collected, collated, managed and inserted into spatial databases. Some of them are available to public [22,23,24,25] and others are used strictly for internal purposes. For example, the specifications proposed by IGN France, specify how features are organised, referenced, captured, maintained and how the quality is assessed. For each theme, precise information such as the definition, the geometry type (point, line, polygon), list of attributes (e.g., name, nature, and number of lanes), selection rules, and geometric capture are described.
A similar example exists in the Italian national vector cartography, named Database Topografico (Topographic Database (DbT)). This has subsequently been transposed by each Italian Region by means of customized specifications. As an example, Lombardy Region (in Northern Italy) provides a rich set of technical specifications for DbT production and updating through photogrammetric surveys, representation, content and physical schemes. All these specifications are separately accessible [24]. Some rigorous protocols, not available to public, were proposed by the Multinational Geospatial Co-production Program (MGCP) to produce high resolution vector data. The protocol provides guidance for every phase of the data gathering and management by providing documentation on: Feature and Attribute Catalogue, Semantic Information Model, Extraction Guide, Metadata Specification, Edge-matching Process, QA Cookbook—Quality Assurance Guidance, Validation and Internal Supervisors’ Direction [26].
Few NMAs in Europe have experience with VGI [27] and there only now we are witnessing the first efforts to develop guidelines, best practices and protocols within NMAs or CSC for dealing with VGI [28]. However several authors such as [8,29,30,31] have considered ways in which VGI and data from NMAs and CSC can be compared, fused or integrated in order to develop more comprehensive, up-to-date and complete datasets. The United States Geological Survey (USGS) was the first authoritative geographic organisation that allowed citizens to act such as volunteers when in 1991 it developed Earth Science Corp renamed later to National Map Corps [32]. Although initially efforts were hampered by the available technology of the time, this situation has changed in the past 4–5 years due to the improved technology and the initiative has become very attractive to volunteers. User guides rather than protocols for contribution are often provided on websites of participating organisations. In the field of Citizen Science, there are many examples of where data collection protocols have been developed. Several authors [33,34,35] remark that ensuring citizens collect and submit accurate data depends on providing three things: clear data collection protocols, simple and logical data forms, and finally support for participants to understand how to follow the protocols and submit their information. According to The Cornell Laboratory for Ornitology [34], most volunteers are willing to follow protocols (even quite complex ones) in order to collect data in a recommended and standardized way to be sure that their input is valuable. The report on Broadening Participation in Biological Monitoring [36] emphasises that in most cases the greatest reward for participants is to see that the results of their voluntary data collection efforts are valued. Protocols can be simplified, clarified, or otherwise modified until the participants can follow them with ease which can be achieved through good project design [33]. The GLOBE Program (https://www.globe.gov) promotes and supports the collaboration of students, educators, as well as professional and citizen scientists on inquiry-based investigations of the Earth system. The GLOBE scientific protocols are step-by-step instructions and frequently asked questions on how to collect high-quality data that is used in research and in the classroom. Their work with teachers has led to the creation of over 55 scientific protocols (https://www.globe.gov/explore-science/globe-science-overview/overview/scientist-nvolvement/science-leads).
VGI in biodiversity monitoring is well known as a field where protocols exist and generally volunteers follow protocols in order to collect good quality data. Successful initiatives, in terms of good quality data, in biodiversity-related projects, include Spipoll [37], the French Bird Breeding Survey [38] and Sauvagedemarue [39]. Many of the participants in these projects are not experts in biological recording but have interest in photography. Simple and short protocols are defined where collection of data happens in a few steps and is easy to carry out. For example the Spipoll project proposes two protocols (in short and long form) in both paper and video format with examples and good practices available [40]. Easy to use online tools are developed and provided to volunteers. Massey [41] indicates that best practices for environmental monitoring project teams are required as they assist project managers and their teams to manage any type of environmental monitoring project. Chapman and Wieczorek [42] edit the production of a very extensive best practice document for the georeferencing of biological species by professional and amateurs. Smith et al. [43] produce an extensive best practice guide for habitat survey and mapping in Ireland. However, the guide is usable in many other regions.
Protocols and good practices for manual digitization and georeferencing of historical maps are also introduced. The British Library (http://www.bl.uk/maps) proposes a crowdsourced project to georeference old maps with a georeferencer online tool (http://www.georeferencer.com) available. The French GeoPeople project contains protocols for manual digitization of old maps from late XVIII and early XXI centuries [44] (see Figure 1). The GeoHistoricalData project uses a collaborative platform to manually digitize old maps at large scale within French Territory according to a detailed protocol collaboratively defined and continuously enriched [45]. Protocols, available as videos, are proposed within a very successful project, the NYPL MAP Warper, which is a collaborative digitization and data validation of historical maps from the New York Library (http://maps.nypl.org/warper).
Would a protocol increase the volunteer participation to a VGI project? In Schmidt et al. [46] the authors show that about 30% of participants in a survey about contribution to OSM declared that they were afraid of doing something wrong and had inadequate guidance. The quality of VGI is considered a barrier also by the European NMAs in engaging with VGI [27] and the existence of VGI protocols would reduce such barriers while maintaining VGI contributors. It may also favour the reuse of collected VGI within other, future and even unintended, purposes.

2.3. Consequences of Lack of Protocols

While there are many great examples of VGI vector data there are still problems related to the quality and we believe that the need for a protocol for VGI data collection exists. The need for a vector-based VGI data collection protocol can be seen from the viewpoint of the geomatics expert and the novice VGI contributor as well. In this section, we outline the consequences of not having a VGI protocol.

2.3.1. The Lack of Protocol from the Perspective of the Layman Contributor

At minimum, a novice, potential contributor is equipped only with interest to participate in a collaborative project. It cannot be assumed that these contributors have any knowledge about editing environments, differences between raster and vector encodings, preferred feature geometries or topologic rules. Even if some explanations are given in web pages of a VGI project, concrete understanding of the basic principles of GIS is not acquired immediately when a contributor engages with a VGI project. If there is only sporadic contribution, concepts such as formats, data types, domains, attributes, database integrity, etc. are hard to understand and implement. In this context, one can recognize a number of issues that could be avoided if a best-practice protocol for VGI data collection is to be followed.
For data collection, it has to be explained that each choice has its advantages and disadvantages and potential contributors should be aware of those before starting to produce data. The list of issues that need to be explained in a protocol includes problems such as selecting an appropriate geometry (point, line or polygon) for a feature, selecting a representative location of the feature (e.g., centroid, entrance, etc.), the attribution process and the needed consistency, the handling of multiple contributions for the same feature, the harmonization of results from different applications or familiarity with the data collection process regarding the limitations of the method and the equipment utilized.
The main contribution of a protocol to an enthusiastic, yet novice and inexperienced, contributor is not only to provide technical details about the data collection process but also to inculcate an attitude and cultivate a culture that needs to be built to each and every contributor in respect with the VGI project goals, the spatial features to be captured and the role these features are expected to play in the hands of the users. Otherwise, loose and free-style contributions will probably deteriorate the overall data quality, something that will not be noticed by the contributor who will continue contributing in a similar or gradually improving way, or they will be spotted and rejected by other experienced members of the community which can cause frustration or embarrassment to the novice contributor with a negative impact on his/her future engagement with the project. All cases are problematic and can be fixed with relatively little extra work of studying and following a certain contribution process.

2.3.2. The Lack of Protocol from the Perspective of Experts

In many VGI projects the loose and unstructured way of data contribution from numerous volunteers has created more problems than those it was trying to solve. Researchers have recognized this issue (see, e.g., [47]) and they have highlighted the need for a moderation in data creation or integration from multiple sources. In this section we present a number of examples where the VGI contribution process and particularly the lack of data contribution protocols were obstacles as they affected many geographic data quality elements. One major example arises from examining the effort to integrate Corine Land Cover data [48] with OSM for France [49]. First, it was realised that the Level of Detail (LoD) of the two datasets differed considerably and this created numerous geometric inconsistencies with OSM [50]. There were semantic inconsistencies as the CLC 2006 nomenclature did not match with OSM typology not least because the land-cover interpretation needs considerable more expertise than the one usually needed in OSM road-classification. Furthermore, the integration of CLC 2006 took place in 2009 (i.e., when there was a change in data licensing), which caused issues regarding temporal consistency among existing and newly imported land-cover features. As there was no protocol in place that could guide (even experienced) volunteers on how to treat newly imported data there were ad-hoc solutions developed to mitigate the issues. In another case, the integration of OSM data and authoritative data from NRCan (a governmental agency of Canada) failed to consider issues around licensing and intellectual property rights which hindered and delayed data integration [51]. Regarding attribution consistency it has been shown that the loose, grass-roots mechanisms of data contribution lead to noise into the datasets that deteriorate overall data quality [5]. VGI is also a social phenomenon and consequently there must be consideration of how social factors can affect contributors and how their contributions are accepted by society itself. For the former, it has been shown that uncontrolled contributions lead to biased participation patterns [52], while for the latter, Haklay et al. [49] describe how a crowdsourced gazetteer project encountered obstacles by the local communities in respect with the dialect used. All these, affect the VGI data quality and create numerous errors in the VGI data collected.
This is not to say that VGI communities do not recognize the importance of error-detecting and avoid trying to correct them. In the case of the OSM project there are a number of tools that try to detect errors such as Keep Right (http://keepright.at), Osmose (http://wiki.openstreetmap.org/wiki/Osmose), MapRoulette (http://maproulette.org), JOSM Validator (http://wiki.openstreetmap.org/wiki/JOSM/Validator) and others that deal with specific layers such as addresses (http://gulp21.bplaced.net/osm/housenumbervalidator), roads (CheckAutopista http://k1wiosm.github.io/checkautopista2), etc. These tools check the OSM data for potential data errors in geometry, topology, accuracy, completeness, and attributes. Notwithstanding the usefulness of such tools, they have an a posteriori functionality and thus form the quality control strategy of OSM. This work aims to create proper conditions at the other end of the quality spectrum of VGI projects: quality assurance. A robust, easy to follow protocol can function as a pre-emptive mechanism that will minimize the appearance of quality deterioration factors.

3. Description of the Vector Data Protocol

3.1. Goals and Qualities of the VGI Vector Data Protocol

From the authors’ point of view, a VGI vector data protocol should have goals related to the form (high level goals) and the content (data specific goals). Regarding high level goals, the protocol should:
  • Align the vision, mission, and plans of a particular VGI project to policies and procedures for collecting geographic vector data. The protocol should be acceptable to both the VGI project community and the members of the project board or steering committee.
  • When possible, satisfy current geospatial standards whilst using methods which have already worked successfully in previous and existing VGI projects.
  • The protocol should be structured and managed efficiently, so that an objective review, control and integrity check both from the managers of the project and external subjects are possible at any time. It should also be easily changed and adapted to changes or advances in geospatial technology or in the mission and vision of the applied VGI project, while at the same time allow compatibility with datasets already created.
The protocol should be based on both existing standards related to the collection, analysis, visualization and documentation of vector data (e.g., from ISO and OGC) but also on successful practices already used in VGI projects.
From a data point of view the protocol should:
  • Outline how to collect accurate VGI vector data.
  • Be effective and available to all the contributors or volunteers of the VGI project.
  • Attempt to promote efficient data collection.
  • Be reliable by providing information and supporting documentation which are relevant and aligned to the overall objectives of the VGI project.
  • Where necessary, include an emphasis on the value of collecting metadata and attribute information about VGI objects created.
  • Be accessible by avoiding excessive use of jargon and unnecessary technical, mathematical and scientific detail. Where possible and appropriate, the protocol should be translated into multiple languages. The protocol should be made openly available in a wide range of open formats.
  • Include data collection methods that are transparent and clear. The protocol should be easy to adopt by ordinary people, i.e., require the use of well-known or well-understandable procedures to be performed with ordinary devices and tools.
  • Be timely by emphasizing the need to ensure that data collection is done in a timely manner. There should not be an unnecessarily long gap between collection and submission to the VGI project.
  • Outline data collection procedures ensuring that the volunteers act with due respect and regard for local laws and by-laws, personal health and safety, conservation and respect of natural environment.

3.2. Content of the VGI Vector Data Protocol

The proposed protocol covers the following topics by adopting the goals and qualities raised previously in Section 3.1 from a data point of view:
  • Data model: The expected thematic layers of the VGI project are introduced to make the contributor familiar with the topic and to increase the awareness of what to collect.
  • Data collection methods: The contributor is informed about the available data collection methods.
  • Vector data characteristics: The contributor is introduced to a number of data characteristics according to the VGI project goal. The above issues are discussed in detail in the following subsections.

3.2.1. Data Model

The protocol should present the VGI project in detail explaining the motivation, the aim and the objectives. This description makes it easier for the contributor to understand why and how to collect data. A VGI project can aim for data collection for different reasons such as to create a land use base map, to record one or more special thematic layers (e.g., endangered birds’ nests) or to capture local names for a gazetteer. In addition, the protocol should inform the contributors of the possible alternative applications of the project data, which may reveal additional qualities needed by the data collected.
According to the project goal, the protocol should propose a list of thematic layers while at the same time maintaining the contributors’ freedom to suggest new ones. For example, the OSM project was started with the goal to capture roads, but, in the end, countless other thematic layers were defined and added. Based on the chosen thematic layers, a data model is defined and presented to the contributors. Data model details:
  • Geometry: A unique geometry such as (multi) point, (multi) line or (multi) polygon or a composed geometry allowing multi-scale data collection—e.g., city as a point (small scale) or as a polygon (big scale)—are proposed for each thematic layer. Geometrical issues such as whether a river is captured as an area or a line should be clarified.
  • Attributes: Attributes capturing the core descriptive characteristics of each thematic layer are proposed. For example, the “roads” thematic layer captures attributes like name, type, number of lanes, etc. Although the list of attributes can be updated by the users, contributors should be aware of the attributes used by other contributors and the values used to instantiate the attributes. Any legitimate value can be recorded to the attributes but contributors’ taxonomies are encouraged.
  • Mapping rules to ensure homogeneity: Rules describing how a real world object should be mapped, e.g., the middle axis is mapped for roads, entrance is mapped for buildings represented by points, the maximum footprint is mapped for buildings represented by polygons, etc.
Protocols should include examples for each thematic layer. Specific cases are presented using vector data already collected, sketches, photos and aerial/satellite imagery, as for example in the Map Feature wiki page of the OSM project (http://wiki.openstreetmap.org/wiki/Map_Features). Contributors are encouraged to familiarize with the protocol and the provided examples before they are enrolled in data collection. Moreover, they are urged to provide comments and remarks.

3.2.2. Data Collection Methods

According to the usual practices for vector data mapping, data collection for a VGI project can be performed by manual vectorisation, field survey and bulk import. Protocols should provide a brief presentation of the process(es) involved and focus on best practices for specific cases. The following qualities should be exhibited:
  • The audience of the data collection presentation should be taken into account.
  • Lists of “dos and don’ts”, demos, examples, podcasts, videos, etc. are good ways of communication.
  • Additional information should be available for the eager user, e.g., hyperlinks to scientific documents.
The outlined data collection methods are presented in the following and a number of good practices are suggested. However, the list is not exhaustive since this is out of the scope of this paper. Good practices should be included in the protocol in relation to the data content which varies for each specific VGI project.
Manual vectorisation is considered as the acquisition of vector data from maps, aerial or satellite imagery. On-screen manual vectorisation by tracing a mouse on features displayed on a computer screen is the most popular method for data acquisition. Some good practices can be suggested:
  • Source type: A georeferenced map/photo or an orthorectified image should be used.
  • Tool: The use of an optical mouse instead of a touchpad is highly recommended.
  • Grid: When a big area or many objects need to be manually digitized, the map/image can be spatially divided into smaller areas in grid. Thus, the identification of the area is facilitated by zooming in/out and exhaustive coverage is succeeded.
  • Scale: The scale should ensure a good precision and allow the capture of appropriate details. The scale should be maintained constant over the collection process of a specific thematic layer to assure homogeneous resolution in data capture. Working at the maximum zoom is not always the best practice since it will produce very detailed geometries that will be time consuming and not necessarily fit for use.
  • The manual vectorisation process should be done object by object according to the data model details (see Section 3.2.1) and the vector data characteristics such as topology (see Section 3.2.3).
Field survey refers to the collection of vector data by using equipment such as GNSS devices, smart phones, etc. A brief presentation of the GNSS technology, characteristics and usage should be included such as sources of error related to equipment and set-up procedures, environmental criteria, etc. In addition, contributors should be recommended to familiarize with this possibly unknown technology. A number of good practices can be advised:
  • Device settings: Set up GNSS settings to get the best performance of the equipment used.
  • Control points: Use a known or standard data set as control points for ensuring high accuracy.
  • On field practice: Position of the GNSS antenna for best satellite reception.
  • Environmental effects: Understand the influence of the environment on quality, e.g., in the wide open high accuracy is succeeded with low cost devices, whereas multi-constellation tracking and multipath filtering is needed to achieve that level of accuracy in shaded areas.
Bulk import refers to the integration of existing vector data in the VGI project. Spatial data from other data sources such as archives held by individuals, governments or third-party organizations can be considered. Good practices for bulk import (some of which are also mentioned in the OSM import guidelines) include:
  • License and private issues: Data for import must be appropriately licensed for use in the VGI framework. For this reason, the issues of data license and privacy should be clearly explained.
  • Coordinate Reference System (CRS) transformation: imports may need to transform data into the VGI project CRS.
  • Schema and data matching: To avoid redundant information and to prevent conflicts, a schema matching needs to be processed followed by a data matching.
  • Transformation: Other transformations such as conversion of data format (e.g., KML to shapefile), geometry change (e.g., polygons to points) or generalization (e.g., very detailed roads in less detailed roads) may be needed to ensure quality of the integration process.

3.2.3. Vector Data Characteristics

A number of vector data characteristics are of great importance and should be introduced by the protocol.
  • CRS: The protocol should clearly state the CRS adopted by the project (e.g., WGS 84). The contributor must always report the CRS used and possible transformations performed. In the case that data are transformed to the CRS of the VGI project from another, one must ensure that the cartographic projection and the datum transformation are performed as expected. Control points should be used to prove that the transformation is correct. If an error measure of this transformation (e.g., RMSE) is known, then it should be reported as metadata.
  • Topology and topological rules: The protocol should encourage data integrity provided by topology. This can be accomplished by adopting specific data collection tactics and using GIS tools that ensure correct topology. For example, most data digitization platforms provide tools that permit snapping to the nearest vertex and segment of a line or polygon. A number of GIS tools can also be used to check for topological correctness after data collection. Since topological rules and their implementation are rather complex to understand, expected topological relations should be explained to the contributors through practical examples, e.g., when a road and a railway intersect there must be a common intersection point; adjacent polygons must share the same border; and points of interest (POIs) situated in buildings must be positioned inside the building polygons. The protocol should include topologically correct examples for each thematic layer, documented e.g., with the vector data collected, photos and aerial/satellite imagery.
  • Level of detail/scale: The protocol should raise the notion of level of detail or reference scale expected by the data based on the project goal. The level of detail should be maintained over the collection process. This can be accomplished by providing guidance regarding the geometry: minimum details for lines and polygons, minimum dimensions, smallest object size (e.g., building bigger than 20 m2 area, and building bigger than cottage), distance between vertices along a line, or the degree of detail in the classification (e.g., number of categories for land use, etc.). The expected level of detail is related to the data model of the VGI project. The scale issue differs in relation to the data collection method, as stated in Table 1.
  • Metadata: The protocol should emphasize the importance of metadata without forcing contributors to enter metadata. Many contributors are not interested/motivated enough to fill up forms of metadata. Only minimal contribution from contributors should be expected. A middle ground between automatic metadata and manual metadata should be considered as a goal. Tools automatically encoding metadata (e.g., zoom level, minimum dimension, resolution, and timestamp) are most appropriate. Metadata may differ according to the collection method (see Table 1). Attributes intended to make comments, to express unexpected or conflict situations, which allow to a better data quality assessment or data integration/analysis, should be recommended to contributors to provide. Table 2 provides an overview of desired metadata for each data collection method.
  • Data quality: Elements of spatial data quality such as currency and completeness that have not been covered in the data model, level of detail/scale and topology should be explained to the contributor with the help of examples. Contributors should be urged to give an estimate of the data quality or at least to give a warning if there is a quality problem (bad position signal, low visibility in manual digitizing, etc.).

4. Vector VGI Protocol Implementation
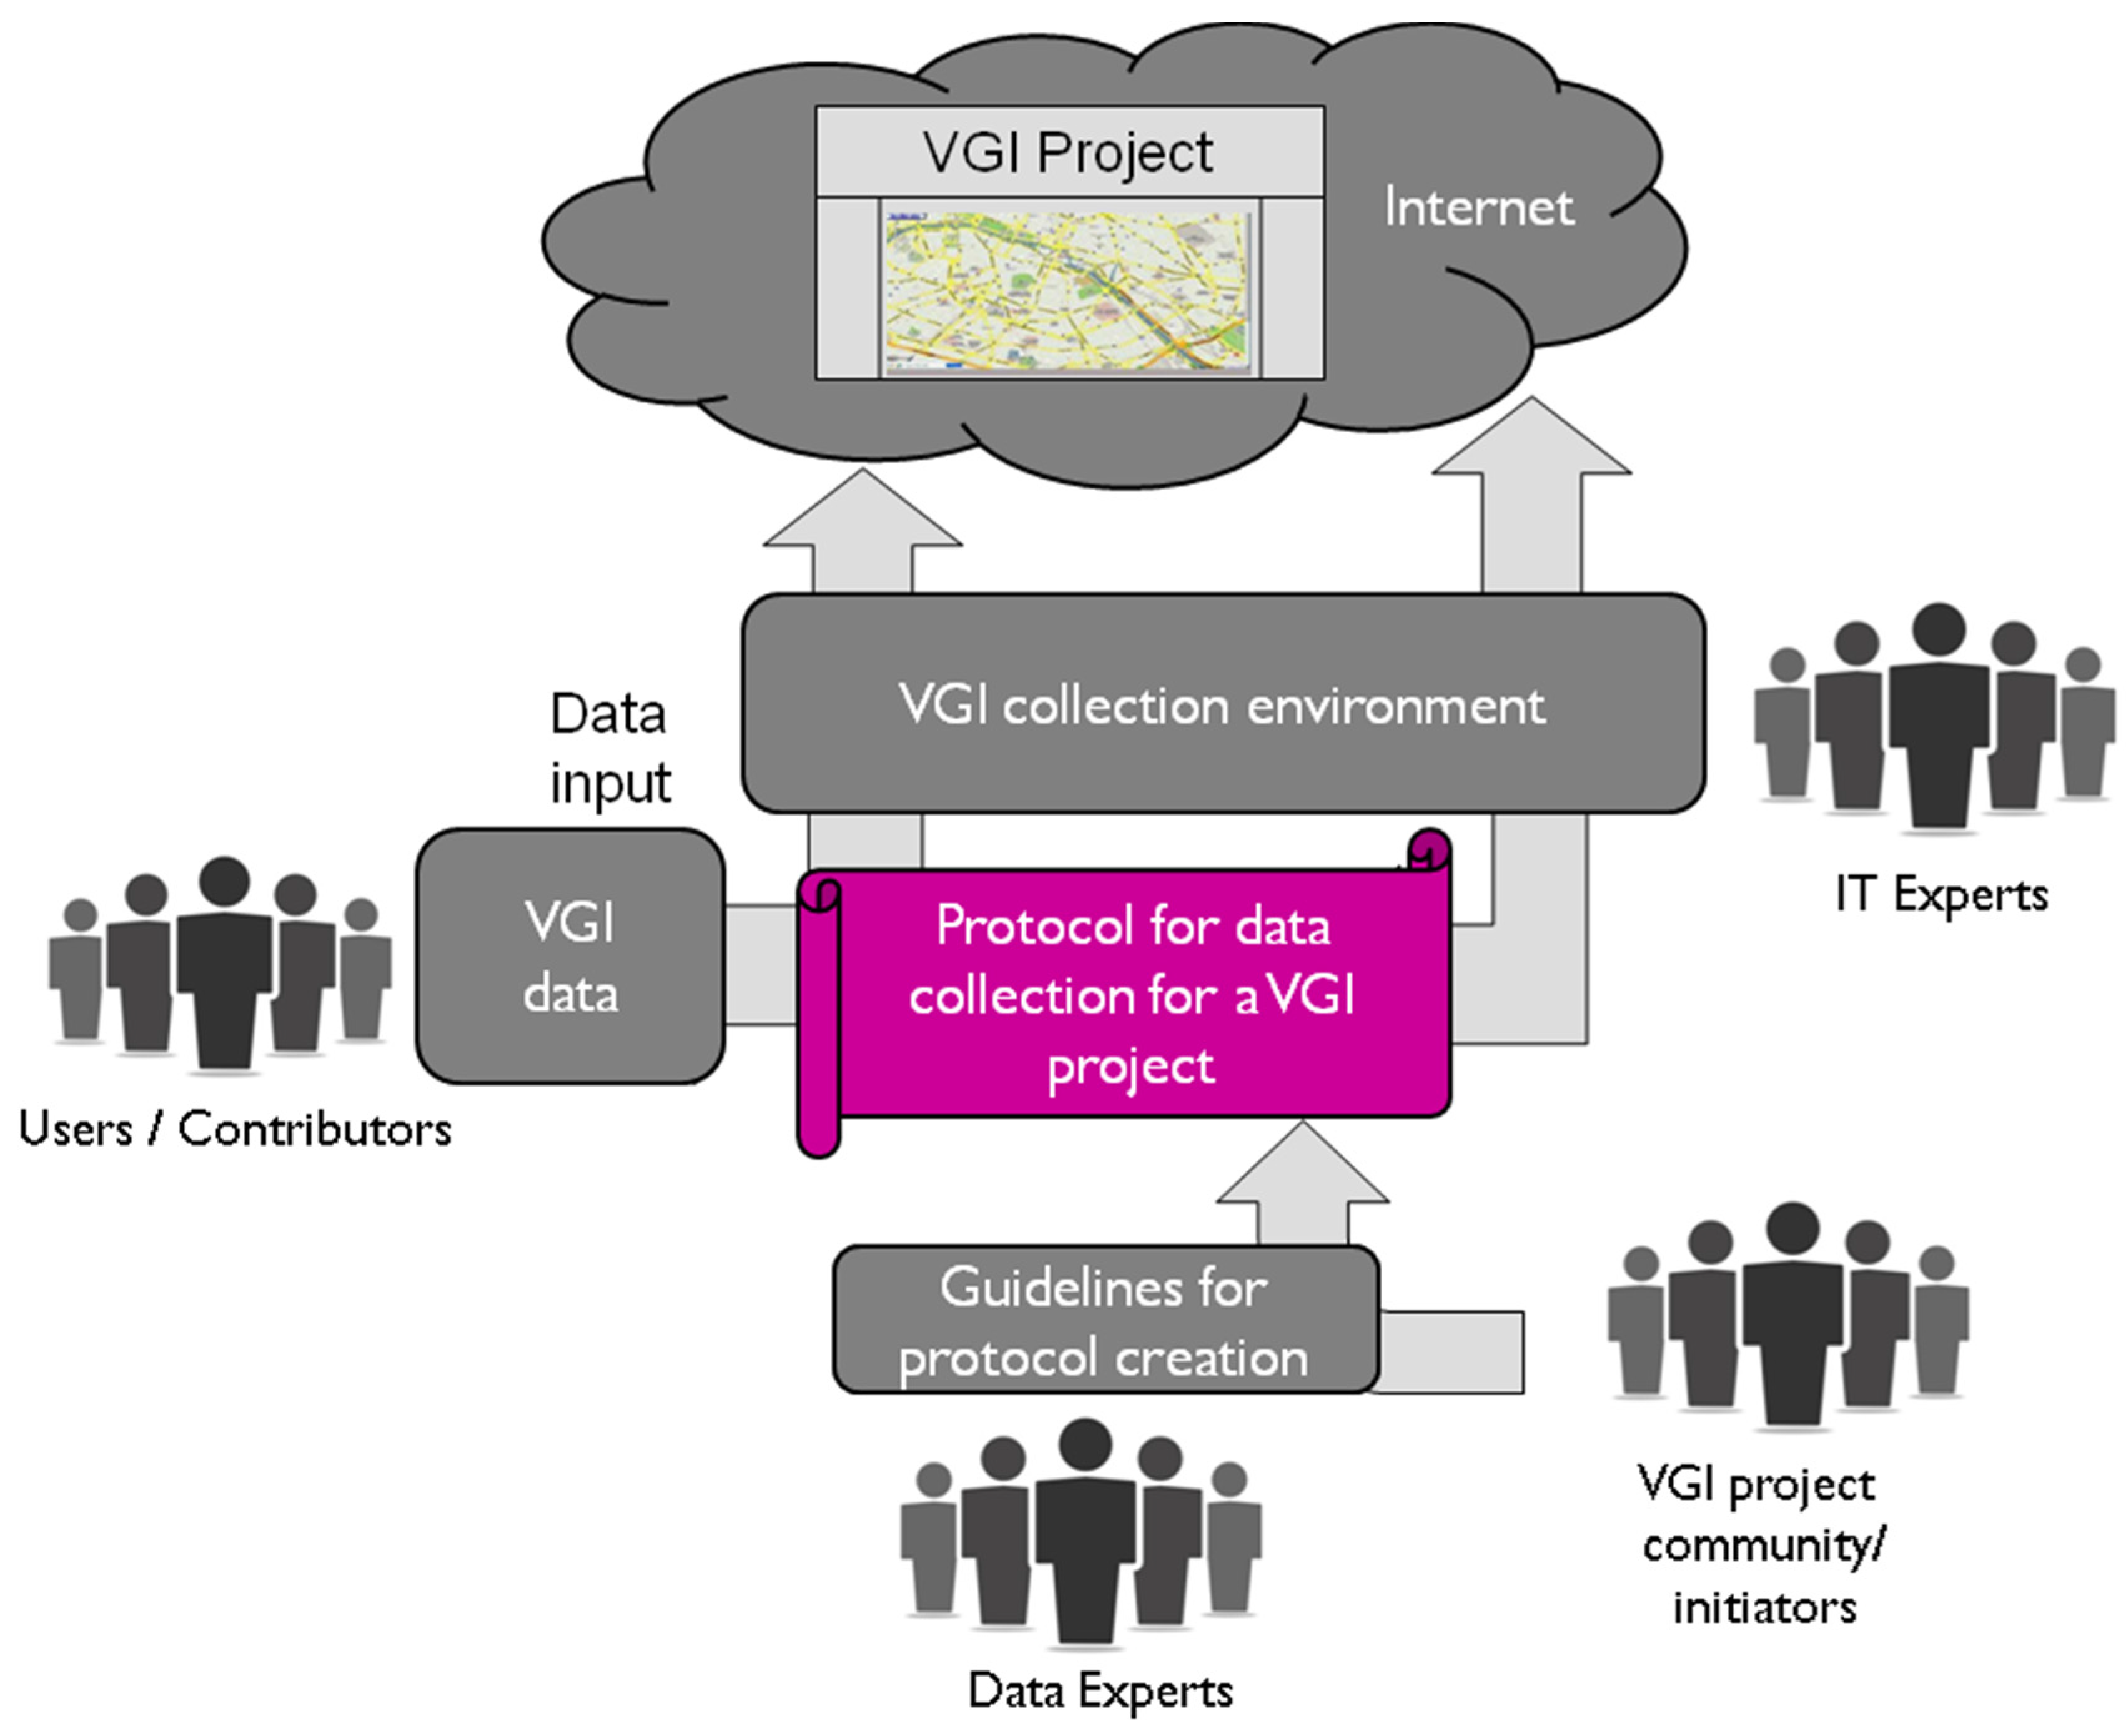
4.1. Stakeholders

As mentioned above, the protocol outlined in this paper should be reasonably generic to be potentially used by any VGI project based on the collection of vector data through manual vectorisation, field survey and bulk import. On the other hand, it should give some concrete recommendations to easily drive users into a replicable step-by-step data collection process and aims to accommodate different levels of user participation (see for example [53]). Different types of stakeholders that might want to adopt the current protocol in their projects include public or private mapping agencies, local governments, public and private associations, Non-Governmental Organization (NGO), and researchers. A case in point could be public or private mapping agencies planning to launch a VGI project in order to receive feedback from citizens regarding the actuality of existing data (e.g., manual vectorisation of a new building) or to collect new content (e.g., obstacles of accessibility). Local governments and municipalities can be also considered as interested parties when building a VGI project to engage in a dialogue with citizens or to gain and share information for purposes such as urban planning [54]. In citizen science projects, different NGO can apply the proposed protocol to collect geographically enabled observations. Moreover, public services, such as medical emergency departments or fire services being interesting by a specific type of data (e.g., water pumps, and obstacles) can lunch a VGI project to collect the needed information. Finally, as cited in Section 2.2, researchers in different fields such as history, geography, geomatics, specialists or non-specialist in spatial data, may be interested to launch new initiatives to collect new spatial data or to manually digitize information existing on old maps for research purposes.
Furthermore, different types of or layman contributors might be requested to follow this protocol. In the formation of the protocol we adopted the typology of Haklay et al. [53] which classifies all types of contributors’ participation. We aim to accommodate the needs of all types of contributors varying from simple crowdsourcing (Level 1) up to extreme citizen science (Level 4). In any case and under any circumstances the proposed protocol safeguards quality input as it sets the basic principles for consistent contributions. The seminal concept of participation by citizens was developed in 1969 by Arnstein [55] when writing about citizen involvement in planning processes in the United States. Arnstein described a ladder of participation with eight steps with the degree of citizen power and control rising the higher the step on this ladder. Our protocol in Figure 2 provides several important steps from Arnstein’s ladder—allowing the citizen community control over the collection and review of data, delegating power amongst contributors and a sense of partnership where every member of the community is following the same concepts and processes.

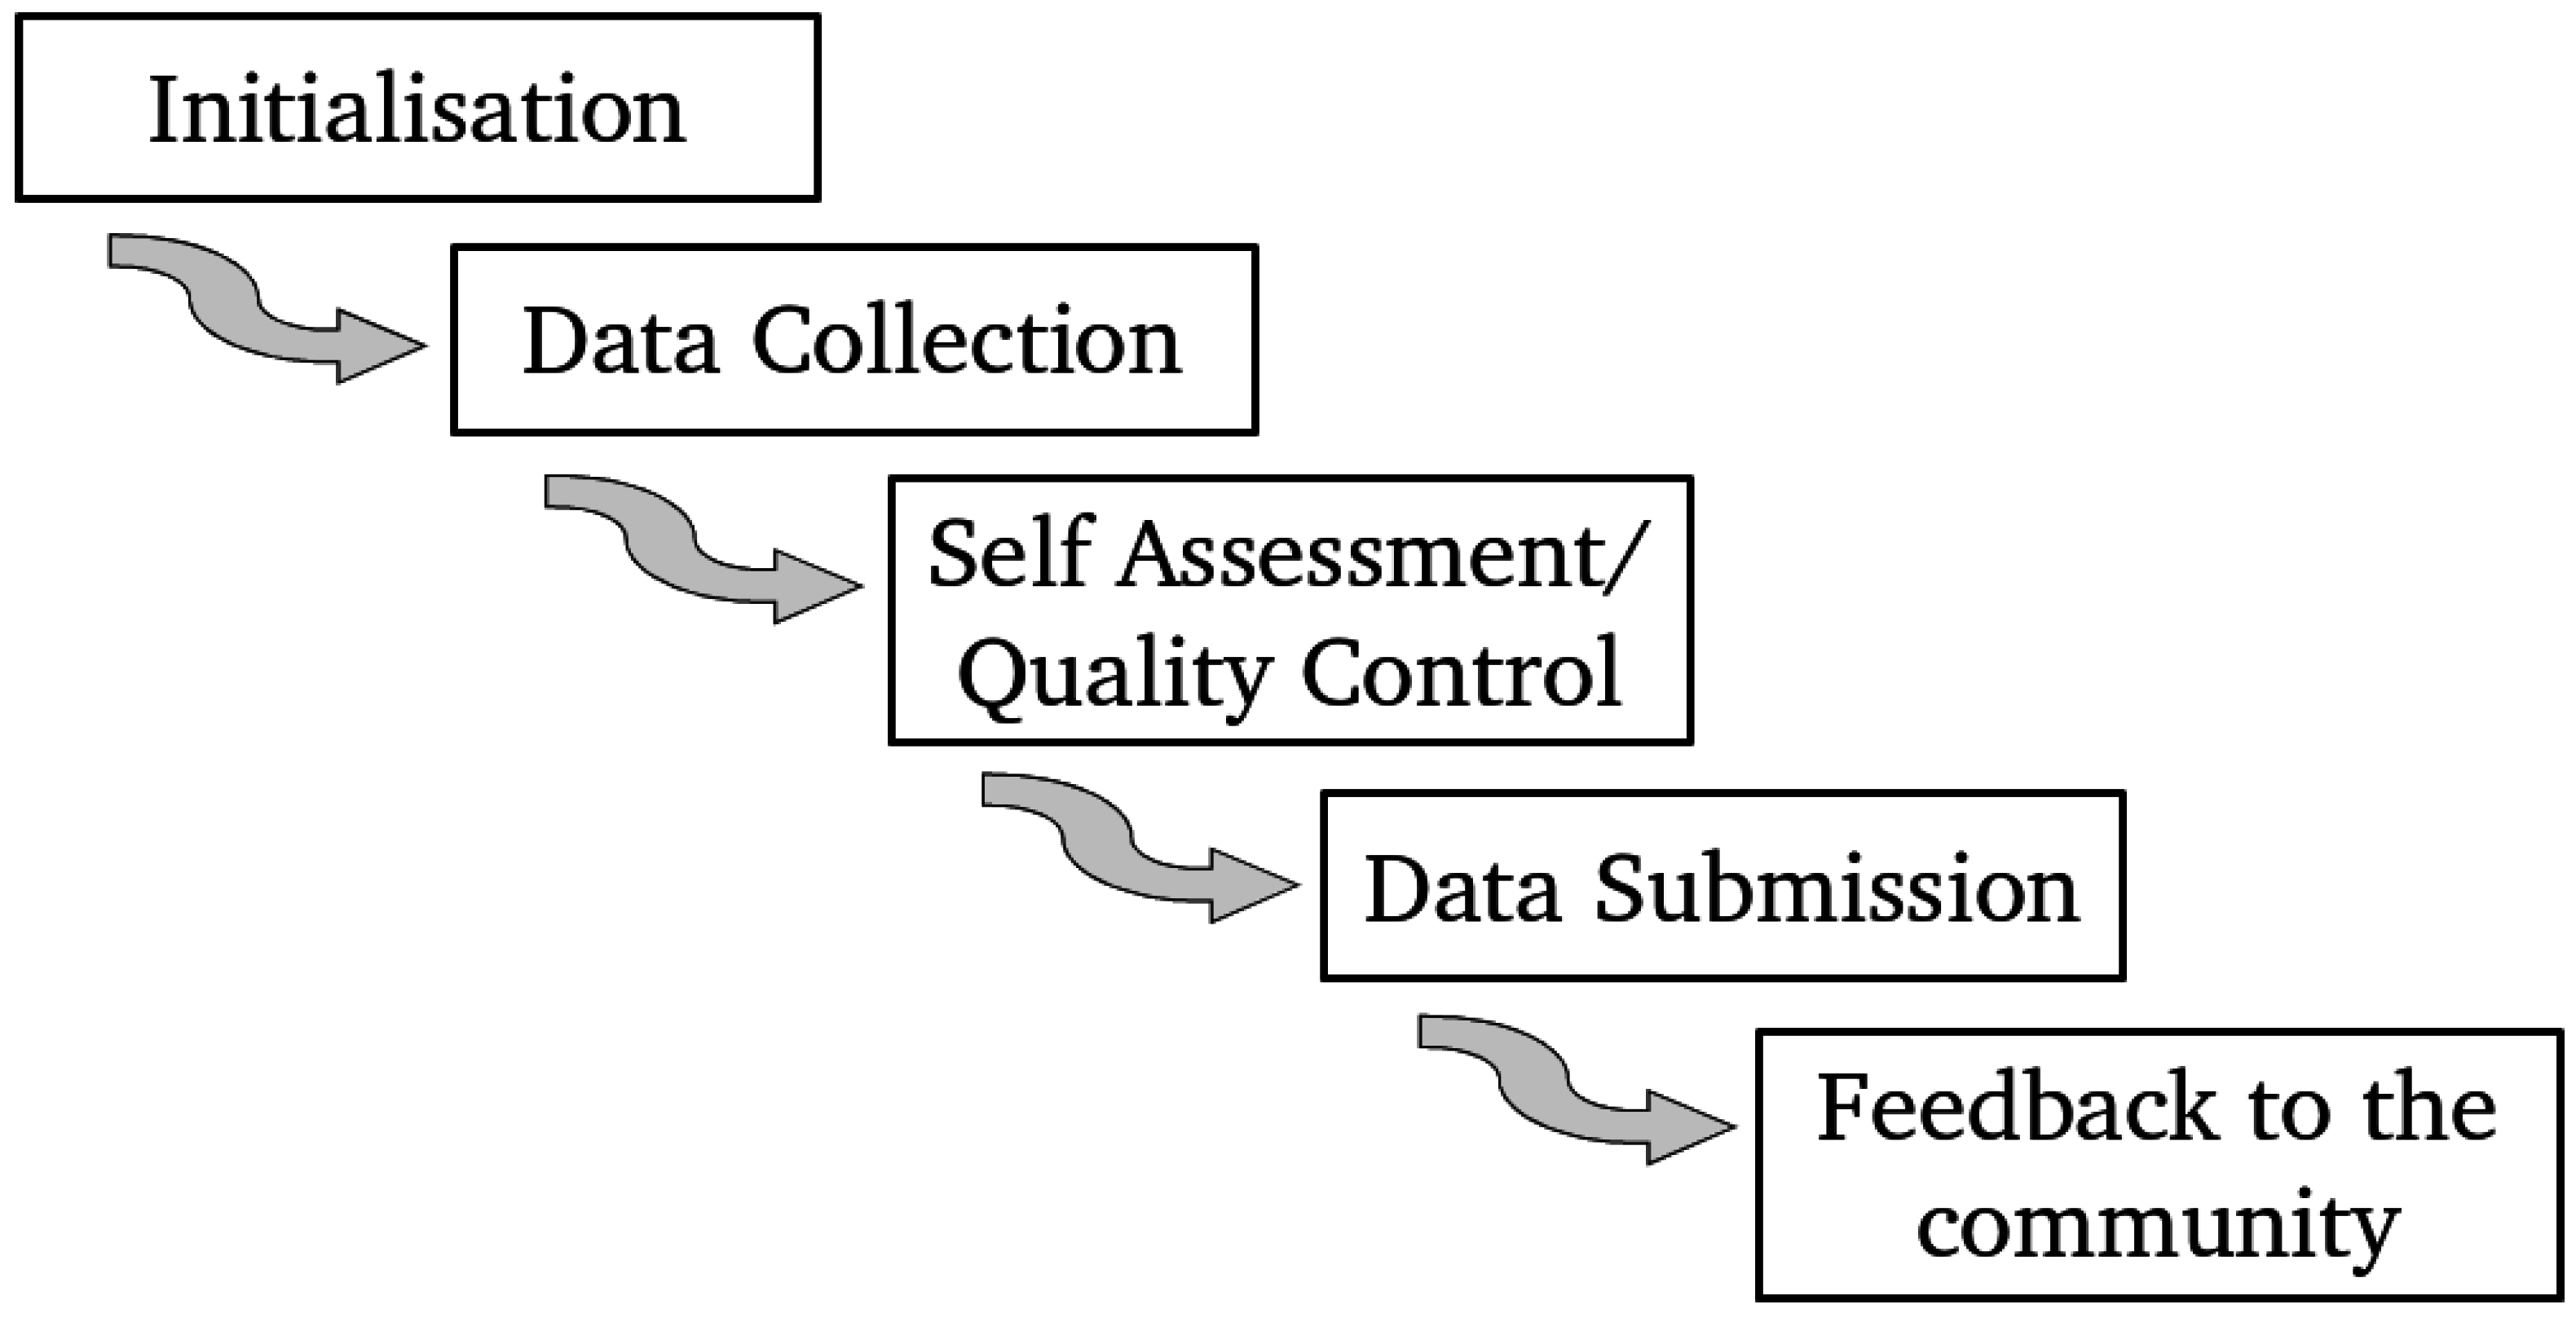
4.2. Stages of Protocol Implementation

The protocol is formalized as the sequence of five main stages (see Figure 2), which are described in the following and are in turn composed of a number of steps.
Appendix A, Appendix B and Appendix C will then provide examples and evaluations of different applications of the protocol based on real case studies involving VGI creation from manual vectorisation, field survey and bulk import.

4.2.1. Initialisation

  • Familiarize with the project by exploring its goals, aims and needs. Understand existing best practices and project specifications, which will facilitate to understand the tasks expected by the project’s contributors and the outcome sought.
  • Decide on/pick a proper device for the task. This can range from a simple web browser for on-screen digitizing to more specialised sensors for on-field collection. The device you choose might not be the best possible one, but it should produce data of a suitable quality for the specific purpose of the VGI project you are contributing to.
  • Familiarise with the device. This helps novice or inexperienced contributors to avoid creating errors that will propagate to the final datasets. Furthermore, some sensors might need to be correctly parameterized.
  • Test collection process. Starting by investing some time in a small demo project will shed light in the entire chain of processes needed. On the one hand, it will help questions to form and answered before real contribution starts. On the other hand, contributors will develop self-confidence or realise that the project is not what they expected. It would be useful to provide some form of “sandbox” development environment where new contributors can simulate the entire chain of processes involved. They can work within the sandbox environment without being concerned with creating problems with the “live” system.
  • Ask yourself if the data thereby collectable can be suitable (and therefore useful) for the VGI project in terms of both content and overall quality. If yes, you are ready to start with the real data collection. If not, you may think to choose a different device (starting back from Step 2) and/or to better test the collection process (starting back from Step 4).

4.2.2. Data Collection

  • Carefully plan the data collection process according to the considerations made during the previous initialisation stage. Identify the best portion(s) of your time you want to spend in data collection: ideally, this should be large enough to ensure the success of the process even in unfavourable conditions or in case errors occur. If possible, concentrate the amount of time you have chosen to spend into one (or few) long stage(s) rather than into many, short stages, as this usually translates into higher-quality output data. Try to avoid other distractions during the whole data collection process.
  • Make sure you have the right device with you and prepare it to be fully working during the data collection process (e.g., in terms of battery power and Internet connection).
  • Make sure you can have a real-time access to the VGI project specifications during data collection. This will be very useful in case you do not remember what you should do and/or you find yourself in a situation when you are not sure on how to proceed.
  • Perform data collection according to the VGI project recommendations. During the process, report any technical (software/hardware) issue you may experience (which is not caused by a bad choice of the device) as well as any anomalous/problematic situation you may encounter which was not explicitly outlined by the project specifications.

4.2.3. Self-Assessment and Quality Control

  • If technically possible, before submitting the collected data to the VGI project server, carefully revise them to check that they are of a suitable quality (in terms of both their geometrical and metadata content) according to the project specifications. In other words, make sure the data you are about to submit can be fully used by the community for the peculiar purpose of the VGI project you are contributing to.
  • In case you find errors (in terms of inaccuracy, incorrectness or incompleteness) in your data, fix them by editing/adding the wrong/missing information; if this cannot be done (because you do not know how to correct the data or because the software implementation does not allow you to do so), delete/discard the data; if this is also not technically possible, before submitting your data clearly state that they are wrong or incomplete.

4.2.4. Data Submission

  • Once all the necessary checks have been made, submit the collected data to the VGI project server. You will require an active Internet connection to perform this step.
  • Make sure the upload operation ends successfully.

4.2.5. Post Data Submission Check

  • Your data are now officially available within the VGI project; perhaps the whole community can already find and use them. Before ending the data collection process, give a final check to the data you have just submitted. This is a different kind of check compared to the previous self-assessment/quality control, as you can now check the quality of your data in terms of—roughly speaking—coherence with the project’s context, i.e., together with the data contributed from all the other volunteers. If available, an automatic validation (of both geometry and metadata) can raise errors and/or warnings about the submitted data.
  • In case errors are detected (both from you and the automatic validator), edit/add or delete/discard the data as explained in the Self-Assessment and Quality Control stage. This operation applies to both the data you have collected and data uploaded by other contributors. Despite the fact that this protocol is meant to guide the data collection process, the same rules are also valid for updating and deleting incorrect/low quality data which are already present in the VGI project.

4.2.6. Feedback to the Community

  • In the same way as the VGI data, also the whole VGI project improves as more and more users contribute to it. Therefore, the recommended final stage of the data collection process is to provide feedback about the experience you have made. Use the available channels provided by the project (forums, mailing lists, social networks, etc.) to express your comments and remarks. Explain whether (and why) the data collection process was easy or problematic, describe any issue you had (e.g., technical problems or unexpected situations) and suggest possible improvements or changes based on your experience. Be precise in your description so that the problem(s) can be easily understood and fixed.
  • As VGI is all about people, spread the word about the project to attract new users. The more participants a VGI project has, the more it can become rich in terms of data and data quality.
  • Examples of the protocol implementation can be found in the appendices (Appendix A, Appendix B and Appendix C).

4.3. Software Implementations of the Protocol

The protocol described in this paper can be used by participants in VGI projects in the form of a printed out or soft copy manual or document. However, as it is clear from the implementation stages described above, a secondary key ambition and goal of this work is to communicate the concepts of the proposed protocol in order to also influence and guide future software implementations for VGI vector data collection. If this protocol can be implemented by software engineers into software used by VGI projects and practitioners, then we believe that the protocol can be communicated to more users and lead to overall improvements in VGI vector data collection. As a matter of fact, we recognize technology as a key enabling factor for the practical adoption of this protocol. It is well-known that an efficient software implementation can make it extremely easy and satisfying for users to go through even complex procedures. Technology, and hence the work of software engineers, can “hide” the complexity of the protocol, which in turn allows to maintain or even increase user participation and improve the quality of the VGI collected. If an existing VGI project had to adopt the protocol, the recommended way would be to exploit technology to gradually integrate the implementation steps described above. This would lead to a slight but progressive modification to the contribution process and the volunteers’ perception and motivation could be maintained or even improved. Examples of how VGI projects can benefit from technology are described in [54].
There is an unpredictable and heterogeneous environment for existing as well as future VGI projects. Users have to deal with a great variety of devices, interfaces and software. Due to the inherent conceptual differences among the three data collection mechanisms upon which the protocol is focused (manual vectorisation, field survey and bulk import) it is beyond the scope of this paper to detail any possible implementation. On the opposite our intention is to recommend that software engineers of VGI projects focus on vector data collection in order for them to translate, for each specific case, the recommendations outlined in the protocol description and formalization (see Section 3 and Section 4) using suitable implementation choices. Ideally, all the steps described above should be carefully checked and for each of them the best possible operationalization solution should be found so that users collecting data can actually exploit the proposed protocol.

5. Discussion and Future Work

5.1. Discussion

In this paper, we have described a plan for the design and implementation of a protocol for the collection of vector data in VGI projects. This protocol is intended to be generic rather than linked to any specific VGI project and works to balance the needs for rigorous data collection strategies and the motivation for VGI project participants to follow the protocol. VGI is now well established and its quality can be in many cases comparable, if not even better, than the quality of corresponding authoritative spatial data [8,9]. In contrast with mainstream and authoritative GI that is usually documented in terms of quality, VGI comes without any straightforward information about its quality and thus, much of the on-going research on the field is devoted into revealing intrinsic data characteristics that can be used as quality indicators. However, and despite the fact that many projects or initiatives seek to maximize the quality of the data collected by contributors, a comprehensive protocol acting as a reference for VGI projects and covering a wide spectrum of quality-related elements is still missing. This paper has addressed this situation by outlining a protocol for the collection of VGI vector data from three distinct processes: manual vectorisation from maps and imagery, field survey, and bulk data import. We believe that the protocol is the first of this kind and intends to provide a first set of general but detailed specifications, which can be potentially applicable to any (existing or new) VGI project focused on vector data collection. We are careful not to relate to any specific VGI initiative (like OpenStreetMap for example) so as to ensure the protocol has potential for further customizations or improvements for specific VGI projects.
For all of these reasons it is difficult to provide an evaluation of the actual usability or effectiveness of the proposed protocol. This will hopefully emerge as VGI projects and related academic research decide to use, or at least to make reference to, the protocol as described in this paper. The protocol has potential to play a very valuable role in VGI projects. This is exemplified in Figure 3, which shows the four actors involved in the use and creation of a protocol for data collection in the framework of a VGI project:
  • Spatial Data Experts: Propose guidelines for the creation and the application of a protocol for vector data collection in the VGI project.
  • VGI project community/initiators: Create the protocol for vector data collection in the VGI project based on the guidelines and the project special characteristics.
  • IT Experts: Implement software interfaces and environments that facilitate the implementation and application of the protocol. We believe that these IT Experts will require the ability to use popular and well known open source (or proprietary) tools for working with geospatial data such as the tools available from OSGeo. We acknowledge and understand that the requirements for the IT implementation of this protocol will be significant and should be examined in more detail at a later stage.
  • Users/Contributors: Collect VGI data following the protocol and provide feedback about the process and the protocol itself.
In this context, the most suitable position available for researchers is the one for spatial data experts. This group can include also project specific experts who bring the substance knowledge to the protocol. As the actors in charge of defining the protocol spatial data experts play a preliminary and crucial role in the whole process. Nevertheless, the success or failure in the adoption of the protocol depends also on all the other actors involved. In an ideal workflow, there should be interaction between all of them. This process should be dynamic and in principle it should never come to an end because as long as the VGI project is active the protocol should be a living reference that constantly evolves with the actors’ feedbacks and mutual decisions.
Every protocol for VGI vector data collection should follow the above-mentioned sequence of five main stages. These stages have been considered by the authors and verified by the case studies analysed in Appendix A, Appendix B and Appendix C. However, the evaluation of a VGI project specific protocol is considered an open process that is conducted as the VGI project develops. The content of the protocol is project-specific, continuously enriches based on the user experiences and adjusts to any new condition, e.g., new technologies in data collection. Initially, the protocol can be evaluated, in order to assess how well it provides with the knowledge and skills needed to collect data, by the spatial data experts or by conducting specific tests. As the VGI project matures, possible problems, omissions or insufficient documentation in the protocol become apparent eventually in the data collected and can be fixed by any of the above mentioned actors such as spatial data experts, IT experts, project community or users. Careless application and rejection of the protocol by the users are also possible and become apparent by problems in the data. When errors are detected, a more careful application of the protocol is advised or enhancement of the protocol with more precise or user-friendly directions to support a better implementation (see Appendix A, Appendix B and Appendix C).

5.2. Future Work and Future Directions

As outlined above, to our knowledge, this is a first attempt at developing a formal protocol for VGI vector data collection. The protocol addresses the collection of vector data from: manual vectorisation of image-based sources of geographic data; collection of field-survey data using devices such as GPS; and the importing or fusion of existing geographic data which is available as open geographic data. This protocol does not claim to address every issue in vector data collection for VGI. We have only touched the tip of the iceberg. There are other issues. Palen et al. [56] indicates in their work that OSM, as the largest VGI project, has had to make itself more accessible to a new array of users both mappers and data consumers. This new accessibility has been brought about by a focus both on the usability of OSM tools, legal questions around data usage, the distribution of the data and the working to attract and retain contributors. However, this is a new contribution to the knowledge in this area. We are not aware of any similar approaches for VGI at the present time. With appropriate protocols, training, and oversight, volunteers can collect data of quality equal to those collected by experts [57]. Development and outline of this first protocol is an important step. As authors such as Kremen et al. [58] suggest, protocols, once developed, can be continually monitored and refined resulting in improved data quality.
There are many opportunities for future work and continued research. As technology continues to develop on ubiquitous Internet, smart phones and smart devices, the Internet of Things, wearables, and so forth, there will be more and more opportunities and novel ways to collect, create and manage VGI. It will be necessary to treat the protocol as a living document because, as Vogt and Fischer (2014) [59] recommend, protocols should be monitored and updated as necessary ensuring the types of data quality checking and quality assurances in place are still valid. This work has proposed, described and explained the protocol, however as it has not yet been adopted by any VGI project thus a formal evaluation is still missing. Retrospectively, future work could study which is the degree of implementation of the protocol within one or more existing VGI projects and analyse the correlation between the adherence to the protocol and the overall VGI data quality or impact of quality issues. From an opposite perspective, in the future the protocol could be customized for specific case studies in VGI projects. This customisation could include writing separate and more detailed protocols for manual vectorisation, field surveys and bulk import. Additionally, this could include the extension of the protocol to including editing and updating of existing data in the project. Implementation of the protocol in dedicated data capturing software would facilitate more widespread adoption and realisation of its merits. The majority of the most popular contribution software in VGI has been developed by software developers and not necessarily influenced by other experts in the field. In this case, we can have a protocol developed by experts which is then implemented by software developers as this serves as a better collaborative utilisation of skills and resources.

Acknowledgments

The authors would like to acknowledge the support and contribution of EU COST Action TD1202 “Mapping and the Citizen Sensor” (http://www.citizensensor-cost.eu).

Author Contributions

All of the six authors were members of the EU COST Action TD1202. The initial working idea for this paper arose during a working group meeting in Vienna, Austria. While Peter Mooney is the lead author of this publication all of the six authors worked in equal measure on all aspects of the paper—the development of the idea and conceptual methodology, associated research, writing the paper and final production and revisions.

Conflicts of Interest

The authors declare no conflict of interest.

Appendix A. VGI Creation from Manual Vectorisation

Scenario: A VGI project named VGI4all is launched with the goal of collecting geographic data to create a base map of the entire world. The VGI4all project, the town named MyTown, and the users GeoX, GeoY, and GeoZ are fictitious.
Vector Data Required: Point, Line and Polygon.
Initialisation: GeoX is informed about the VGI4all project and decides to participate by collecting VGI data for his hometown MyTown. On his way to work, GeoX visits the project home page where he founds a lot of information about the goals, aims and needs of the project. As GeoX is not much of a scholar type, he prefers to listen to the available podcast and watch a video about best practices. He is informed of the available protocol for vector data collection. From the protocol, he learns that VGI4all data apart for visualization can be used for navigation, and as a result correct positioning of information related to access is very important e.g., the entrance of a building. Since he is not very familiar with GPS technology, he decides to use on-screen manual vectorisation from the web browser for his first try. He believes there is no need to familiarize with the device as he uses the mouse in everyday work with the computer. Because he has not previous experience with manual digitizing, he decides to experiment with the tutorial environment that implements the protocol. Following the basic steps, he is accustomed with the entire chain of processes and feels somehow confident to contribute his own data. He experiments by digitizing the school as a polygon, the highway axis as a line and the supermarket as a point. Looking at the collected data, he is not very satisfied by the quality of the position captured compared to the original image. He remembers that according to the protocol a traditional optical mouse is more efficient for on screen digitizing than the laptop touchpad and he decides to connect a mouse to his laptop. He repeats the data collection process achieving better results.
Self-Assessment/Quality Control: Before submitting the data, he revises the data to check that they are of suitable quality.
Data diffusion: When all the checks have been completed, data are uploaded to the VGI project server.
Final Check of the contribution: GeoX observes the data he has contributed in the online map. Looking at the data at a finer zoom level reveals inconsistencies with exiting entities such as neighbour buildings. He refers to the protocol where he discovers a predefined range of zoom levels appropriate for the specific thematic layers and objects. He sets the appropriate zoom level and edits the data in order to solve this problem and enhance data quality.
Feedback to the community: GeoX fills the feedback form about his experience and subscribes to the forum and the mailing list. At the end, he posts on Facebook and Twitter, in order to inform his followers he has left his mark in VGI4all. He talks about his experience to his friends and neighbours and encourages them to become VGI4all contributors in order to put MyTown on the map. He stresses the importance of the existence of a protocol in this VGI project that assured the quality of his contributions and provided him with easy step by step instructions. With a high self-esteem coming from the feeling that he has collected high quality data according to the protocol, GeoX becomes a devoted VGI4all contributor. Several days later, GeoX visits VGI4all again. He notices that another contributor has changed the school name to a false value and decides to correct the problem. He sends a message to the VGI4all administrator with a link to the Ministry of Education web page indicating the official name of the school and the administrator fixes the problem. In order to enhance attribute quality, he adds a comment to the protocol regarding the need to verify the attribute values with existing web resources such as government sites and to provide with relevant links for verification.

Appendix B. VGI Creation from Field Survey

Scenario: Through an open call, the citizens of MyTown are invited to map the tourism POIs located in a specific area using a specific app for Android and iOS devices. The website of MyTown administration lists the instructions to download and use the app. Citizens contributing with at least ten points correctly reported (in terms of position and attributes) will receive a free ticket for the main museum of MyTown.
Vector Data Required: Point.
Initialisation: GeoY wants to participate to MyTown’s project because he is an art lover and wants to get the free ticket for the museum. He owns a BlackBerry but he is new to mobile devices. First, he gives a careful look at the website to understand the project requirements and to familiarize with the app through both the screenshots and a useful demo video. Once he has a clear idea of the project specifications, he decides to use his wife’s Android smart phone because the app is not available for his BlackBerry. Then he downloads and initializes the app, which requires first to create an account by typing a username and a password. GeoY also verifies that all the required functions (writing text, taking pictures/videos, connecting to the Internet, and registering a position via the GPS) are available on the device and work properly.
GeoY starts to simulate the data collection process thanks to a special function of the app that allows reporting points without submitting them to the project’s server. After several experiments, he realizes that the entire process takes approximately between one and two minutes for each point to report, but a significant delay can occur due to the GPS signal being either absent or not sufficiently strong to achieve the precision required. However, he concludes that he is willing to join the project and that his wife’s Android smart phone is a suitable device to accomplish the required tasks.
Data Collection: During the weekend GeoY decides to spend half a day to perform the data collection. He brings the Android smart phone with him after taking care that the battery power is at its maximum, because he realized from the previous tests that using the GPS strongly influences the battery performance. He reaches the area of interest and starts looking for the suggested points. When he finds one, he goes through the questionnaire and takes a picture of the point. When asked for the position, according to the instructions he goes as close as possible to the point and then taps the smart phone screen to record the coordinates.
The app has been designed so that the whole data collection procedure can be performed offline. GeoY reports thirteen POIs by respecting the stated requirements. For instance, when reporting the position of a statue located on top of a private building (non-accessible by law), he records the coordinates of the closest possible point to the building.
Self-Assessment/Quality Control: Once back at home and before submitting the reports, GeoY can briefly check if they are of a suitable quality according to the protocol’s requirements. This is allowed by the app itself, which displays a preview of the points on top of satellite imagery and shows a summary of the recorded attributes when a point is tapped. Doing so, GeoY finds out that two of them are definitely not acceptable. The first has been placed by the GPS in an area that is quite far from the one where the tourism POIs are located; the second is discarded because the description of some textual attributes was not successfully saved and he cannot remember their contents.
Data diffusion: Once he has checked data quality, GeoY connects the Android device to his house’s Wi-Fi network and submits the eleven point reports which have been previously saved. The reports are now stored on MyTown’s project server with all their attributes.
Final Check of the contribution: Once submitted, GeoY’s reports are displayed on an online map which is publicly available on MyTown’s website. This map can be navigated and queried to access the reported data together with their attributes. GeoY can thus perform a final check of all his contributions. For just one of the POIs, he realizes that the description of an attribute can be actually improved: he can do it even at this stage by logging into the website (using the same credentials of the app) and changing the text under consideration.
Feedback to the community: After data collection and submission, GeoY feels much more involved in the project than he was at the beginning. Besides hoping to receive the free ticket for the museum (notification will be sent him once his contributions will be checked by MyTown administration staff), he feels he has done something really useful for MyTown and he concludes his participation to the initiative by: (1) spreading the word about the project, by sharing on social networks the Web page listing his personal contributions; and (2) giving a final feedback to the project’s community by suggesting few modifications that, according to his experience, can be good to introduce to improve the app. The latter is possible from the website through a specific text box, where citizens can also inform MyTown staff about possible issues encountered while collecting and managing data.

Appendix C. VGI Creation from Bulk Import

Scenario: In MyTown there is a mountaineering club. One year ago the club organized an event to record the local mountain paths using GPS. These paths are portrayed on a topographic map produced by the club, which is used for orientation by mountaineers.
Vector Data Required: Lines.
Initialisation: GeoZ thinks that it would be a good idea to contribute this data to VGI4all after persuading the mountaineering club members to support this donation and provide permission and license to reuse the data. GeoZ explores the data appearing on the mountaineering club map and believes it is compatible with VGI4all. By communication with the mountaineering club, he learns that there is a digital file with this data in ArcGIS geodatabase format. He knows the data are considered of good quality, because a professional surveyor has supervised the data collection, and thus they are suitable for VGI4all.
Data Collection: As GeoZ plans the data import into VGI4all, he realizes that it is a complicated technical process that he cannot implement. He asks help from the VGI4all community and sends them a scanned copy of the map. He also asks them if the community is interested in importing this data. VGI4all experts find the data useful and inform him that there is a coordinate system incompatibility, since map data are in UTM projection as stated in the marginalia. GeoZ connects to VGI4all home page and opens the best practices page based on the protocol referring to “Import bulk data”. He refreshes information about VGI4all CRS and realizes that WGS84 is used which is different from UTM. The process becomes too complicated and overpasses his abilities, so he decides to ask help from an experienced VGI4all user. After posting in the forum, he finds a more experienced contributor living in MyTown willing to help him. Before data import, preprocessing must take place which has three stages: changing projection from UTM to WGS84; adding an attribute named “type” and updating its value to “mountaineering path”; and finally saving data in a format that can be uploaded to VGI4all such as ESRI shapefile. After the appropriate processing, MyTown mountain paths are imported.
Self-Assessment/Quality Control: At a first look, the data seem of suitable quality and according to the project specifications. There are no impacts on existing data, as no other mountain paths existed in the VGI4all map.
Data diffusion: When all the checks according to the protocol have been completed, data are submitted to the VGI4all project server. In addition to this, all available metadata on original data collection and processing is submitted as well.
Final Check of the contribution: GeoZ notices that the paths position is compatible with VGI4all imagery.
Feedback to the community: GeoZ has enjoyed his experiences with VGI4all and he decides to become a regular contributor. At the end of the year he is in the TOP 100 list of the most valuable contributors.

References

  1. Goodchild, M.F. Citizens as sensors: The world of volunteered geography. GeoJournal 2007, 69, 211–221. [Google Scholar] [CrossRef]
  2. Spielman, S.E. Spatial collective intelligence? Credibility, accuracy, and volunteered geographic information. Cartogr. Geogr. Inf. Sci. 2014, 41, 115–124. [Google Scholar] [CrossRef] [PubMed]
  3. Stefanidis, A.; Crooks, A.; Radzikowski, J. Harvesting ambient geospatial information from social media feeds. GeoJournal 2013. [Google Scholar] [CrossRef]
  4. Spinsanti, L.; Ostermann, F. Automated geographic context analysis for volunteered information. Appl. Geogr. 2013. [Google Scholar] [CrossRef]
  5. Antoniou, V. User Generated Spatial Content: An Analysis of the Phenomenon and Its Challenges for Mapping Agencies. Ph.D. Thesis, University College London (UCL), London, UK, 2011. [Google Scholar]
  6. Arsanjani, J.J.; Zipf, A.; Mooney, P.; Helbich, M. An introduction to openstreetmap in geographic information science: Experiences, research, and applications. In OpenStreetMap in GIScience; Springer: Berlin, Germany, 2015; pp. 1–15. [Google Scholar]
  7. Ciepluch, B.; Jacob, R.; Mooney, P.; Winstanley, A. Comparison of the accuracy of OpenStreetMap for Ireland with Google maps and Bing maps. In Proceedings of the Ninth International Symposium on Spatial Accuracy Assessment in Natural Resources and Environmental Sciences, Leicester, UK, 20–23 July 2010.
  8. Ludwig, I.; Voss, A.; Krause-Traudes, M.A. Comparison of the street networks of Navteq and OSM in Germany. In Advancing Geoinformation Science for a Changing World; Geertman, S., Reinhardt, W., Toppen, F., Eds.; Springer: Berlin, Germany, 2011; pp. 65–84. [Google Scholar]
  9. Graser, A.; Straub, M.; Dragaschnig, M. Towards an open source analysis toolbox for street network comparison: Indicators, tools and results of a comparison of OSM and the official Austrian reference graph. Trans. GIS 2014. [Google Scholar] [CrossRef]
  10. Neis, P.; Zielstra, D. Recent developments and future trends in volunteered geographic information research: The case of OpenStreetMap. Future Int. 2014, 6, 76. [Google Scholar] [CrossRef] [Green Version]
  11. Sui, D. Volunteered geographic information: A tetradic analysis using McLuhan’s law of the media. In Proceedings of the Workshop on Volunteered Geographic Information, Santa Barbara, CA, USA, 13–14 December 2007.
  12. Johnson, P.A.; Sieber, R.E. Motivations driving government adoption of the Geoweb. GeoJournal 2012, 77, 667–680. [Google Scholar] [CrossRef]
  13. See, L.; Mooney, P.; Foody, G.; Bastin, L.; Comber, A.; Estima, J.; Fritz, S.; Kerle, N.; Jiang, B.; Laakso, M.; et al. Crowdsourcing, citizen science or volunteered geographic information? The current state of crowdsourced geographic information. ISPRS Int. J. Geo-Inf. 2016, 5, 55. [Google Scholar] [CrossRef]
  14. Ali, A.L.; Falomir, Z.; Schmid, F.; Freksa, C. Rule-guided human classification of Volunteered Geographic Information. ISPRS J. Photogramm. Remote Sens. 2016. [Google Scholar] [CrossRef]
  15. Vandecasteele, A.; Devillers, R. Improving volunteered geographic information quality using a tag recommender: The case of OpenStreetMap. In OpenStreetMap in GIScience: Experiences, Research, and Applications; Arsanjani, J.J., Zipf, A., Mooney, P., Helbich, M., Eds.; Springer: Berlin, Germany, 2016; pp. 59–80. [Google Scholar]
  16. Chan, K.S.; Godby, R.; Mestelman, S.; Andrew, M.R. Crowding-out voluntary contributions to public goods. J. Econ. Behav. Organ. 2002. [Google Scholar] [CrossRef]
  17. Haklay, M. How good is volunteered geographical information? A comparative study of OpenStreetMap and Ordnance Survey datasets. Environ. Plan. B Plan. Des. 2010. [Google Scholar] [CrossRef]
  18. Mooney, P.; Corcoran, P.; Winstanley, A.C. Towards quality metrics for OpenStreetMap. In Proceedings of the 18th SIGSPATIAL International Conference on Advances in Geographic Information Systems, San Jose, CA, USA, 2–5 November 2010.
  19. Fan, H.; Zipf, A.; Fu, Q.; Neis, P. Quality assessment for building footprints data on OpenStreetMap. Int. J. Geogr. Inf. Sci. 2014. [Google Scholar] [CrossRef]
  20. Brovelli, M.A.; Minghini, M.; Molinari, M.E.; Mooney, P. Towards an automated comparison of OpenStreetMap with authoritative road datasets. Trans. GIS 2016. [Google Scholar] [CrossRef]
  21. Senaratne, H.; Mobasheri, A.; Loai, A.A.; Capineri, C.; Haklay, M. A review of volunteered geographic information quality assessment methods. Int. J. Geogr. Inf. Sci. 2016. [Google Scholar] [CrossRef]
  22. Chrisman, N.R. Traitement de la qualité: Perspective historique [Quality Treatment: Historical perspective]. In Qualité de L’information Géographique; Devillers, R., Jeansoulin, R., Eds.; Lavoisier: Cachan, France, 2005; pp. 25–35. (In French) [Google Scholar]
  23. Ordnance Survey. OS MasterMap™ Real-World Object Catalogue. Available online: http://www.ordnancesurvey.Aco.uk/docs/legends/os-mastermap-real-world-object-catalogue.pdf (accessed on 11 September 2016).
  24. Regione Lombardia. Specifiche tecniche per la produzione dei database topografici locali [Technical Specifications for the Production of the Local Topographic Databases]. Available online: http://www.territorio.regione.lombardia.it/cs/Satellite?c=Redazionale_P&childpagename=DG_Territorio%2FDetail&cid=1213282350126&pagename=DG_TERRWrapper#1213283029180 (accessed on 11 September 2016).
  25. Institut national de l’information géographique et forestière (IGN). BDTOPO Version 2.1: Descriptif de contenu. Available online: http://professionnels.ign.fr/sites/default/files/DC_BDTOPO_2–1.pdf (accessed on 11 September 2016).
  26. Farkas, I. Key points and the most significant documents in the production of the High Resolution Vector Data (HRVD) within the Multinational Geospatial Co-production Program (MGCP). Acad. Appl. Res. Public Manag. Sci. 2009, 8, 141–149. [Google Scholar]
  27. Olteanu-Raimond, A.M.; Hart, G.; Foody, G.M.; Touya, G.; Kellenberger, T.; Demetriou, D. The scale of VGI in map production: A perspective of European National Mapping Agencies. Trans. GIS 2015. [Google Scholar] [CrossRef]
  28. Johnson, P.A.; Sieber, R.E. Situating the adoption of VGI by government. In Crowdsourcing Geographic Knowledge, 2nd ed.; Sui, D., Elwood, S., Goodchild, M., Eds.; Springer: Berlin, Germany, 2013; pp. 65–81. [Google Scholar]
  29. Pourabdollah, A.; Morley, J.; Feldman, S.; Jackson, M. Towards an authoritative OpenStreetMap: Conflating OSM and OS OpenData National Maps’ road network. ISPRS Int. J. Geo-Inf. 2013. [Google Scholar] [CrossRef]
  30. Gao, S.; Li, L.; Li, W.; Janowicz, K.; Zhang, Y. Constructing gazetteers from volunteered Big Geo-Data based on Hadoop. Comput. Environ. Urban Syst. 2014. [Google Scholar] [CrossRef]
  31. Touya, G.; Coupé, A.; Jollec, J.L.; Dorie, O.; Fuchs, F. Conflation optimized by least squares to maintain geographic shapes. ISPRS Int. J. Geo-Inf. 2013, 2, 621–644. [Google Scholar] [CrossRef]
  32. Bearden, M.J. The national map corps. The USGS’s volunteer geographic information program. In Proceedings of the Workshop on Volunteered Geographic Information, University of California, Santa Barbara, CA, USA, 13–14 December 2007.
  33. Bonney, R.; Cooper, C.B.; Dickinson, J.; Kelling, S.; Phillips, T.; Rosenberg, K.V.; Shirk, K.J. Citizen science: A developing tool for expanding science knowledge and scientific literacy. Bioscience 2009, 59, 977–984. [Google Scholar] [CrossRef]
  34. The Cornell Lab of Ornithology. “Toolkit Steps”. Available online: http://www.birds.cornell.edu/citscitoolkit/toolkit/steps (accessed on 11 September 2016).
  35. Pocock, M.J.O.; Chapman, D.S.; Sheppard, L.J.; Roy, H.E. Choosing and Using Citizen Science: A Guide to When and How to Use Citizen Science to Monitor Biodiversity and the Environment; Centre for Ecology & Hydrology: Wallingford, UK, 2014. [Google Scholar]
  36. Broadening Participation in Biological Monitoring: Guidelines for Scientists and Managers Institute for Culture and Ecology. Available online: http://www.fs.fed.us/pnw/pubs/pnw_gtr680.pdf (accessed on 11 September 2016).
  37. Spipoll: “UN PROGRAMME DE SCIENCES PARTICIPATIVES—A Survey of Insect Polinators in France”. Available online: http://www.spipoll.org/participer/un-programme-de-sciences-participatives (accessed on 16 November 2016). (In French)
  38. VIGIENature “Un reseau de citoyens qui fait avancer la science”. Available online: http://vigienature.mnhn.fr/page/protocole (accessed on 16 November 2016). (In French)
  39. Sauvagedemarue: “Sauvages de ma rue” Wilderness from my street. Available online: http://sauvagesdemarue.mnhn.fr/sites/sauvagesdemarue.fr/files/upload/Fiche%20protocole.pdf (accessed on 16 November 2016). (In French)
  40. Deguines, N.R.; de Flores, M.J.; Fontaine, C. The whereabouts of flower visitors: Contrasting land-use preferences revealed by a country-wide survey based on citizen science. PLoS ONE 2012. [Google Scholar] [CrossRef] [PubMed]
  41. Massey, S. Best Practices for Environmental Project Teams, 1st ed.; Elsevier: Amsterdam, The Netherland, 2011. [Google Scholar]
  42. Chapman, A.D.; Wieczorek, J. Guide to Best Practices for Georeferencing; Global Biodiversity Information Facility: Copenhagen, Denmark, 2006. [Google Scholar]
  43. Smith, G.F.; O’Donoghue, P.; Delaney, E. Best Practice Guidance for Habitat Survey and Mapping; Ireland’s Heritage Council: Kilkenny, Ireland, 2011. [Google Scholar]
  44. Ruas, A.; Plumejeaud, C.; Nahassia, L.; Grosso, E.; Olteanu-Raimond, A.M.; Costes, B.; Vouloir, M.C.; Motte, C. GéoPeuple: The creation and the analysis of topographic and demographic data over 200 years. In Cartography from Pole to Pole; Buchroithner, M., Prechtel, N., Burghardt, D., Eds.; Springer: Berlin, Germany, 2014; pp. 3–18. [Google Scholar]
  45. Perret, J.; Gribaudi, M.; Barthelemy, M. Roads and cities of 18th century France. Sci. Data 2015. [Google Scholar] [CrossRef] [PubMed]
  46. Schmidt, M.; Klettner, S.; Steinmann, R. Barriers for contributing to VGI projects. In Proceedings of the 26th International Cartographic Conference, Dresden, Germany, 25–30 August 2013.
  47. Mauè, P.; Schade, S. Quality of geographic information patchworks. In Proceedings of the 11th AGILE International Conference on Geographic Information Science, Girona, Spain, 5–8 May 2008.
  48. Corine Land Cover. The Corine Land Cover Map “An Inventory of Land Cover In 44 Classes, and Presented As a Cartographic Product, At A Scale of 1:100 000 for Europe”. Available online: http://www.eea.europa.eu/publications/COR0-landcover (accessed on 11 September 2016).
  49. Haklay, M.; Antoniou, V.; Basiouka, S.; Soden, R.; Mooney, P. Crowdsourced Geographic Information Use in Government; Report to GFDRR (World Bank); The World Bank: Washington, DC, USA, 2014. [Google Scholar]
  50. Touya, G.; Brando-Escobar, C. Detecting level-of-detail inconsistencies in Volunteered Geographic Information data sets. Cartogr. Int. J. Geogr. Inf. Geovis. 2013. [Google Scholar] [CrossRef]
  51. Beaulieu, A.; Begin, D.; Genest, D. Community mapping and government mapping: Potential collaboration? In Proceedings of the Symposium of ISPRS Commission I, Calgary, AB, Canada, 16–18 June 2010.
  52. Antoniou, V.; Schlieder, C. Participation patterns, VGI and gamification. In Proceedings of the 17th AGILE Conference on Geographic Information Science, Castellón, Spain, 3–6 June 2014.
  53. Haklay, M. Citizen science and volunteered geographic information—Overview and typology of participation. In Crowdsourcing Geographic Knowledge: Volunteered Geographic Information (VGI) in Theory and Practice; Sui, D.Z., Elwood, S., Goodchild, M.F., Eds.; Springer: Berlin, Germany, 2013; pp. 105–122. [Google Scholar]
  54. Campagna, M. The geographic turn in social media: Opportunities for spatial planning and Geodesign. Lect. Notes Comput. Sci. 2014, 8580, 598–610. [Google Scholar]
  55. Arnstein, S. A ladder of citizen participation. J. Am. Inst. Plan. 1969, 35, 216–224. [Google Scholar] [CrossRef]
  56. Palen, L.; Soden, R.; Anderson, T.J.; Barrenechea, M. Success & scale in a data-producing organization: The socio-technical evolution of OpenStreetMap in response to humanitarian events. In Proceedings of the 33rd Annual ACM Conference on Human Factors in Computing Systems (CHI ’15), New York, NY, USA, 18–23 April 2015.
  57. Bonney, R.; Shirk, J.L.; Phillips, T.B.; Wiggins, A.; Ballard, H.L.; Miller-Rushing, A.J.; Parrish, J.K. Next steps for citizen science. Science 2014, 343, 1436–1437. [Google Scholar] [CrossRef] [PubMed]
  58. Kremen, C.; Ullman, K.S.; Thorp, R.W. Evaluating the quality of citizen-scientist data on pollinator communities. Conserv. Biol. 2011. [Google Scholar] [CrossRef] [PubMed]
  59. Vogt, J.; Fischer, B. A protocol for citizen science monitoring of recently-planted urban trees. Cities Environ. 2014. [Google Scholar] [CrossRef]
Figure 1. Example of manual digitization from old maps within the GeoPeople project; from [44].
Ijgi 05 00217 g001
Figure 2. Sequence of the five main stages of the protocol for VGI vector data collection.
Ijgi 05 00217 g002
Figure 3. Interaction of the protocol for data collection with the actors involved in the context of a VGI project.
Ijgi 05 00217 g003
Table 1. Instructions to contributors on Level of detail/scale in relation to the data collection method.
Manual VectorisationField SurveyBulk Import
Use a predefined range of zoom levels recommended by the protocol for specific thematic layers and objects.- When possible, report or define the device survey sampling rate.
- Provide free text comments on the environmental conditions, weather, non-visibility of satellites, etc.
- Consider the level of detail and scale of the data and whether the data are appropriate for import into the VGI project.
- Generalisation may be applied prior to the import.
Table 2. Suited metadata in relation to the data collection method.
Manual VectorisationField SurveyBulk Import
- Information about the background layer or imagery source: resolution, date, etc.
- Information about the data capture process such as zoom level(s), scale, date/time of digitization, software/environment used, etc.
- Free text comments on the visual quality of the imagery such as cloud cover, tree cover, shadows, etc.
- Original CRS and transformation applied.
- Device details: GNNS device mark/model, smart phone mark/model.
- Software used.
- Timestamp/date of collection.
- Type of locomotion such as walking, going by car, etc.
- Free text report about the conditions encountered while sampling such as signal quality, weather, environmental etc.
- Upload of the DOP.
- Original CRS and transformation applied.
- Existing metadata about the data: date, CRS, scale, license, currency, etc.
- Additional metadata from both the structured and unstructured metadata (if available).
- Record of the import process such as software, schema transformation (ontologies, geometries, attributes), CRS transformation, etc.

