Abstract
To elucidate a realistic traffic assignment scenario, a multi-criterion decision system is essential. A traffic assignment model designed to simulate real-life situation may therefore utilize absolute and/or relative impedance. Ideally, the decision-making process should identify a set of traffic impedances (factors working against the smooth flow of traffic) along with pertinent parameters in order for the decision system to select the most optimal or the least-impeded route. In this study, we developed geospatial algorithms that consider multiple impedances. The impedances utilized in this study included, traffic patterns, capacity and congestion. The attributes of the decision-making process also prioritize multi-traffic scenarios by adopting first-in-first-out prioritization method. We also further subdivided classical impedance into either relative impedance or absolute impedance. The main advantage of this innovative multi-attribute, impedance-based trip assignment model is that it can be implemented in a manner of algebraic approach to utilize shortest path algorithm embedded in a Geographic Information Systems (GIS)—Graphical User Interface tool. Thus, the GIS package can therefore handle the multi-attribute impedance effectively. Furthermore, the method utilized in this paper displays flexibility and better adaptation to a multi-modal transportation system. Transportation, logistics, and random events, such as terrorism, can be easily analyzed with pertinent impedance.
1. Introduction
A traffic assignment model (TAM) employs various approaches in issues-of-scale with respect to modal transportation networks. Since transportation systems play an important role in the movement of goods and people, a TAM must be contextually and scientifically sound. User equilibrium invokes Wardrop’s first principle [1], which can be surmised as: In equilibria, there is no unilateral gain for a driver to reduce his/her travel costs by selecting another feasible route. This can be simply regarded as the journey-time equilibrium for route choice, where travel cost on routes selected are set as equal but less than on any unused route [1]. In a typical user equilibrium scenario, a user may choose the minimum cost route. However, since the user equilibrium can vary due to random perceptive components, such as user preference, experience, and time of travel, it is necessary to include other routes that may meet a set threshold. To account for this randomness, stochastic user equilibrium assignment can be utilized since it incorporates unilateral route changes. Under the stochastic user equilibrium assignment scenario, various assumptions can be stated: (a) users cannot reduce the travel cost by changing routes owing to limited available information at that particular instant; and (b) congestion can be adequately accounted for by using a delay function [2,3,4,5]. As such, stochastic user equilibrium becomes a fixed-point solution to the problem of selecting routes and travel times over a network. User choices are made according to a random utility model for a stochastic user equilibrium model, and link travel times are dependent on the link flows.
One of the traffic assignment models for a large-scale travel demand model is a path-based all-or-nothing (AON) assignment using Dijkstra’s shortest path algorithm [6]. The AON assignment allocates all vehicle trips to an origin and destination pair, which is the most feasible single route. There are advantages of this approach; the foremost is the anthropogenic-induced (social optimum) factor. Social optimum status (macroscopic characteristic) is commonly used for large-scale network transportation planning [7,8], where maximal profits can be derived at minimized risks. However, this is quite unlike for short-term trip estimation in the user equilibrium, which can indeed take into account travel-time dependency (microscopic characteristic) by considering both origin-destination flow and capacity [5]. An aggregated origin-destination flow can be disaggregated into individual trips to reflect travel-time dependency. The disaggregated trips would thereafter be assigned systematically to display an ideal route in stochastic user equilibrium. The drawback in this case would be the large number of links required to formulate contiguous links. Thus, most heuristic algorithms that would employ such an aggregation process in route assignment should not exceed a set of impedance thresholds especially on number of route links and their connectivity properties [9].
In light of existing traffic assignment models, the TAM does not feature pertinent link segment information, such as road closure, underlying or overarching ad hoc policy (e.g., converting a three-lane road to a two-lane road with a bicycle route), user route preference based on experience, and vehicular performance related factors (e.g., driving a fully-loaded truck uphill versus using a circuitous route), we are proposing a GIS-based traffic assignment model that can fully account for these factors and more in efficient ways without relying on transportation planning software on the shelf. Our basic principle is the use of impedance as the elemental guiding paradigm of the developed traffic assign model, which can easily be extended or integrated into any applied GIS network model with little extra efforts and costs. This would offer: (i) flexibility in vehicle routing; and (ii) easiness of incorporating an attribute data structure that would account for all impedance cases. The proposed modified all-or-nothing (MAON) assignment place several packets of a bundle of the vehicle trips to an origin and destination pair, which is the most feasible single route for each packet at a time.
The major objectives of this study are to develop a multi-attribute and impedance-based traffic assignment model for transportation planners and travel demand analysts. We then applied the proposed traffic assignment model to simulate an urban traffic scenario incorporating six major impedance attributes.
2. Literature Review
Selecting a route process typically involves minimizing travel distance, especially under the assumption that transportation cost (also referred to as disutility) is significantly affected by travel distance. Janic showed that a complete logistical cost should entail an economic distance [10]. An economic distance is the distance a commodity may travel before transport costs exceed the value of freight. A traffic assignment model involving a travel distance minimization problem include Beyer’s line weight means (LWM) [11]. Dijkstra’s shortest path algorithm is easily utilized in LWM as a means of determining a route with the least impedance. The disadvantages of utilizing LWM include: (i) the fact that only single-modal networks can be modeled; (ii) segment gaps may be inadvertently included in the route selected; and (iii) total impedance can be too small to interpret for very short segments. Nevertheless, LWM is still useful in the long-range transportation planning, especially in comparing economic distances between newer routes with other alternative routes.
Operational disutility measures, such as, travel time, congestion, and operating speed, have been used to gauge impedance [12]. Most studies use travel time as the dominant impedance factor. It has been postulated that viable future simulation approaches would require including faster travel time paths and segments with increased travel speed as path alternatives [13,14,15,16].
Nesterov and de Palma’s approach constrained the flow capacity on a single link for simulating congestion by considering volume and capacity [17]. The rationale of their approach stemmed from setting both demand and capacity constraints over a finite time frame [18]. The traffic reassignment, in such a scenario, consists of two processes: (a) deducting the traffic flow leaving the congested segment from a prior time, which we can term as an apriori condition; and (b) adding the traffic entering the congested segment during a current period as a posteriori condition [19]. In this way, a sequence of trips assigned was designed by a first-in first-out (FIFO) queuing algorithm. The FIFO rule within the algorithm is required for multiple realistic origin-destination assignments [20,21]. This FIFO rule can also be applied to this study in order to a similar approach to a dynamic stochastic user equilibrium-based traffic assignment model by disaggregating the selected routes into multiple routes using a random-order sequence over a specified period.
Geographic information systems (GIS) can configure solutions for re-routing problems, for example, in real-time emergency vehicle routing when a user has to consider physical dynamics (e.g., one way roads, traffic, and road maintenance) and inherent uncertainty (e.g., parade routes, pedestrian traffic, etc.). The classical GIS approach is to set single impedance and then aggregate all the segments that meet the impedance condition. To implement sophisticated network analyses and incorporate geospatial information, finer levels of impedances that may vary from segment to segment are required. For instance, Kwan and Ransberger applied segment-level impedance designated to model where impasses were most likely to exist [22]. They also noted that dealing with a degree of uncertainty was cumbersome, especially when factors like debris on road segments after storms impede travel on the roads. To account for multiples factors impeding travel, multi-criteria decision-making process have been utilized in operations research in general [23,24].
Grossardt et al. [23] used an analytical hierarchy process in transport. Chen et al. [24] used an analytic minimum impedance surface (AMIS) model on contiguous surfaces for identifying route choice based on input from a user. The analytical hierarchy process can also be extended to include a compensatory multi-criteria decision method and include risk analysis [25].
In précis, a comprehensive study addressing a multi-attribute impedance approach with a first-in first-out rule within thresholds of the packet size has never been undertaken. We believe that this is the first algorithm that does quantify, annotate and provide a visual output of traffic assignment model that addresses: volume/capacity ratio, driving hazard conditions (flooded sections), bridge closures, general road repair/construction, right-of-way, road classification (unpaved or otherwise) together. The model proposed in this study is smiliar to a dynamic traffic assignment model, which can be utilized for a state and regional long-range transportation planning. The model used for this study disaggregates the period into smaller time intervals, such as, weekly or monthly.
3. Model Development
3.1. Approach
A network dataset consists of nodes and links. Nodes represent: (i) locations; (ii) terminating nodes; and (iii) centroids of areas Links are road segments with directions and capacity. Each link is connected by two nodes (a starting node and an ending node) with the end node serving as the starting node for the next contiguous link. Each segment contains associated generalized costs such as distance and travel time. A route is a set of segments connected from origin to destination through multiple segments and have impedance inevitably. The impedance is a sum of generalized costs from the segments, which belong to the route. For example, if a generalized cost of the segments is travel time, the impedance of the route is travel time, and the best route is the quickest route. A detour, with the least impedance value, might be selected when one of the segments of the route increases the generalized cost abruptly. A trip can be defined as the journey between an origin and destination through a route. An origin and destination pair may likewise include node information representing centroids of areas and points.
Secondarily, selected routes generate a dataset of impedance depending on geographic locations, types of movement, transport modes, and time windows. The aim in such an optimized system is minimizing the impedance resulting from temporal and spatial gaps. The impedance is sourced from transportation infrastructure, weather, policies and regulations, vehicles, commodities, and drivers. The impedance on a logical transportation networks appears onto nodal and link components, as modified from Gutiérrez and Urbano [26]:
where Zp = impedance (i.e., total generalized costs of links) of a path p; Zs = generalized cost of link s along the feasible path p; Zn = generalized cost of a node n along the feasible path p.
If an activity reaches adjacent nodes, the connected segments become alternative segments of a route, that is, p = (S, N), of which movement from origin to destination through a set of links can be represented by S(i, j). S is a set of links, and N is a set of nodes including i and j. Node i is the tail node (start node), and node j is the head node (end node).
3.2. Components
We expanded Arnold et al.’s [27] “open” or “closed” electric circuit concept for assessing disconnection and connection from a tail node i to a head node j. When goods and people travel from node i to j via contiguous segments, the status of the connecting segment is expressed by a Boolean variable Xs = 1, which implies that the segment s is traversable due to its high traversability (i.e., low impedance (In electronics, zero means that an electric circuit is open, so electrical current cannot flow: The analogy in transportation implies that a road is closed due to a high impedance value)). In this study, absolute traversability, X, is binary values, which represent the maximum traversable value of 1 and the minimum traversable value of 0. We define that the reverse concept of traversability is impedance by using absolute complements, which is denoted by I. For example, if impedance is high, the traversability is low and vice versa. In other words, high absolute impedance on a link (Is), in this study, was defined as the low absolute traversability on the link (Xs).
Examples of absolute traversability on a link (Xs) included increasing number of lanes and fair weather conditions. Absolute traversability on a node (Xn) is found from a normal condition of a bridge. On the contrary, one way highway can improve a traffic flow for forward direction, but prevent contraflow (Table 1). In the same way, bad weather condition impedes travel along a road segment. Examples of node impedance can be found from bridges, terminals, and border crossings. A bridge is either opened or closed. Examples of absolute impedance on a link (Is) were attributed to one-way streets for Cases 5–8 and inclement weather for Cases 2, 4, 6, and 8 (Table 1). Similarly, absolute impedance on a node (IN) can take the form of an additional impediment, such as presence of transshipment between two modes and park-and-ride facilities. Impedance was adapted as a unitless value that is normalized, resulting in a relative impedance value weighted by segment length. The nodes should be transformed into dummy segments with generalized, virtual costs in GIS, so the points are converted into line shapefiles. For that reason, this study considers the nodes as segments for the rest of this paper.
Absolute traversability Xs was simplified by an AND logic representing logical conjunctions (Table 1). To be traversable through a AND logic, all attributes (k) should provide traversability. Xsk represents generalized cost of an attribute k on a segment s. If a factor k impedes travel, the segment s is declared untraversable (non-traversable). When the impedance is extremely high on a segment s due to one or more of k attributes as absolute barrier, the segment can become untraversable (non-traversable), for example, when Xs = 0 in the relation:
In this way, the AND logic will contain eight combinations (i.e., 23) in total (Table 2). From Equation (2) and Table 1, if at least one of the three attributes of a segment (Xs,k={1,2,3}) shows un-traversability, the segment s (Xs) would be untraversable.

Table 1.
Examples of AND logic on absolute impedance values of a segment s.
| Case | One-Way (Xsk = 1) | Bridge (Xsk = 2) | Weather (Xsk = 3) | Traversability | Impedance | ||
|---|---|---|---|---|---|---|---|
| AND (Xsk) | Absolute Traversability (Xs) | 1-AND (Xsk) | Absolute Impedance (Is) | ||||
| Case 1 | 1 | 1 | 1 | 1 | Traversable | 0 | No Impedance |
| Case 2 | 1 | 1 | 0 | 0 | Untraversable | 1 | Very High |
| Case 3 | 1 | 0 | 1 | 0 | Untraversable | 1 | Very High |
| Case 4 | 1 | 0 | 0 | 0 | Untraversable | 1 | Very High |
| Case 5 | 0 | 1 | 1 | 0 | Untraversable | 1 | Very High |
| Case 6 | 0 | 1 | 0 | 0 | Untraversable | 1 | Very High |
| Case 7 | 0 | 0 | 1 | 0 | Untraversable | 1 | Very High |
| Case 8 | 0 | 0 | 0 | 0 | Untraversable | 1 | Very High |
Table 2.
Determining relative impedance value of a segment s.
| Case | One-Way (Rsk = 1) | Bridge (Rsk = 2) | Weather (Rsk = 3) | Traversability | Impedance | ||
|---|---|---|---|---|---|---|---|
| Relative Traversability P(Rs) | Relative Impedance (Is) | ||||||
| Case 1 | 1 | 1 | 1 | 1 | Traversable | 0 | Very Low |
| Case 2 | 1 | 1 | P(Rs,k=3) | P(Rs,k=3) | Most Likely | 1 − P(Rs,k=3) | Low |
| Case 3 | 1 | P(Rs,k=2) | 1 | P(Rs,k=2) | Most Likely | 1 − P(Rs,k=2) | Low |
| Case 4 | 1 | P(Rs,k=2) | P(Rs,k=3) | P(Rs,k=2) × P(Rs,k=3) | Likely | 1 − P(Rs,k=2) × P(Rs,k=3) | High |
| Case 5 | P(Rs,k=1) | 1 | 1 | P(Rs,k=1) | Most Likely | 1 − P(Rs,k=1) | Low |
| Case 6 | P(Rs,k=1) | 1 | P(Rs,k=3) | P(Rs,k=1) × P(Rs,k=3) | Likely | 1 − P(Rs,k=1) × P(Rs,k=3) | High |
| Case 7 | P(Rs,k=1) | P(Rs,k=2) | 1 | P(Rs,k=1) × P(Rs,k=2) | Likely | 1 − P(Rs,k=1) × P(Rs,k=2) | High |
| Case 8 | P(Rs,k=1) | P(Rs,k=2) | P(Rs,k=3) | P(Rs,k=1) × P(Rs,k=2) × P(Rs,k=3) | Rarely Likely | 1 − P(Rs,k=1) × P(Rs,k=2) × P(Rs,k=3) | Very High |
Note: The possibility value of traversability Rsk lies between 0 and 1, that is, P(Rsk) = [0,1].
Some segments of a selected path can be classified as “weak segments” using a degree of traversability value, P(Rs), defined by the distribution [0,1] such that P(Rs) = [0,1]. This algebraically means that it is relatively traversable, due to a weak link, which has a value of relative traversability within the range of (0 < P(Rs) < 1) [28,29]. The relative traversability on a link [P(Rs)] is the product of all associated traversability factors. By using this, an assignment process can be akin to road users opting to avoid traveling on a rough section of a route by choosing to go through a construction zone where they may be delayed further. Relative traversability also describes the ease of access to traversable routes [30,31]. Three attributes will generate eight combinations (i.e., 23) in total (Table 2). Relative traversability of a segment can therefore be obtained from:
where is the product of all P(Rsk), with k independent attributes of a segment s. P(Rsk) represents relative traversability caused by an attribute k on a segment s, and P(Rnk) represents relative traversability caused by an attribute k on a node n (Table 2). The nodes are converted into lines in GIS, so the notations of the node n will be interchangeable with the notation of segment s. Because of the heterogeneous length of the segments, this study adopts weighted distance relative (WDR) impedance to reevaluate relative impedance (I) given by WDRs = ds × (1 − P(Rs)), where P(Rs) is relative traversability, and ds is the length of segment s (e.g., [16]). By doing so, the sensitivity of the impedance of a segment increases to a traffic assignment model. The total impedance for a path P (i.e., Zp) takes into account the total WDR for a route, that is, , when the selected and preferred segments are integral to the path. Each component in Table 2 has a possibility value between 0 and 1. Once the length of a segment is applied to the route impedance, the Zp is unitless. The output will also contain eight (23) possible combinations in total. Among them, only one case (Case 1) is absolutely traversable. Other combinations can be determined based on a most likelihood case.
4. Case Study
The study area lies within the Fargo-Moorhead metropolitan area including the city of Prairie Rose. These cities were significantly affected by the spring flood of the Red River in March 2009 and March 2010. Several bridges were flooded, some were closed, and some had flood warning signs. Some regions along the Red River were placed under a flood watch. Two major interstate highways, I-29 and I-94, run perpendicular to each other. There is also a toll bridge between Fargo and Moorhead. During these floods, congestion was observed in routes that are usually passable year round. Some bridges on both sides of the river were partially submerged. In addition to areas close to the river, some lower regions were flooded by storm water, causing road lane closures.
4.1. System Optimum
For the first scenario, we assumed significant Red River flooding within flood-prone areas of Fargo-Moorhead. A variety of impedance attributes were set as travel retardants between the cities. If a journey has to follow rerouted trip, then the most likely path would be selected by the algorithm. A portion of the algorithm adopts Dijkstra’s shortest path to minimize the total impedance from origin to destination only if a user were to select this as the most important criteria. To assign all trips to the feasible paths, the algorithm iterates through the path selection process at least P times, where P indicates the number of paths Equation (4). The number of iterations was estimated by optimizing the function:
If the number of trips and road capacity was unlimited, the algorithm needed only to run once to determine the preferable path based on an AON assignment.
4.2. Key Attributes
Let us suppose that travelers care about six major attributes namely: (a) volume/capacity (V/C) ratio; (b) hazards; (c) bridge operation; (d) construction; (e) right-of-way; and (f) road classification (Figure 1). Each attribute may include multiple levels, with unique possibility values ranging between 0 (high impedance) to 1 (no impedance). We can also safely assume: (i) non-compensatory methods (e.g., [25], pp. 621–680), which do not permit trade-offs between attributes; and (ii) also that the possibility produced by the attribute’s levels follows a linear function. For simplification and ease of coding in GIS, we can also likewise assume that the volume capacity ratio follows a linear function (Figure 1a). As an example; if flood information is not available on a road segment and/or a bridge, the hazard possibility is set to 1, whereas the impedance within flooded segments is set to 0 (Figure 1b). Depending on the flood level, a bridge can be closed for safety concerns and algorithmically the segment could be set with a value of 0 indicating high impedance.
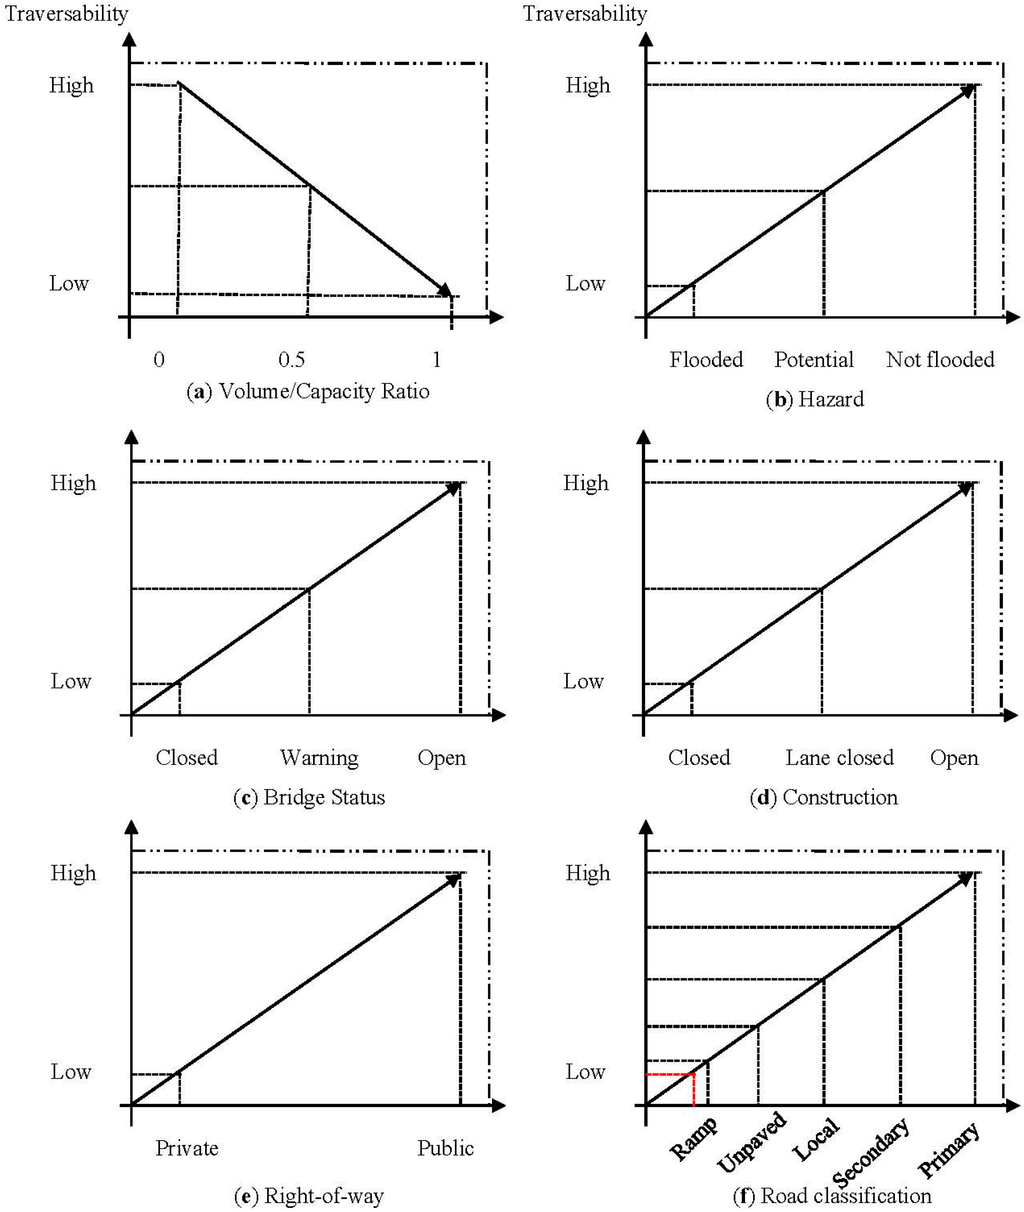
Figure 1.
Levels of attributes and traversability. (a) Volume/capacity ratio; (b) hazard; (c) bridge status; (d) construction; (e) right-of-way; (f) road classification.
Figure 1.
Levels of attributes and traversability. (a) Volume/capacity ratio; (b) hazard; (c) bridge status; (d) construction; (e) right-of-way; (f) road classification.
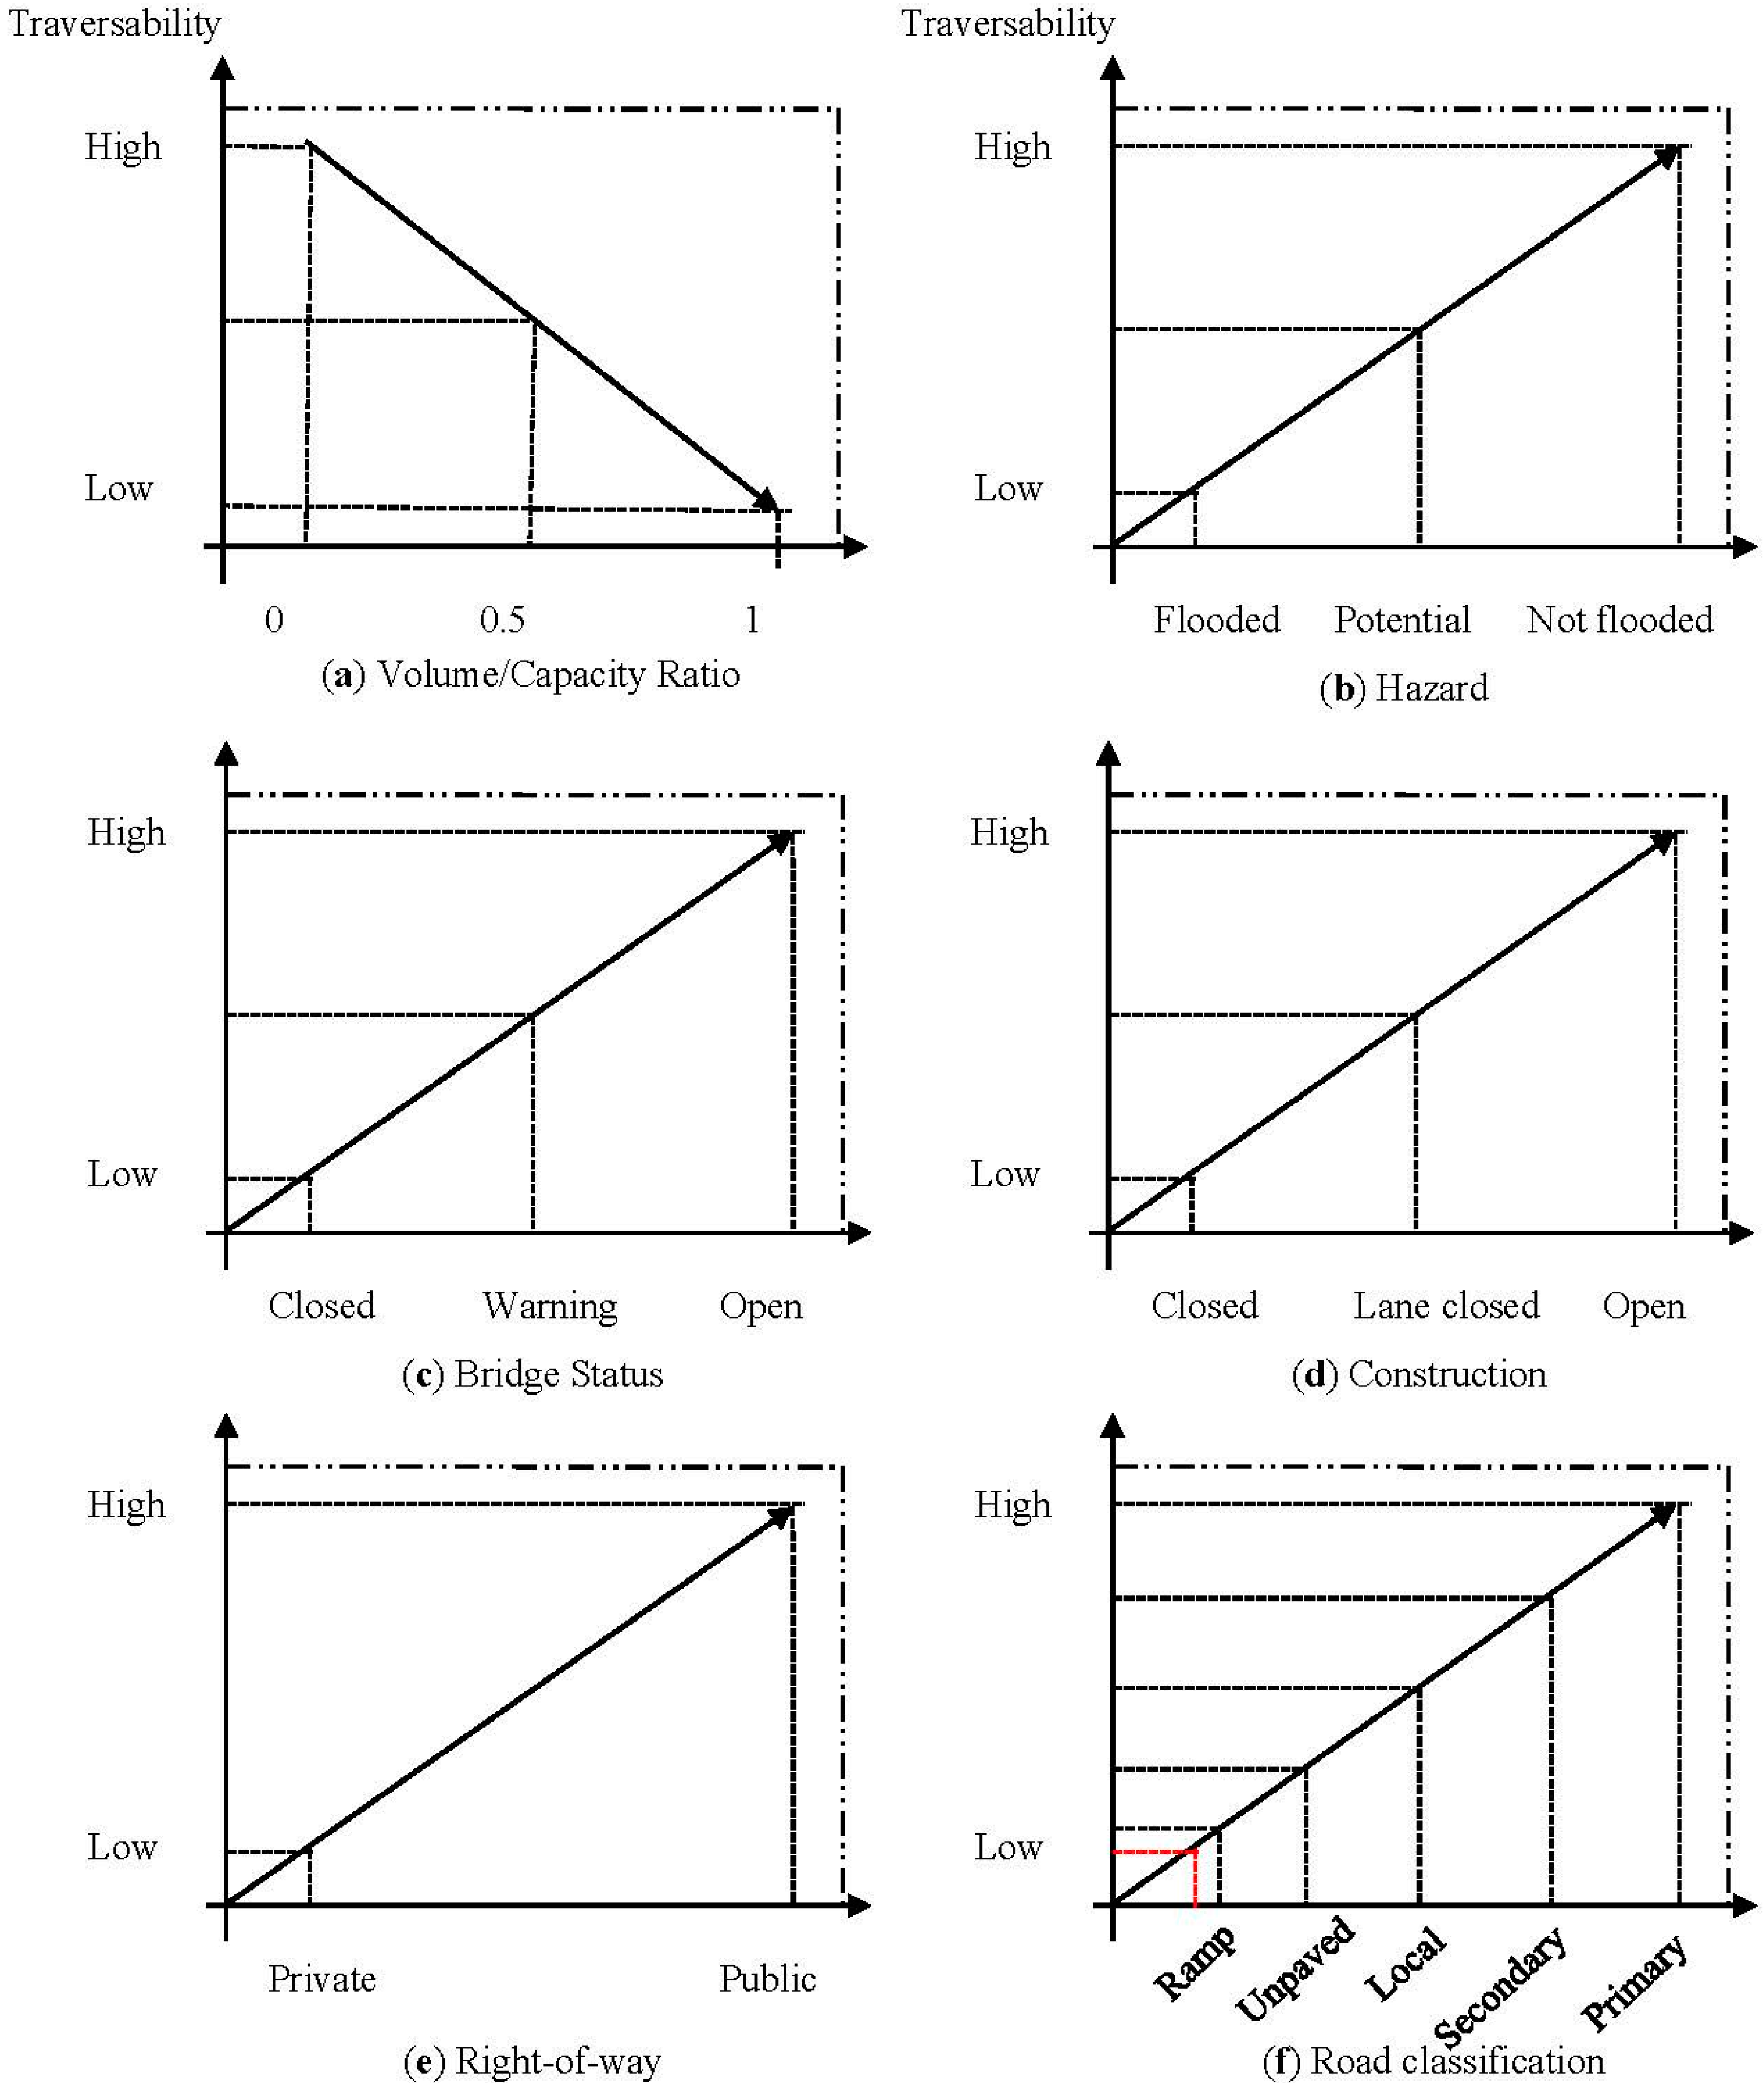
As an event level increases, a traveler will be aptly warned (Figure 1c). In urban settings, some roads may be closed due to road construction and therefore a high impedance value of 0 can be generated. If the road segment has multiple lanes, a partial lane or one or more lanes may be closed, limiting traffic to a narrow single lane (Figure 1d), an impedance value of 0.5 can be set based on the linearity assumption. In our approach, utilizing TIGER® (Topologically Integrated Geographic Encoding and Referencing) files, we segregated private from public roads. We set private road impedance at a high value (Figure 1e). TIGER® road files provide several road classifications, for example ramp, unpaved, local, secondary, and primary. We set impedance values as: 0.2 for ramp, 0.4 for unpaved, 0.6 for local, 0.8 for secondary roads, and no impedance for primary roads (Figure 1f).
4.3. Scenario Analyses
In the output tables, each route contains a unique route identifier representing a trip. The travel time (in hours) and the distance (in miles) were determined from the selected least impedance route. Attributes of the network dataset included the relative and absolute impedance values calculated for each segment using Equations (2) and (3), respectively.
- Scenario 1 (modified all-or-nothing (MAON) and trip set less than or equal to capacity): The first scenario shows capacity constraint with a MAON assignment for a trip set between origin and destination (Scenario 1 in Table 3). The number of trips was maximized at 900, a value lower than the average segment capacity specified, that is, 1060.
Table 3. Input information for Scenarios 1–5.
Table 3. Input information for Scenarios 1–5. Origin Destination Trips (Packet Size) Town FIPS Town FIPS Scenario 1 Scenario 2 Scenario 3 Scenario 4 Scenario 5 Prairie Rose 64,320 Moorhead 43,864 900 1350 450 450 225 Prairie Rose 64,320 Moorhead 43,864 450 450 225 Prairie Rose 64,320 Moorhead 43,864 N/A 450 225 Prairie Rose 64,320 Moorhead 43,864 225 Prairie Rose 64,320 Moorhead 43,864 225 Prairie Rose 64,320 Moorhead 43,864 225 Prairie Rose 64,320 Fargo 25,700 900 1350 450 450 225 Prairie Rose 64,320 Fargo 25,700 450 450 225 Prairie Rose 64,320 Fargo 25,700 N/A 450 225 Prairie Rose 64,320 Fargo 25,700 225 Prairie Rose 64,320 Fargo 25,700 225 Prairie Rose 64,320 Fargo 25,700 225 Note: Place FIPS 64,320 is for Prairie Rose, ND, Place FIPS 43,864 for Moorhead, MN, and Place FIPS 25,700 for Fargo, ND. - Scenario 2 (MAON and trip set larger than capacity): The second scenario involves a number of trips exceeding segment capacity. This was to demonstrate the route selection process under a limited set capacity.
- Scenario 3 (multiple trip sets when trip set is less than or equal to capacity): The third scenario has half the number of trips as in Scenario 1. It is also worthwhile to note that congestion effect is not easily discernible from Scenario 1.
- Scenario 4 (congestion effect and multiple trip sets): In this scenario, newer routes were selected between Prairie Rose and Moorhead. Scenario 4 is an extension of Scenarios 2 and 3, that is, using half of the trip set size from Scenario 2 to demonstrate congestion effect. The number of trips in the trip set was fewer than that from Scenario 2, although the total number of trips remained the same. We can deduce that for the OD pair, a distinct route will be selected independent of previously selected routes because of congestion and capacity limits.
- Scenario 5 (multiple trip sets coupled with random order of the trip sets): Randomly sequenced OD pairs were used to remove any sequence bias (Table 3). A trip set was sub-divided into two trip sets from Scenario 4. Scenario 5 illustrates the effect of a smaller trip set size. Scenario 5 also shows the relationship between impedance and miles generated since the distance information was an integral component of impedance.
5. Results and Implications
5.1. Effects of Capacity
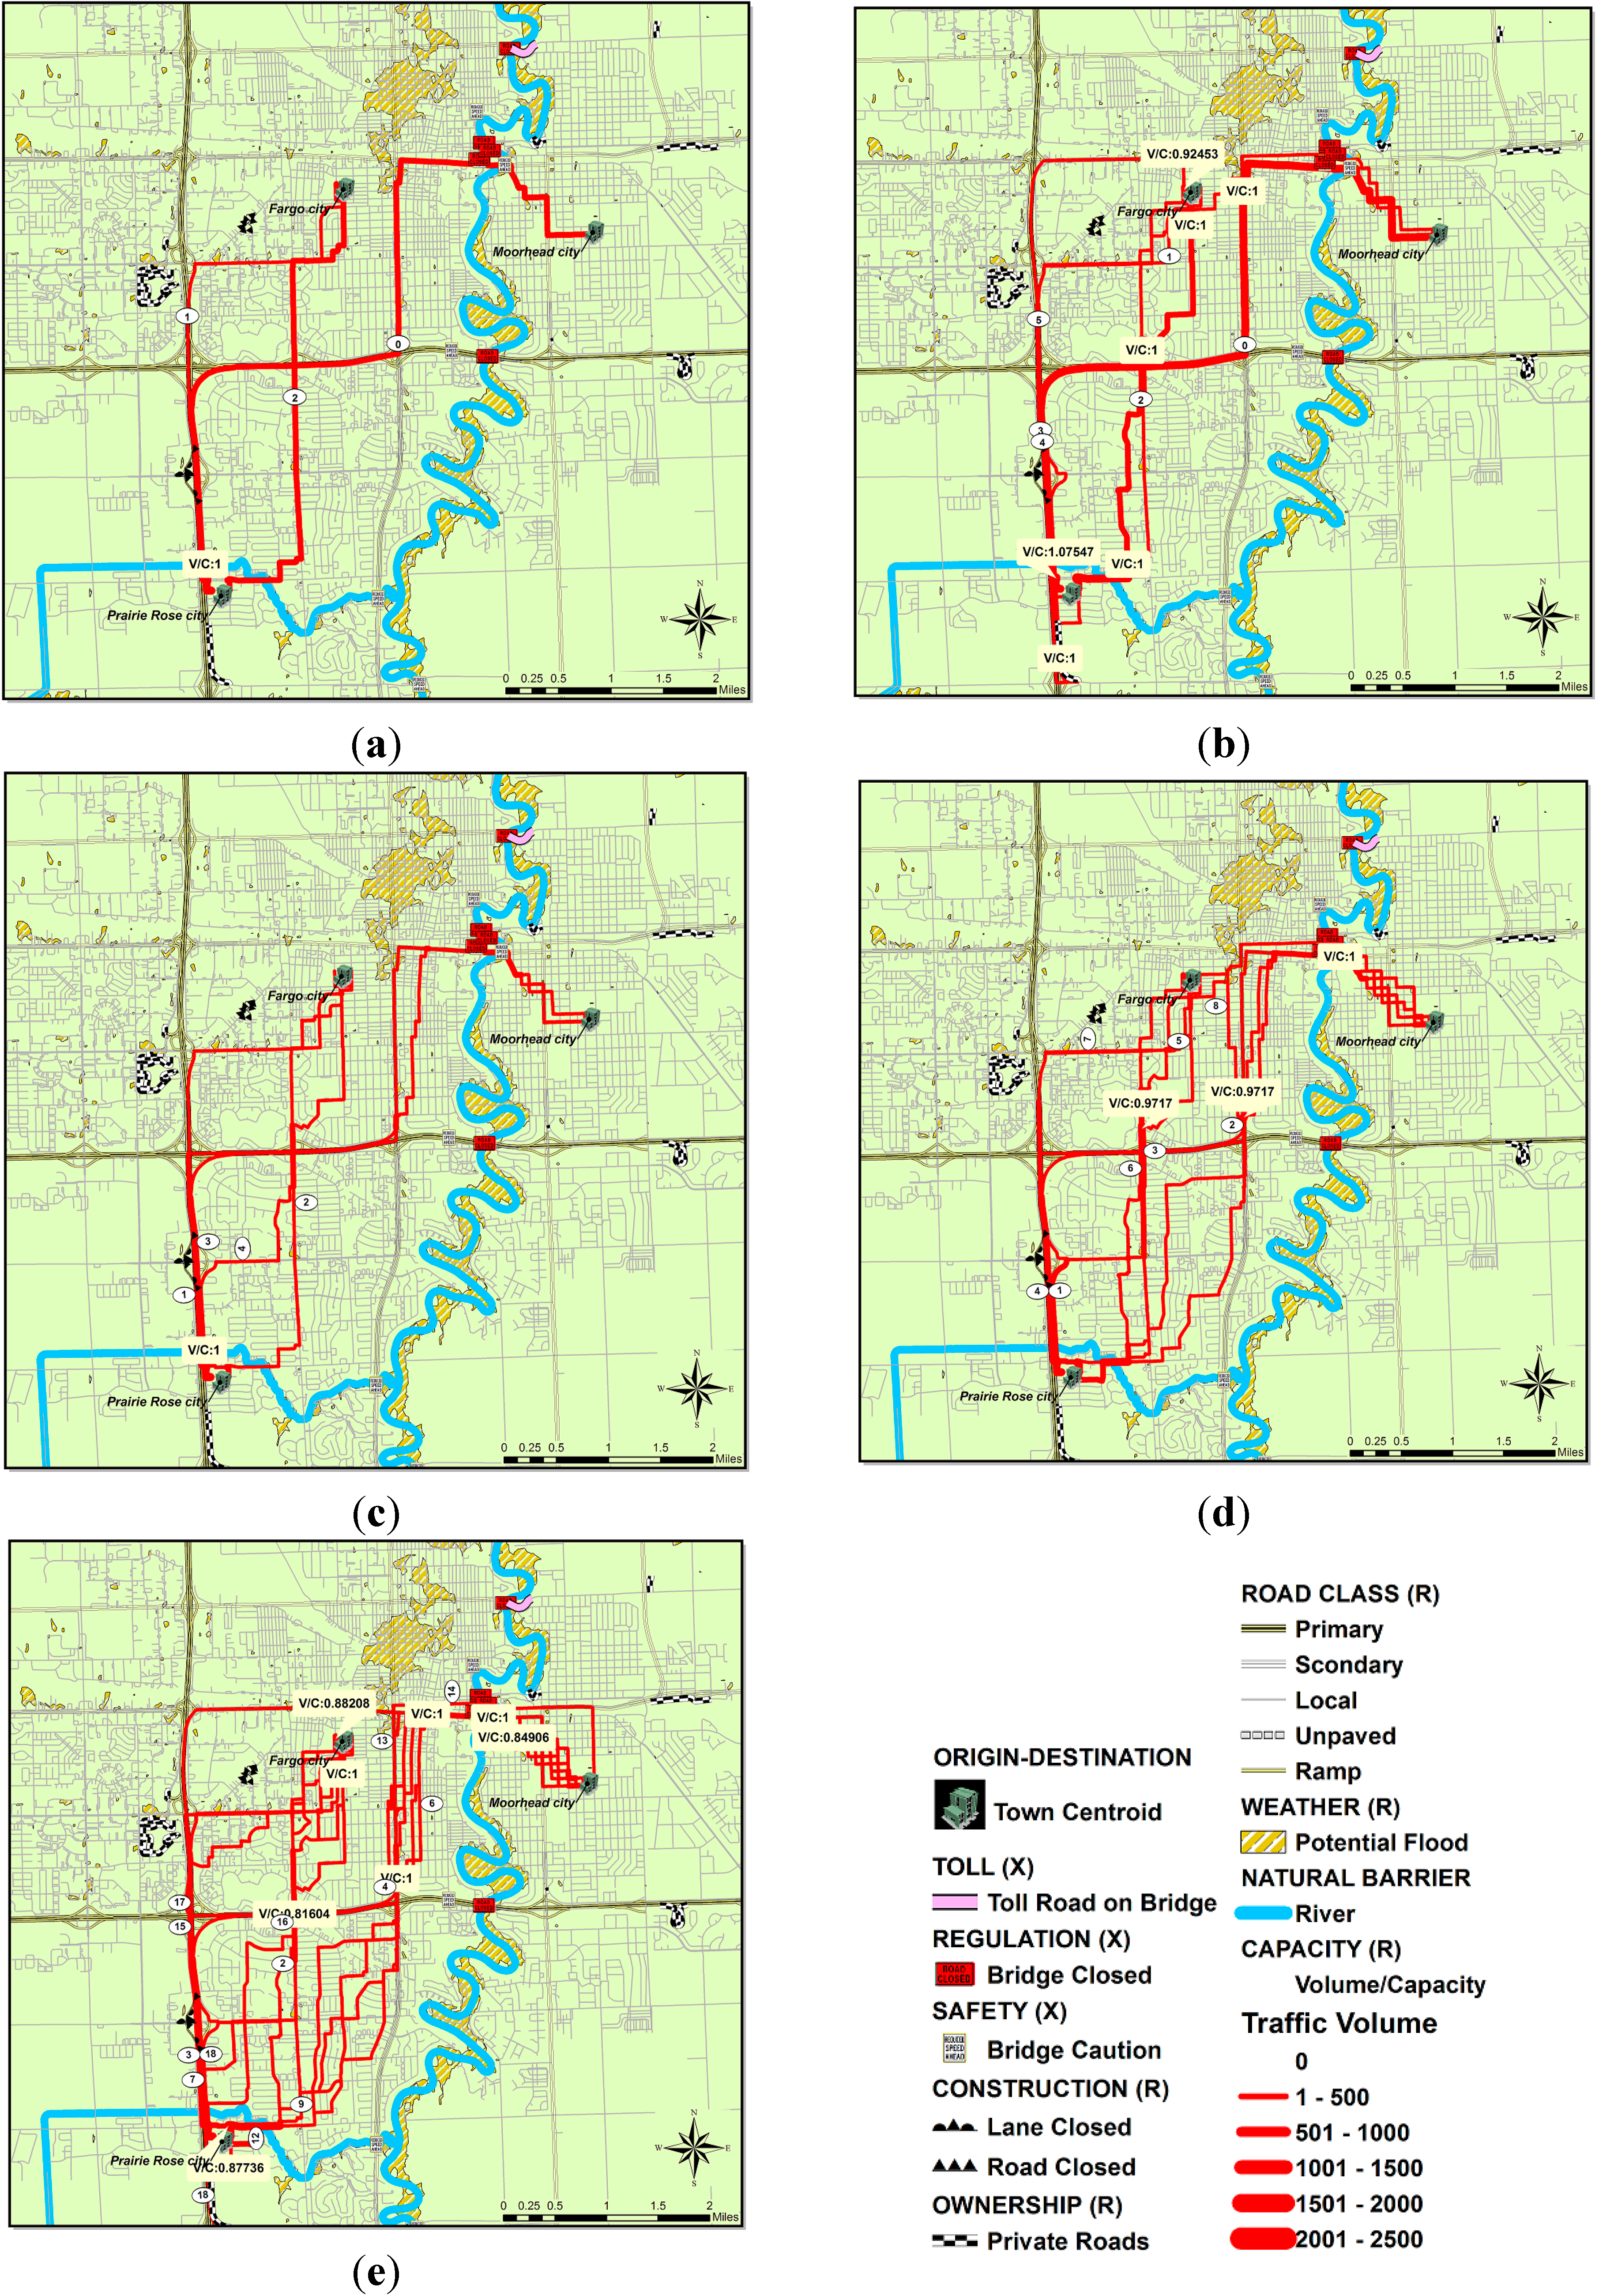
In Scenario 1, the sequence of IDs (i.e., identifications of paths) indicates the order of the best routes based on the lowest impedance values for each pair (Table 4 and Figure 2a). The ID 0 is assigned for a trip set of 900 trips. The corresponding route length is also shown in the output table. Note that the travelled miles do not necessarily represent the shortest route distances. A packet of trip between Prairie Rose and Fargo was split into smaller size of trip packets due to a capacity of the path ID 1.
Table 4.
Output results from Scenarios 1–5.
| Scenario | ID | Origin | Destination | Trips | Impedance | Hour * | Miles ** |
|---|---|---|---|---|---|---|---|
| 1 | 0 | Prairie Rose | Moorhead | 900 | 9.93 | 0.17 | 8.28 |
| 1 | Prairie Rose | Fargo | 160 | 6.24 | 0.14 | 5.39 | |
| 2 | Prairie Rose | Fargo | 740 | 6.40 | 0.16 | 5.10 | |
| Average | 600 | 7.52 | 0.16 | 6.26 | |||
| 2 | 0 | Prairie Rose | Moorhead | 1060 | 9.93 | 0.17 | 8.28 |
| 1 | Prairie Rose | Moorhead | 290 | 10.92 | 0.25 | 8.35 | |
| 2 | Prairie Rose | Fargo | 770 | 6.76 | 0.16 | 5.18 | |
| 3 | Prairie Rose | Fargo | 290 | 9.21 | 0.20 | 7.57 | |
| 4 | Prairie Rose | Fargo | 210 | 9.72 | 0.19 | 7.51 | |
| 5 | Prairie Rose | Fargo | 80 | 10,006.69 | 0.15 | 6.27 | |
| Average | 450 | 1675.54 | 0.187 | 7.19 | |||
| 3 | 0 | Prairie Rose | Moorhead | 450 | 9.93 | 0.17 | 8.28 |
| 1 | Prairie Rose | Moorhead | 450 | 10.35 | 0.19 | 8.38 | |
| 2 | Prairie Rose | Fargo | 450 | 6.31 | 0.16 | 5.06 | |
| 3 | Prairie Rose | Fargo | 160 | 6.72 | 0.14 | 5.41 | |
| 4 | Prairie Rose | Fargo | 290 | 7.00 | 0.17 | 5.43 | |
| Average | 360 | 8.06 | 0.17 | 6.51 | |||
| 4 | 0 | Prairie Rose | Moorhead | 450 | 9.93 | 0.17 | 8.28 |
| 1 | Prairie Rose | Moorhead | 450 | 10.35 | 0.19 | 8.38 | |
| 2 | Prairie Rose | Moorhead | 160 | 10.75 | 0.22 | 7.98 | |
| 3 | Prairie Rose | Moorhead | 290 | 11.10 | 0.25 | 8.36 | |
| 4 | Prairie Rose | Fargo | 160 | 6.65 | 0.14 | 5.38 | |
| 5 | Prairie Rose | Fargo | 290 | 6.90 | 0.17 | 5.40 | |
| 6 | Prairie Rose | Fargo | 450 | 7.29 | 0.17 | 5.32 | |
| 7 | Prairie Rose | Fargo | 320 | 7.34 | 0.17 | 5.58 | |
| 8 | Prairie Rose | Fargo | 130 | 7.76 | 0.18 | 5.94 | |
| Average | 300 | 8.67 | 0.18 | 6.74 | |||
| 5 | 0 | Prairie Rose | Moorhead | 225 | 9.93 | 0.17 | 8.28 |
| 1 | Prairie Rose | Fargo | 225 | 6.14 | 0.14 | 5.39 | |
| 2 | Prairie Rose | Moorhead | 225 | 10.34 | 0.23 | 8.00 | |
| 3 | Prairie Rose | Fargo | 225 | 6.50 | 0.13 | 5.39 | |
| 4 | Prairie Rose | Moorhead | 225 | 10.68 | 0.22 | 7.95 | |
| 5 | Prairie Rose | Fargo | 225 | 6.62 | 0.14 | 5.46 | |
| 6 | Prairie Rose | Moorhead | 225 | 10.99 | 0.23 | 8.11 | |
| 7 | Prairie Rose | Fargo | 160 | 6.81 | 0.16 | 5.11 | |
| 8 | Prairie Rose | Fargo | 65 | 7.10 | 0.15 | 5.49 | |
| 9 | Prairie Rose | Moorhead | 160 | 11.36 | 0.22 | 8.09 | |
| 10 | Prairie Rose | Moorhead | 65 | 11.53 | 0.19 | 8.98 | |
| 11 | Prairie Rose | Fargo | 30 | 7.29 | 0.15 | 5.44 | |
| 12 | Prairie Rose | Fargo | 195 | 7.42 | 0.16 | 5.19 | |
| 13 | Prairie Rose | Moorhead | 95 | 11.96 | 0.25 | 8.94 | |
| 14 | Prairie Rose | Moorhead | 30 | 12.10 | 0.24 | 8.46 | |
| 15 | Prairie Rose | Moorhead | 100 | 12.95 | 0.24 | 9.69 | |
| 16 | Prairie Rose | Fargo | 95 | 8.69 | 0.19 | 6.06 | |
| 17 | Prairie Rose | Fargo | 60 | 8.84 | 0.18 | 6.23 | |
| 18 | Prairie Rose | Fargo | 70 | 10.17 | 0.19 | 7.55 | |
| Average | 142 | 9.34 | 0.19 | 7.04 | |||
Note: * travel time under ideal condition; ** physical travel distance coded by a network designer; A network designer determines Hour and Miles for dummy links.
In Scenario 2 (Table 4 and Figure 2b), the O-D pair between Prairie Rose and Moorhead resulted in two potential routes compared to four routes for the O-D pair between Prairie Rose and Fargo. Also note that ID 0 aligns well with the interstate highway system since the vehicle capacity over the interstate highway system is larger than for other routes. As such, ID 1 was assigned only a trip set size of 290 trips with a higher impedance value compared to that for ID 0. The O-D pair of Prairie Rose and Fargo encompasses six routes because local roads have less capacity than major roads even if route sections are parts of the interstate highway. The unassigned trips are reassigned to the second best route (ID 3) and to subsequent IDs. ID 5 shows an infeasible impedance value due to: (i) summed values designating congestion stemming from residuals from previously selected routes (ID 2 & ID 3); and (ii) connectivity based on an infeasible route since it is the only accessible route to the destination. ID 5 is a rare case since impedance is very high so it is infeasible even though the length is shorter than for other routes (ID 2 & 3).
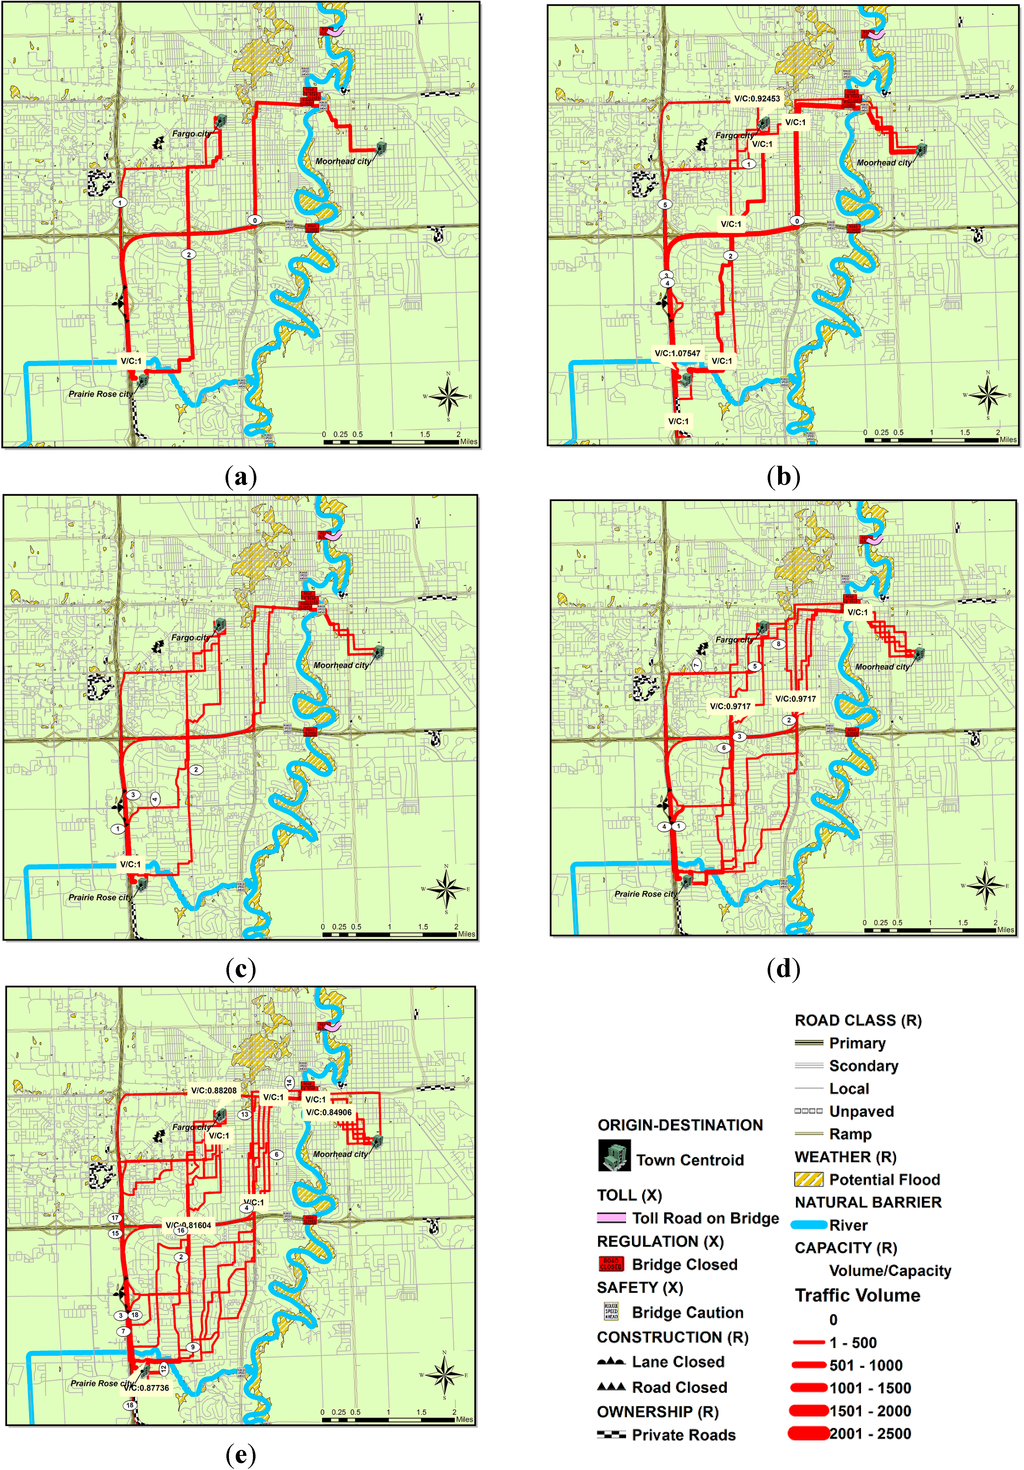
Figure 2.
Selected routes from Scenarios 1–5. (a) Selected routes from Scenario 1; (b) Selected routes from Scenario 2; (c) Selected routes from Scenario 3; (d) Selected routes from Scenario 4; (e) Selected routes from Scenario 5.
Figure 2.
Selected routes from Scenarios 1–5. (a) Selected routes from Scenario 1; (b) Selected routes from Scenario 2; (c) Selected routes from Scenario 3; (d) Selected routes from Scenario 4; (e) Selected routes from Scenario 5.
5.2. Effects of Congestion
In Scenario 3, five routes are selected; two routes for the first O-D pairs and the other three routes for the second O-D pair (Table 4). Major highways would be chosen in general, but an alternative route was selected with low impedance and no congestion. Congestion impedance in this case may also function as a quasi-dynamic factor for route choice. Some segments double up as impedance multipliers due to (i) increased capacity; (ii) a higher road classification; and (iii) a lower relative impedance.
In Scenario 4, newer routes are selected for the O-D pairs between Prairie Rose and Moorhead devoid of capacity conflict even though impedance values are different (Table 4). The route ID 2 has higher impedance than ID 1; however, the total length in miles is shorter. This indicates that the route with ID 2 has a higher cost than ID 1 because hierarchically it is the route with the third lowest impedance. The Prairie Rose-Fargo routes also show that the shortest paths had higher impedances.
5.3. Effects of Packet Size
Nineteen routes were distributed across the region with primary roads selected repeatedly as indicated by overlapping (thicker) lines and assigned trip information (Table 4). This mimics stochastic user equilibrium model based on impedance information. The subdivided trips were sensitive to (a) congestion; and (b) stochastically-derived impedances values. From Figure 2a,b, dissimilar trends for travel length and impedance can be observed from the Prairie Rose and Moorhead pair. Figure 2c,d display similar incremental trends for travel length and impedance from the Prairie Rose and Fargo pair. Some points that may need to be addressed in the future simulations may include the following:
- Trip sequence and O-D information may have an impact on the route choice, which can further be constrained by capacity and other factors.
- A cost set is important for better simulation and design such as annual average daily traffic (AADT) data from highway performance management systems (HPMS) [5].
5.4. Discussion
In this study, we have broken down impedance into absolute and relative impedance and also into links and nodes in response to infrastructure and would-be users’ preferences (e.g., volume/capacity ratio, hazards, bridge operation, construction, right-of-way, and road classification) [32]. Physical attributes, such as locations (nodes) and roads (links), and pertinent dynamics were deemed within the scope of an ideal routing system. We developed an impedance-based multi-criteria decision-making algorithm using GIS, thereby extending a previous single impedance approach for traffic assignment. Five scenarios were developed to evaluate and illustrate the algorithm under set criterion including FIFO assignment and capacity constraints.
We found that considering only distance or travel time as separate entities was not realistic. Other factors needed to be accounted for by adopting induced impedances. When distance is weighted appropriately using the possibility value to transect a segment, a modified distance value can then be recalculated to simulate realistic traffic impacts. From the Oak Ridge National Laboratory database [33], a dummy link was assigned to any terminal that is physically unconnected to a segment or a node in the contiguous layer. In our approach, a bridge exists as a node on a segment without linkage to the segment or node. So, to account for a bridge closure, a logical construct was assigned for the affected segment in order to generate a node impedance value. Gentile and Papola [34] used a similar segment level approach rather than an aggregate path because they felt that a path by itself is not an elementary unit for proper route choice and traffic assignment. In this regard, link impedance can best be applied to each segment. Accessibility is therefore narrowed to lower impedance segments to ease traversing from a selected origin to destination.
Three different types of traversability are employed: “go” for low impedance values of 1, “detour” for high impedance values of 0, and “slow” for impedance values between 0 and 1. For instance, if roads are not blocked or unregulated by policies, vehicles can pass through the selected routes as a “go”. Particular situations, such as accidents, severe weather, congestion, and poor level of service (LOS), can result into a “slow” trip. The “slow” situation includes delay and results in an incurred penalty cost. The “detour” case occurs from absolute barriers such as the lack of capacity, bridge collapse, road blocking/closing, regulation, and congestion. Some relative impedance is closely related to “slow” and “detour” coincidentally to a certain degree like severe traffic accidents, congestion, and severe weather conditions.
A high level of flexibility and agility to respond to social and environmental effects is required in emerging markets and transportation sectors. Some impedance is inevitable (value added) and some undesirable (non-value added), causing higher total transportation costs and slower speeds. The approach in this study can also be used to gauge a disruption scenario. This can be done by altering the impedance value in a network and identifying critical segments and vulnerable infrastructure. This multi-attribute impedance traffic assignment model can be extended to freight shipments that may be affected by street closures such as was the case in the 2013 Boston Marathon. On that fateful day significant streets were blocked due to terrorism fears, significantly affecting scheduled shipments. This algorithm can also be used in conjunction with route user surveys to extend its functionality. The distance weighted impedance can easily be replaced with travel time weighted impedance in similar studies.
6. Conclusions
In this study, classical impedance was determined and then categorized into link impedance and node impedance. This was done to develop an innovative multi-attribute impedance-based modified all-or-nothing traffic assignment model. The advantage of this approach is to eliminate the efforts of removing unconnected segments physically and logically at the pre-processing stage of network analysis. In doing so, the multi-attribute impedance can be easily controlled and manipulated in a GIS. Thus, GIS tools can be utilized for travel demand modeling in a long-range transportation planning. To establish an optimum route, the multi-attribute impedance was minimized by decreasing either segment and/or node impedance. In addition, the method proposed in this study offers flexibility in applied transportation and logistics studies and provides a means for analysts to respond promptly to inherent variables. To evaluate a model network, complex dynamic models allied with weather information, congestion, seasonal regulation areas, and various geographical factors can be implemented using attributes of the proposed approach. In addition, the algorithm discussed in this study can be used to reflect decision-making rules and behavior such as risk-averse, risk-neutral, and risk-taker drivers by utilizing stochastically generated user behaviors. Thus, although the experiments were done using all-or-nothing, this multi-attribute impedance concept can be used with a typical path-based traffic assignment algorithm.
Some limitations of the study are found. Non-linear impedance values should be further tested for the route selection process. In addition, a dynamic stochastic trip assignment model with trajectory should be considered in the future to incorporate congestion and dynamic factors such as accident, and other unforeseeable events for the short-term operations planning. In the future, a linear traversability and impedance model should be calibrated in order to respond to travelers’ behavior. In addition, the level of attributes and traversability can be determined by using fuzzy inference [32] with linguistic classes. Advanced survey instruments such as optical license plate recognition and global positing systems (GPS) tracking systems can be utilized to predict driver’s behavior and combined with the multi decision factors for assigning trips to the roads networks.
Acknowledgments
We thank the anonymous reviewers who reviewed this manuscript. The authors would like to acknowledge funding from Mountain-Plains Consortium, Regional Transportation Center, Transportation and Research and Innovative Technology Administration, U.S. Department of Transportation. The results and opinions in this paper are those of the authors and do not necessarily reflect the policy of the sponsors.
Author Contributions
EunSu Lee conceived and designed the experiments and wrote the most part of the paper, Peter G. Oduor contributed analysis tool and partially wrote the paper and provided the framework of the analysis.
Conflicts of Interest
The authors declare no conflict of interest.
References
- Wardrop, J.G. Some theoretical aspects of road traffic research. ICE Proc. Eng. Divisions 1952, 1, 325–362. [Google Scholar] [CrossRef]
- Daganzo, C.F.; Sheffi, Y. On stochastic models of traffic assignment. Transp. Sci. 1997, 11, 253–274. [Google Scholar] [CrossRef]
- Damberg, O.; Lundgren, J.T.; Patriksson, M. An algorithm for the stochastic user equilibrium problem. Transp. Res. Part B 1996, 30, 115–131. [Google Scholar] [CrossRef]
- Bell, M.G.H.; Shield, C. A stochastic user equilibrium path flow estimator. Transp. Res. Part C 1997, 5, 197–210. [Google Scholar] [CrossRef]
- Battelle. FAF3 Freight Traffic Analysis. Available online: http://faf.ornl.gov/fafweb/Data/Freight_Traffic_Analysis/faf_fta.pdf (accessed on 18 May 2015).
- Dijkstra, E.W. A note on two problems in connexion with graphs. Numer. Math. 1959, 1, 269–271. [Google Scholar] [CrossRef]
- Tolliver, D.; Dybing, A.; Lu, P.; Lee, E. Modeling investments in county roads and local roads to support agricultural logistics. J. Transp. Res. Forum 2011, 50, 101–115. [Google Scholar]
- Lee, E.; Oduor, P.G.; Farahmand, K.; Tolliver, D. Heuristic path-enumeration approach for container trip generation and assignment. J. Transp. Res. Forum 2011, 12, 7–21. [Google Scholar]
- Petersen, E.R. A primal-dual trip assignment algorithm. Manag. Sci. 1975, 22, 87–95. [Google Scholar] [CrossRef]
- Janic, M. Modeling the full costs of an intermodal and road freight transport network. Transp. Res. Part D 2007, 12, 33–44. [Google Scholar] [CrossRef]
- Keshkamat, S.S.; Looijen, J.M.; Zuidgeest, M.H.P. The formulation and evaluation of transport route planning alternative-s: A spatial decision support system for the Via Baltica Project, Poland. J. Transp. Geogr. 2009, 17, 54–64. [Google Scholar] [CrossRef]
- Geurs, K.T.; Wee, B.B. Accessibility evaluation of land-use and transport strategies: Review and research directions. J. Transp. Geogr. 2004, 12, 127–140. [Google Scholar] [CrossRef]
- Woudsma, C.; Jensen, J.F.; Kanaroglou, P.; Maoh, H. Logistics land use and the city: A spatial-temporal modeling approach. Transp. Res. Part E 2008, 44, 277–297. [Google Scholar] [CrossRef]
- Shaw, S.L. What about “Time” in transportation geography? J. Transp. Geogr. 2006, 14, 237–240. [Google Scholar] [CrossRef]
- Miller, H.J. Measuring space-time accessibility benefits within transportation networks: Basic theory and computational procedures. Geogr. Anal. 1999, 31, 187–212. [Google Scholar] [CrossRef]
- Weber, J.; Kwan, M. Bringing time back in: A study on the influence of travel time variations and facility opening hours on individual accessibility. Prof. Geogr. 2002, 54, 226–240. [Google Scholar] [CrossRef]
- Nesterov, Y.; de Palma, A.D. Stationary dynamic solutions in congested transportation networks: Summary and perspectives. Netw. Spat. Econ. 2003, 3, 371–395. [Google Scholar] [CrossRef]
- Taylor, N.B. The CONTRAM dynamic trip assignment model. Netw. Spat. Econ. 2003, 3, 297–322. [Google Scholar] [CrossRef]
- Lee, E.; Oduor, P.G.; Farahmand, K. Simplistic geospatial techniques in analyzing transportation dynamics for origin-destination container movement routes in the United States. J. Transp. Syst. Eng. Inf. Technol. 2012, 12, 79–90. [Google Scholar]
- Peeta, S.; Ziliaskopoulos, A.K. Foundations of dynamic trip assignment: The past, the present and the future. Netw. Spat. Econ. 2001, 1, 233–265. [Google Scholar] [CrossRef]
- Carey, M. Nonconvexity of the dynamic trip assignment problem. Transp. Res. Part B 1992, 26, 127–133. [Google Scholar] [CrossRef]
- Kwan, M.P.; Ransberger, D.M. LiDAR assisted emergency response: Detection of transport network obstructions caused by major disasters. Comput. Environ. Urban Syst. 2010, 34, 179–188. [Google Scholar] [CrossRef]
- Grossardt, T.; Bailey, K.; Barumm, J. Analytic minimum impedance surface: Geographic information system-based corridor planning methodology. Transp. Res. Rec. 2001. [Google Scholar] [CrossRef]
- Chen, T.Y.; Chang, H.L.; Tzeng, G.H. Using a weight-assessing model to identify route choice criteria and information effects. Transp. Res. Part A 2001, 35, 197–224. [Google Scholar]
- Cascetta, E. Transportation System Analysis: Models and Applications; Springer: New York, NY, USA, 2009. [Google Scholar]
- Gutiérrez, J.; Urbano, P. Accessibility in the European Union: The impact of the trans-European road network. J. Transp. Geogr. 1996, 4, 15–25. [Google Scholar] [CrossRef]
- Arnold, P.; Peeters, D.; Thomas, I. Modeling a rail/road intermodal transportation system. Transp. Res. Part E 1994, 40, 255–270. [Google Scholar] [CrossRef]
- Handy, S.L. Regional versus Local Accessibility: Implications for Nonwork Travel. Available online: http://www.uctc.net/papers/234.pdf (accessed on 19 May 2015).
- Transportation Research Board. Highway Capacity Manual; National Research Council: Washington, DC, USA, 2000. [Google Scholar]
- Moseley, M.J. Accessibility: The Rural Challenge; Methuen and Company Limited: London, UK, 1979. [Google Scholar]
- Stanilov, K. Accessibility and land use: The case of suburban Seattle, 1960–1990. Reg. Stud. 2003, 37, 783–794. [Google Scholar] [CrossRef]
- Reddy, H.K.; Chakroborty, P. A Fuzzy inference based assignment algorithm to estimate O-D matrix from link volume counts. Comput. Environ. Urban Syst. 1998, 22, 409–423. [Google Scholar] [CrossRef]
- Oak Ridge National Laboratory. Railroad Network. Available online: http://cta.ornl.gov/transnet/RailRoads.html (accessed on 18 May 2015).
- Gentile, G.; Papola, A. An alternative approach to route choice simulation: The sequential models. In Proceeding of the European Transport Conference, Strasbourg, France, 18–20 September 2006.
© 2015 by the authors; licensee MDPI, Basel, Switzerland. This article is an open access article distributed under the terms and conditions of the Creative Commons Attribution license (http://creativecommons.org/licenses/by/4.0/).