
Solar Irradiance Modelling with NASA WW GIS Environment


Abstract
:
1. Introduction
2. Method
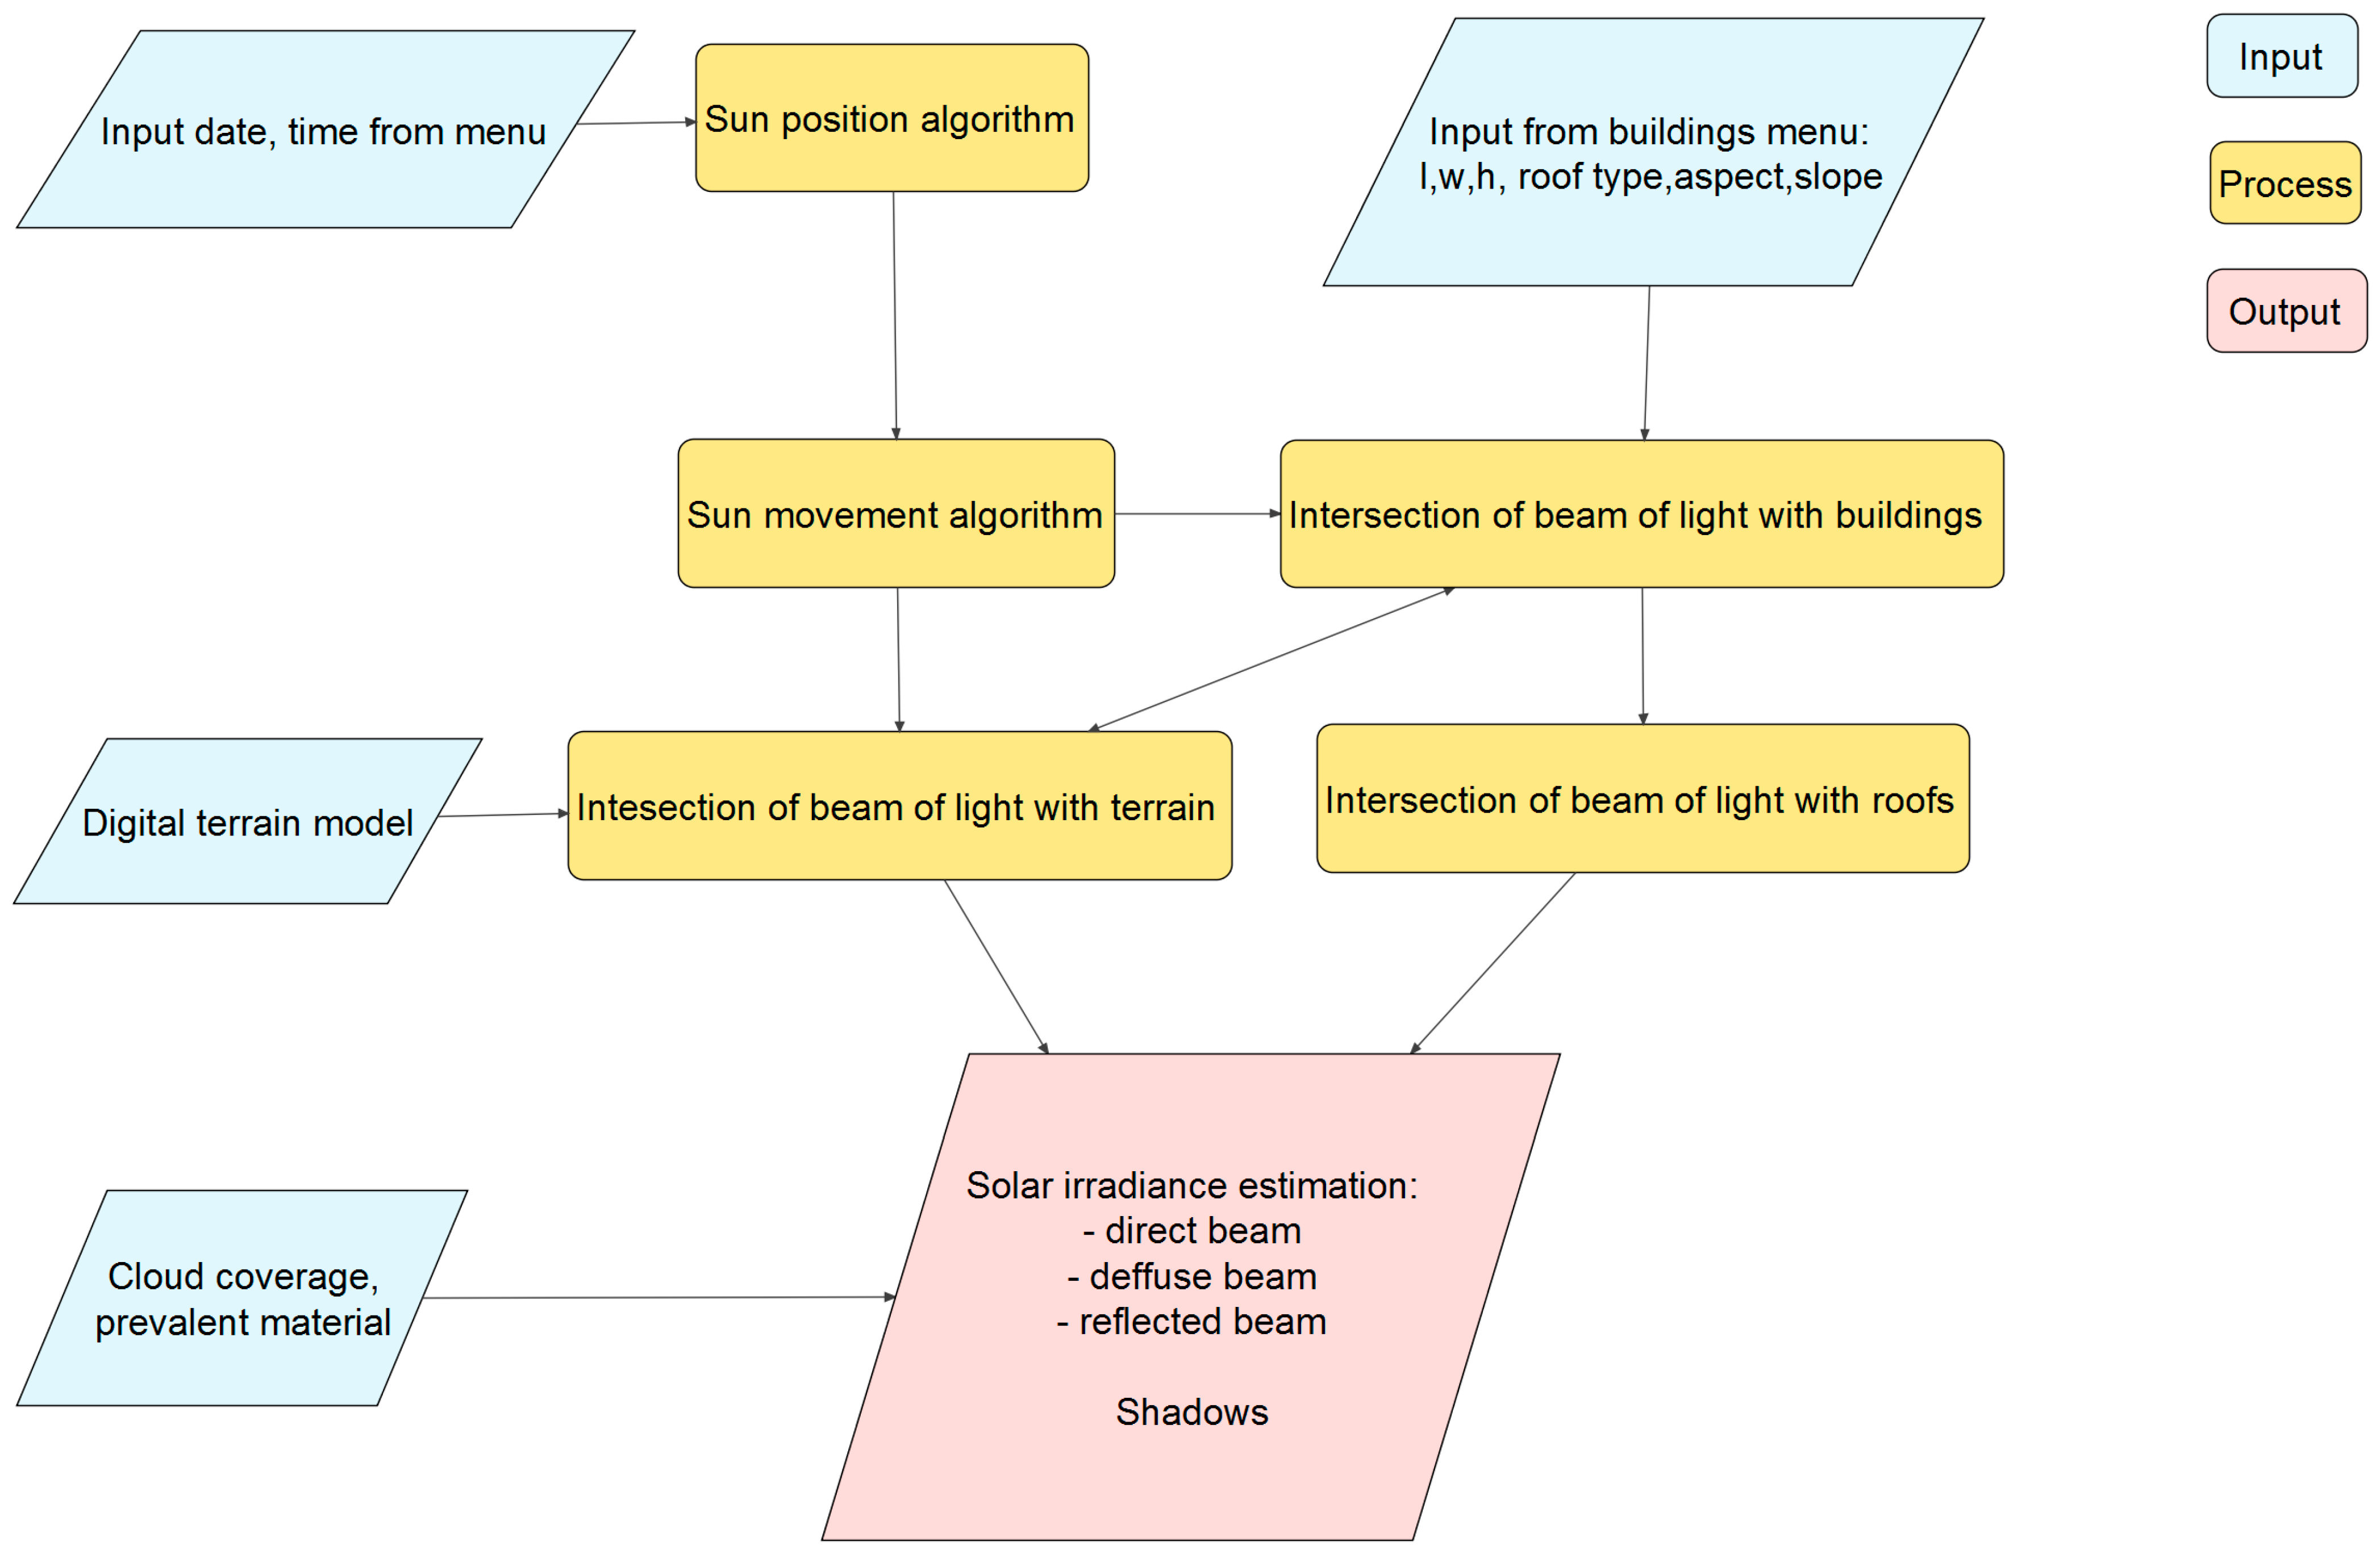
2.1. Sun Position Algorithm
2.2. Atmosphere Model

| Material | ρs | Material | ρs |
|---|---|---|---|
| asphalt road | 0.10 | loam (with clay) | 0.14 |
| broad-leaf trees | 0.26 | roof | 0.13 |
| concrete | 0.22 | snow | 0.75 |
| conifers | 0.07 | stones, gravel | 0.20 |
| dark-colored building | 0.27 | water | 0.07 |
| dirt road | 0.04 | white-colored building | 0.60 |
| grass (dry + green) | 0.23 |
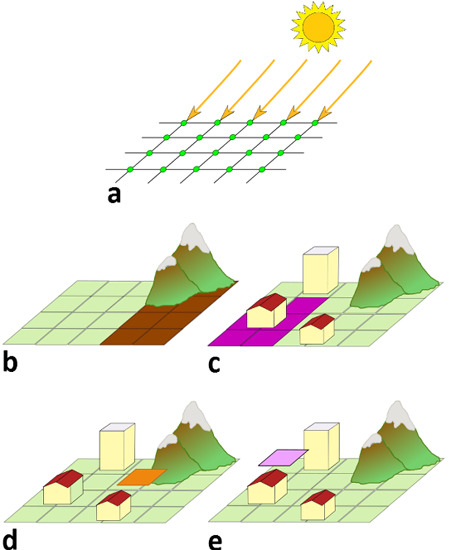
2.3. Building Model
2.4. Obstructions
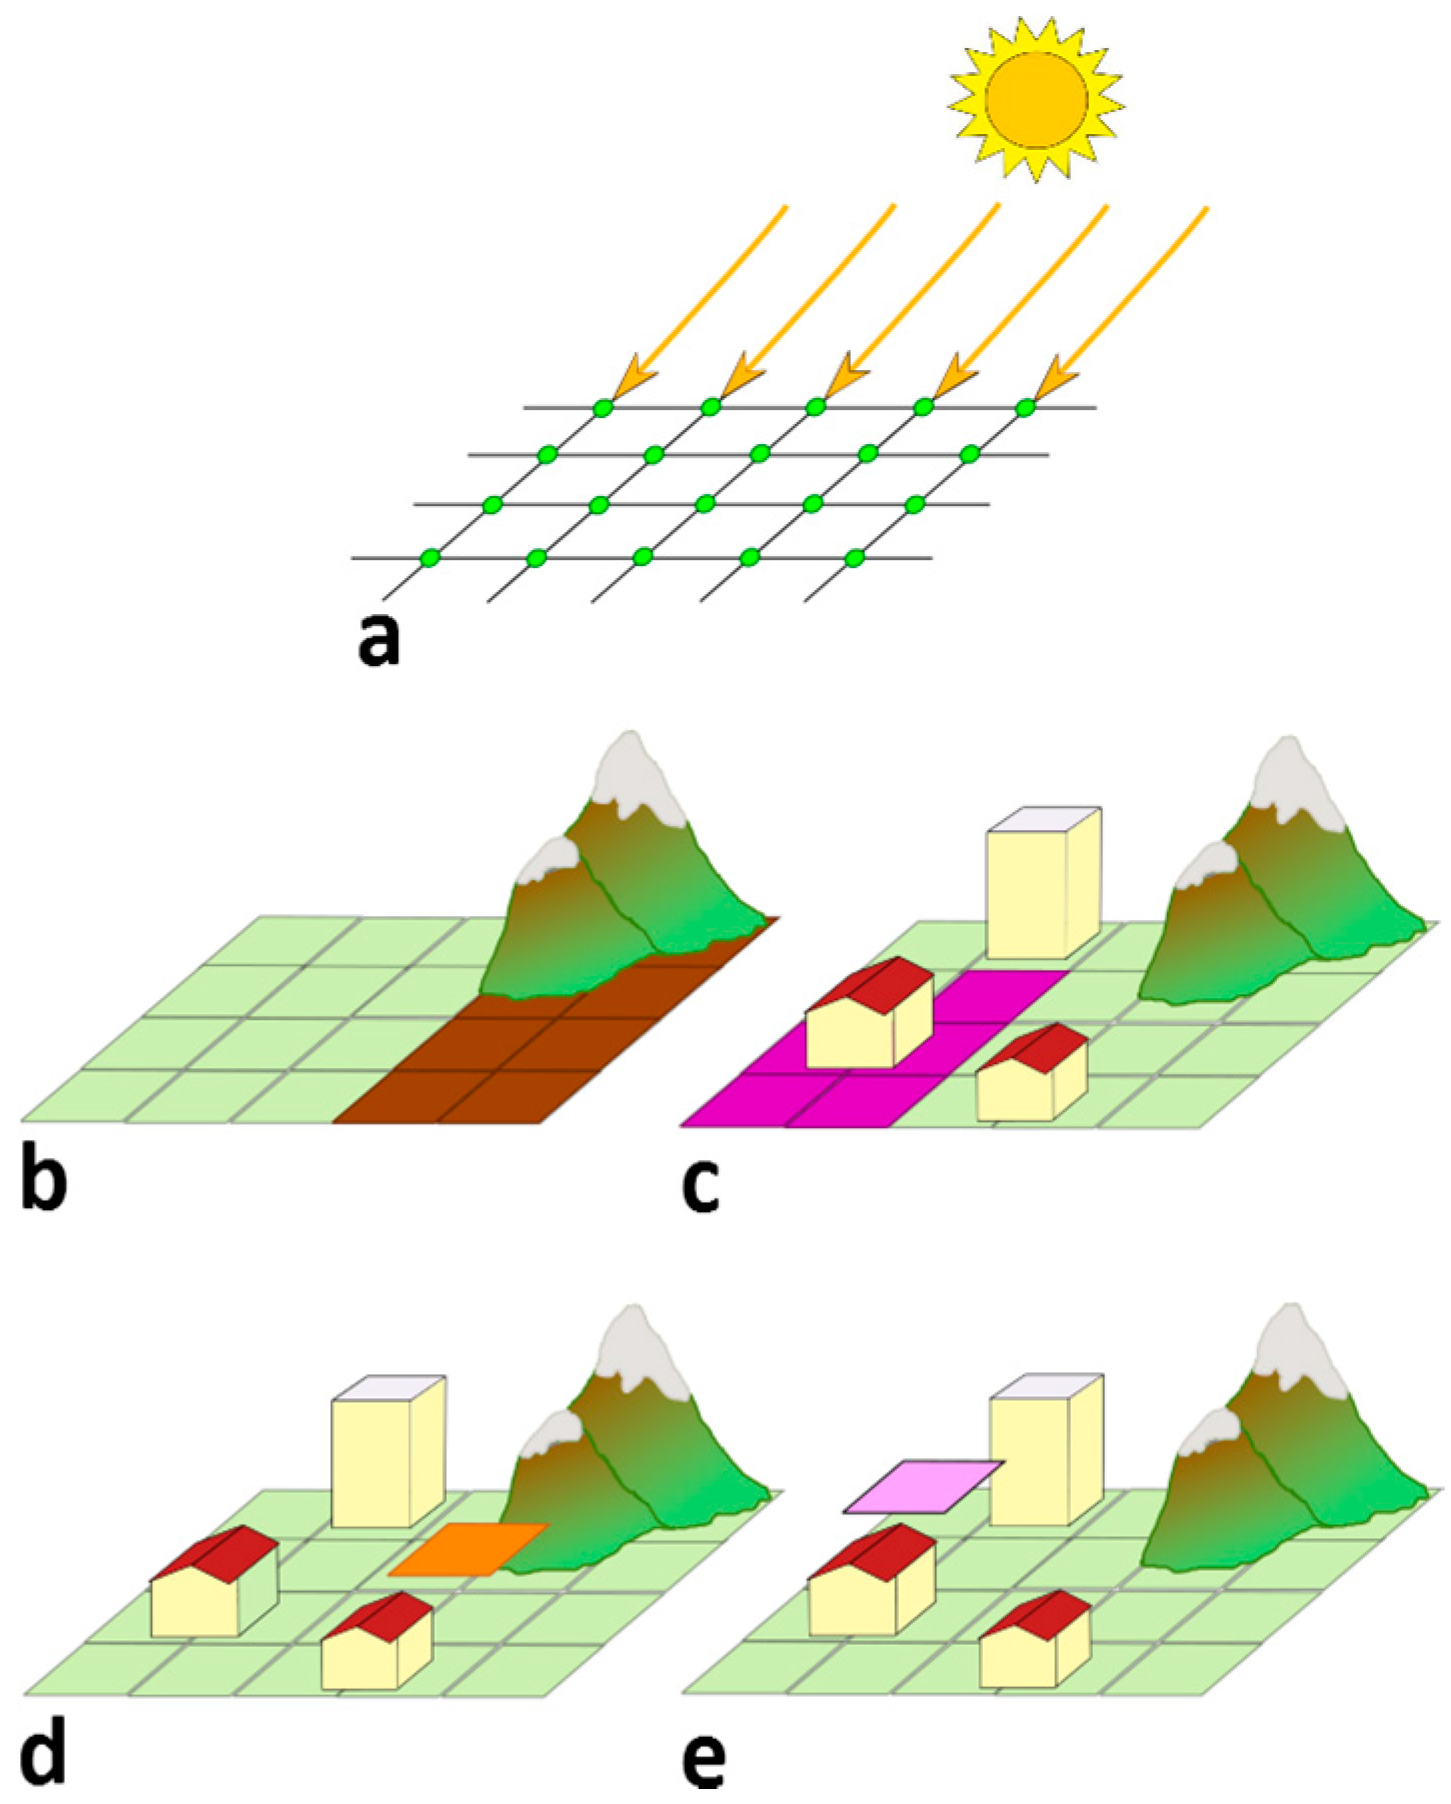
2.5. Final Model
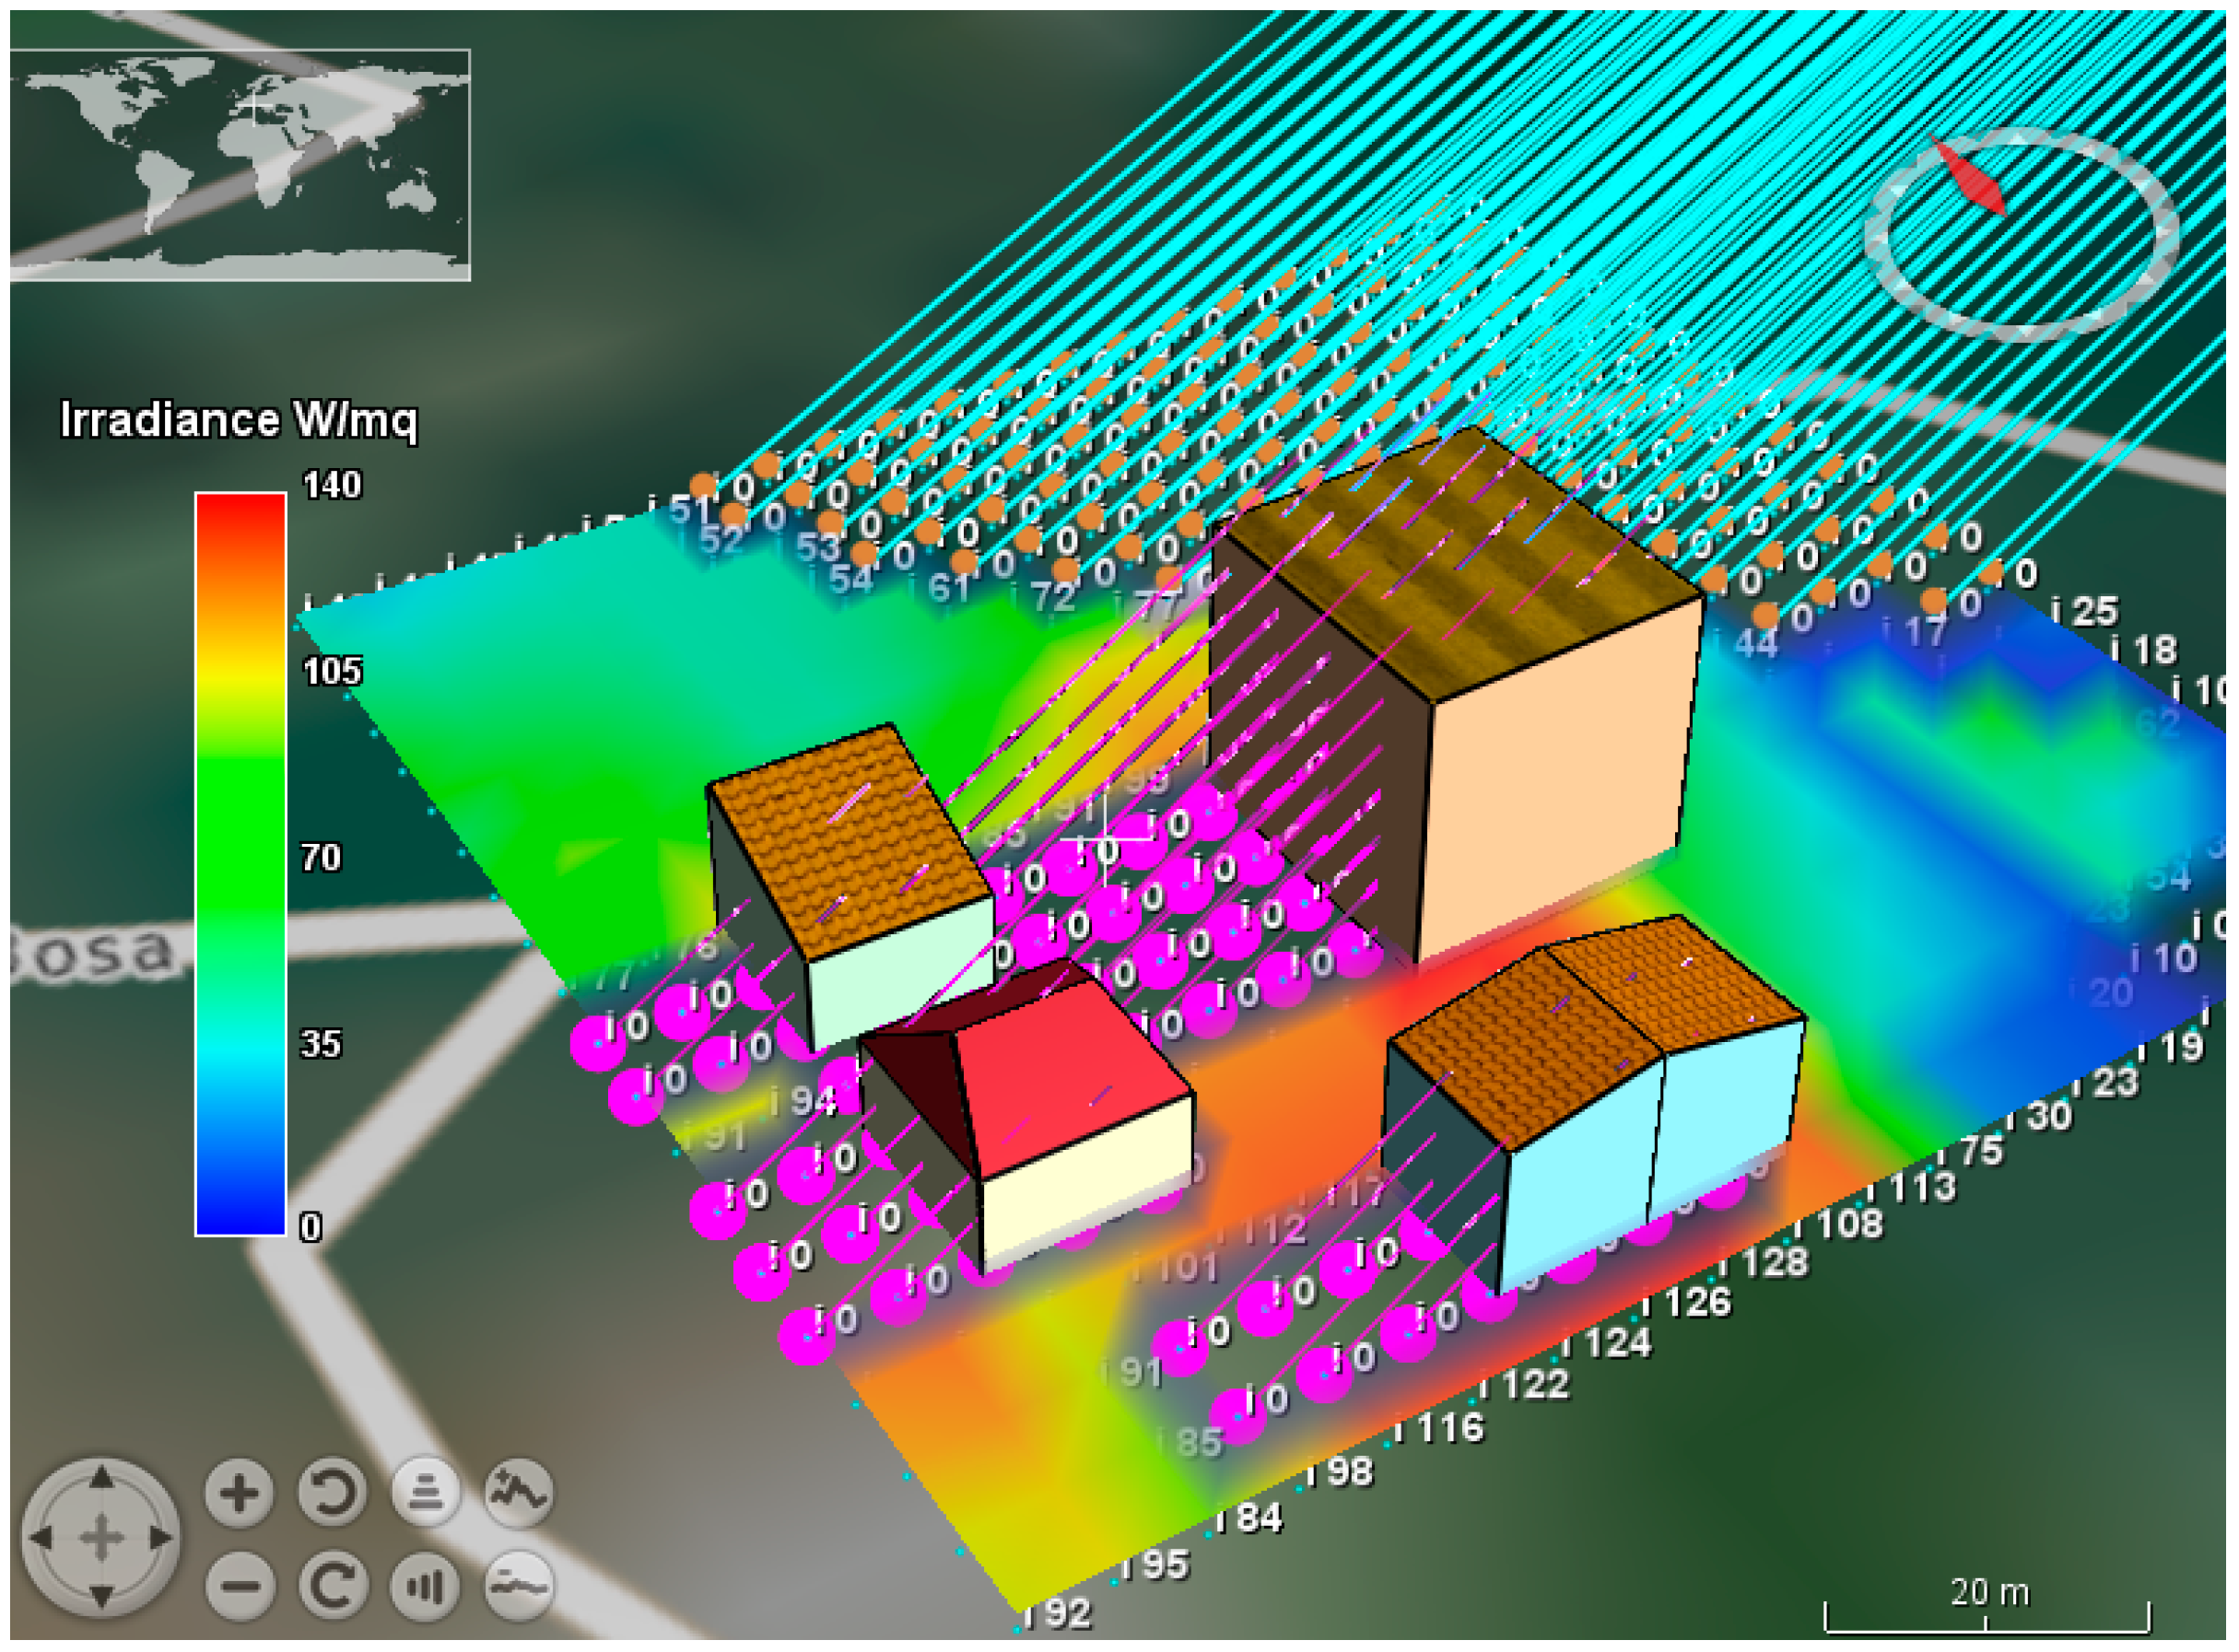
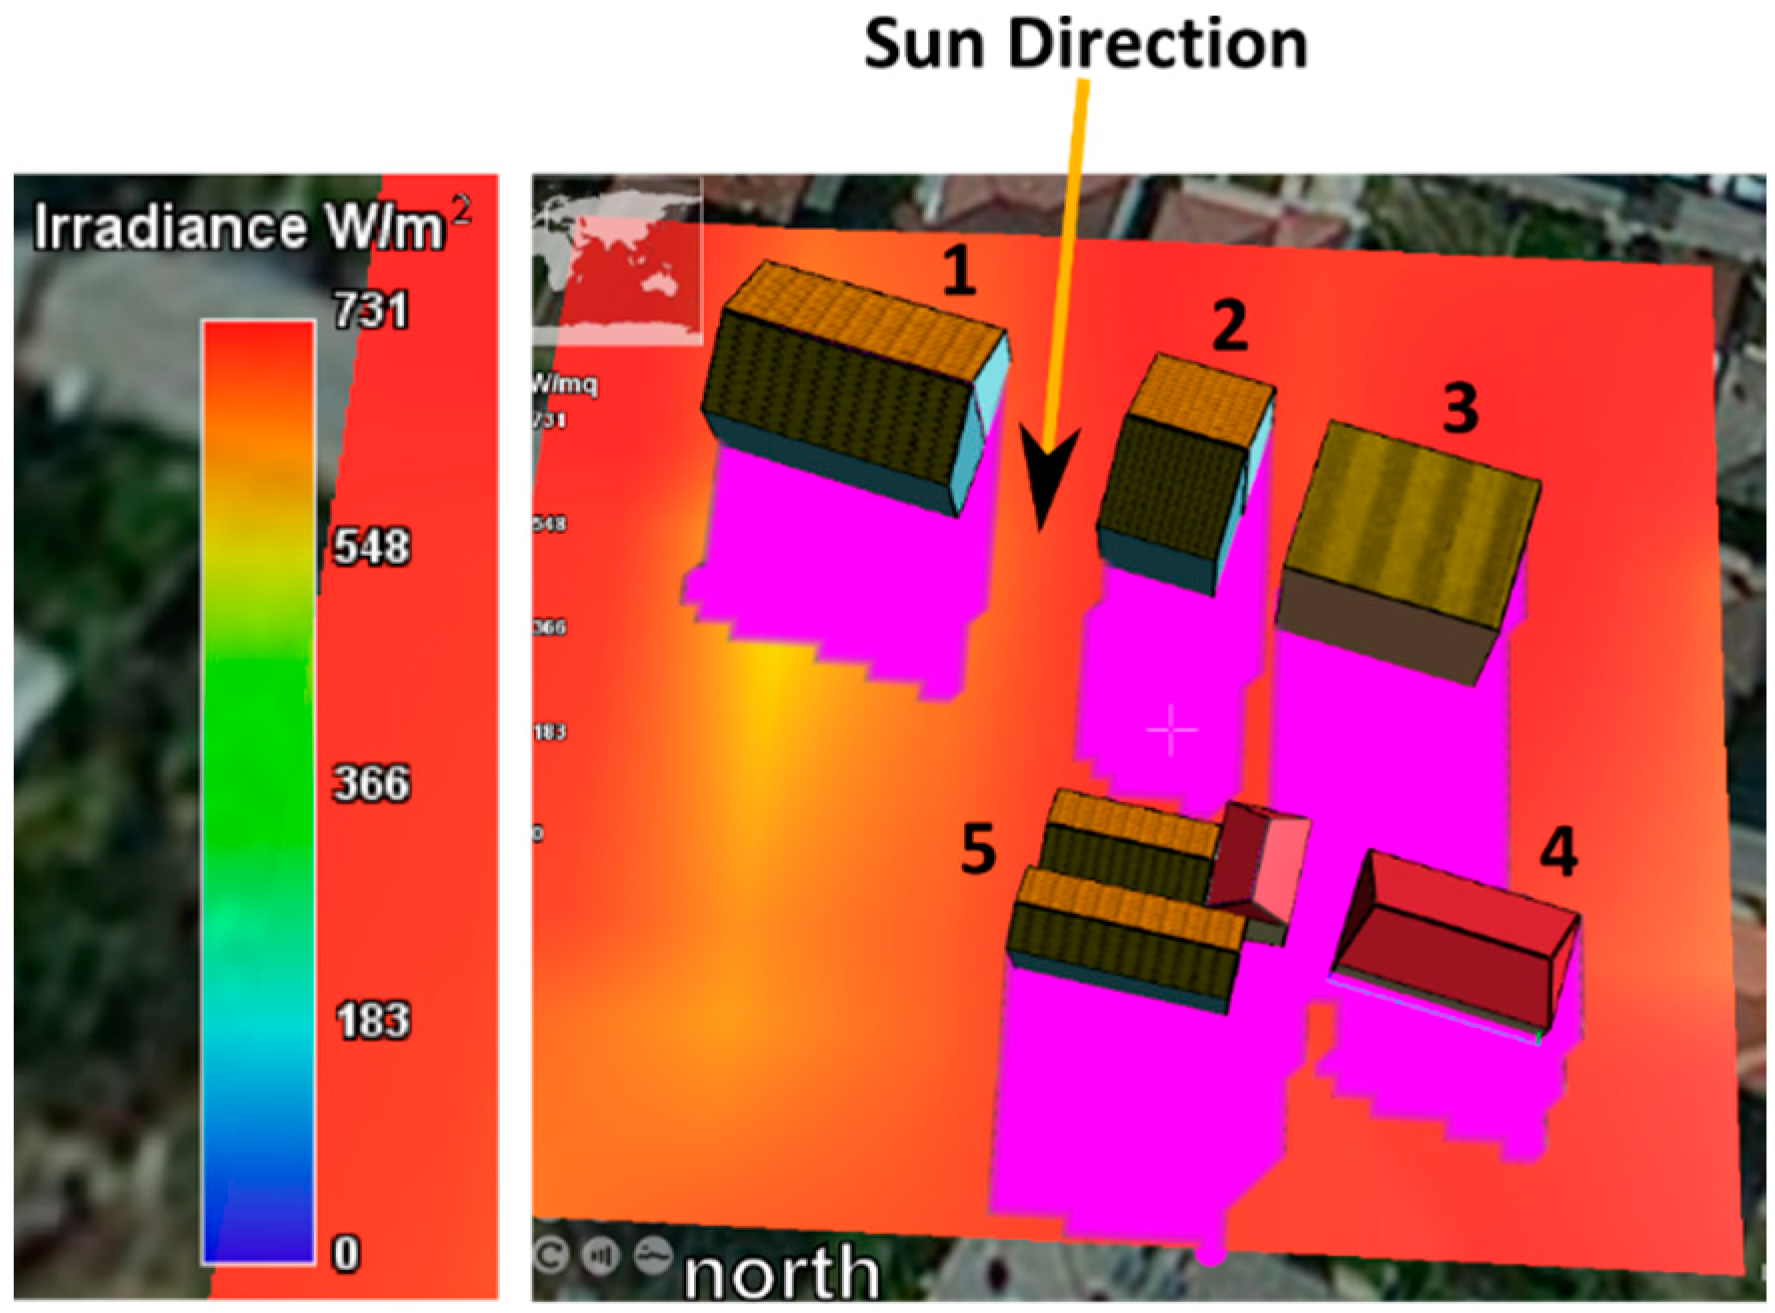
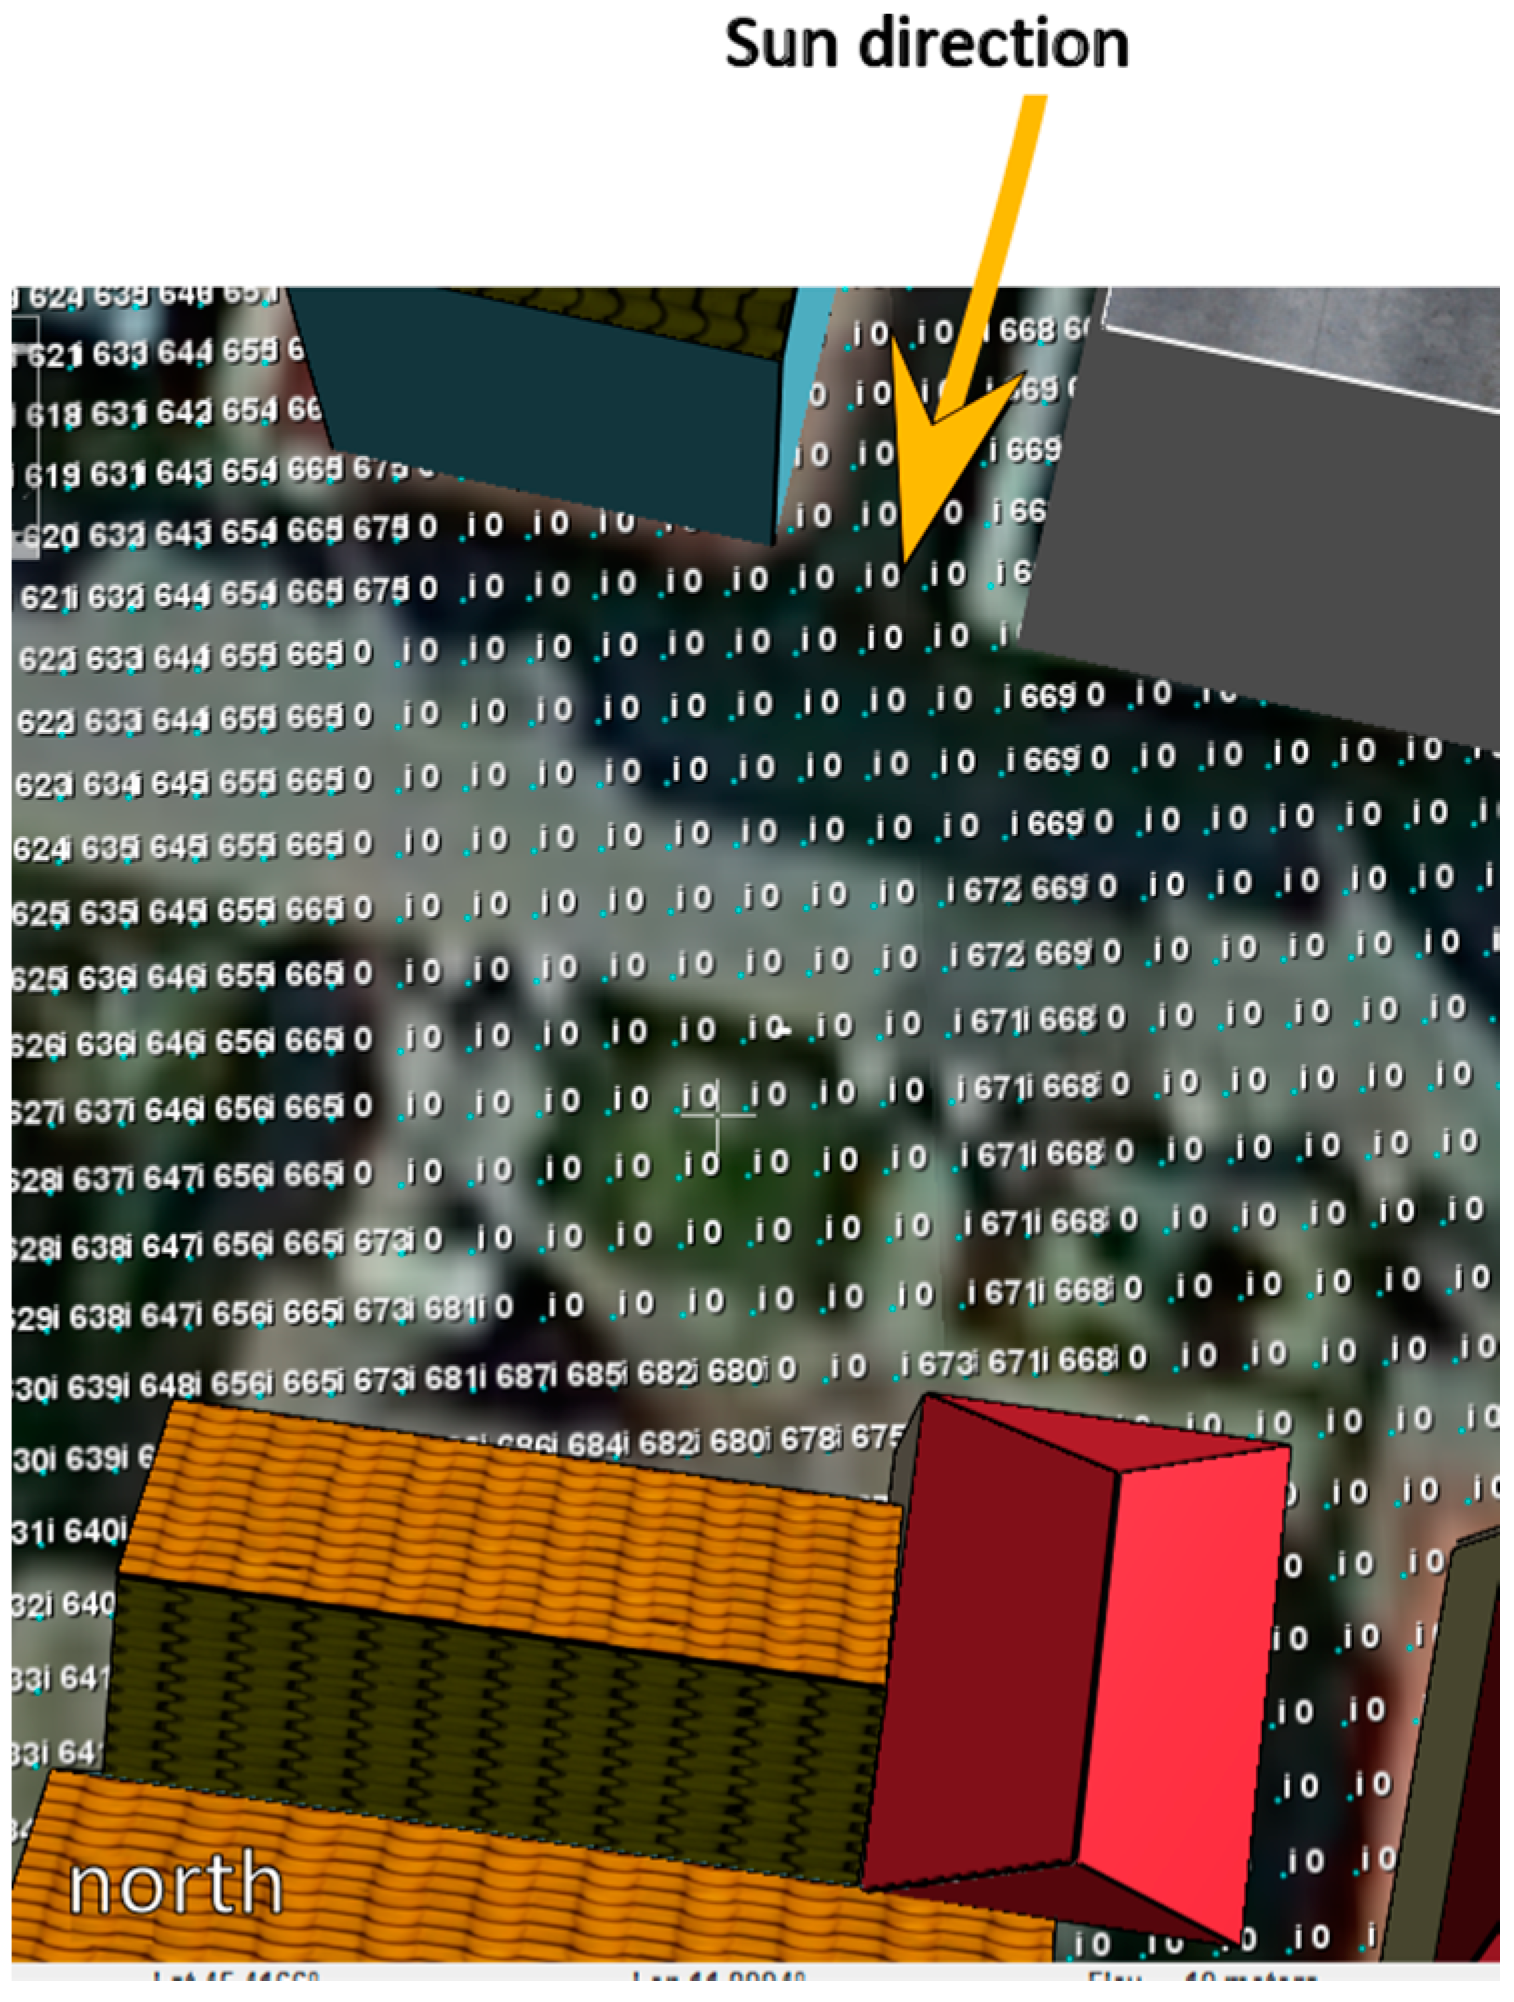
3. Experimental Results
- (i)
- a certain time of day and a certain day of year to calculate the sun position;
- (ii)
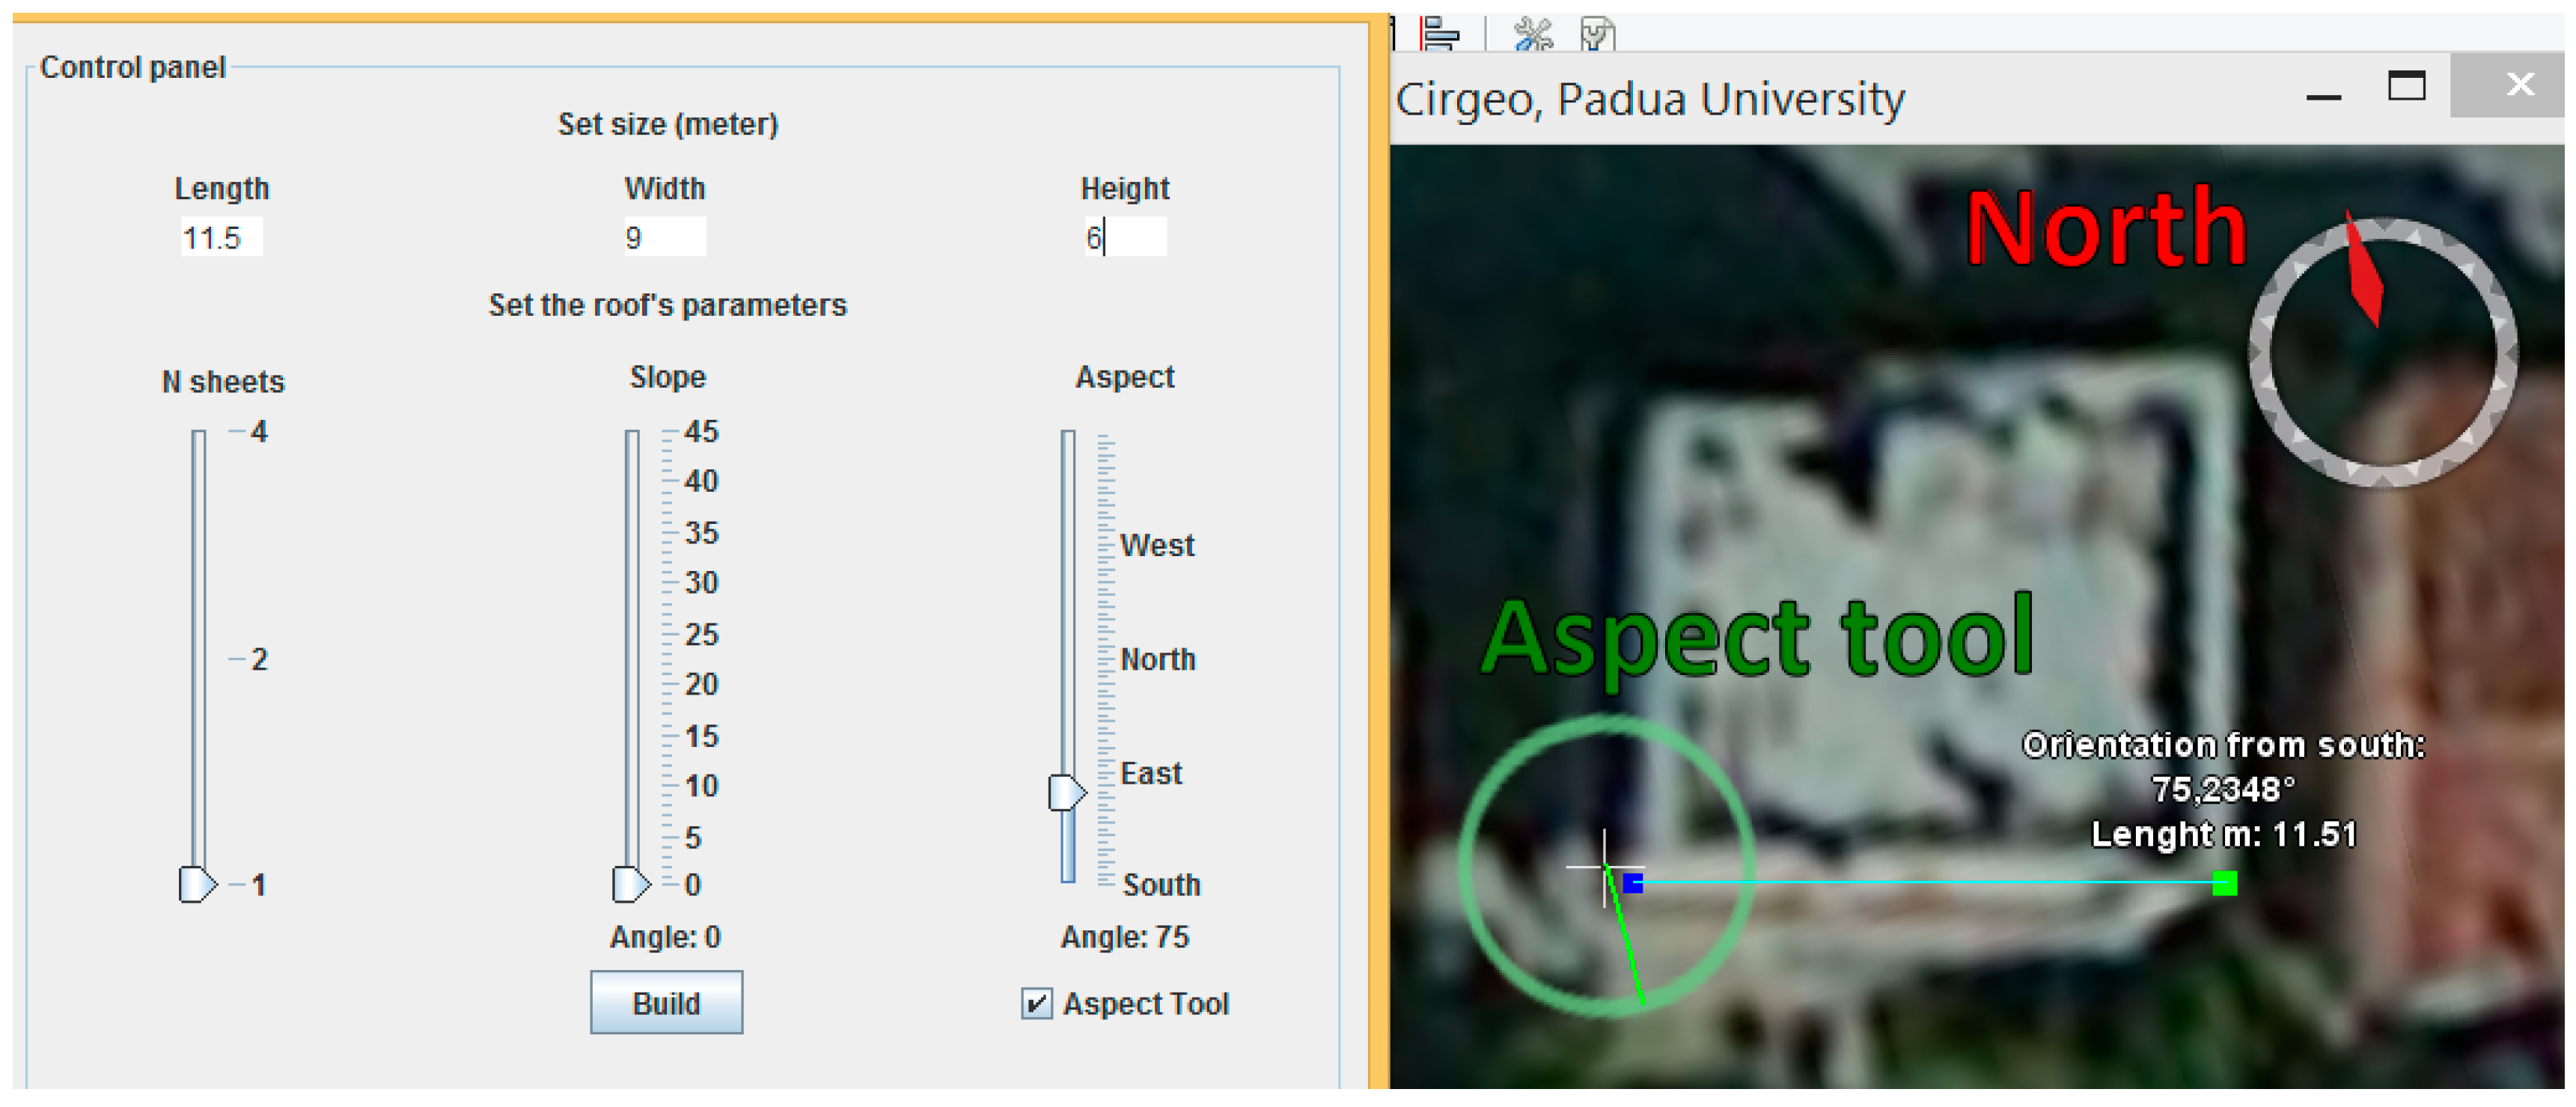
- the dimension of the building, i.e., length and width and eaves height;
- (iii)
- the roof typologies (number of sheets), slope and aspect;
- (iv)
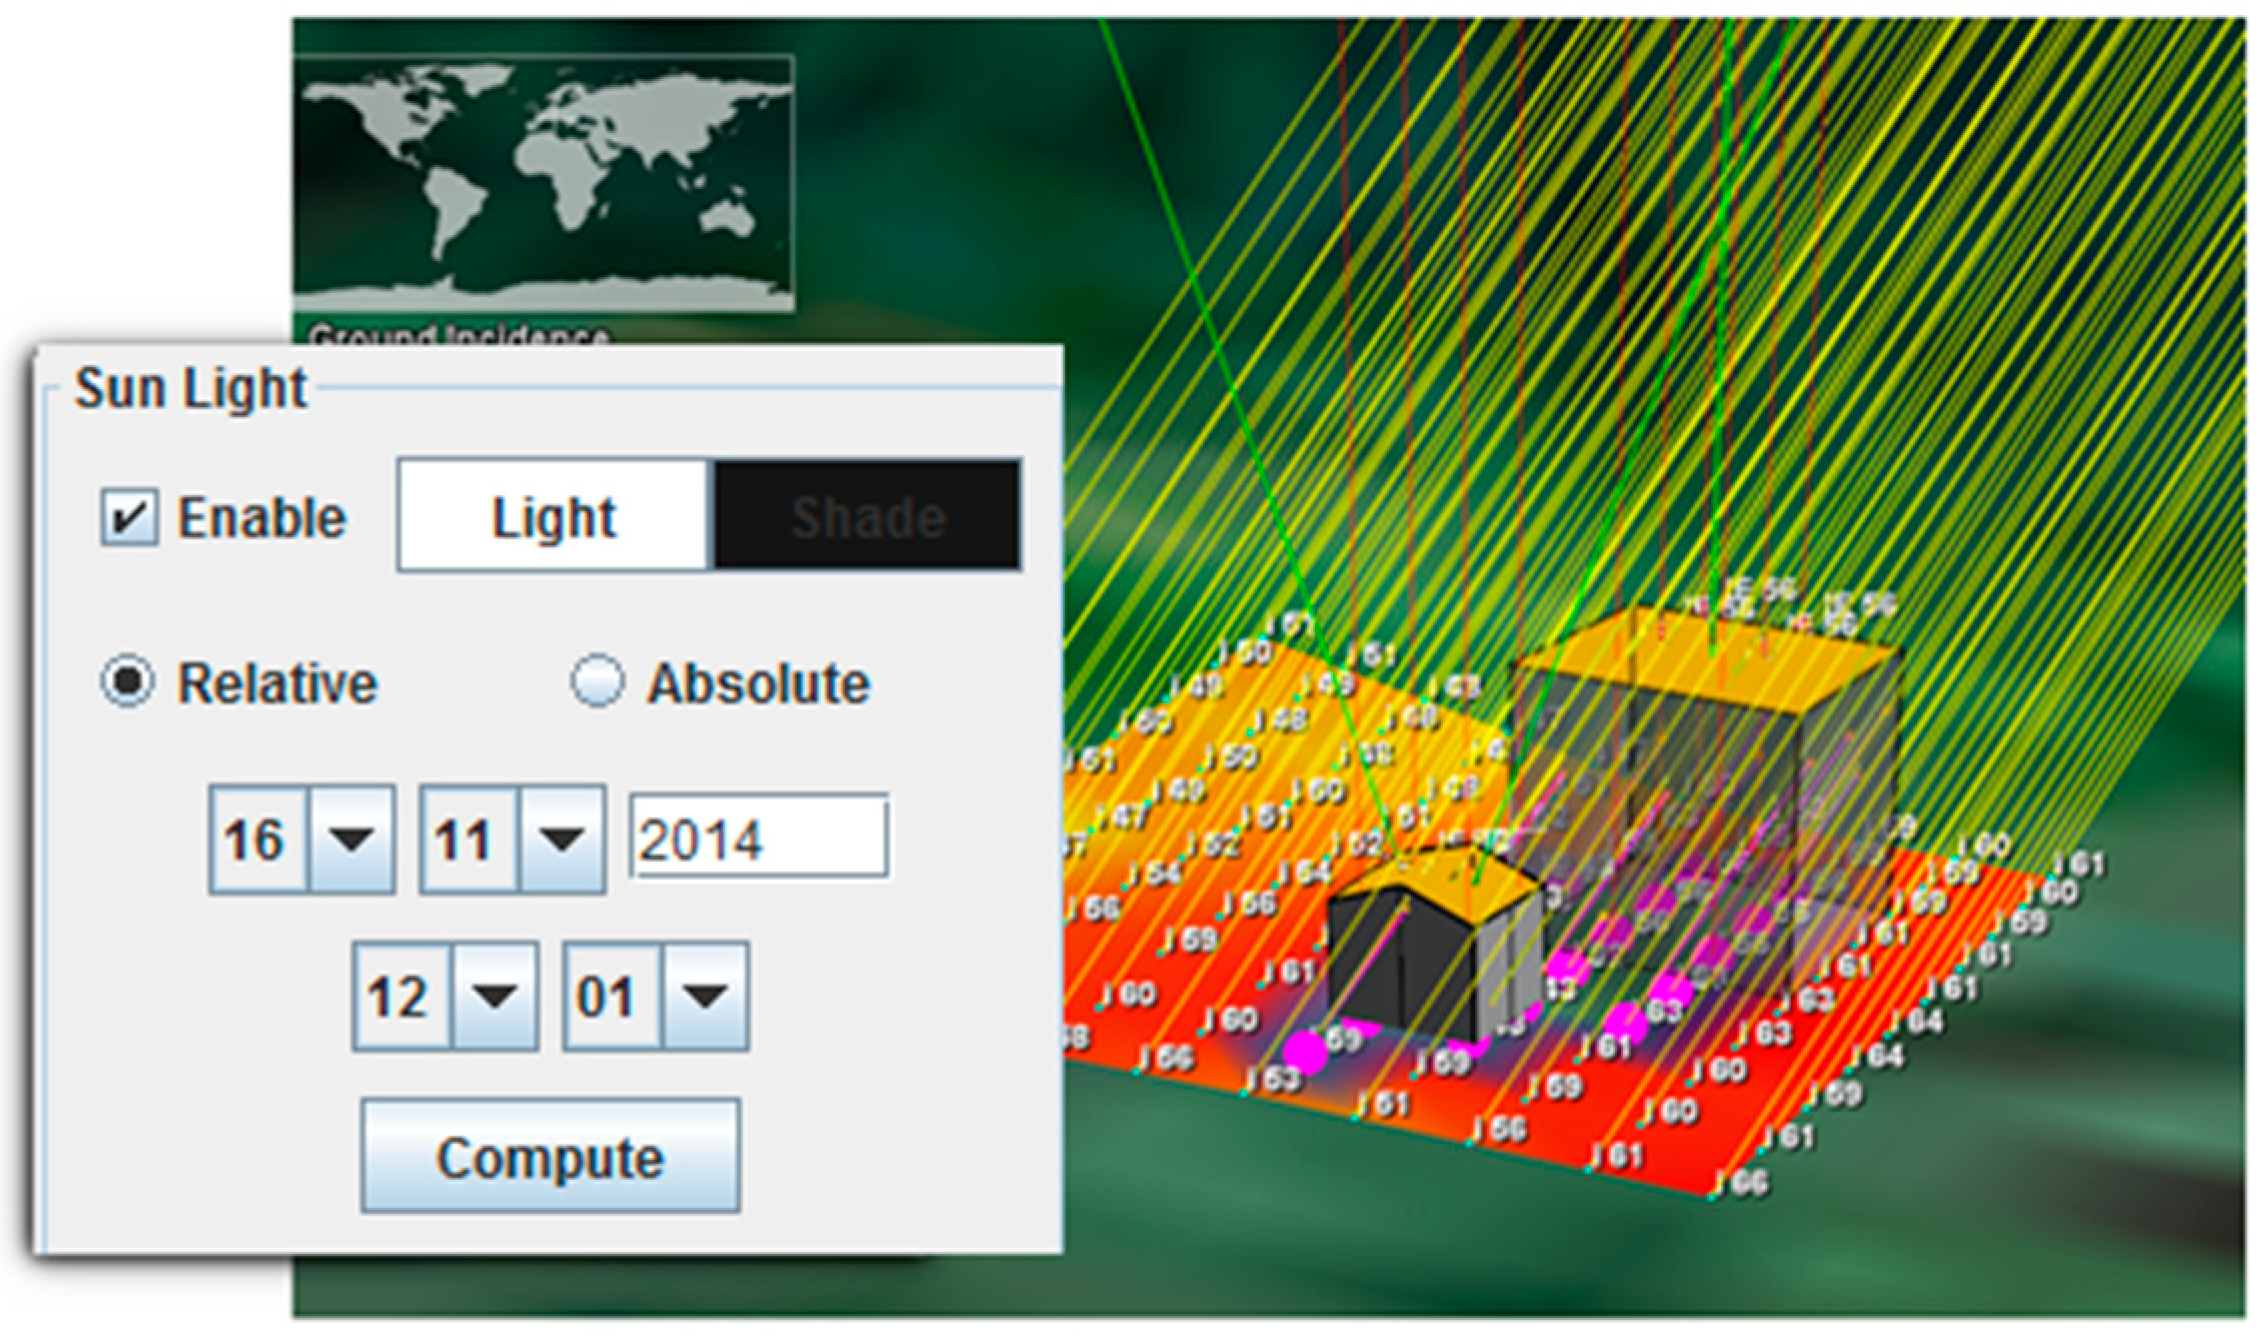
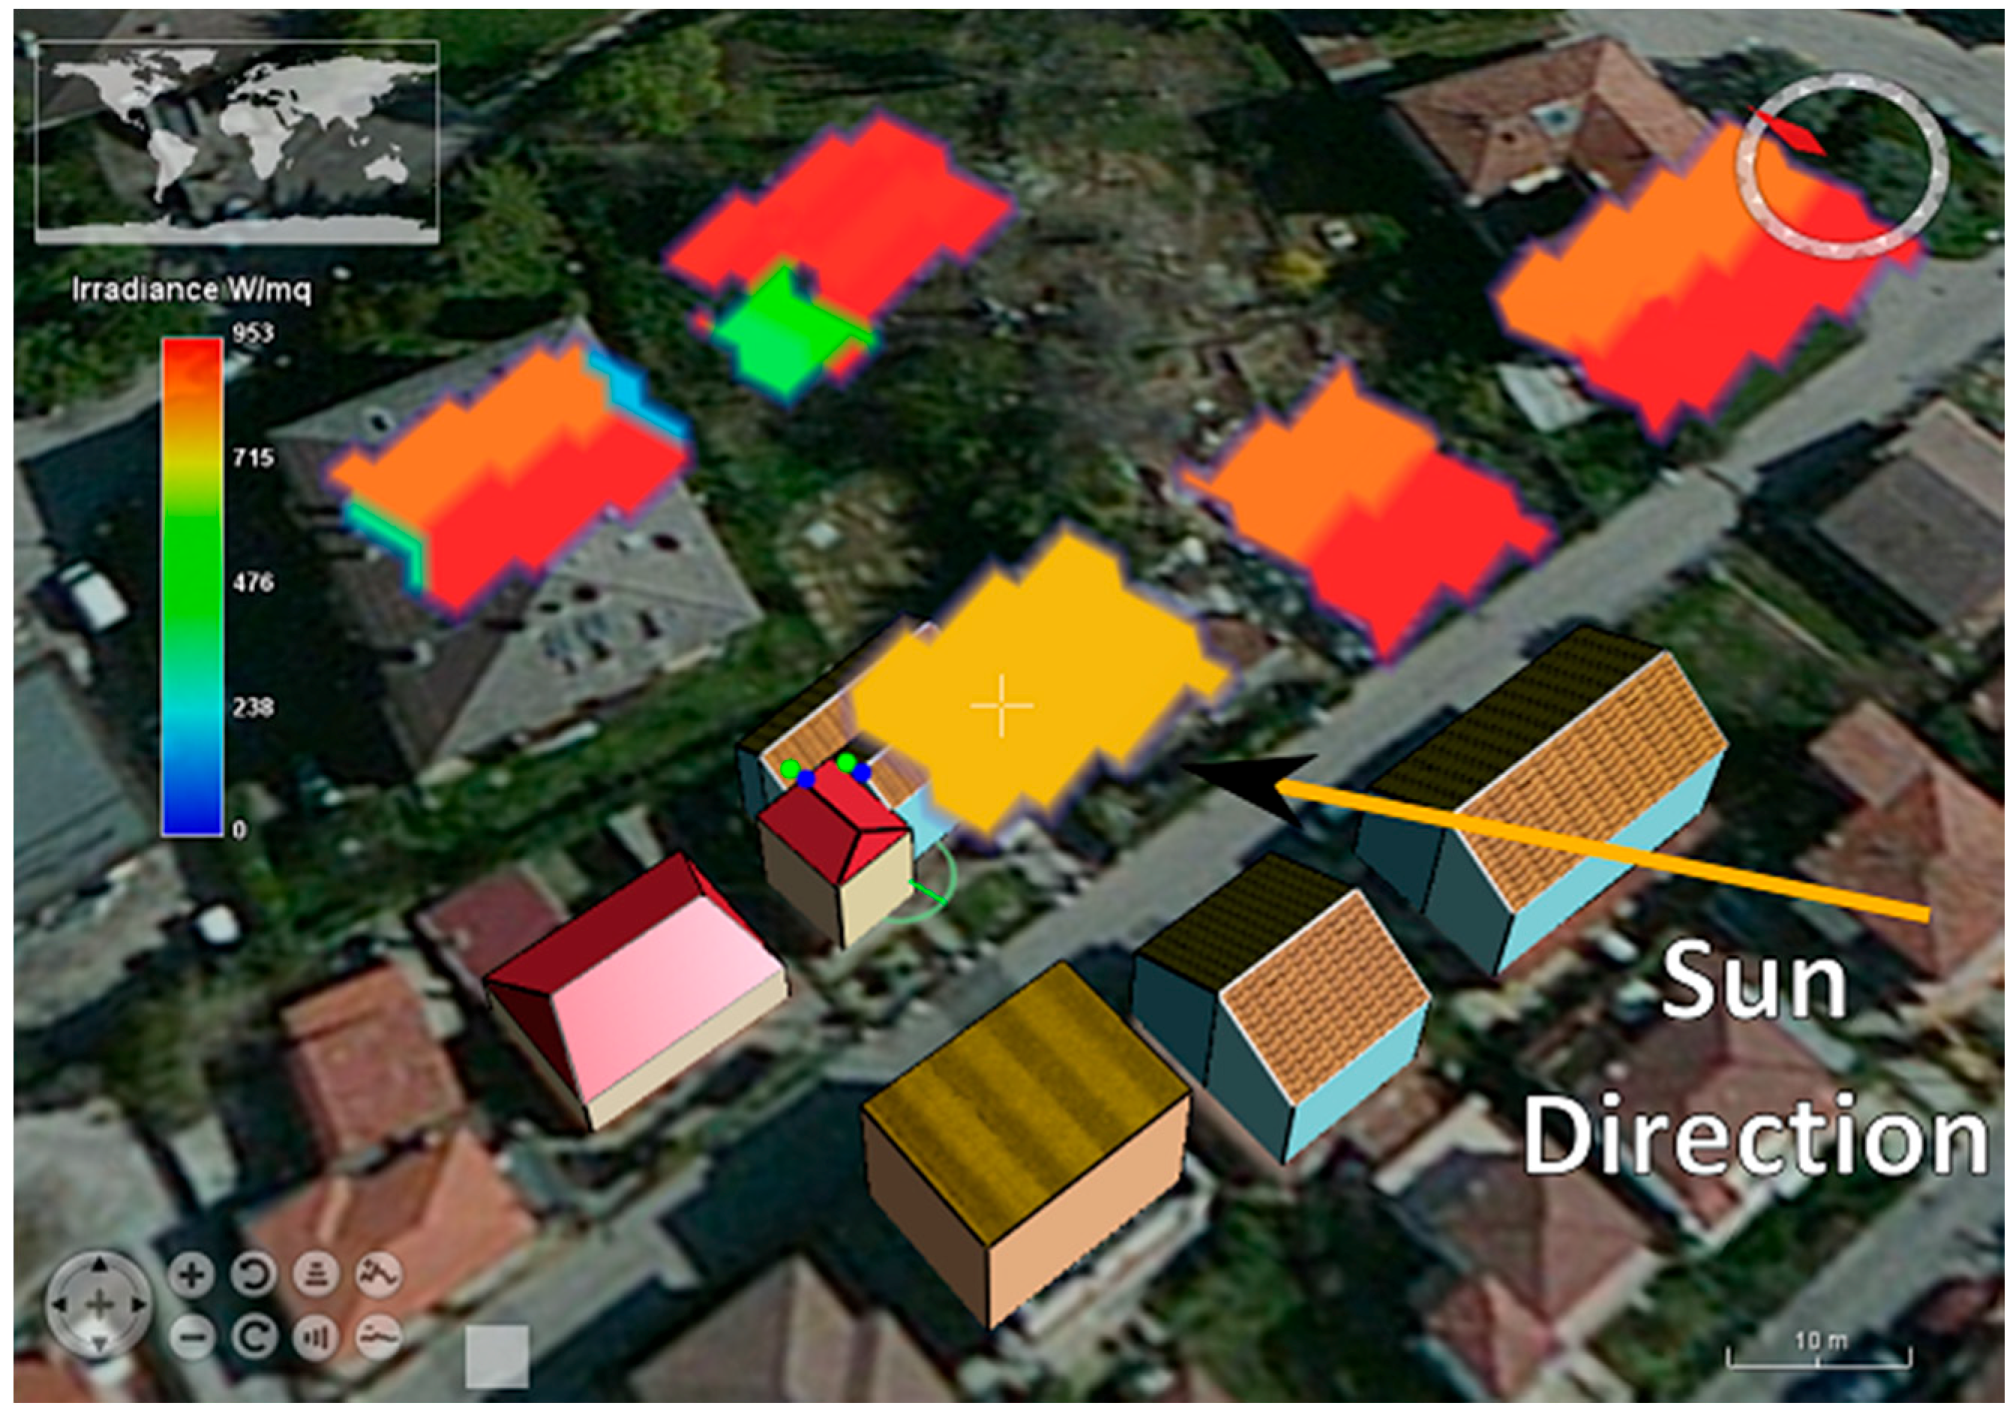
- a dedicated tool allows to measurement of the size and aspect of building, using available NASA WW layers, i.e., orthophotos or satellite images (Figure 5);
- (v)
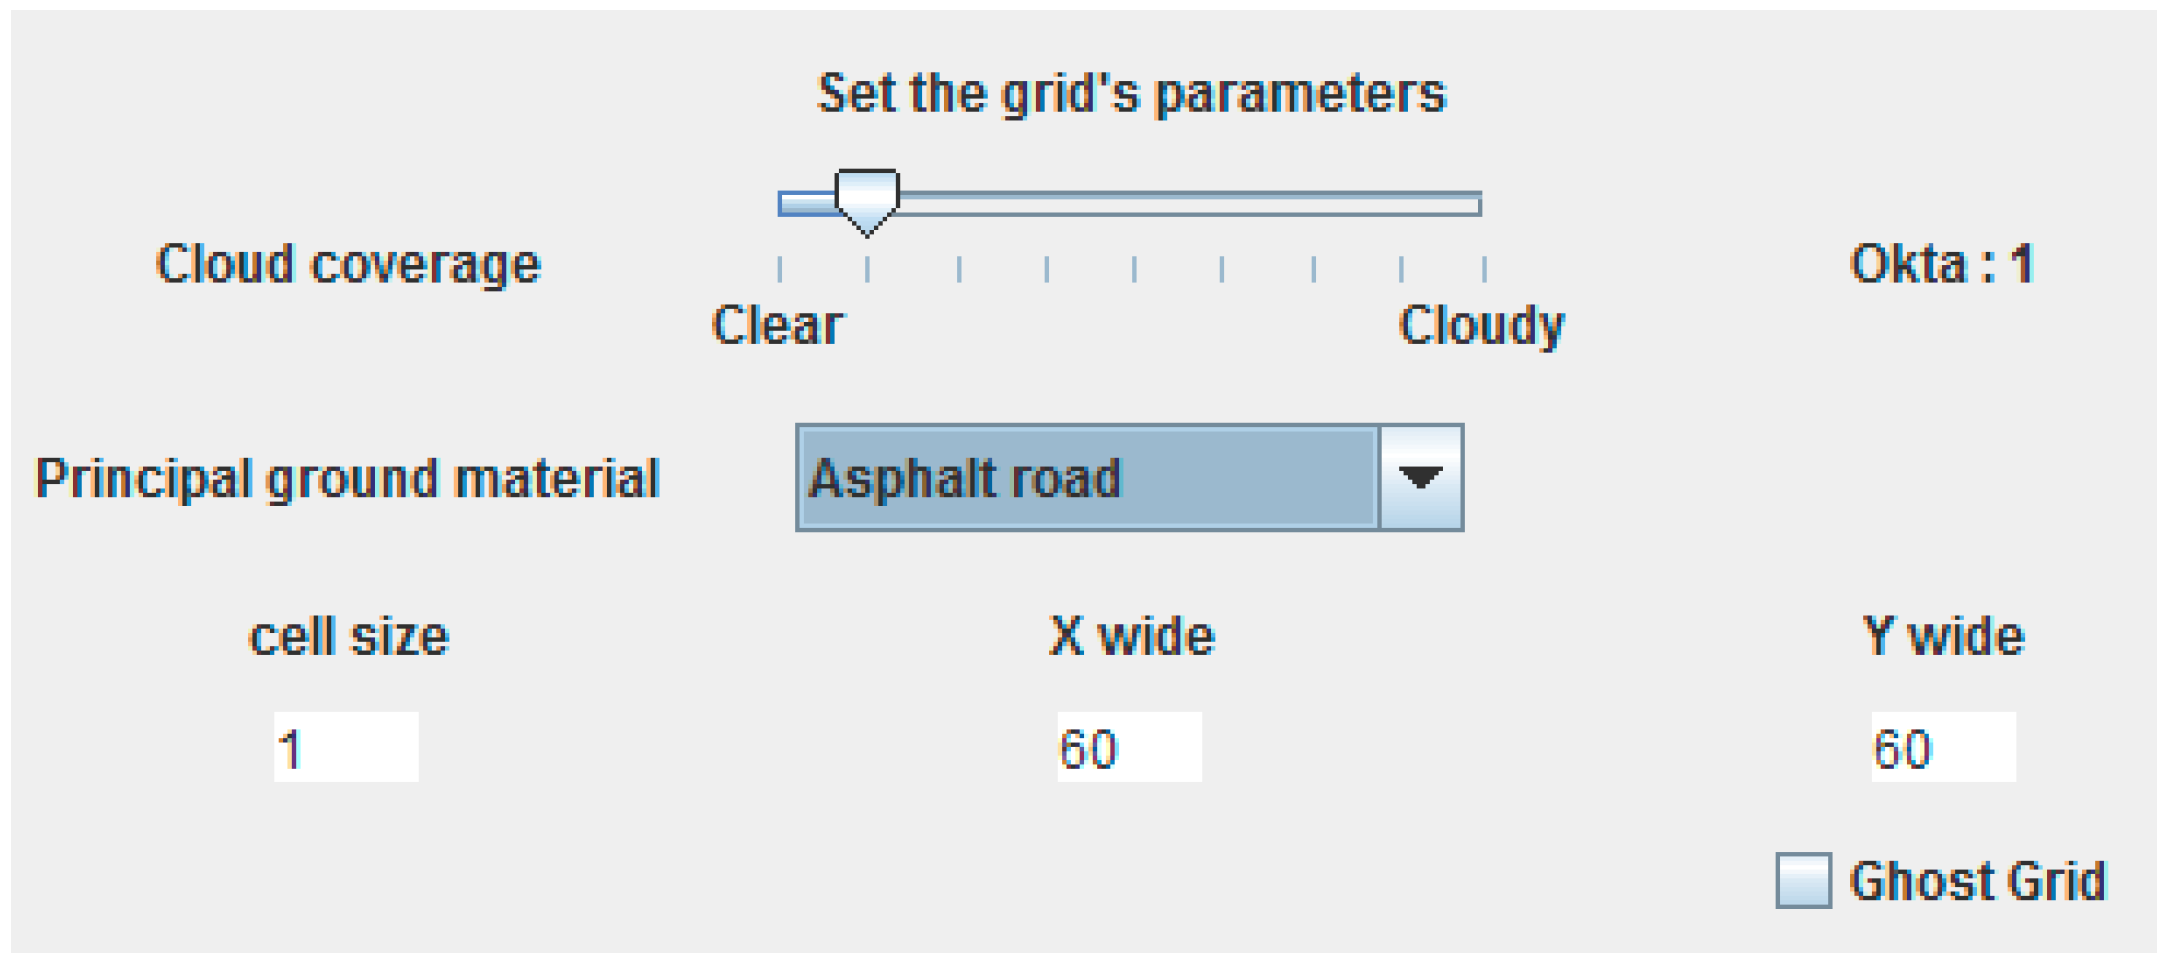
- a dedicated control panel allows the setting of cloud coverage percentage and prevalent ground material, used for the estimation of the reflected component of the light ray;
- (vi)
- analytic grid size (Figure 6).

4. Conclusions
Author Contributions
Conflicts of Interest
References
- Hogan, P.; Gaskins, T. Geographic information processing: Standards-based open source visualization technology for environmental understanding. In GeoSpatial Visual Analytics; de Amicis, R., Stojanovic, R., Conti, G., Eds.; Springer: Dordrecht, The Netherlands, 2009; pp. 357–362. [Google Scholar]
- Bell, D.; Kuehnel, F.; Maxwell, C.; Kim, R.; Kasraie, K.; Gaskins, T.; Hogan, P.; Coughlan, J. NASA WW: Opensource GIS for mission operations. In Proceedings of the 2007 IEEE Aerospace Conference, Big Sky, MT, USA, 3–10 March 2007; Volumes 1–9, pp. 4317–4325.
- Rodríguez, E.; Morris, C.S.; Belz, J.E. A global assessment of the SRTM performance. Photogramm. Eng. Remote Sens. 2006, 7, 249–260. [Google Scholar] [CrossRef]
- Robertson, G.G.; Card, S.K.; Mackinlay, J.D. Information visualization using 3D interactive animation. Commun. ACM 1993, 36, 57–71. [Google Scholar] [CrossRef]
- Hildebrandt, D. A software reference architecture for service-oriented 3D geovisualization systems. ISPRS Int. J. Geo-Inf. 2014, 3, 1445–1490. [Google Scholar] [CrossRef]
- Green, M.A.; Emery, K.; Hishikawa, Y.; Warta, W.; Dunlop, E.D. Solar cell efficiency tables (version 42). Prog. Photovolt. Res. Appl. 2013, 21, 827–837. [Google Scholar] [CrossRef]
- Buriez, J.C.; Bonnel, B.; Fouquart, Y. Theoretical and experimental sensitivity study of the derivation of the solar irradiance at the earth’s surface from satellite data. Beitr. zur Phys. der Atmos. 1986, 59, 263–281. [Google Scholar]
- Gagliano, A.; Patania, F.; Nocera, F.; Capizzi, A.; Galesi, A. GIS-based decision support for solar photovoltaic planning in urban environment. In Smart Innovation, Systems and Technologies; Springer: Heildeberg, Germany, 2013; Volume 22, pp. 865–874. [Google Scholar]
- Rich, P.M.; Barnes, F.J.; Alamos, L.; Weiss, S.B. GIS-based solar radiation flux models. Am. Soc. Photogramm. Remote Sens. Tech. Pap. 1993, 3, 132–143. [Google Scholar]
- Dubayah, R.; Rich, P.M. Topographic solar radiation models for GIS. Int. J. Geogr. Inf. Syst. 1995, 9, 405–419. [Google Scholar] [CrossRef]
- Fu, P.; Rich, P.M. Design and implementation of the solar analyst: An ArcView extension for modeling solar radiation at landscape scales. In Proceedings of the Nineteenth Annual ESRI User Conference, San Diego, CA, USA, 26–30 July 1999; pp. 1–24.
- Neteler, M.; Mitasova, H. Open Source GIS: A GRASS GIS Approach; Springer US: New York, NY, USA, 2008; pp. 1–406. [Google Scholar]
- Hofierka, J.; Šúri, M. The solar radiation model for Open Source GIS: Implementation and applications. In Proceedings of the 2002 Open Source GIS-GRASS Users Conference, Trento, Italy, 11–13 September 2002.
- Hofierka, J. A new GIS-based solar radiation model and its application to photovoltaic assessments. Trans. GIS 2004, 8, 175–190. [Google Scholar] [CrossRef]
- Photovoltaic Geographical Information System (PVGIS). Available online: http://re.jrc.ec.europa.eu/pvgis/ (accessed on 17 December 2014).
- Šúri, M.; Cebecauer, T. SolarGIS: New Web-Based Service Offering Solar Radiation Data and PV Simulation Tools for Europe, North Africa and Middle East. Available online: http://geomodelsolar.eu/_docs/papers/2010/Suri-Cebecauer_SolarGIS_EUROSUN2010.pdf (accessed on 17 December 2014).
- Šúri, M.; Cebecauer, T.; Skoczek, A. SolarGIS: Solar data and online applications for PV planning and performance assessment. In Proceedings of the 26th European Photovoltaics Solar Energy Conference, Hamburg, Germany, 5–8 September 2011.
- Rylatt, M.; Gadsden, S.; Lomas, K. GIS-based decision support for solar energy planning in urban environments. Comput. Environ. Urban Syst. 2001, 25, 579–603. [Google Scholar] [CrossRef]
- Gadsden, S.; Rylatt, M.; Lomas, K.; Robinson, D. Predicting the urban solar fraction: A methodology for energy advisers and planners based on GIS. Energy Build. 2003, 35, 37–48. [Google Scholar] [CrossRef]
- PVsyst. Available online: http://files.pvsyst.com/help/index.html (accessed on 22 April 2015).
- PV*SOL. Available online: http://www.solardesign.co.uk/pv.php (accessed on 22 April 2015).
- Redweik, P.; Catita, C.; Brito, M.C. PV potential estimation using 3D local scale solar radiation model based on urban LIDAR data. In Proceedings of the 26th European Photovoltaic Solar Energy Conference, Hamburg, Germany, 5–9 September 2011; pp. 3–5.
- Erdélyi, R.; Wang, Y.; Guo, W.; Hanna, E.; Colantuono, G. Three-dimensional SOlar RAdiation Model (SORAM) and its application to 3-D urban planning. Sol. Energy 2014, 101, 63–73. [Google Scholar] [CrossRef]
- Ivanova, S.M. 3D analysis of the incident diffuse irradiance on the building’s surfaces in an urban environment. Int. J. Low-Carbon Technol. 2014. [Google Scholar] [CrossRef]
- Hofierka, J.; Zlocha, M. A new 3-D solar radiation model for 3-D city models. Trans. GIS 2012, 16, 681–690. [Google Scholar] [CrossRef]
- Tanaka, T.; Wang, M. Solution of radiative transfer in anisotropic plane-parallel atmosphere. J. Quant. Spectrosc. Radiat. Transf. 2008, 83, 555–577. [Google Scholar] [CrossRef]
- Reda, I.; Andreas, A. Solar position algorithm for solar radiation applications. Sol. Energy 2004, 76, 577–589. [Google Scholar] [CrossRef]
- Grena, R. Five new algorithms for the computation of Sun position from 2010 to 2110. Sol. Energy 2012, 86, 1323–1337. [Google Scholar] [CrossRef]
- Lee, C.-Y.; Chou, P.-C.; Chiang, C.-M.; Lin, C.-F. Sun tracking systems: A review. Sensors 2009, 9, 3875–3890. [Google Scholar] [CrossRef] [PubMed]
- Anderson, B. Solar Energy: Fundamentals in Building Design; McGraw-Hill: New York, NY, USA, 1977. [Google Scholar]
- Omini, G.; Savino, S. La Captazione dell’Energia Solare; CISM-Int Center Mech Sc: Udine, Italy, 2013; pp. 15–73. (In Italian) [Google Scholar]
- Kasten, F.; Czeplak, G. Solar and terrestrial radiation dependent on the amount and type of cloud. Sol. Energy 1980, 24, 177–189. [Google Scholar] [CrossRef]
- ENEA, Atlante Italiano Della Radiazione Solare. Available online: http://www.solaritaly.enea.it/CalcComune/Definizioni.php (accessed on 27 April 2015).
- Allen, R.G.; Trezza, R.; Tasumi, M. Analytical integrated functions for daily solar radiation on slopes. Agric. For. Meteorol. 2006, 139, 55–73. [Google Scholar] [CrossRef]
- Resch, B.; Sagl, G.; Törnros, T.; Bachmaier, A.; Eggers, J.-B.; Herkel, S.; Narmsara, S.; Gündra, H. GIS-based planning and modeling for renewable energy: Challenges and future research avenues. ISPRS Int. J. Geo-Inf. 2014, 3, 662–692. [Google Scholar] [CrossRef]
- Pirotti, F.; Guarnieri, A.; Vettore, A. Collaborative Web-GIS design: A case study for road risk analysis and monitoring. Trans. GIS 2011, 15, 213–226. [Google Scholar] [CrossRef]
- Piragnolo, M.; Pirotti, F.; Guarnieri, A.; Vettore, A.; Salogni, G. Geo-spatial support for assessment of anthropic impact on biodiversity. ISPRS Int. J. Geo-Inf. 2014, 3, 599–618. [Google Scholar] [CrossRef]
© 2015 by the authors; licensee MDPI, Basel, Switzerland. This article is an open access article distributed under the terms and conditions of the Creative Commons Attribution license (http://creativecommons.org/licenses/by/4.0/).
Share and Cite
Piragnolo, M.; Masiero, A.; Fissore, F.; Pirotti, F. Solar Irradiance Modelling with NASA WW GIS Environment. ISPRS Int. J. Geo-Inf. 2015, 4, 711-724. https://doi.org/10.3390/ijgi4020711
Piragnolo M, Masiero A, Fissore F, Pirotti F. Solar Irradiance Modelling with NASA WW GIS Environment. ISPRS International Journal of Geo-Information. 2015; 4(2):711-724. https://doi.org/10.3390/ijgi4020711
Chicago/Turabian StylePiragnolo, Marco, Andrea Masiero, Francesca Fissore, and Francesco Pirotti. 2015. "Solar Irradiance Modelling with NASA WW GIS Environment" ISPRS International Journal of Geo-Information 4, no. 2: 711-724. https://doi.org/10.3390/ijgi4020711
APA StylePiragnolo, M., Masiero, A., Fissore, F., & Pirotti, F. (2015). Solar Irradiance Modelling with NASA WW GIS Environment. ISPRS International Journal of Geo-Information, 4(2), 711-724. https://doi.org/10.3390/ijgi4020711