Article

Spatiotemporal Heterogeneity of Influencing Factors for Urban Spaces Suitable for Running Workouts Based on Multi-Source Big Data

School of Landscape Architecture, Northeast Forestry University, Harbin 150040, China
*
Author to whom correspondence should be addressed.
ISPRS Int. J. Geo-Inf. 2025, 14(9), 366; https://doi.org/10.3390/ijgi14090366
Submission received: 10 July 2025 / Revised: 12 September 2025 / Accepted: 19 September 2025 / Published: 22 September 2025

Abstract

With the growing emphasis on running in urban health initiatives, understanding the spatiotemporal dynamics of running behavior has become essential for smart city development. This study harnesses multi-source big data—including running trajectories, points of interest (POIs), and remote sensing data—to systematically analyze factors influencing running space selection. Through stepwise regression analysis, we identify 16 significant variables encompassing accessibility, diversity, and comfort dimensions. The Geographical and Temporally Weighted Regression (GTWR) model is then employed to uncover distinct spatiotemporal heterogeneity patterns, demonstrating how these factors variably influence running activities across different urban zones and time periods. The methodology and findings contribute to geospatial analysis in urban health studies while providing practical guidance for creating more inclusive, runner-friendly urban environments.

1. Introduction

With the improvement of living standards and the advancement of social development, mental illness and chronic diseases have become significant factors affecting public health [1,2]. The prevalence of sedentary lifestyles and a lack of exercise has weakened immunity and various health issues, including muscle and joint problems [3]. Physical exercise can reduce the incidence of mental and chronic diseases [4,5]. In recent years, the national fitness movement has gained traction, with walking and running emerging as popular and accessible forms of physical activity [6]. Urban planning has increasingly incorporated public health considerations as guiding principles for city development. The introduction of various sports apps has made exercise trajectories more scientific and efficient. As essential components of residents’ lives, urban built spaces significantly influence daily lifestyles [7]. It is crucial to enhance the planning of sports facilities and health-oriented spaces in cities [8] to promote national fitness initiatives and help achieve the goal of universal health [9]. This paper explores the characteristics of existing walking and running paths to identify residents’ preferences and needs regarding sports spaces. The findings aim to facilitate the rational use of urban resources and encourage the integration of spatial science with health science. Ultimately, this research can provide data support to help relevant departments create more scientifically sound urban health policies, foster a healthy urban environment, and promote the overall well-being of cities, offering valuable insights for the planning of urban sports spaces.

2. Literature View

2.1. Sports and Health

Research on the relationship between urban environments and physical activity began in developed countries during the 1980s and 1990s. In 1996, a report by the Director of the U.S. Health Bureau emphasized the strong connection between urban residents’ health and outdoor, low-intensity physical activities, noting the influence of subjective perception, environmental psychology, and other psychosocial factors on physical activity levels [10]. Special issues exploring the links between the built environment, physical activity, and health were published in the American Journal of Public Health and the American Journal of Health Promotion in 2003, marking a turning point in public health research [11,12]. Around the same time, Shanghai introduced its Three-Year Action Plan for Building a Healthy City (2003–2005), emphasizing the creation of a health-supportive environment and promotion of physical activity [13]. In 2005, the U.S. Centers for Disease Control and Prevention initiated studies on physical activity patterns, culminating in the 2008 Report of the Committee on Recommended Guidelines for Physical Activity [14] and the Physical Activity Guidelines for Americans [15]. More recently, SmartAsset’s annual evaluation report, “The Most Convenient Cities in the United States,” streamlined its metrics from eight indicators in 2019 to six in 2021, stimulating further research into factors influencing physical activity behavior [16]. National policy initiatives have also played a key role: in 2016, the State Council of China released the Healthy China 2030 Plan, which established goals for fitness infrastructure, physical activity promotion, and tailored exercise programs for specific populations [17]. The subsequent Healthy China Initiative (2019–2030) incorporated national fitness metrics as core objectives, advocating for expanded fitness facilities and increased per capita length of urban jogging trails [18]. With advances in intelligent technology and big data, smart running products have proliferated [19], enabling more scientific and digitalized methods for recording physical activity and measuring environmental variables.

2.2. Running and the Built Environment

Research on physical activity and the built environment has a long history, with running emerging as a key area of interest as public health awareness has grown. Early studies were largely qualitative, relying on exercise trajectory annotation, surveys, and interviews to understand athletes’ preferences. From an urban design standpoint, studies have indicated that local road network characteristics influence jogging behavior among adults, with road density showing a positive correlation with jogging frequency—particularly in less urbanized areas [20]. Questionnaire-based studies and multilevel modeling have further revealed correlations between jogging behavior and built environment features, notably the presence of community green spaces and open areas [16].
The advent of big data has transformed research methodologies. Data from fitness applications and GPS devices now enable detailed analysis of movement patterns and trajectories, overcoming many limitations of traditional survey-based approaches [21]. Integration of questionnaire responses with GPS tracking data has allowed researchers to infer travel behaviors of gym users and evaluate public space infrastructure [22]. Multi-source big data have introduced new paradigms for studying running behavior, capturing both temporal and spatial variations and laying a methodological foundation for quantitative assessments of jogging space suitability. For example, a study combining GPS trajectories and social media data found that urban park jogging streams have distinct spatio-temporal clustering characteristics [20]. In Chinese cities such as Chengdu and Guangzhou, multi-source geographic data and spatial modeling have been used to examine how environmental variables affect the frequency of outdoor jogging [23,24]. Techniques including random forest and geographically weighted regression have been applied in Beijing to analyze nonlinear and spatially varying relationships, underscoring the role of spatial heterogeneity in shaping running behavior [25,26].

2.3. Suitable Running Space and Methodological Considerations

The concept of suitable running space has gained significant attention in urban planning and health research, with a focus on creating safe, convenient, and enjoyable environments for runners. The key factor influencing residents’ choice of suitable running spaces is environmental design, which encompasses features such as running paths, green spaces, trails, and public facilities. It has been shown that environmental accessibility directly affects the frequency and choice of running routes, and that easily accessible open spaces and green areas can significantly promote physical activity behavior [27]. In addition, environmental quality dimensions such as green coverage and landscape quality have also been shown to have a significant impact on running experience and health benefits [28]. Places with a positive social atmosphere also enhance runners’ engagement and exercise stickiness, further promoting their physical activity levels [29].
The concept of suitable running space has garnered increasing attention in urban planning and public health, emphasizing the need to create safe, accessible, and enjoyable environments for runners. Key factors influencing route selection include environmental design attributes such as running paths, green spaces, trails, and public facilities. Studies confirm that accessibility to such spaces directly affects running frequency and route choice [27], while environmental quality—including greenery coverage and landscape aesthetics—significantly influences both experience and health outcomes [28]. Social aspects, such as a sense of community and perceived safety, further improve engagement and adherence to running routines [29]. An ideal running space should offer diverse route options to accommodate varying preferences and abilities, with evidence indicating that path and landscape variety increase physical activity appeal and enjoyment [30]. This study defines “running suitable space” as one that effectively supports runners’ needs, facilitating a dynamic coupling between humans, the environment, and health.
Most previous studies have relied on questionnaires and interviews to capture runners’ subjective perceptions of safety, comfort, and aesthetics. These data are sometimes combined with mobile tracking data to identify frequented routes and activity hotspots, and to quantify built environment impacts on running suitability. While valuable, such approaches often overlook underlying spatial and temporal non-stationarity. For example, conventional global regression models assume spatial homogeneity, thereby masking local variations in factor influences. Alternative approaches such as bivariate statistical models and geostatistical methods. For example, traditional global regression models assume spatial homogeneity, thereby masking local variations in factor effects. Methods such as spatial autocorrelation analyses can reveal spatial dependencies and patterns, but often fail to incorporate temporal dynamics or to deal effectively with multiscale heterogeneity.
In this study, we employ a Geographically and Temporally Weighted Regression (GTWR) model to analyze the spatiotemporal influences of 16 environmental factors on running density. Unlike global models or purely spatial techniques, GTWR captures both spatial and temporal heterogeneity, allowing regression coefficients to vary across space and time. This is particularly relevant for running behavior, which exhibits strong diurnal, restday-weekend, and seasonal variations. GTWR supports a more nuanced, process-oriented understanding of how environmental factors operate within specific spatial and temporal contexts. From a procedural standpoint, this approach improves contextual accuracy and policy relevance, enabling targeted, locale-specific interventions. Thus, by integrating multi-source spatiotemporal behavioral and environmental data within a GTWR framework, this study offers a methodologically robust and spatially explicit foundation for assessing and planning suitable spaces for running.

3. Materials and Methods

3.1. Study Area

This study focuses on Harbin, the capital of Heilongjiang Province, China. Specifically, the research area is centered around the Third Ring Road of Harbin, covering the districts of Nangang, Xiangfang, Daoli, Daowai, and parts of Songbei District (Figure 1). This area encompasses vital commercial, cultural, and residential zones and serves as the central hub for daily life in the city [31,32]. It also represents a core area of Harbin with a high frequency of running routes, making it an ideal location for the study.
The data collection focused on the month of August 2024, which is more suitable for outdoor running than the typical harsh winter climate in Harbin [33], and the temperature difference between Harbin and other cities in China is the smallest in August. Therefore, choosing this time period ensures that the data are representative and of general significance for the study of suitable running spaces.

3.2. Analytical Framework

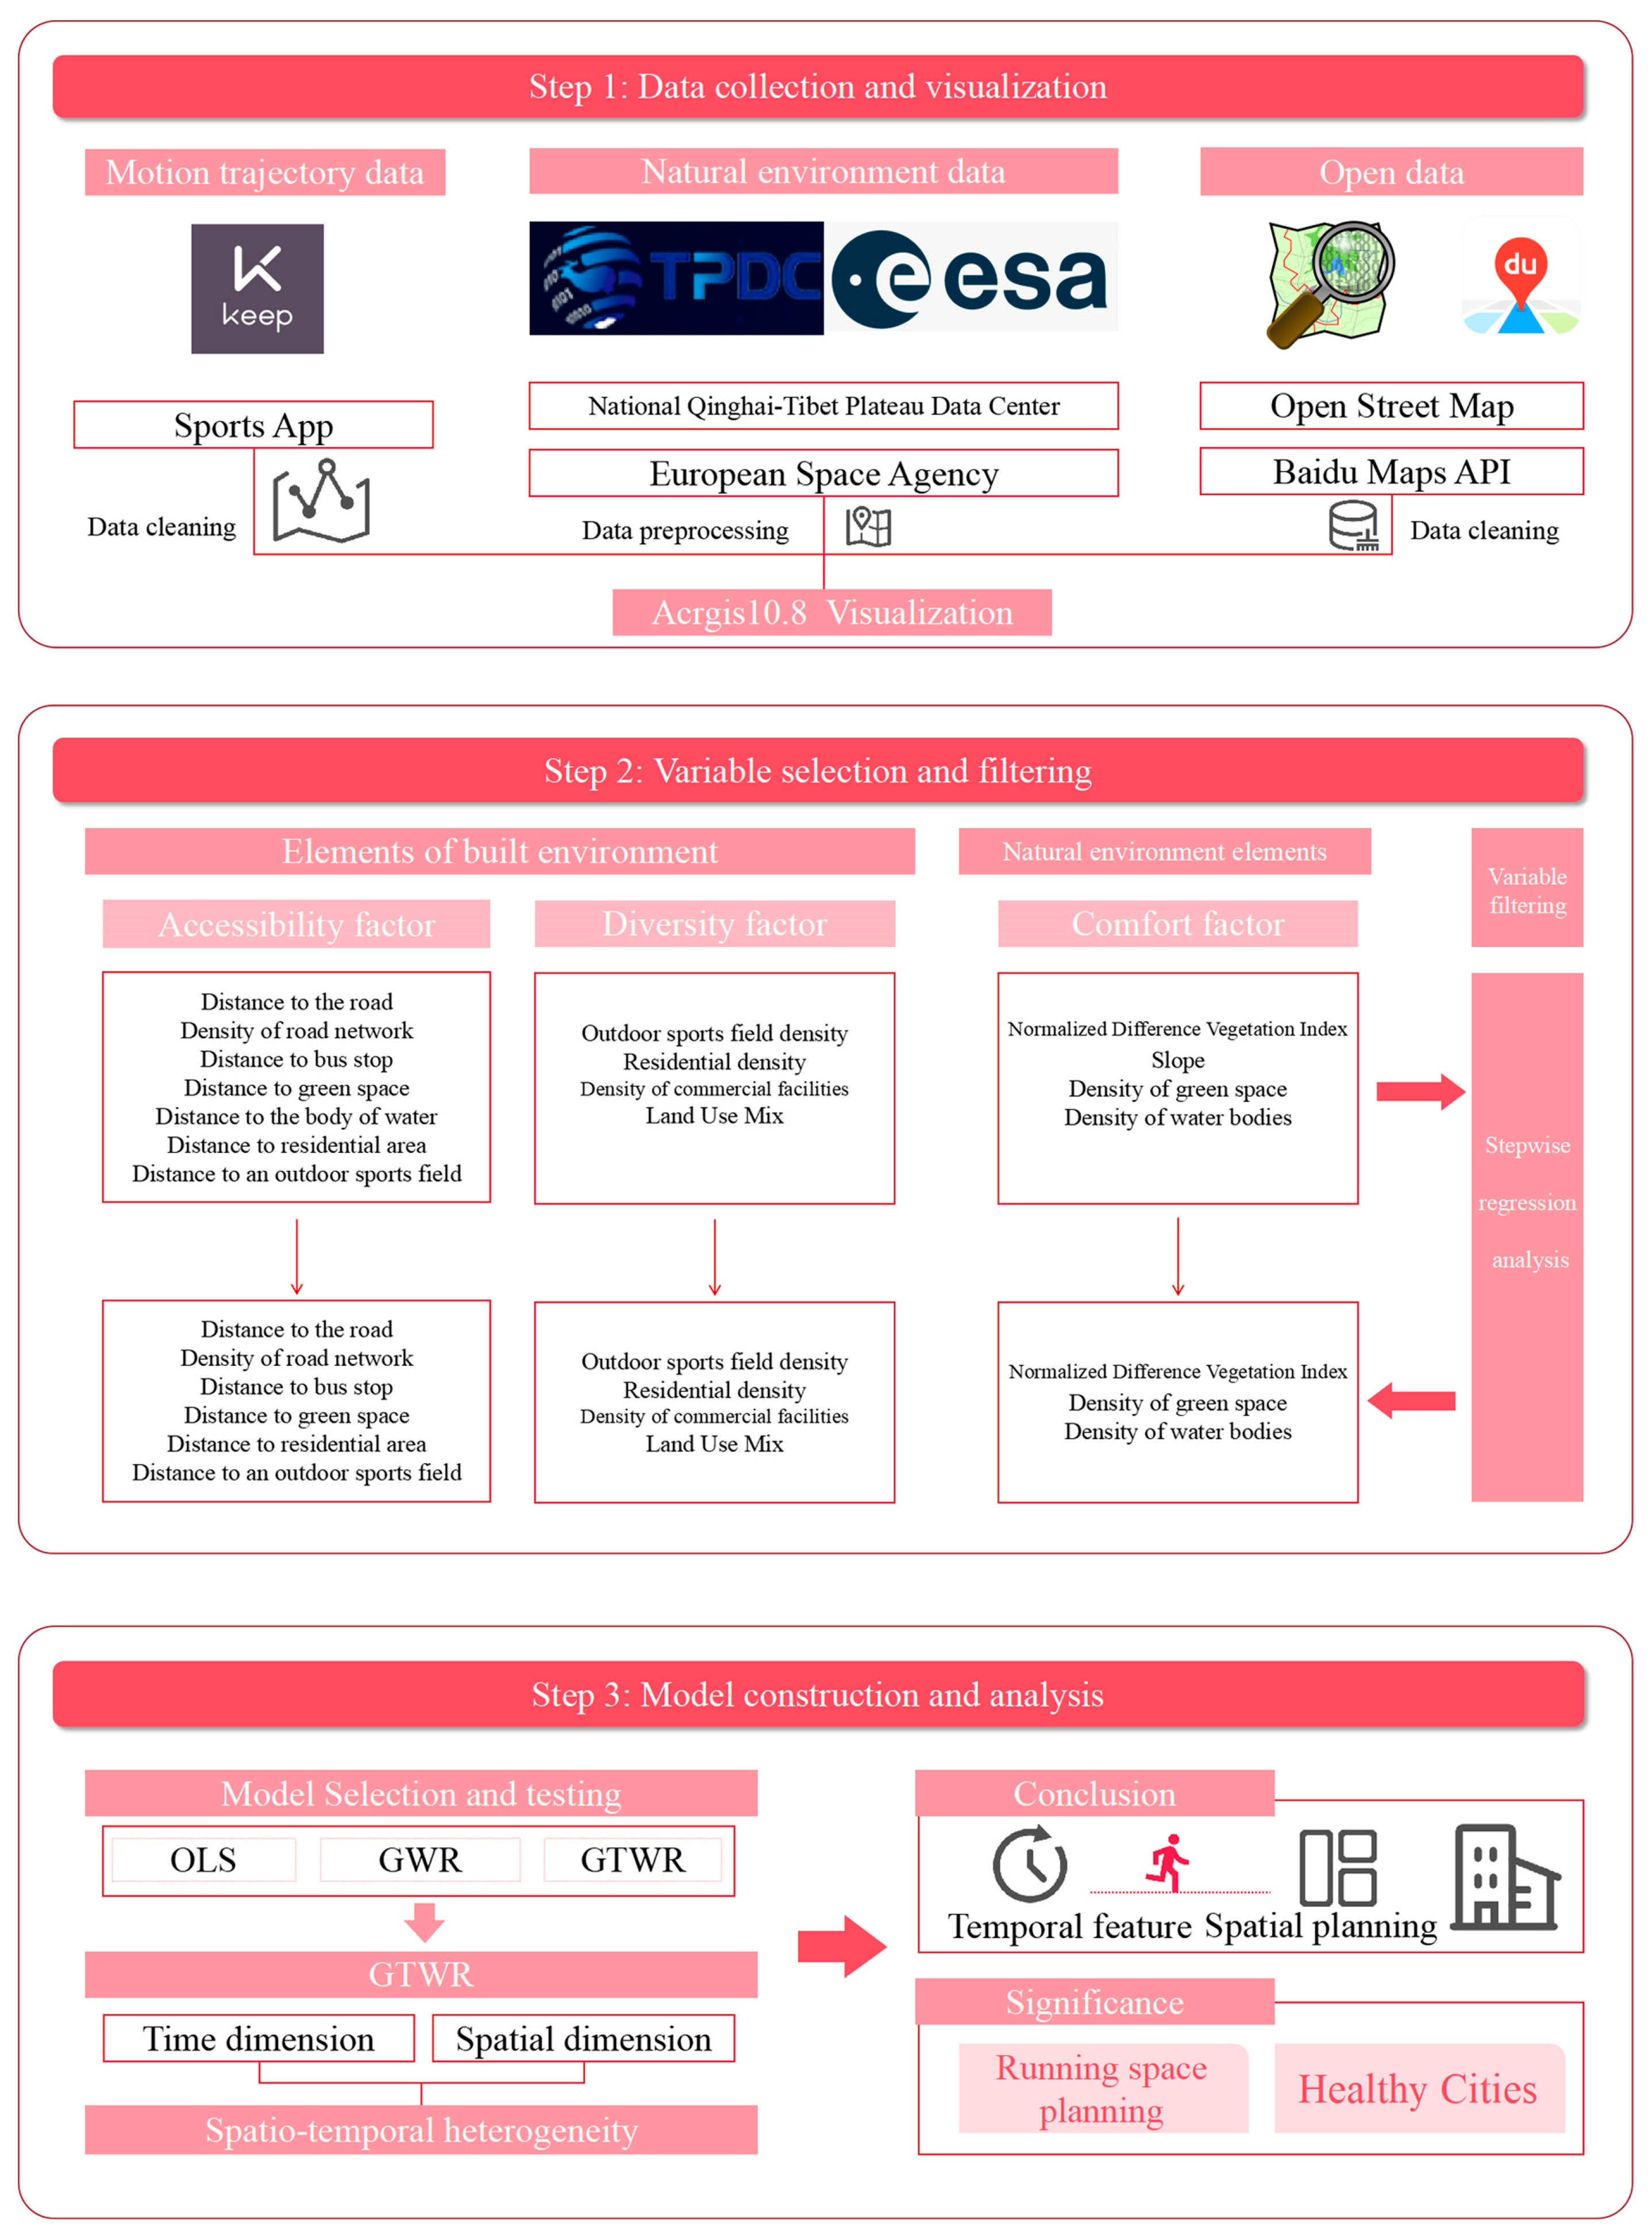
The framework and technical workflow of this study (Figure 2) consist of three main stages: data collection and visualization, variable selection and screening, and model selection and analysis.
Firstly, running trajectory data were obtained from China’s sports application, remote sensing data were obtained from various geospatial sources, including NDVI and slope data, and built environment data were obtained from Baidu Maps API and Open Street Map. These datasets were subsequently processed and visualized.
Second, the collected environmental data were categorized into three major factors: accessibility, diversity, and comfort. Based on the characteristics of the study area, a total of 15 secondary explanatory variables were identified. To address multicollinearity issues and identify the most relevant variables, a stepwise regression analysis was employed, which reduced the number of secondary explanatory variables to 13.
Finally, after evaluating model performance, the Generalized Temporal Weighted Regression (GTWR) model was chosen for the analysis. The GTWR model was preferred over OLS (Ordinary Least Squares) and GWR (Geographically Weighted Regression) models due to its superior fit and ability to handle spatio-temporal heterogeneity in running trajectories. This model was used to understand the varying influences of different factors on running activity over time and space. The results from the analysis were used to develop recommendations for improving running spaces and urban sports environments to promote healthier living.

3.3. Data

3.3.1. Running Trajectory Data

Following a comprehensive review and comparison of existing mainstream sports applications, the application version 8.3.10 of Keep was selected as the data collection platform. Running trajectories within Harbin City for August 2024 were collected using “Harbin” as the search keyword. The dataset includes movement length, distance, activity type, temporal information, latitude, longitude, and other relevant parameters.
Data acquisition was performed through the platform’s analysis interface complemented by decompilation tools. The raw data were restructured into the specific format required for experimental analysis. Following data cleaning and processing, a total of 4305 trajectories comprising 1,631,680 trajectory points were initially obtained.
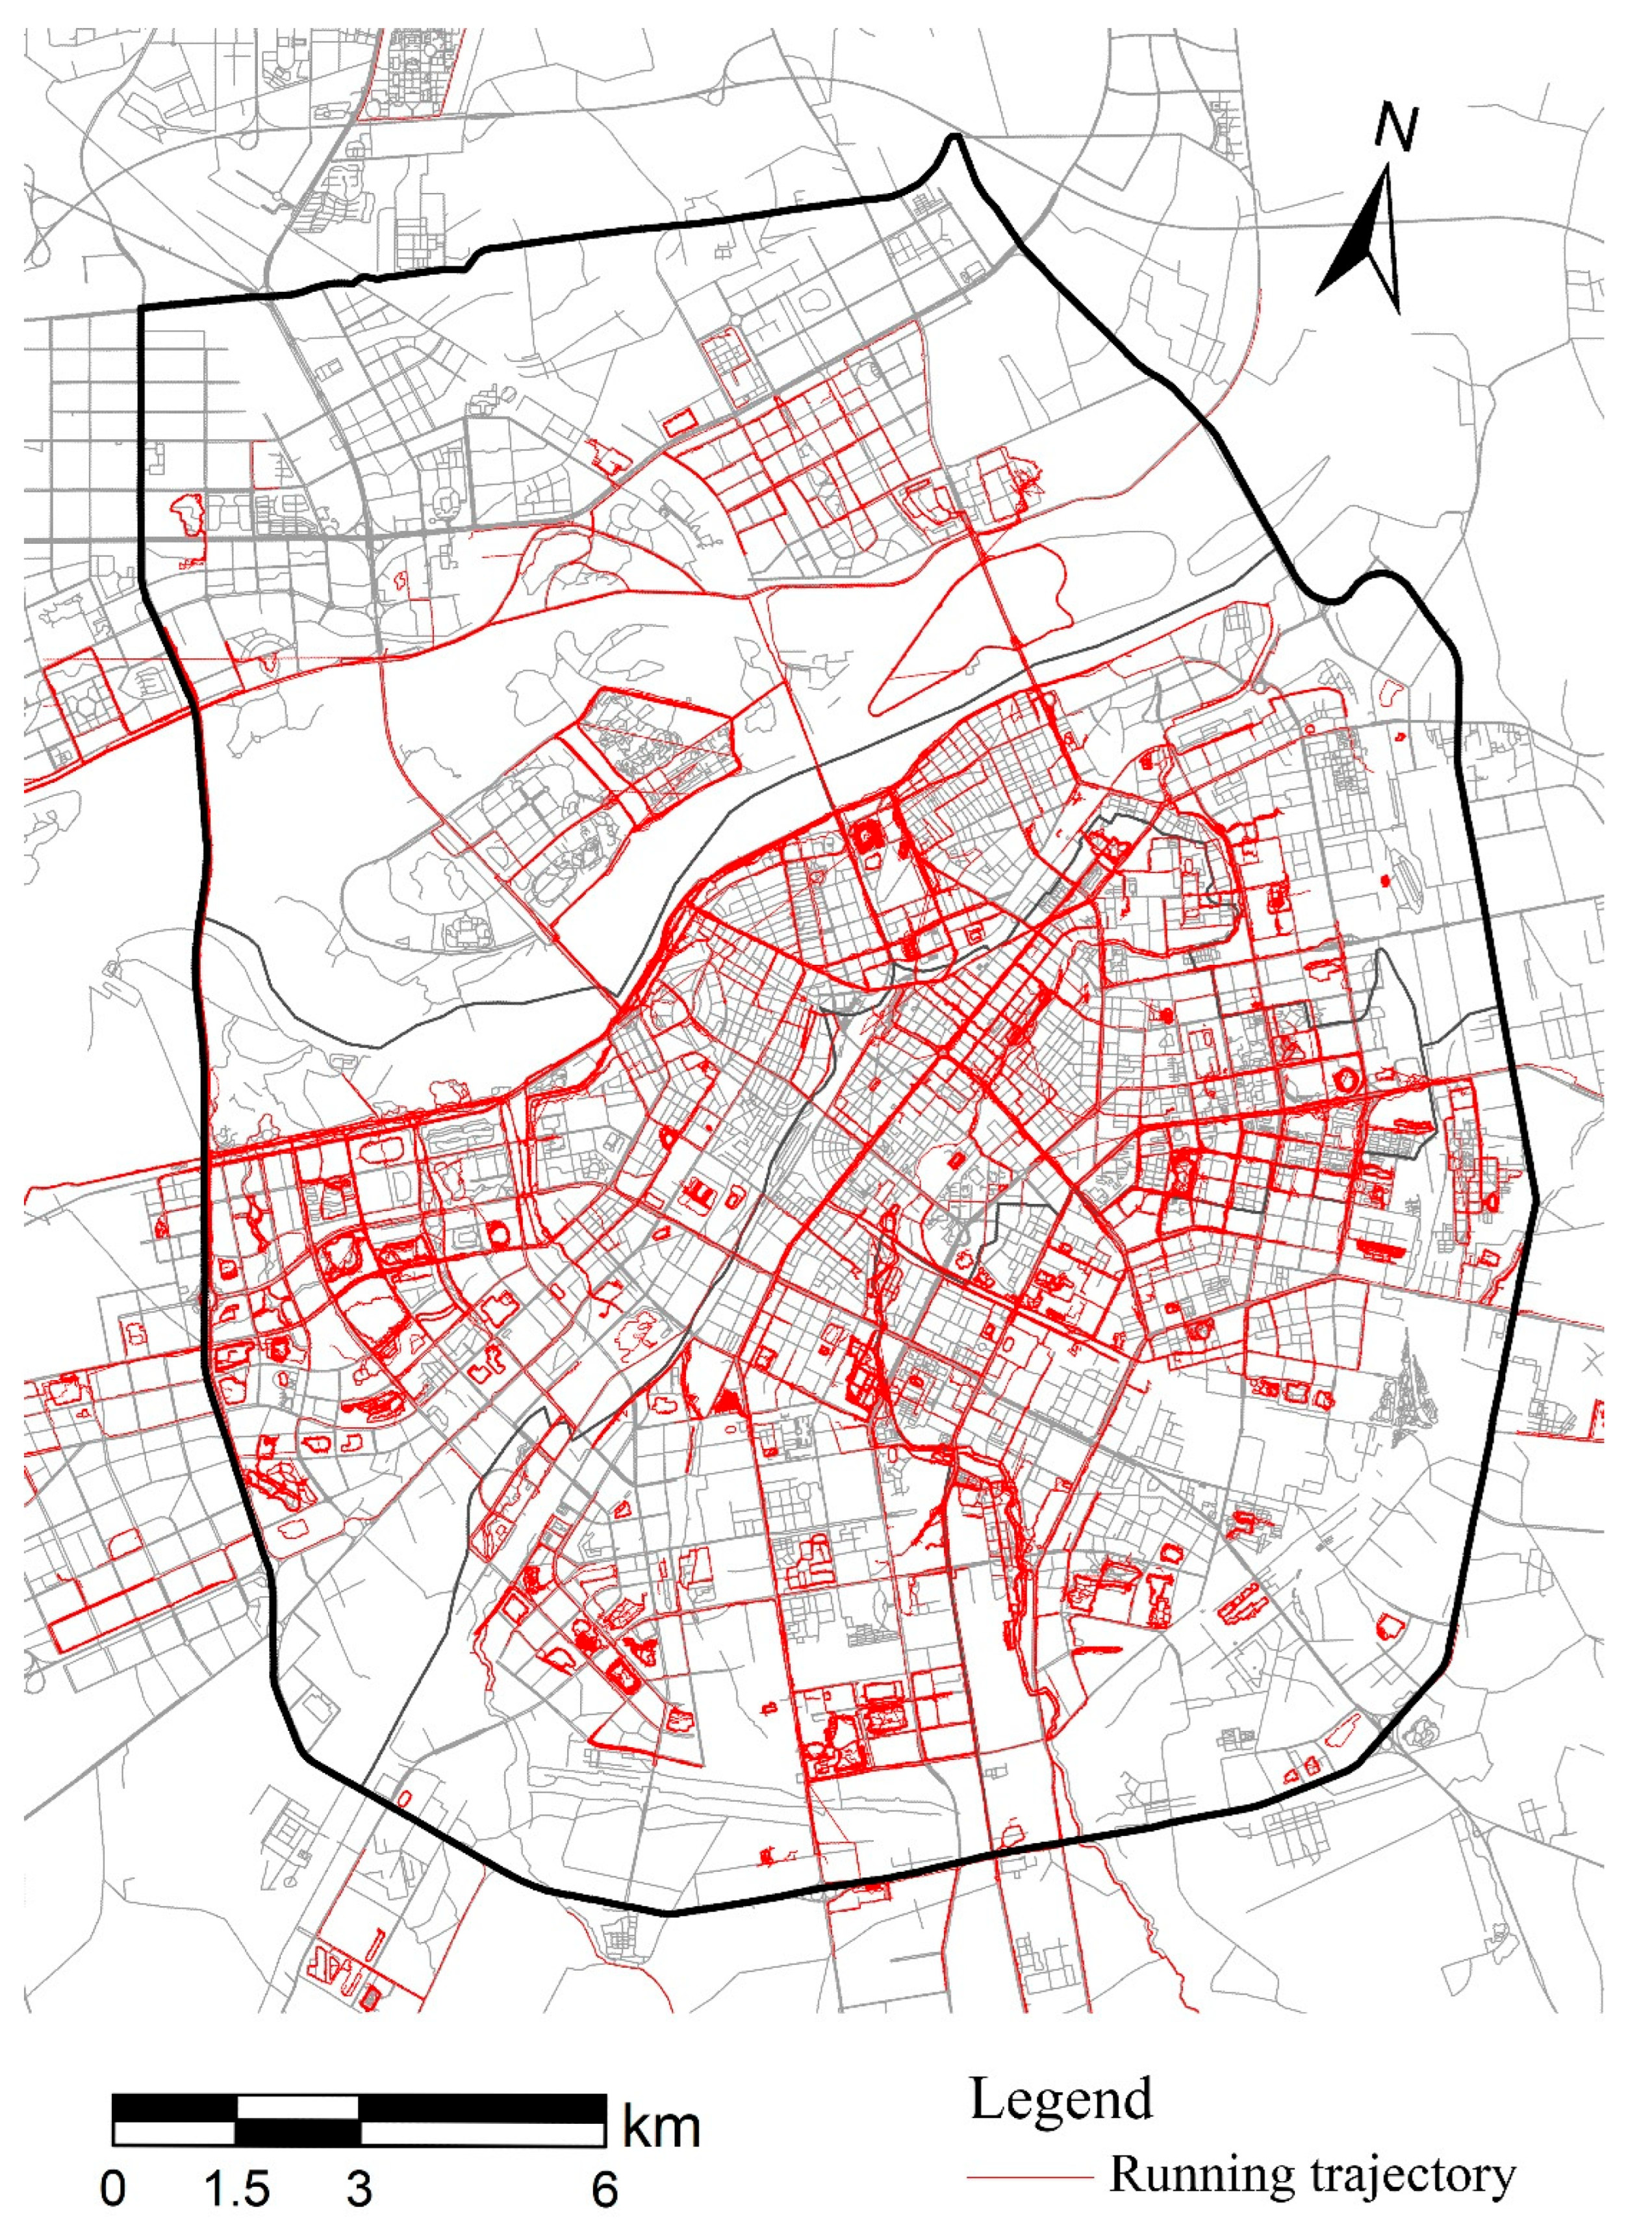
The processed data were imported into ArcGIS 10.8 for visualization and spatially cropped according to the study area boundaries. The final dataset consisted of 3323 running trajectories and 1,317,631 trajectory points within Harbin’s Third Ring Road area for the specified study period (Figure 3).

3.3.2. Natural Environment Data

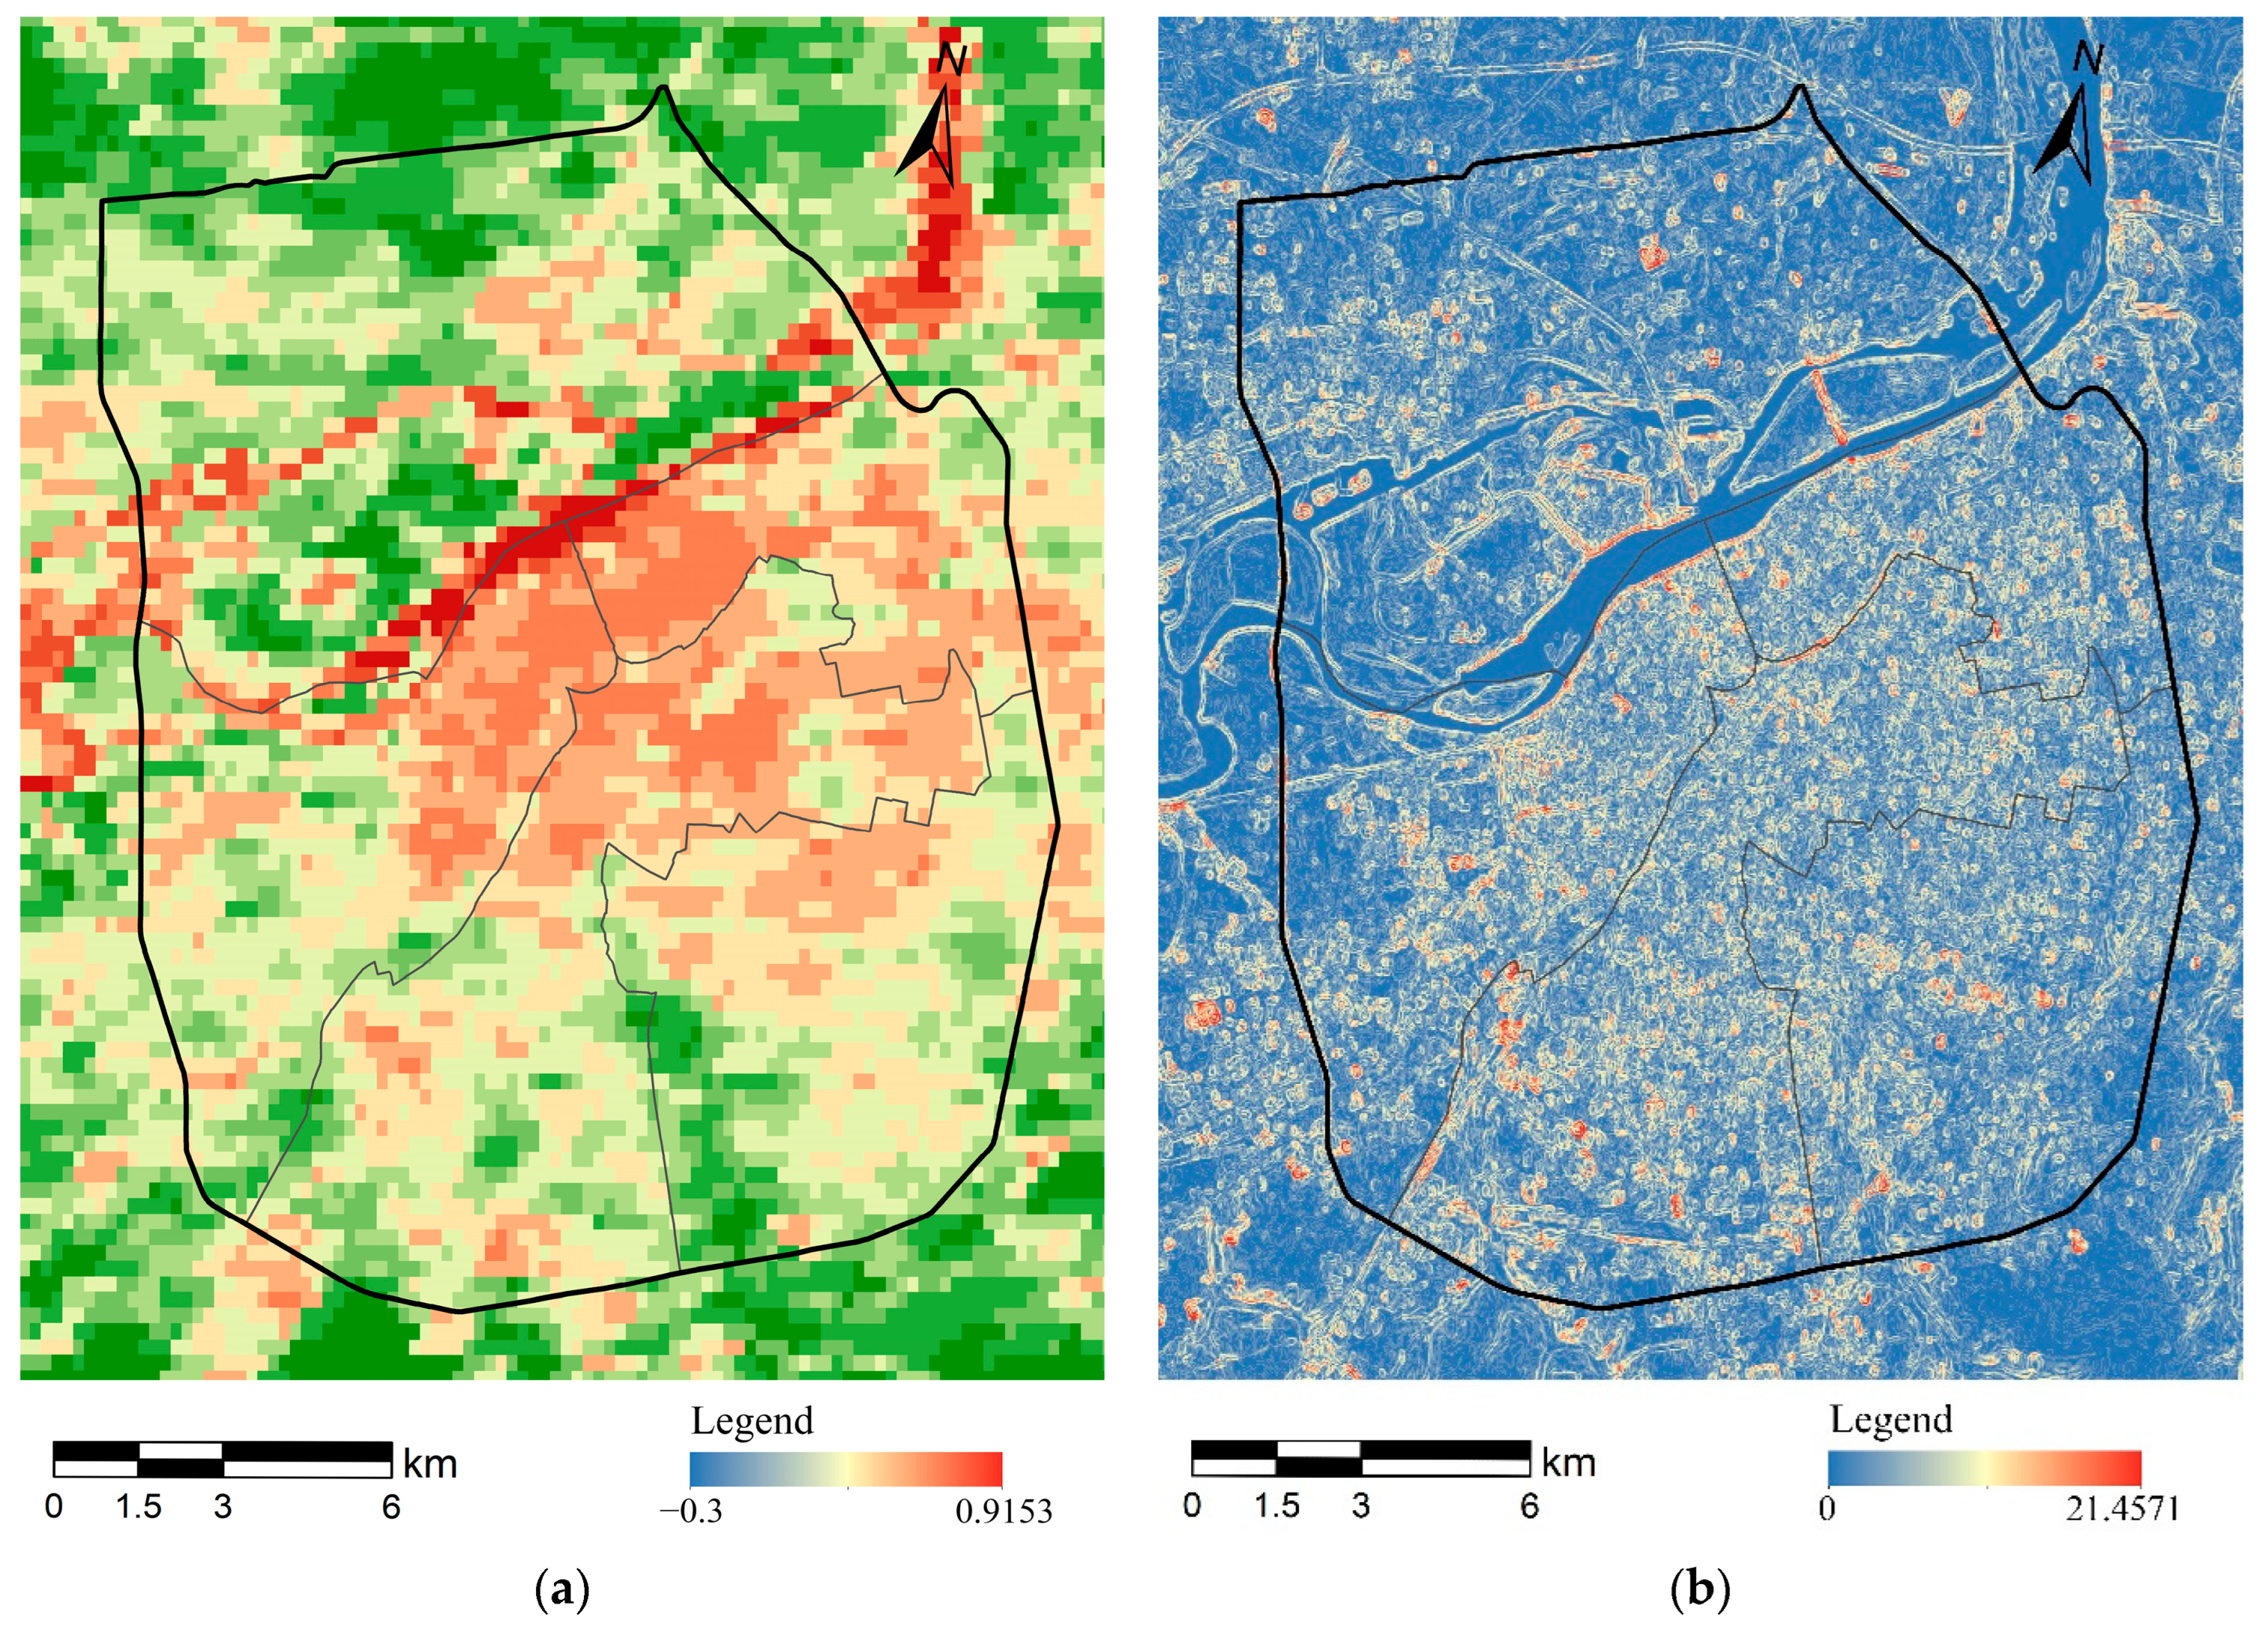
The Normalized Difference Vegetation Index (NDVI) data are obtained from the National Scientific Data Center for the Tibetan Plateau (https://data.tpdc.ac.cn, accessed on 15 on August 2023) with a spatial resolution of 250 m [34]. The raw data were downloaded from the official website and normalized to obtain values ranging from −0.2 to 1, with a single value of −0.3 as a missing filler value. This index can be used to qualitatively and quantitatively evaluate the vegetation cover and its growth vitality, and is an indicator of the density and health of vegetation, reflecting the land cover and vegetation status, which provides valuable information for understanding the natural environment of Harbin (Figure 4a).
Slope data were obtained from the European Space Agency’s Copernicus DEM (https://panda.copernicus.eu/panda, accessed on 16 August 2022), processed to derive terrain gradients. The Copernicus DEM products, with a 30 m grid spacing, were used to create a slope terrain index, which accurately reflects the topography of the study area [35] (Figure 4b).

3.3.3. Other Data

Other data refers mainly to data that reflect the built environment, which includes road network data, POI data and AOI data. These data are obtained from the Open Map Street View. Road network data includes all levels of the road network, which can reflect the distribution of roads and thus conduct related research. POI data (Point of Interest) refers to any location with specific significance on the map (Figure 5a), AOI data (Area of Interest) refers to the surface of interest in the Internet e-map ., which also contains four basic information, and is mainly used to express the following in maps area-like geographic entities with better expressive power, better computational power, and better stability(Figure 5b). In this paper, the AOI and POI data related to the impact elements are extracted including outdoor sports facilities, residential areas, green spaces, water systems and other related data. From this, the quantitative index of built environment can be obtained, which well reflects the condition of the venue in terms of built environment [36].

3.4. Variable Selection

3.4.1. Dependent Variable

The dependent variable in this study is the density of each running trajectory, which serves as an indicator of the frequency with which residents select specific exercise locations. The calculation process involved three main steps: First, the density of trajectory line elements within the neighborhood of each output raster cell was computed. Second, the line density values at all trajectory points were extracted. Finally, the average of these density values across all points belonging to each trajectory was calculated, resulting in the final trajectory density measure.

3.4.2. Explanatory Variables

In this study, explanatory variables are categorized into built environment elements and natural environment elements. Based on Cervero [37] and Kirkman’s 5D theory [38], the built environment is subdivided into accessibility elements and diversity elements. The natural environment is regarded as an amenity factor (Table 1).
Accessibility factors primarily focus on their potential influence on runners’ route selection [39]. Runners generally exhibit a preference for linear and circular routes. Linear routes typically include paths along roadways, water bodies, and linear parks [40]. The distance to various road types reflects runners’ preferences regarding road safety and overall experience [41]. Proximity to roads, water bodies, green spaces, and outdoor sports facilities helps evaluate runners’ environmental preferences during linear movement activities [42].
Given that different road classes serve distinct functions and consequently affect runners’ route selection differently, we categorized road proximity into four hierarchical levels for separate analysis: distance to expressways, arterial roads, secondary arterial roads, and branch roads. The distance between exercise venues and residential areas reflects their spatial relationship with residential locations [43], while proximity to public transportation stations indicates the venue’s transportation accessibility [44].
This study employed nearest neighbor analysis to calculate minimum distances. Specifically, we measured the nearest distance of each trajectory point to various POIs, AOIs, and roads at all levels, including public transportation stops, residential areas, water bodies and green spaces, and roads at all levels. The average nearest neighbor distance of each trajectory point was then calculated as the final proximity metric. In this study, we used nearest neighbor analysis to calculate the minimum distance.
Diversity [45] and comfort [46] factors are primarily used to examine the characteristics that make exercise venues more appealing to exercisers. Typically, exercise locations are fixed, and exercisers have specific environmental demands . The degree of land-use mix, represented by the Shannon Diversity Index (SHDI), evaluates the diversity and distribution of various types of POIs , thus analyzing the land-use characteristics of sports areas. The SHDI is calculated as follows:
S H D I = i = 1 m p i × l n p i
where SHDI represents diversity, p i is the ratio of the number of type i to the total number of POIs, and m is the total number of POI types. The higher the SHDI value, the greater the degree of land-use mixing. The density of residential areas in proximity to the trajectory can be used to explore the relationship between residents’ choice of sports locations and their residential areas. Similarly, the density of commercial facilities can examine the relationship between sports locations and the economic vitality of the area, while the density of outdoor sports venues can highlight the connection between residents’ exercise preferences and the availability of professional sports facilities.
The Normalized Difference Vegetation Index (NDVI) serves as an effective indicator of land cover and vegetation health. A higher NDVI value indicates more abundant and healthy vegetation. NDVI can be used to assess residents’ preferences for the level of greening at exercise venues [47]. Additionally, slope data can indicate residents’ preferences for the smoothness of the terrain during walking or running [48]. The density of water bodies and green spaces provides insights into residents’ preferences for the type of natural environment at sports venues [49].

3.5. Research Methods

3.5.1. Stepwise Regression Method

In actual analysis, exploratory research often requires studying the relationship between multiple independent variables and dependent variables. These variables may exhibit various interconnections, and models can be affected by multicollinearity [50]. To improve analysis efficiency, stepwise regression is frequently used for multiple linear regression analysis. This method gradually introduces independent variables that significantly impact the dependent variable, while eliminating irrelevant ones. It also checks for multicollinearity and corrects it to some extent, allowing for a more accurate representation of the relationship between the independent and dependent variables.

3.5.2. Geographically and Temporally Weighted Regression (GTWR)

In this study, stepwise regression is first employed to reduce multicollinearity by retaining only significant variables. The resulting model is then analyzed using the GTWR method to reveal the spatiotemporal heterogeneity of running movements and their influencing factors.
The regression parameters of independent variables in the Geographically Weighted Regression (GWR) model vary depending on spatial location. In contrast, the regression parameters in the GTWR model change with both spatial and temporal locations. In the GTWR model, a spatiotemporal coordinate system is defined to calculate the distance between two data points, measuring their proximity [51]. As a result, compared to the GWR model, the GTWR model offers a more comprehensive approach to describing the spatiotemporal relationship between explanatory variables and dependent variables. The basic expression of the GTWR model is shown as follows [52]:
y i = β 0 u i , v i , t i + k β k u i , v i , t i X i k + ε i
Here, ( u i , v i ) represents the latitude and longitude coordinates of the i th sample point, t i represents the observation time, y i represents the dependent variable value of the i th sample point, and X i k represents the k th explanatory variable of the i th sample point. Is the model error term, β 0 ( u i , v i , t i ) represents the regression constant of the i th sample point, and β k ( u i , v i , t i ) represents the regression coefficient of the k th explanatory variable of the i th sample point. The regression coefficients of GTWR are estimated based on the locally weighted least squares method, and the expression for the estimated regression coefficients is as follows [52]:
β ^ u i , v i , t i = X T W u i , v i , t i X 1 X T W u i , v i , t i Y
where the W u i , v i , t i space-time weight matrix is an n × n diagonal matrix, = W u i , v i , t i = diag (Wi1, Wi2…Wij…Win). W i j (1 ≤ jn) is the spatiotemporal distance attenuation function, calculated as follows [53]:
W i j = e x p d i j S T 2 h 2
where is the spatiotemporal distance between the trajectory line and, calculated and publicized as follows d i j S T [52]:
d i j S T = λ u i u j 2 + v i v j 2 + μ t i t j 2
where and µ is the weight that balances the different effects since spatial distance and time are measured in different units.

4. Results

4.1. Descriptive Statistics and Analysis

4.1.1. Spatial Morphology Analysis

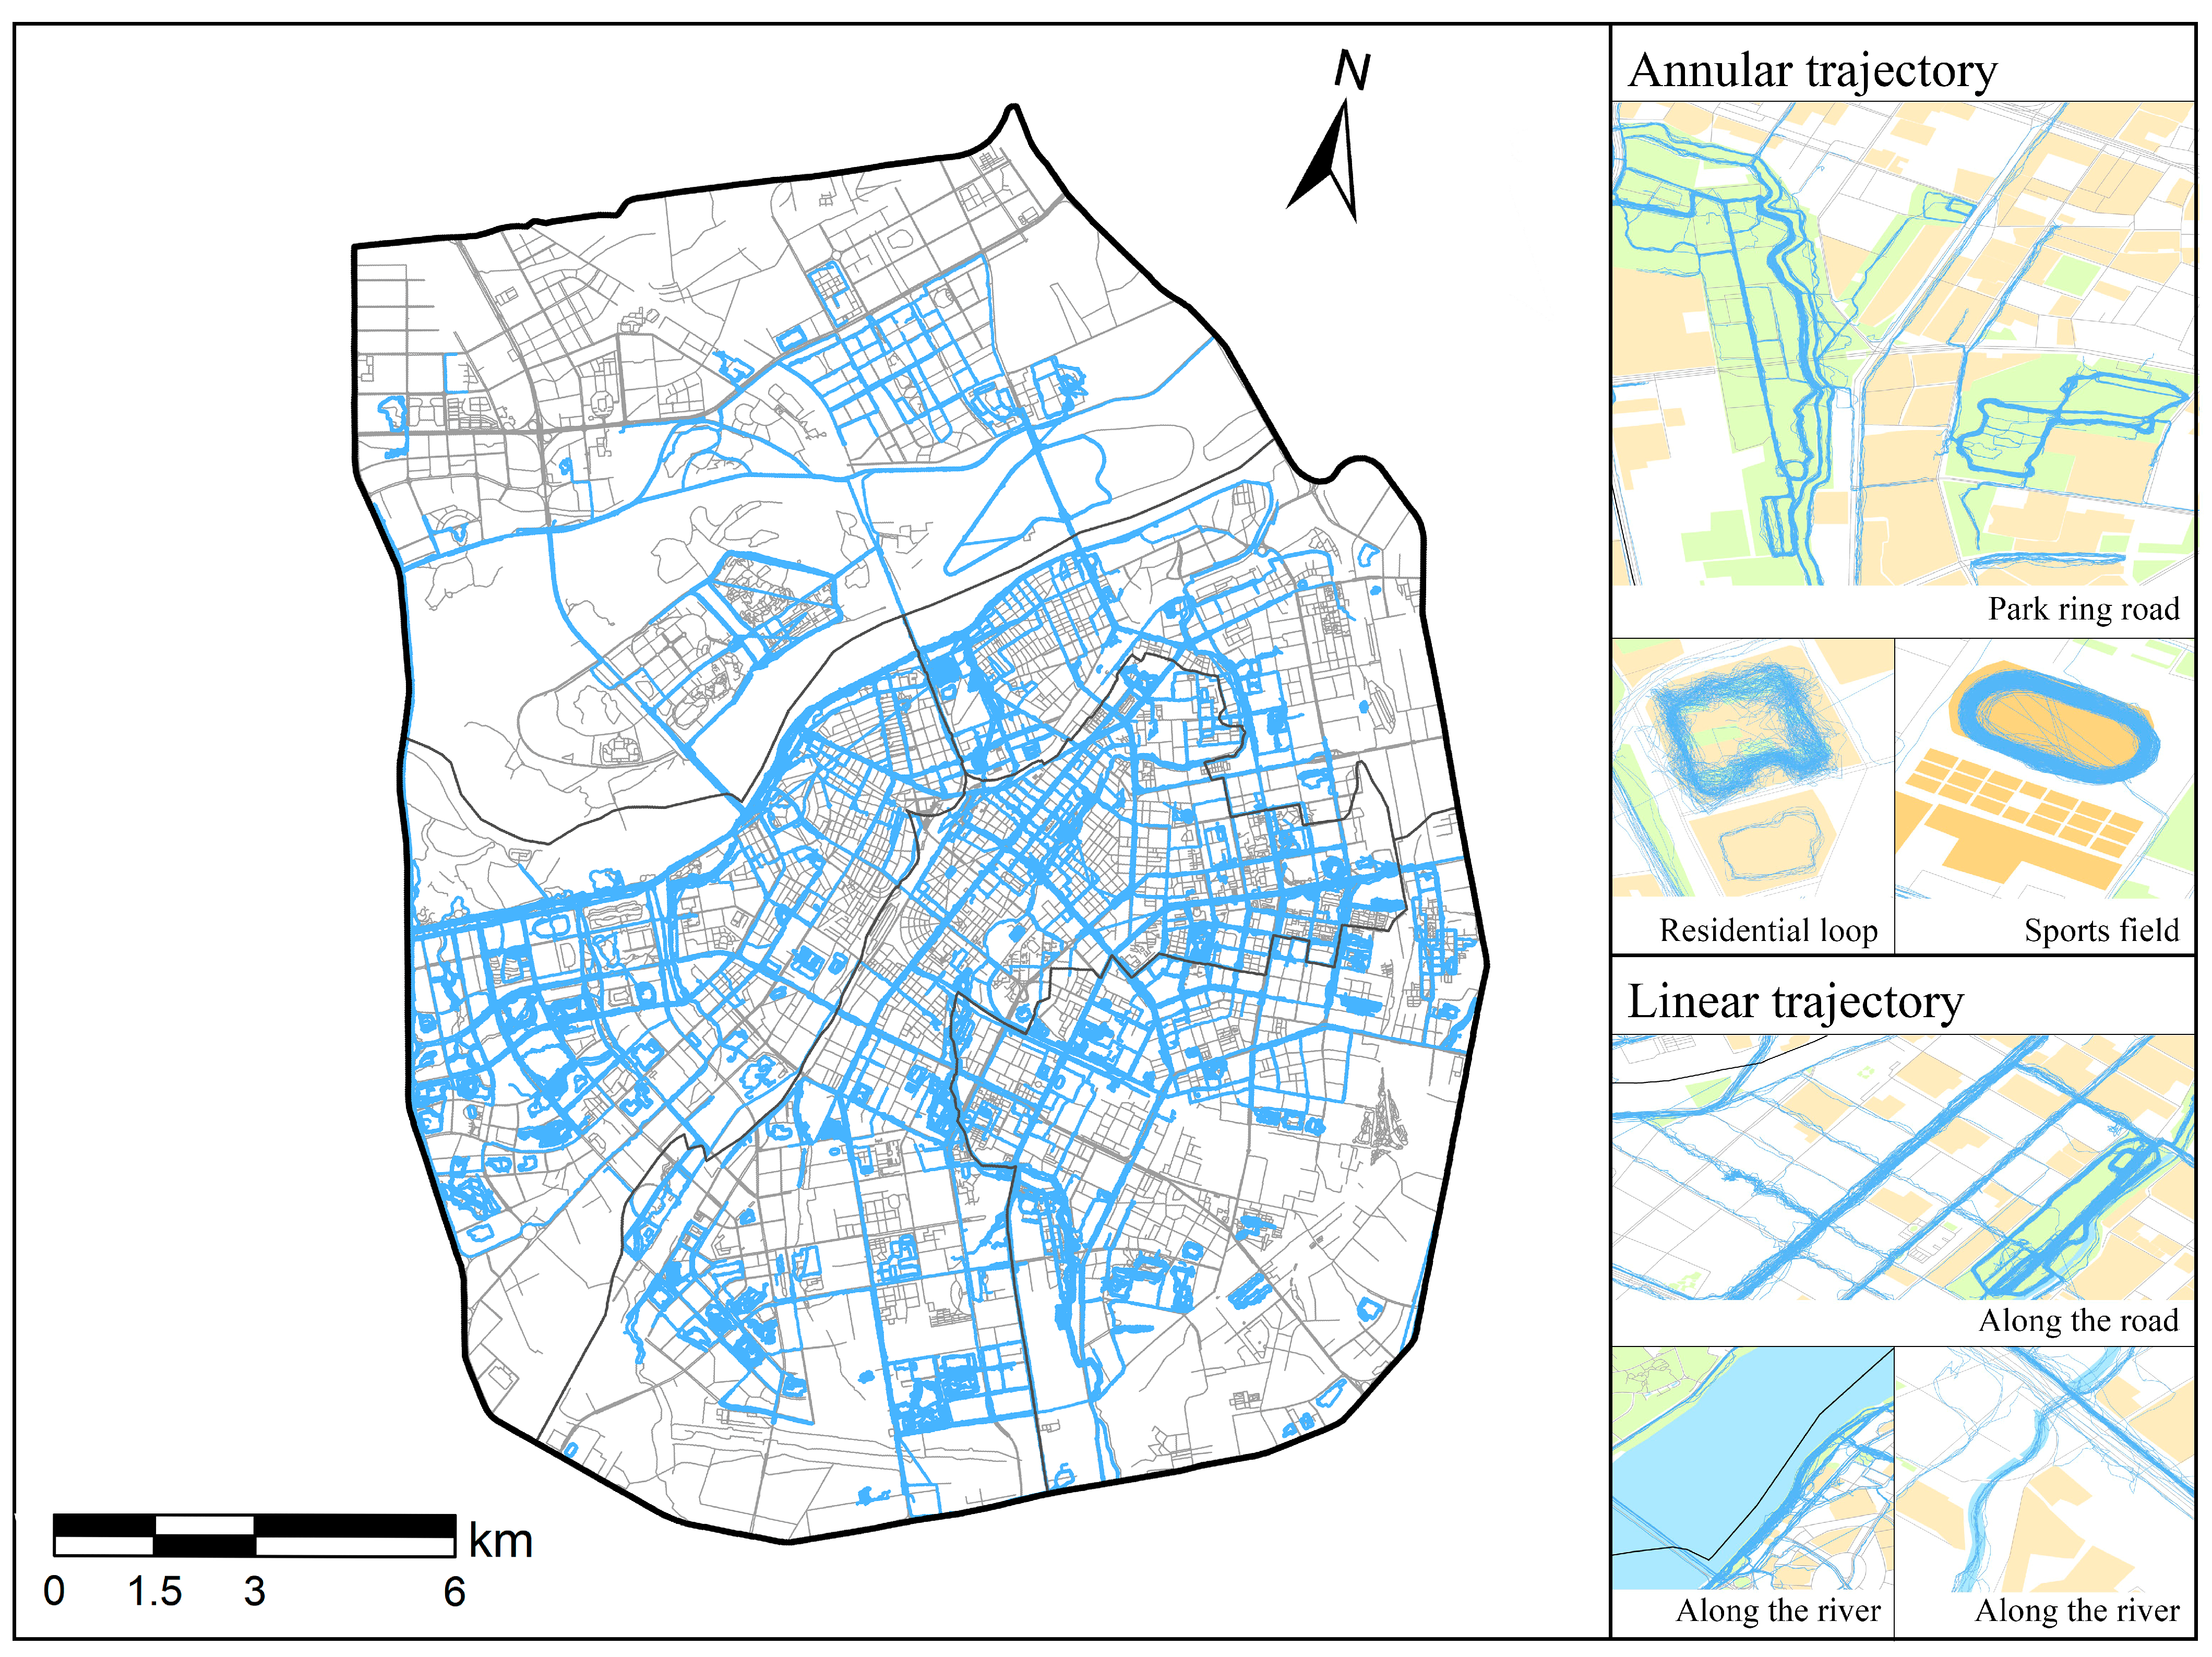
The spatial configuration of running trajectories demonstrates both cohesive and diverse characteristics, which can be broadly categorized into two distinct types: linear and circular (Figure 6).
Linear trajectories are predominantly observed along urban streets, riverbanks, and waterfront areas. These routes are characterized by clear directional structure, providing exercisers with well-defined paths that facilitate continuous and focused running activity. Prominent examples include the Songhua River and Majiagou areas, which are widely recognized as preferred locations for linear running. These sites combine aesthetically pleasing natural landscapes with well-maintained pedestrian trails, enabling users to engage in physical activity while appreciating scenic surroundings.
Circular trajectories, on the other hand, are primarily concentrated around park loops, residential complexes, and sports grounds. These environments offer relatively enclosed and controlled settings, enhancing runners’ sense of safety and spatial cohesion. The looped roads encircling parks, for instance, create a conducive atmosphere for recreational running, promoting both physical exercise and social interaction among users.
Both linear and circular trajectory patterns accommodate the diverse preferences and needs of different runners, offering urban residents varied options for maintaining active and healthy lifestyles. This observed variation underscores the complexity involved in designing urban running spaces that effectively support public health objectives.

4.1.2. Time-Frequency Preference Analysis

This study analyzes user-generated route data obtained from the Keep software platform, including parameters such as movement time, duration, distance, and other relevant metrics, to investigate fundamental characteristics of running behavior. Descriptive statistics were employed to elucidate the distribution patterns within the dataset.
Running activities exhibit distinct temporal concentrations, with the highest frequencies observed during two primary periods: 4:30–7:30 AM and 7:30–9:30 PM (Figure 7). The majority of running sessions occur on rest days. Overall, morning running attracts more participants, and a bi-daily exercise pattern is evident on weekdays, with Thursday showing the highest proportion of running sessions. On rest days, running activities on Sunday mornings begin slightly later compared to other rest days. Evening running times demonstrate minimal variation across days; however, Thursday displays a notably higher engagement rate in the evening, while Sunday exhibits significantly lower participation relative to other days.

4.1.3. Variable Analysis

Subsequent modeling analyses explored these spatial patterns and influencing factors, with descriptive statistics for the variables selected for this paper (Table 2).

4.2. Variable Filtering

This study employed stepwise regression analysis to examine multicollinearity among explanatory variables [54]. All explanatory variables were first standardized, followed by variable selection through stepwise regression. The analysis eliminated two statistically non-significant variables from the initial set of 18 explanatory variables: “distance to water bodies” in the accessibility factor and “slope” in the comfort factor. The final model retained 16 variables demonstrating statistical significance (Table 3).

4.3. Spatiotemporal Heterogeneity Analysis of Running Trajectories

4.3.1. Empirical Results and Test of GTWR Model

When performing the GTWR model estimation, it is crucial to ensure that there is no multicollinearity among the explanatory variables. Multicollinearity was assessed in the previous steps using a stepwise regression model, and the test results show that the variance inflation factor (VIF) values for all explanatory variables are below 10, with the average VIF also under 10. This indicates that there is no multicollinearity in the model, meeting the conditions for GTWR model estimation.
To compare the performance of the OLS, GWR and GTWR models, the GTWR Beta plug-in, developed by Prof. Bo Huang’s team at the Chinese University of Hong Kong based on the ArcGIS platform, was used to estimate both models. The results are presented in Table 4. In this study, two indicators—R2 and AICc—were used to evaluate model fit. A higher R2 value indicates better model fit, while a lower AICc value reflects better model performance. The regression analysis of the three models reveals that the GTWR model significantly outperforms the OLS and GWR models in terms of R2 and shows a lower AICc value. Therefore, the GTWR model demonstrates a superior ability to fit the data, and better explains the variables, and its regression coefficients exhibit better statistical significance.
The regression coefficients of the explanatory variables in the fitted results of the GTWR model can reflect the magnitude of the influence of each variable on the density of running tracks. The larger the absolute value of the regression coefficient of an explanatory variable, the greater the effect on the dependent variable, and the opposite means that the explanatory variable has less effect on the dependent variable; a positive regression coefficient of an explanatory variable indicates that it has a facilitating effect on the dependent variable, while a negative regression coefficient indicates that it has an inhibiting effect [55].

4.3.2. Accessibility Factors

As shown in Figure 8, the spatial influence patterns of running trajectories exhibit certain similarities between weekdays and rest days, although the effects are more pronounced and cover broader areas on rest days.
Based on the magnitude of regression coefficients, branch roads exert the strongest influence on the spatio-temporal heterogeneity of running trajectories (Figure 8g,h). On weekdays, areas with higher sensitivity are mainly concentrated in the eastern parts of Nangang District and Daowai District—older urban zones characterized by dense and complex road networks, where the fragmented structure of branch roads negatively affects running continuity [56]. On rest days, the spatial influence demonstrates a linear structure, concentrated primarily between Daowai District and the adjacent Nangang and Xiangfang Districts. The high degree of land-use mix in this corridor leads residents to prefer running in nearby areas on weekdays, while traveling to better-equipped locations on rest days.
The influence pattern of secondary roads is similar to that of branch roads (Figure 8e,f), though the effect of branch roads is more significant. The spatial impacts of both distance to main roads (Figure 8c,d) and road network density (Figure 8g,h) show comparable distributions: positive effects are concentrated in the western Daoli and Songbei Districts, where favorable traffic conditions and comfortable environments promote running activity, whereas strong negative effects cluster in eastern Nangang and Daowai Districts, where residents prefer main roads for running due to the complex and often confusing local road network [57]. Distance to freeways (Figure 8a,b) exhibits the most extensive spatial influence, predominantly within central urban areas. The elevated freeway structures and associated complex traffic conditions beneath them negatively impact both psychological and physiological aspects of exercise. Although the spatial extent of this influence is similar on weekdays and rest days, the effect is more widespread on rest days.
In summary, residents in areas with dense and intricate road networks tend to prefer main roads for running, avoiding secondary and branch roads with numerous intersections. Conversely, in regions with well-planned road networks and lower traffic volumes, runners favor secondary and branch roads. On weekdays, running activities are more spatially concentrated, typically occurring near residential areas, while on rest days, cross-area exercise becomes more common and exerts a more substantial spatial impact.
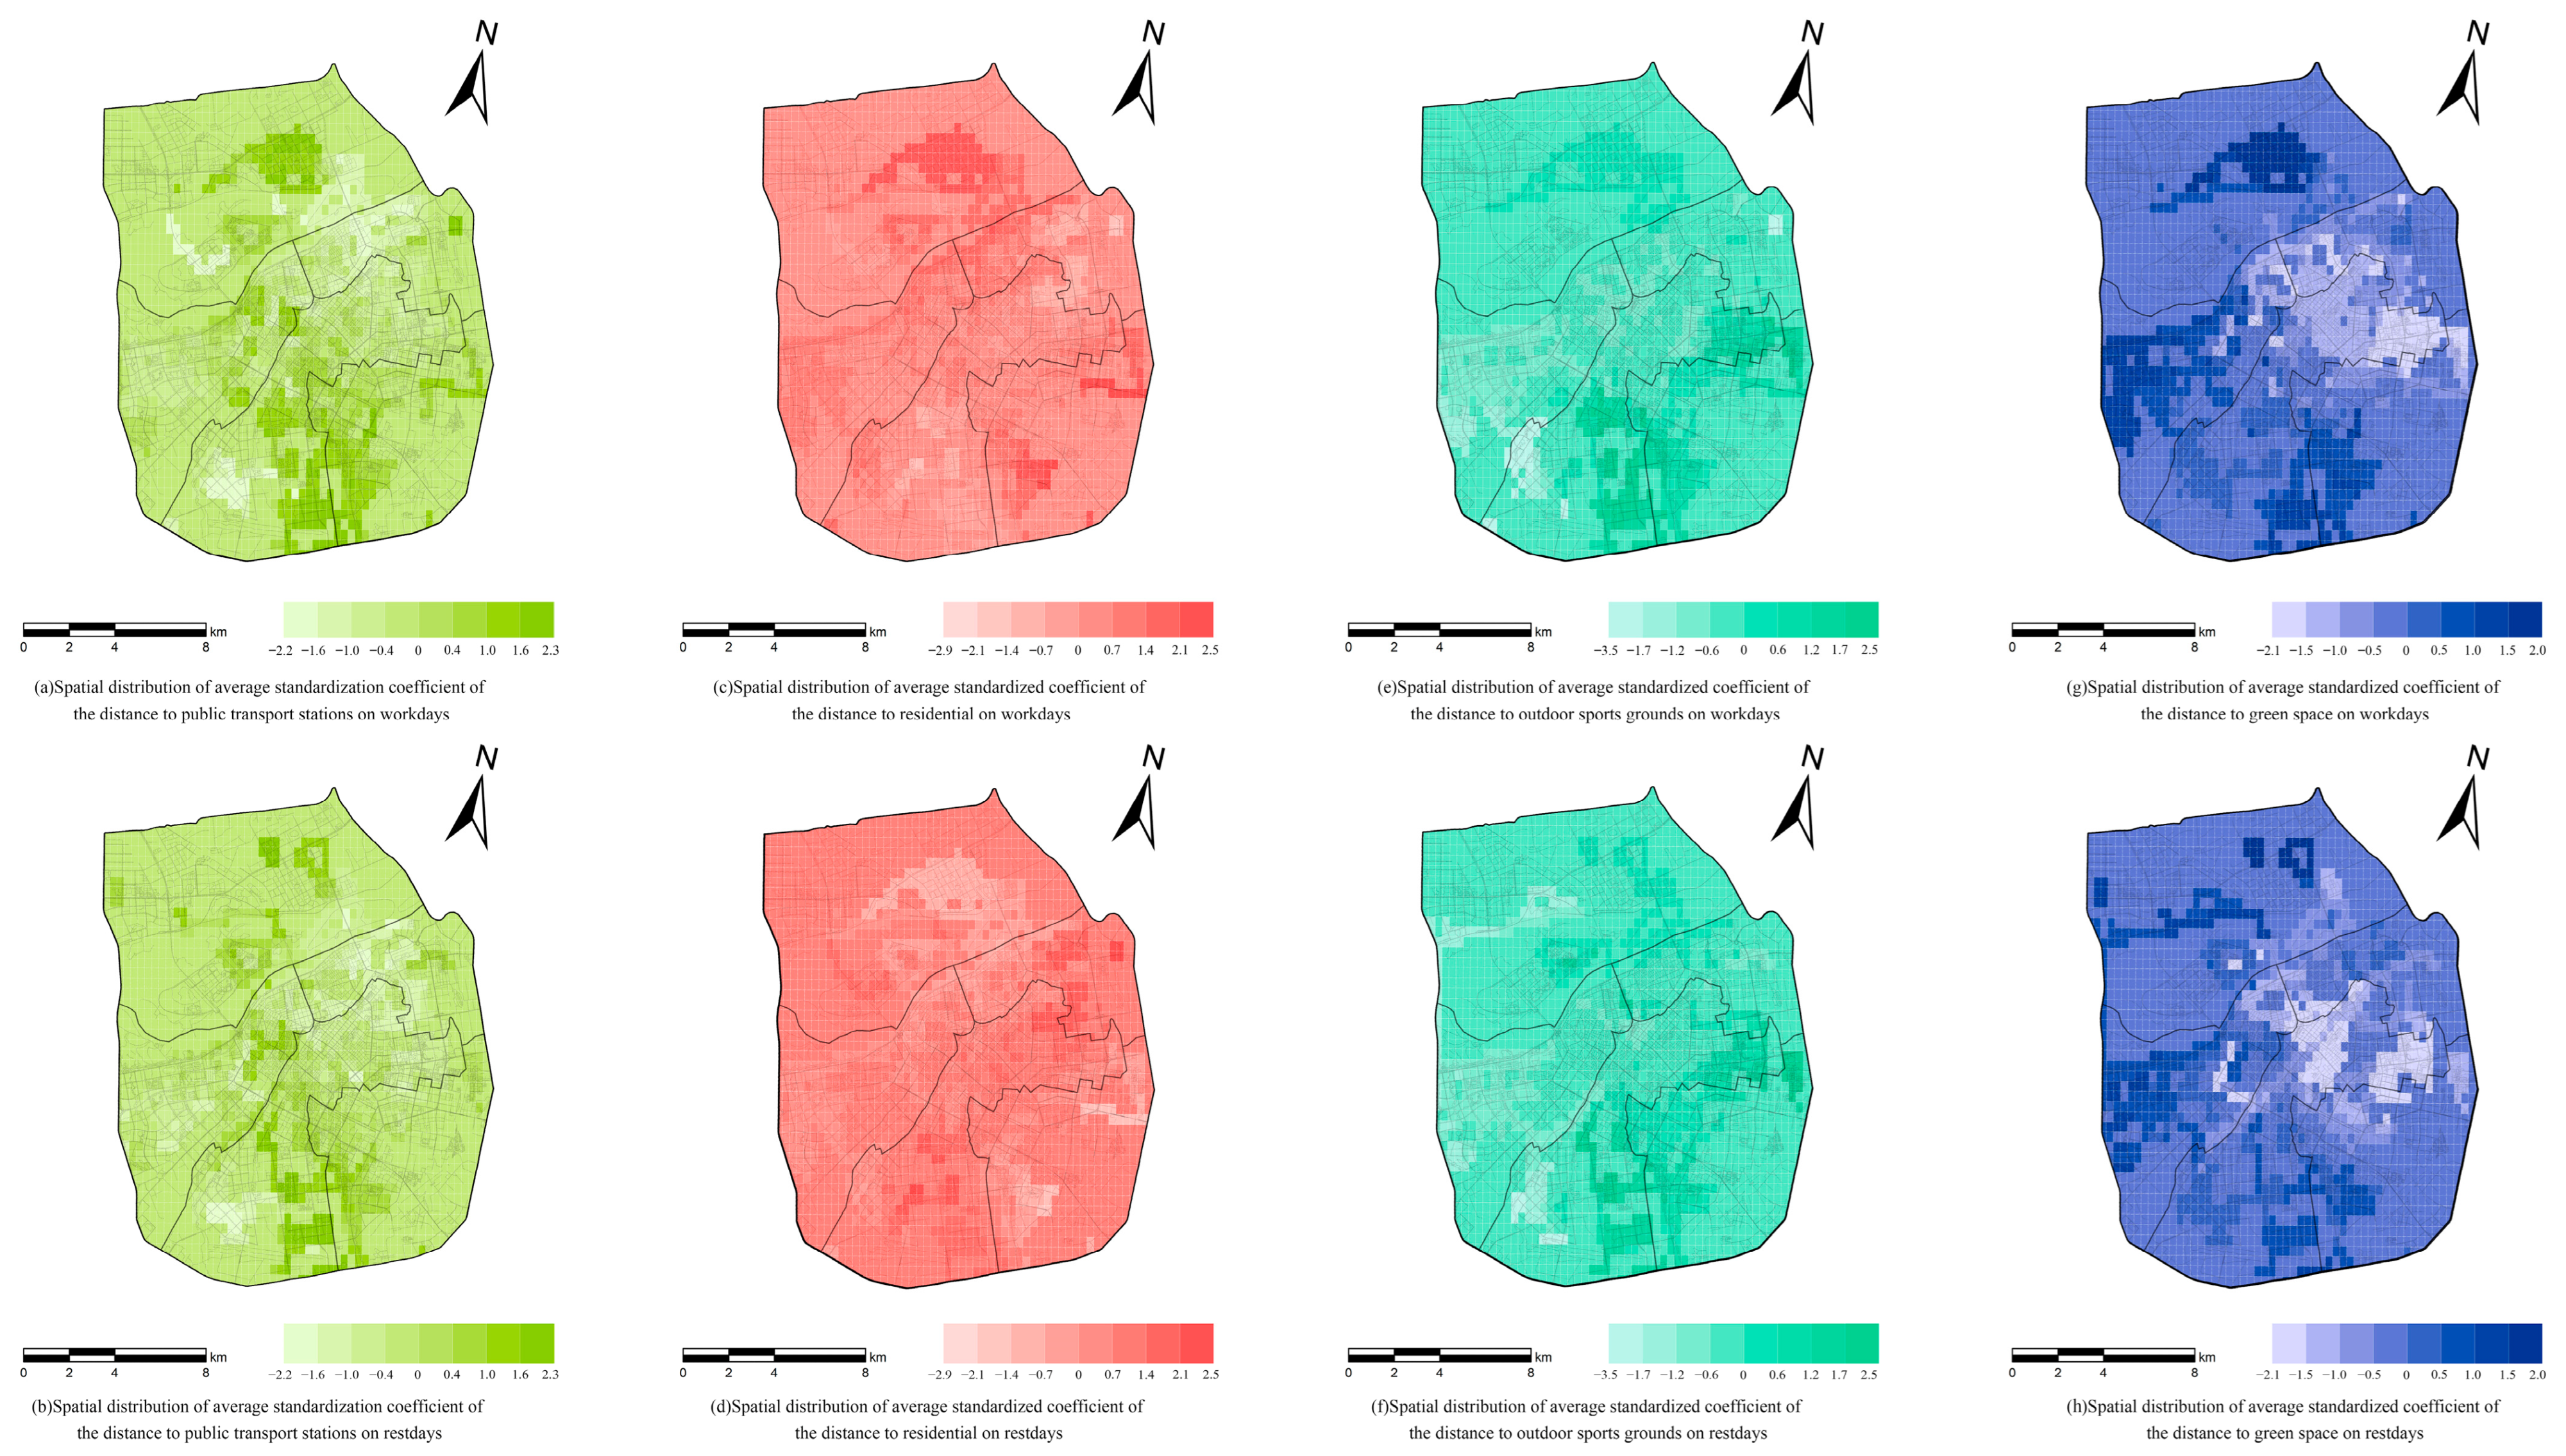
The spatial distribution of the impacts of proximity to public transport stops, residential areas, outdoor sports venues, and green spaces is presented in Figure 9. Overall, distance to green spaces exhibits the most extensive spatial influence. With the exception of outdoor sports venues, which demonstrate similar spatial extents of influence on both weekdays and rest days, all other factors show significant variations between these two time periods.
According to the magnitude of the regression coefficients, distance to outdoor sports venues exerts the strongest influence on the spatiotemporal heterogeneity of running trajectories (Figure 9e,f). Areas with high sensitivity are predominantly concentrated in regions with a high density of outdoor sports venues, indicating that residents prefer to use these nearby facilities for running activities. The influence of distance to public transport stops is significantly greater in both intensity and spatial extent on weekdays compared to rest days (Figure 9a,b). This suggests that on weekdays, runners prioritize accessibility due to time constraints related to commuting, whereas on rest days, they have greater freedom in selecting running locations based on other preferences [58].
Although distance to residential areas shows a broader spatial influence on weekdays than on rest days, its regression coefficients indicate a weaker effect during weekdays (Figure 9c,d). In areas with high residential density, closer proximity to residential zones corresponds to stronger influence, while the effect diminishes when residents choose more distant venues. Distance to green spaces demonstrates a wider spatial influence than the other factors examined (Figure 9g,h). As green spaces represent a critical environmental factor in exercise location choice [59], residents in densely populated areas show a strong preference for exercising in these areas. In contrast, in sparsely populated regions, proximity to green spaces becomes a less determinant factor in route selection.

4.3.3. Diversity Factors

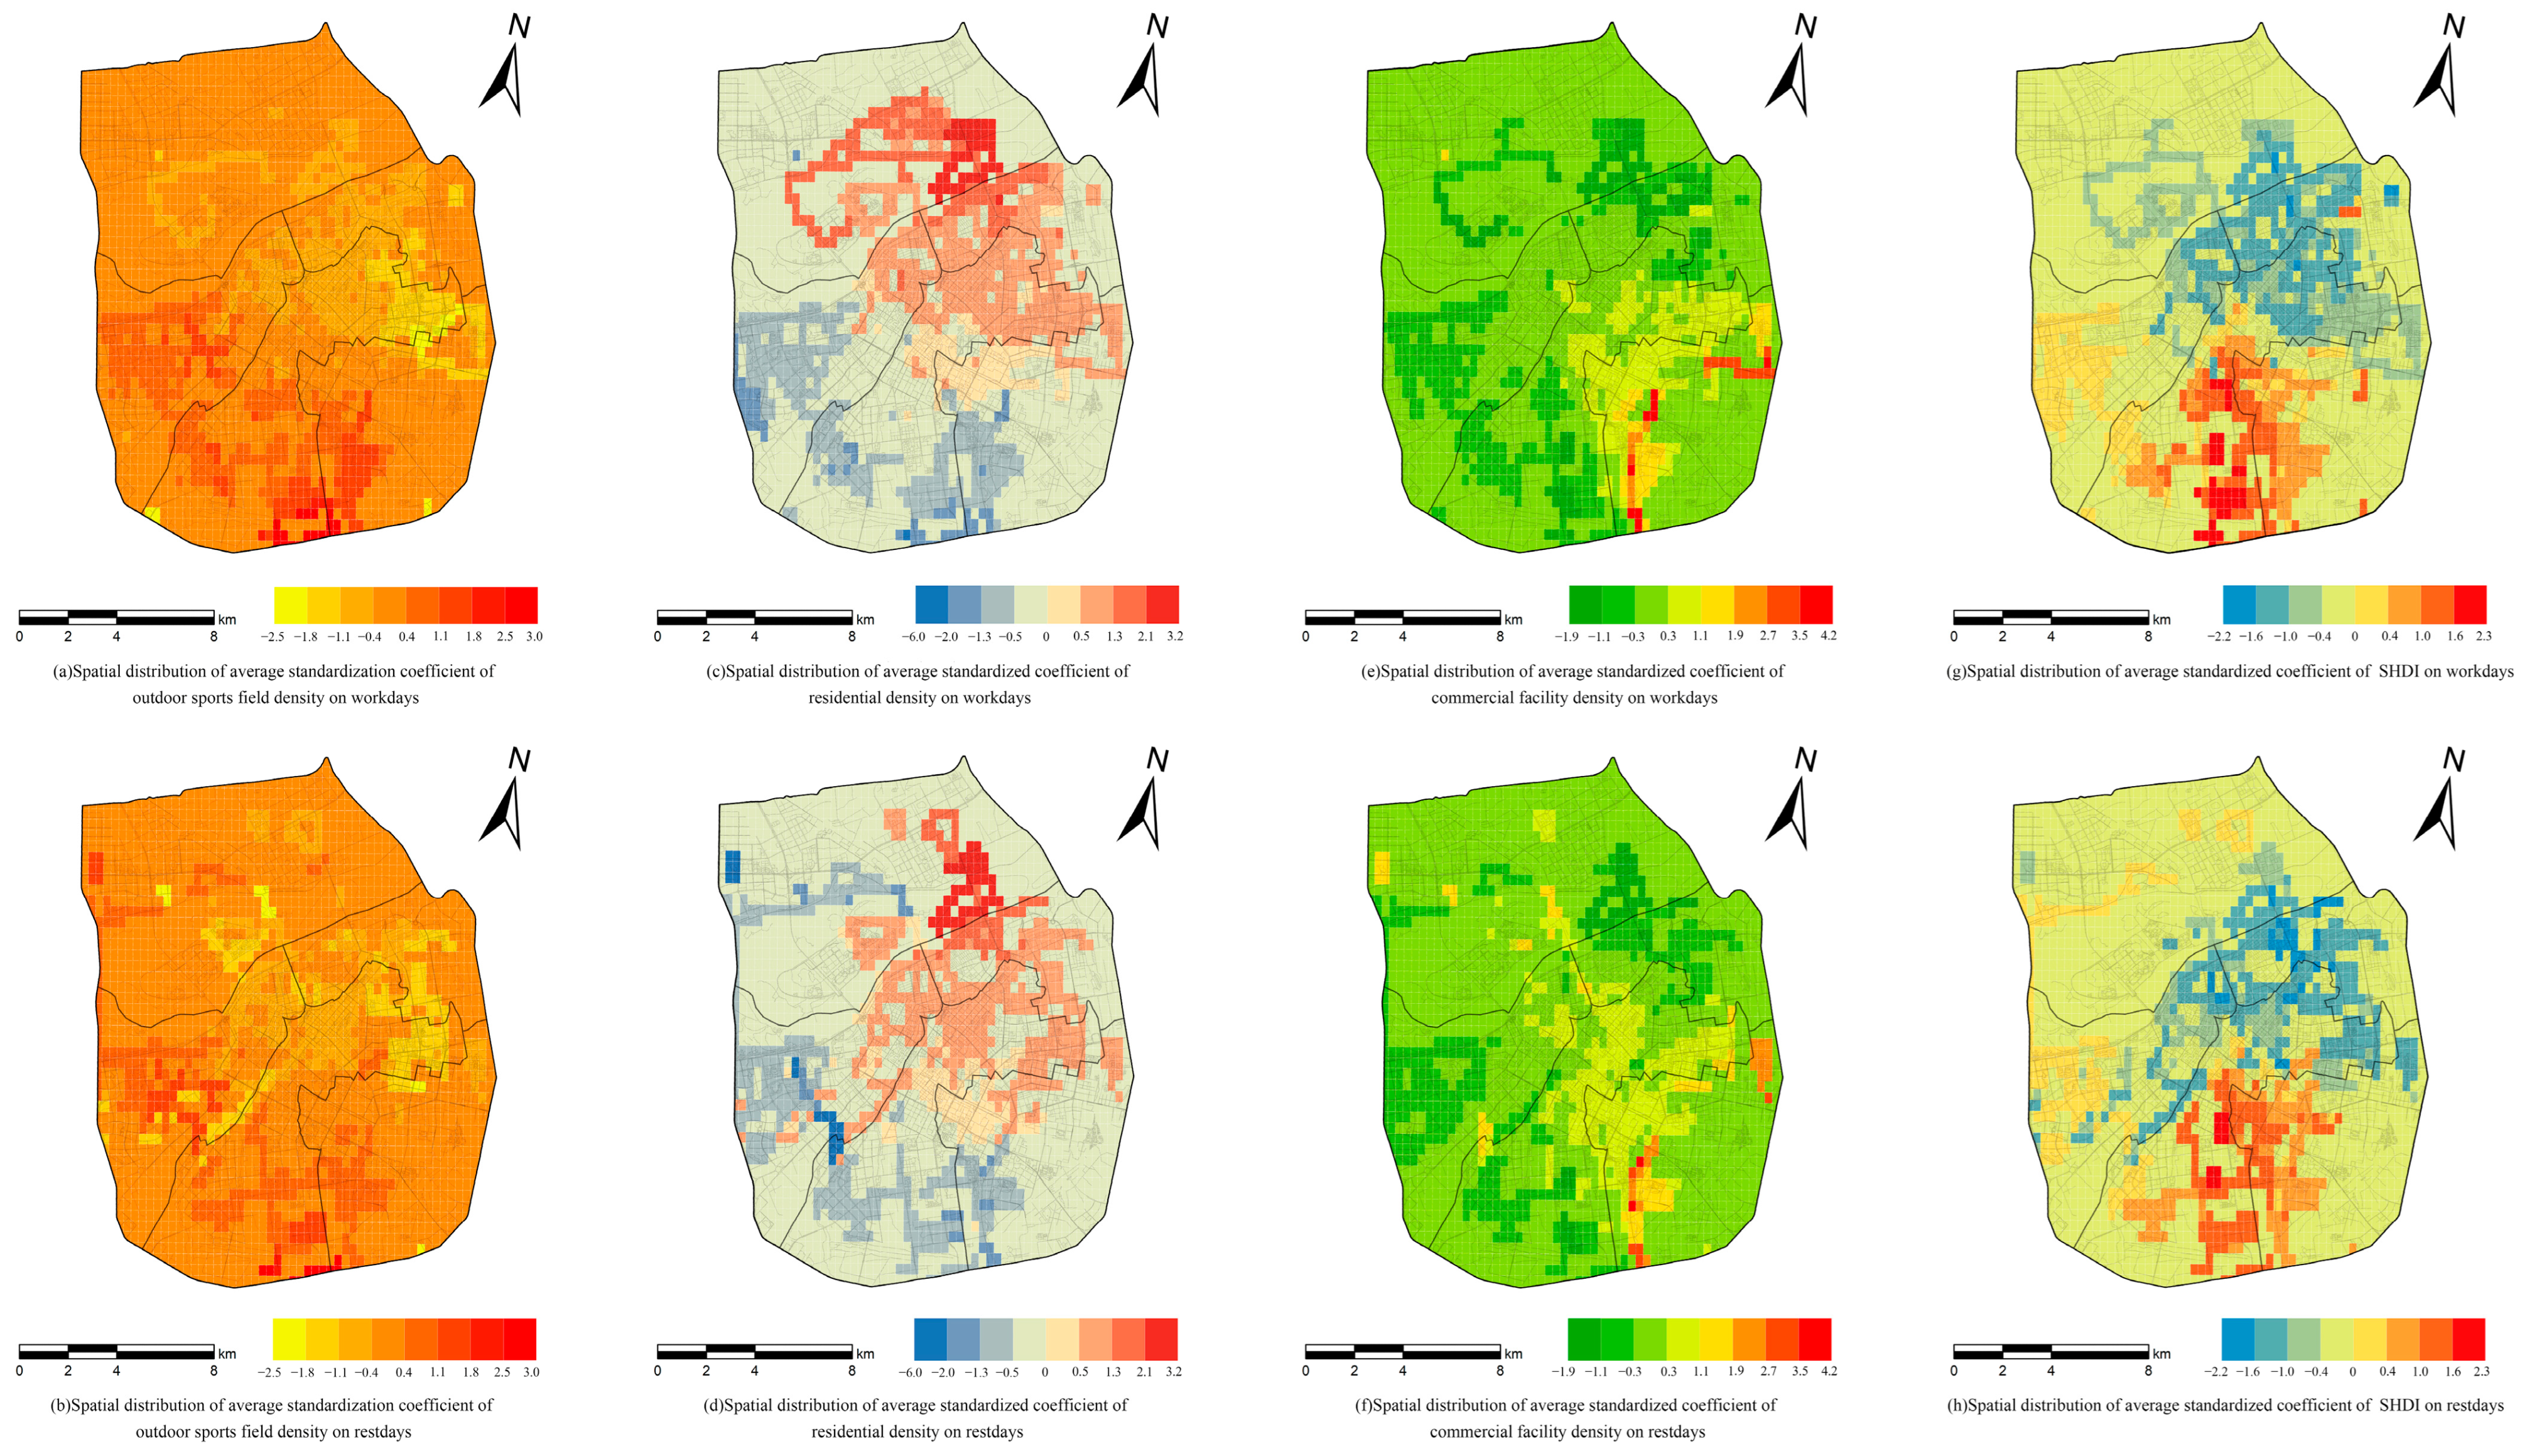
As shown in Figure 10, significant differences were observed in the spatial extent and magnitude of the effects of outdoor sports facility density, residential area density, commercial area density, and land-use functional mix on the spatiotemporal heterogeneity of running trajectories. Among these factors, residential area density exhibited the strongest influence (Figure 10c,d). This effect was particularly pronounced in Songbei District and the central urban area, where high residential density strongly positively influenced runners’ location choices. In contrast, Qunli New District, Xiangfang District, and the southern part of Nangang District showed negative correlations.
The influence of outdoor sports facility density was significantly greater on weekdays than on rest days, both in terms of intensity and spatial extent (Figure 10a,b). In Xiangfang District and southern Nangang District, the high density of sports venues correlated with residents’ preference for exercising near their homes on weekdays. On rest days, the strongest positive effects were observed in Qunli New District and Songbei District, indicating that sports venue proximity remains relevant across different days but varies spatially. In Daoli District, the influence of sports facility density was weaker and negatively correlated, likely due to the abundance of alternative amenities.
Commercial facility density was predominantly negatively correlated with running location choice (Figure 10e,f). High pedestrian and vehicular traffic in commercially dense areas likely disrupts continuous running [60], contributing to this negative association. A modest positive correlation was observed only in parts of Xiangfang District, where proximity to water systems, coastal landscapes, and trails appeared to attract runners.
Land-use functional mix showed relatively consistent effects with smaller spatial variability (Figure 10g,h). Eastern Nangang and Xiangfang Districts exhibited positive correlations, suggesting that mixed-use environments in these regions provide exercise-friendly elements. In contrast, Daoli District and northern Nangang showed negative correlations, possibly due to the dominance of commercial and recreational land uses that may increase environmental vibrancy but hinder exercise continuity. As a composite indicator, functional mix demonstrated high stability in its influence pattern [61].
These findings indicate that the effects of density and diversity factors on running trajectory heterogeneity vary considerably across space and between weekdays and rest days. Residential density and outdoor sports facility density emerged as the most influential factors, while commercial density and functional mix exhibited more complex, context-dependent relationships. These insights can inform more targeted and effective planning strategies for urban sports spaces.

4.3.4. Comfort Factors

As shown in Figure 11, notable differences were observed in the spatial extent and magnitude of the effects of water body density, green space density, and NDVI on the spatiotemporal heterogeneity of running trajectories. Among these factors, NDVI exhibited the strongest influence (Figure 11e,f). A particularly significant effect was observed on weekdays in the northeastern part of Xiangfang District—an area characterized by low population density but hosting a university campus. The high vitality of students and faculty, combined with well-vegetated surroundings, contributed to a strong positive correlation with NDVI. On rest days, stronger effects were identified in southeastern Songbei District and parts of Daoli District. Despite relatively moderate NDVI values in these regions within the main urban context, the findings suggest a preference among residents for physical activity in areas with higher vegetation coverage [62].
Green space density and water body density demonstrated contrasting relationships with running behavior, though the spatial influence of green space was considerably broader (Figure 11c,d). The extensive number and wide distribution of green spaces across the city meant that, in central urban areas, green space density exerted a strong positive effect on exercise location choice, with a more pronounced spatial extent on weekdays compared to rest days. Conversely, in Qunli New District, as well as parts of Nangang, Daowai, and Xiangfang Districts, green space density showed a negative correlation with running activity.
In contrast, water body density exhibited a more limited influence (Figure 11a,b). Residents demonstrated a preference for running along waterways in certain contexts; however, in the central city—where water bodies are scarce and green spaces abundant—water body density correlated negatively with exercise location choice, indicating that runners favored green spaces over aquatic environments in these areas.
In summary, comfort-related environmental factors influence running trajectories in both spatially and temporally heterogeneous ways. NDVI and green space density emerged as particularly significant predictors, while the effect of water body density was relatively constrained. These findings highlight the context-dependent roles that natural elements play in shaping urban running behaviors.

4.4. Integrated Analysis of Spatiotemporal Heterogeneity

4.4.1. Spatial Level

Based on the analysis of the aforementioned variables, the entire study area can be divided into four main zones according to their spatial influence characteristics.
In the central urban area, characterized by a complex and dense road network, residents tend to prefer parks and residential neighborhoods for exercise. Due to high land use intensity and a relatively rigid spatial structure, subsequent planning should prioritize the improvement of main road sidewalks—enhancing surface smoothness, increasing width, and designing dedicated running routes. Concurrently, green spaces within parks should be better integrated through the construction of running tracks, environmental upgrades, and enhanced vegetation to improve the overall exercise experience. In residential areas, particularly older communities, pedestrian-vehicle separation should be implemented, internal roads should be rationally planned to improve accessibility and safety, and running-friendly routes should be upgraded.
In Qunli New District, which features a well-planned road network and low population density, residents show a preference for roads with comfortable environments, open views, and smooth surfaces. Owing to its recent development, the area benefits from newer infrastructure and a pleasant environment. Future planning should focus on upgrading sidewalks along secondary and branch roads, improving pavement quality, widening pathways, reducing obstacles, and promoting the construction of urban green spaces. In addition, outdoor sports facilities should be rationally planned to increase their number and optimize distribution, while lighting installations should be enhanced to ensure nighttime safety and support continuous and safe physical activity.
As a national ecological district, Songbei District is rich in ecological resources and contains numerous large parks, alongside a relatively sparse population. Residents’ choices of exercise locations are mainly influenced by residential density, and the sparse road network and limited residential development lead residents to prioritize physical activity in nearby areas. Future planning should emphasize the rational design of neighborhood roads, implement pedestrian-vehicle separation, improve road smoothness and safety, and rehabilitate aging pavement. Although outdoor sports facilities are currently limited, they remain an important factor in residents’ location choice. It is therefore essential to plan and construct functional, safe, and sustainable outdoor sports venues in flat and accessible locations, equipped with lighting facilities.
The southeastern parts of Nangang District and Xiangfang District are located on the periphery of the central urban area and contain dense, complex road networks with aging facilities. Residents prefer to exercise along small streets and secondary roads, where abundant water and green resources, lower traffic volumes, and a relatively quiet environment contribute to a sense of safety and comfort. Subsequent planning should improve the connectivity of secondary and branch roads, address fragmented road segments, and implement traffic control measures—such as speed reduction or time-based vehicle restrictions—to manage flow effectively. Street lighting should also be increased to enhance safety. A landscaped walkway along the Majiagou River has become a preferred exercise area for residents, though its design requires further refinement. Future improvements should include enhanced water management and greening of the riverside landscape, along with pilot projects such as smart walkways and digital fitness equipment to elevate the exercise experience.

4.4.2. Time Level

The descriptive analysis of temporal variables indicates discernible spatiotemporal variability in exercise behavior between weekdays and rest days, along with differentiated demands for exercise space across various time periods.
On workdays, residents’ physical activity is predominantly concentrated near their residential areas, reflecting a preference for proximity-based exercise with limited cross-regional movement. High-impact areas are mainly located in the eastern part of Nangang District and Daowai District, where the old urban fabric is characterized by a dense and complex network of branch roads that hinders continuous running. Future planning should prioritize the optimization of bus routes to improve accessibility to exercise venues and reduce the likelihood of exercise abandonment due to commuting constraints. Additionally, there is a need to enhance the diversity and density of sports facilities in residential areas by repurposing underutilized spaces. Increasing the availability of localized sports infrastructure can further encourage exercise nearby. In urban green spaces, the establishment of dedicated sports trails, improved signage, rational landscape planning, and regular maintenance are recommended to ensure cleanliness and safety, thus promoting running activity. Furthermore, traffic management strategies such as time-based pedestrianization or vehicle restrictions on high-use running routes during peak hours could enhance exercise continuity.
On rest days, the spatial influence and intensity of exercise location selection exhibit considerable variation, with certain areas showing significant increases or decreases in usage intensity. Residents frequently travel to well-equipped venues or engage in cross-district exercise, demonstrating greater diversity and flexibility in venue choice. Planning responses should focus on increasing the variety and attractiveness of exercise facilities while encouraging inter-district physical activity. Enhancements to inter-district transportation connectivity—such as expanded bus services and shared bicycle docking stations—would improve access to sports facilities and contribute to urban vitality. The development of large, integrated sports parks with comprehensive amenities could effectively meet diverse public needs. Additionally, sports facilities in residential neighborhoods should be upgraded in a context-sensitive manner, accounting for local characteristics. The promotion of thematic sports programs and inter-district sports initiatives on rest days could foster regional cooperation and allow residents to benefit from shared sports resources.

5. Discussion and Limitations

5.1. Discussion

Based on the results of the analyses in Section 4, this study found significant differences in running trajectories in both the spatial and temporal dimensions. From the spatial dimension, this difference stems from the uniqueness of the built and natural environments in different regions, which significantly affects residents’ decision-making on where to exercise. From the time dimension, the difference in trajectories between restdays and workdays reflects the changing pattern of residents’ daily routine and activity needs.
Although Harbin, a city in the northeast of China, is selected for this paper, the climate and temperature of Harbin in August are less different from the average climate in China, and the temperature and climate are more suitable for running, so the month of August is generally representative.
Compared with previous studies that mainly focus on static environmental characteristics, this study innovatively introduces a time-dynamic dimension, and by comparing restday and weekend patterns, it is found that accessibility factors (e.g., public transport accessibility) have a greater impact on restdays, while comfort factors (e.g., green space quality) are more important on weekends. This study is innovative in its use of proximity analysis, as well as in its division of road types into four classes for differentiation. Breaking away from the regional aggregation statistics used in previous studies, this refined analysis, unlike earlier studies that treated roads as homogeneous categories, was able to capture details of spatial preferences that had been overlooked in previous studies, which found significant differences in the effects of different classes of roads on running route choice, with feeder roads having the strongest association with running activity.
These innovative findings provide new insights into urban planning and public health interventions. In particular, the differences in the temporal dimension suggest that urban planning strategies need to take into account the differentiated needs of different periods when promoting physical activity. Future research could combine real-time environmental data and individual socioeconomic characteristics to further reveal the decision-making mechanisms behind running route choice.

5.2. Limitations

There are several limitations of this study that need to be accounted for, mainly in the following aspects:
Firstly, in terms of the data source, there is a certain sample selectivity bias because only data from a single exercise app was used, which may not fully cover the full range of walking and running route types used by exercise enthusiasts. Second, in terms of the time dimension, the data collection period was limited to a specific month, in which the rest day sample contained only 8 days (4 full weekend cycles), a period that may be difficult to adequately reflect the long-term stability of the behavioural patterns. In addition, due to the significant seasonal variations in Harbin, the findings may not be generalisable to Harbin throughout the year, but they are generalisable for studying running space and route selection. In order to enhance the reliability of the findings, future data collection can be matched with seasonal characteristics, and the seasonal variation characteristics of exercise routes can be systematically examined by expanding the period and sample size. Third, the findings mainly reflect the behavioural characteristics of the middle-aged and young mobile user groups, with insufficient coverage of non-major user groups such as children and the elderly. The study mainly reflects the exercise preferences of young and middle-aged fitness enthusiasts, with a certain degree of universality, but due to the environment and living habits of various regions have great differences, specific cities need to be studied according to local conditions. At the same time, the population factor also has a very great influence, but this paper mainly focuses on the influence of its built environment, but this study also reflects the macro characteristics of population distribution to a certain extent through the spatial elements such as the residential area of interest (AOI), point of interest (POI), and the density of the road network. In the future, big data can be combined with traditional survey methods to help close this gap. Finally, in terms of the indicator system, although this study comprehensively considered multidimensional influencing factors, the measurement accuracy of environmental parameters can still be further improved, for example, by introducing finer environmental indicators, such as thermal comfort index and sky visibility coefficient.

6. Conclusions

In this study, a geographically and temporally weighted regression (GTWR) model was used to analyse the spatial and temporal heterogeneity of 18 variables affecting the density of running trajectories. Spatial improvement strategies were proposed for suitable running spaces in different areas and at different times of the day, providing suggestions for urban sports space planning. The results of the study show that:
(1)
Influencing factors: the influence of built environment elements (road class, green space distribution, and accessibility of facilities) on the selection of sports routes has significant spatial heterogeneity. Among them, the quality of the feeder road network, green space accessibility, and the internal environment of the residential area are the three most influential dimensions. It is noteworthy that the importance ranking of these influences differed significantly between restdays and rest days.
(2)
Spatial differentiation characteristics: The study area showed a clear pattern of four types of spatial differentiation: ① the city centre area showed a park-oriented exercise pattern in a high-density built-up environment, and there is a need to focus on improving the quality of footpaths and park running track facilities; ② the emerging development area showed a road-preferred characteristic in a low-density environment, and there is a need to optimise the exercise suitability of the secondary road network; ③ the ecological new area demonstrated a residential area-oriented exercise The ecological new areas show a residential oriented exercise pattern and urgently need to improve the community exercise facilities; ④ The urban fringe areas form a mixed pattern based on the water system and green space, and need to improve the connectivity of the secondary road network and the quality of the waterfront space. This spatial differentiation is closely related to the characteristics of the built environment, population density, and the distribution of facilities in each area.
(3)
In terms of time dynamics: restdays show obvious “residential proximity” characteristics, with fragmented distribution of exercise space; while rest days show “destination orientation” characteristics, forming cross-regional exercise networks. This difference reflects the differences in residents’ needs for exercise at different times of the day: restdays focus on convenience, while rest days pursue a variety of experiences.
Based on the findings of the study, the following planning recommendations are proposed. Implement differentiated spatial intervention strategies: focus on improving the quality of parks and running tracks in the central area, improve the road sports function in the emerging area, enhance the construction of community facilities in the ecological area, and optimise the secondary road network and waterfront space in the peripheral area. Construct a spatial and temporal complementary sports network: focus on improving facilities around residential areas on restdays, and strengthen the construction of regional sports destinations on rest days. Promote the construction of intelligent sports environments: pilot the application of new technologies such as smart running tracks and digital fitness facilities. Establishing a multi-scale linkage mechanism: combining community-level facility improvement with city-level exercise network planning. This study provides a scientific basis for healthy city planning and the construction of sports-friendly environments, and the research results can be subsequently transformed into specific spatial interventions in conjunction with the urban regeneration process to promote the development of national fitness activities.

Author Contributions

Conceptualization, Xinyu Di and Jun Zhang; methodology, Xinyu Di; software, Xinyu Di; validation, Xinyu Di and Jun Zhang; formal analysis, Xinyu Di; investigation, Xinyu Di; resources, Jun Zhang; data curation, Xinyu Di; writing—original draft preparation, Xinyu Di; writing—review and editing, Jun Zhang; visualization, Xinyu Di; supervision, Jun Zhang; project administration, Jun Zhang; funding acquisition, Jun Zhang. All authors have read and agreed to the published version of the manuscript.

Funding

The research received no external funding.

Data Availability Statement

Data are contained within the article.

Conflicts of Interest

The authors declare no conflicts of interest.

References

  1. Nutbeam, D.; Lloyd, J.E. Understanding and responding to health literacy as a social determinant of health. Annu. Rev. Public Health 2021, 42, 159–173. [Google Scholar] [CrossRef]
  2. Zaman, S.; Mian, A.K.; Butt, F. Attitude of young students towards sports and physical activities. Glob. Manag. J. Acad. Corp. Stud. 2018, 8, 33–42. [Google Scholar]
  3. Kaczynski, A.T.; Potwarka, L.R.; Saelens, B.E. Association of park size, distance, and features with physical activity in neighborhood parks. Am. J. Public Health 2008, 98, 1451–1456. [Google Scholar] [CrossRef] [PubMed]
  4. Kazdin, A.E. Interventions in everyday life to improve mental health and reduce symptoms of psychiatric disorders. Am. Psychol. 2024, 79, 185. [Google Scholar] [CrossRef]
  5. Paluska, S.A.; Schwenk, T.L. Physical activity and mental health: Current concepts. Sports Med. 2000, 29, 167–180. [Google Scholar] [CrossRef]
  6. Quirk, H.; Bullas, A.; Haake, S.; Goyder, E.; Graney, M.; Wellington, C.; Copeland, R.; Reece, L.; Stevinson, C. Exploring the benefits of participation in community-based running and walking events: A cross-sectional survey of parkrun participants. BMC Public Health 2021, 21, 1978. [Google Scholar] [CrossRef] [PubMed]
  7. Mandeli, K. Public space and the challenge of urban transformation in cities of emerging economies: Jeddah case study. Cities 2019, 95, 102409. [Google Scholar] [CrossRef]
  8. Nuriddinov, A. Physical activity, health and environment. Am. J. Soc. Sci. Humanit. Res. 2023, 3, 189–200. [Google Scholar]
  9. Salvo, D.; Garcia, L.; Reis, R.S.; Stankov, I.; Goel, R.; Schipperijn, J.; Hallal, P.C.; Ding, D.; Pratt, M. Physical activity promotion and the United Nations sustainable development goals: Building synergies to maximize impact. J. Phys. Act. Health 2021, 18, 1163–1180. [Google Scholar] [CrossRef]
  10. Yancey, A.K.; Fielding, J.E.; Flores, G.R.; Sallis, J.F.; McCarthy, W.J.; Breslow, L. Creating a robust public health infrastructure for physical activity promotion. Am. J. Prev. Med. 2007, 32, 68–78. [Google Scholar] [CrossRef]
  11. Sallis, J.F.; Adams, M.A.; Ding, D. Physical activity and the built environment. In The Oxford Handbook of the Social Science of Obesity; Oxford University Press: Oxford, UK, 2011. [Google Scholar]
  12. Sallis, J.F.; Carlson, J.A.; Mignano, A.M.; Lemes, A.; Wagner, N. Trends in presentations of environmental and policy studies related to physical activity, nutrition, and obesity at Society of Behavioral Medicine, 1995–2010: A commentary to accompany the Active Living Research Supplement to Annals of Behavioral Medicine. Ann. Behav. Med. 2013, 45, 14–17. [Google Scholar] [CrossRef] [PubMed]
  13. Wang, L.; Jiang, X.; Cai, J. Healthy city planning: Insights from China. In Chinese Urban Planning and Construction: From Historical Wisdom to Modern Miracles; Springer: Berlin/Heidelberg, Germany, 2021; pp. 201–223. [Google Scholar]
  14. Committee, P.A.G.A. Physical Activity Guidelines Advisory Committee Report, 2008; US Department of Health and Human Services: Washington, DC, USA, 2008; p. A1-H14.
  15. Committee, P.A.G.A. Physical Activity Guidelines for Americans; US Department of Health and Human Services: Washington, DC, USA, 2008; pp. 15–34.
  16. Karusisi, N.; Bean, K.; Oppert, J.-M.; Pannier, B.; Chaix, B. Multiple dimensions of residential environments, neighborhood experiences, and jogging behavior in the RECORD Study. Prev. Med. 2012, 55, 50–55. [Google Scholar] [CrossRef] [PubMed]
  17. Zhang, C.; Gong, P. Healthy China: From words to actions. Lancet Public Health 2019, 4, e438–e439. [Google Scholar] [CrossRef] [PubMed]
  18. Dai, J.; Menhas, R. Sustainable development goals, sports and physical activity: The localization of health-related sustainable development goals through sports in China: A narrative review. Risk Manag. Healthc. Policy 2020, 13, 1419–1430. [Google Scholar] [CrossRef]
  19. Xiao, X.; Tan, F.T.C.; Lim, E.T.; Henningsson, S.; Vatrapu, R.; Hedman, J.; Tan, C.W.; Clemenson, T.; Mukkamala, R.R.; Van Hillegersberg, J. Sports digitalization: An overview and A research agenda. In Proceedings of the 38th International Conference on Information Systems, Atlanta, GA, USA, 10–13 December 2017. ICIS 2017, 2018. [Google Scholar]
  20. Liu, Y.; Hu, J.; Yang, W.; Luo, C. Effects of urban park environment on recreational jogging activity based on trajectory data: A case of Chongqing, China. Urban For. Urban Green. 2022, 67, 127443. [Google Scholar] [CrossRef]
  21. Peart, D.J.; Balsalobre-Fernández, C.; Shaw, M.P. Use of mobile applications to collect data in sport, health, and exercise science: A narrative review. J. Strength Cond. Res. 2019, 33, 1167–1177. [Google Scholar] [CrossRef]
  22. Wolf, I.D.; Wohlfart, T. Walking, hiking and running in parks: A multidisciplinary assessment of health and well-being benefits. Landsc. Urban Plan. 2014, 130, 89–103. [Google Scholar] [CrossRef]
  23. Yang, W.; Hu, J.; Liu, Y.; Guo, W. Examining the influence of neighborhood and street-level built environment on fitness jogging in Chengdu, China: A massive GPS trajectory data analysis. J. Transp. Geogr. 2023, 108, 103575. [Google Scholar]
  24. Shi, T.; Gao, F. Utilizing Multi-Source Geospatial Big Data to Examine How Environmental Factors Attract Outdoor Jogging Activities. Remote Sens. 2024, 16, 3056. [Google Scholar] [CrossRef]
  25. Yang, W.; Fei, J.; Li, Y.; Chen, H.; Liu, Y. Unraveling nonlinear and interaction effects of multilevel built environment features on outdoor jogging with explainable machine learning. Cities 2024, 147, 104813. [Google Scholar] [CrossRef]
  26. Yang, W.; Li, Y.; Liu, Y.; Fan, P.; Yue, W. Environmental factors for outdoor jogging in Beijing: Insights from using explainable spatial machine learning and massive trajectory data. Landsc. Urban Plan. 2024, 243, 104969. [Google Scholar] [CrossRef]
  27. Kaczynski, A.T.; Koohsari, M.J.; Stanis, S.A.W.; Bergstrom, R.; Sugiyama, T. Association of street connectivity and road traffic speed with park usage and park-based physical activity. Am. J. Health Promot. 2014, 28, 197–203. [Google Scholar] [CrossRef] [PubMed]
  28. Gladwell, V.F.; Brown, D.K.; Wood, C.; Sandercock, G.R.; Barton, J.L. The great outdoors: How a green exercise environment can benefit all. Extrem. Physiol. Med. 2013, 2, 3. [Google Scholar] [CrossRef]
  29. Edwards, P.; Tsouros, A.D. Promoting Physical Activity and Active Living in Urban Environments: The Role of Local Governments; WHO Regional Office Europe: Copenhagen, Denmark, 2006. [Google Scholar]
  30. Zhang, S.; Wang, Z.; Helbich, M.; Ettemaa, D. Assessing runners’ exposure to natural and built environments in the Netherlands: A descriptive assessment based on GPS tracking. Int. J. Environ. Health Res. 2024, 34, 2104–2123. [Google Scholar] [CrossRef]
  31. Wang, Y.; Han, Y.; Pu, L.; Jiang, B.; Yuan, S.; Xu, Y. A novel model for detecting urban fringe and its expanding patterns: An application in Harbin City, China. Land 2021, 10, 876. [Google Scholar] [CrossRef]
  32. Wang, X.; Bao, X.; Ge, Z.; Xi, J.; Zhao, Y. Identification and Redevelopment of Inefficient Residential Landuse in Urban Areas: A Case Study of Ring Expressway Area in Harbin City of China. Land 2024, 13, 1238. [Google Scholar] [CrossRef]
  33. Kabisch, N.; Kraemer, R. Physical activity patterns in two differently characterised urban parks under conditions of summer heat. Environ. Sci. Policy 2020, 107, 56–65. [Google Scholar] [CrossRef]
  34. Gao, J.; Shi, Y.; Zhang, H.; Chen, X.; Zhang, W.; Shen, W.; Xiao, T.; Zhang, Y. China Regional 250 m Normalized Difference Vegetation Index Data Set (2000–2022). Natl. Tibet. Plateau/Third Pole Environ. Data Cent. 2023, 2, 946–952. [Google Scholar]
  35. European Space Agency Sinergise. Copernicus Global Digital Elevation Model. 2021. [CrossRef]
  36. Li, X.; Hu, T.; Gong, P.; Du, S.; Chen, B.; Li, X.; Dai, Q. Mapping essential urban land use categories in Beijing with a fast area of interest (AOI)-based method. Remote Sens. 2021, 13, 477. [Google Scholar] [CrossRef]
  37. Cervero, R.; Kockelman, K. Travel demand and the 3Ds: Density, diversity, and design. Transp. Res. Part D Transp. Environ. 1997, 2, 199–219. [Google Scholar] [CrossRef]
  38. Pikora, T.; Giles-Corti, B.; Bull, F.; Jamrozik, K.; Donovan, R. Developing a framework for assessment of the environmental determinants of walking and cycling. Soc. Sci. Med. 2003, 56, 1693–1703. [Google Scholar] [CrossRef]
  39. Norman, P.; Pickering, C.M. Factors influencing park popularity for mountain bikers, walkers and runners as indicated by social media route data. J. Environ. Manag. 2019, 249, 109413. [Google Scholar] [CrossRef]
  40. Tegart, A.D. Runnability: Evaluation of Environmental Features Promoting Running; Simon Fraser University: Vancouver, BC, Canada, 2025. [Google Scholar]
  41. Sahani, R.; Bhuyan, P. Modelling pedestrian perspectives in evaluating satisfaction levels of urban roadway walking facilities. Transp. Res. Procedia 2020, 48, 2262–2279. [Google Scholar] [CrossRef]
  42. Maroko, A.R.; Maantay, J.A.; Sohler, N.L.; Grady, K.L.; Arno, P.S. The complexities of measuring access to parks and physical activity sites in New York City: A quantitative and qualitative approach. Int. J. Health Geogr. 2009, 8, 34. [Google Scholar] [CrossRef]
  43. Rapport, N.; Dawson, A. Home and movement: A polemic. In Migrants of Identity; Routledge: Oxfordshire, UK, 2021; pp. 19–38. [Google Scholar]
  44. Asgari Gandomani, R.; Rahimi, A.; Shahbazpour, L.; Jokar Arsanjani, J. Spatial Justice and Accessibility: Optimizing Sports Facility Allocation in Tehran. Land 2025, 14, 1318. [Google Scholar] [CrossRef]
  45. Ghalamro, S.S.; Bandarabad, A.; Shahabian, P. Investigating the Role of Spatial Diversity in Selecting Behavioral Patterns of Public Territory (Case Study: Zanjan’s Pedestrian Zone). J. Urban Manag. Energy Sustain. 2022, 3, 19–38. [Google Scholar]
  46. Ma, X.; Chau, C.K.; Lai, J.H.K. Critical factors influencing the comfort evaluation for recreational walking in urban street environments. Cities 2021, 116, 103286. [Google Scholar] [CrossRef]
  47. Teeuwen, R.; Milias, V.; Bozzon, A.; Psyllidis, A. How well do NDVI and OpenStreetMap data capture people’s visual perceptions of urban greenspace? Landsc. Urban Plan. 2024, 245, 105009. [Google Scholar] [CrossRef]
  48. Vernillo, G.; Giandolini, M.; Edwards, W.B.; Morin, J.-B.; Samozino, P.; Horvais, N.; Millet, G.Y. Biomechanics and physiology of uphill and downhill running. Sports Med. 2017, 47, 615–629. [Google Scholar] [CrossRef]
  49. Wheeler, B.W.; Lovell, R.; Higgins, S.L.; White, M.P.; Alcock, I.; Osborne, N.J.; Husk, K.; Sabel, C.E.; Depledge, M.H. Beyond greenspace: An ecological study of population general health and indicators of natural environment type and quality. Int. J. Health Geogr. 2015, 14, 17. [Google Scholar] [CrossRef]
  50. Shrestha, N. Detecting multicollinearity in regression analysis. Am. J. Appl. Math. Stat. 2020, 8, 39–42. [Google Scholar] [CrossRef]
  51. Huang, B.; Wu, B.; Barry, M. Geographically and temporally weighted regression for modeling spatio-temporal variation in house prices. Int. J. Geogr. Inf. Sci. 2010, 24, 383–401. [Google Scholar] [CrossRef]
  52. Brunsdon, C.; Fotheringham, A.S.; Charlton, M.E. Geographically weighted regression: A method for exploring spatial nonstationarity. Geogr. Anal. 1996, 28, 281–298. [Google Scholar] [CrossRef]
  53. O’Sullivan, D. Geographically weighted regression: The analysis of spatially varying relationships. Geogr. Anal. 2003, 35, 272–275. [Google Scholar] [CrossRef]
  54. Zhang, T.; Zhou, X.; Liu, X. Reliability analysis of slopes using the improved stochastic response surface methods with multicollinearity. Eng. Geol. 2020, 271, 105617. [Google Scholar] [CrossRef]
  55. Chuang, I.-T.; Benita, F.; Tunçer, B. Effects of urban park spatial characteristics on visitor density and diversity: A geolocated social media approach. Landsc. Urban Plan. 2022, 226, 104514. [Google Scholar] [CrossRef]
  56. Schrijnen, P.M. Infrastructure networks and red-green patterns in city regions. Landsc. Urban Plan. 2000, 48, 191–204. [Google Scholar] [CrossRef]
  57. Zhong, Q.; Li, B.; Chen, Y. How do different urban footpath environments affect the jogging preferences of residents of different genders? Empirical research based on trajectory data. Int. J. Environ. Res. Public Health 2022, 19, 14372. [Google Scholar] [CrossRef]
  58. Lo, A.-T.; Houston, D. How do compact, accessible, and walkable communities promote gender equality in spatial behavior? J. Transp. Geogr. 2018, 68, 42–54. [Google Scholar] [CrossRef]
  59. Wang, H.; Dai, X.; Wu, J.; Wu, X.; Nie, X. Influence of urban green open space on residents’ physical activity in China. BMC Public Health 2019, 19, 1093. [Google Scholar] [CrossRef] [PubMed]
  60. Wen, L.; Kenworthy, J.; Marinova, D. Higher density environments and the critical role of city streets as public open spaces. Sustainability 2020, 12, 8896. [Google Scholar] [CrossRef]
  61. Li, H.; Peng, J.; Yanxu, L.; Yi’na, H. Urbanization impact on landscape patterns in Beijing City, China: A spatial heterogeneity perspective. Ecol. Indic. 2017, 82, 50–60. [Google Scholar] [CrossRef]
  62. Song, Y.; Chen, B.; Kwan, M.-P. How does urban expansion impact people’s exposure to green environments? A comparative study of 290 Chinese cities. J. Clean. Prod. 2020, 246, 119018. [Google Scholar] [CrossRef]
Figure 1. Location of the study area.
Ijgi 14 00366 g001
Figure 2. Research framework.
Ijgi 14 00366 g002
Figure 3. Running trajectories.
Ijgi 14 00366 g003
Figure 4. Natural Environment Data: (a) NDVI; (b) Slope.
Ijgi 14 00366 g004
Figure 5. Built environment data: (a) POIs; (b) AOIs.
Ijgi 14 00366 g005
Figure 6. Running trajectory distribution diagram.
Ijgi 14 00366 g006
Figure 7. Running time-frequency graph.
Ijgi 14 00366 g007
Figure 8. Spatial distribution of the average standardized coefficient of the distance to roads for workdays and restdays: (a) the distance to the freeway on workdays; (b) the distance to the freeway on restdays; (c) the distance to the main road on workdays; (d) the distance to the main road on restdays; (e) the distance to the main road on workdays; (f) the distance to the main road on restdays; (g) the distance to the bypass on workdays; (h) the distance to the bypass on restdays; (i) the road network density on workdays; (j) the road network density on workdays.
Ijgi 14 00366 g008
Figure 9. Spatial distribution of average standardized coefficients of accessibility factors for workdays and restdays: (a) the distance to public transport stations on workdays; (b) the distance to public transport stations on restdays; (c) the distance to residential on workdays; (d) the distance to residential on restdays; (e) the distance to outdoor sports grounds on workdays; (f) the distance to outdoor sports grounds on restdays; (g) the distance to green space on workdays; (h) the distance to green space on restdays.
Ijgi 14 00366 g009
Figure 10. Spatial distribution of average standardized coefficients of diversity factors for workdays and restdays: (a) outdoor sports field density on workdays; (b) outdoor sports field density on restdays; (c) residential density on workdays; (d) residential density on restdays; (e) commercial facility density on workdays; (f) commercial facility density on restdays; (g) SHDI on workdays; (h) SHDI on restdays.
Ijgi 14 00366 g010
Figure 11. Spatial distribution of average standardized coefficients of comfort factors for workdays and restdays: (a) water density on workdays; (b) water density on restdays; (c) park density on workdays; (d) park density on restdays; (e) NDVI on workdays; (f) NDVI on restdays.
Ijgi 14 00366 g011
Table 1. Explanatory variable categories and descriptions.
CategoryVariablesDescription
AccessibilityDistance to the roadDistance to the freewayThe mean of the closest distance between trajectory points on each trajectory and roads of different classes (m)
Distance to the main road
Distance to the secondary road
Distance to the bypass
Density of road networkThe mean of the road network density at the location of the trajectory point on each trajectory (km/km2)
Distance to bus stopThe mean distance from the trajectory point on each trajectory to the nearest subway station, bus stop (m)
Distance to green spaceThe mean distance from the trajectory point on each trajectory to the nearest green space (m)
Distance to the body of waterThe mean distance from the trajectory point on each trajectory to the nearest body of water (m)
Distance to residential areaThe mean distance from the trajectory point on each trajectory to the nearest residential area (m)
Distance to an outdoor sports fieldThe mean distance from the trajectory point on each trajectory to the nearest sports facility (m)
VarietyOutdoor sports field densityThe mean number of outdoor sports field points per unit area
Residential densityMean number of residential area points per unit area
Density of commercial facilitiesMean number of commercial facility points per unit area
Land Use Mix (SHDI)The mean value of the POI Shannon entropy
ComfortNormalized Difference Vegetation Index (NDVI)The average of the standardized differential vegetation index
SlopeThe mean of the maximum rate of change in the direction of each unit and its adjacent units
Density of green spaceThe mean number of green space points per unit area
Density of water bodiesThe mean number of points of a water body per unit area
Table 2. Descriptive analysis of each variable.
Category VariablesMeanS.D.
Dependent VariableWalking and running motion track density262.837188.120
Explained variable
AccessibilityDistance to roadDistance to the freeway755.782534.086
Distance to the main road212.692234.499
Distance to the secondary road358.974309.949
Distance to the bypass251.755174.258
Density of road network221.8250.018
Distance to bus stop145.798221.825
Distance to green space947.657145.798
Distance to the body of water136.403947.657
Distance to residential area579.955136.403
Distance to an outdoor sports field2.448579.955
VarietyOutdoor sports field density7.2342.448
Residential density391.0997.234
Density of commercial facilities1.683391.099
Land Use Mix (SHDI)0.4151.683
ComfortNormalized Difference Vegetation Index (NDVI)1.9010.415
Slope755.7821.901
Density of green space5.2854.714
Density of water bodies0.8061.035
Table 3. Stepwise Regression Model results.
CategoryVariablesCoef.Sig.VIF
AccessibilityDistance to roadDistance to the freeway0.0910.0001.741
Distance to the main road0.1210.0002.662
Distance to the secondary road0.0520.0001.966
Distance to the bypass0.1170.0001.617
Density of road network−0.3090.0001.621
Distance to bus stop−0.2960.0004.238
Distance to green space−0.3040.0001.797
Distance to the body of water---
Distance to residential area−0.0720.0023.196
Distance to an outdoor sports field−0.0660.0002.131
VarietyOutdoor sports field density−0.0420.0171.847
Residential density0.2730.0003.778
Density of commercial facilities0.1490.0003.466
Land Use Mix (SHDI)−0.1840.0002.611
ComfortNormalized Difference Vegetation Index (NDVI)0.3740.0001.756
Slope---
Density of green space0.2280.0002.866
Density of water bodies0.0380.0432.063
R20.448
Adj R20.445
Significance F amount of change0.043
Table 4. R2 and AICc data of OLS, GWR and GTWR models.
AICcR2
OLS42,307.70.447891
GWR35,785.30.934207
GTWR35,632.90.935108
Disclaimer/Publisher’s Note: The statements, opinions and data contained in all publications are solely those of the individual author(s) and contributor(s) and not of MDPI and/or the editor(s). MDPI and/or the editor(s) disclaim responsibility for any injury to people or property resulting from any ideas, methods, instructions or products referred to in the content.