Article

Enhancing Electric Vehicle Charging Infrastructure Planning with Pre-Trained Language Models and Spatial Analysis: Insights from Beijing User Reviews

1
School of Artificial Intelligence, China University of Geosciences Beijing, Beijing 100083, China
2
Hebei Key Laboratory of Geospatial Digital Twin and Collaborative Optimization, China University of Geosciences Beijing, Beijing 100083, China
3
Technology Innovation Center for Territory Spatial Big-Data, Ministry of Natural Resources of the People’s Republic of China, Beijing 100036, China
*
Author to whom correspondence should be addressed.
ISPRS Int. J. Geo-Inf. 2025, 14(9), 325; https://doi.org/10.3390/ijgi14090325
Submission received: 5 July 2025 / Revised: 7 August 2025 / Accepted: 21 August 2025 / Published: 24 August 2025

Abstract

With the growing adoption of electric vehicles, optimizing the user experience of charging infrastructure has become critical. However, extracting actionable insights from the vast number of user reviews remains a significant challenge, impeding demand-driven operational planning for charging stations and degrading the user experience. This study leverages three pre-trained language models to perform sentiment classification and multi-level topic identification on 168,129 user reviews from Beijing, facilitating a comprehensive understanding of user feedback. The experimental results reveal significant task-model specialization: RoBERTa-WWM excels in sentiment analysis (accuracy = 0.917) and fine-grained topic identification (Micro-F1 = 0.844), making it ideal for deep semantic extraction. Conversely, ELECTRA, after sufficient training, demonstrates a strong aptitude for coarse-grained topic summarization, highlighting its strength in high-level semantic generalization. Notably, the models offer capabilities beyond simple classification, including autonomous label normalization and the extraction of valuable information from comments with low information density. Furthermore, integrating textual and spatial analyses revealed striking patterns. We identified an urban–rural emotional gap—suburban users are more satisfied despite fewer facilities—and used geographically weighted regression (GWR) to quantify the spatial differences in the factors affecting user satisfaction in Beijing’s districts. We identified three types of areas requiring differentiated strategies, as follows: the northwestern region is highly sensitive to equipment quality, the central urban area has a complex relationship between supporting facilities and satisfaction, and the emerging adoption area is more sensitive to accessibility and price factors. These findings offer a data-driven framework for charging infrastructure planning, enabling operators to base decisions on real-world user feedback and tailor solutions to specific local contexts.

1. Introduction

The global transition to electric vehicles (EVs) has shifted consumer concerns from “range anxiety” to “charging anxiety”, making the user experience of charging infrastructure critical for widespread adoption [1,2]. User-generated content (UGC) from online reviews provides valuable insights for transforming public feedback into actionable infrastructure planning decisions [3], though extracting meaningful patterns from this massive data volume remains computationally challenging.
Natural language processing (NLP) approaches for analyzing user feedback have evolved considerably. Early lexicon-based methods gave way to traditional machine learning models requiring extensive feature engineering [4]. Deep learning architectures subsequently automated this process, with models, like the convolutional neural network (CNN) and long short-term memory (LSTM), proving effective for sentiment classification tasks [5,6,7,8]. The emergence of pre-trained language models (PLMs) marked a significant advancement, with BERT revolutionizing the field through large-scale pre-training and task-specific fine-tuning [9]. Chinese-adapted variants, like RoBERTa-WWM and ELECTRA, have further enhanced performance for Chinese text analysis [10,11,12].
Despite these advances, applying NLP methods to EV charging feedback reveals significant research gaps. Current sentiment analysis research focuses heavily on single-level tasks, lacking frameworks that provide multi-granularity output combining sentiment with both coarse and fine-grained topic identification [13,14]. This limitation prevents operators from obtaining the comprehensive insights needed for both strategic planning and operational management.
Additionally, user review analysis typically lacks spatial perspective, treating feedback as location-independent data despite the geographical nature of charging infrastructure [15,16]. EV charging feedback presents unique analytical challenges distinct from general infrastructure assessment. The domain involves technical terminology and complex operational factors, including charging speed, equipment reliability, and payment systems [17]. EV charging also exhibits counterintuitive spatial patterns where urban areas often show lower satisfaction despite higher infrastructure investment [18]. Beijing, with over 600,000 registered EVs and the world’s largest public charging network, provides an ideal context for developing domain-specific analytical approaches. Moreover, Beijing’s ambitious charging infrastructure expansion plans, including the construction of over 1000 ultra-fast charging stations by 2025 and enhanced EV adoption incentives, underscore the critical need for data-driven planning methodologies.
While PLMs have been widely applied to Chinese text analysis, their application to EV charging infrastructure remains limited. Recent studies demonstrate that domain-specific approaches significantly outperform general frameworks for EV user feedback analysis [18]. The technical terminology and multi-dimensional nature of charging experiences require specialized analytical approaches [19].
Current approaches to UGC data quality rely primarily on preprocessing filters, overlooking the potential for PLMs to autonomously refine data during training [20,21,22]. This represents a missed opportunity for improving performance and recovering valuable insights from seemingly low-quality content.
To address these limitations, this study develops and compares three Chinese PLMs (BERT, RoBERTa-WWM, and ELECTRA) for analyzing 168,129 user reviews from Beijing. We make three main contributions, namely developing a unified framework for multi-granularity sentiment and topic analysis; integrating text analysis with spatial data through geographically weighted regression to reveal spatial heterogeneity in user satisfaction; and demonstrating autonomous data refinement capabilities that extract value from low-density comments. Our findings enable the transition from reactive service to proactive, location-aware infrastructure management.
The remainder of this paper is organized as follows: Section 2 details the data handling. Section 3 outlines the methodology. Section 4 presents the results, including model comparisons, data refinement capabilities, and spatial analysis. Section 5 provides the conclusion and future outlook.

2. Data Collection and Processing

2.1. Data Acquisition

The data for this study are sourced from public reviews on two apps, Star Charge and TELD, which are among China’s leading public charging service operators. As of December 2023, the combined market share of these two operators in China’s public charging sector exceeds 50%, making their user review data highly representative.
The data we gathered primarily come from the comment sections of all charging stations located in Beijing on these two charging apps. The data collection process utilizes network packet capture and automated scripting technologies, regularly retrieving the official interfaces of both applications to obtain the latest data. The collected data include comment content, user ratings, timestamps, charging station IDs, and geographic location information. The entire data collection process strictly complies with relevant laws, regulations, and platform terms of use, and does not involve any user personal data. We only collect comment content publicly shared by users and do not include user IDs, contact information, or other personally identifiable information. The data are kept within the limits permitted by the platform to avoid disrupting its normal operations.
To ensure user privacy protection, the following specific measures have been implemented: (1) Automated screening and anonymization of all content that may contain personal information; (2) complete separation of comment data from user identity information, retaining only comment content, time, and geolocation information; (3) geolocation information is only precise to the charging station level and does not track real-time user locations. These measures ensure that the research process adheres to data ethics requirements while protecting user rights.

2.2. Data Statistics and Pre-Processing

A total of 168,129 original reviews were collected for this study, comprising 85,223 reviews from 526 charging stations on the Star Charge platform and 82,906 reviews from 434 charging stations on the TELD platform. All charging stations are located in Beijing.
To enhance the effectiveness of model training, this experiment requires a systematic approach to carefully prepare the raw data. First, we remove content that is objectively devoid of informational value, as it cannot provide meaningful feedback. This includes operators’ marketing materials, promotional advertisements, and posts lacking substantial textual feedback. Next, we remove redundant elements, such as emojis, URLs, and HTML tags, from the text while retaining important Chinese punctuation marks to preserve sentence integrity and original meaning. Additionally, we reprocess incomplete or unlabeled comments and standardize label formats to eliminate inconsistencies. It is important to note that the pre-trained model has limitations on the length of input text. Therefore, comments exceeding the limit will be truncated during the experiment. To address the issue of uneven distribution of sentiment categories in the classification task, a balancing strategy is adopted, which involves downsampling larger categories and upsampling smaller categories. After this comprehensive cleaning and preprocessing stage, a high-quality dataset containing 59,057 valid comments is obtained for model training and evaluation.
The significant reduction from 168,129 comments to 59,057 primarily represents the necessary and rigorous filtering of irrelevant content. However, we retained semantically meaningful but ambiguously classified feedback, which may have potential value but is too vague, complex, or multidimensional for human annotators to confidently classify into a single specific category. It is crucial to identify it so that we can filter out truly useless content while retaining semantically rich but ambiguously classified feedback for future processing through model optimization.

2.3. Data Annotation Strategy

2.3.1. Sentiment Labeling

The allocation of sentiment labels is achieved through a methodology that integrates automation with manual calibration. An initial automated annotation of the comments was performed using a large language model’s API to classify them into four categories, as delineated in Table 1. Importantly, this automated annotation process was implemented as an iterative, multi-round refinement procedure involving systematic prompt optimization, intermediate human validation, and continuous quality assessment until satisfactory annotation consistency was achieved. Furthermore, empirical studies have demonstrated that ChatGPT outperforms crowd workers in text annotation tasks across multiple domains, with zero-shot accuracy exceeding crowd workers by approximately 25 percentage points while maintaining superior intercoder agreement [23], validating the effectiveness of API-based annotation when properly implemented with quality control measures. Moreover, recent advances in automated annotation for clinical NLP have shown that LLM-based annotation systems can achieve expert-level performance while significantly reducing annotation costs and time requirements [24].
After the automated labeling was completed, we implemented a comprehensive quality assurance protocol involving multiple validation stages. First, we cross-validated the results and submitted inconsistent samples for manual review, focusing particularly on cases where the automated system exhibited low confidence scores or conflicting predictions. Second, we randomly selected 40% of the data for full manual review to ensure final annotation quality. This extensive human validation approach aligns with best practices demonstrated in high-impact studies, where strategic human oversight of automated annotation systems has been shown to maintain annotation reliability while preserving efficiency gains [25]. Furthermore, the iterative nature of our annotation process, involving multiple rounds of prompt refinement and validation, ensures that potential systematic biases are identified and corrected before final label assignment, addressing concerns about automated annotation reliability through systematic quality control measures.

2.3.2. Topic Labeling

Topic labeling also adopted a combination of automation and manual verification. Based on suggestions from industry experts and a preliminary analysis, we designed a two-level topic labeling system, i.e., for fine-grained (Table 2) and coarse-grained (Table 3) topics.
The labeling process employs a multi-label classification strategy, meaning that a comment can be attributed to multiple topics. Similar to sentiment annotation, the process starts with automatic classification by an LLM, followed by cross-validation and a 40% random manual review to ensure labeling quality.

2.4. Descriptive Analysis of Data

Figure 1 illustrates the distributional characteristics of the comment dataset.
The distribution of comment lengths is significantly right-skewed, indicating that users tend to post short comments. The distribution of the number of comments per station is also right-skewed, with most stations having a small number of comments and a few having a very large number. Both distributions are “long-tailed”, indicating that there are small but significant outliers in the data, which reflects differences in user engagement and focus.
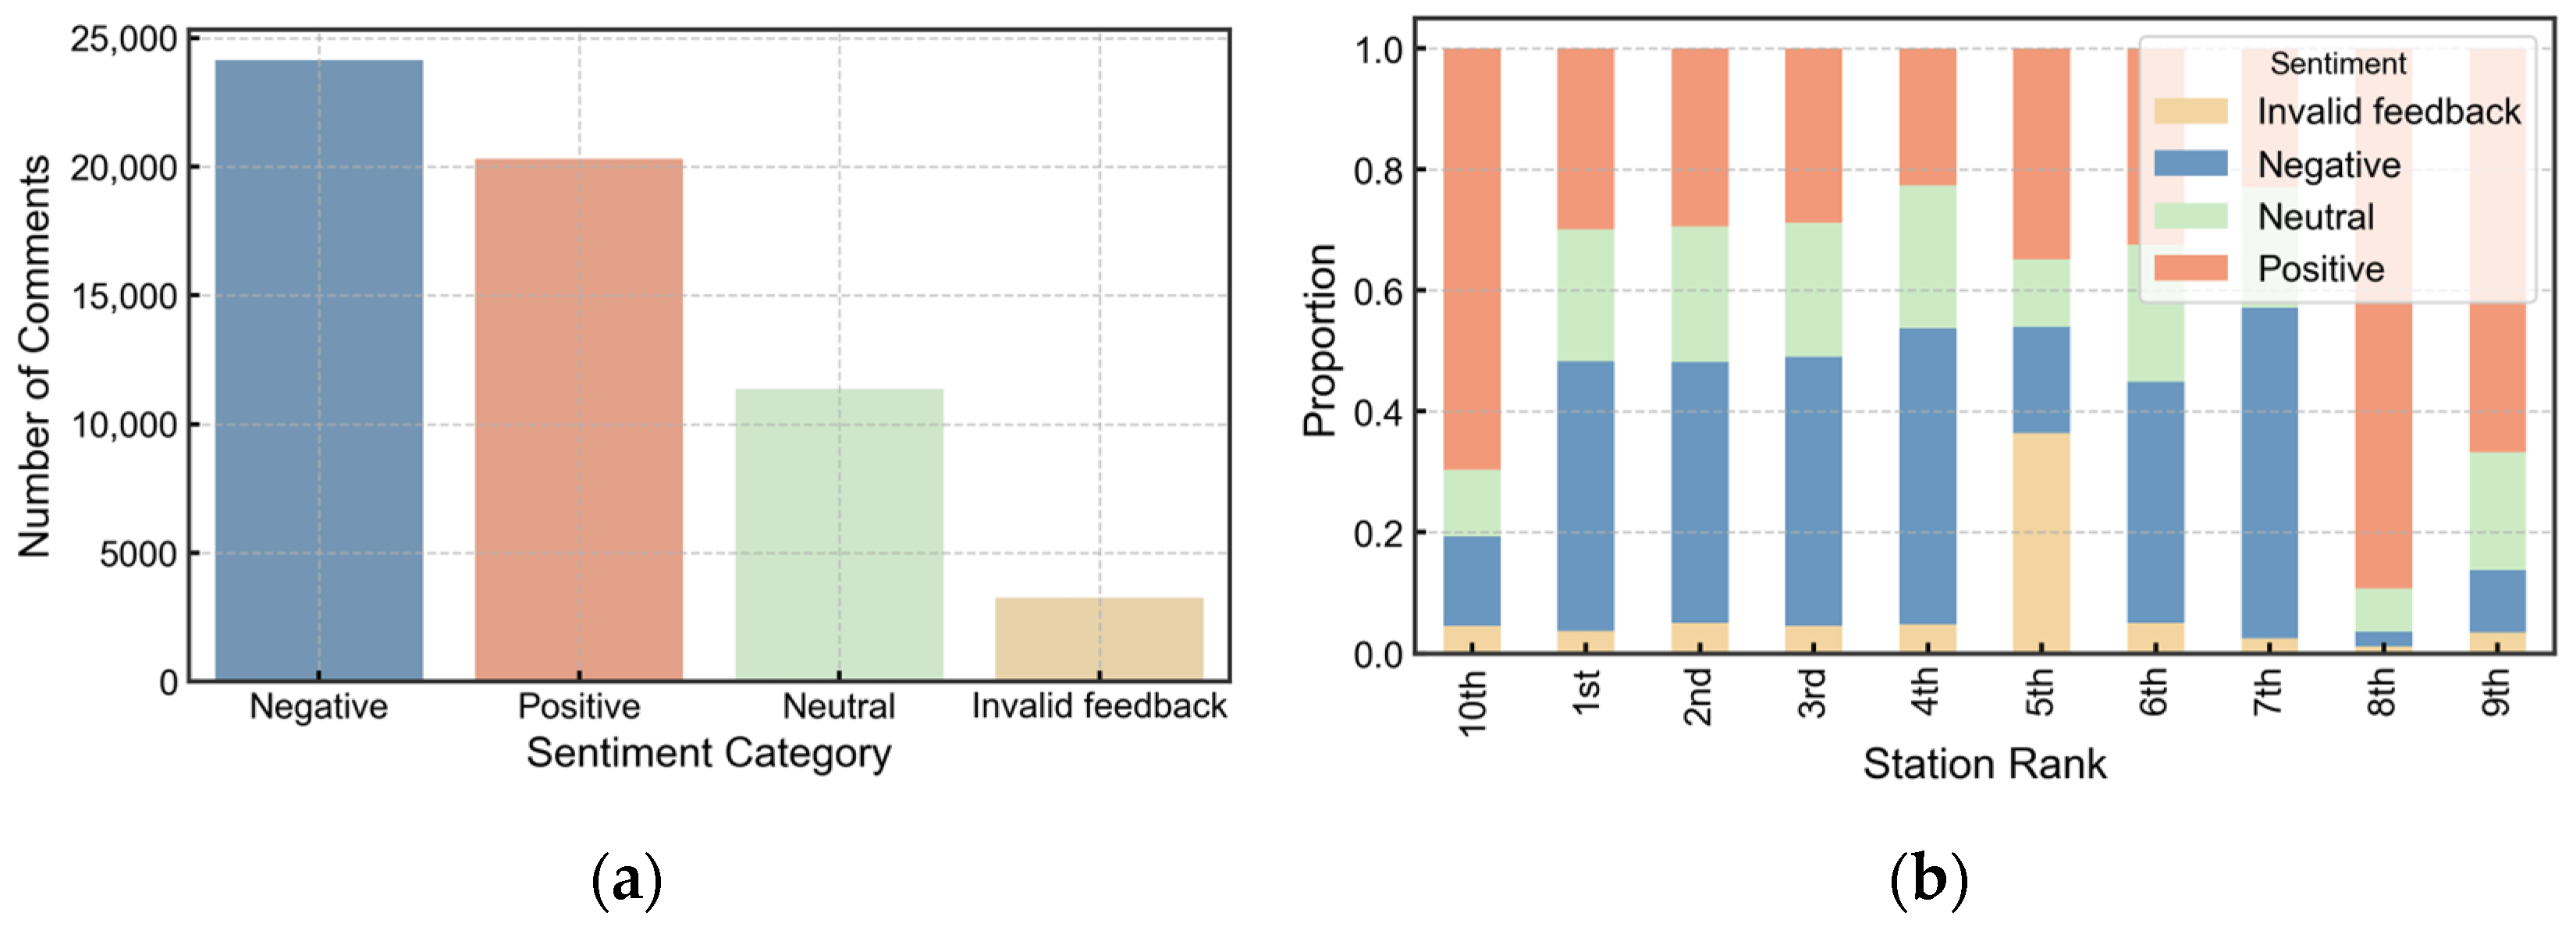
Figure 2 provides an analysis of sentiment distribution.
From Figure 2, it is evident that negative comments are the most frequent category overall, suggesting that users are more inclined to provide feedback on negative experiences. However, a substantial proportion of positive feedback also exists. While the sentiment composition is relatively balanced for most stations, significant differences between individual stations are apparent, reflecting variations in service quality or user base characteristics.
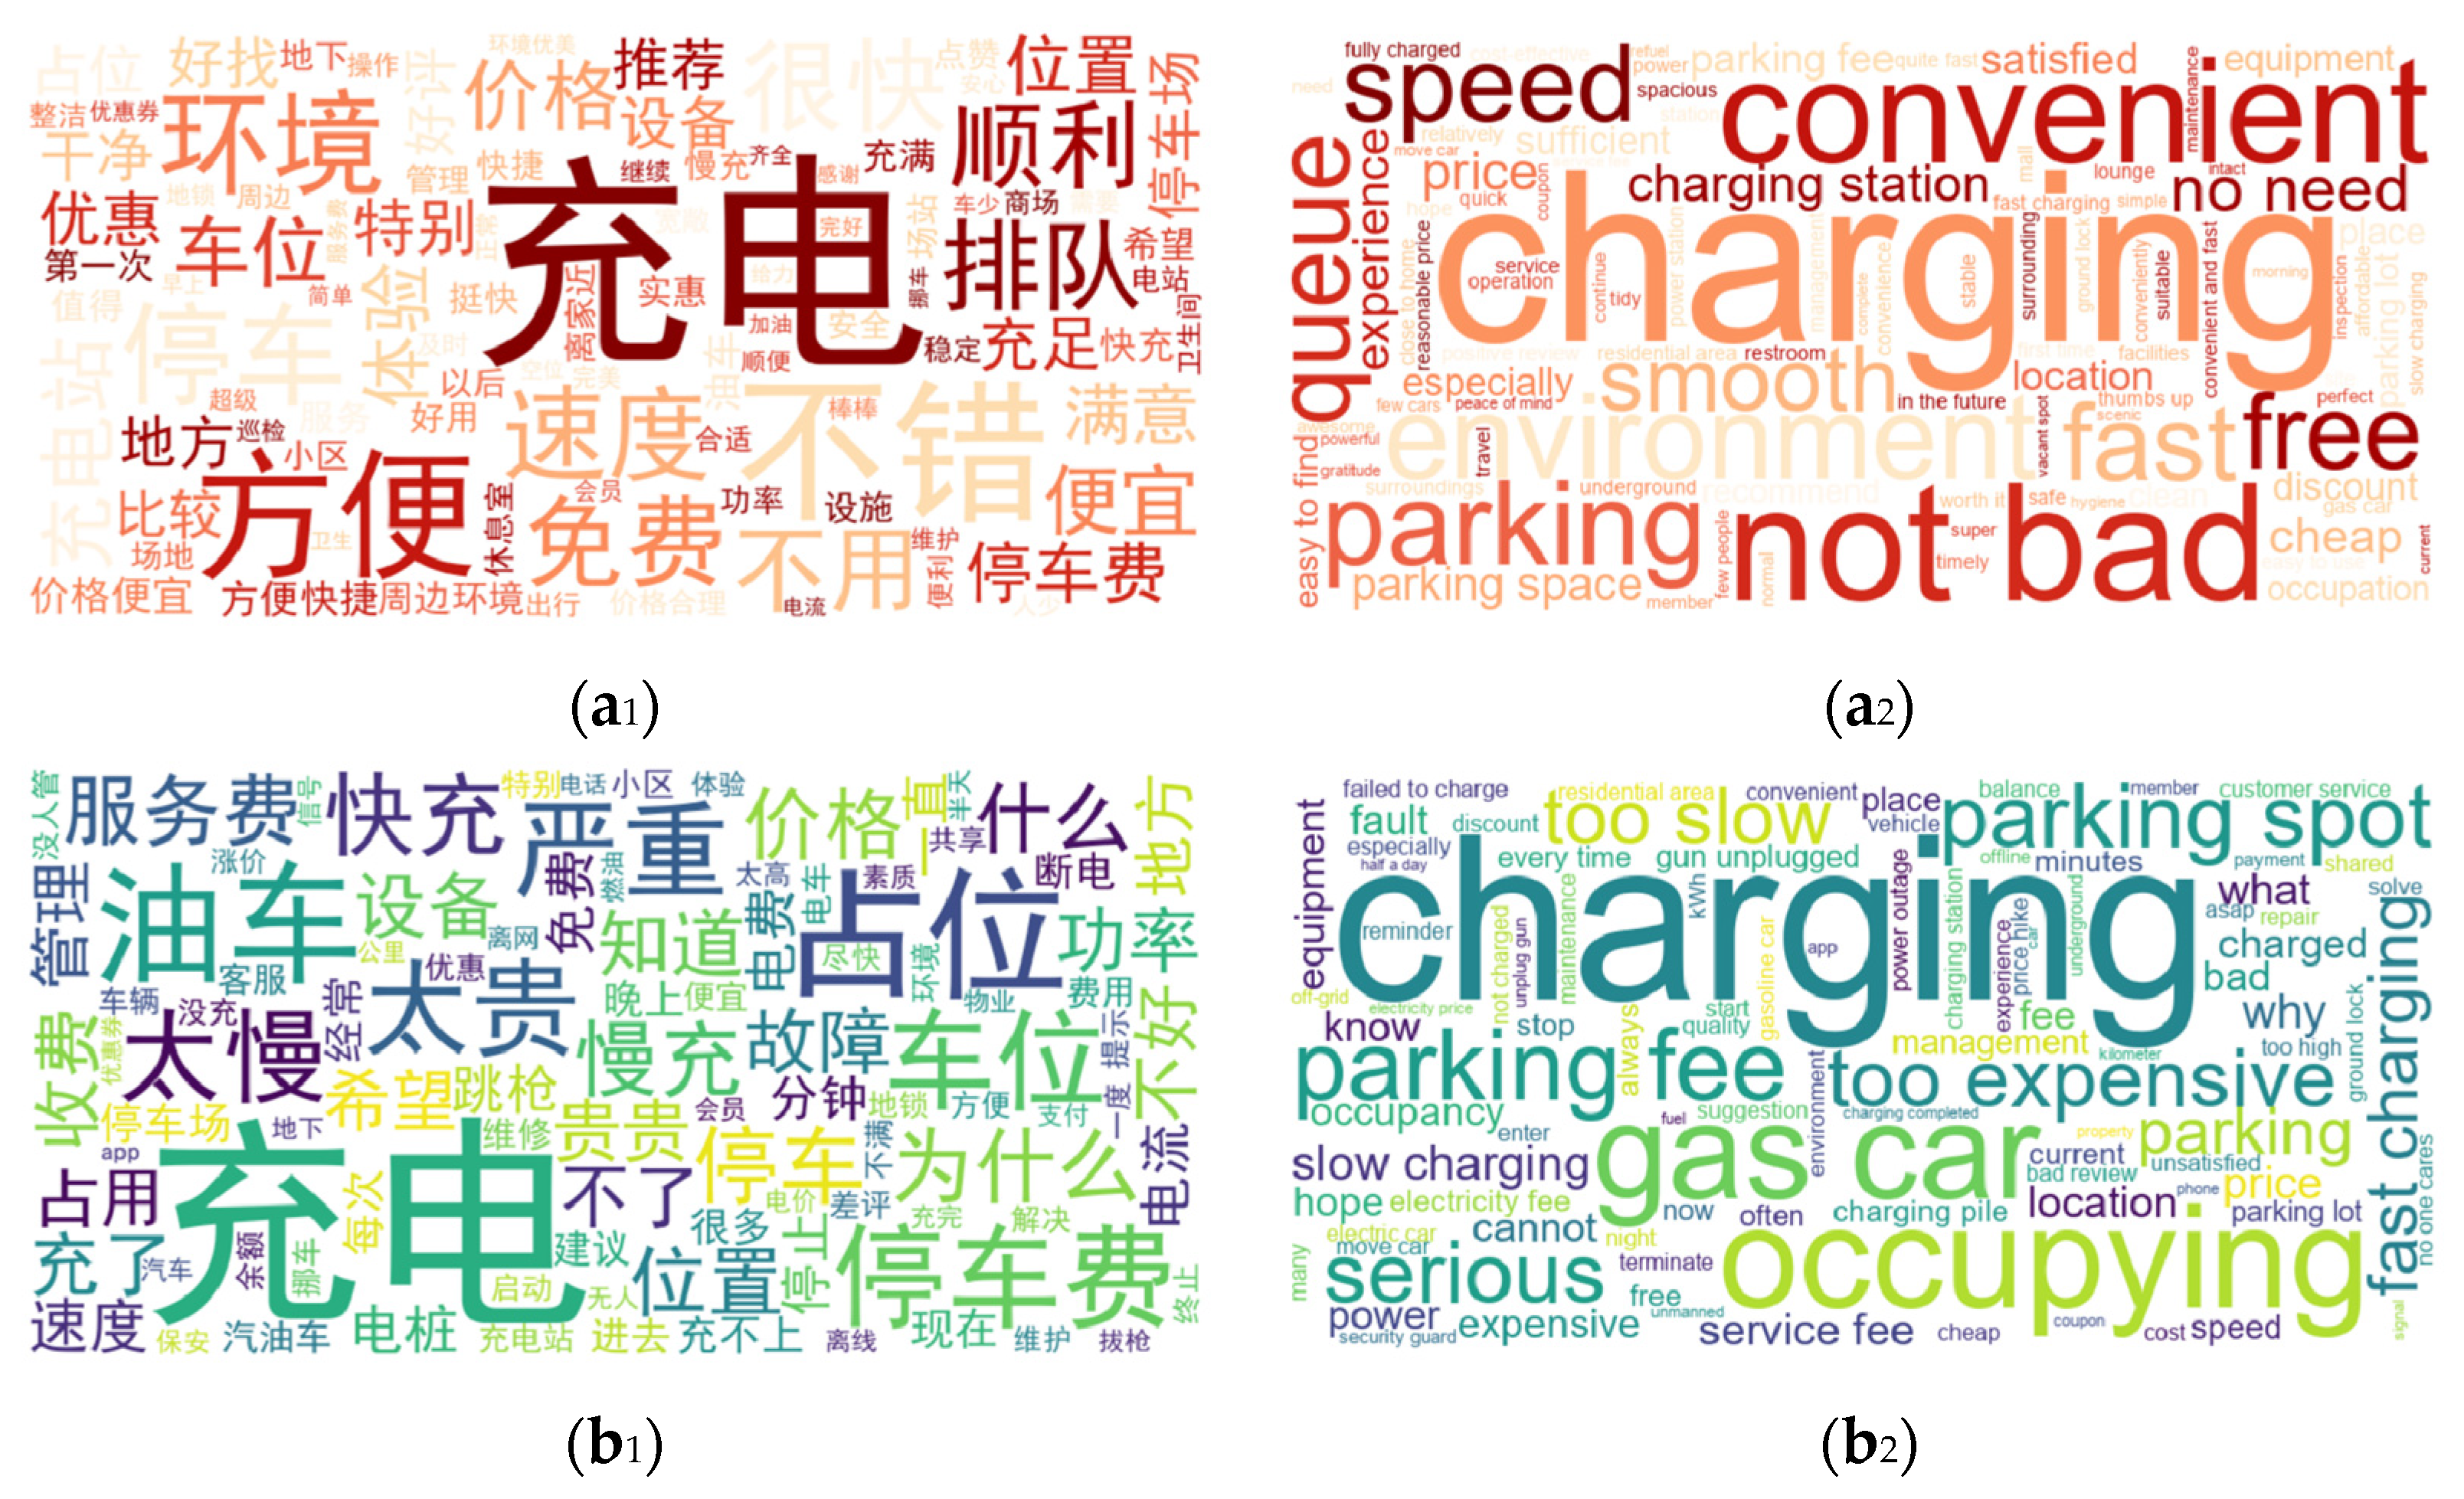
Figure 3 visualizes the most frequent words in comments of different sentiment polarities.
A comparison of the two word clouds reveals that while “charging” is a prominent term in both positive and negative reviews, the focus differs. Positive reviews frequently highlight service convenience and environmental quality. In contrast, negative reviews tend to emphasize issues related to waiting times, availability, and price. This distinction provides clear direction for service quality improvement.

3. Methods

3.1. General Framework

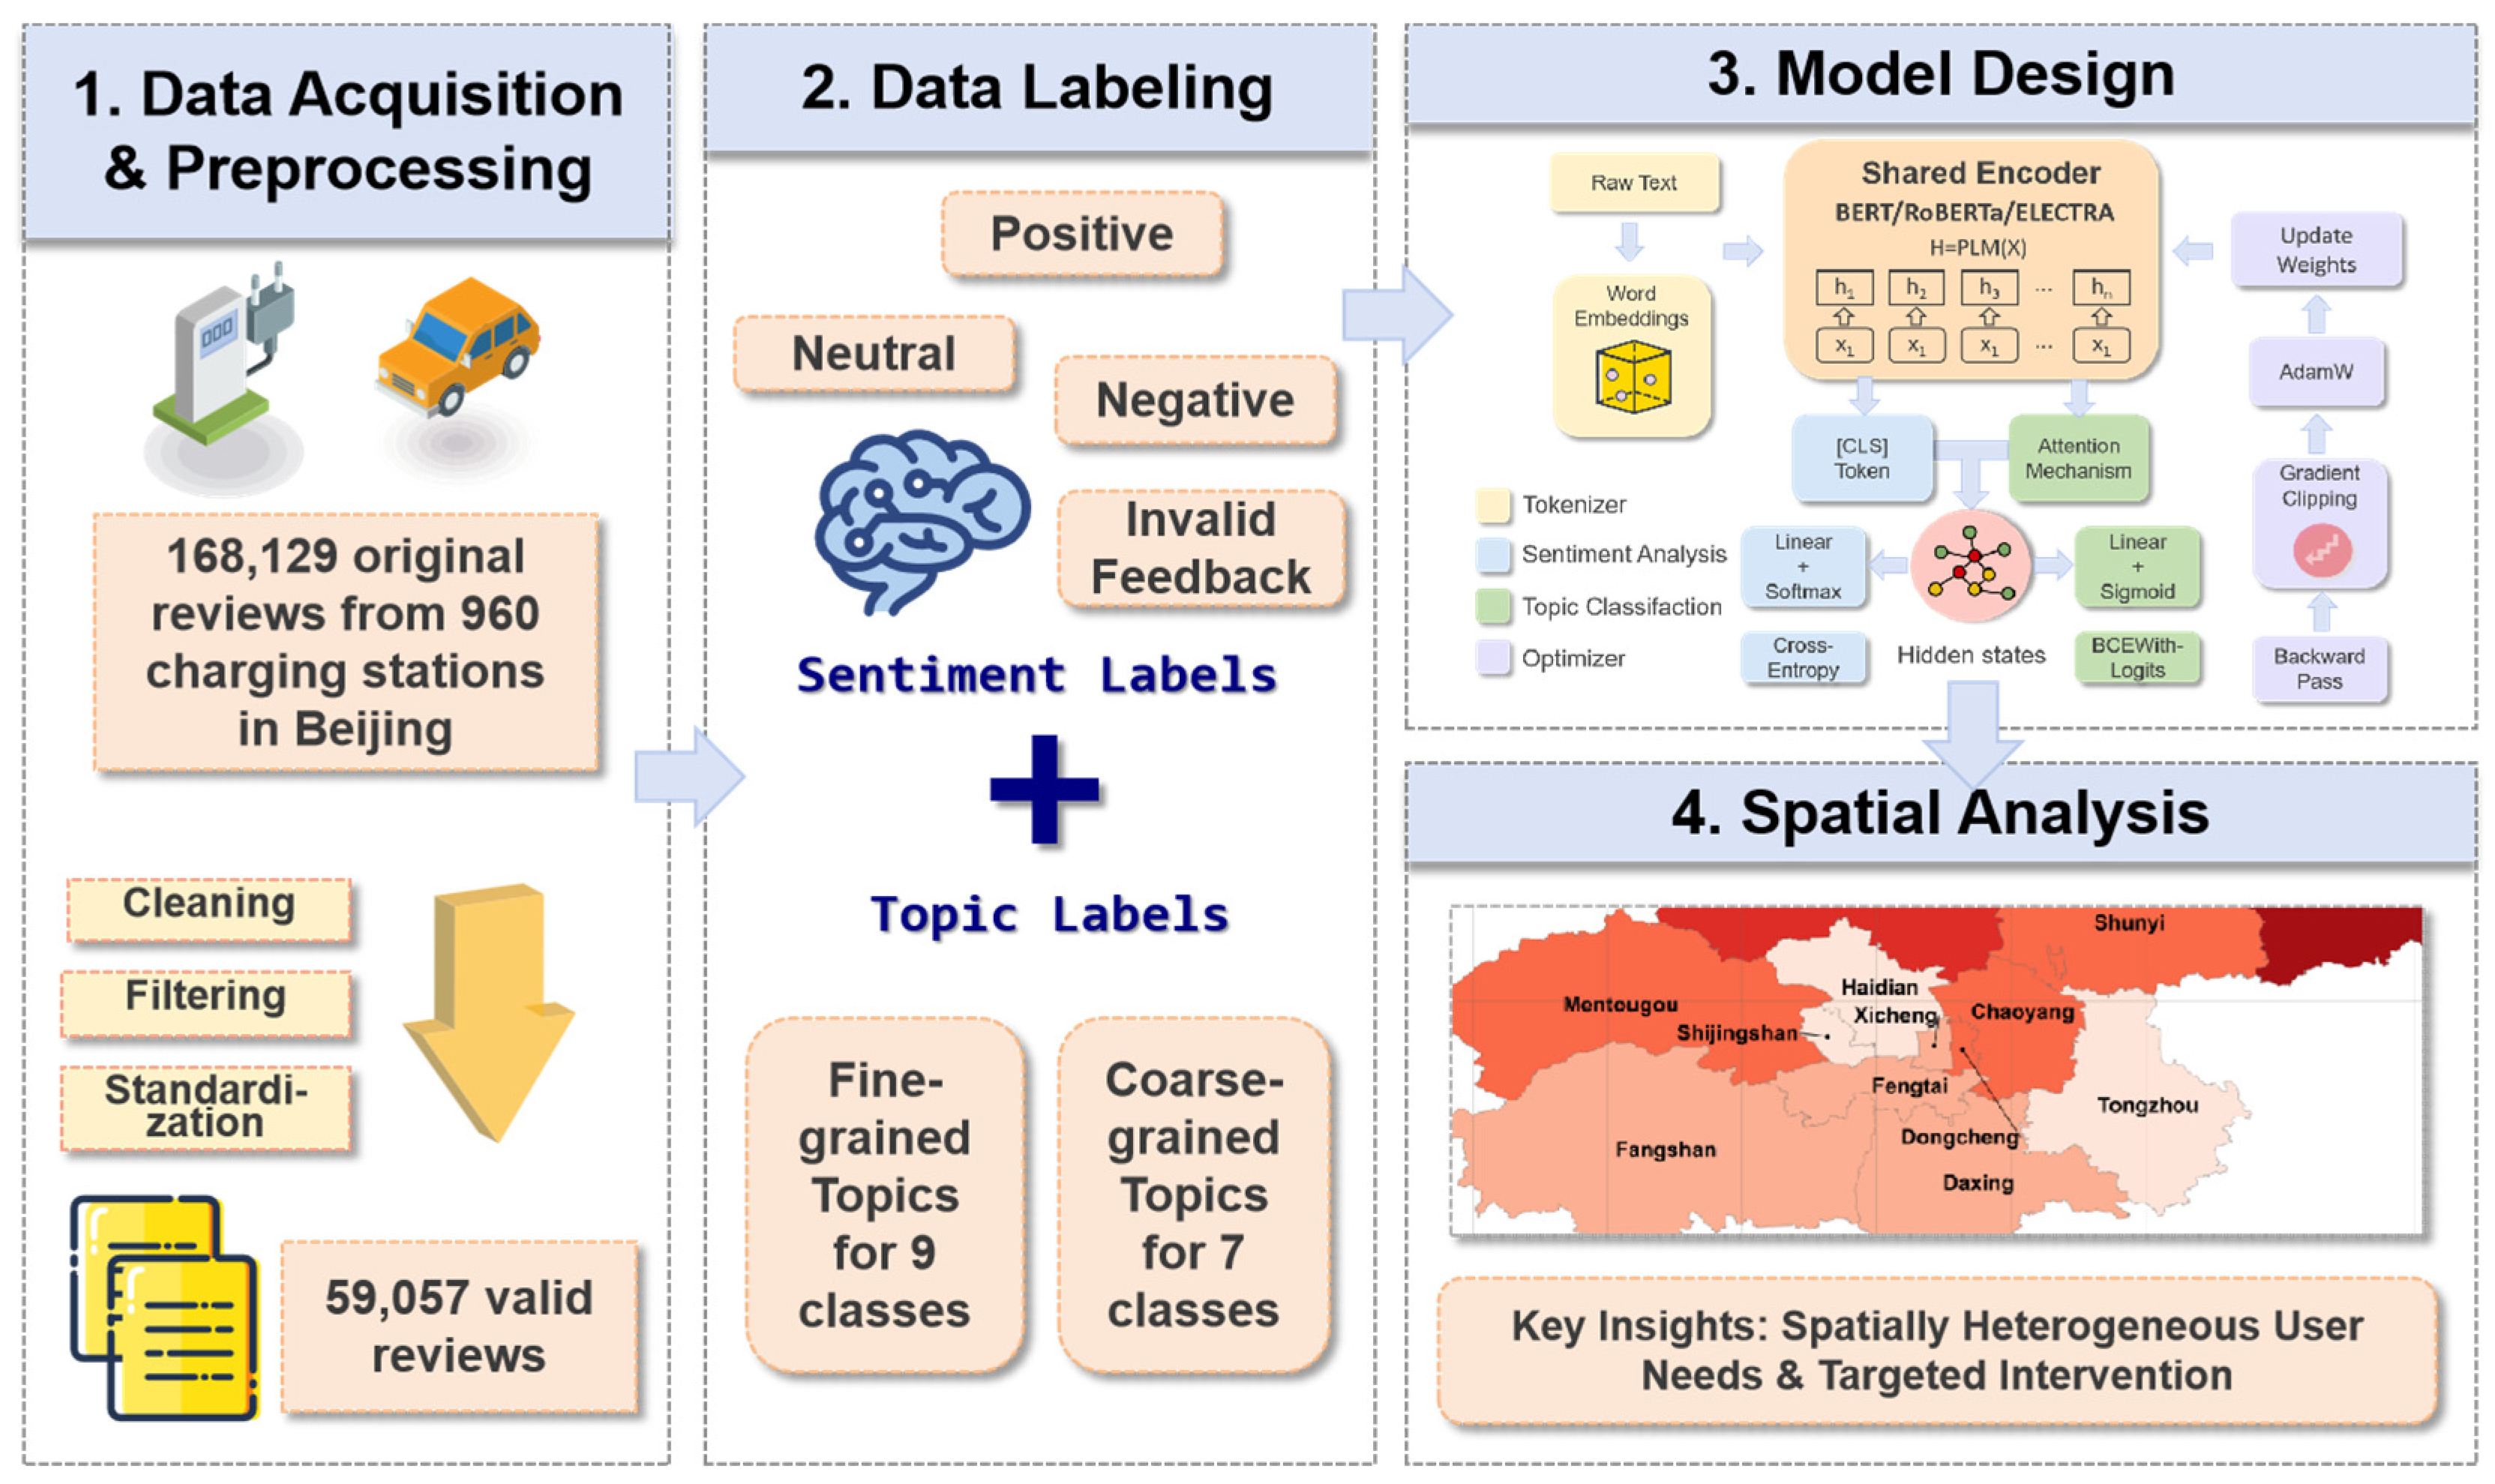
Figure 4 provides a comprehensive overview of our research pipeline, which transforms unstructured user reviews into actionable spatial insights through a four-stage process. The first stage, data collection and pre-processing, begins with the acquisition of 168,129 raw comments from 960 charging stations across Beijing. This dataset undergoes rigorous cleaning, filtering, and standardization to yield 59,057 high-quality, valid reviews. In the second stage, data annotation, we apply a multi-faceted labeling strategy to this refined dataset, assigning each review both sentiment labels (positive, neutral, negative, or invalid feedback) and topic labels at two levels of granularity: fine-grained (nine classes) and coarse-grained (seven classes) [26]. The third stage, model architecture, utilizes these richly annotated data to train classification models based on a unified architecture, which will be detailed in the next subsection. In the final stage, spatial analysis, the structured outputs from the model—predicted sentiments and topics—are integrated with spatial information. This fusion enables spatial analysis of the user experience, including mapping the distribution of sentiment and identifying spatial clusters of specific topics, thereby providing a new dimension of understanding for charging infrastructure management.
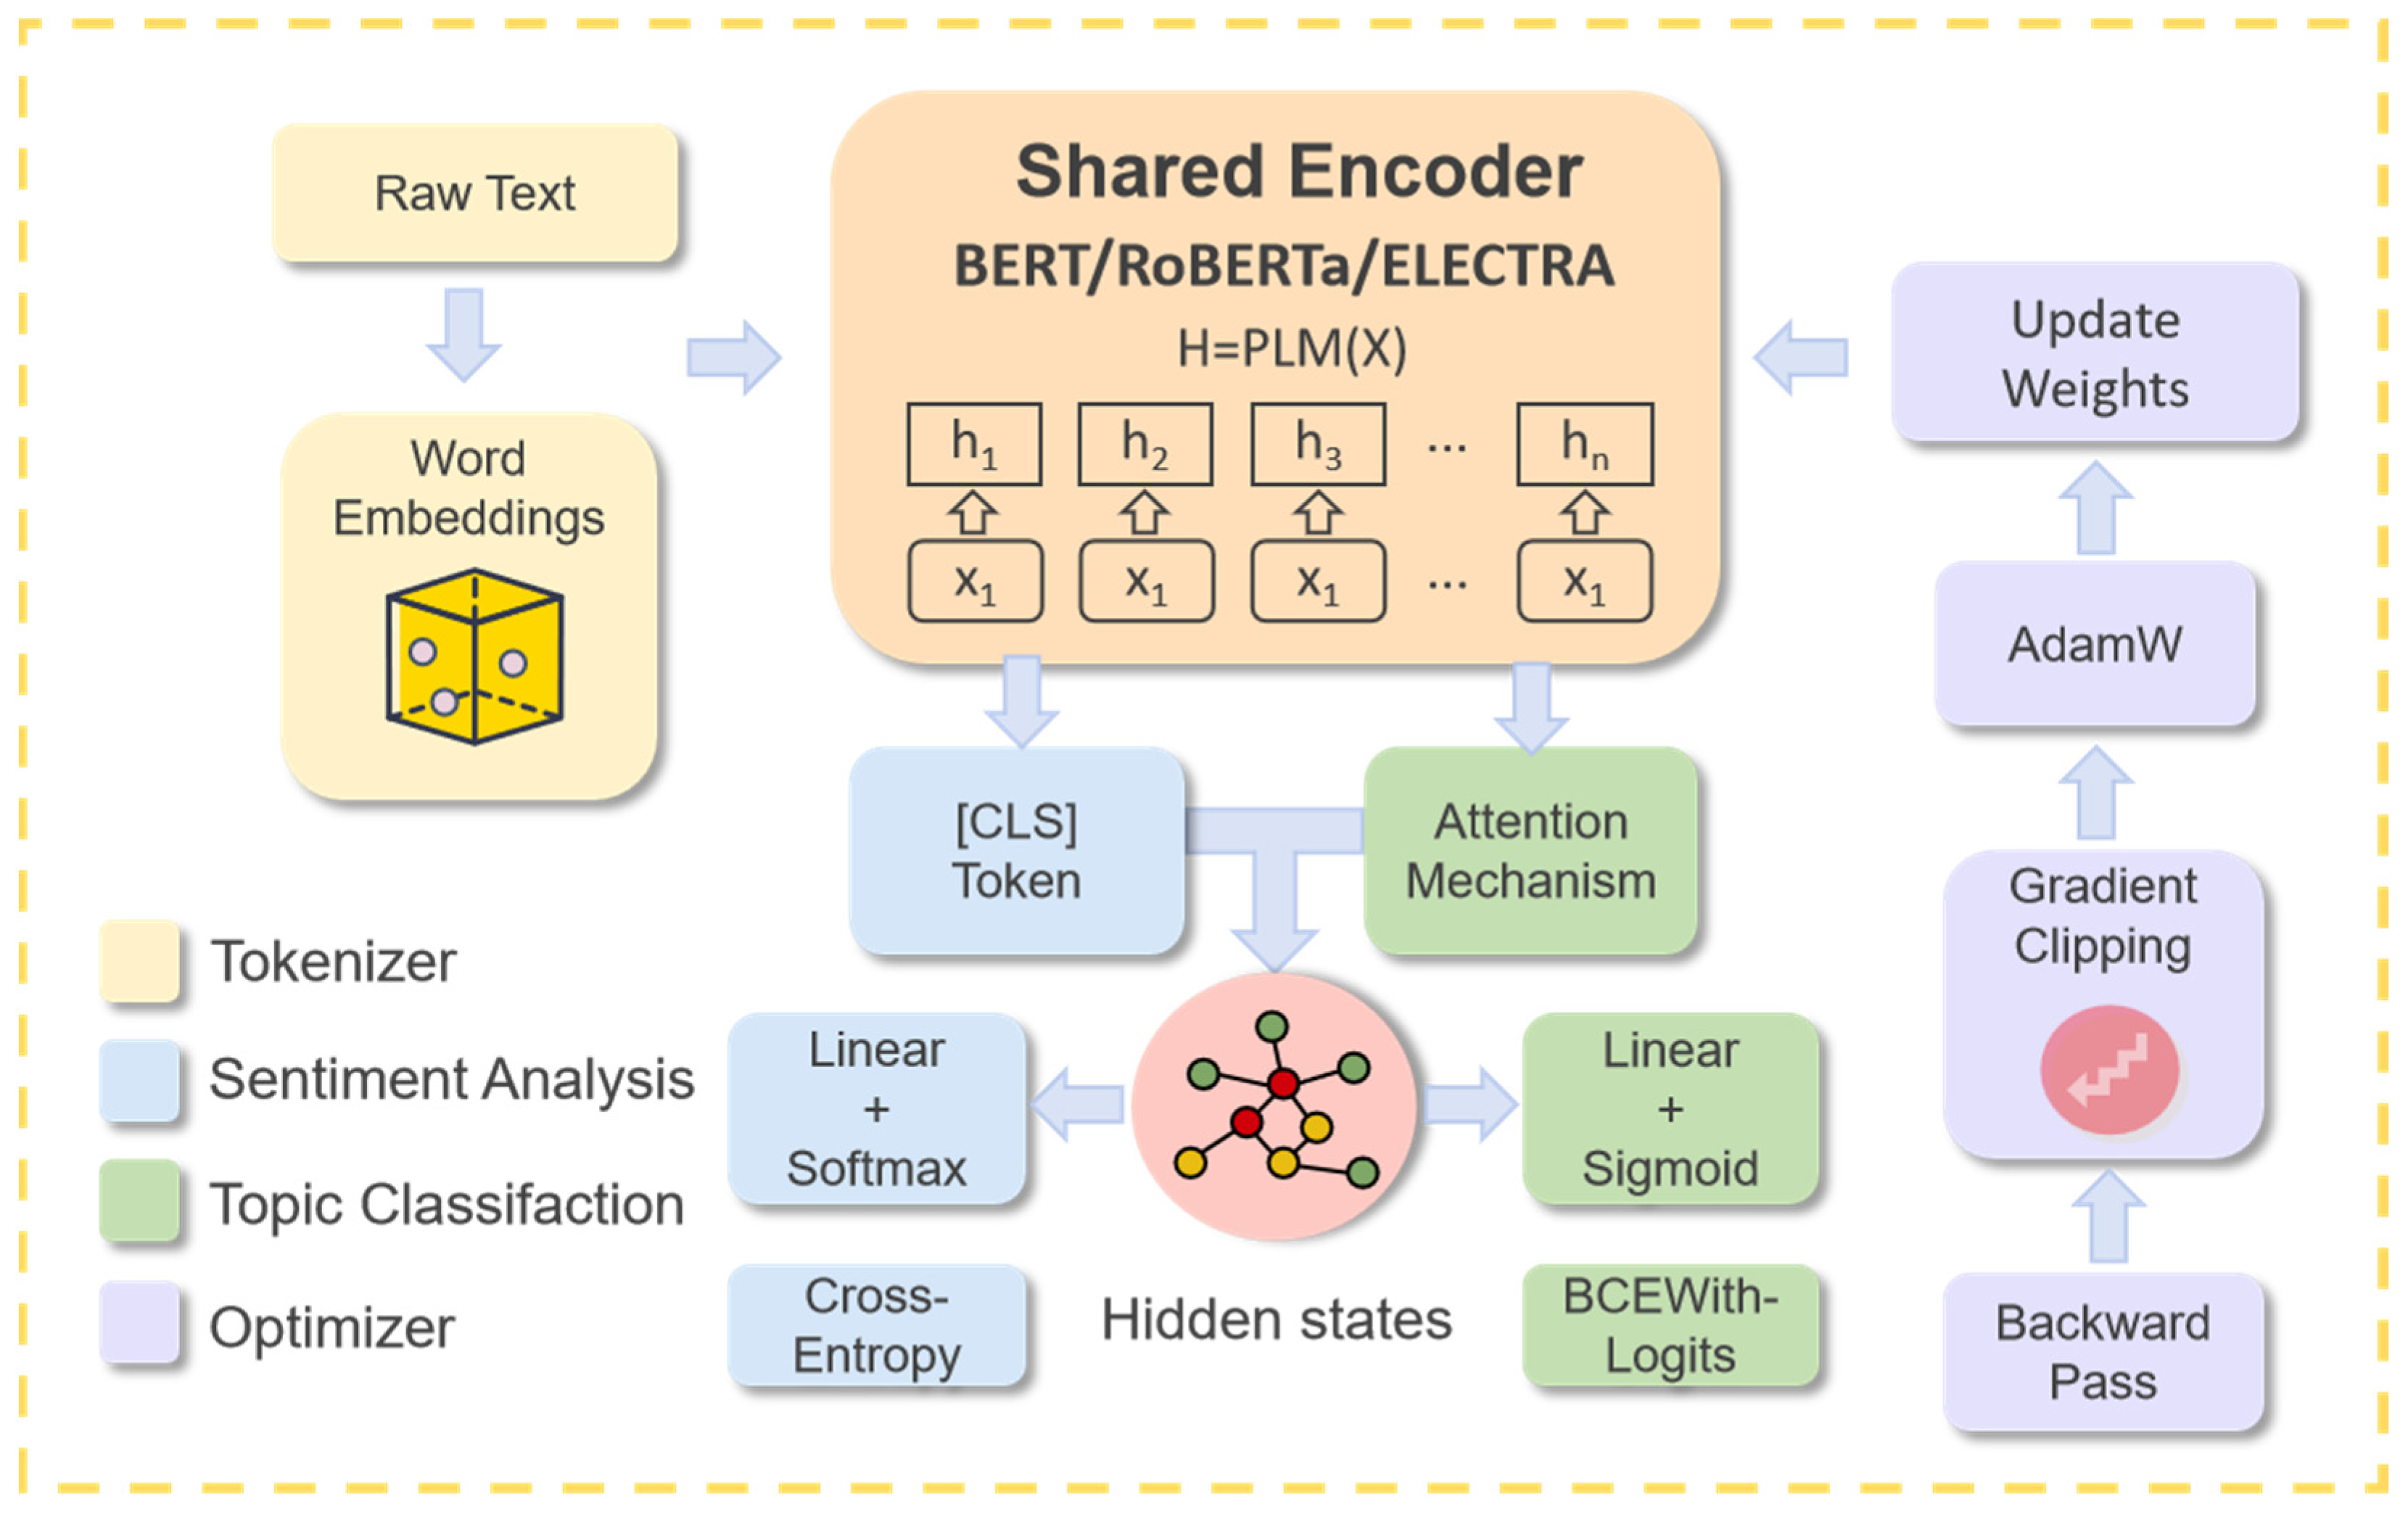
As illustrated in Figure 5, the unified architecture of the model is delineated, encompassing the workflow from data input to model optimization. The process commences with text tokenization, followed by the generation of high-dimensional word embedding vectors. These vectors are then processed by one of three PLMs (BERT, RoBERTa, or ELECTRA) [8,9,11], which act as powerful encoders to generate context-aware hidden state representations for the entire input sequence. From these hidden states, the architecture branches into two independent, task-specific paths [27]. For single-label sentiment analysis, the final hidden state of the special “[CLS]” token is extracted to serve as the sentence-level representation, which is then passed to a linear classifier with a softmax function. For multi-label topic classification, an attention mechanism is first applied to the entire sequence of hidden states to generate a weighted summary vector. This vector is then fed into a linear layer equipped with a sigmoid function. Each path is optimized independently using a corresponding loss function, with cross-entropy for sentiment analysis and binary cross-entropy with logits for topic classification. The training cycle is completed through backpropagation, optional gradient clipping, and the AdamW optimizer, which updates all model weights to improve performance.

3.2. Model Architecture

Our approach is based on the encoder–classifier framework, using independent models for sentiment classification, coarse-grained topic classification, and fine-grained topic classification. For the encoder, we selected three representative Chinese pre-trained language models (PLMs), namely BERT, RoBERTa-WWM, and ELECTRA. Our methodological approach is centered on an encoder–classifier framework, for which we developed independent models for each of our three analytical tasks, namely sentiment analysis, coarse-grained topic classification, and fine-grained topic classification. As mentioned above, for the encoder component, we selected three powerful and representative Chinese pre-trained language models (PLMs), namely BERT, RoBERTa-WWM, and ELECTRA. These models were chosen for several strategic reasons that address both computational efficiency and task-specific performance requirements. Indeed, we deliberately selected smaller-scale BASE models rather than larger language models because of our dataset size, which is substantial for domain-specific analysis but limited relative to the parameter scale of large language models, making smaller models more appropriate to prevent overfitting and ensure robust generalization [28]. Furthermore, the encoder architecture of BERT-series models has been proven superior to generative decoder architectures for text classification tasks, and transformer encoder models consistently outperform GPT-style decoders in classification accuracy, F1 scores, and computational efficiency [29]. Meanwhile, comprehensive performance optimization studies have confirmed that BERT, RoBERTa, and similar encoder-based models maintain sustained leadership in classification performance while offering better resource efficiency and deployment feasibility compared to generative models [30].
The encoder converts the input text into hidden state representations. Subsequently, for single-label sentiment analysis, we utilize the hidden state of the special “[CLS]” token as the aggregated representation of the entire sequence. For multi-label topic classification tasks, we employ an attention pooling mechanism to generate finer-grained representations that highlight key parts of the text.
The pooled vectors are input into the final linear classification layer, with sentiment analysis using softmax and cross-entropy loss, and topic classification using sigmoid and binary cross-entropy loss. Algorithm 1 details the complete training process. All models are trained using the AdamW optimiser.
Algorithm 1: Multi-task PLM framework
Input: 
dataset  D = { ( X i , Y i ) } i = 1 N , model  PLM { BERT ,   RoBERTa ,   ELECTRA } , Task type  T { S e n t i m e n t , T o p i c } , learning rate  η , weight decay  λ , batch size  B , max epochs  E
Output: 
Trained model parameters  θ
1:    Initialize model parameters  θ  (PLM encoder and classification head)
2:    Initialize AdamW optimizer with learning rate  η  and weight decay  λ
3:    for epoch = 1 to  E  do:
4:                  for each batch  ( X batch , Y batch )  from  D  do:
5:                              Obtain contextualized hidden states:  H = P L M ( X batch ) , where  H R B × L × D
6:                                 if  T = S e n t i m e n t  then:
7:                                        Aggregate representation using the [CLS] token:  v = H [ : , 0 , : ]
8:                             else if  T = T o p i c  then:
9:                                                       Compute attention scores:  u t = t a n h ( W w h t + b w )
10:                                                   Compute attention weights:  α t = e x p ( u t T u w ) j = 1 L     e x p ( u j T u w )
11:                                                  Create context vector:  v = t = 1 L   α t h t
                        end if
12:                            Pass pooled vector through the final linear layer to get logits:  o ˆ = L i n e a r ( v )
13:                            if  T = S e n t i m e n t  then:
14:                                                Apply softmax to get probabilities:  y ˆ = s o f t m a x ( o ˆ )
15:                                                Compute Cross-Entropy Loss:  L = 1 B i = 1 B   j = 1 C   y i j l o g ( y ˆ i j )
16:                                 else if  T = T o p i c  then:
17:                                             Compute Binary Cross-Entropy with Logits Loss:
L = 1 B i = 1 B   j = 1 M   [ y i j l o g ( σ ( o ˆ i j ) ) + ( 1 y i j ) l o g ( 1 σ ( o ˆ i j ) ) ]
18:                                        end if
19:                                        Perform backpropagation to compute gradients  θ L
20:                                        Update model parameters using the optimizer:  θ O p t i m i z e r S t e p ( θ , θ L )
21:                      end for
22:    end for
23:    return  θ  
It is worth noting that sentiment analysis and topic classification tasks are designed as independent tasks in our multi-task framework to ensure that they are not influenced by cross-task effects during inference. This ensures the interpretability of each task while allowing the shared encoder to learn a generalized representation applicable to both tasks.

3.3. Experimental Setup

3.3.1. Evaluation Indicators

After model training, the following metrics were selected for evaluation. For detailed information, please refer to Table 4.
For imbalanced datasets, Micro-F1 serves as the primary metric, as it reflects overall predictive effectiveness across all classes, while Macro-F1 provides insight into per-class performance equality.

3.3.2. Hyperparameterization

To systematically investigate the impact of different optimization strategies on model performance, we designed five distinct hyperparameter configurations (A–E), detailed in Table 5 Each configuration was designed to test a specific hypothesis regarding model training.
The rationale for each configuration is as follows.
Configuration A (baseline): Establishes a standard set of hyperparameters to serve as a reference point for all other experiments.
Configuration B (large batch and low learning rate): Explores the effect of a larger batch size (128) combined with a lower learning rate (1 × 10⁻⁵), a strategy aimed at achieving more stable gradient updates.
Configuration C (long sequence): Doubles the maximum sequence length to 256 to assess the model’s capacity to leverage longer contextual information. To counteract potential overfitting, the batch size was halved to 32 and the dropout rate was increased to 0.2.
Configuration D (sentiment-focused): Prioritizes the sentiment analysis task by increasing its loss weight to 1.5 and setting the early stopping criterion to monitor the validation Macro-F1 score for sentiment classification.
Configuration E (extended training): Investigates the impact of prolonged training by increasing the number of epochs to 30 and extending the early stopping patience to 5, allowing the model more time to converge.
In addition, to ensure the reliability and statistical significance of the experimental results, each set of experiments was run independently five times using different random seeds (42, 43, 44, 45, and 46). The final reported performance is the mean and standard deviation of these five runs.

4. Results and Discussion

4.1. Overall Model Performance Comparison

This section begins with a macroscopic comparison of the best performance achieved by the three pre-trained models (BERT, RoBERTa-WWM, ELECTRA) across tasks, aiming to identify the relative strengths of the different models in specific tasks.
As demonstrated in Figure 6, the models exhibit significantly divergent performance characteristics and task specialization, with no single model configuration proving optimal for all tasks. This underscores the importance of precise calibration for distinct tasks. In terms of optimal performance, RoBERTa-WWM emerges as the leading model, attaining the highest scores across all three tasks. As shown in the charts, it achieves the highest scores in sentiment analysis, fine-grained topic classification, and coarse-grained topic classification. This suggests that the whole-word masking (WWM) pre-training strategy is particularly effective at capturing the diverse semantic features present in user feedback data. While RoBERTa-WWM demonstrated the highest peak performance, the violin plot offers a more comprehensive perspective on performance distribution. BERT demonstrated robust and consistent performance, particularly in topic classification. ELECTRA also consistently achieved high scores in the sentiment analysis task. The exceptional performance of RoBERTa-WWM, when combined with varied optimal configurations for different tasks, indicates a key finding: although strong pre-training objectives, like WWM, provide a robust foundation, fully realizing a model’s potential requires targeted optimizations based on the specific architectural and feature requirements of the downstream task.

4.2. Sentiment Analysis Results

4.2.1. Model Performance on Sentiment Recognition

The sentiment recognition task aims to determine the overall sentiment tendency of user comments. This section examines the performance of various models and hyperparameter configurations on this task.
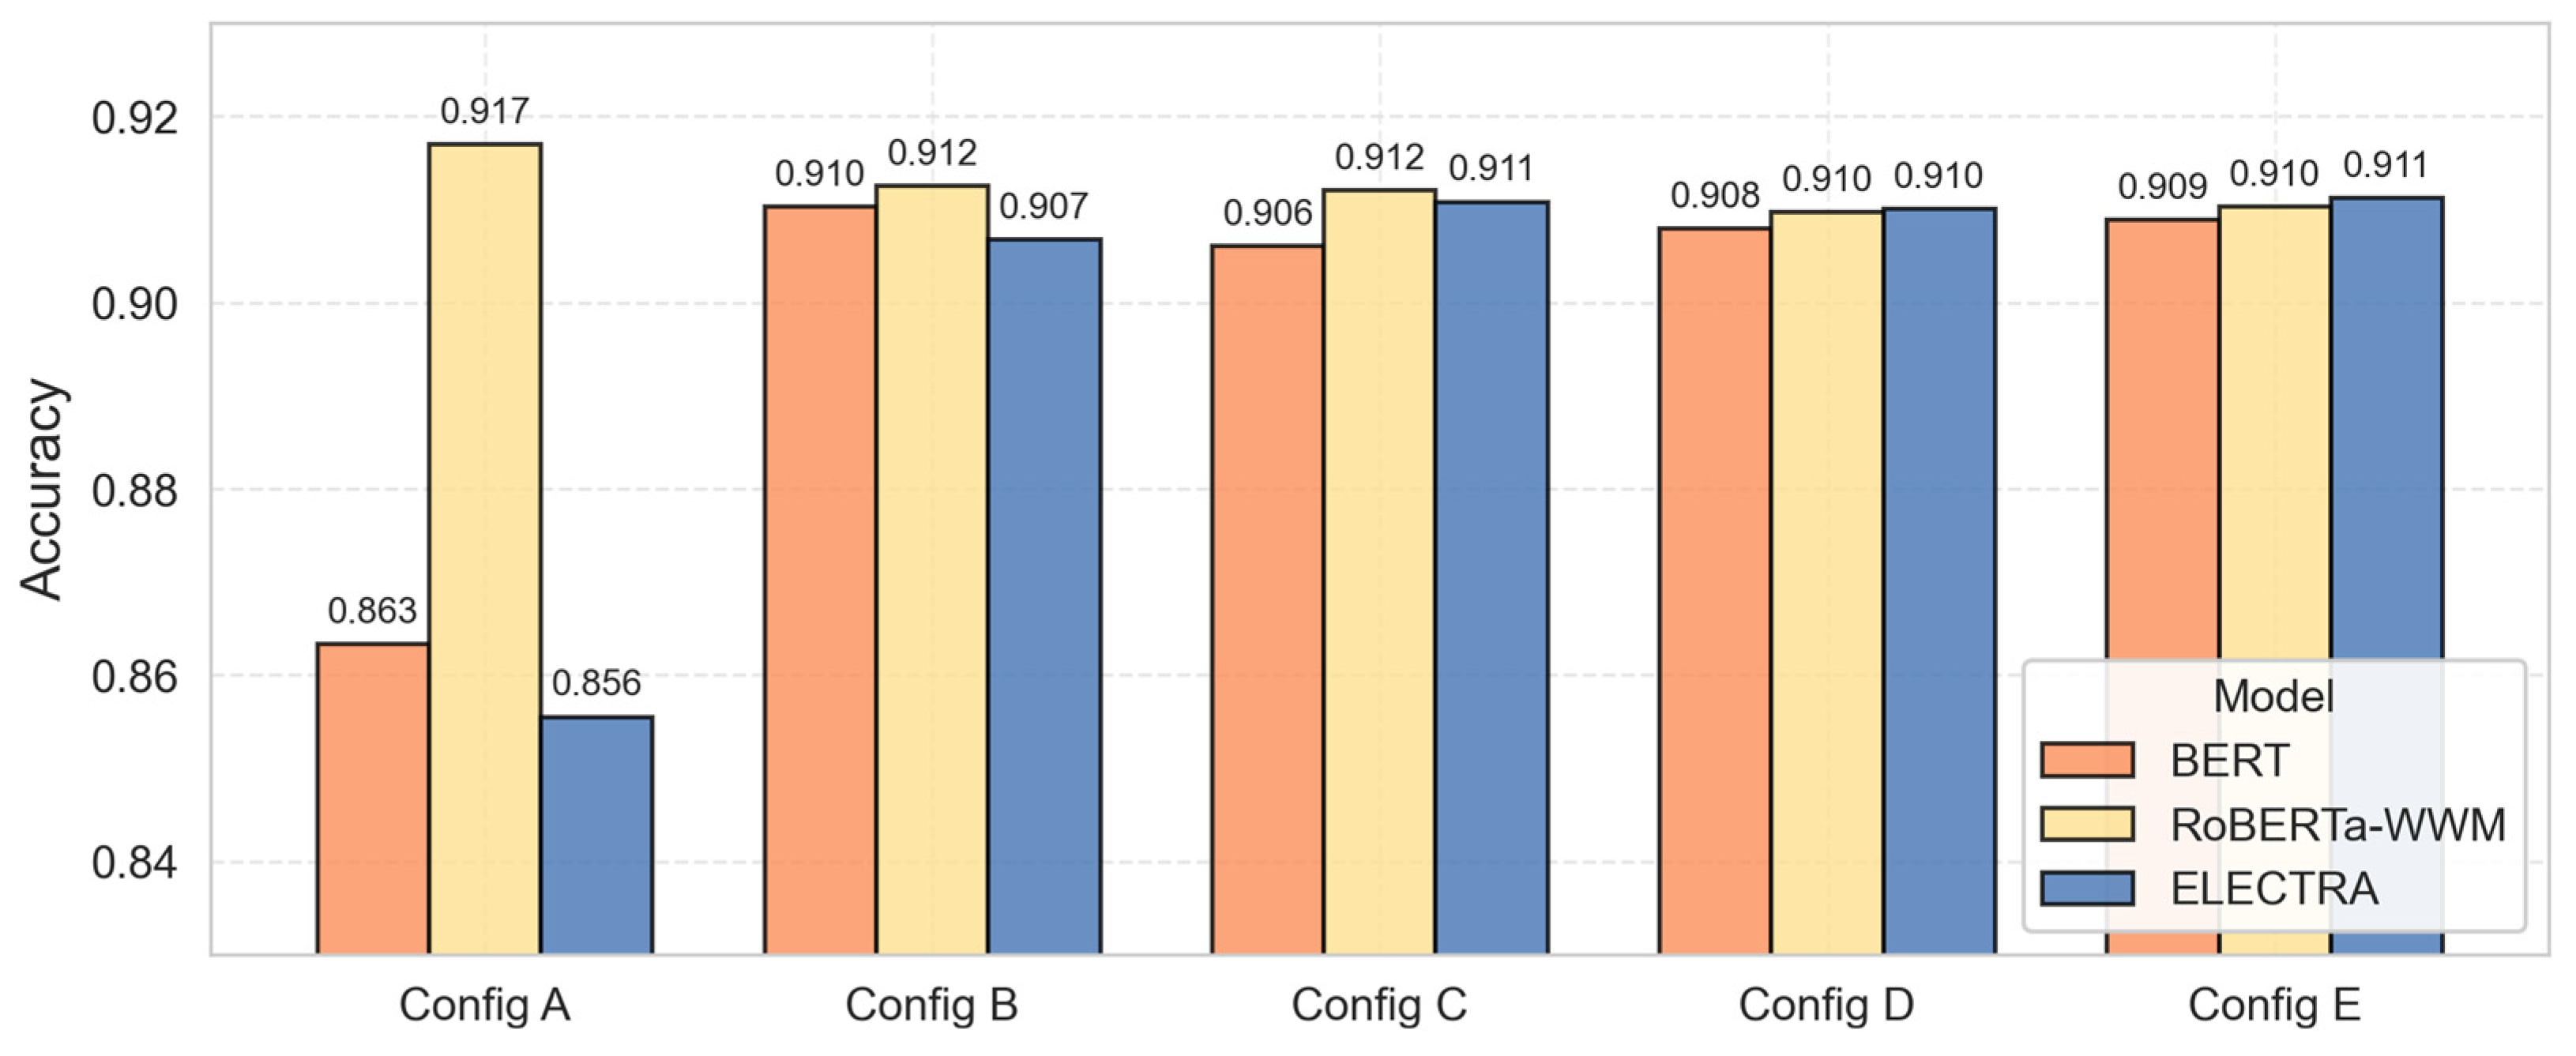
Figure 7 illustrates the performance (accuracy) of the three models on the sentiment analysis task across five distinct hyperparameter configurations. The results reveal several key insights into the models’ characteristics. RoBERTa-WWM demonstrates exceptional out-of-the-box capability, achieving the overall highest score (0.917) in the baseline Configuration A. This suggests that its pre-training with WWM makes it inherently well-suited for sentiment analysis. In contrast, ELECTRA starts with the lowest baseline performance (0.856) but exhibits the greatest potential for improvement. Through hyperparameter tuning, its accuracy climbs by 5.5 percentage points to a competitive peak of 0.911 (Configurations C and E), underscoring that its potential is fully unlocked with sufficient adaptation to the downstream task. BERT shows a solid baseline and benefits moderately from tuning, reaching its peak performance of 0.910 in Configuration B. Furthermore, the effectiveness of tuning strategies varies by model. Configuration D, which adjusts task loss weights, fails to yield the best result for any model, suggesting that direct manipulation of task-specific loss may be a less effective optimization route. Instead, strategies, such as increasing the input sequence length (Configuration C) or extending the training cycle (Configuration E), proved more effective, particularly for unlocking ELECTRA’s performance. This reinforces the conclusion that optimal model performance is not achieved through a one-size-fits-all approach but requires targeted tuning tailored to the specific pre-training architecture and task.

4.2.2. Spatial Distribution of Sentiment Patterns

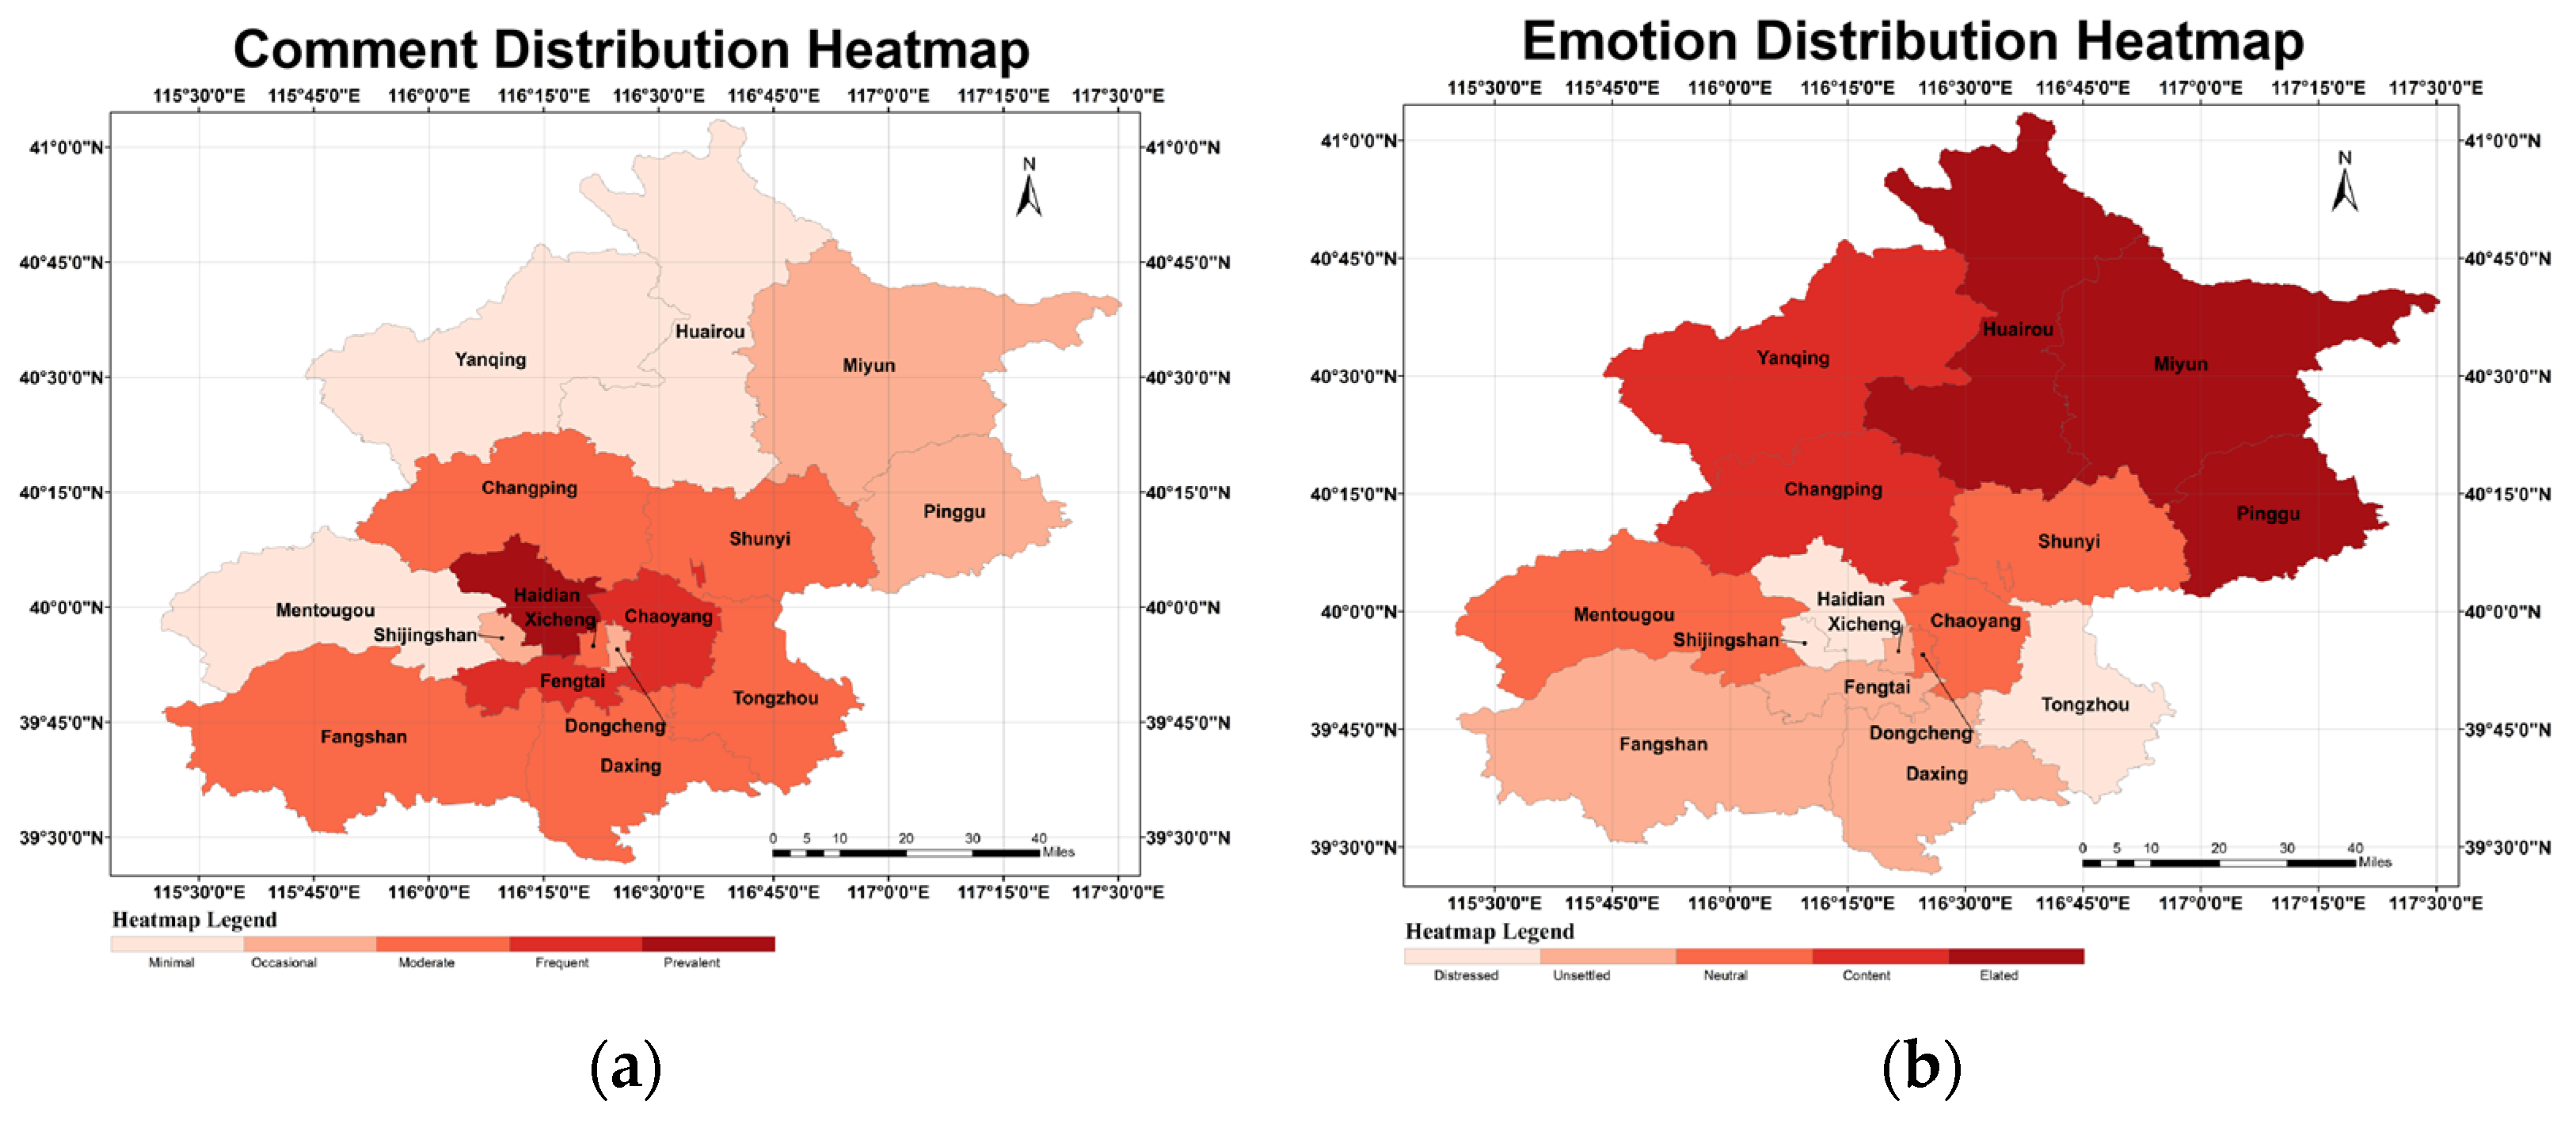
Prior to examining sentiment patterns, we analyzed the spatial distribution of user review data across Beijing’s districts to establish the statistical foundation for subsequent sentiment analysis. Crucially, all spatial analyses utilize the original, unmodified data distribution to preserve authentic user feedback patterns and ensure ecological validity of our findings, maintaining the natural sentiment distribution observed in real-world charging infrastructure usage. Figure 8a presents the comment distribution heatmap, revealing significant spatial heterogeneity in user engagement levels across the metropolitan area.
Figure 8b displays comment density across districts, with darker red indicating higher review volumes (prevalent) and lighter colors representing lower engagement levels (minimal to occasional). Beijing contradicts traditional assumptions about infrastructure quality. Northern suburban areas, including Pinggu, Miyun, and Huairou, exhibit significantly higher sentiment scores, while southern and western urban districts—such as Haidian, Fengtai, and Daxing—display a marked negative sentiment pattern. This inverted satisfaction distribution calls into question the conventional center–periphery model of infrastructure quality and provides a key insight: EV charging satisfaction appears to decline with proximity to the urban core, despite these areas typically having higher infrastructure investment.
This anomalous pattern suggests that for urban charging infrastructure, users in technology-intensive urban areas have higher expectations, leading to heightened dissatisfaction despite potentially more advanced equipment. Our analysis identifies the following three key factors driving this phenomenon: (1) high utilization rates and intense competition for charging resources in urban core areas lead to service bottlenecks; (2) in technologically advanced areas, like Haidian (home to numerous tech companies and universities), users have significantly higher expectations; and (3) despite having fewer charging options, suburban users report higher satisfaction with existing infrastructure.

4.2.3. Geographically Weighted Regression Analysis

To investigate spatial heterogeneity in factors influencing negative sentiment, we employed geographically weighted regression (GWR) analysis using the original, unbalanced sentiment data distribution to ensure authentic spatial patterns. After ordinary least squares analysis and variable screening, we finally identified seven predictive variables, as follows: POI densities for dining/shopping, entertainment/culture, auto-related services, and business/commercial areas, plus review topics related to price, parking/environment, and charging equipment. The GWR model employed adaptive kernel functions with AICc optimization to balance model fit and complexity.
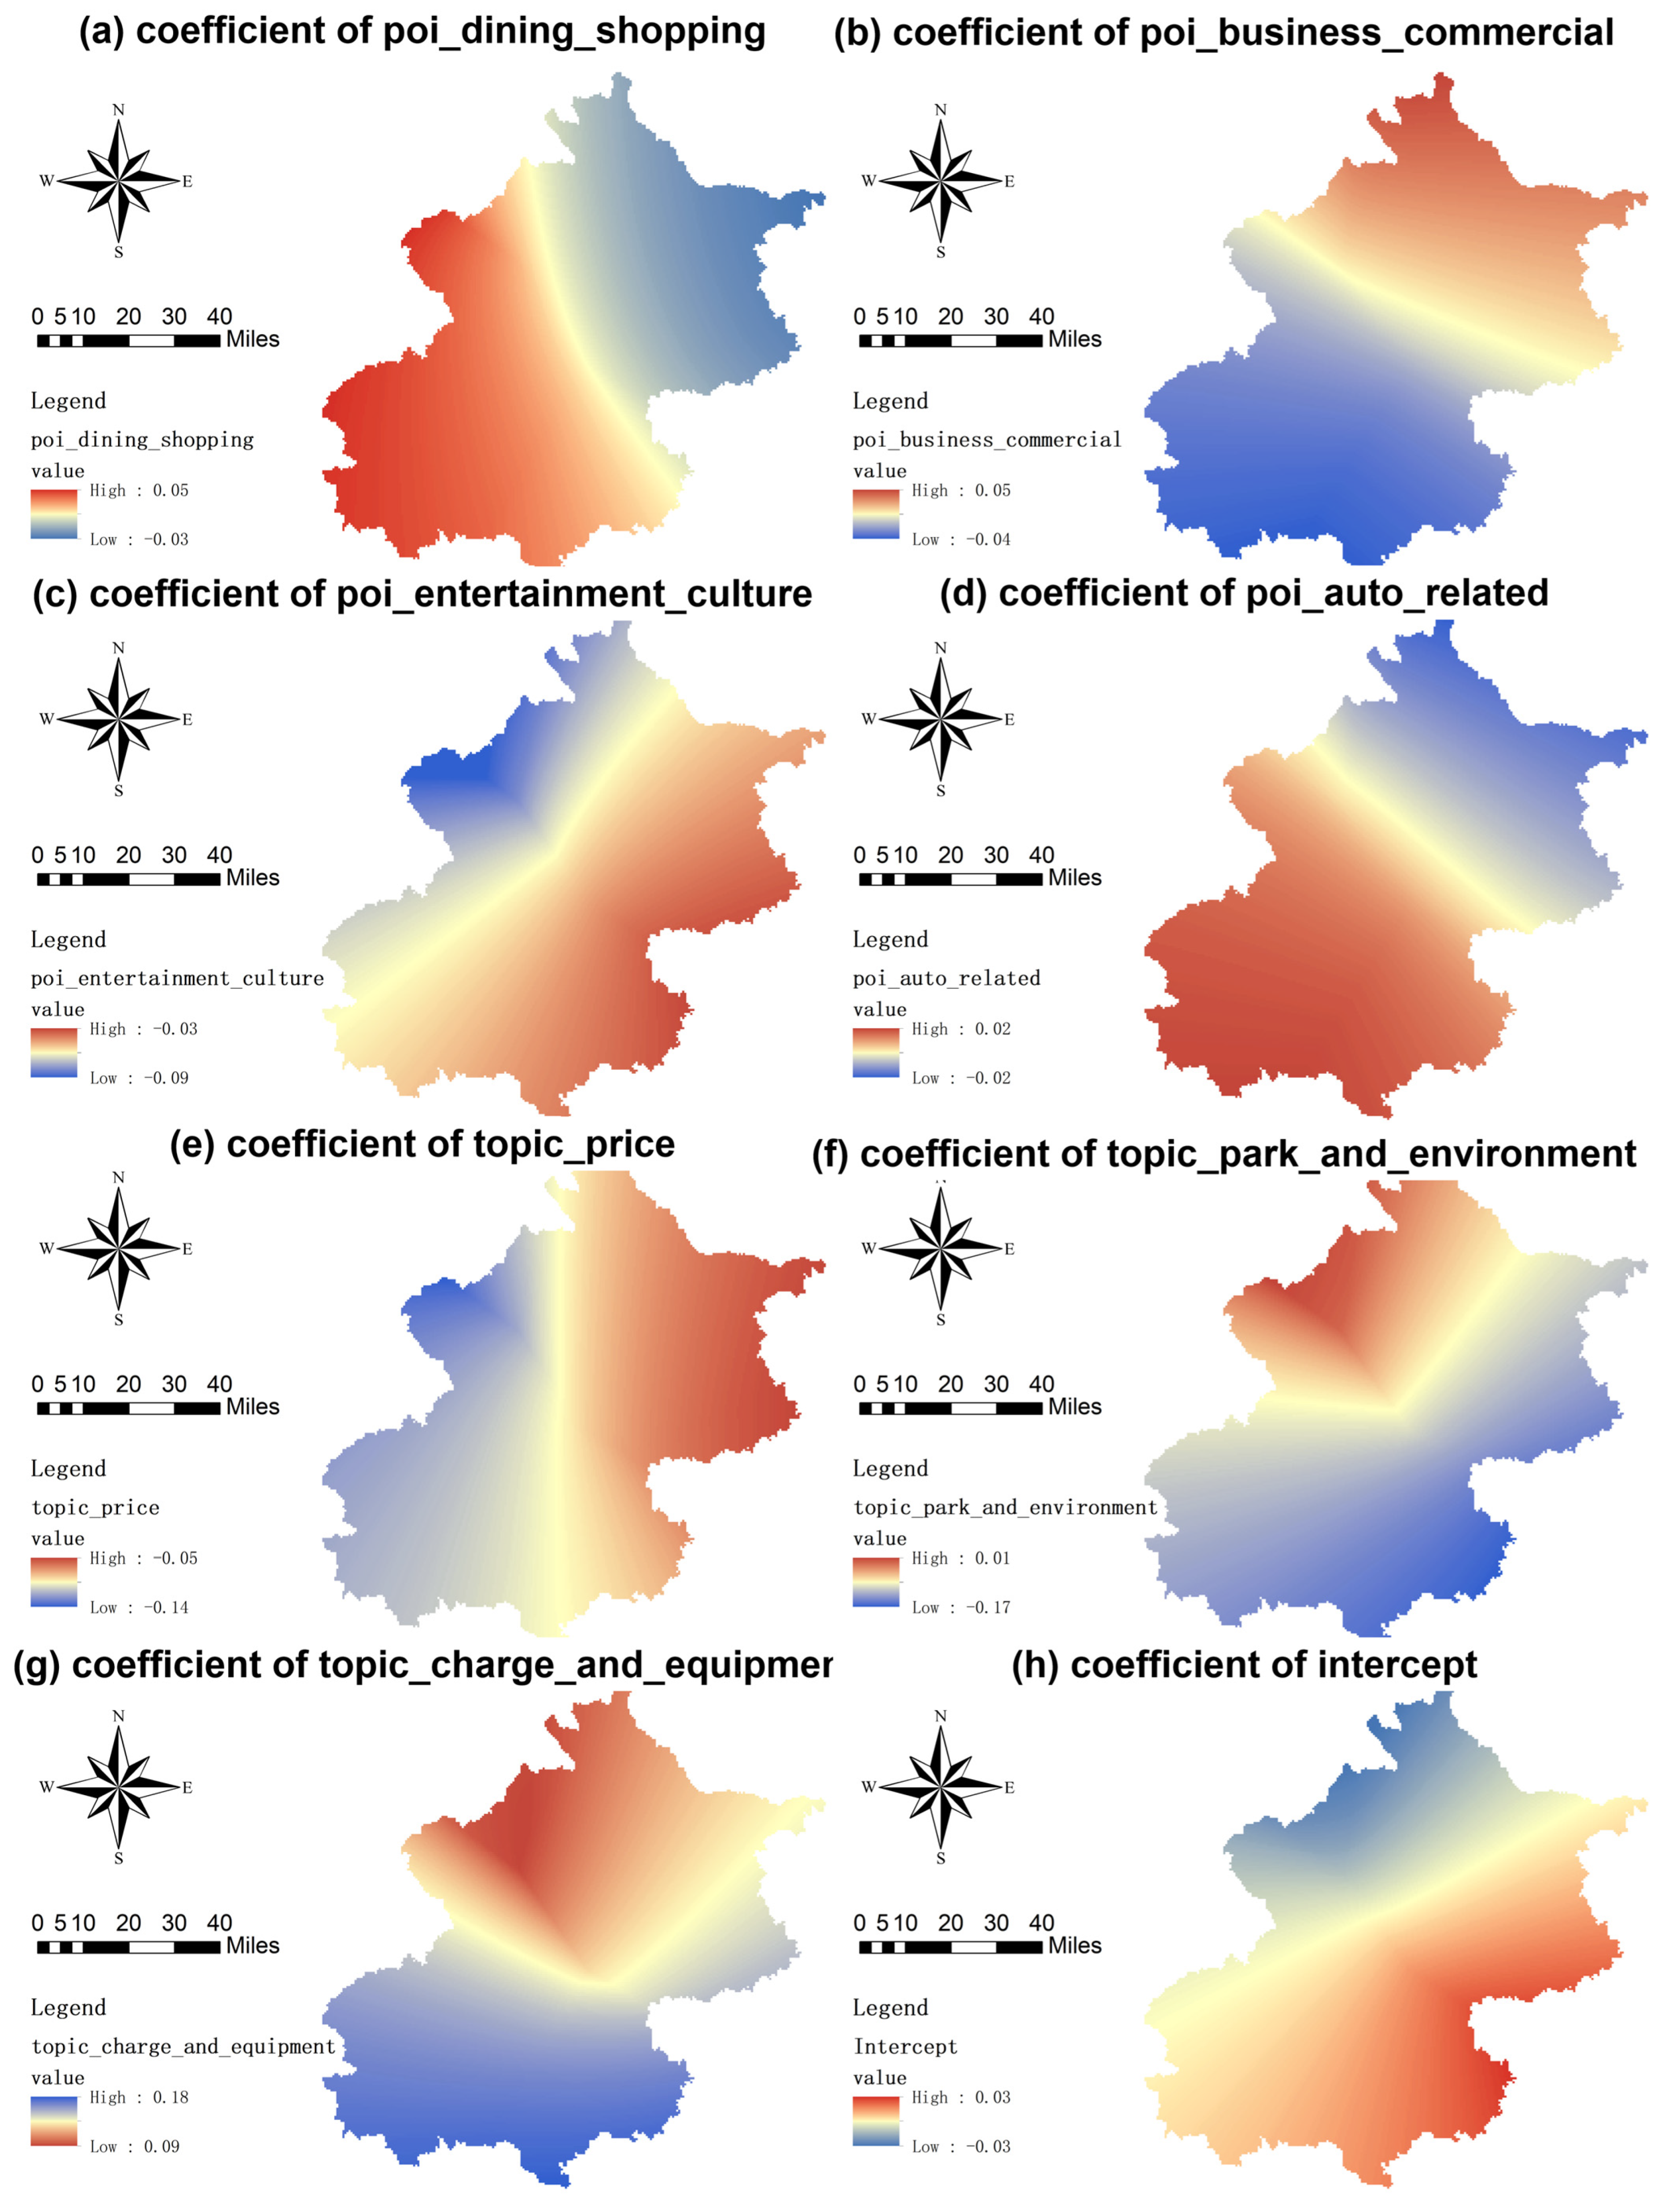
The GWR analysis revealed significant spatial heterogeneity in predictor–sentiment relationships across Beijing (Figure 9). The baseline negative sentiment exhibits a northwest-to-southeast gradient, with northwestern districts showing lower dissatisfaction levels. POI density variables demonstrate pronounced spatial variation: dining/shopping density correlates positively with negative sentiment in southern districts but negatively in northern areas, suggesting different demand–supply balances and user expectations. Auto-related POI density shows the most stable north–south gradient, while business/commercial density exhibits complex multi-center patterns.
Review topic variables reveal particularly insightful spatial patterns. Price-related topics show strong negative coefficients in northwestern districts (−0.14), suggesting higher price satisfaction in these areas. Parking/environment topics exhibit clear north–south differentiation, with opposite effects depending on regional conditions. Most notably, charging equipment topics demonstrate the strongest spatial gradient, with northwestern districts showing the highest coefficients (0.18), reflecting elevated user expectations in technologically advanced areas.
The analysis identifies three distinct spatial archetypes requiring differentiated strategies. The “technological frontier zone” (northwestern districts) shows high sensitivity to equipment quality, necessitating experience enhancement programs with advanced technology and professional maintenance. The “commercial-residential mixed zone” (central districts) requires space optimization plans with intelligent parking management. The “emerging adoption zone” (peripheral areas) needs accessibility improvement programs focusing on basic infrastructure and transparent pricing. This spatial heterogeneity validates the need for location-specific rather than uniform planning approaches, enabling proactive, spatially-aware infrastructure management.

4.3. Model Interpretability Analysis Using SHAP

To understand the decision-making process of our best-performing model (RoBERTa-WWM, F1 = 0.912), we conducted SHAP analysis to identify the most influential features for sentiment prediction.
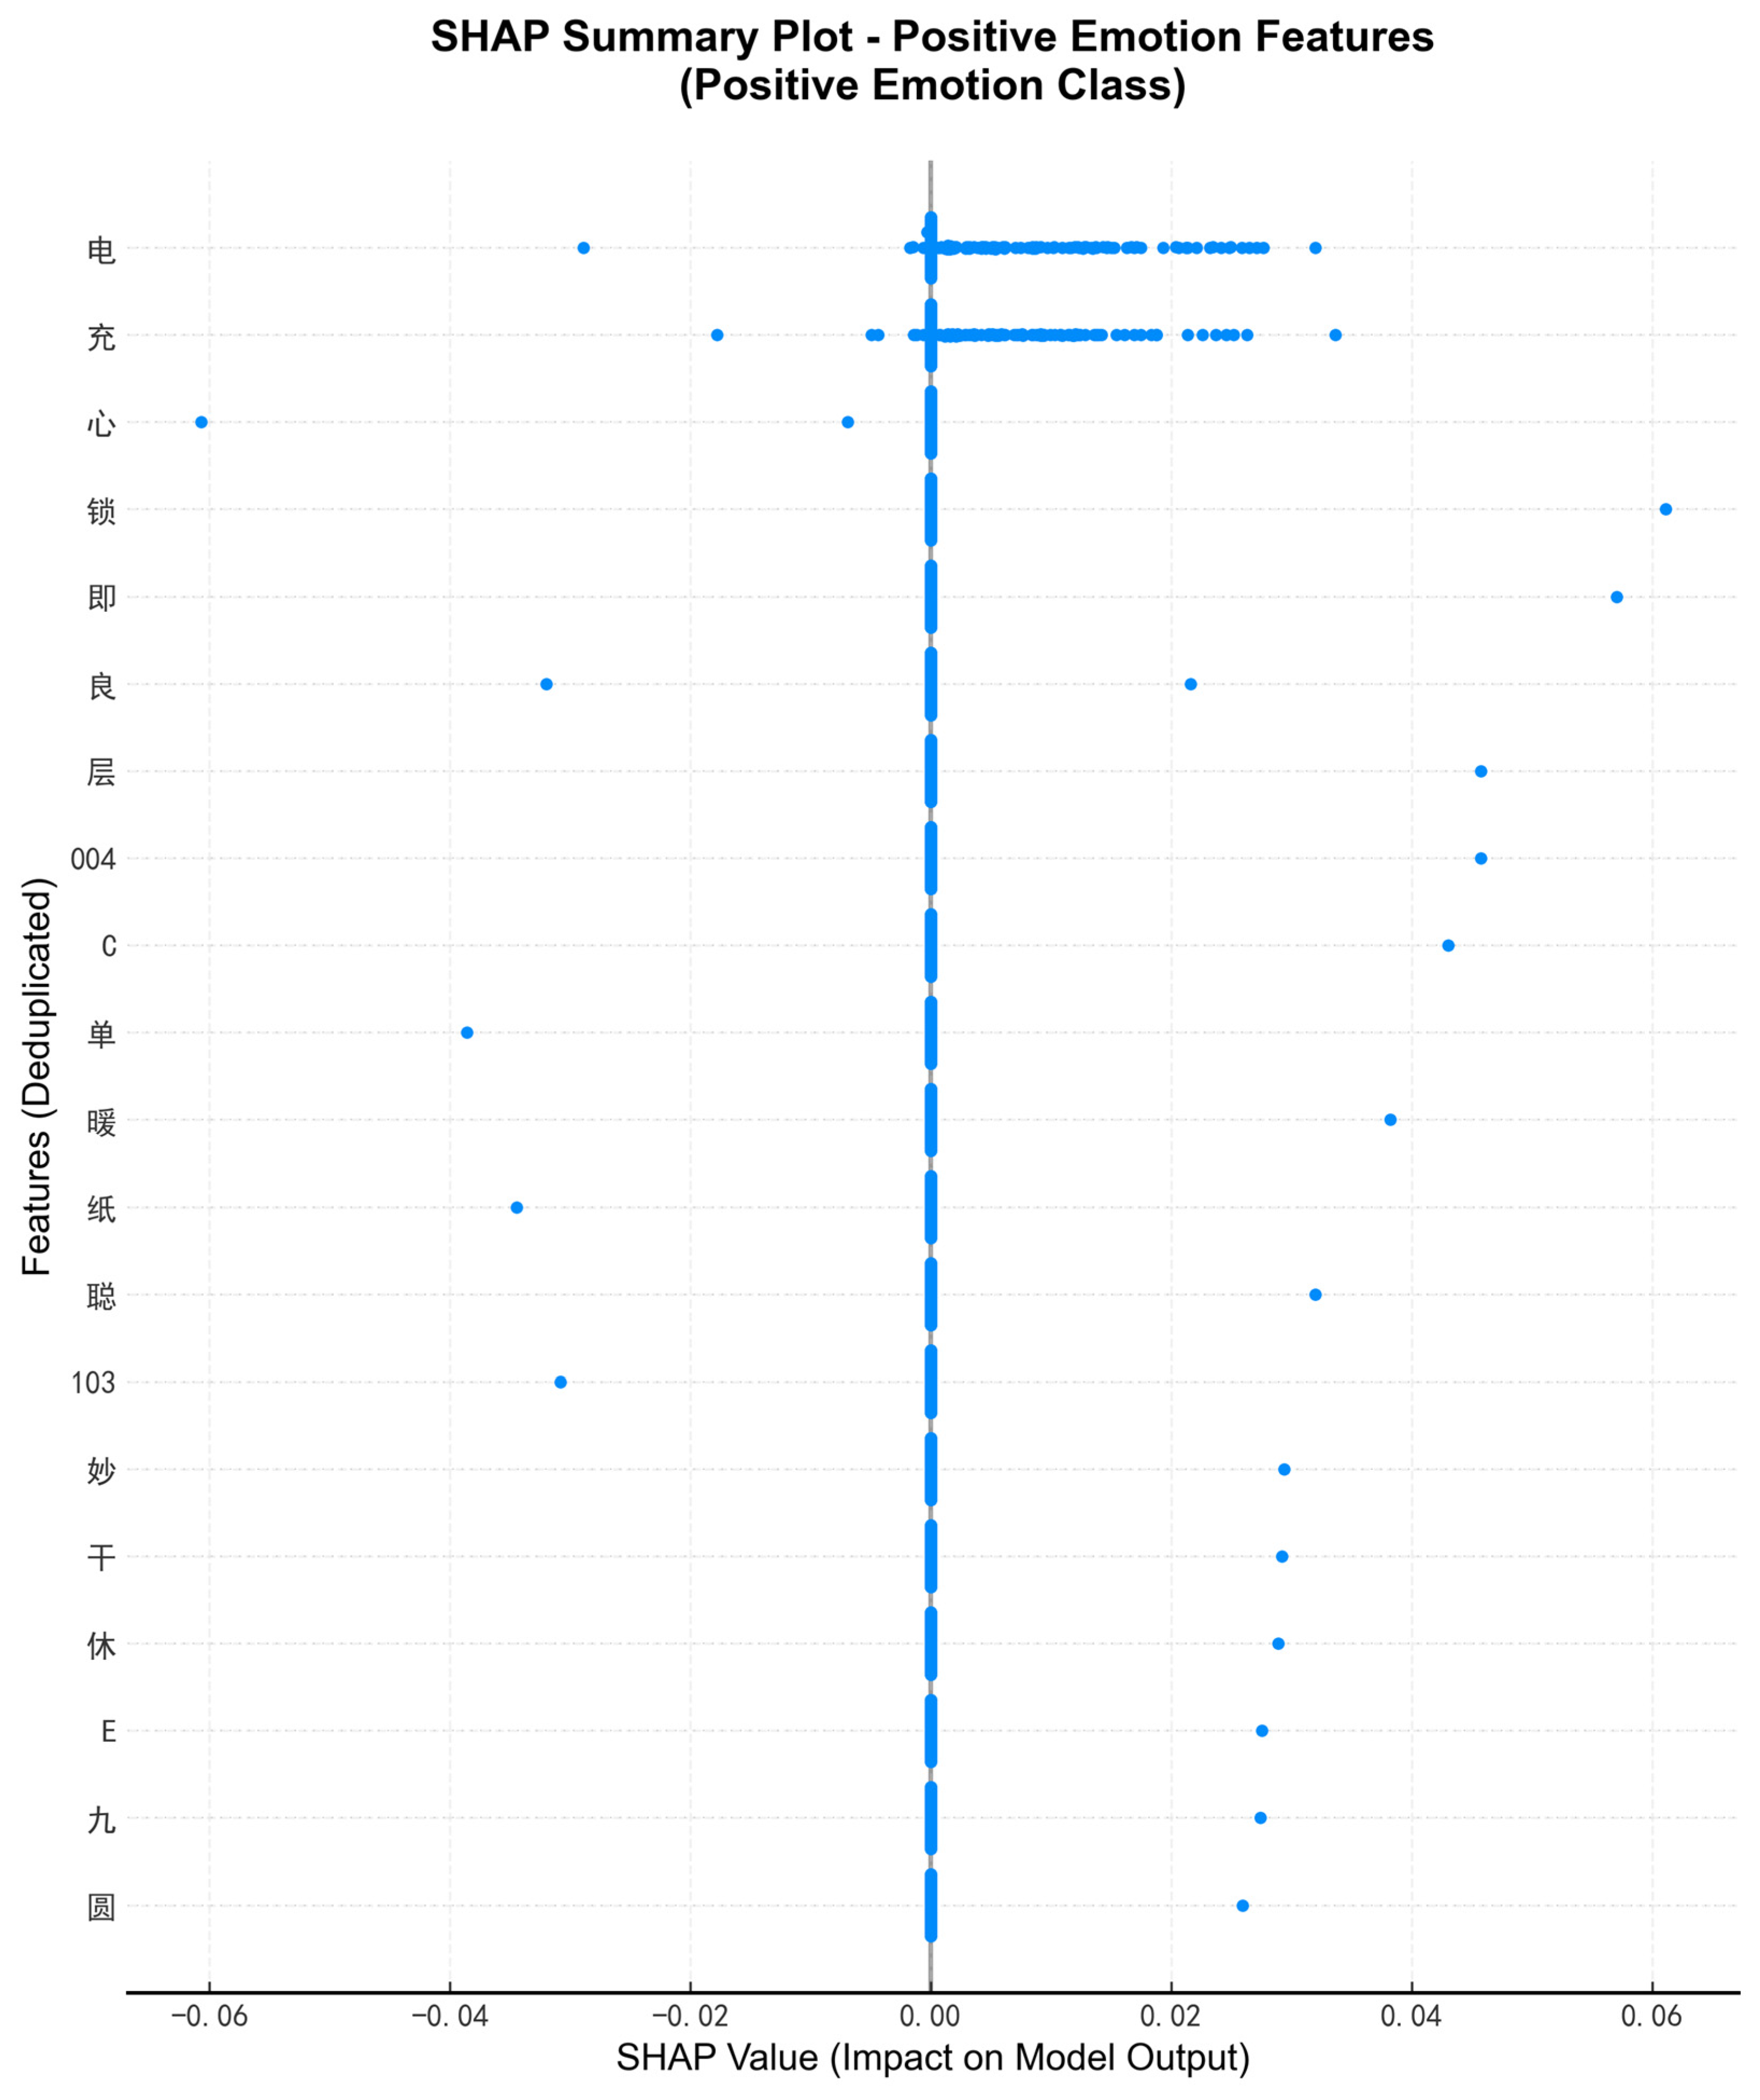
Figure 10 presents the SHAP summary plot for positive sentiment classification, revealing key feature importance patterns.
The analysis reveals that positive indicators include “充电” (charging), “方便” (convenient), “快” (fast), and “好” (good). The model demonstrates contextual understanding through bidirectional SHAP value distributions, where the same word contributes differently based on usage context. Infrastructure-related terms, like “停车” (parking), “位置” (location), and “环境” (environment), significantly contribute to positive sentiment, confirming that the model captures the multifaceted nature of charging experiences.
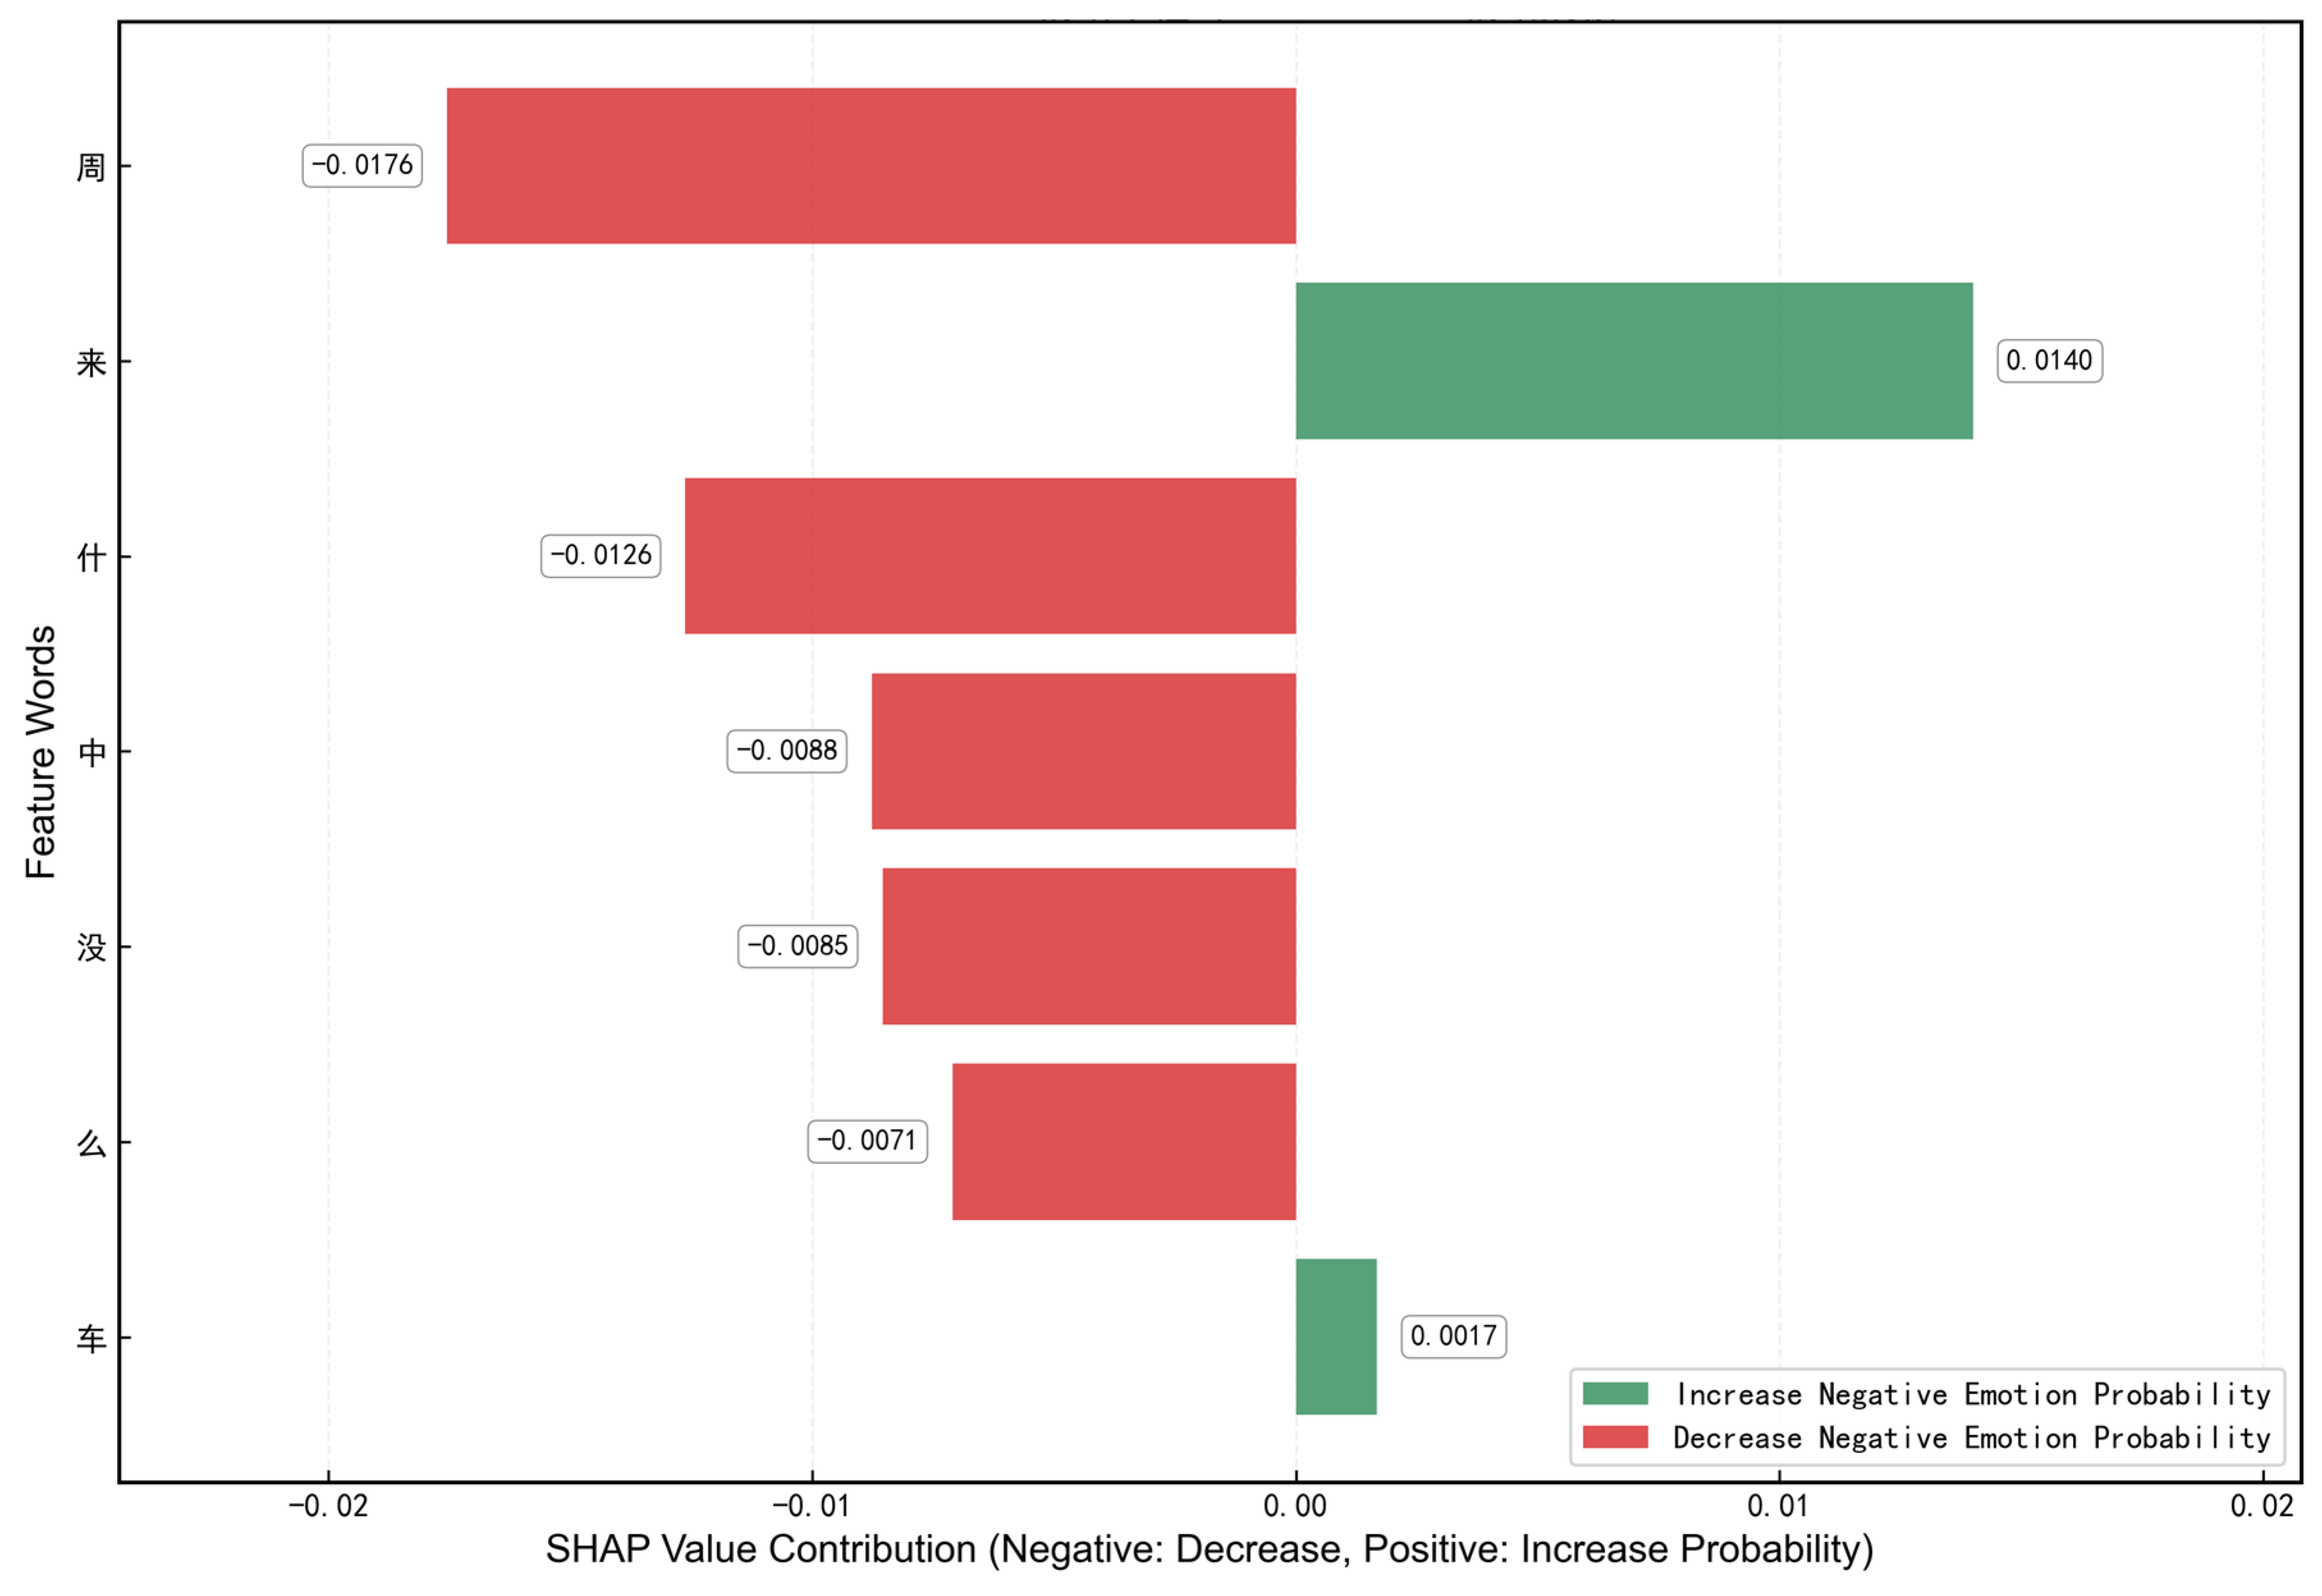
Figure 11 illustrates individual prediction mechanisms through waterfall plot analysis. The true label is “Emotionally Neutral”, but it is predicted to be “Emotionally negative”‘.
The waterfall analysis demonstrates that the model focuses on semantically meaningful terms while filtering out non-informative tokens. Positive contributors relate to satisfactory charging experiences, while negative contributors involve problem-related terms. This selective attention mechanism ensures that predictions are based on substantive content rather than superficial features.
The SHAP analysis confirms the model’s trustworthiness through alignment with domain expertise and the absence of spurious correlations. The model’s focus on contextually relevant features indicates generalizable learning rather than dataset-specific artifacts, supporting reliable deployment in real-world scenarios. The interpretability framework also enables continuous monitoring for potential model drift and emerging linguistic patterns.

4.4. Topic Analysis Results

To further validate the model’s effectiveness and reveal its underlying working mechanism, this study conducts a quantitative comparative analysis of the label distribution in the dataset before and after model training. This analysis not only confirms the classification performance of the model but also reveals its advanced capability in optimizing and refining the original labeling system, as reflected in the following three aspects.

4.4.1. Fine-Grained vs. Coarse-Grained Topic Recognition Performance

The challenge of topic recognition varies significantly with semantic granularity. Fine-grained recognition requires identifying specific points, while coarse-grained recognition demands higher-level abstraction. Figure 12 and Figure 13 illustrate the performance of the models in these respective tasks.
Compared to fine-grained recognition, coarse-grained topic recognition requires the model to perform a higher level of abstraction and generalization of text content. A comparison of model performance is shown in Figure 12.
As Figure 12 and Figure 13 illustrate, different model architectures are uniquely suited to different levels of abstraction. For the fine-grained topic recognition task (Figure 8), which requires a deep understanding of specific user issues, RoBERTa-WWM ultimately achieves the highest Micro-F1 score of 0.844 (Configuration E), with BERT as a close runner-up at 0.842 (Configuration C). This indicates that for tasks requiring deep, localized semantic extraction, the pre-training objectives of RoBERTa and BERT provide a powerful foundation.
In the coarse-grained topic recognition task (Figure 13), which demands higher-level abstraction, all models prove to be highly competitive. After hyperparameter tuning, their performances converge into a narrow range, with RoBERTa-WWM and BERT consistently achieving the top scores. While ELECTRA does not reach the highest peak performance, it exhibits the most substantial improvement from its baseline, underscoring its “late-bloomer” potential and its strong capacity to learn generalizable features with sufficient training.
Collectively, these findings offer a nuanced view on model selection. Instead of a single best model, we observe task-dependent strengths. RoBERTa-WWM and BERT emerge as powerful and versatile models, excelling at both deep, fine-grained analysis and high-level, coarse-grained abstraction. The results suggest that for tasks requiring robust, top-tier performance across different granularities, RoBERTa-WWM and BERT are the most reliable choices.

4.4.2. Model-Driven Label Taxonomy Normalization

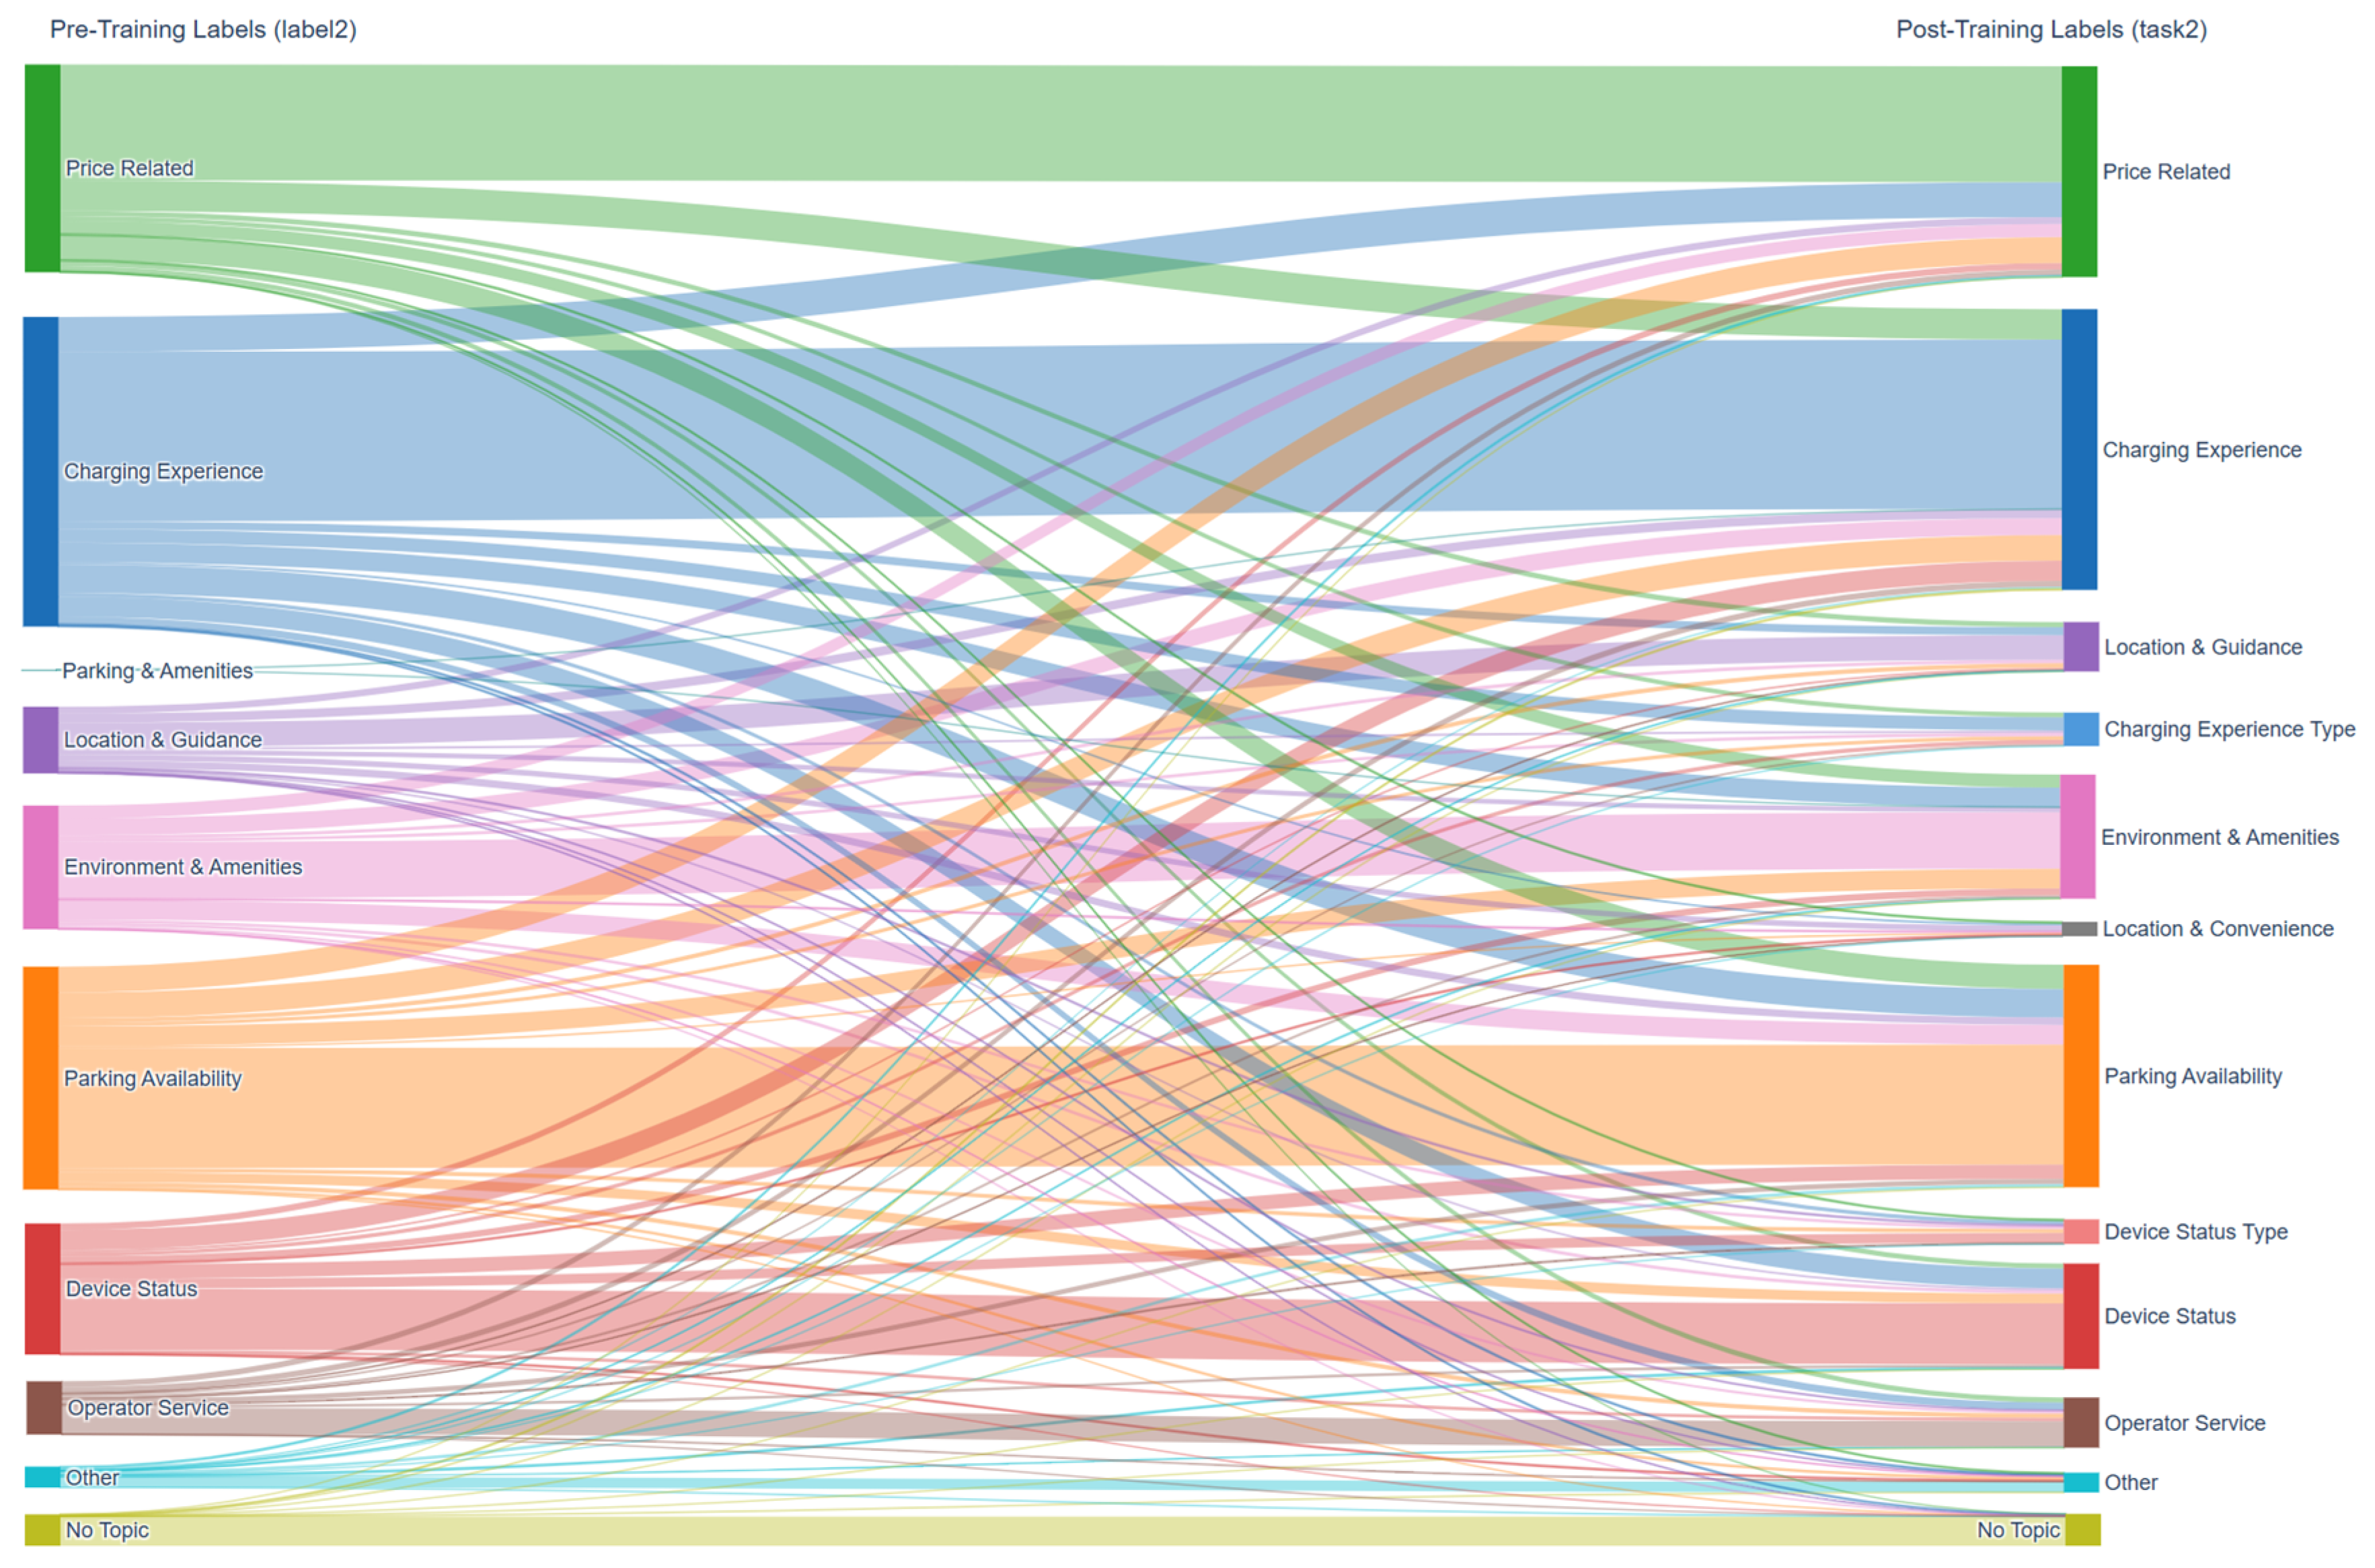
The original dataset contains “dirty labels” (e.g., “charging experience” and “charging experience category”), which are semantically overlapping or redundant due to inconsistent manual annotation. Our analysis demonstrates that the trained model can independently learn and normalize these labels. For instance, in the fine-grained topic classification task, the model successfully reclassified a substantial number of samples originally belonging to the “charging experience category” into the core “charging experience” and “device status” categories.
This analysis reveals a significant capability of the model: autonomous classification reconstruction. The model displays an exceptional capacity to discern and rectify discrepancies within the original annotation system. This finding has important implications for large-scale annotation projects, where maintaining annotation consistency is a major challenge.
As demonstrated in Figure 14, a Sankey diagram provides a visual representation of the model’s “semantic integration effect”, signifying its capacity to discern and amalgamate semantically equivalent categories that were artificially delineated in the original annotation. For instance, the model autonomously merged the separate categories “charging experience” and “charging experience category” into a single “charging experience” concept, indicating that it can go beyond superficial lexical differences to understand semantic equivalence.
More significantly, the model demonstrates remarkable capability in processing comments initially labeled as “Untitled” or “Other” by human annotators. These comments were not filtered during preprocessing because they contained semantically meaningful content, but were too ambiguous, complex, or multi-faceted for human annotators to confidently categorize. The model’s ability to extract actionable insights from these previously uncategorizable comments represents a key advancement in automated feedback analysis.
This finding suggests that the language model can infer and reconstruct conceptual hierarchies without explicit instruction. The model effectively reconstructs the implicit conceptual hierarchy that human annotators applied inconsistently by accurately integrating broader categories into their core concepts.
Crucially, the model demonstrates the ability to “extract information from noise” by discerning meaningful signals from categorically ambiguous labels rather than objectively low-information content. It systematically reassigns instances from the “Untitled” and “Other” categories to specific and information-rich categories. This approach enhances the signal-to-noise ratio of the dataset without necessitating additional human annotation, recovering valuable insights that were previously inaccessible due to categorization difficulties rather than content inadequacy.

4.4.3. Topic Denoising and Information Enhancement

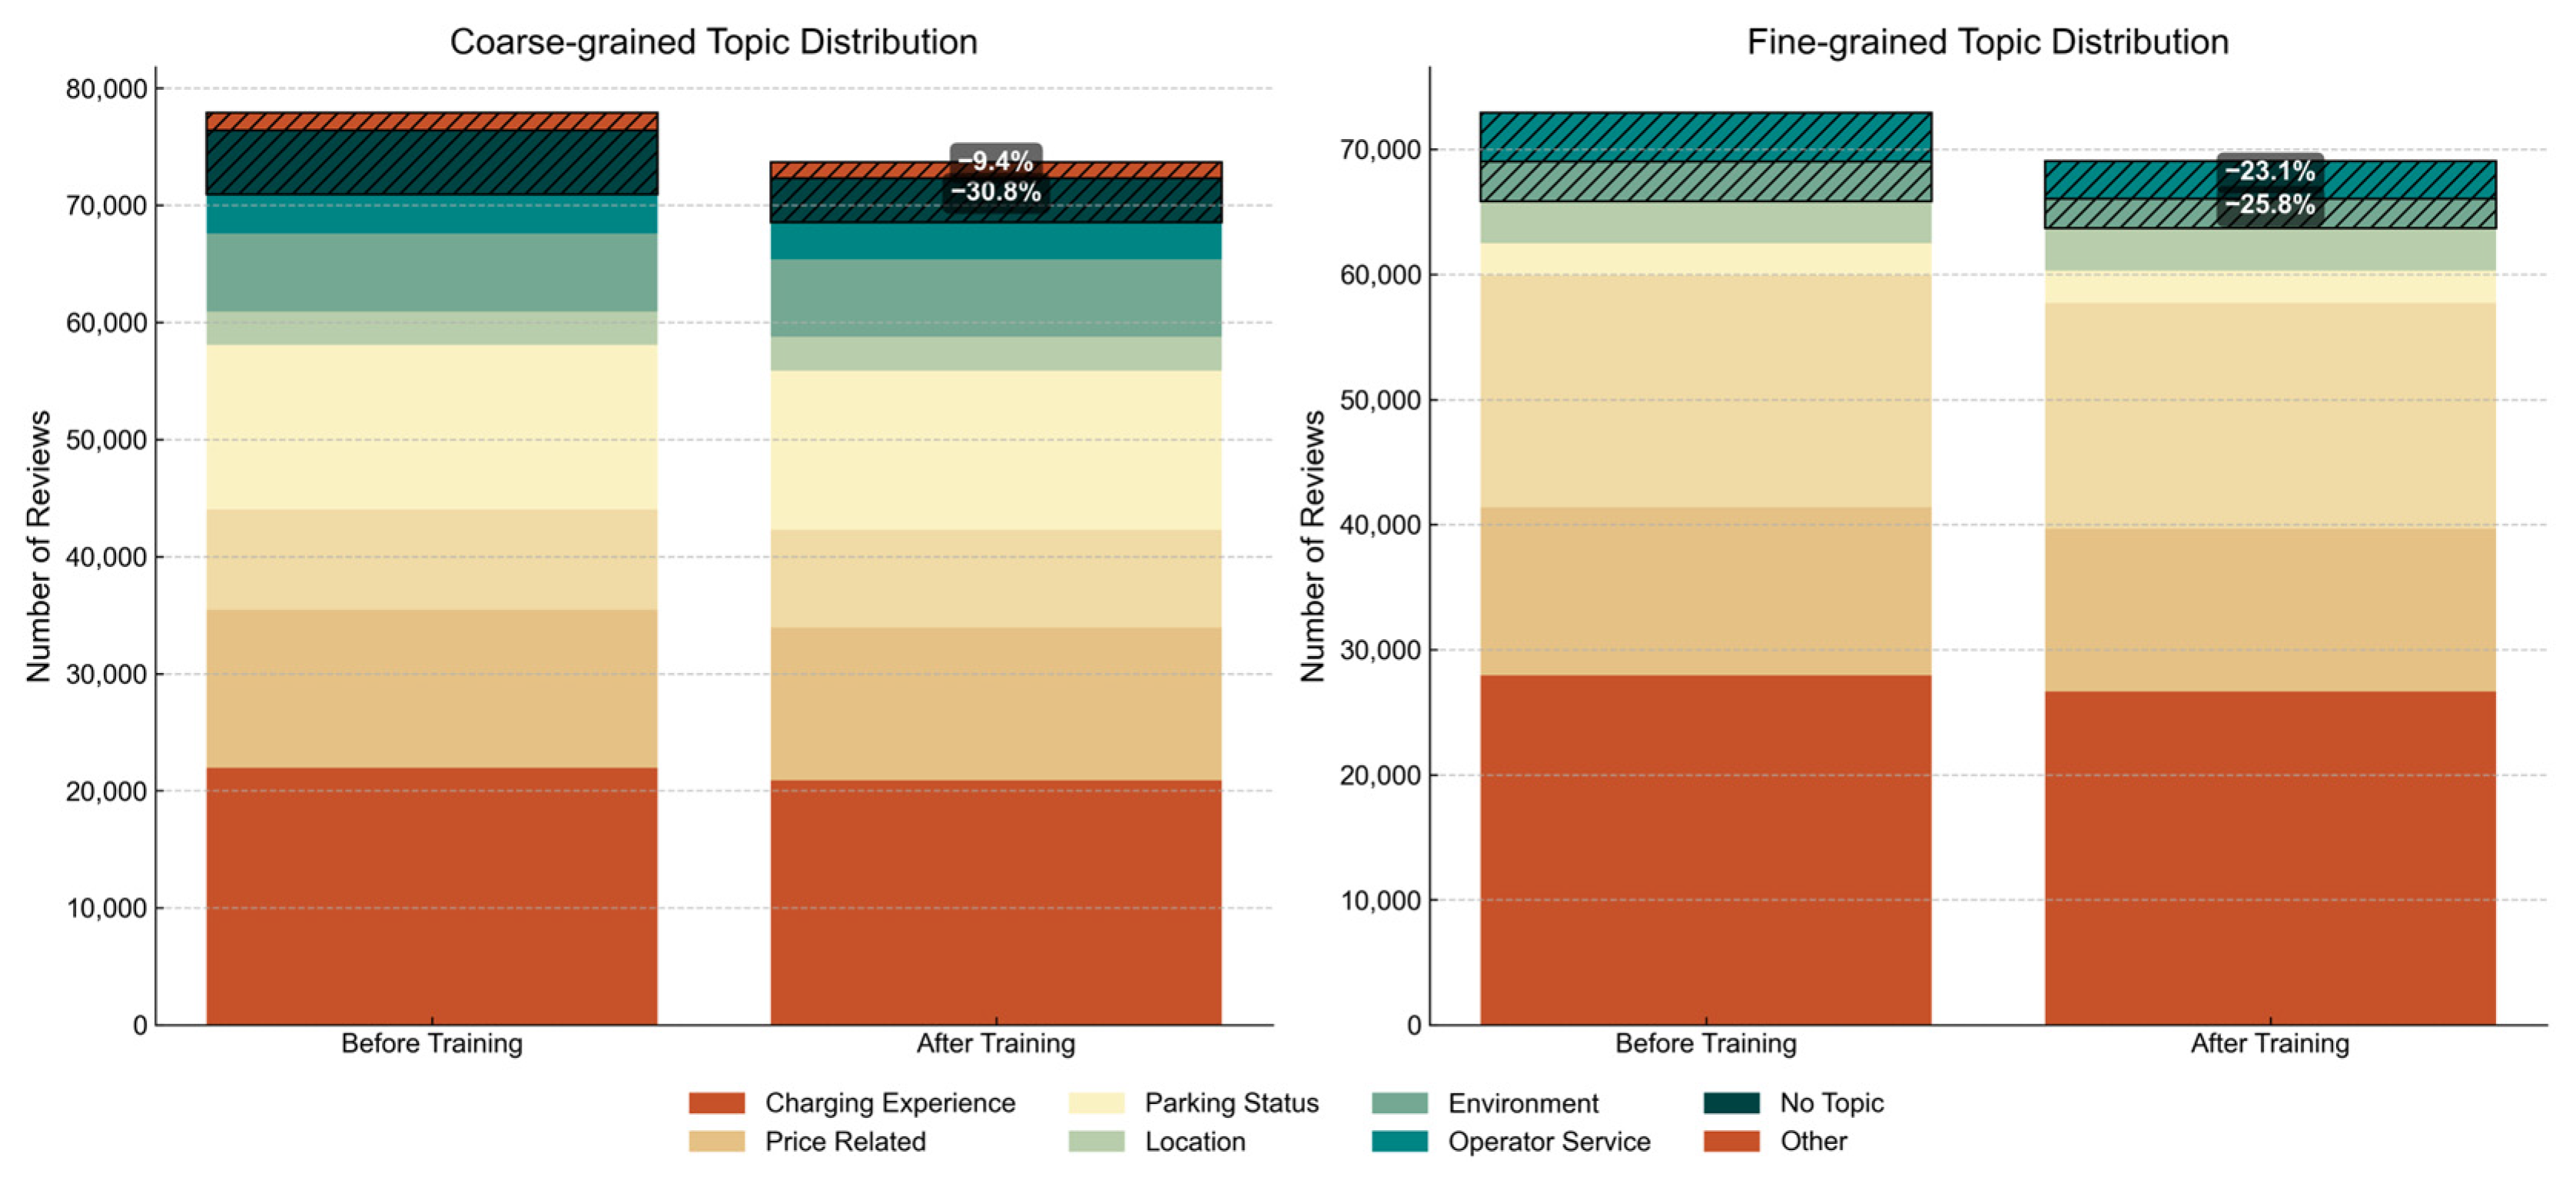
The original dataset contained a large number of comments with low information density, labeled as “Untitled” or “Other”. After being processed by the model, the number of samples with these low-information labels dropped significantly. As shown in Figure 15, the count of “Untitled” labels in the coarse-grained task decreased from 5463 to 3783 (a 30.8% reduction), while in the fine-grained task, it decreased from 3160 to 2346 (a 25.8% reduction).
As demonstrated in Figure 15, the model is capable of systematically reallocating previously discarded data points into actionable feedback categories. This transformation represents the recovery of lost customer insights, which has a direct impact on charging infrastructure planning. Comments initially considered to be “noise” were found to contain valuable feedback on specific aspects of charging infrastructure that could not be classified by human annotators.
Beyond simple classification, the model excels at extracts potential topics from text initially regarded as “noise” and accurately categorizes them into more informative, specific categories. This process has been demonstrated to enhance the overall signal-to-noise ratio and analytical value of the dataset, illustrating the model’s capacity to grasp the semantic nuances of ambiguous and complex text.
In summary, the model trained in this study is not only a high-performance classifier but also an effective tool for data refinement. Through autonomous learning, it has standardized, denoised, and logically enhanced the original annotated data, significantly improving data quality and usability while also validating the potential of the multi-task learning framework in deep semantic understanding and knowledge discovery from a new perspective.
For EVCS operators, this capability can reveal previously hidden patterns in user feedback that traditional methods miss. The model can identify comments expressing concern through indirect expressions or contextual clues, rather than relying on explicit statements. For instance, comments that referenced “long waiting times” but did not explicitly mention charging speed were reclassified from “no topic” to “charging experience”. This semantic noise reduction has profound implications for EVCS feedback analysis. Operators implementing similar models could see a 25% to 30% increase in the number of valid samples without additional data collection. Most importantly, it transforms seemingly inconsequential comments, transforming previously low-value data into a valuable resource for infrastructure planning and service optimization.

4.5. Spatial Analysis and Application Insights

In this section, the study combines the analysis of review text with spatial analysis to reveal the spatial distribution patterns of user experience at the district level in Beijing and the clustering characteristics of specific problem types. This provides data support for differentiated planning and management of charging infrastructure.
The crux of this multi-dimensional analysis is the conversion of unstructured text into structured data, subsequently associated with spatial coordinates. This process enables a transformation of the analysis scale from “points” (individual charging stations) to “areas” (urban regions), which holds higher application value. It facilitates the development of more targeted solutions for issues arising in specific regions and assists operators in identifying problem clusters, enabling them to develop more targeted solutions for specific problem types concentrated in those areas.

4.5.1. Spatial Clustering of Charging Station Topics

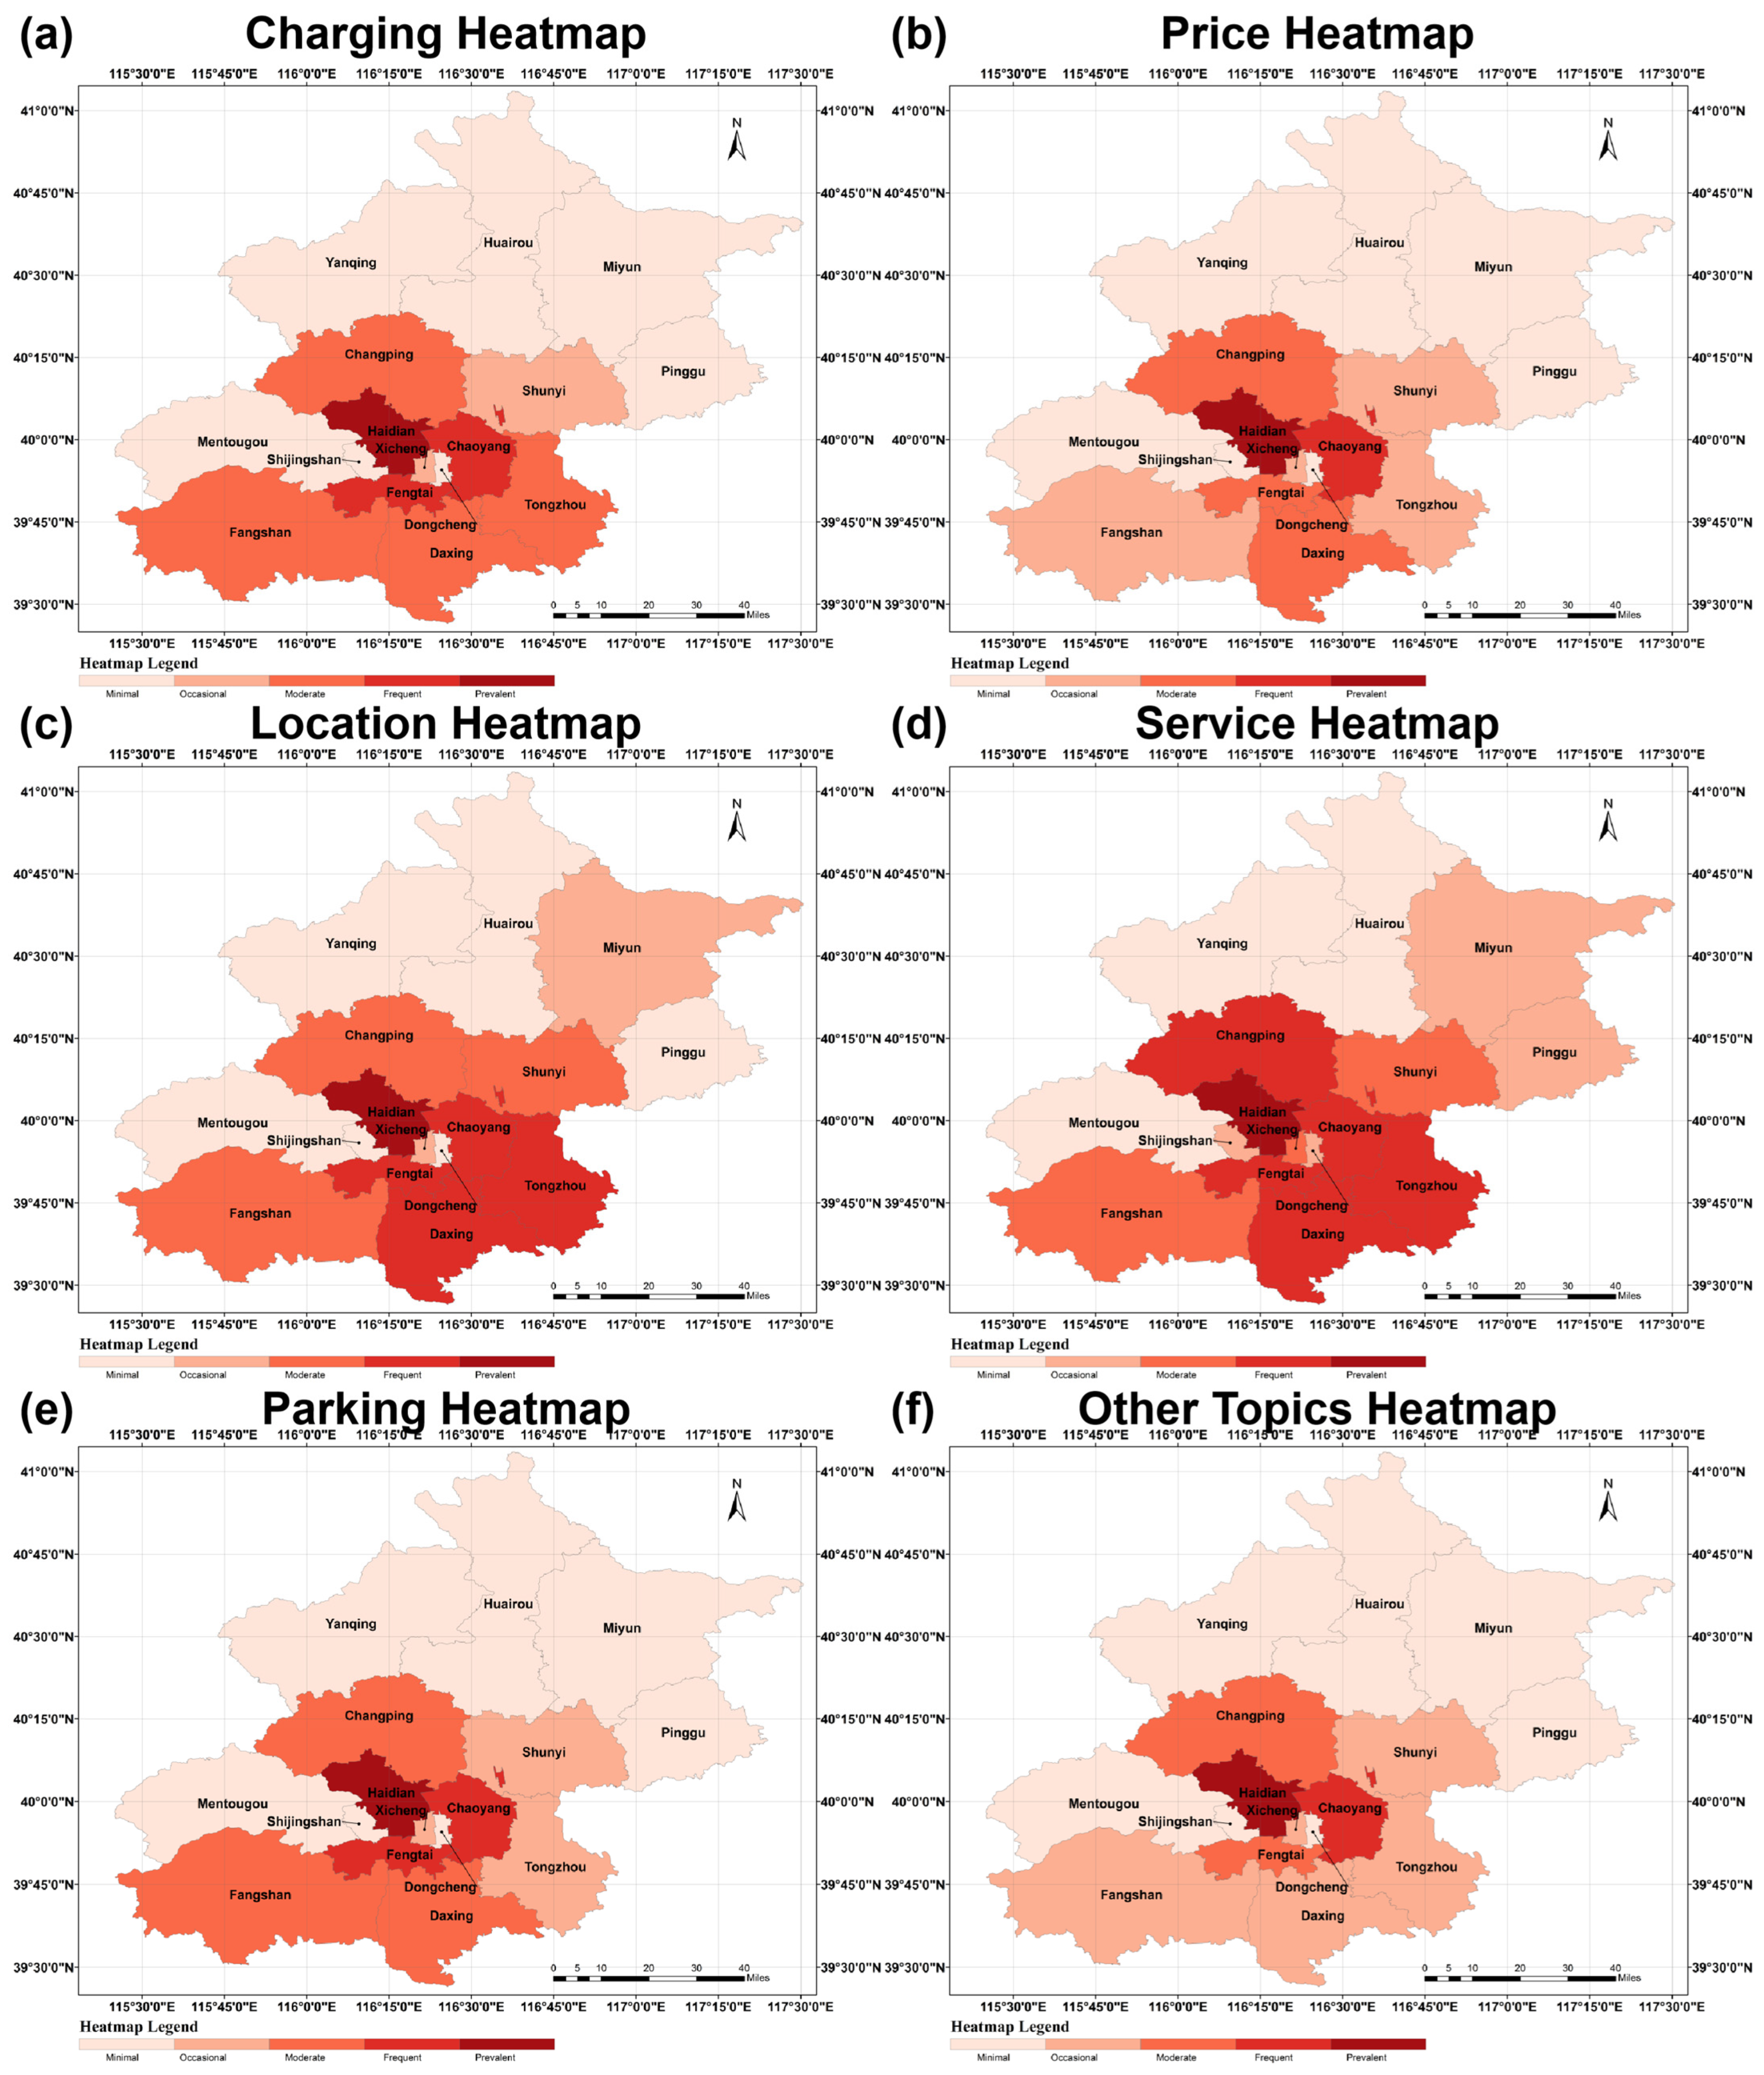
As demonstrated in Figure 16, the distribution of popular topics in comments related to Beijing charging stations exhibits significant spatial variations. All heat maps indicate that Haidian District, marked in dark red, is the core area for all topic discussions. This finding is consistent with the city’s reputation as a major center for scientific and technological innovation and a hub for higher education institutions. The discussion intensity in the city center (including Dongcheng, Xicheng, and Chaoyang Districts) and surrounding areas (including Fengtai, Daxing, and Tongzhou Districts) is relatively high, particularly on certain issues, such as charging experience, parking, and cost. Conversely, northern and remote areas, such as Yanqing, Huairou, Miyun, and Pinggu, demonstrate a lower level of discussion intensity. Based on these data, we identify the following three major spatial archetypes influenced by unique infrastructure characteristics: the “technological frontier zone” (Haidian and parts of Chaoyang), characterized by discussions on charging experience and equipment reliability; the “commercial-residential mixed zone” (Dongcheng and Xicheng), where parking availability and environmental issues are prominent; and the “emerging adoption zone” (suburban areas), defined by price sensitivity and basic access issues.
This distribution pattern is indicative of the uneven development of charging infrastructure and usage in Beijing. In core urban areas, charging demand and related issues are more pronounced, with users prioritizing practical considerations, such as charging convenience, cost, and parking availability. In contrast, suburban areas have lower charging infrastructure coverage and utilization rates, leading to limited discussion on these topics. This spatial segmentation provides a novel framework for planners to develop targeted deployment strategies tailored to different urban archetypes.

4.5.2. Regional Anomalies and Their Implications

Two notable spatial anomalies can be identified from the heat map. First, Haidian District shows extremely high heat across all topics, particularly charging experience (21,959 mentions) and price (10,847 mentions). This may indicate the presence of a unique user group in Haidian, such as tech enthusiasts and early EV adopters, who have higher expectations for charging services and are more vocal in providing feedback. Second, despite its urban location, Shijingshan District exhibits significantly lower heat across all topics compared to surrounding regions. For instance, it had only 87 comments related to charging experience, suggesting potential lag in the development of its charging infrastructure. Additionally, a notable disparity exists between Chaoyang District and the adjacent Tongzhou District in terms of charging experience mentions. This geographical adjacency, coupled with a significant difference in discussion intensity, points to uneven EVCS development and service quality in Tongzhou.
Based on this spatial analysis, we propose a differentiated infrastructure planning framework. For technologically advanced areas, like Haidian, an “Experience Enhancement Program” should be implemented, deploying high-capacity equipment, advanced reservation systems, and professional maintenance teams to meet the high expectations of tech-savvy users. In commercial core areas, a “Space Optimization Plan” could be deployed, featuring intelligent parking management systems and dedicated charging zones with time-limited usage. For “charging blind spots”, like Shijingshan, targeted market research and awareness campaigns should be conducted alongside infrastructure improvements. Finally, in high-satisfaction areas, such as Dongcheng, introducing ultra-fast charging and value-added services could further enhance user loyalty. This data-driven, geographically-stratified approach enables operators to transition from reactive customer service to proactive, location-based infrastructure management, effectively addressing the most relevant challenges in each urban environment and accelerating EV adoption. Our research suggests that the next generation of charging infrastructure planning must integrate these spatial thematic patterns with traditional density metrics to create a network that genuinely meets the diverse needs of urban EV users.

4.5.3. Correlation Between Topics and Spatial Features

The correlation analysis between topic distribution and spatial characteristics (see Figure 17) reveals that user concerns exhibit distinct patterns across different spatial environments. The analysis indicates a significant negative correlation between charging experience topics and distance from the city center (r = −0.47, p = 0.001), suggesting that users in closer proximity to urban core areas place greater emphasis on the quality of the charging experience. This spatial pattern may reflect multiple urban centralization factors, including higher usage intensity of charging stations, higher user expectations, and increased equipment failure rates due to higher usage frequency.
In contrast, topics related to pricing and parking availability exhibited extremely weak correlations with spatial features (e.g., price: r = −0.04, p = 0.817), indicating that these concerns are distributed uniformly across the city and are location-independent. This finding carries significant ramifications for service providers: targeted spatial interventions are imperative to address issues pertaining to charging experience, whereas consistent city-wide policies are needed for pricing and parking concerns. The analysis yielded a “spatial sensitivity gradient”: charging experience is highly location-dependent, pricing issues show intermediate sensitivity, and parking availability is largely location-insensitive. This gradient suggests that infrastructure planning should adopt calibrated strategies: charging technology choices should be location-adaptive (e.g., deploying high-capacity, fast-charging equipment in urban centers), while pricing strategies and parking solutions can be regionally standardized.
Furthermore, a weak correlation was identified between comment density and issue proportion, with charging experience demonstrating the strongest correlation (r = 0.26, p = 0.065), although this remained below traditional significance thresholds. In addition, the number of charging stations within a region has a negligible impact on issue distribution, with all correlations approaching zero. This finding challenges traditional assumptions about infrastructure saturation, suggesting that merely increasing the number of charging stations may not address users’ specific needs and that service quality outweighs quantity. This supports a shift from expansion-oriented development to upgrading existing infrastructure with an emphasis on user experience.
Collectively, these correlation patterns suggest a “spatially aware, experience-centric” development model for charging infrastructure. Within this framework, charging station specifications, maintenance protocols, and service designs must be tailored to regional characteristics, rather than uniformly implemented. The pronounced spatial variations in charging experience issues, in stark contrast to the uniform distribution of price and parking challenges, underscore the necessity for operators to prioritize enhancing equipment quality and maintenance in urban core areas, while concurrently implementing consistent pricing and parking management policies across the entire city. This nuanced, regionally differentiated strategy will facilitate more effective planning of charging stations and enhance overall user satisfaction.

5. Conclusions

This study developed a framework for analyzing EV charging station user reviews using pre-trained language models, achieving effective sentiment classification and multi-granularity topic identification. The core findings include the following: RoBERTa-WWM demonstrates superior performance in sentiment analysis (accuracy = 0.917) and fine-grained topic identification (Micro-F1 = 0.844), while ELECTRA excels at coarse-grained tasks. The models exhibit autonomous data refinement capabilities, extracting valuable insights from low-density comments. Spatial analysis revealed significant urban–suburban sentiment patterns, with GWR analysis identifying three distinct spatial archetypes, namely technology frontier zones with high equipment sensitivity, commercial–residential mixed zones with complex amenity relationships, and emerging adoption zones focused on accessibility and pricing. These findings enable customized infrastructure strategies and location-aware management approaches.
The study demonstrates clear correlations between pre-training strategies and task requirements, with RoBERTa’s WWM strategy excelling in sentiment analysis while ELECTRA’s replaced token detection (RTD) approach shows advantages in coarse-grained tasks. The models exhibit autonomous data refinement capabilities, extracting valuable insights from low-density comments and reassigning labels to enhance dataset reliability.
Spatial analysis revealed an “urban-suburban sentiment gap” where northern suburbs show higher satisfaction despite fewer facilities, while technology-intensive districts exhibit negative sentiment. GWR analysis identified three spatial archetypes requiring differentiated strategies, with technology frontier zones needing advanced equipment, commercial–residential mixed zones requiring space optimization, and emerging adoption zones focusing on accessibility.
The framework provides actionable insights for infrastructure operators through differentiated strategies and supports evidence-based policy decisions. However, limitations include challenges in processing complex linguistic phenomena and geographic scope limited to Beijing, which may limit generalizability to other regions with different user behavior patterns.
Future research should explore several promising directions. Although this study has demonstrated the effective adaptability of existing PLM in electric vehicle charging scenarios, future research can expand the scope and volume of data collection to support larger-scale model architectures and training strategies, thereby exploring improvements in the model’s performance in identifying user needs and requirements. Additionally, extending data collection to more regions and cities would validate generalizability across different economic development levels and user demographics, enabling the development of adaptive models that can be customized according to regional attributes for differentiated analysis and customized predictions. Building on the GWR framework, future research should also explore more sophisticated spatial econometric approaches and incorporate temporal dimensions to enable dynamic analysis of evolving user satisfaction patterns. Finally, combining textual feedback with quantitative metrics and real-time operational data would create comprehensive user experience models that capture both subjective perceptions and objective performance indicators.

Author Contributions

Conceptualization, Yanxin Hou and Peipei Wang; Data curation, Yanxin Hou, Zhuozhuang Yao and Ziying Chen; Formal analysis, Yanxin Hou; Funding acquisition, Peipei Wang; Investigation, Zhuozhuang Yao and Ziying Chen; Methodology, Yanxin Hou; Software, Yanxin Hou and Zhuozhuang Yao; Supervision, Peipei Wang and Xinqi Zheng; Validation, Yanxin Hou; Visualization, Yanxin Hou; Writing—original draft, Yanxin Hou; Writing—review and editing, Yanxin Hou, Peipei Wang, Zhuozhuang Yao, Xinqi Zheng, and Ziying Chen. All authors have read and agreed to the published version of the manuscript.

Funding

This research was supported by the Fundamental Research Funds for the Central Universities, grant number 2652023060 and Category A, China University of Geosciences Beijing Undergraduate Innovation and Entrepreneurship Training Program.

Data Availability Statement

The data presented in this study are available on request from the corresponding author due to proprietary and privacy considerations.

Acknowledgments

The authors would like to express their sincere gratitude to the School of Information Engineering at China University of Geosciences (Beijing) for providing the computational resources necessary for this study. We also thank the anonymous reviewers for their insightful comments and valuable suggestions that significantly improved the quality of this manuscript.

Conflicts of Interest

The authors declare that they have no known competing financial interests or personal relationships that could have appeared to influence the work reported in this paper.

References

  1. LaMonaca, S.; Ryan, L. The state of play in electric vehicle charging services—A review of infrastructure provision, players, and policies. Renew. Sustain. Energy Rev. 2022, 154, 111733. [Google Scholar] [CrossRef]
  2. Bhat, F.A.; Tiwari, G.Y.; Verma, A. Preferences for public electric vehicle charging infrastructure locations: A discrete choice analysis. Transp. Policy 2024, 149, 177–197. [Google Scholar] [CrossRef]
  3. Li, S.G.; Liu, F.; Zhang, Y.Q.; Zhu, B.Y.; Zhu, H.; Yu, Z.X. Text Mining of User-Generated Content (UGC) for Business Applications in E-Commerce: A Systematic Review. Mathematics 2022, 10, 3554. [Google Scholar] [CrossRef]
  4. Yang, L.; Li, Y.; Wang, J.; Sherratt, R.S. Sentiment Analysis for E-Commerce Product Reviews in Chinese Based on Sentiment Lexicon and Deep Learning. IEEE Access 2020, 8, 23522–23530. [Google Scholar] [CrossRef]
  5. Kim, Y. Convolutional Neural Networks for Sentence Classification. In Proceedings of the 2014 Conference on Empirical Methods in Natural Language Processing, Doha, Qatar, 25–29 October 2014; pp. 1746–1751. [Google Scholar]
  6. Alemayehu, F.; Meshesha, M.; Abate, J. Amharic political sentiment analysis using deep learning approaches. Sci. Rep. 2023, 13, 17982. [Google Scholar] [CrossRef] [PubMed]
  7. Onan, A. Bidirectional convolutional recurrent neural network architecture with group-wise enhancement mechanism for text sentiment classification. J. King Saud Univ. Comput. Inf. Sci. 2022, 34, 2098–2117. [Google Scholar] [CrossRef]
  8. Devlin, J.; Chang, M.-W.; Lee, K.; Toutanova, K. BERT: Pre-training of Deep Bidirectional Transformers for Language Understanding. In Proceedings of the 2019 Conference of the North American Chapter of the Association for Computational Linguistics: Human Language Technologies, Minneapolis, MN, USA, 2–7 June 2019; pp. 4171–4186. [Google Scholar]
  9. Liu, Y.; Ott, M.; Goyal, N.; Du, J.; Joshi, M.; Chen, D.; Levy, O.; Lewis, M.; Zettlemoyer, L.; Stoyanov, V. RoBERTa: A Robustly Optimized BERT Pretraining Approach. arXiv 2019, arXiv:1907.11692. [Google Scholar] [CrossRef]
  10. Cui, Y.; Che, W.; Liu, T.; Qin, B.; Yang, Z. Pre-Training with Whole Word Masking for Chinese BERT. IEEE/ACM Trans. Audio Speech Lang. Process. 2021, 29, 3504–3514. [Google Scholar] [CrossRef]
  11. Clark, K.; Luong, M.-T.; Le, Q.V.; Manning, C.D. ELECTRA: Pre-training Text Encoders as Discriminators Rather Than Generators. arXiv 2020, arXiv:2003.10555. [Google Scholar] [CrossRef]
  12. Nazir, A.; Rao, Y.; Wu, L.W.; Sun, L. Issues and Challenges of Aspect-based Sentiment Analysis: A Comprehensive Survey. IEEE Trans. Affect. Comput. 2022, 13, 845–863. [Google Scholar] [CrossRef]
  13. Zhang, W.X.; Li, X.; Deng, Y.; Bing, L.D.; Lam, W. A Survey on Aspect-Based Sentiment Analysis: Tasks, Methods, and Challenges. IEEE Trans. Knowl. Data Eng. 2023, 35, 11019–11038. [Google Scholar] [CrossRef]
  14. Abdelgwad, M.M.; Soliman, T.H.A.; Taloba, A.; Farghaly, M.F. Arabic aspect based sentiment analysis using bidirectional GRU based models. J. King Saud Univ. Comput. Inf. Sci. 2022, 34, 6652–6662. [Google Scholar] [CrossRef]
  15. Hu, B.; Ester, M. Spatial topic modeling in online social media for location recommendation. In Proceedings of the 7th ACM Conference on Recommender Systems, Hong Kong, China, 12–16 October 2013; pp. 25–32. [Google Scholar]
  16. Mao, H.; Fan, Y.; Tong, M. Research on aspect-based sentiment analysis of movie reviews based on deep learning. J. Inf. Sci. 2024. [Google Scholar] [CrossRef]
  17. Ren, X.; Sun, S.; Yuan, R. A Study on Selection Strategies for Battery Electric Vehicles Based on Sentiments, Analysis, and the MCDM Model. Math. Probl. Eng. 2021, 2021, 9984343. [Google Scholar] [CrossRef]
  18. Chen, S.; Tu, C. Fine-Grained Sentiment Analysis of Electric Vehicle User Reviews: A Bidirectional LSTM Approach to Capturing Emotional Intensity in Chinese Text. arXiv 2024, arXiv:2412.03873. [Google Scholar] [CrossRef]
  19. Sharma, H.; Ud Din, F.; Ogunleye, B. Electric Vehicle Sentiment Analysis Using Large Language Models. Analytics 2024, 3, 425–438. [Google Scholar] [CrossRef]
  20. Obiedat, R.; Al-Darras, D.; Alzaghoul, E.; Harfoushi, O. Arabic Aspect-Based Sentiment Analysis: A Systematic Literature Review. IEEE Access 2021, 9, 152628–152645. [Google Scholar] [CrossRef]
  21. Li, F.; Huang, M.; Yang, Y.; Zhu, X. Learning to identify review spam. In Proceedings of the Twenty-Second International Joint Conference on Artificial Intelligence, Barcelona, Spain, 16–22 July 2011; Volume 3, pp. 2488–2493. [Google Scholar]
  22. Huang, C.; He, G. Text Clustering as Classification with LLMs. arXiv 2024, arXiv:2410.00927. [Google Scholar] [CrossRef]
  23. Gilardi, F.; Alizadeh, M.; Kubli, M. ChatGPT outperforms crowd workers for text-annotation tasks. Proc. Natl. Acad. Sci. USA 2023, 120, e2305016120. [Google Scholar] [CrossRef]
  24. Fonferko-Shadrach, B.; Strafford, H.; Jones, C.; Khan, R.A.; Brown, S.; Edwards, J.; Hawken, J.; Shrimpton, L.E.; White, C.P.; Powell, R.; et al. Annotation of epilepsy clinic letters for natural language processing. J. Biomed. Semant. 2024, 15, 17. [Google Scholar] [CrossRef]
  25. Ivanisenko, T.V.; Demenkov, P.S.; Ivanisenko, V.A. An Accurate and Efficient Approach to Knowledge Extraction from Scientific Publications Using Structured Ontology Models, Graph Neural Networks, and Large Language Models. Int. J. Mol. Sci. 2024, 25, 11811. [Google Scholar] [CrossRef] [PubMed]
  26. Zhu, L.; Xu, M.; Bao, Y.; Xu, Y.; Kong, X. Deep learning for aspect-based sentiment analysis: A review. PeerJ Comput. Sci. 2022, 8, e1044. [Google Scholar] [CrossRef]
  27. Wu, Z.; Cao, G.; Mo, W. Multi-Tasking for Aspect-Based Sentiment Analysis via Constructing Auxiliary Self-Supervision ACOP Task. IEEE Access 2023, 11, 82924–82932. [Google Scholar] [CrossRef]
  28. Bucher, M.J.J.; Martini, M. Fine-tuned’ small’ LLMs (still) significantly outperform zero-shot generative AI models in text classification. arXiv 2024, arXiv:2406.08660. [Google Scholar]
  29. Wang, Y.; Qu, W.; Ye, X. Selecting between BERT and GPT for text classification in political science research. arXiv 2024, arXiv:2411.05050. [Google Scholar] [CrossRef]
  30. Malvankar, K.; Fallon, E.; Connolly, P.; Flanagan, K. Performance optimization for transformer models on text classification tasks. In Proceedings of the 2023 International Conference on Emerging Techniques in Computational Intelligence (ICETCI), Hyderabad, India, 21–23 September 2023; pp. 105–111. [Google Scholar]
Figure 1. Distributional characteristics of the comment dataset. (a) Frequency distribution and density estimation curve of comment length; (b) distribution of the number of comments per station.
Ijgi 14 00325 g001
Figure 2. Sentiment distribution analysis. (a) Distribution of sentiment categories across the entire dataset; (b) sentiment category percentages for the 10 stations with the highest number of comments.
Ijgi 14 00325 g002
Figure 3. Word frequency word cloud map of commentary affective polarity. (a1) Word frequencies from positive comments in Chinese; (a2) word frequencies from positive comments in English; (b1) word frequencies from negative comments in Chinese; (b2) word frequencies from negative comments in English.
Ijgi 14 00325 g003
Figure 4. The overall research framework.
Ijgi 14 00325 g004
Figure 5. Architecture of the unified model for sentiment and topic analysis.
Ijgi 14 00325 g005
Figure 6. Best performance comparison across different tasks.
Ijgi 14 00325 g006
Figure 7. Sentiment analysis performance (accuracy) across different configurations.
Ijgi 14 00325 g007
Figure 8. Spatial Distribution of User Comments and Sentiment for EV Charging Stations in Beijing. (a) A heatmap illustrating the spatial density of user comments, with warmer colors indicating higher comment volumes. This panel highlights significant regional variations in user engagement. (b) A map detailing the distribution of sentiment scores across different districts. Darker red shades denote higher review volumes and a marked negative sentiment, while lighter shades represent lower engagement levels with predominantly positive sentiment. The map reveals an inverse correlation between proximity to the urban core and user satisfaction, with northern suburban districts (e.g., Pinggu, Miyun, Huairou) showing higher satisfaction and southern and western urban districts (e.g., Haidian, Fengtai, Daxing) displaying negative sentiment.
Ijgi 14 00325 g008
Figure 9. GWR coefficient spatial distribution map.
Ijgi 14 00325 g009
Figure 10. SHAP summary plot for positive sentiment classification. Each dot represents a sample, with its x-axis position showing the SHAP value contribution to the positive sentiment output. Non-English features include: “电” (electricity), “充” (charge), “心” (heart), “锁” (lock), “即” (immediately), “良” (good), “层” (layer), “单” (single), “暖” (warm), “纸” (paper), “聪” (smart), “妙” (wonderful), “干” (dry), “休” (rest), “九” (nine), and “圆” (round).
Ijgi 14 00325 g010
Figure 11. SHAP waterfall plot for individual sample analysis. The plot shows how each feature (word) contributes positively (green) or negatively (red) to the model’s sentiment prediction.
Ijgi 14 00325 g011
Figure 12. Fine-grained topic recognition performance.
Ijgi 14 00325 g012
Figure 13. Coarse-grained topic recognition performance.
Ijgi 14 00325 g013
Figure 14. Analysis of label changes before and after model training.
Ijgi 14 00325 g014
Figure 15. Thematic reallocation of low-information reviews before and after model training.
Ijgi 14 00325 g015
Figure 16. Spatial distribution of user review topics for EV charging stations in Beijing.
Ijgi 14 00325 g016
Figure 17. Correlation between topics and spatial features.
Ijgi 14 00325 g017
Table 1. Emotion label explanation.
Emotional LabelsBasis of JudgmentTypical ExampleTypical Example (English)
Emotionally PositiveComments that express positive emotions, such as satisfaction and appreciation.很赞,最近一年多都在用Great, I’ve been using it for over a year now.
Emotionally NegativeComments that express dissatisfaction, complaints, and other negative emotions.一个半小时都充不满,太慢了浪费时间Takes an hour and a half and still can’t fully charge, way too slow and a waste of time.
Emotionally NeutralComments that do not contain explicit emotional tendencies or objective statements.应该是新开的站吧,桩子挺多,地方不是太大,错车要注意安全Must be a newly opened station—lots of chargers, but the space isn’t very big, so be careful when passing other cars.
Invalid FeedbackComments whose content is not related to the charging service or that do not contain substantive information.1,234,567,8901,234,567,890
Table 2. Fine-grained topics (9 categories).
Level 1 TopicSecondary TopicKey Content Points and ExamplesTypical ExampleTypical Example (English)
Charging experienceSmooth chargingFast charging, easy operation, and smooth process.充电真心慢 一个小时充了百分之35Charging is really slow, only 35% in an hour.
Charging problemsSlow charging, interruption or jumping off the gun, charging failure, unstable power, and model incompatibility.
Condition of equipmentGood equipmentAdequate equipment, easy to use, neat appearance, clear screen. Example: “Good facilities”.第一个老卡不上,换了一个,对女生可能还是费劲点The first one kept getting stuck, switched to another, still a bit tough for girls.
Equipment issuesThe equipment is damaged, in short supply, outdated, defective in design, and inconvenient to use.
Location and convenienceGood locationCharging stations are conveniently located and easy to find, navigation is accurate, and parking spaces are close to the charging stations.很好找,每层停车场入口就能看见。Easy to find, visible at every parking lot entrance.
Location issuesCharging stations are hard to find, navigation is incorrect, and entrances are challenging to locate.
Clear guidanceStation directions are clear, app navigation is accurate, and bad piles are marked.
Lack of guidanceConfusing station directions, incorrect app navigation, and unmarked piles.
Price-relatedReasonable priceAffordable, cost-effective, and discounted.停车费太贵了12一小时了Parking fee is too expensive, 12 per hour.
Price issuesCharging, service, and parking fees are expensive, opaque, and inaccurately calculated.
The situation regarding parking spacesGood parkingPlenty of parking, free parking, and well-managed dedicated spaces.油车占位现象严重,应加强管理Gas cars occupying spots is a serious issue, management should improve.
The problem of parking spacesParking spaces are tight; you have to wait in line; fuel trucks occupy space; parking fees are high; cars still take up space after filling up.
Environment and supporting facilitiesFavorable environmentIt is a clean environment, brightly lit, sheltered, and well-appointed. Example: “There are restrooms”.环境不错不错不错不错不错The environment is nice nice nice nice nice.
Environmental issuesThe environment is dirty, dimly lit, and lacks support, with a poor Internet signal.
Operator servicesGood serviceCustomer service is responsive, the staff is committed, the app is stable, and offers are real.总得来说满意 余额目前没发现怎能退回Overall satisfied, haven’t figured out how to refund the balance yet.
Service issuesSlow customer service response, employee negligence, a hard-to-use app, and payment, billing, balance, and membership issues.
(sth. or sb) elseOther issuesSpecific information of value to other users that is not included in the above categorization.我真的不想评论的 烦人I really didn’t want to comment, so annoying.
UntitledUntitledNo clear topic不错不错不错不错不错Nice. Nice. Nice. Nice. Nice.
Table 3. Coarse-grained topics (7 categories).
Secondary TopicScope of Topics Covered at the First LevelTypical ExampleTypical Example (English)
Charging experience and equipmentCharging experience + device status有一把枪用不了了,管理员赶紧修修吧There’s a charging gun that’s not working, please fix it quickly, administrator.
Location and guidanceLocation and guidance商场环境好车位充足,交通便利The mall has a great environment with plenty of parking spaces and convenient transportation.
Price-relatedPrice-related太贵了 比国家电网的贵太多了It’s too expensive, much pricier than State Grid.
Car parking and environment packageParking situation + environment and facilities全是油车占位All the spots are taken by gas cars.
Carrier service-relatedCarrier-service related把红包用了,还有几块钱就得了,可能不来了。Use the discount, just save a few bucks, might not come again.
(sth. or sb) else(sth. or sb) else这个月就可以做出一些改变This month, we can make some changes.
UntitledUntitled好满意So satisfied.
Table 4. Evaluation metrics for different tasks.
Task TypeMetricFormulaInterpretation
Sentiment analysis
(single-label)
Accuracy T P + T N T P + T N + F P + F N Overall classification correctness
Macro-F1 1 C c = 1 C   F 1 c Unweighted average F1 across classes
Weighted-F1 c = 1 C   w c F 1 c Support-weighted F1 across classes
Topic classification
(multi-label)
Micro-F1 2 P m i c r o R m i c r o P m i c r o + R m i c r o Global F1 aggregating all labels
Macro-F1 1 L l = 1 L   F 1 l Unweighted average F1 across labels
Sample-F1 1 N i = 1 N   F 1 i Average F1 per sample instance
where TP = true positive, TN = true negative, FP = false positive, FN = false negative, C = number of classes, L = number of labels, N = number of samples, and $w_c$ = class weight proportional to support.
Table 5. Hyperparameter Configurations for Experimental Setups.
HyperparameterConfig A Config B Config C Config D Config E
Max sequence length128128256128128
Batch size64128326464
Learning rate2 × 10−51 × 10−52 × 10−52 × 10−52 × 10−5
Epochs2020202030
Dropout rate0.10.10.20.10.1
Loss weights (S, CT, FT *)[1.0, 1.0, 1.0][1.0, 1.0, 1.0][1.0, 1.0, 1.0][1.5, 1.0, 1.0][1.0, 1.0, 1.0]
Patience33335
* S, CT, and FT correspond to the loss weights for the sentiment, coarse-grained topic, and fine-grained topic tasks, respectively.
Disclaimer/Publisher’s Note: The statements, opinions and data contained in all publications are solely those of the individual author(s) and contributor(s) and not of MDPI and/or the editor(s). MDPI and/or the editor(s) disclaim responsibility for any injury to people or property resulting from any ideas, methods, instructions or products referred to in the content.