4.3. Comparison to Existing Methods
We compare the performance of our approach against five recent regression methods, each representing a distinct modeling paradigm. Streetscore [
43] is a classification-based approach that integrates multiple visual features. RESupCon [
52] applies supervised contrastive learning to enhance regression accuracy. Adaptive Contrast [
53] is a contrastive learning technique tailored for medical image regression tasks, while UCVME [
54] employs a semi-supervised learning framework to improve performance with limited labeled data. CLIP + KNN [
55] is a clustering method that uses CLIP features for image score aggregation. We evaluate these methods using metrics of R
2 and comparison accuracy.
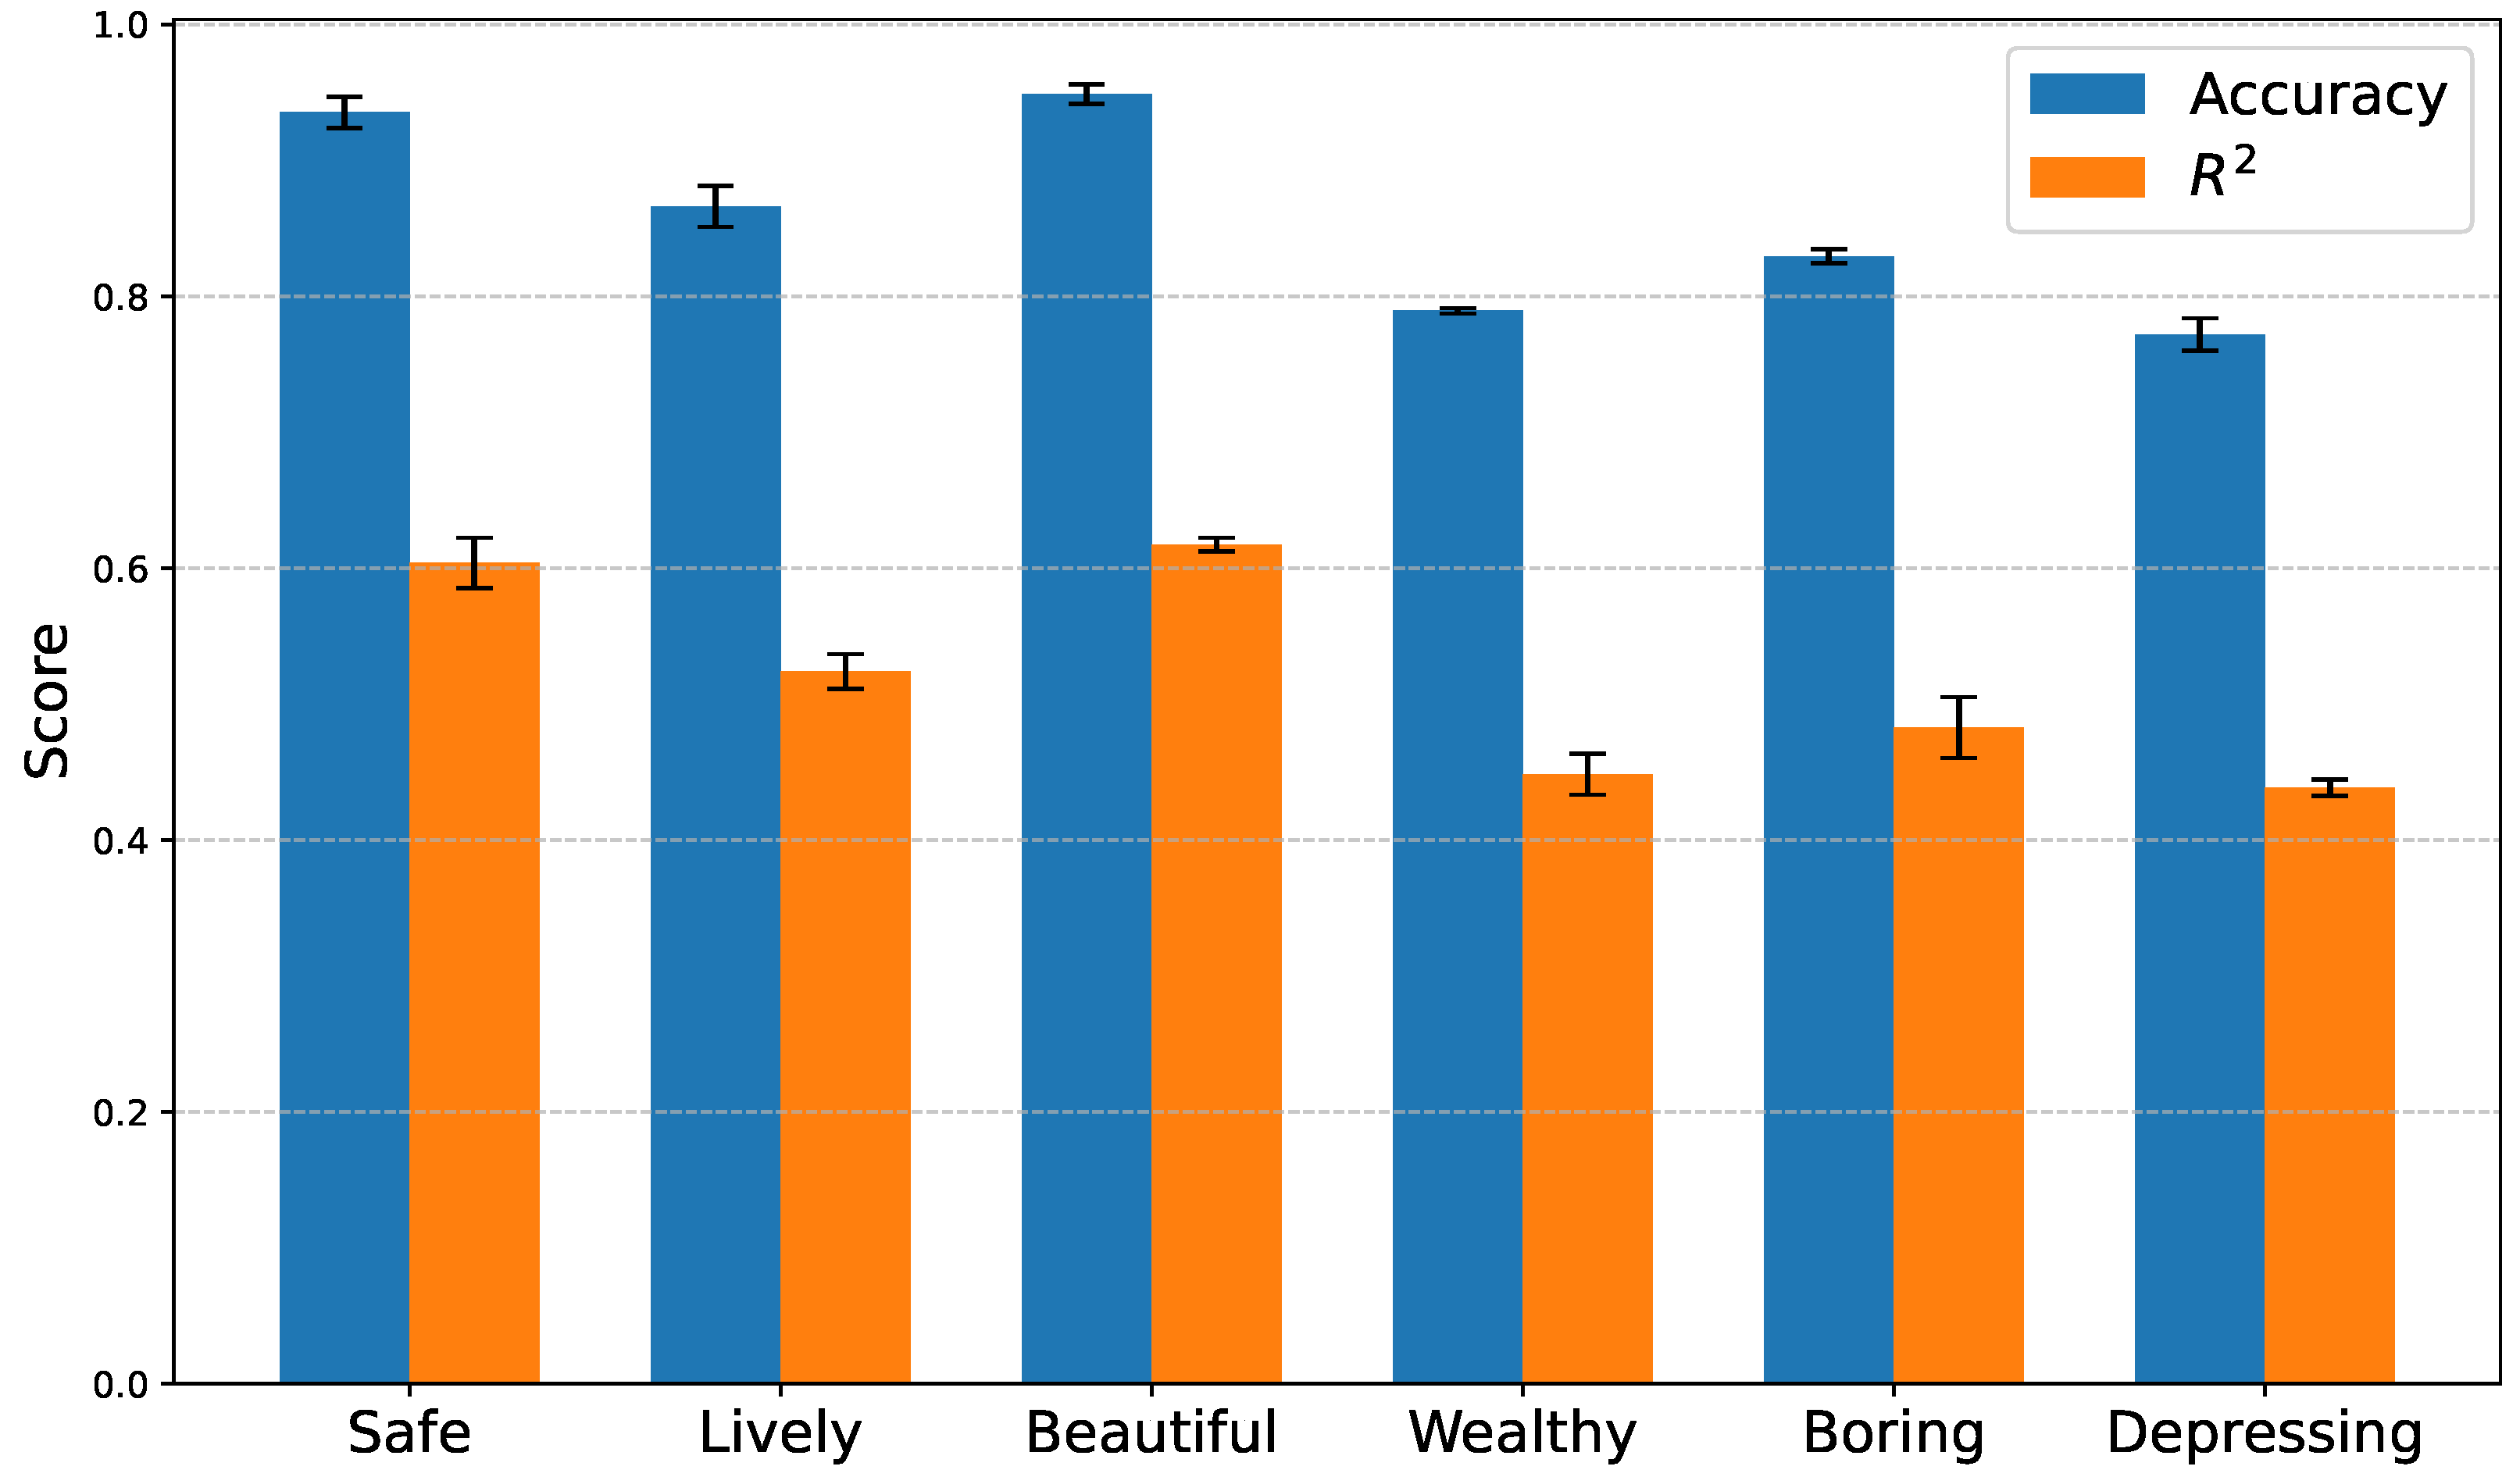
Table 3 presents a detailed comparison across six perceptual dimensions from Place Pulse 2.0, and several trends can be observed. Among the baseline methods, CLIP + KNN achieves the best performance, consistently outperforming traditional CNN-based methods (Streetscore, Adaptive Contrast, and RESupCon) in both accuracy and
across all dimensions. This highlights the strong generalization ability of CLIP features for visual perception tasks. Additionally, compared to all baselines, our proposed UP-CBM approach achieves new state-of-the-art results. The UP-CBM with an RN-101 backbone already surpasses CLIP + KNN by notable margins in most categories. The UP-CBM with a ViT-B backbone further improves the performance, achieving the best results across all six dimensions. Specifically, it improves the accuracy in the Safe dimension to 0.9352 and the
in the Beautiful dimension to 0.6174, which represents substantial improvements.
A clear trend is also observed that ViT-based models (ViT-S and ViT-B) generally outperform ResNet-based models (RN-50 and RN-101), reflecting the advantages of transformer architectures in modeling complex visual semantics for perceptual regression. The most important discovery is that our method not only improves the comparison accuracy but also significantly raises the scores, indicating better regression quality and consistency with human perceptual judgments. These results demonstrate the effectiveness of our UP-CBM framework in capturing perceptual cues and improving generalization across diverse urban perception dimensions.
We further evaluate the performance of different concept-based classification methods on the VRVWPR dataset, which contains six perceptual dimensions: Walkability, Feasibility, Accessibility, Safety, Comfort, and Pleasurability. For concept-based methods, we briefly introduce them in this section. SENN [
58] and ProtoPNet [
59] are pioneering works that introduce interpretable prototypes or relevance scores to enhance model explainability. BotCL [
20] improves concept learning by combining bottleneck constraints with contrastive learning, whereas P-CBM [
60] proposes a post hoc concept bottleneck model for flexible concept supervision. LF-CBM [
61] refines concept bottlenecks by leveraging label factorization to disentangle concept dependencies. We also include standard deep models (ResNet50 and ViT-Base) as baselines for comparison.
As shown in
Table 4, the UP-CBM consistently achieves superior performance across all dimensions. Our UP-CBM based on RN50 already matches or exceeds the strongest prior methods, whereas the UP-CBM with a ViT-B backbone further boosts the accuracy to new state-of-the-art levels. Specifically, it achieves an overall accuracy of 0.8835, outperforming the previous best method, LF-CBM (0.8647), by a notable margin. Across individual dimensions, the UP-CBM ViT-B attains the highest accuracy in all six perceptual categories. For example, it improves Walkability to 0.9021, Feasibility to 0.9405, and Comfort to 0.9253, demonstrating that our framework can more effectively capture nuanced perceptual concepts compared with previous approaches. In addition, transformer-based models (ViT-B) consistently outperform convolutional networks (ResNet50) in both baseline and UP-CBM settings, highlighting the advantage of transformer architectures for concept-aware visual perception modeling. These results validate the effectiveness of our UP-CBM framework in enhancing both interpretability and prediction accuracy for perceptual classification tasks.
4.4. Concept Analysis
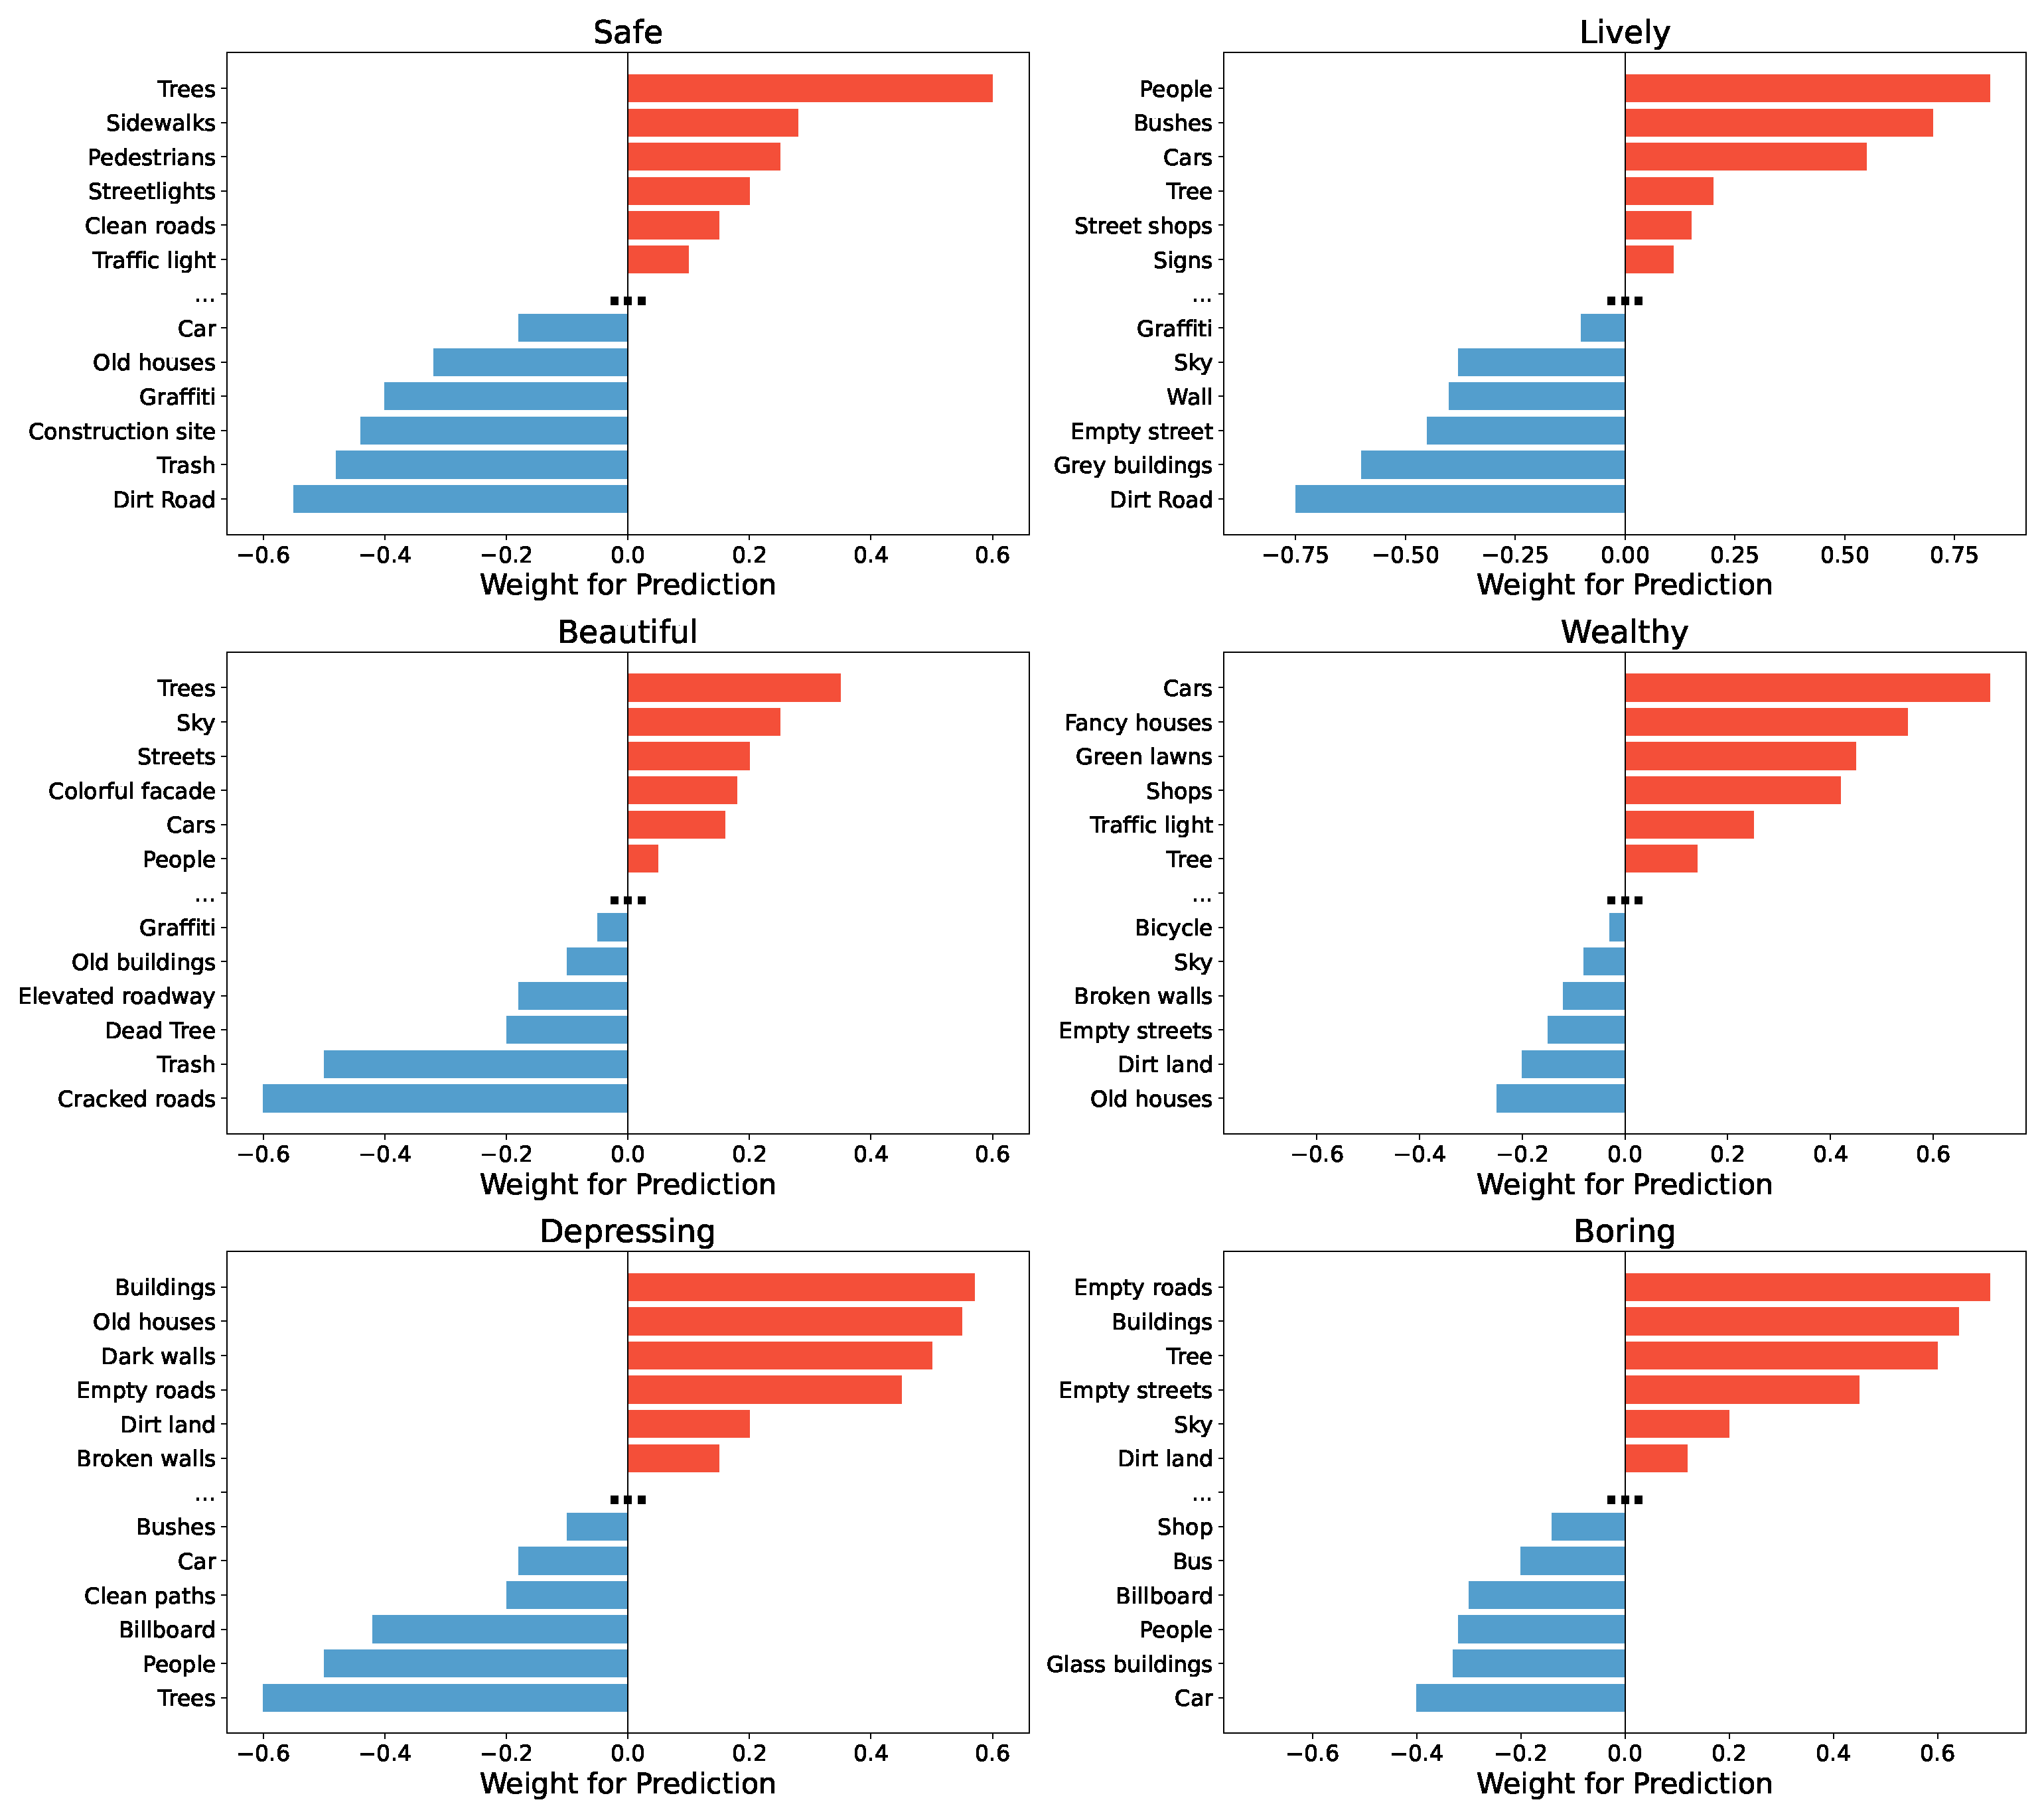
The objective of this experiment is to investigate the influences of various visual concepts on the prediction of urban perception dimensions. For each concept (In
Figure 3), we compute the product of its activation value and the corresponding weight from the fully connected classifier and normalize the result to the range
(computed across the whole test set). A higher normalized value (closer to 1) indicates a positive contribution to the perception prediction, whereas a lower value (closer to
) indicates a negative impact. To intuitively illustrate the role of different concepts, we plot bar charts for each perception dimension. Positive concepts are shown in red, negative concepts in blue, and a bold ellipsis visually separates positive and negative concepts (the top 6 positive and negative concepts are demonstrated).
Across the different perception dimensions, we observe distinct patterns: For Safe, natural and pedestrian-friendly elements such as “Trees”, “Sidewalks”, and “Pedestrians” make strong positive contributions, highlighting the importance of greenery and pedestrian infrastructure for perceived safety. Conversely, elements indicative of environmental deterioration, such as “Trash”, “Construction site”, and “Graffiti” negatively affect safety perception. For Lively, the presence of “People”, “Bushes”, and “Cars” strongly enhances the sense of liveliness, emphasizing the role of human activity and transportation in shaping urban vibrancy. In contrast, empty streets (“Streets”) and monotonous structures (“Grey buildings”) significantly diminish the feeling of liveliness. For Beautiful, natural scenery elements such as “Trees” and “Sky”, as well as colorful architectural features (“Colorful facade”), positively influence beauty perception. On the other hand, environmental damage such as “Cracked roads” and “Trash” substantially lowers perceived beauty, demonstrating the critical role of cleanliness and natural elements. For Wealthy, indicators of affluence, including “Fancy houses”, “Shops”, and “Green lawns”, contribute strongly to the sense of wealth. Meanwhile, dilapidated elements like “Old houses” and “Cracked roads” exert a negative impact, suggesting that visual cues of maintenance and prosperity are closely tied to wealth perception. For Depressing, old and deteriorated structures like “Old houses”, “Dark walls”, and “Empty roads” are the major contributors, while the presence of “Trees” and “People” alleviates the depressing feeling. For Boring, monotony-related features such as “Empty roads”, “Buildings”, and “Empty streets” increase boredom, whereas “People” and “Shops” mitigate it by introducing diversity and activity. Overall, these results demonstrate that specific visual elements have consistent and interpretable influences on different dimensions of urban perception, providing valuable insights for urban design and planning.
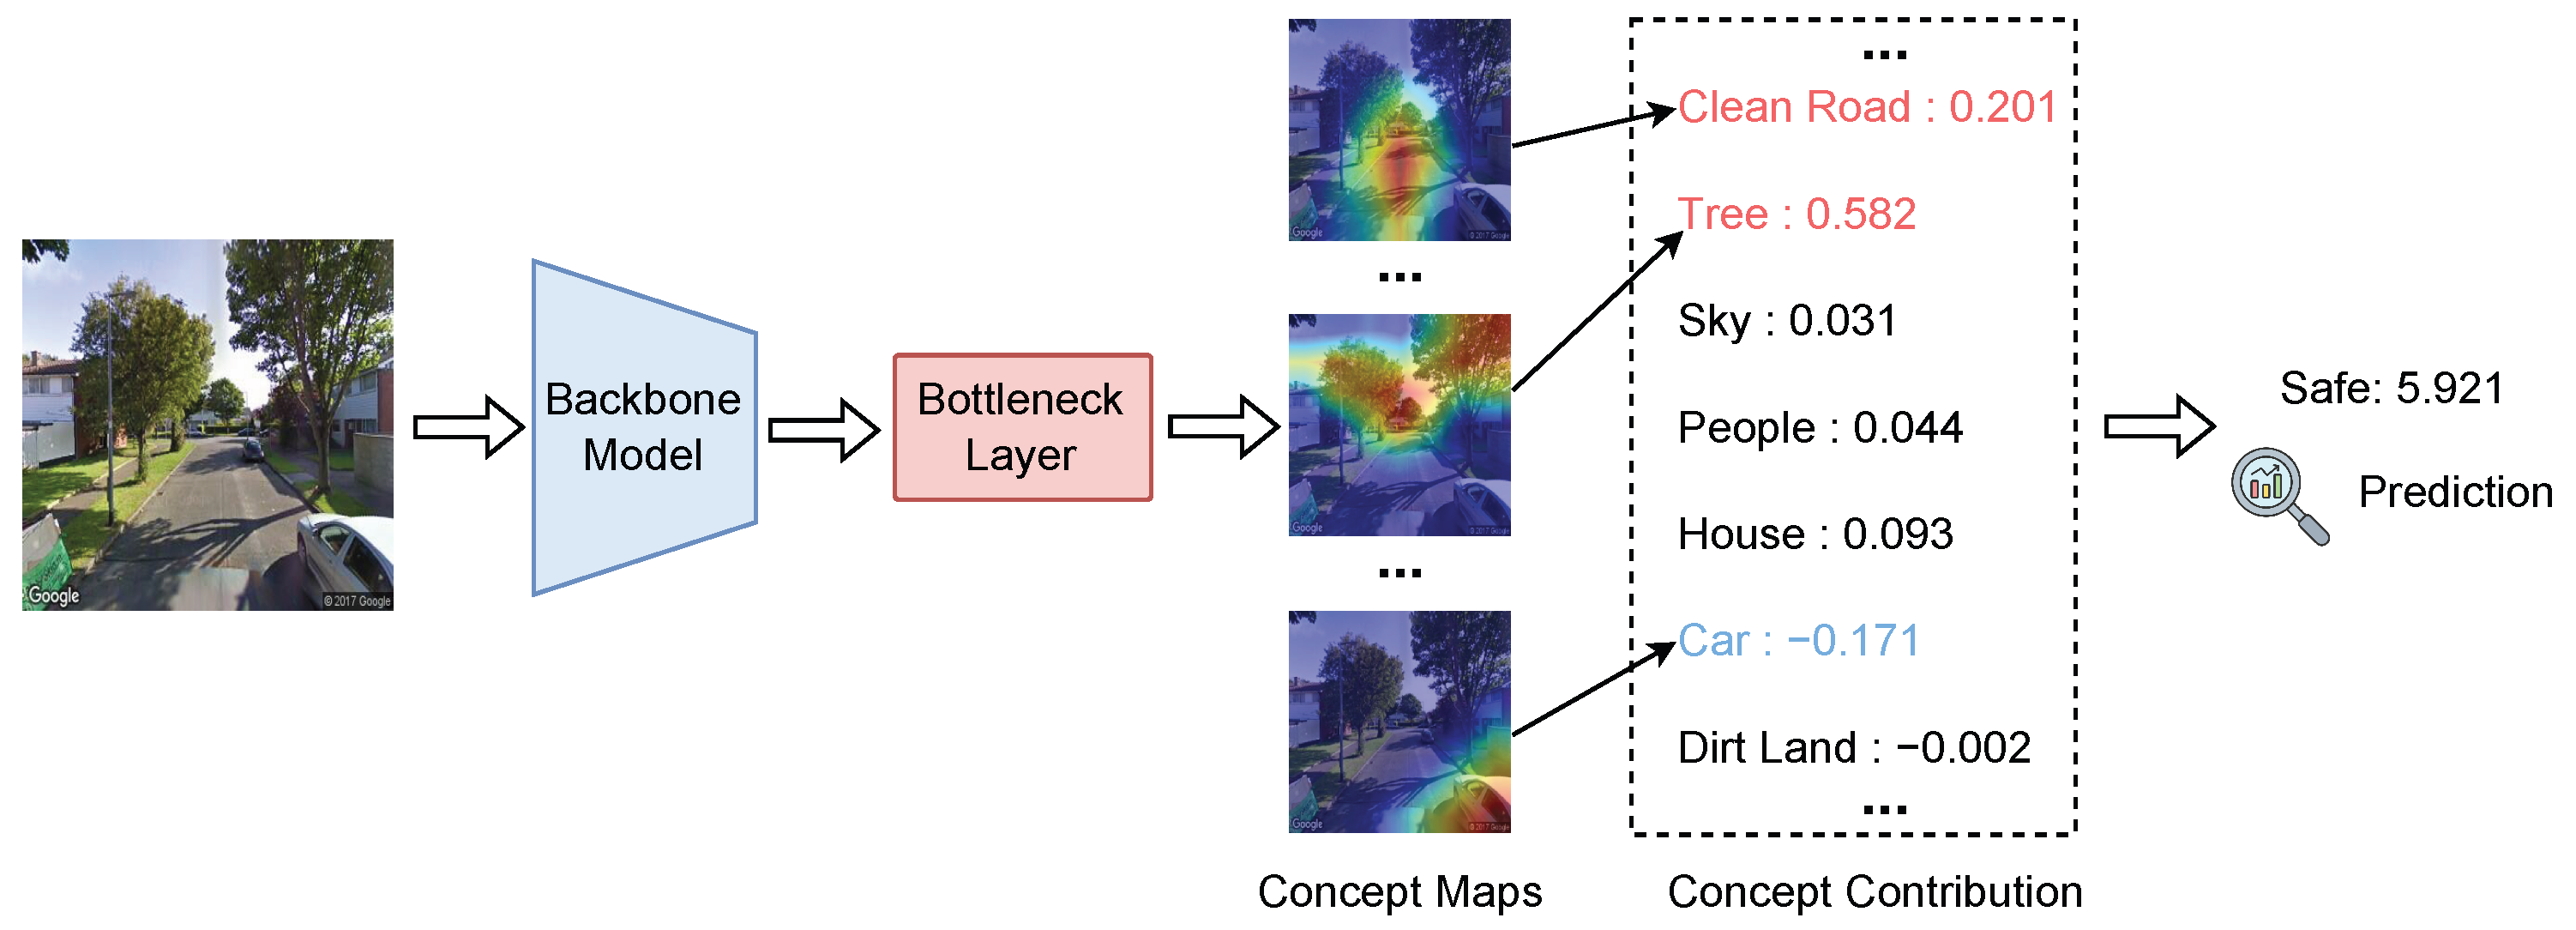
Figure 4 illustrates the concept-based interpretation process for the “Safe” score prediction during inference. The input street-view image is first processed by a backbone model to extract high-level visual features. These features are then passed through a bottleneck layer that generates a set of semantically meaningful concept maps, each highlighting spatial regions associated with specific urban concepts. For each concept, a scalar contribution score is calculated, reflecting its influence on the final “Safe” score. Positive contributions indicate concepts that enhance perceived safety, while negative contributions represent factors that detract from it.
In this example, “Tree” exhibits the highest positive contribution (0.582), suggesting that the presence of trees strongly promotes the perception of safety. “Clean Road” also contributes positively (0.201), reinforcing the intuition that well-maintained infrastructure improves safety perceptions. Other positive but smaller contributions come from “House” (0.093), “People” (0.044), and “Sky” (0.031). Conversely, the presence of a “Car” negatively impacts the safety score (−0.171), implying that visible vehicles in this context are associated with lower perceived safety. “Dirt Land” shows a minor negative effect (−0.002). By aggregating these weighted contributions across concepts, the model produces a final “Safe” prediction score of 5.921. This decomposition provides an interpretable pathway from low-level visual features to high-level safety assessments, offering transparency and explainability for the model’s decision-making process.
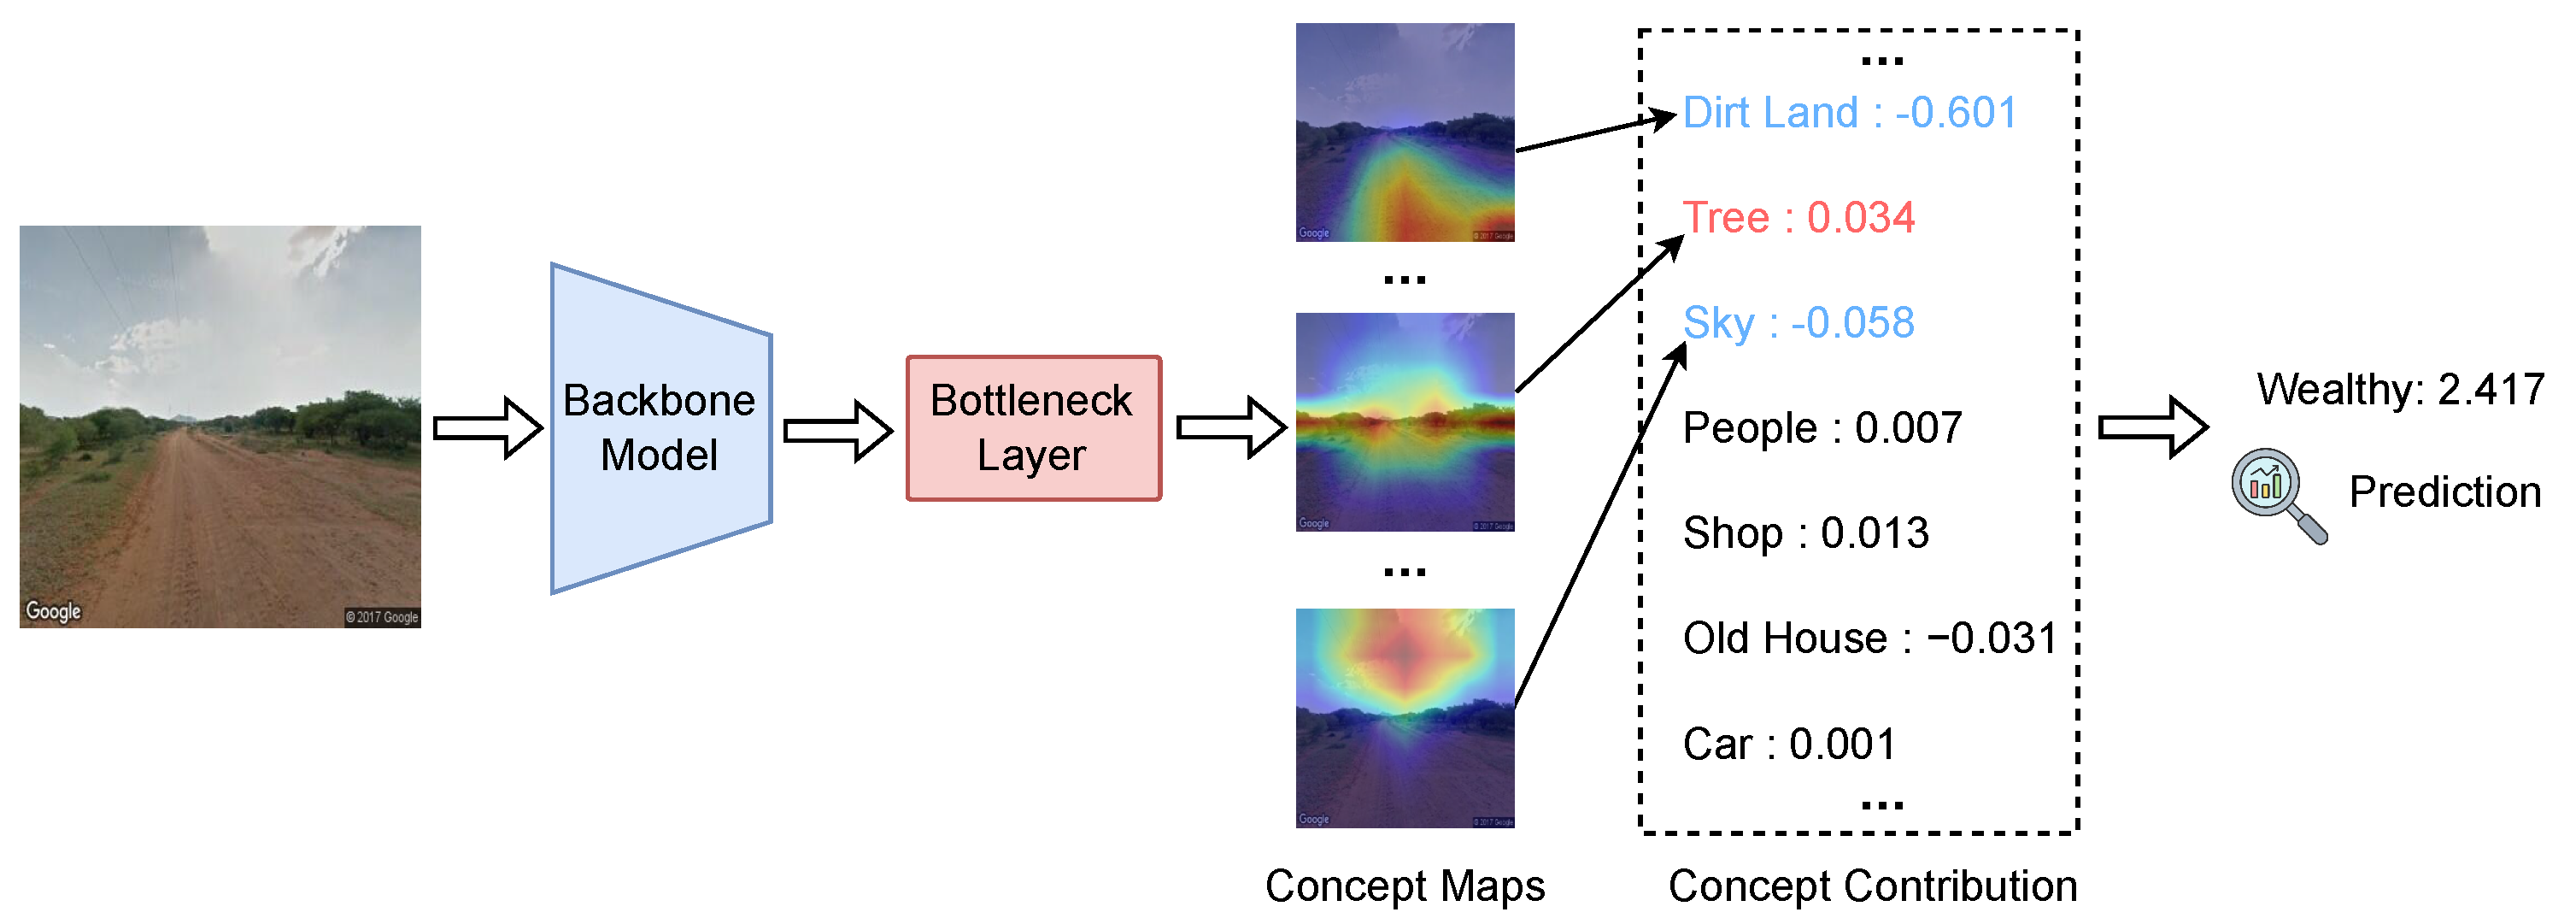
Similarly, the concept-based analysis for the “Wealthy” score prediction (
Figure 5) shows that “Dirt Land” makes the largest negative contribution (−0.601). “Tree” (0.034) and “Shop” (0.013) have minor positive effects, while “Sky” (−0.058) and “Old House” (−0.031) negatively impact the wealth prediction. “People” (0.007) and “Car” (0.001) contribute minimally. These aggregated concept contributions result in a final “Wealthy” score of 2.417.
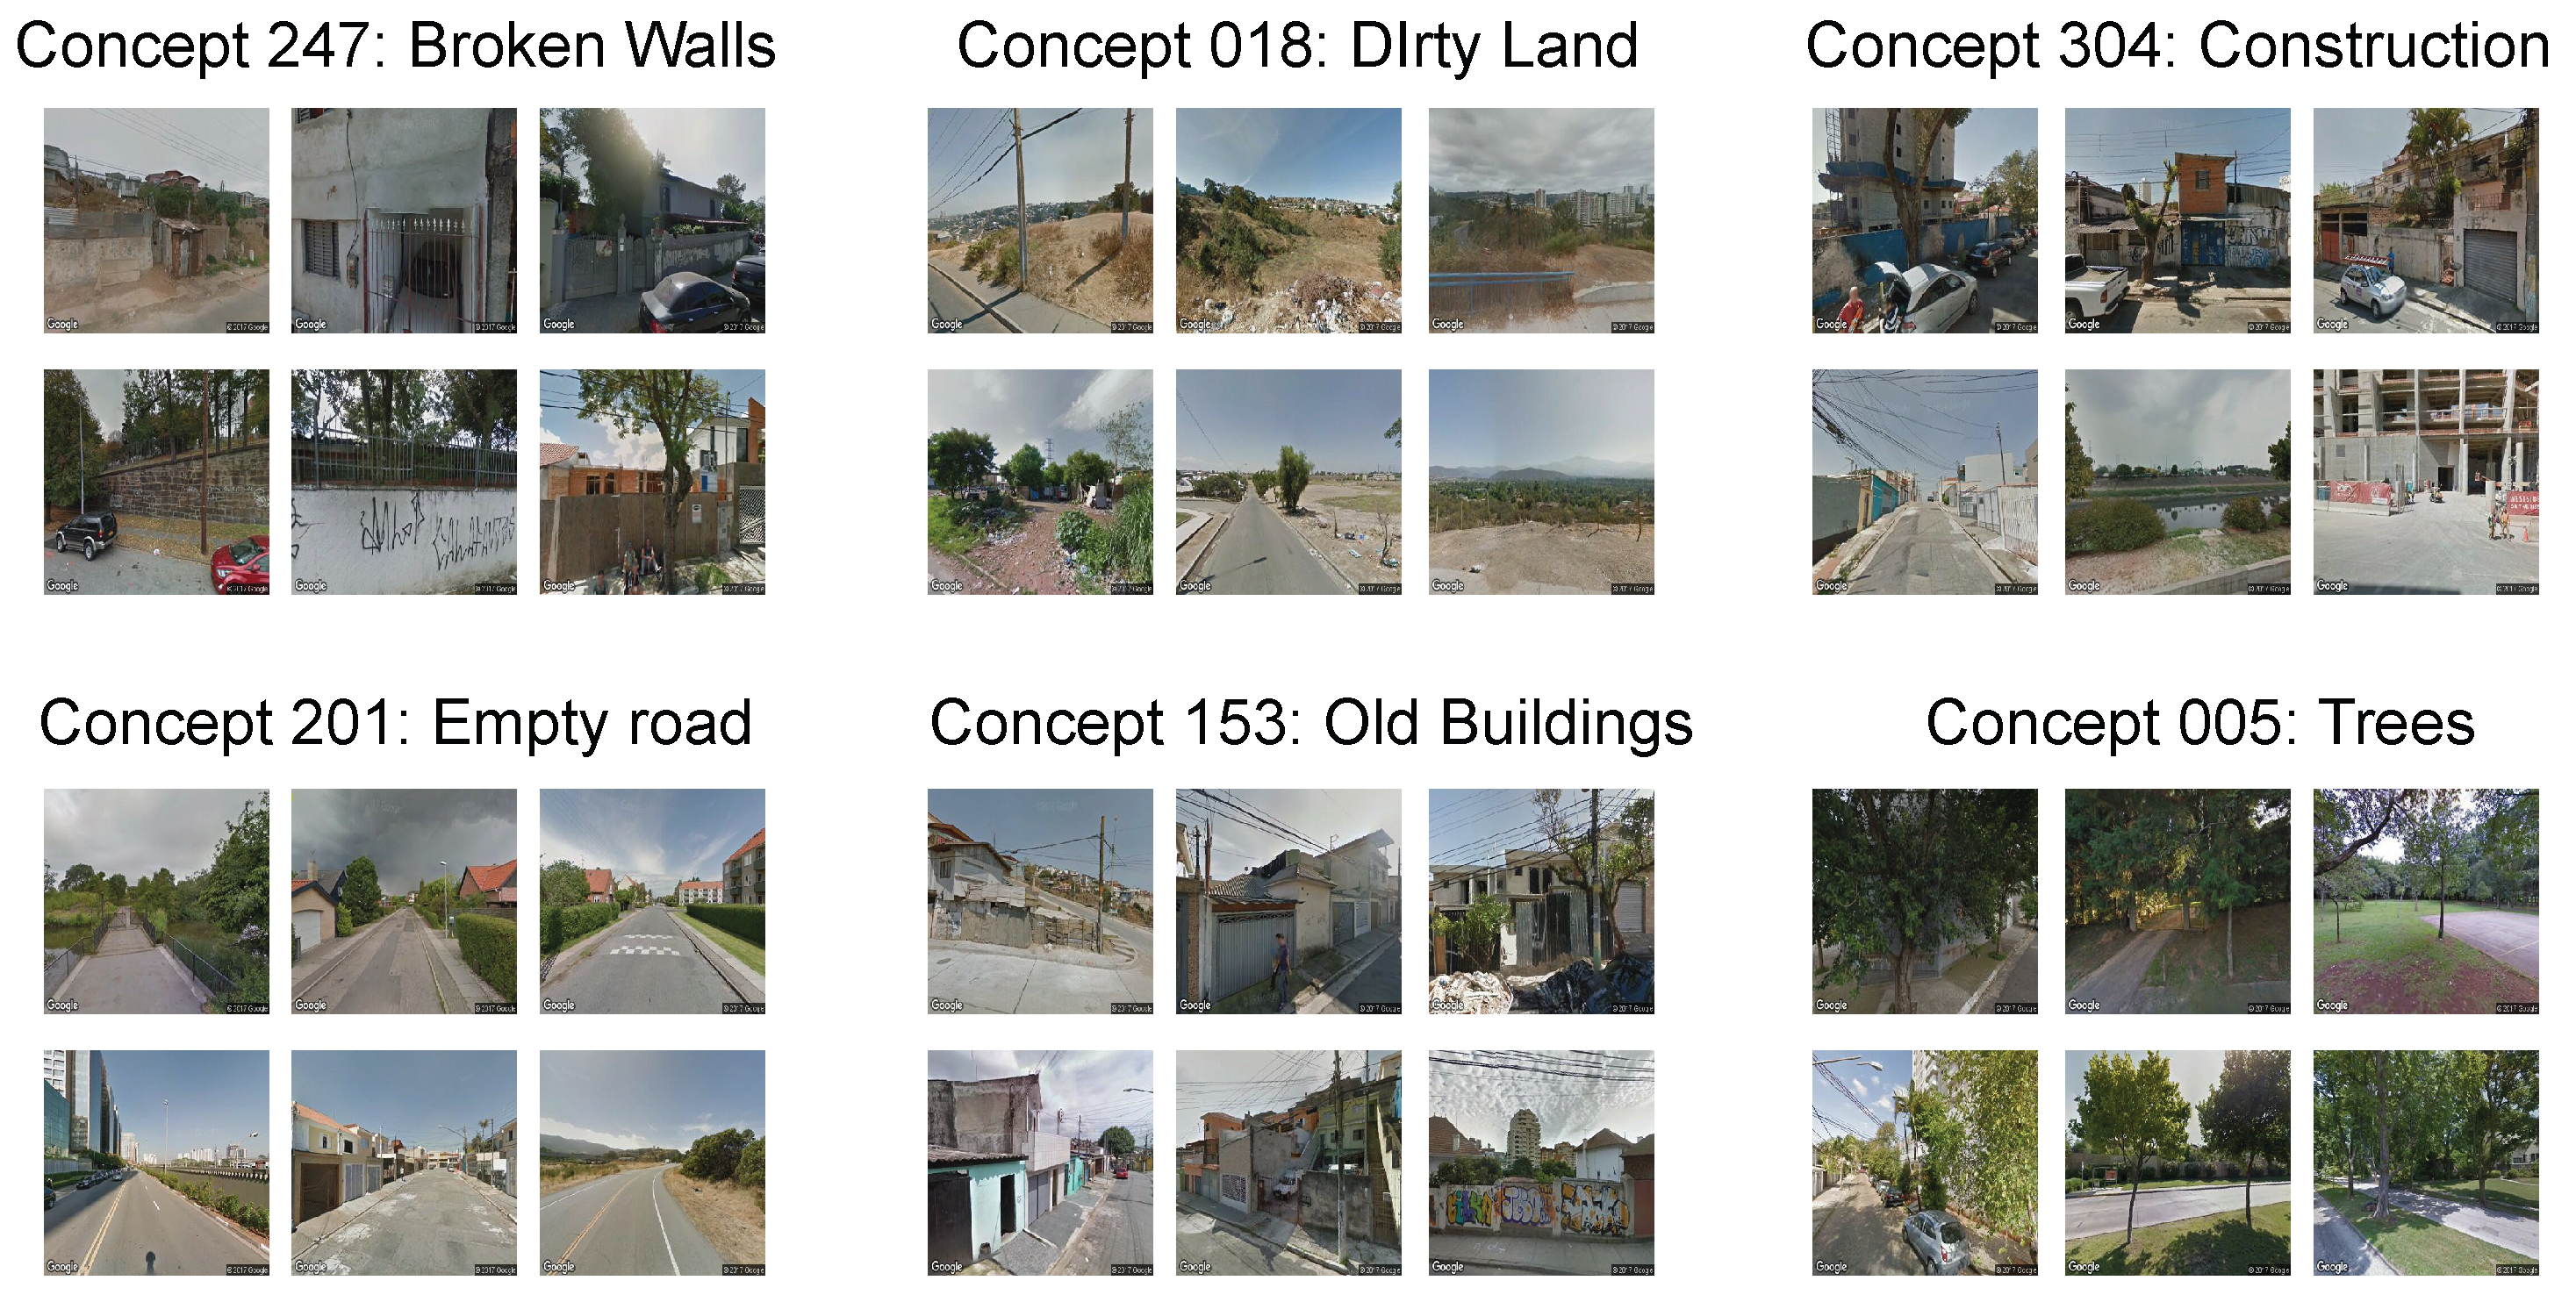
In addition, we conduct a qualitative assessment to confirm that each concept in the concept bottleneck layer is effectively linked to its designated semantic meaning (as illustrated in
Figure 6). After training a UP-CBM on Places365, we sample five concepts from the concept bottleneck layer. For each selected concept, we extract the top six validation images with the highest activations for the corresponding concept. For most concepts, the images with the highest activations generally align well with the intended concept semantics. However, in cases such as “Construction,” some images containing unrelated visual elements (e.g., “old buildings”) are also retrieved. This suggests that the semantic consistency for each concept is not flawless and still exhibits certain limitations.
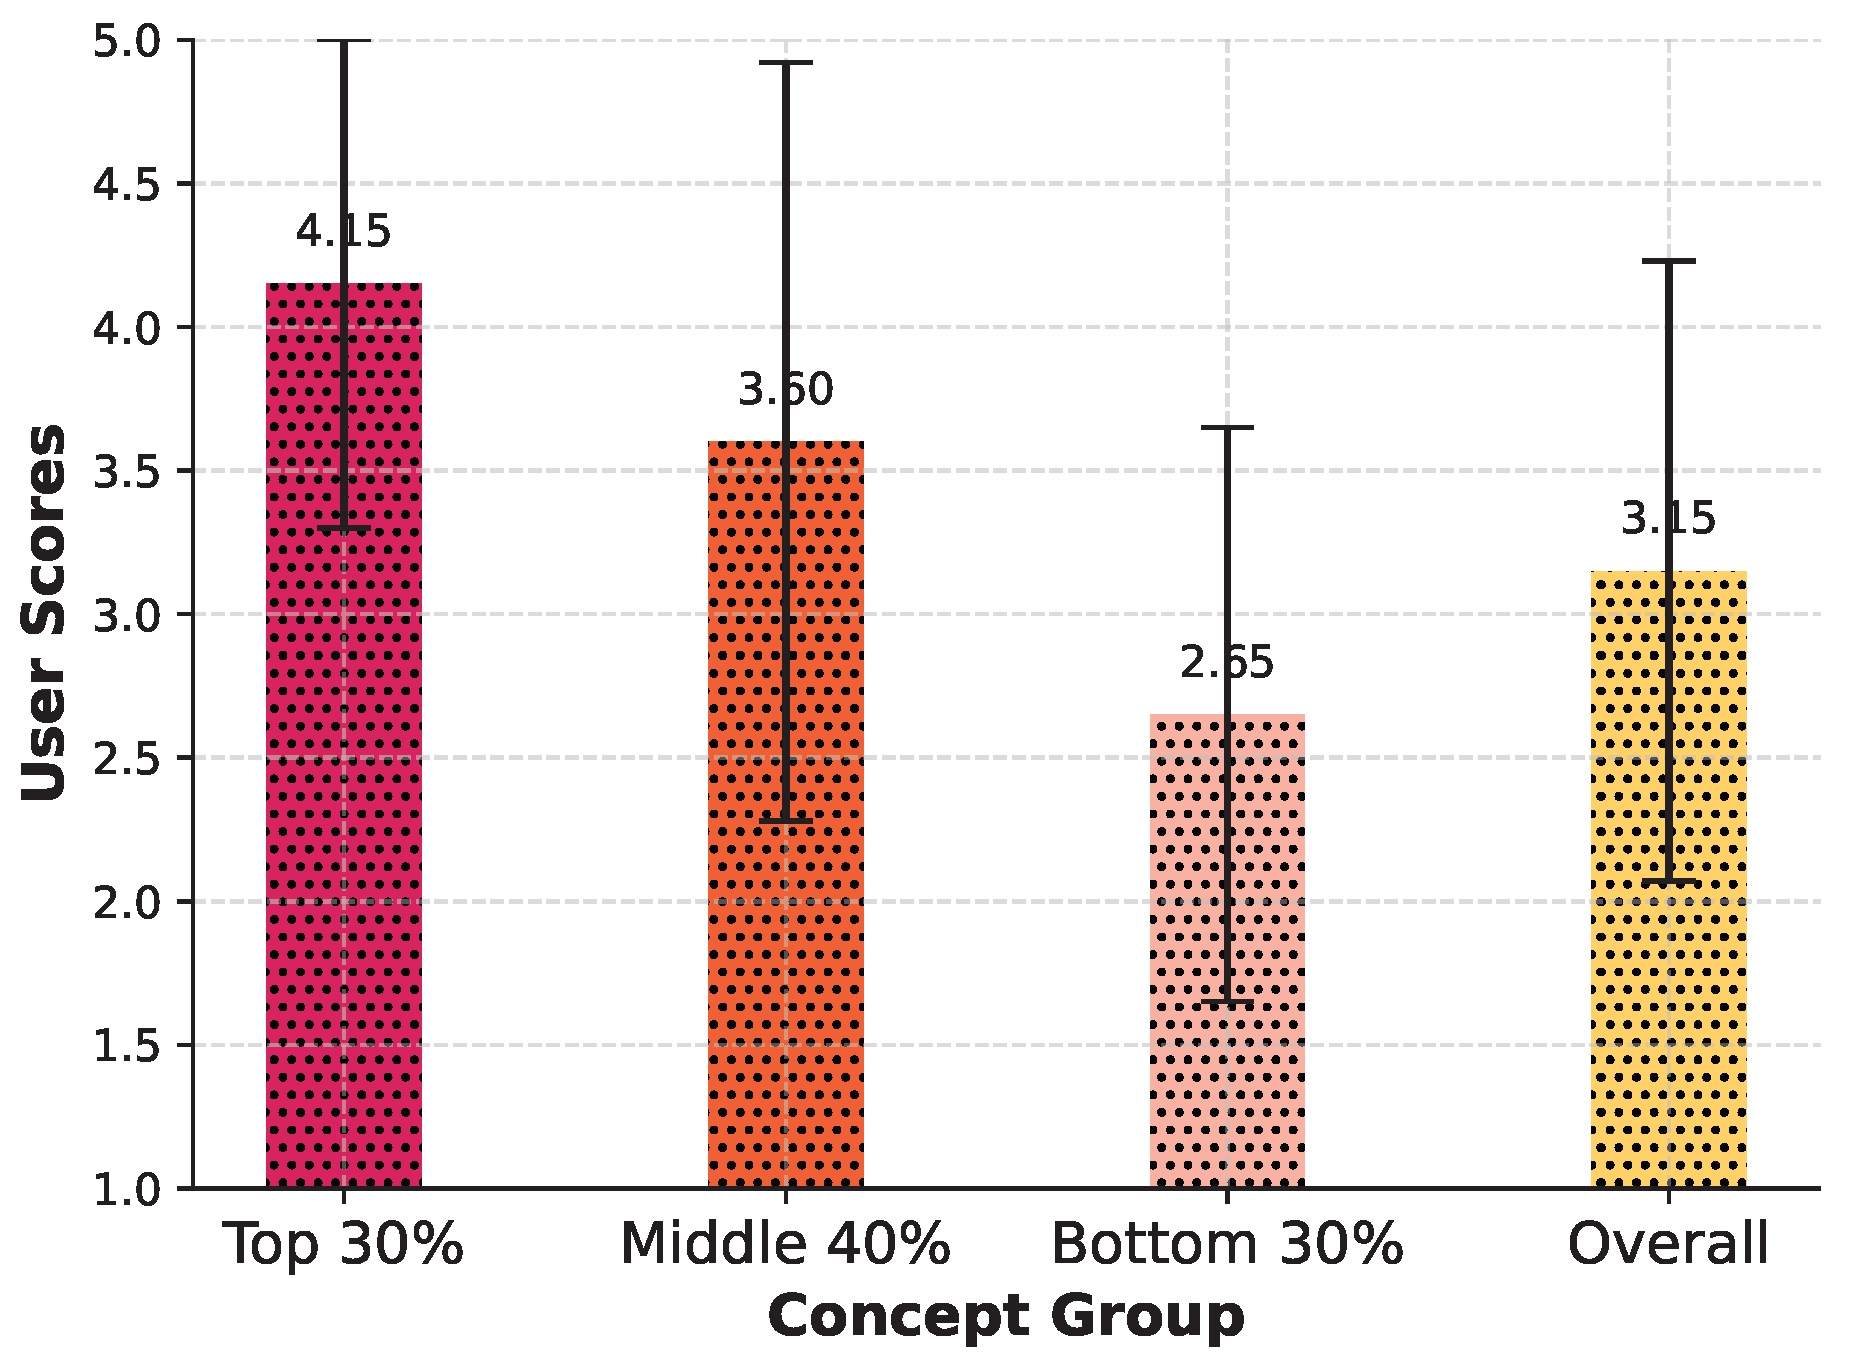
To further evaluate semantic consistency, we conducted a user study involving 20 participants. Each participant was shown all concepts in the format presented in
Figure 6 and asked to rate the semantic consistency of each concept on a scale from 1 to 5. The results are illustrated in
Figure 7. Based on the average scores, we categorized the concepts into three groups: the top 30%, middle 40%, and bottom 30%. Overall, the results indicate that the concepts learned by the UP-CBM are generally interpretable to human evaluators. This user study involved 20 participants from Nanchang University, comprising 16 undergraduate students and 4 master’s students. While the relatively small sample size provides valuable preliminary insights into concept semantic consistency, it may limit the generalizability of the findings. Future work will expand the participant pool and include individuals from more diverse backgrounds to enhance the robustness and applicability of the conclusions.
4.5. Ablation Analysis
In this section, we analyze the impact of different module and hyperparameter settings.
As shown in
Table 5, the results demonstrate the effectiveness of employing multi-scale visual prompts. When both 2 × 2 and 7 × 7 prompts are used together, the model achieves the best performance across both datasets, with an accuracy of 0.8567 and an
of 0.5191 on Place Pulse 2.0, and a classification accuracy of 0.8835 on VRVWPR. Using only the 2 × 2 prompts leads to a notable performance drop of approximately 7–8 percentage points, indicating that coarse-scale features alone are insufficient for optimal perception modeling. In contrast, using only the 7 × 7 prompts results in a much smaller decrease (around 1–2 points), suggesting that fine-grained visual information contributes more significantly to performance. These results highlight the importance of integrating multiple spatial resolutions to capture complementary information for perception tasks.
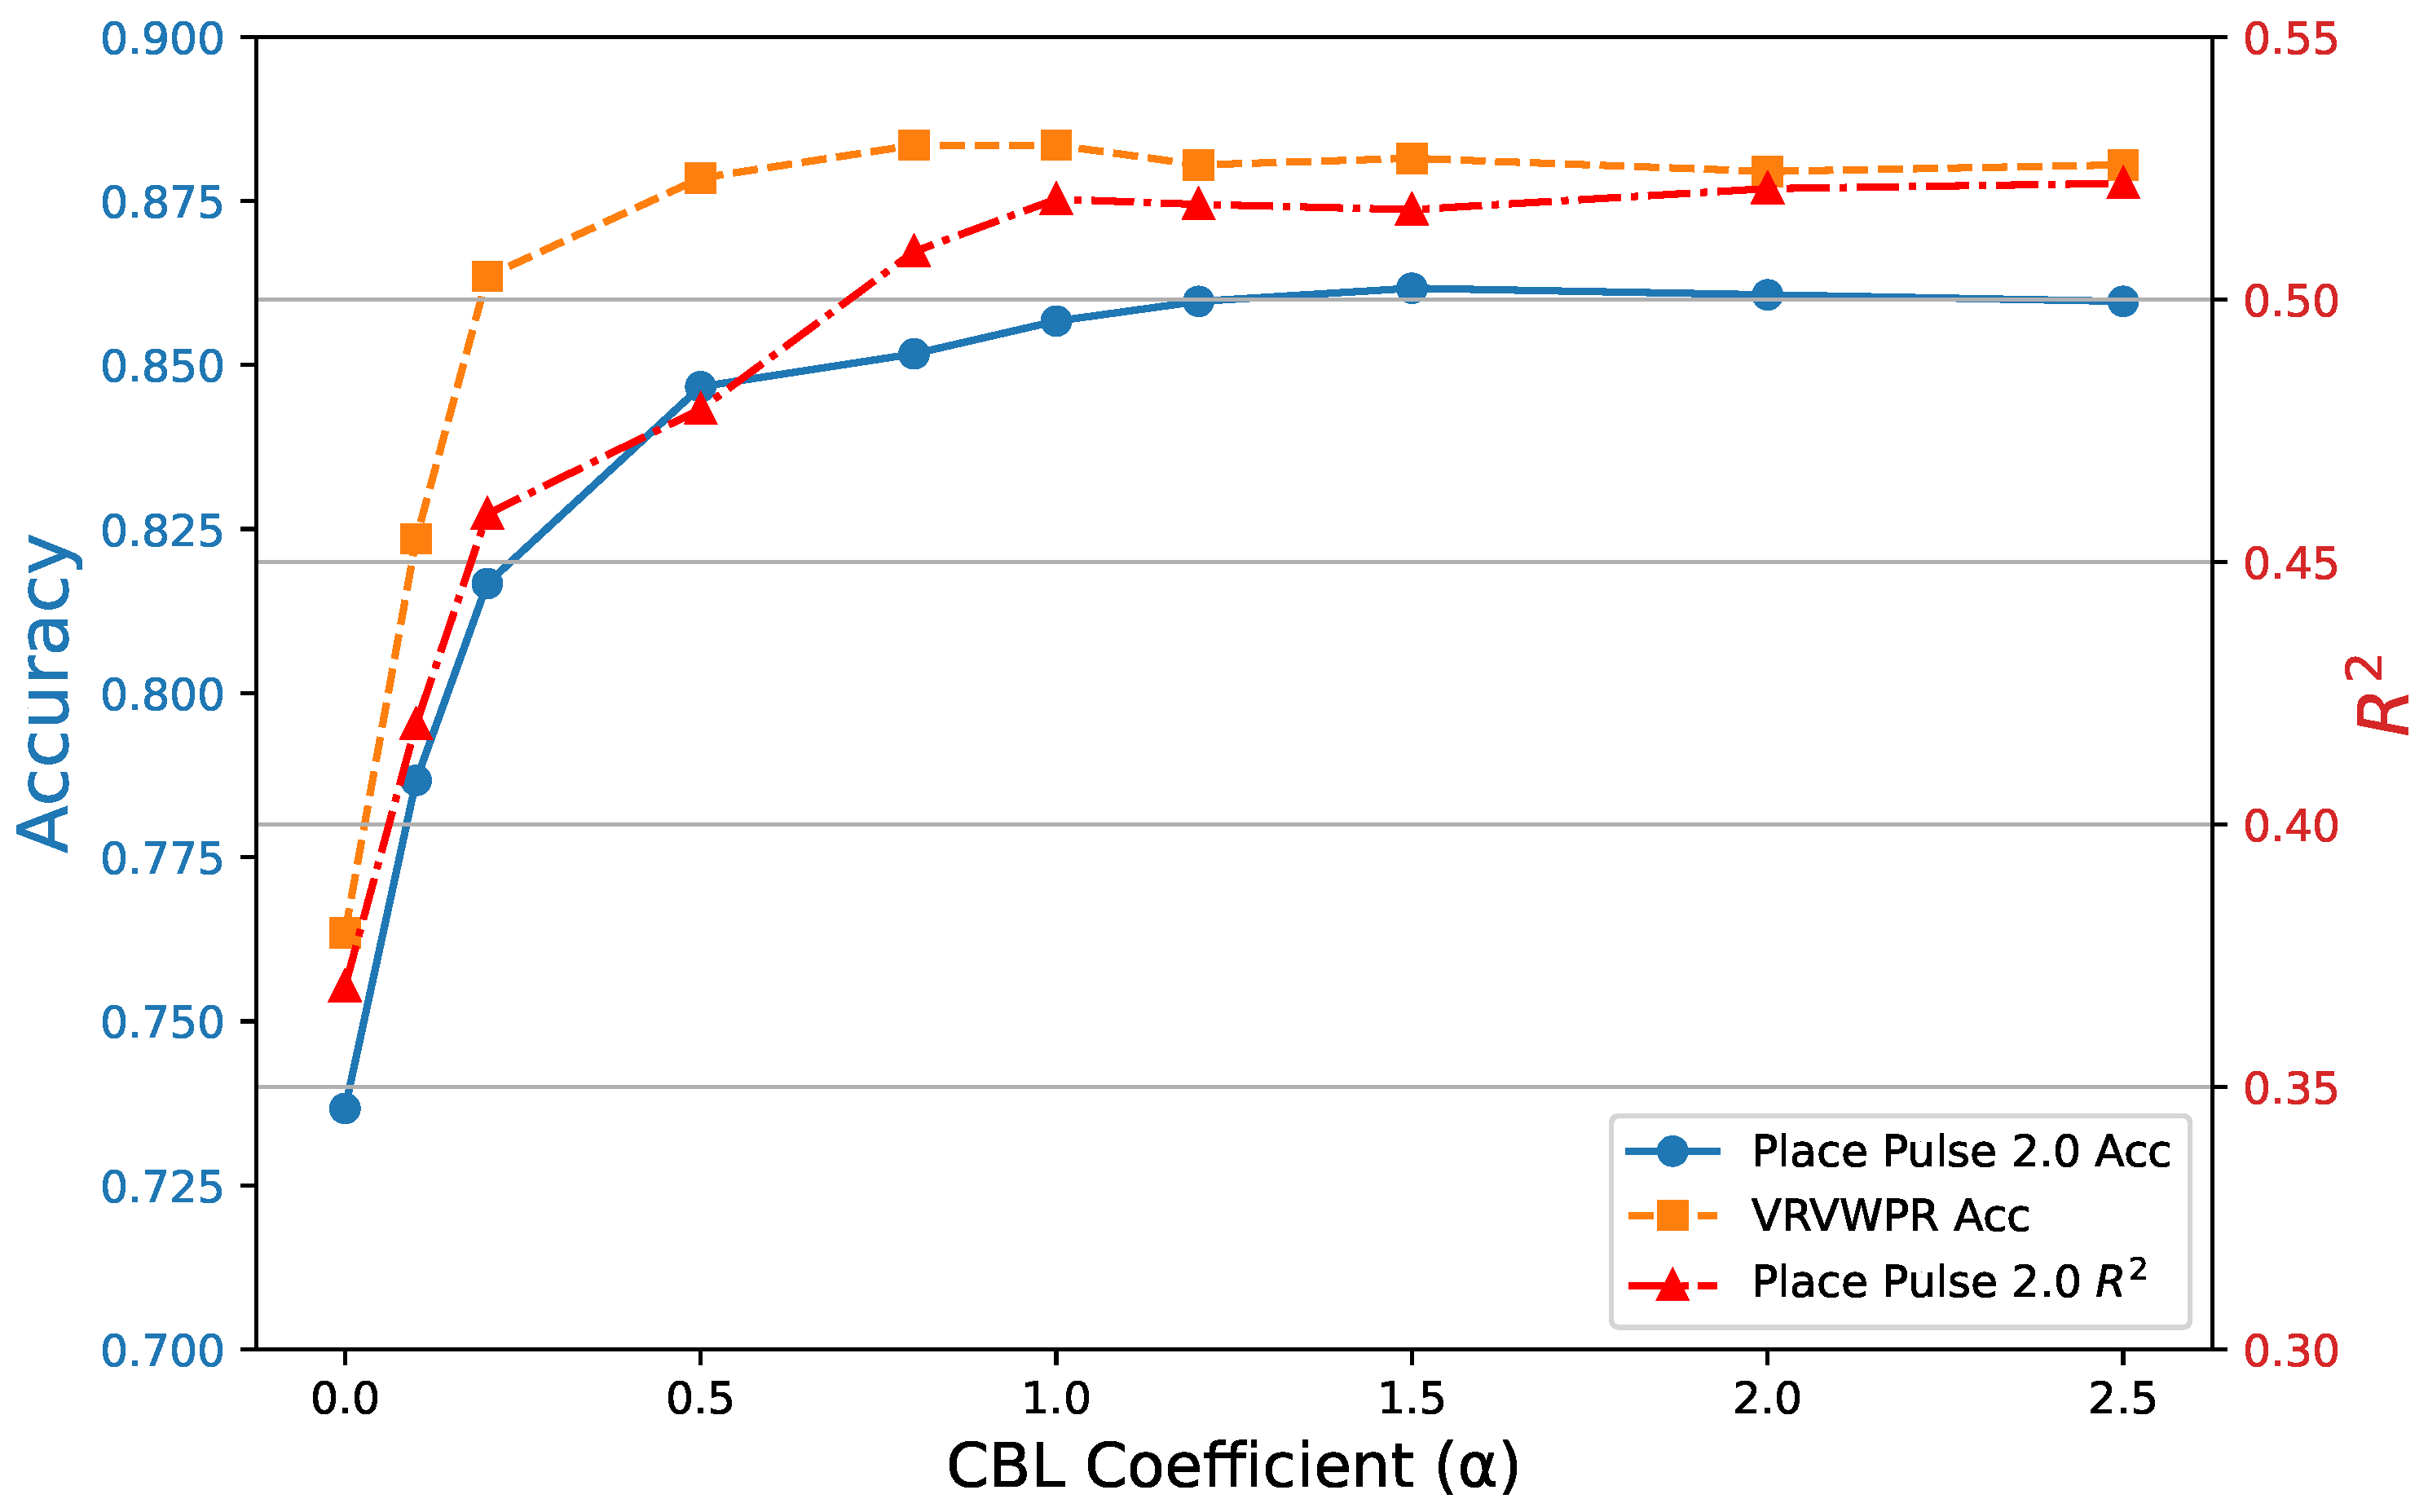
In
Figure 8, we analyze the impact of the CBL coefficient (
) on model performance across Place Pulse 2.0 and VRVWPR. When
, the absence of CBL leads to notable performance degradation: the accuracy of Place Pulse 2.0 drops to 0.7367 (
) and
falls to 0.3691 (
), while VRVWPR accuracy decreases to 0.7635 (
). As
increases to 0.1 and 0.2, the performance improves but remains below baseline, with Place Pulse 2.0 accuracy reaching 0.7867 and 0.8167, respectively. At
, the results become much closer to baseline levels, with Place Pulse 2.0 accuracy at 0.8467,
at 0.4791, and VRVWPR accuracy at 0.8785. Further increasing
to 0.8 and 1.0 leads to stabilization, where both accuracy and
nearly match or slightly exceed baseline values. Beyond
, although minor fluctuations occur (e.g., slight gains in accuracy and small decreases in
), no substantial improvement is observed. These results indicate that applying a moderate CBL coefficient (
between 0.5 and 1.0) effectively enhances model generalization, while larger
values yield diminishing returns.
We adopted a single convolutional CBL for two principal reasons. First, channel independence: the 1 × 1 convolution ensures that each concept channel attends exclusively to its corresponding semantic feature, avoiding any cross-channel interference. Second, effective alignment: despite its simplicity, this design—when paired with an MSE alignment loss—consistently guides each concept activation to match its CLIP-derived pseudo-label. In preliminary experiments, we also evaluated a two-layer CBL variant (
Table 6) but observed no significant gains in overall accuracy. However, slight performance difference happens between Place Pulse 2.0 and VRVWPR dataset (the former performs worse with the two-layer setting, whereas the latter benefits from it). This may be because, in classification tasks with discrete labels, the extra non-linear transformation enhances feature separability and captures subtle concept interactions, offering a small performance gain over the simpler design. As a result, we retained the single-layer configuration to maximize interpretability of the model’s reasoning process. Nevertheless, we acknowledge that incorporating more sophisticated multi-scale feature fusion within the CBL could further enhance the network’s capacity to discover and represent complex urban perception concepts. For instance, integrating deformable or dilated convolutions would allow the CBL to adaptively aggregate spatial information at varying receptive fields, capturing both fine-grained details and broader contextual cues. Future work will explore these architectures and quantify their impact on both predictive performance and explanatory fidelity.
