Article

Bridging Humanitarian Mapping and the Sustainable Development Goals

by
Quang Huy Nguyen
1,
Maria Antonia Brovelli
1,*,
Alberta Albertella
1,
Taichi Furuhashi
2 and
Michael Montani
3
1
Department of Civil and Environmental Engineering (DICA), Politecnico di Milano, 20133 Milan, Italy
2
School of Global Studies and Collaboration, Aoyama Gakuin University, Tokyo 150-8366, Japan
3
United Nations Global Service Centre, 72100 Brindisi, Italy
*
Author to whom correspondence should be addressed.
ISPRS Int. J. Geo-Inf. 2025, 14(8), 307; https://doi.org/10.3390/ijgi14080307
Submission received: 26 May 2025 / Revised: 18 July 2025 / Accepted: 2 August 2025 / Published: 8 August 2025

Abstract

The Sustainable Development Goals (SDGs) have become the global framework for evaluating the effectiveness of humanitarian projects. Humanitarian mapping is considered a popular voluntary geographic information technique that provides data for disaster response. Although humanitarian mapping has contributed significantly to the SDGs, there is a lack of in-depth studies on the state of this relationship. This paper aims to assess the potential relationship between the SDGs and humanitarian mapping by (1) analyzing SDG indicators to determine their potential contribution to humanitarian mapping, and (2) identifying the actual contribution of humanitarian mapping projects to the SDGs. To achieve this, the study uses a structured methodology that combines SDG indicator analysis with project-level data filtering and text mining. Three major humanitarian mapping platforms—HOT-TM, MapSwipe, and Ushahidi—are examined in order to capture their potential and actual contributions to the SDG framework. Ultimately, the study highlights the strong alignment between humanitarian mapping activities and the need to monitor the SDGs, particularly in water, urban infrastructure, and land use, emphasizing the potential of volunteer-driven geospatial data to address critical data gaps.

1. Introduction

1.1. From Agenda 2030 to SDGs

In 1987, the Brundtland Commission introduced the concept of sustainable development (SD), defining it as the “paths of human progress that meet the needs and aspirations of the present generation without compromising the ability of future generations to meet their needs” [1,2]. Since then, SD has become the main topic of numerous theoretical and practical studies [3,4]. The United Nations (UN), as a worldwide intergovernmental organization (IGO) with members from 193 sovereign states [5], plays its role by developing frameworks for the implementation of SD, particularly the Millennium Development Goals (MDGs), from 2000 to 2015, and the more recent Sustainable Development Goals (SDGs) [6].
In September 2015, the adoption of “Transforming our World: The 2030 Agenda for Sustainable Development” established a new universal development agenda that acts as the blueprint for the action of the majority of nations [6,7,8]. The framework has become the main tool for UN Member States to report on SD progress in their countries across 17 different key areas. According to Geng et al. (2018), in the 15 years from 2016 to 2030, each nation agreeing with the SDGs should keep up with the progress in implementing the goals and targets, at all levels [9]. The SDGs comprise 17 goals that have been agreed to be key achievements for global sustainability. To ensure the success of the goals, 169 targets and 247 indicators have been developed. On the one hand, the targets keep the global ambition of the goals, on the other hand, they need to adapt to local policy and needs in each country. They specify the method of realization, stabilizing political opinions, and provide data for the common achievements. This system has been emphasized as comprehensible and valuable [6].
Data availability (DA), a system for assessing data contribution for the SDGs, is reviewed annually and decided by the Inter-agency and Expert Group on SDG Indicators (IAEG-SDG). The chosen DA system in this paper is from 10 April 2025 [10]. In this system, each indicator is categorized in two tiers corresponding to the quality of data entry.
  • Tier I: Indicator is conceptually clear, has an internationally established methodology and standards are available, and data are regularly produced by countries for at least 50 per cent of countries and of the population in every region where the indicator is relevant.
  • Tier II: Indicator is conceptually clear, has an internationally established methodology, and standards are available, but data are not regularly produced by countries. [10].
The data monitoring gap for each SDG indicator can be identified by checking its tier. For example, an indicator ranked in tier II tends to lack data, a framework, and a standard for data acquisition and integration compared to an indicator in tier I and vice versa. In some minor cases, indicators can have multiple tiers of DA depending on the mixture of indices [10].

1.2. Geospatial Information for the Quality of Each Indicator

For SDG monitoring, geospatial location is one of the important keys for measuring indices and disaggregation. This has been proven to be the central motivation of indicator monitoring systems, answering the where questions [6,11,12,13]. State-of-the-art technology, such as open geographic data, mobile devices, web mapping, and crowd-sourcing platforms, are crucial for the process of collecting geolocation data [12,14]. To manage this aspect, the Working Group on Geospatial Information by IAEG-SDGs (IAEG-SDGs-WG-GI) was formed. In August 2017, they met and proposed a list of 24 indicators in the SDGs that benefit from geospatial information (GI) technology. In this list, there are 15 indicators that can be contributed directly by GI and 9 indicators that can be well supported. The Group on Earth Observations (GEO) has also proposed an additional 29 indicators for the list of indicators that can benefit from GI [11,13,15] (Table A1, Appendix A).
The 64th UN Conference of European Statisticians (Paris, 27–29 April 2016) highlighted the importance of geospatial data and analysis in the SDG monitoring framework, recommending three levels of contribution:
  • Contributing directly to the proposed framework, not only in terms of sources of information to increase data availability and spatial disaggregation but also in terms of methods and analysis to produce indicators resulting from the integration of geospatial and statistical information;
  • Promoting common accepted standards and frameworks to guarantee comparability;
  • Encouraging innovation and modernization [15].
This study focuses on the first method of contribution; therefore, the direct improvement of data availability is considered.

1.3. From Citizen Science to Humanitarian Mapping

Citizen science (CS) has an important role in contributing to the SDGs [16,17,18,19]. CS is defined by the Oxford English Dictionary as “scientific work undertaken by members of the general public, often in collaboration with or under the direction of professional scientists and scientific institutions” [20]. In a systematic review of definitions, CS can be briefly understood as cross-disciplinary, “community-based” activities of “data monitoring and collection”, toward participatory, inclusive, and deep engagements [21]. Therefore, crowd-sourced data is the main object of CS. A branch of CS dealing with geospatial information, especially for disaster risk response (DRR), is volunteered geographic information (VGI) [22,23]. VGI (volunteered geographic information) refers to geospatial data obtained by citizens from different backgrounds who contribute to appropriate web platforms, thanks to the development of Web 2.0 and the Global Navigation Satellite System (GNSS) [22,24,25,26]. Based on content generation, VGI is classified as either active/conscious or passive/unconscious [26]. The term ’crowd-sourced geographic information’ (CGI) was later introduced as an alternative to VGI to encompass the two content generation methods [27]. It has also been noted that in numerous cases the UN has replaced its traditional mapping method with VGI/CGI, as it allows for saving costs on expensive closed-source map production and increasing data maintainability [28].
Humanitarian mapping (HM) is a separate field focused on providing maps and geospatial data for humanitarian purposes [29]. Mapping is central to humanitarian efforts, because in most cases, these activities face the problem of geospatial information inequality [30]. The earliest records of HM can be traced back to the 19th century, almost at the same time as the beginning of humanitarianism. Over time, it is observable that HM has changed from analog to digital mapping, from fine detail to large-data acquisition, from individual work to networked collaboration [29].
In the last fifteen years, these two fields have merged, sharing multiple characteristics. In 2010, the catastrophic earthquake that occurred in Port-au-Prince, Haiti, has marked a significant evolution of HM through the use of VGI/CGI platforms such as OpenStreetMap (OSM) and Ushahidi [16,31,32,33]. The historical process of HM in the OSM community has been described by Herfor et al.; they indicated that HM “refers to collaborative mapping in OSM […] for both humanitarian relief responses and humanitarian purposes in general” and “remote mapping or digitization and consists of the generation of geographic data based on satellite imagery” [16]. Others consider HM as a branch of CS and VGI that efficiently provides data for DRR and the SDGs [14,31,34,35]. In the extent of this paper, the scope of HM is narrowed to digital HM contributed by VGI/CGI.

1.4. Humanitarian Mapping as One of the Pillars in the SDG Data Framework

Other sources of data include crowd-sourced data, which is one of the four main pillars of reliable data contribution in the National Spatial Data Infrastructure system for the SDGs, in addition to Earth Observations and Monitoring; National Spatial Data Infrastructure; and National Statistical Systems, Accounts, Administrative, Registers, Demographics [7,36] (Figure 1). As mentioned in Section 1.3, crowd-sourced data can be found throughout the HM process. In particular, OpenStreetMap (OSM), the global HM data source and community, has played a significant role in covering the gaps in missing and outdated data for the SDGs in certain countries [37,38]. It is also stated that, in certain cases, DRR community-based innovation is strongly encouraged [38,39]. HM applications for the SDGs are already well promoted in universities [35,40,41,42]. Meeting the requirement for three levels of contribution to the SDGs (direct contribution, promotion, and innovation engagement) mentioned in Section 1.2, HM is identified as a robust, global, and highly available source of data acquisition for the monitoring of the SDGs.
Generally, there are three types of HM activities, categorized by the use and generation of data.
  • Classification: The process of assigning predefined attributes (values/categories) to existing geographical information.
  • Digitization: The process of creating new digital geographic objects based on existing geographic information.
  • Conflation: The process of integrating existing geographic information representing the same real-world object into a consistent digital representation [43].
Although there are multiple potential applications of HM as an effective source for bridging SDG data gaps, there have been few recent studies reviewing the state of the art in the role of HM in SDG contributions. This paper explores two main questions: Which indicators can potentially benefit from HM activities? What is the current condition of HM activities’ contributions to the SDGs?
This paper examines the potential contribution of three platforms—HOT-TM (digitization), MapSwipe (classification), and Ushahidi (conflation)—to the SDG monitoring framework. A detailed comparison has been carried out and is presented in Table 1.
  • HOT-TM is a platform develop by the Humanitarian OpenStreetMap Team (HOT) for OSM digitization, dedicated mostly to HM purposes [44]. HOT-TM splits the mapping area into a grid of smaller squared areas, called tasks. Each mapper is assigned a task and collaborates with the other members of the team without worrying about conflicts.
  • MapSwipe is a web and mobile application in which a user classifies a certain area by looking at satellite images [45]. Similarly to HOT-TM, MapSwipe assigns tasks to the mapper, represented as 3 × 3 squares, in both the cases of mobile and web browsers. Users are instructed to examine the basemap and report the presence of mapping objects by tapping each square on the screen.
  • Ushahidi, founded in 2008, is a powerful toolbox for gathering monitoring data at a fast pace in the web environment [46]. The organizers create deployments on specific themes, then users can contribute by reporting emails, text, and multimedia through posts. Unlike HOT-TM and MapSwipe, each deployment is open-ended, organizers can expand the project without creating its replica, and there is no need to eliminate duplication theoretically.

2. Materials and Methods

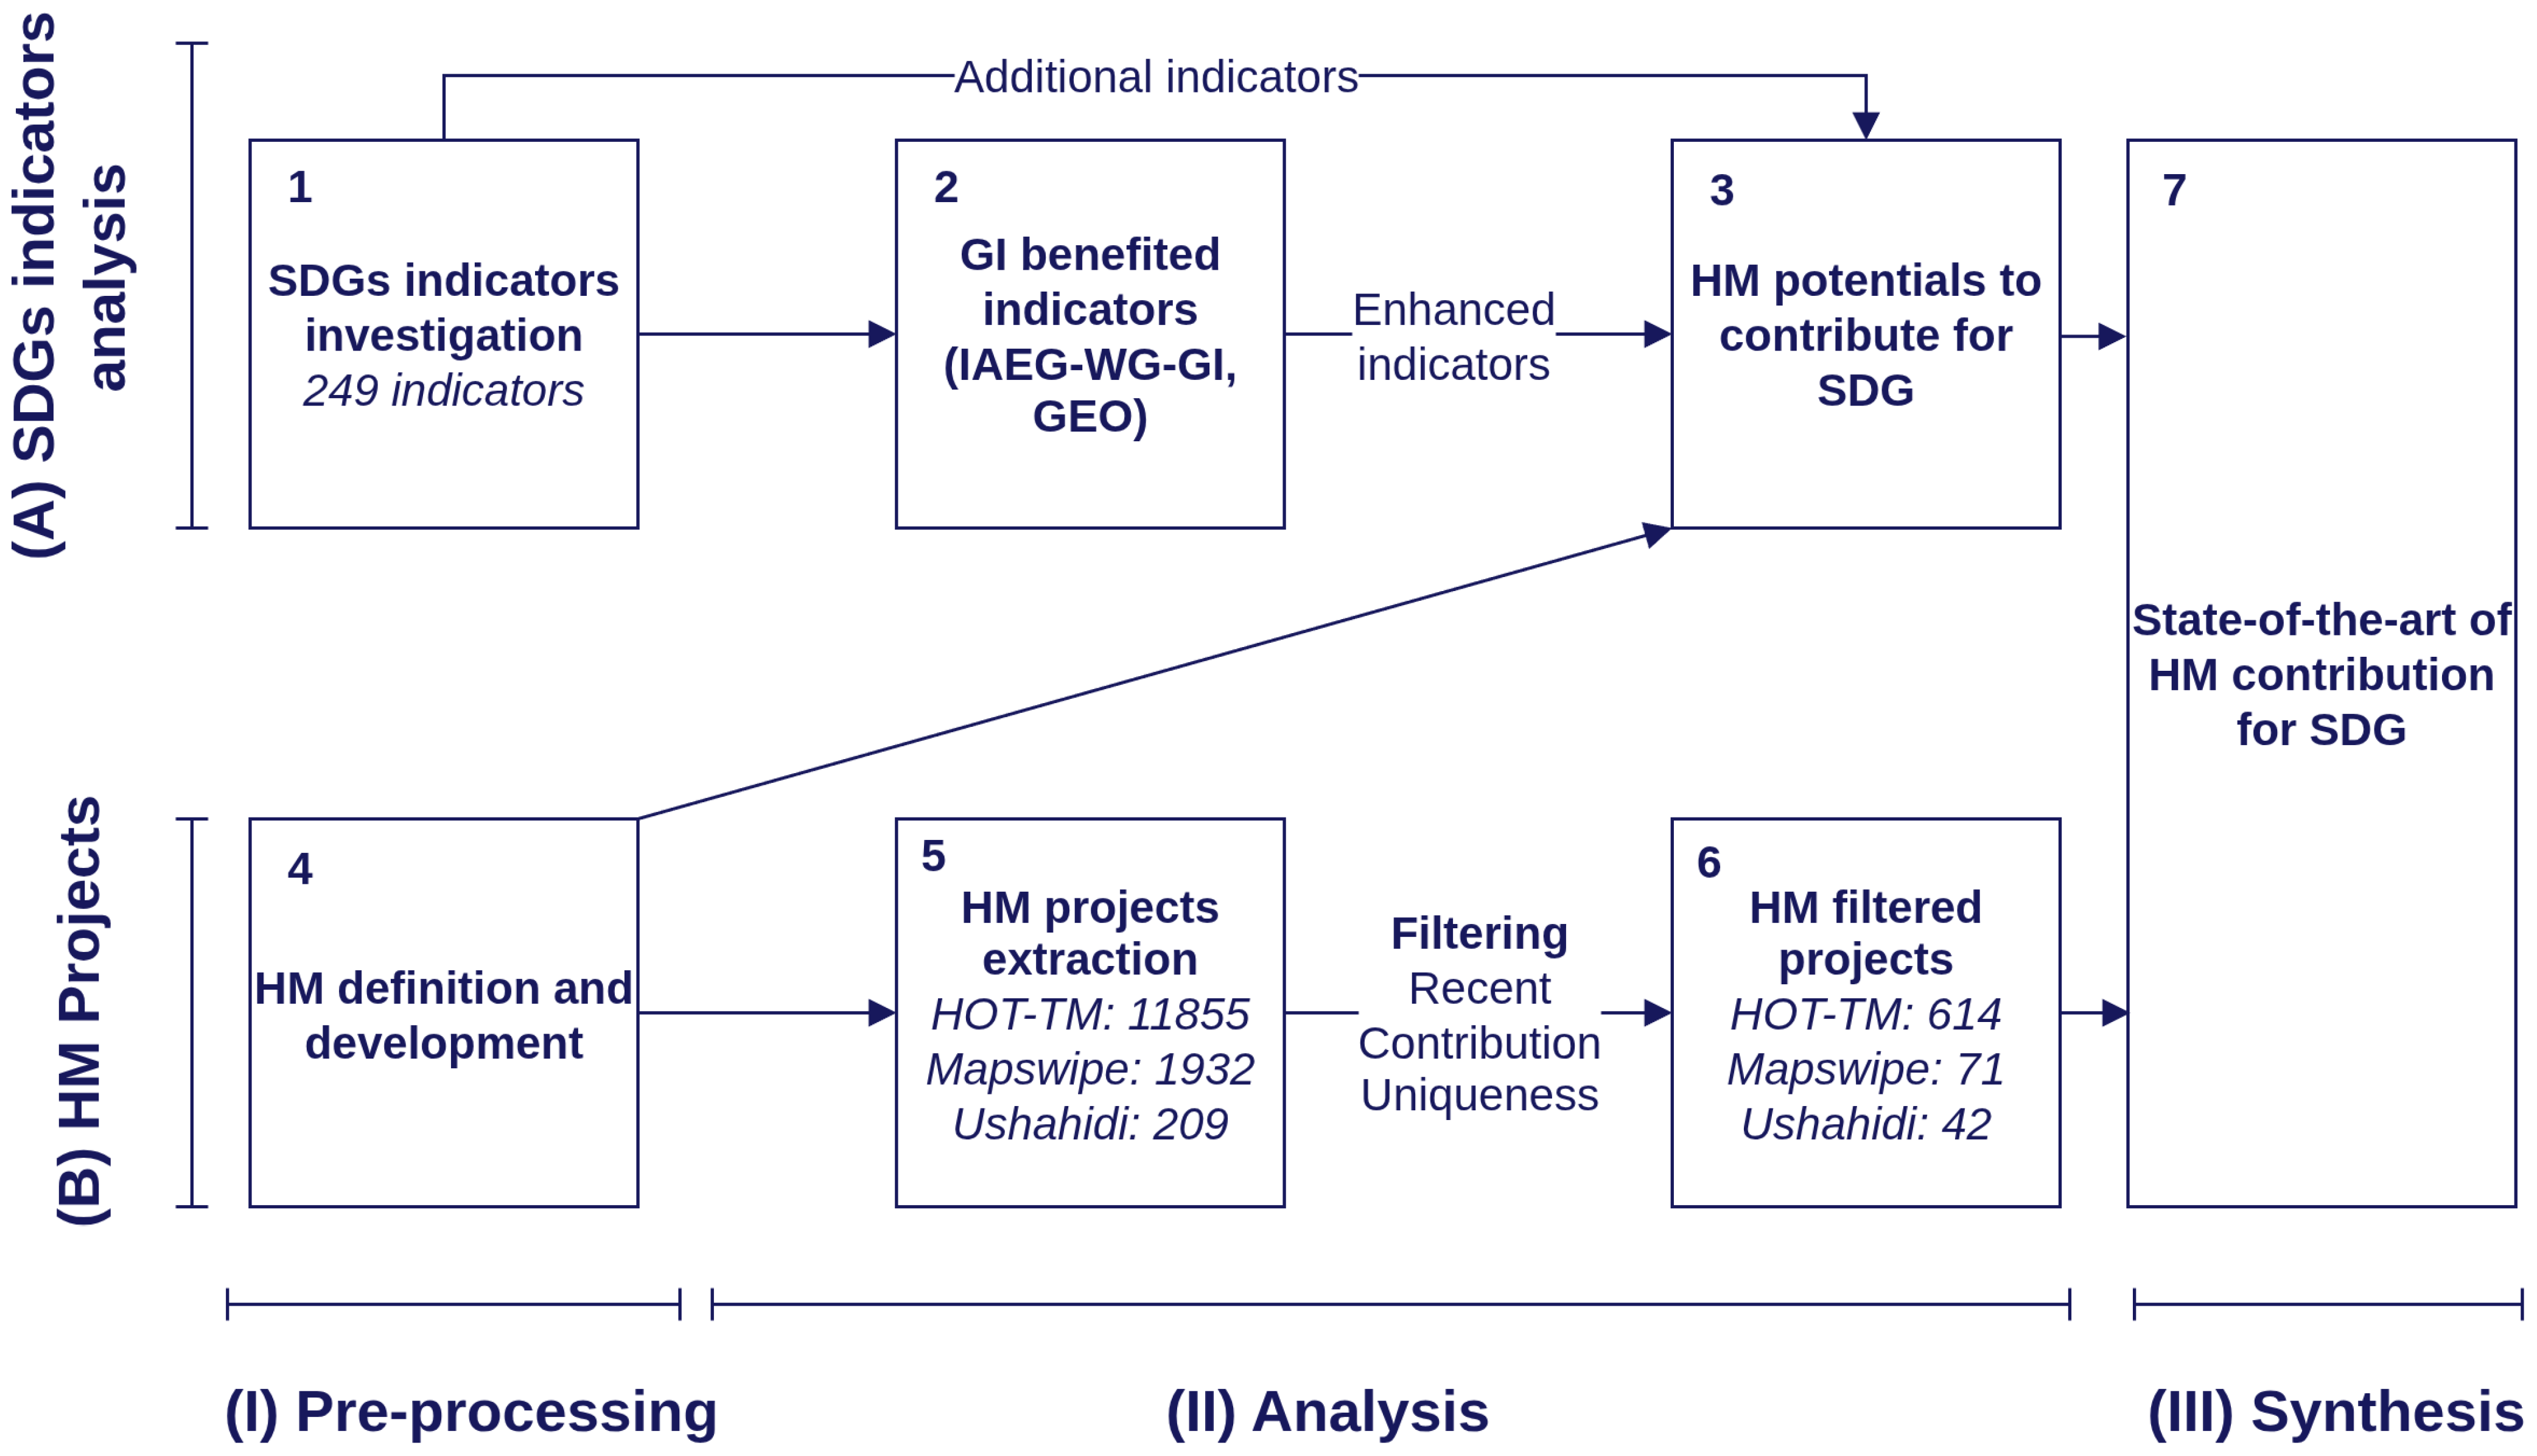
Two aspects are analyzed in this paper: (i) the potential contribution of HM to the structure of the SDG indicators, and (ii) the actual contribution of HM projects. As shown in Figure 2, in this study, we consider 2 main aspects: (A) SDG indicator analysis, and (B) HM project analysis. The process has 3 steps: (i) pre-processing, (ii) analysis, and (iii) synthesis. These develop into 7 components: (1) SDG indicator investigation, (2) GI-benefited indicators, (3) HM’s potential to contribute to SDGs, (4) HM definition and development, (5) HM project extraction, (6) HM-filtered projects, (7) state of the art of HM’s contribution to SDGs.
The first aspect of this study investigates the potential of HM to contribute to the SDGs (components 1–4). With the insights into HM mentioned in the previous sections, 247 indicators have been individually reviewed by thoroughly checking the metadata and comparing with the historical dataset of geospatial information-supported indicators listed by IAEG-SDGs and GEO. The selected indicators must be able to obtain and aggregate HM data registered in their metadata. Two criteria are used to categorize them: the potential contribution of HM and the potential mapping technique type. For the first categorization, the indicators are separated into three groups:
  • Introduced indicators (HM-I) are indicators that were not included in the IAEG-SDG-WG-GI and GEO lists, but are included in this study.
  • Enhanced indicators (HM-E) are indicators that are mentioned in the IAEG-SDG-WG-GI and GEO lists, and have the potential to be improved by HM.
  • Non-affected indicators are unrelated indicators.
Then, the indicators are labeled with three types of mapping techniques, as defined in Section 1.4. Each indicator can be tagged by one or more mapping techniques. At the end of this step, we propose a list of indicators to which HM activities have the potential to contribute.
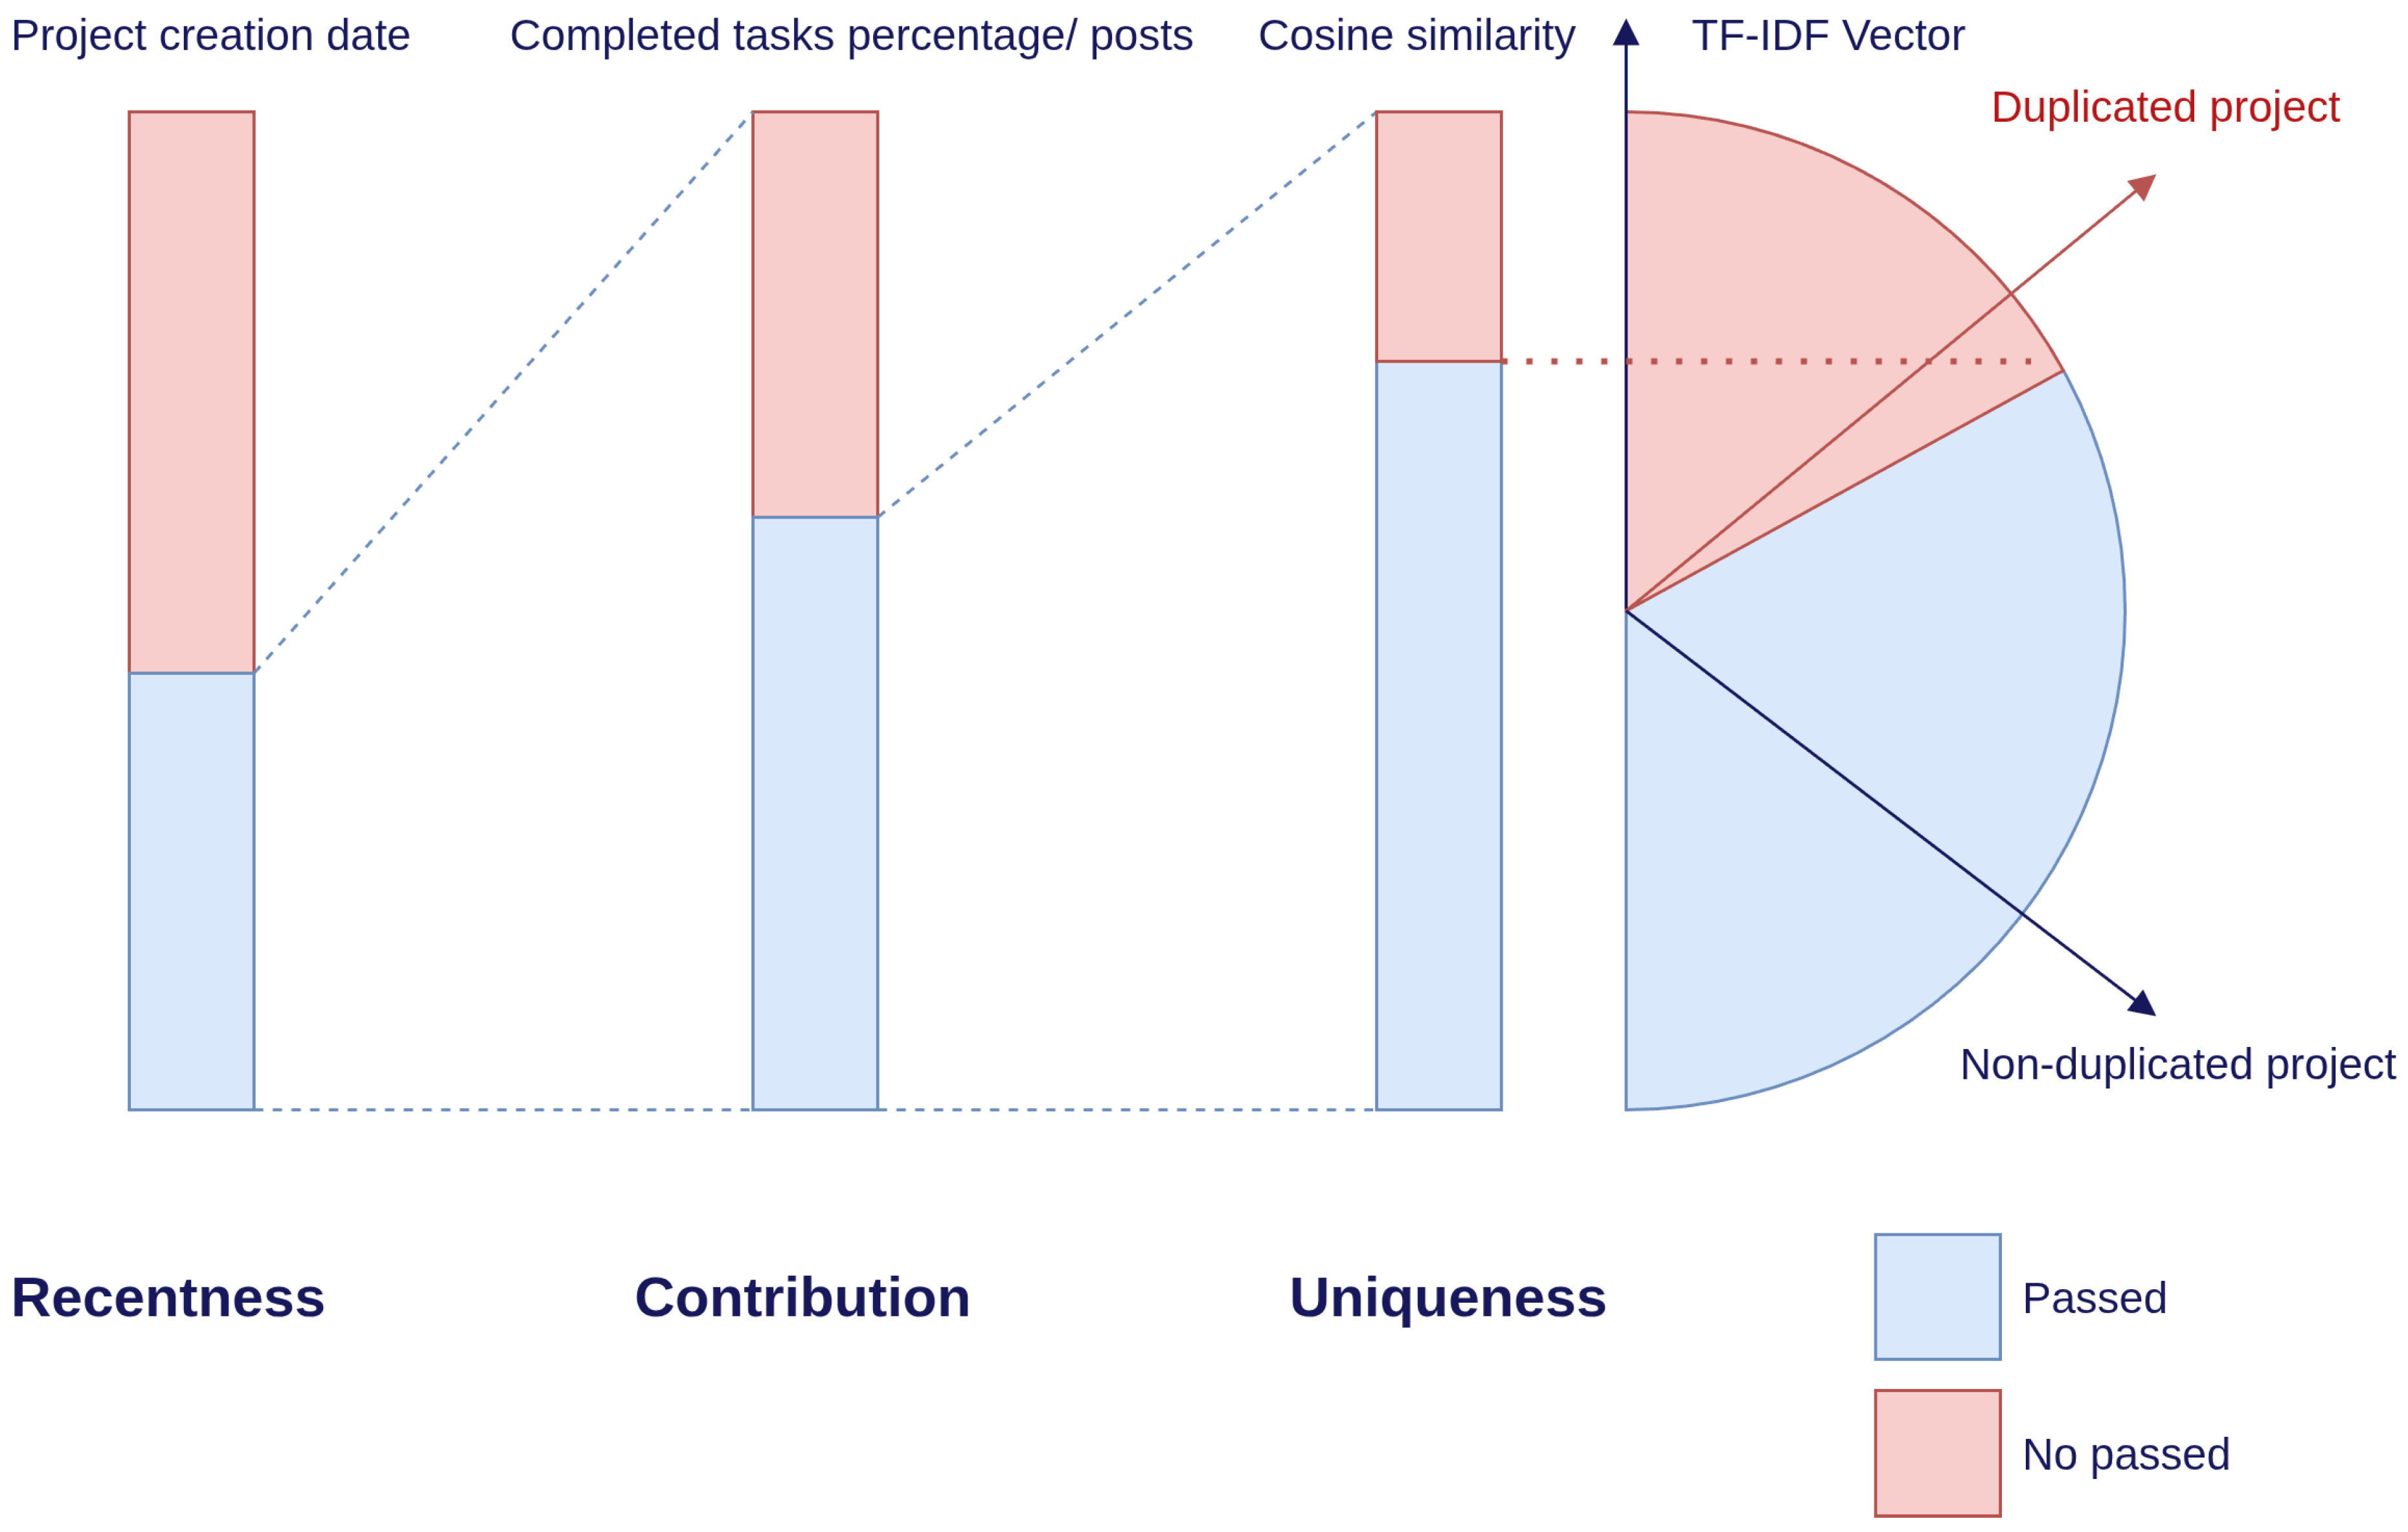
The second aspect analyzes HM projects with regard to their actual contribution to the SDGs (components 5–6). As shown in Figure 3, HM projects were extracted from the sources then filtered using three criteria: recentness, contribution, and uniqueness. Firstly, the projects were sorted according to when they started, with 50% of the most recent ones being considered. The second step of the filtering process evaluated the contribution. The projects were sorted according to the percentage of completed tasks for HOT-TM and MapSwipe, while those in Ushahidi were sorted according to the number of posts. Fifty percent of the most valuable projects were kept. Finally, TF-IDF (term frequency–inverse document frequency) and cosine similarity were used to detect project replication [47,48].
TF-IDF is a technique that measures the importance of each term in a document d relative to the set of all documents, called the corpus, D.
T F - I D F ( t , d ) = f t , d · l o g ( N 1 + d t )
where f t , d is the relative frequency of term t in the document d, N is the number of all documents in corpus D, and d t is all documents containing term t in corpus D.
In this study, the document is the concatenation of the projects’ selected features and the corpus is all the projects in one HM platform. Based on empirical insights, the selected features from HOT-TM projects are name, organization, author, and country; from MapSwipe projects are name, project_details, look_for and organization_name; and from Ushahidi are title, country, category, and excerpt. The TF-IDF vectorizer then represents each document as a multidimensional vector.
d = T F - I D F ( t 0 ) T F - I D F ( t 1 ) . . . T F - I D F ( t n ) where t 0 , t 1 , . . . t n are the different terms in document d
The cosine similarity measures the cosine of the angle between any two documents in the corpus. This results in numbers ranging from −1 to 1, which show the level of similarity, from low to totally identical. Project pairs with a cosine similarity score higher than 0.5 are marked as duplicates and one member is removed.
At the end of the screening process, 614 HOT-TM projects, 71 MapSwipe projects, and 42 Ushahidi projects were considered for the analysis.
The current state of HM and its relation to the SDGs was studied by comparing it to the list of indicators with potential contributions in order to form the dataset of actual contributions by HM to the SDGs. Then, we manually compared the scope of each selected project with the requirement of each indicator pointed out in the metadata. Based on the descriptions, all projects that were vague, irrelevant, general, or training-oriented were excluded. Subsequently, these statistical data were then used to visualize the coverage of HM projects in the SDG indicators (component 7).
For the final analysis, three new indicators are used: (1) introduced indicators refers to the number of indicators that were not included in GEO and IAEG-SDG-WG-GI’s lists but introduced in this study; (2) exclusive indicators refers to the number of indicators that are contributed to by only one HM platform; (3) low-data-availability indicators are indicators that are classified into tier II and tier I/II.
Finally, trends, gaps, limitations, and the future scope of the study are shown based on the findings.

3. Results

This section presents the main findings of the study, focusing on the potential and actual contributions of humanitarian mapping (HM) to the Sustainable Development Goals (SDGs). The analysis is structured into three parts: the assessment of SDG indicators influenced by HM (Section 3.1); the distribution of data sources across HM projects (Section 3.2); and the evaluation of the actual contributions of HM to specific SDG indicators (Section 3.3).

3.1. SDG Indicator Analysis

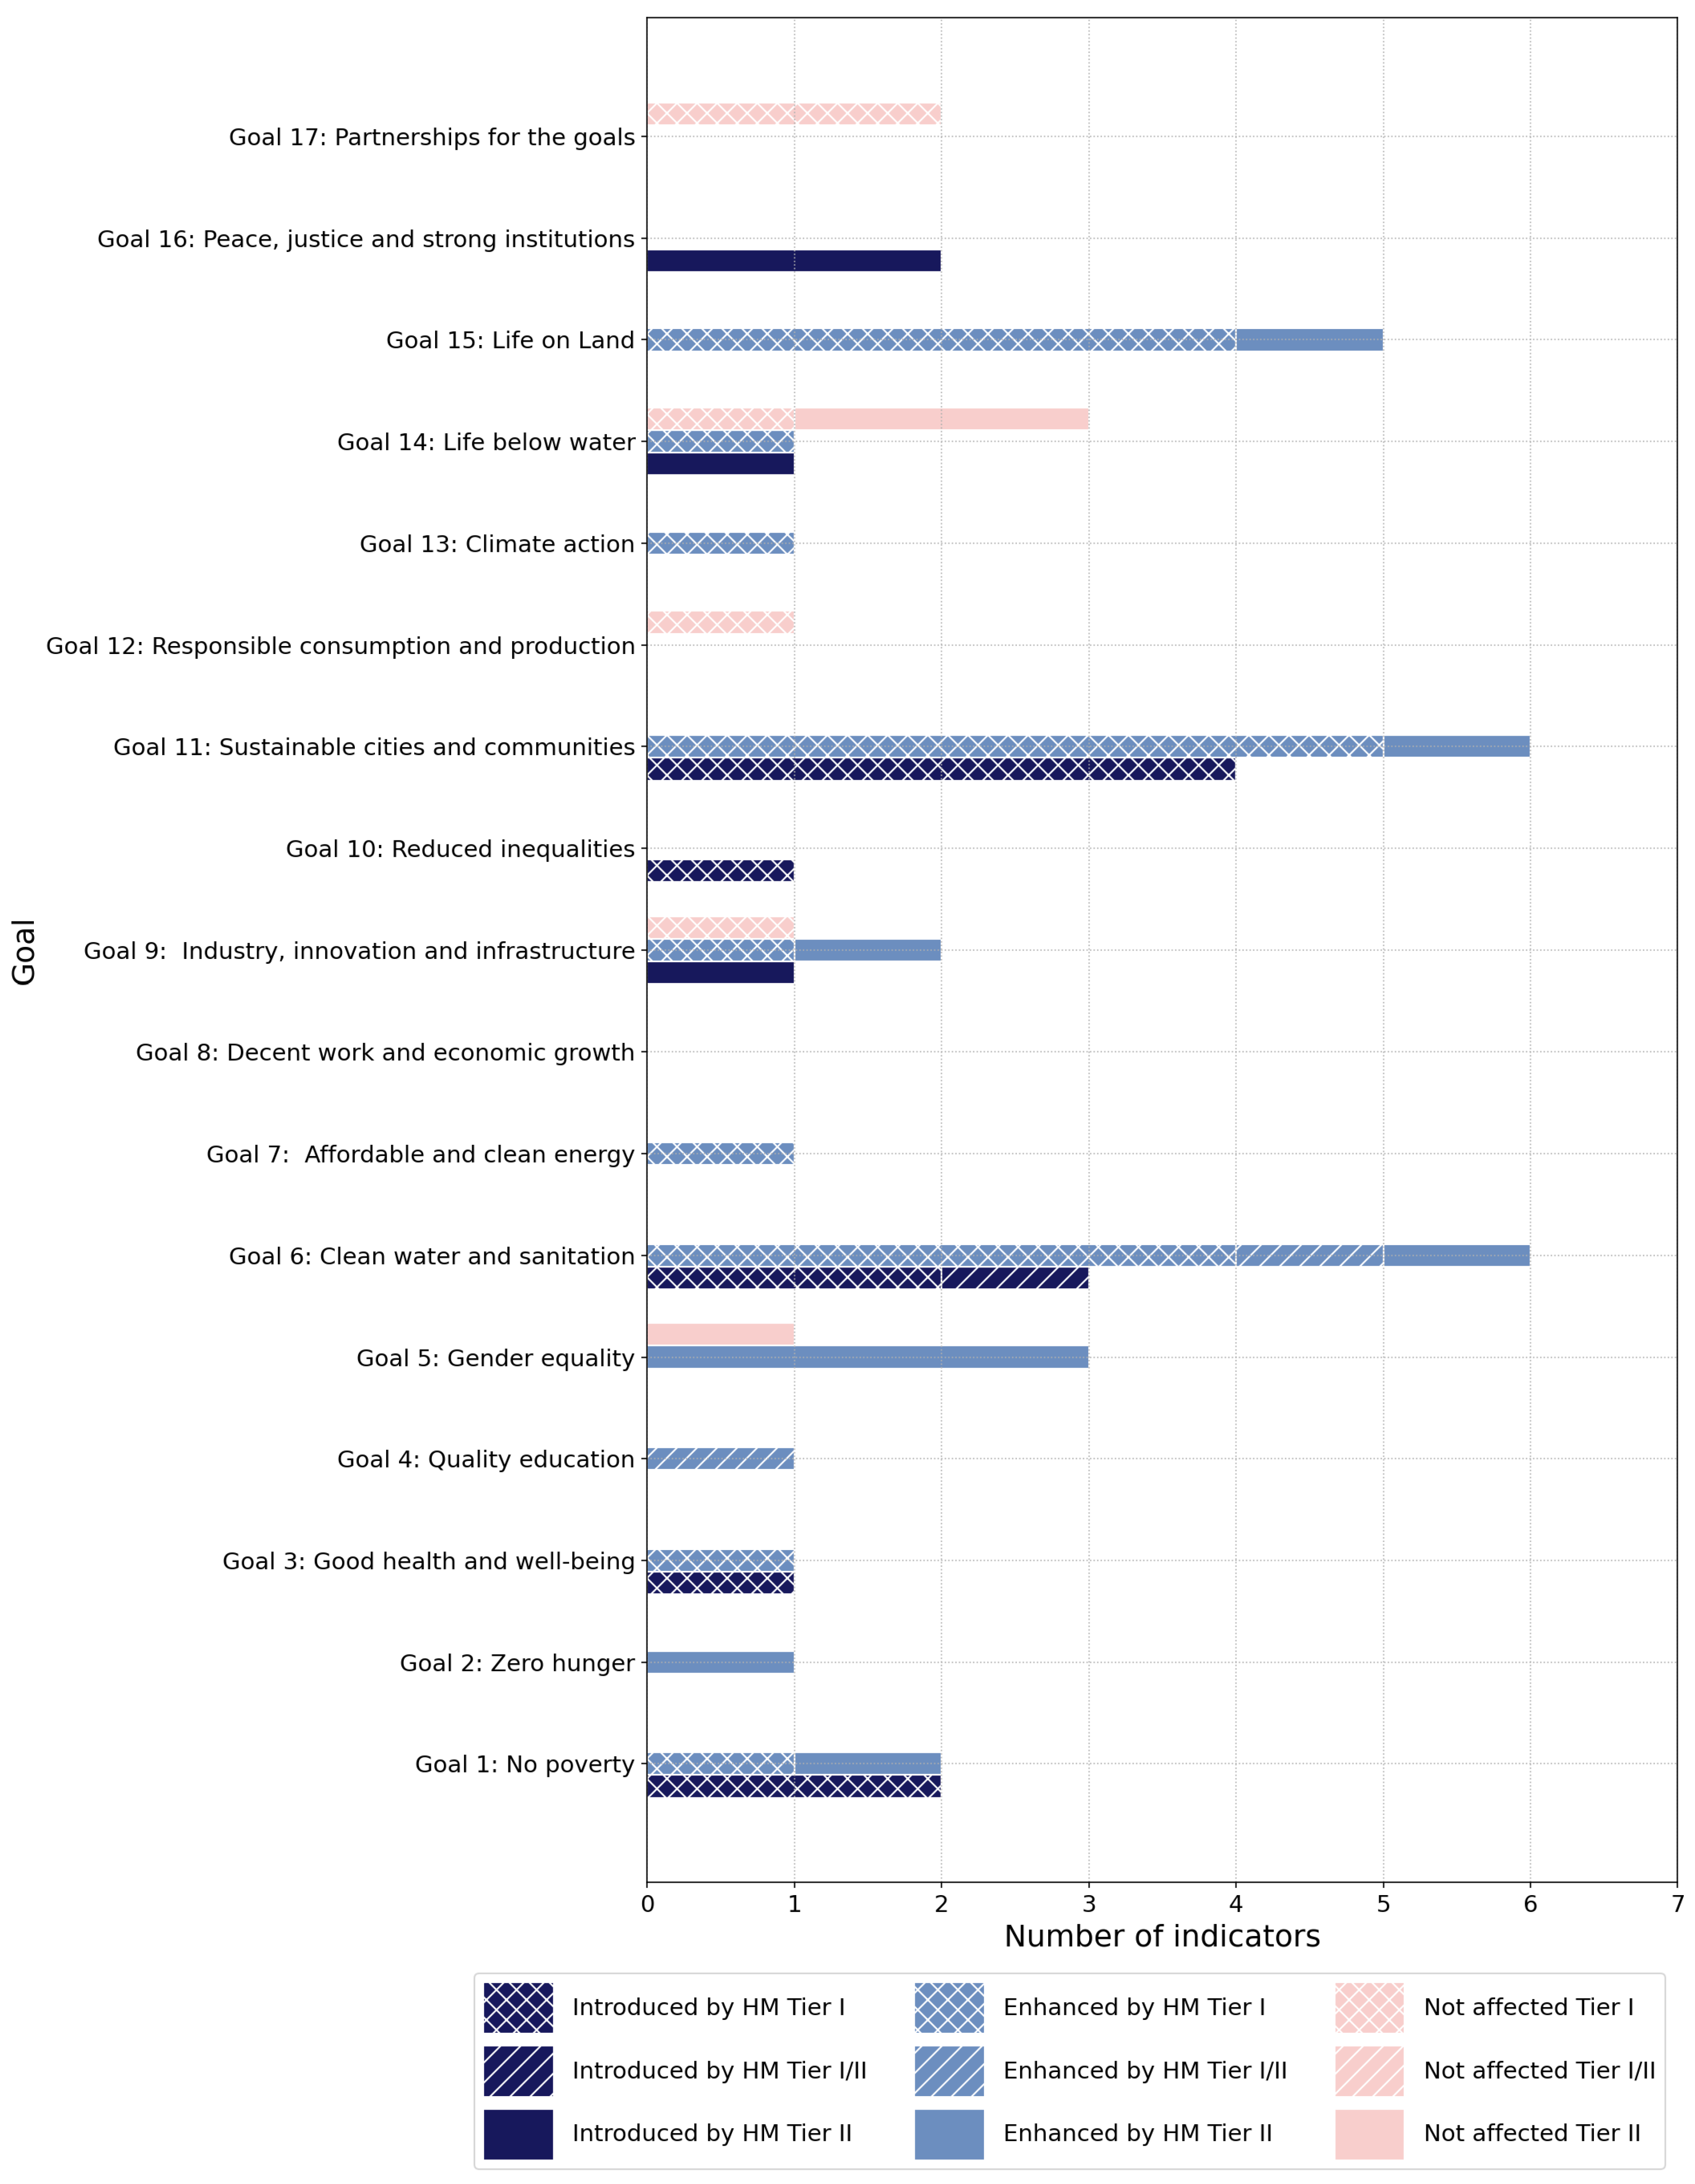
The results indicate that HM has the potential to support nearly all the SDGs. As shown in Figure 4, there is a strong alignment between several indicators (particularly Goal 6: Clean water and sanitation; Goal 11: Make cities and human settlements inclusive, safe, resilient and sustainable; and Goal 15: Make cities and human settlements inclusive, safe, resilient and sustainable) and HM activities. In total, there are 15 introduced indicators (HM-I) and 30 enhanced indicators (HM-E). The potential introduced indicators are highly concentrated in Goal 11 (four indicators) and Goal 6 (three indicators); while enhanced indicators are scattered between Goal 6 (six indicators), Goal 11 (six indicators), Goal 15 (five indicators), and Goal 5 (three indicators). HM was found to have no potential for contribution to Goal 8, Goal 12, or Goal 17. The tier I data indicators remain mainly in Goal 11 (nine indicators), Goal 6 (six indicators), and Goal 15 (four indicators). The tier II data indicators are mainly distributed in Goal 5 (four indicators), Goal 14 (three indicators), and Goal 6 (three indicators).
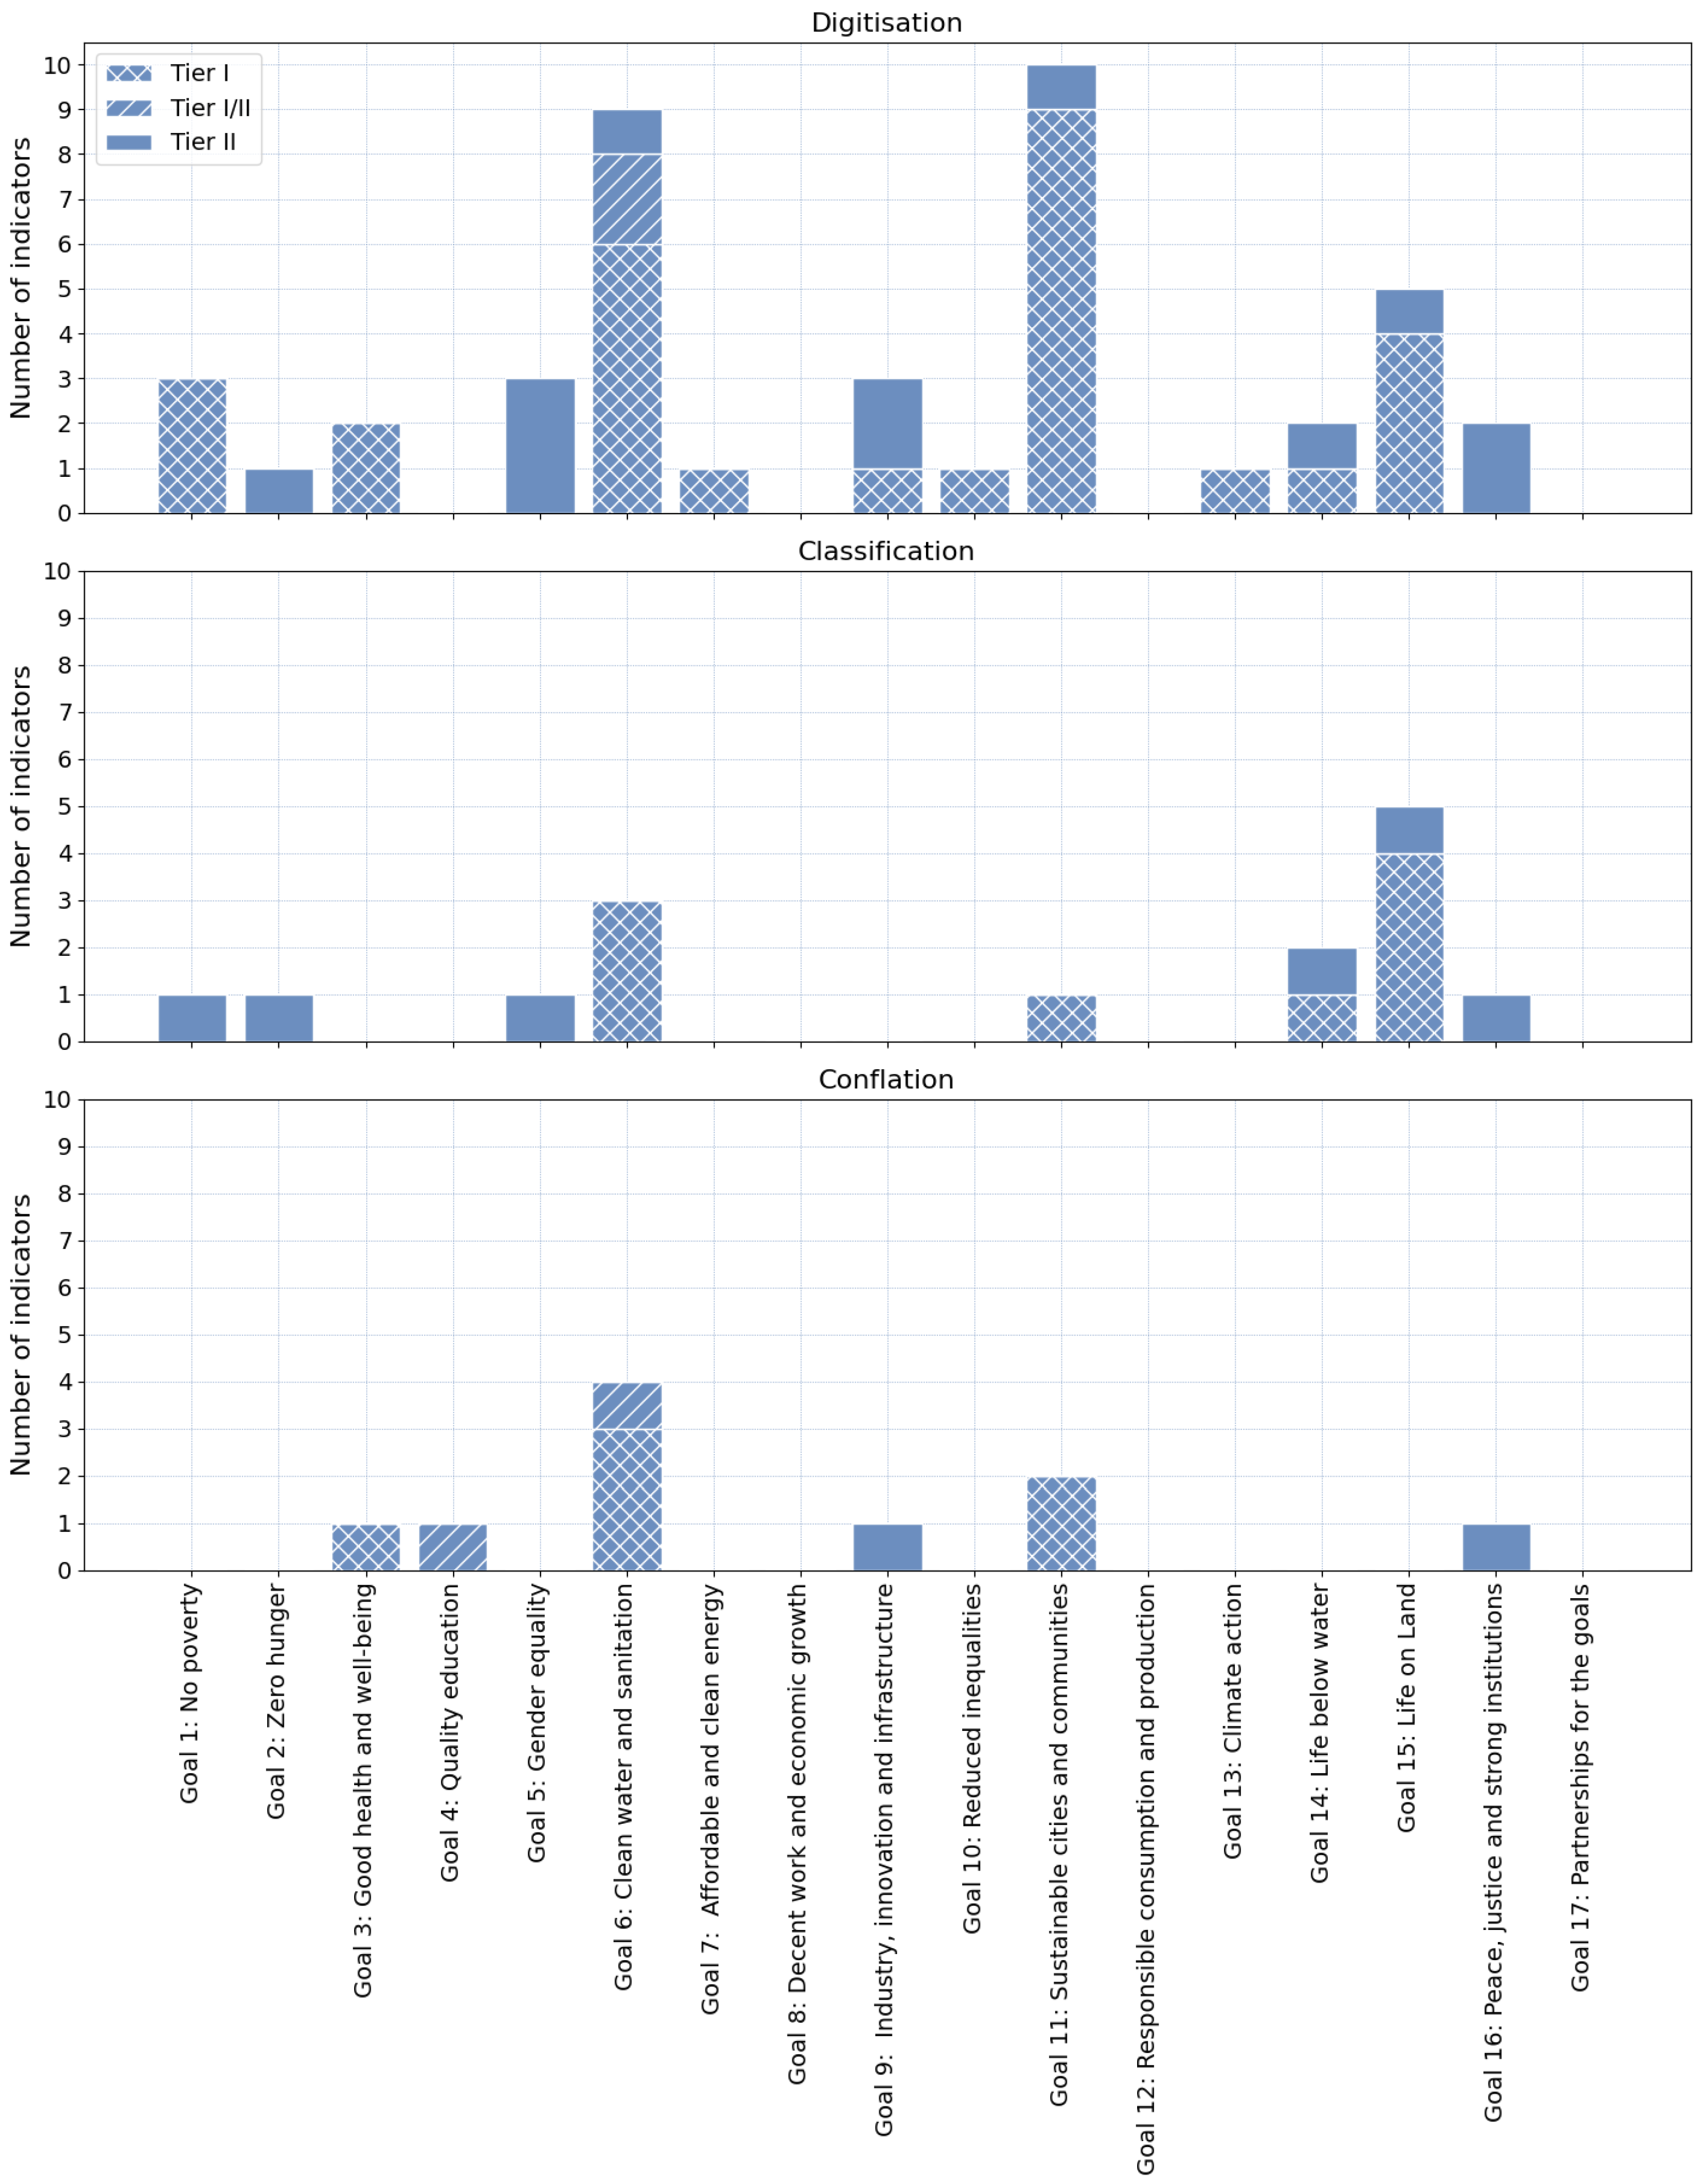
The number of indicators in each goal categorized by the three HM techniques is shown in Figure 5. Digitization is the leading HM approach in terms of the number of indicators (43 indicators), followed by classification (15 indicators) and conflation (10 indicators). Moreover, digitization is shown to be more contributive to Goal 6, Goal 11, and Goal 15 because mapping water, buildings, and land cover can contribute greatly to these goals. In other cases, classification is the most effective for Goal 15 because land cover mapping requires classification technology, while the conflation technique is more significant for Goal 6 and Goal 11 because mapping water and settlement requires an interdisciplinary approach.
It is also observed that one indicator can be involved in multiple HM approaches. For example, for indicator 16.1.4: Proportion of population that feel safe walking alone around the area they live after dark, HM can help classify imagery, digitize urban physical elements such as buildings and open spaces, and overlay various data, particularly population or local criminality. In other cases, as in indicator 11.6.1: Proportion of municipal solid waste collected and managed in controlled facilities out of total municipal waste generated, by cities, waste-collection-point mapping is considered as purely related to digitization.
These findings show that the concentration of potential contributions in Goals 6, 11, and 15 suggests that HM is particularly well suited to address challenges relating to water, urban infrastructure, and land use.

3.2. Humanitarian Mapping Project Data Resource Distribution

HM is involved in the provision and the use of geospatial data for humanitarian aid. An HM project can collect data from multiple sources. VGI/CGI is currently the main source of HM data, but not all VGI/CGI projects are considered HM. In order to map HM activities in one holistic map, further efforts are needed. This study analyzes three popular VGI/CGI platforms in order to reveal the potential data resources for HM projects, without indicating precisely the geospatial distribution of HM projects.
The number of recent non-duplicated projects in the three investigated platforms aggregated by nation is shown in Figure 6. The three platforms work globally, but the geographic ranges are different. HOT-TM and MapSwipe are built within an OSM environment, focusing on disaster response in the Americas, most of Africa, South Asia, and the Asia–Pacific area. Meanwhile, Ushahidi is an independent database, and its projects are frequently found in the Americas and Europe, with others scattered across Africa, South Asia, and Oceania.
In detail, the number of projects in HOT-TM ranges from 1 to 70, with the highest number in Uganda (70 projects), and an average of 2.5 projects per country. A total of 71 projects are recorded in MapSwipe. The number of projects in each country ranges from 1 to 5, with a mean of 1.775 projects per country. Chad, India, and South Sudan have the highest number of projects on MapSwipe. Ushahidi has the fewest projects, with a total of 42 and a mean of 1.355 projects per country. The maximum number of projects per country is four, which can be observed in Colombia.
Distinct geographic patterns among the three platforms have been revealed by the analysis, heightening the global reach and regional focus of HM data contributions.

3.3. HM Contribution to SDG

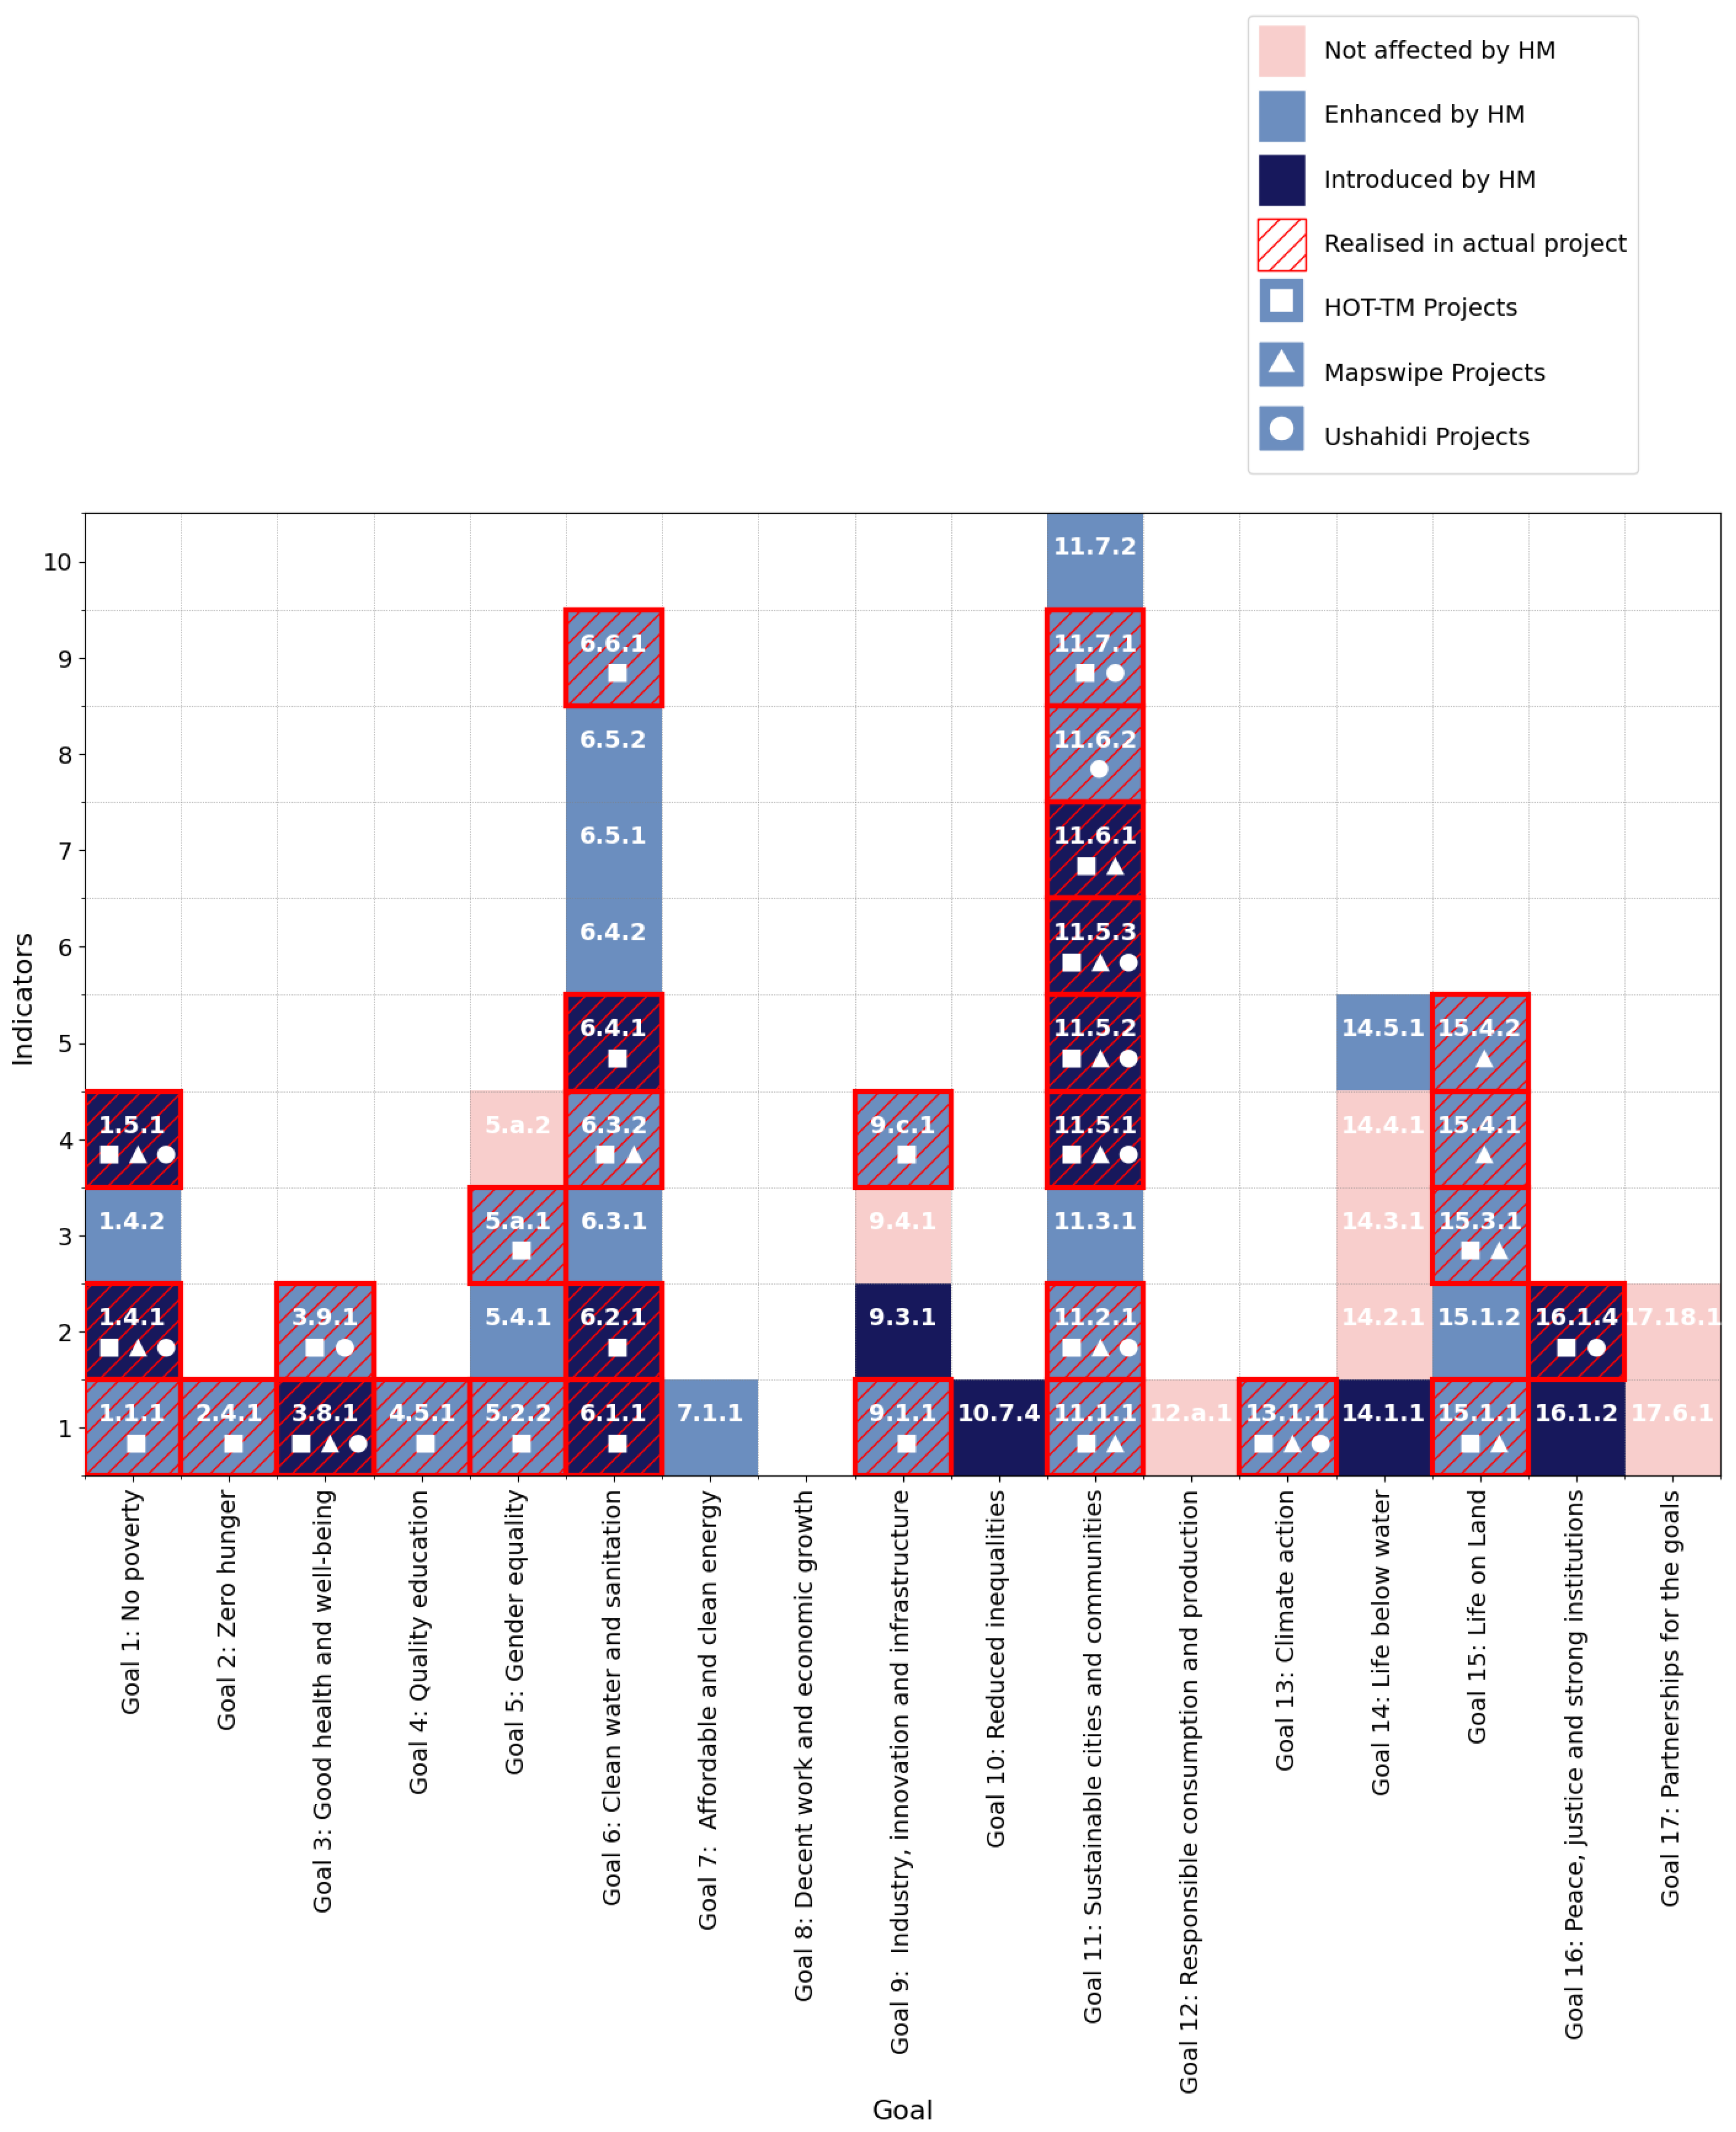
HM projects contribute to 15 goals and to 30 of the 53 potential indicators (56.49%) (see Figure 7). HM is mainly present in Goal 11: Make cities and human settlements inclusive, safe, resilient and sustainable (eight indicators), Goal 6: Clean water and sanitation (five indicators), and Goal 15: Life on land (four indicators). There are 11 indicators that are introduced indicators and 14 exclusive indicators. With only nine tier II and tier I/II indicators contributed, HM projects do not focus on improving missing data indicators.
As summarized in Table 2, HOT-TM ranks first in the total number of contributions, with 27 indicators, because HOT-TM is the largest platform in terms of the number of recent non-duplicated projects. Following this, Ushahidi has 15 indicators and MapSwipe has 12 indicators. Regarding the introduced indicators, we do not observe a significant difference: 11 indicators for HOT-TM and 7 indicators each for Ushahidi and MapSwipe. With 11 indicators, HOT-TM’s exclusive indicators outweigh MapSwipe (2 indicators) and Ushahidi (1 indicator). For low-data-availability indicators, HOT-TM projects have contributed to eight indicators, with only one for both MapSwipe and Ushahidi.
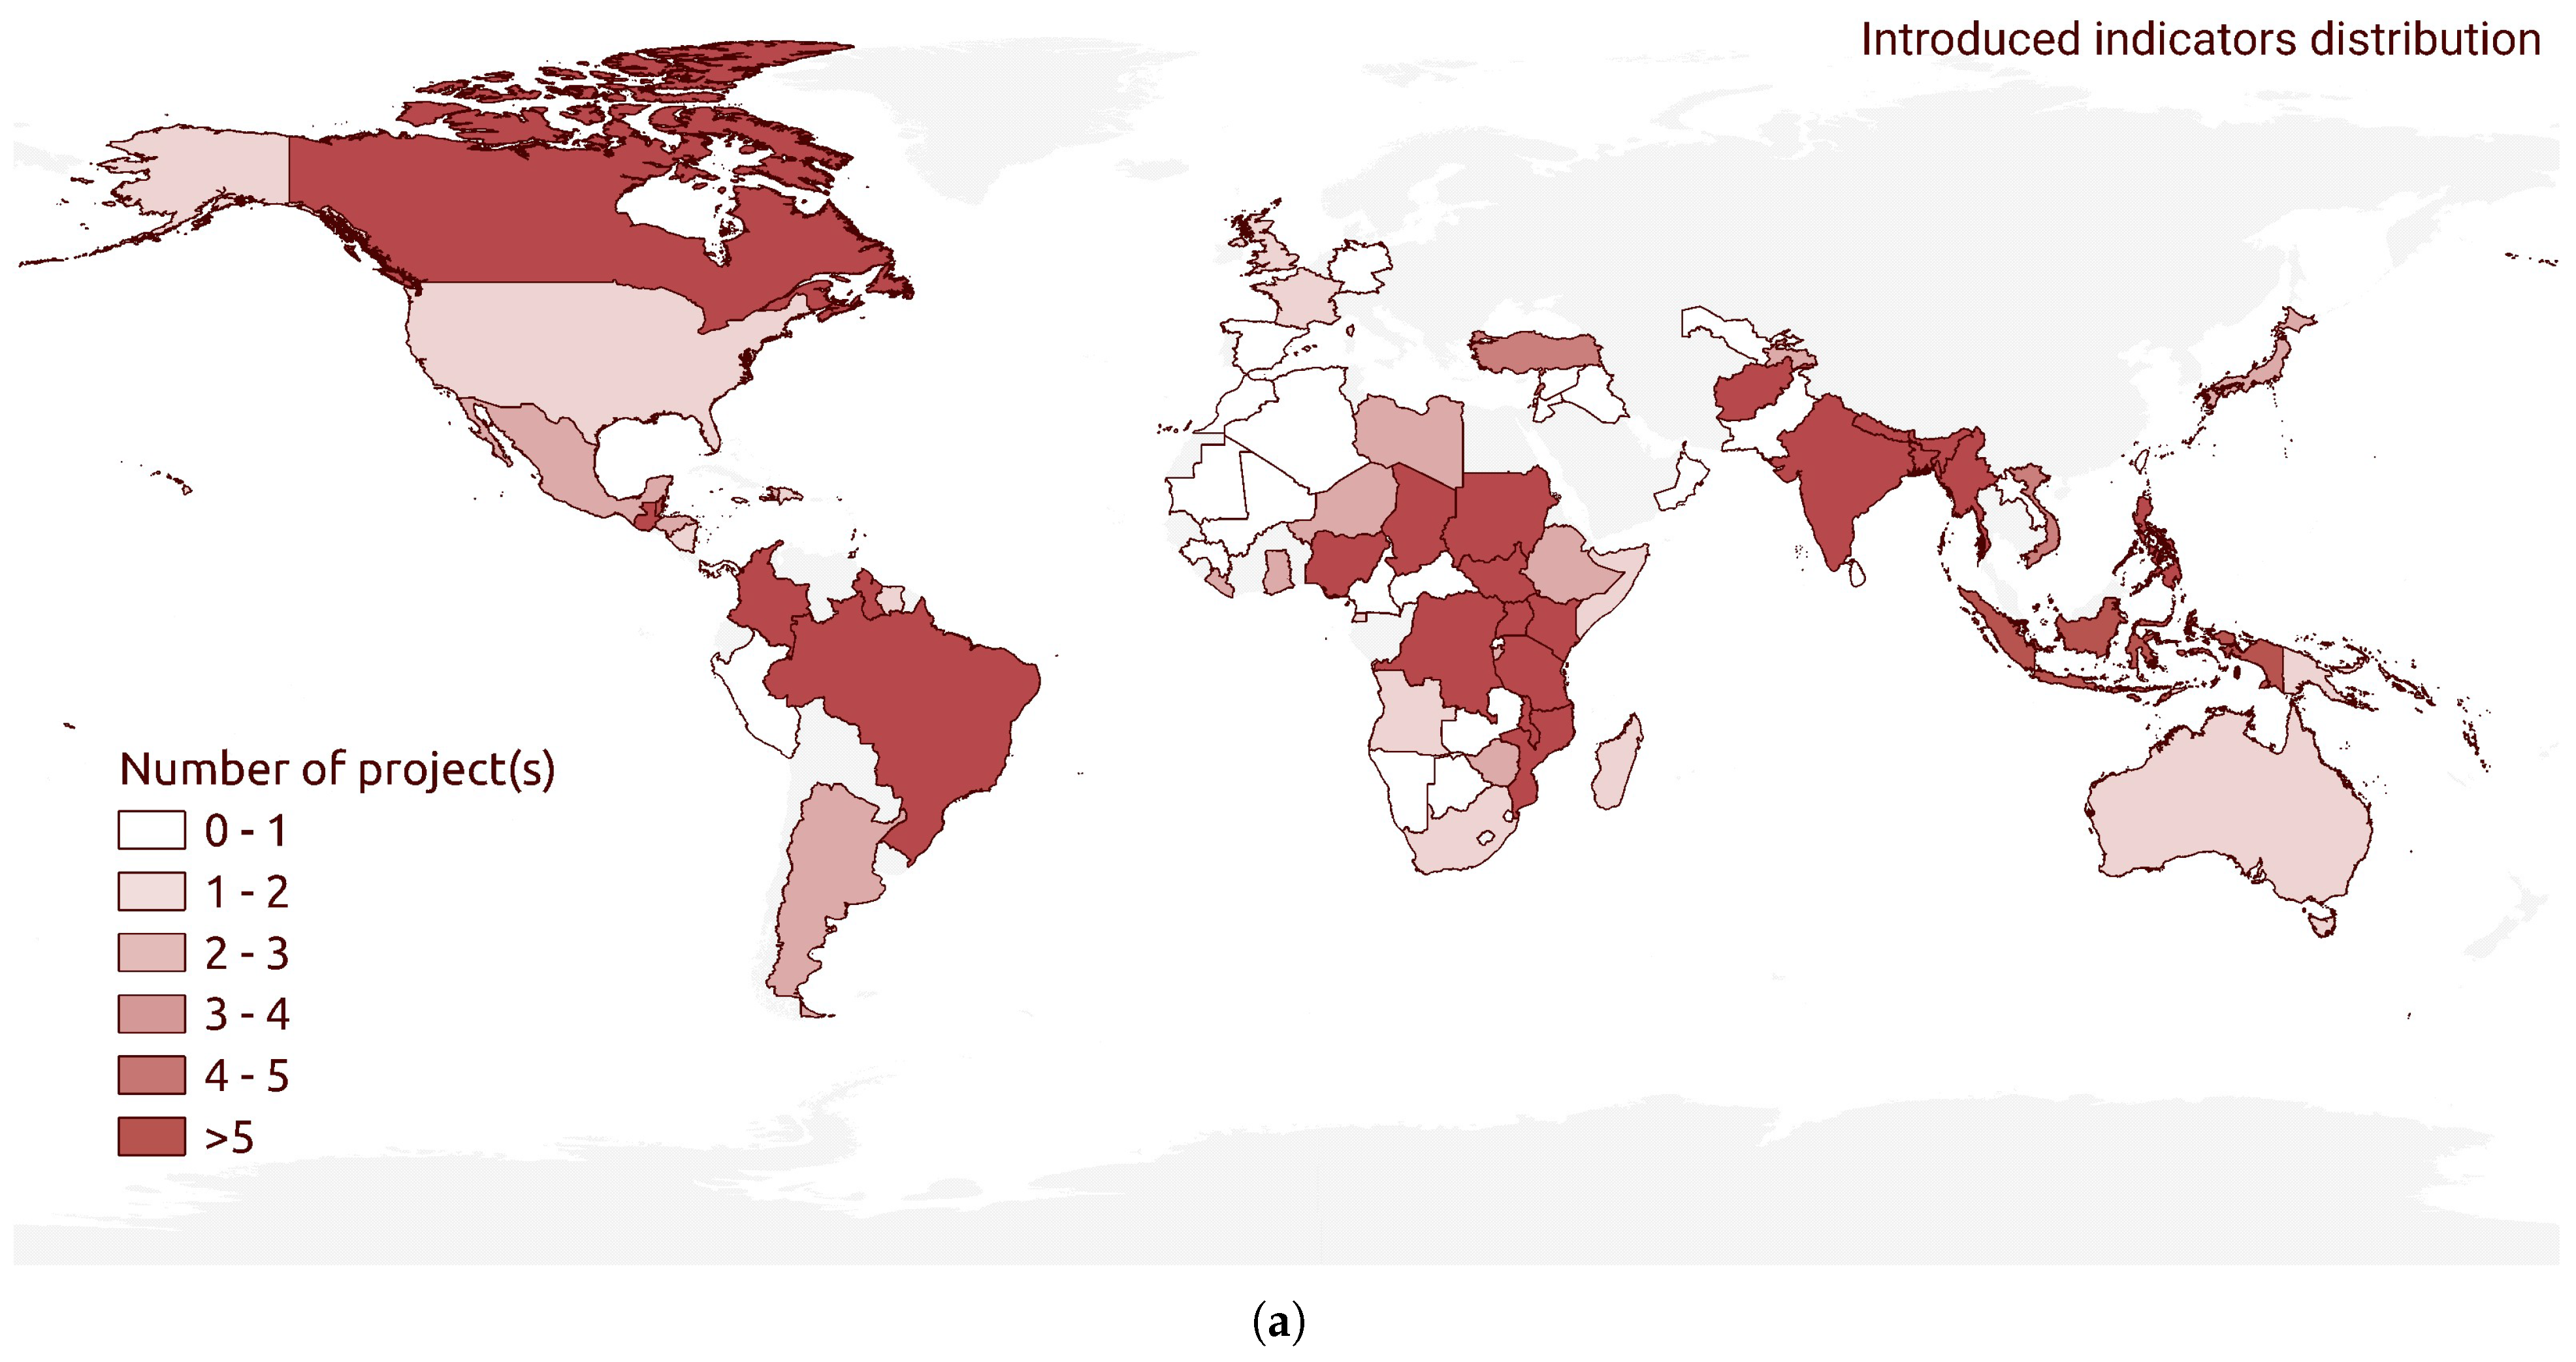
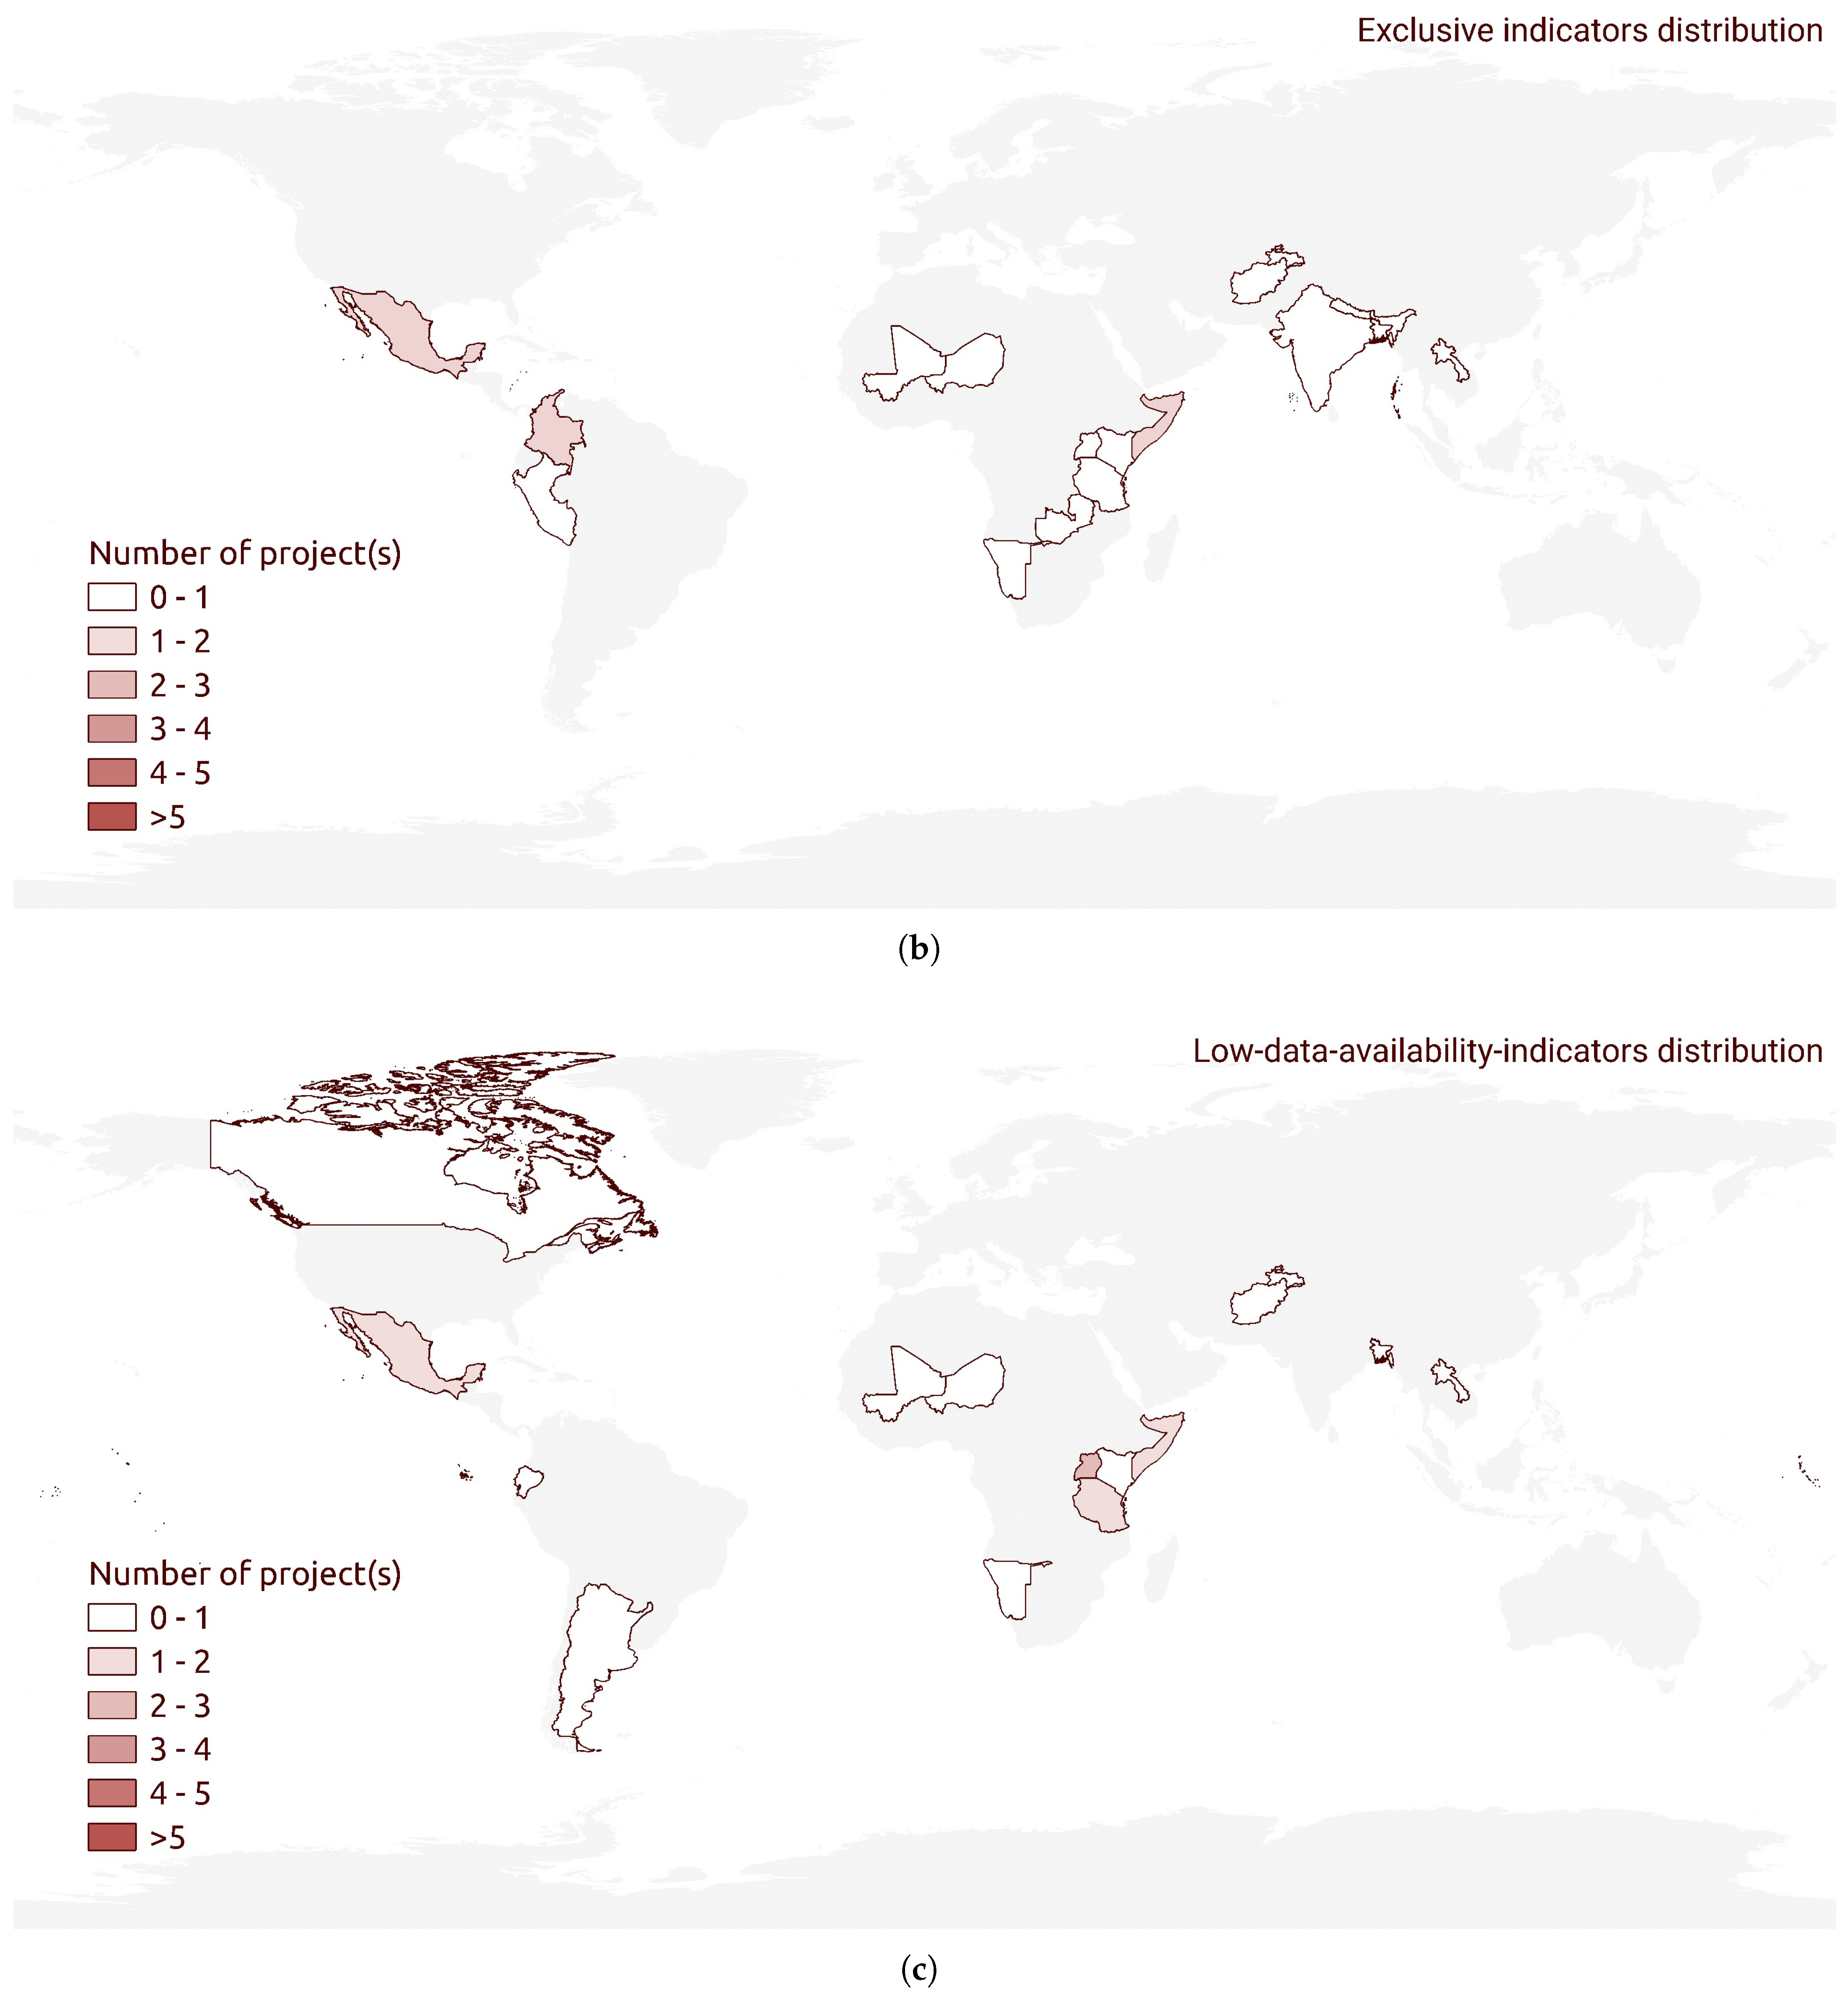
The analysis of HM projects’ geo-distribution reveals a predominant distribution of projects in the Global South and North America (see Figure 8). A total of 296 HM projects have used introduced indicators, with a high concentration in developing countries such as Brazil (12 projects), Nigeria (12 projects), Malawi (10 projects), India (9 projects), and the Philippines (9 projects). For the distribution of exclusive and low-data-availability indicators, there are a total of 21 and 23 projects, respectively. The highest numbers of projects were recorded in Uganda, Colombia, Mexico, and Somalia. We can observe that the three distinct platforms, each with a different scope, have covered a variety of potential indicators. However, there is still a lack of interest in improving the diversity and quality of contributions to the SDGs.

4. Discussion and Conclusions

4.1. Trends and Gaps

HM has made a great deal of data available for SDG contributions by using geospatial data for disaster relief. There is a focus on post-disaster damage mapping activities; for example, indicators 1.5.1: Number of deaths, missing persons and directly affected persons attributed to disasters per 100,000 population; 11.5.2: Direct economic loss attributed to disasters in relation to global gross domestic product (GDP); and 11.5.3 (a): Damage to critical infrastructure, and (b): number of disruptions to basic services, attributed to disasters; with a particular emphasis on the affected population and damage to infrastructure. One reason is that the DRR framework can effectively integrate VGI/CGI and HM, especially in the response and recovery phases [30,34].
Environmental mapping is one important phenomenon, as observed in the contributions to Goal 6: Clean water and sanitation, and Goal 15: Clean water and sanitation. Water is a key focus in HM projects, for example, for mapping water access during the Malawi cholera outbreak [49]; mapping water security during TerresEauVie by USAID, Sustainable Water Partnership, and Winrock [50]; and waterway mapping for topographic maps for peacekeeping activities by UN Mappers [40,51]. Forest-area mapping is also a critical movement in HM, as observed in El Carmen forest monitoring (Mexico), and in the Amazon forest and buildings project by the Open Mapping Hub—Latin America and the Caribbean [52].
Urban areas are also common targets for HM, because urbanization is a global phenomenon. Informal settlement (11.1.1: Proportion of urban population living in slums, informal settlements or inadequate housing) and facility accessibility (11.2.1: Proportion of population that has convenient access to public transport, by sex, age and persons with disabilities; 11.7.1: Average share of the built-up area of cities that is open space for public use for all, by sex, age and persons with disabilities; 9.c.1: Proportion of population covered by a mobile network, by technology; 9.1.1: Proportion of the rural population who live within 2 km of an all-season road) are the two primary types of this mapping. This can be explained by the fact that, in most cases, VGI/CGI data concerning settlements and infrastructures are visible on satellite imagery and therefore practically available via the HOT-TM and MapSwipe projects [53]. Moreover, open data on urban construction is complementary and highly integrative with other urban development projects [54].
However, energy and ocean mapping is found to be under-represented across the three HM platforms, as in Goal 14: Life below water and Goal 7: Affordable and clean energy. In most cases, submarine elements and electrical infrastructure are not readily identifiable in satellite imagery.

4.2. Limitations

This study has the following limitations: (A) the number of HM projects is updated rapidly, but the study could only capture the situation during research implementation; (B) the elimination of incomplete or duplicate projects may have led to information loss; (C) the review process was performed manually, therefore human errors and biases are inevitable; (D) the three platforms were chosen based on popularity, so the study may have missed contributions from lesser-known platforms.

4.3. Contribution

This study described the current state of HM projects’ potential and actual contributions to the SDGs. The finding that HM projects pay insufficient attention to diversifying data themes and working areas, and improving indicators with low-availability data, could be explored further in other studies and enhanced in future HM projects. The assessment pipeline presented in this paper could be reused or integrated into future reports to support SDG assessment over the next five years (2025–2030).

4.4. Future Directions

Crowd-sourced data and humanitarian mapping have undeniable advantages for the SDGs. The question that should be raised is how to monitor HM projects in order to respond to global needs. Two development tracks could be proposed: extraction of the SDG indicators and project orientation.
For the first of these, using up-to-date artificial intelligence (AI) technology, e.g., large language models, one could analyze HM projects’ description in depth in terms of mining data in connection with one or a set of the SDG indicators (a primitive prototype of the application has been developed during this study; see Figure 9). In the future, the review process of the projects and of the SDG indicators should be automatic and enhanced in terms of the rapid detection of the SDG indicators embedded in HM projects and the quantification of large datasets of HM projects. The data from this study could be reused to train deep learning models, thereby fostering automatic progress. Reducing the time spent reviewing the completeness of indicators could enhance the quality of SDG data flow monitoring.
The second track would focus on how HM projects are formed. AI could help suggest relevant SDG indicators during the creation of HM projects. It is recommended that this application be integrated into HM platforms. In addition, the application should also guide projects in providing the necessary data for humanitarian projects and contributing data to the urgent SDG indicators. An application could be developed to suggest to users in the area the platforms that would be most efficient, the requirements of the HM project, and the description and instructions for future projects.

Author Contributions

Quang Huy Nguyen, Maria Antonia Brovelli, Alberta Albertella, Taichi Furuhashi and Michael Montani; formal analysis, Quang Huy Nguyen; investigation, Quang Huy Nguyen; methodology, Quang Huy Nguyen, Maria Antonia Brovelli, and Alberta Albertella; project administration, Maria Antonia Brovelli; resources, Maria Antonia Brovelli, and Alberta Albertella; software, Quang Huy Nguyen; supervision, Maria Antonia Brovelli, and Alberta Albertella; visualization, Quang Huy Nguyen; writing—original draft, Quang Huy Nguyen; writing—review and editing, Maria Antonia Brovelli, Alberta Albertella, Taichi Furuhashi, and Michael Montani. All authors have read and agreed to the published version of the manuscript.

Funding

This research received no external funding.

Conflicts of Interest

The authors declare no conflicts of interest.

Abbreviations

The following abbreviations are used in this manuscript:
AIArtificial intelligence
CSCitizen science
DAData availability
DRRDisaster risk response
GIGeospatial information
GEOGroup on Earth Observations
HMHumanitarian mapping
HM-IIndicators introduced by humanitarian mapping
HM-EIndicators enhanced by humanitarian mapping
HOTHumanitarian Openstreetmap Team
HOT-TMHumanitarian Openstreetmap Team Tasking Manager
IGOIntergovernmental Organization
IAEG-SDGInter-agency and Expert Group on SDG Indicators
IAEG-SDGs-WG-GIInter-Agency Expert Group on Sustainable Development Goals Indicators
Working Group on Geospatial Information
MDGsMillennium Development Goals
NGONon-governmental organization
OSMOpenStreetMap
SDSustainable development
SDGsSustainable Development Goals
TF-IDFTerm frequency-inverse document frequency
UNUnited Nations
VGIVolunteered geographic information

Appendix A. The SDG Indicator Analysis

Table A1. The analysis of the SDG indicators under the criteria of HM contributions.
GoalIndicatorIndicator DescriptionData AvailabilityIAEG-
SDGs-
WG-
GI
GEOHM-IHM-EMapping TypesNotes
11.1.11.1.1 Proportion of the population living below the international poverty line by sex, age, employment status and geographic location (urban/rural)Tier IX XDigitisationMapping buildings to support demographic distribution data
11.4.11.4.1 Proportion of population living in households with access to basic servicesTier I X DigitisationMapping buildings and public facilities; support data disaggregation by geographic location
1.4.21.4.2 Proportion of total adult population with secure tenure rights to land, (a) with legally recognized documentation, and (b) who perceive their rights to land as secure, by sex and type of tenureTier IIX XClassificationMapping landuse; support data disaggregation by geographic location
1.5.11.5.1 Number of deaths, missing persons and directly affected persons attributed to disasters per 100,000 populationTier I X DigitisationMapping damaged buildings; support data disaggregation by geographic location
22.4.12.4.1 Proportion of agricultural area under productive and sustainable agricultureTier IIX XClassification, DigitisationMapping landcover (agriculture area); support data disaggregation by geographic location
33.8.13.8.1 Coverage of essential health servicesTier I X DigitisationMapping distribution of essential health services; support data disaggregation by geographic location
3.9.13.9.1 Mortality rate attributed to household and ambient air pollutionTier I X Digitisation, ConflationBuilding mapping (building and ambient air quality mapping)
44.5.14.5.1 Parity indices (female/male, rural/urban, bottom/top wealth quintile and others such as disability status, indigenous peoples and conflict-affected, as data become available) for all education indicators on this list that can be disaggregatedTier I/IIX XConflationSupport calculating location dimension of Parity Index
55.2.25.2.2 Proportion of women and girls aged 15 years and older subjected to sexual violence by persons other than an intimate partner in the previous 12 months, by age and place of occurrenceTier IIX XDigitisationMapping place of occurence;support data disaggregation by geographic location
5.4.15.4.1 Proportion of time spent on unpaid domestic and care work, by sex, age and locationTier IIX XDigitisationSupport data disaggregation by geographic location
5.a.15.a.1 (a) Proportion of total agricultural population with ownership or secure rights over agricultural land, by sex; and (b) share of women among owners or rights-bearers of agricultural land, by type of tenureTier IIX XClassification, DigitisationMapping landcover (agriculture area); support data disaggregation by geographic location
5.a.25.a.2 Proportion of countries where the legal framework (including customary law) guarantees women’s equal rights to land ownership and/or controlTier IIX
66.1.16.1.1 Proportion of population using safely managed drinking water servicesTier I X DigitisationMapping location of drinking water sources; support data disaggregation by geographic location
6.2.16.2.1 Proportion of population using (a) safely managed sanitation services and (b) a hand-washing facility with soap and waterTier I/II X DigitisationSupport data disaggregation by geographic location
6.3.16.3.1 Proportion of domestic and industrial wastewater flows safely treatedTier I/II X XDigitisation, ConflationMapping wastewater sources;
6.3.26.3.2 Proportion of bodies of water with good ambient water qualityTier IX XClassification, Digitisation, ConflationMapping water (including basin, stream, water surface, pollution points); support data disaggregation by geographic location
6.4.16.4.1 Change in water-use efficiency over timeTier I X Digitisationsupport data disaggregation by geographic location
6.4.26.4.2 Level of water stress: freshwater withdrawal as a proportion of available freshwater resourcesTier I X XDigitisationSupport data disaggregation by geographic location
6.5.16.5.1 Degree of integrated water resources managementTier I X XDigitisationSupport data disaggregation by geographic location
6.5.26.5.2 Proportion of transboundary basin area with an operational arrangement for water cooperationTier IX XDigitisation, Classification, ConflationMapping water (including basin, stream, water surface, pollution points); support data disaggregation by geographic location
6.6.16.6.1 Change in the extent of water-related ecosystems over timeTier IX XClassification, Digitisation, ConflationMapping water (including basin, stream, water surface, pollution points); support data disaggregation by geographic location
77.1.17.1.1 Proportion of population with access to electricityTier I X XDigitisationSupport data disaggregation by geographic location
99.1.19.1.1 Proportion of the rural population who live within 2 km of an all-season roadTier IIX XDigitisation, ConflationMapping buildings and all-season roands; support data disaggregation by geographic location
9.3.19.3.1 Proportion of small-scale industries in total industry value addedTier II X DigitisationMapping small-scale industries distribution
9.4.19.4.1 CO2 emission per unit of value addedTier I X
9.c.19.c.1 Proportion of population covered by a mobile network, by technologyTier IX XDigitisationMapping living area of the population who is covered by a mobile network, broken down by technology
1010.7.410.7.4 Proportion of the population who are refugees, by country of originTier I X DigitisationSupport data disaggregation by geographic location
1111.1.111.1.1 Proportion of urban population living in slums, informal settlements or inadequate housingTier I X XDigitisationMapping buildings; support data disaggregation by geographic location
11.2.111.2.1 Proportion of population that has convenient access to public transport, by sex, age and persons with disabilitiesTier IX XDigitisationMapping public transport accessibility (Point of interest); support data disaggregation by geographic location
11.3.111.3.1 Ratio of land consumption rate to population growth rateTier IX XDigitisation, ConflationMapping urbnized area, urbanized area change, built-up area; support data disaggregation by geographic location
11.5.111.5.1 Number of deaths, missing persons and directly affected persons attributed to disasters per 100,000 populationTier I X DigitisationMapping damaged buildings; support data disaggregation by geographic location
11.5.211.5.2 Direct economic loss attributed to disasters in relation to global gross domestic product (GDP)Tier I X DigitisationMapping damaged buildings; support data disaggregation by geographic location
11.5.311.5.3 (a) Damage to critical infrastructure and (b) number of disruptions to basic services, attributed to disastersTier I X DigitisationMapping damaged buildings and critical infrastructure; support data disaggregation by geographic location
11.6.111.6.1 Proportion of municipal solid waste collected and managed in controlled facilities out of total municipal waste generated, by citiesTier I X DigitisationMapping municipal solid waste collected and managed in controlled facilities mapping; support data disaggregation by geographic location
11.6.211.6.2 Annual mean levels of fine particulate matter (e.g. PM2.5 and PM10) in cities (population weighted)Tier I X Digitisation, Classification, ConflationAir quality mapping
11.7.111.7.1 Average share of the built-up area of cities that is open space for public use for all, by sex, age and persons with disabilitiesTier IX XDigitisationMapping buildings, roads, public spaces; support data disaggregation by geographic location
11.7.211.7.2 Proportion of persons victim of non-sexual or sexual harassment, by sex, age, disability status and place of occurrence, in the previous 12 monthsTier IIX XDigitisationMapping place of occurence; support data disaggregation by geographic location
1212.a.112.a.1 Installed renewable energy-generating capacity in developing and developed countries (in watts per capita)Tier I X
1313.1.113.1.1 Number of deaths, missing persons and directly affected persons attributed to disasters per 100,000 populationTier I X XDigitisationMapping damaged buildings; support data disaggregation by geographic location
1414.1.114.1.1 (a) Index of coastal eutrophication; and (b) plastic debris densityTier II X Digitisation, ClassificationSupport geospatial analysis
14.2.114.2.1 Number of countries using ecosystem-based approaches to managing marine areasTier IIX
14.3.114.3.1 Average marine acidity (pH) measured at agreed suite of representative sampling stationsTier II X
14.4.114.4.1 Proportion of fish stocks within biologically sustainable levelsTier I X
14.5.114.5.1 Coverage of protected areas in relation to marine areasTier IX XDigitisation, ClassificationMapping protected area
1515.1.115.1.1 Forest area as a proportion of total land areaTier IX XDigitisation, ClassificationMapping Forest Area
15.1.215.1.2 Proportion of important sites for terrestrial and freshwater biodiversity that are covered by protected areas, by ecosystem typeTier IX XDigitisation, ClassificationMapping protected area
15.3.115.3.1 Proportion of land that is degraded over total land areaTier IX XClassification, DigitisationMapping degraded land area
15.4.115.4.1 Coverage by protected areas of important sites for mountain biodiversityTier IX XDigitisation, ClassificationMapping protected area
15.4.215.4.2 (a) Mountain Green Cover Index and (b) proportion of degraded mountain landTier IX XDigitisation, ClassificationMapping Mountain Area, Landcover and degraded land area
1616.1.216.1.2 Conflict-related deaths per 100,000 population, by sex, age and causeTier II X DigitisationMapping place of death
16.1.416.1.4 Proportion of population that feel safe walking alone around the area they live after darkTier II X Classification, Digitisation, ConflationMapping neightborhood
1717.6.117.6.1 Fixed broadband subscriptions per 100 inhabitants, by speedTier I X
17.18.117.18.1 Statistical capacity indicatorsTier I X

References

  1. UN. Secretary-General; World Commission on Environment and Development. Report of the World Commission on Environment and Development: Note/by the Secretary-General; United Nations: New York, NY, USA, 1987; Available online: https://digitallibrary.un.org/record/139811?v=pdf (accessed on 22 May 2025).
  2. Brundtland, G.H. Our common future. In Earth and Us; Tolba, M.K., Biswas, A.K., Eds.; Butterworth-Heinemann: Oxford, UK; Boston, MA, USA, 1991; pp. 29–31. Available online: https://digitallibrary.un.org/record/247793?ln=en (accessed on 22 May 2025).
  3. Mensah, J. Sustainable development: Meaning, history, principles, pillars, and implications for human action: Literature review. Cogent Soc. Sci. 2019, 5, 1653531. [Google Scholar] [CrossRef]
  4. Ruggerio, C.A. Sustainability and sustainable development: A review of principles and definitions. Sci. Total Environ. 2021, 786, 147481. [Google Scholar] [CrossRef] [PubMed]
  5. United Nations. About Us. Publisher: United Nations. Available online: https://www.un.org/en/about-us (accessed on 30 April 2025).
  6. UN. Transforming Our World: The 2030 Agenda for Sustainable Development. Technical Report. 2015. Available online: https://sdgs.un.org/sites/default/files/publications/21252030%20Agenda%20for%20Sustainable%20Development%20web.pdf (accessed on 30 April 2025).
  7. Scott, G.; Rajabifard, A. Sustainable development and geospatial information: A strategic framework for integrating a global policy agenda into national geospatial capabilities. Geo-Spat. Inf. Sci. 2017, 20, 59–76. [Google Scholar] [CrossRef]
  8. Carpentier, C.L.; Braun, H. Agenda 2030 for Sustainable Development: A powerful global framework. J. Int. Counc. Small Bus. 2020, 1, 14–23. [Google Scholar] [CrossRef]
  9. Geng, W.; Chen, J.; Zhang, H.P.; Xu, K. Task and Progress of IAEG-SDGS: WGGI in Monitoring SDGS Through a ‘Geographic Location’ Lens. In Proceedings of the ISPRS TC III Mid-term Symposium “Developments, Technologies and Applications in Remote Sensing” (Volume XLII-3), Beijing, China, 7–10 May 2018; Copernicus GmbH: Göttingen, Germany, 2018; Volume XLII-3, pp. 385–390. [Google Scholar] [CrossRef]
  10. IAEG-SDGs. Tier Classification for Global SDG Indicators. Technical Report. 2025. Available online: https://unstats.un.org/sdgs/iaeg-sdgs/tier-classification/ (accessed on 22 May 2025).
  11. United Nations ESCAP. Geospatial Information and the 2030 Agenda for Sustainable Development. Technical Report. Available online: https://repository.unescap.org/server/api/core/bitstreams/13280a24-305b-44f5-899d-b7d65173a4b8/content (accessed on 22 May 2025).
  12. United Nations ESCWA. Integration of Geospatial Information with Statistical Information in Support of the SDG Indicators. 2021. Available online: https://www.unescwa.org/sites/default/files/pubs/pdf/integration-geospatial-information-statistical-sdg-indicators-english_2.pdf (accessed on 22 May 2025).
  13. Inter-agency and Expert Group on the Sustainable Development Goals (United Nations). The SDGs Geospatial Roadmap (English); UN-GGIM: New York, NY, USA, 2022; Available online: https://ecosoc.un.org/en/node/19594 (accessed on 22 May 2025).
  14. Brovelli, M.A.; Codrina, M.I.; Coetzee, S. Openness and Community Geospatial Science for Monitoring SDGs—An Example From Tanzania. In Sustainable Development Goals Connectivity Dilemma; CRC Press: Boca Raton, FL, USA, 2019; Available online: https://www.taylorfrancis.com/books/oa-edit/10.1201/9780429290626/sustainable-development-goals-connectivity-dilemma-abbas-rajabifard?refId=7602ecb9-37e7-4de2-926f-241a555ceb9e&context=ubx (accessed on 22 May 2025).
  15. UN GGIM: Europe Working Group B, Cetl, V. The Territorial Dimension in SDG Indicators: Geospatial Data Analysis and Its Integration with Statistical Data; Instituto Nacional de Estatística: Lisbon, Portugal, 2019. Available online: https://un-ggim-europe.org/wp-content/uploads/2019/05/UN_GGIM_08_05_2019-The-territorial-dimension-in-SDG-indicators-Final.pdf (accessed on 22 May 2025).
  16. Herfort, B.; Lautenbach, S.; Porto De Albuquerque, J.; Anderson, J.; Zipf, A. The evolution of humanitarian mapping within the OpenStreetMap community. Sci. Rep. 2021, 11, 3037. [Google Scholar] [CrossRef]
  17. Lämmerhirt, D.; Gray, J.; Venturini, T.; Meunier, A. Advancing Sustainability Together? Citizen-Generated Data and the Sustainable Development Goals; SSRN Electronic Journal: Rochester, NY, USA, 2018. [Google Scholar] [CrossRef]
  18. Fraisl, D.; Campbell, J.; See, L.; Wehn, U.; Wardlaw, J.; Gold, M.; Moorthy, I.; Arias, R.; Piera, J.; Oliver, J.L.; et al. Mapping citizen science contributions to the UN sustainable development goals. Sustain. Sci. 2020, 15, 1735–1751. [Google Scholar] [CrossRef]
  19. West, S.; Pateman, R. How Could Citizen Science Support the Sustainable Development Goals? Stockholm Environment Institute: Stockholm, Sweden, 2017; Available online: https://www.sei.org/mediamanager/documents/Publications/SEI-2017-PB-citizen-science-sdgs.pdf (accessed on 22 May 2025).
  20. Oxford English Dictionary. Citizen Science, n. Meanings, Etymology and More|Oxford English Dictionary. Available online: https://www.oed.com/dictionary/citizen-science_n (accessed on 19 January 2025).
  21. Haklay, M.M.; Dörler, D.; Heigl, F.; Manzoni, M.; Hecker, S.; Vohland, K. What Is Citizen Science? The Challenges of Definition. In The Science of Citizen Science; Vohland, K., Land-Zandstra, A., Ceccaroni, L., Lemmens, R., Perelló, J., Ponti, M., Samson, R., Wagenknecht, K., Eds.; Springer International Publishing: Cham, Switzerland, 2021; pp. 13–33. [Google Scholar] [CrossRef]
  22. Goodchild, M.F. Citizens as sensors: The world of volunteered geography. GeoJournal 2007, 69, 211–221. [Google Scholar] [CrossRef]
  23. Goodchild, M.; Glennon, J. Crowdsourcing geographic information for disaster response: A research frontier. Int. J. Digit. Earth 2010, 3, 231–241. [Google Scholar] [CrossRef]
  24. Gulnerman, A.G.; Senel, M.; Gokduman, O.D. Comparing two crowdsourcing platforms: Assessing their potential for mapping Antarctica. Earth Sci. Inform. 2024, 17, 4655–4673. [Google Scholar] [CrossRef]
  25. Senaratne, H.; Mobasheri, A.; Ali, A.L.; Capineri, C.; Haklay, M.M. A review of volunteered geographic information quality assessment methods. Int. J. Geogr. Inf. Sci. 2017, 31, 139–167. [Google Scholar] [CrossRef]
  26. See, L.; Mooney, P.; Foody, G.; Bastin, L.; Comber, A.; Estima, J.; Fritz, S.; Kerle, N.; Jiang, B.; Laakso, M.; et al. Crowdsourcing, Citizen Science or Volunteered Geographic Information? The Current State of Crowdsourced Geographic Information. ISPRS Int. J. Geo-Inf. 2016, 5, 55. [Google Scholar] [CrossRef]
  27. Degrossi, L.C.; Porto de Albuquerque, J.; Dos Santos Rocha, R.; Zipf, A. A taxonomy of quality assessment methods for volunteered and crowdsourced geographic information. Trans. GIS 2018, 22, 542–560. [Google Scholar] [CrossRef]
  28. Brandusescu, A.; Sieber, R.E.; Jochems, S. Confronting the hype: The use of crisis mapping for community development. Converg. Int. J. Res. into New Media Technol. 2016, 22, 616–632. [Google Scholar] [CrossRef]
  29. Johns, F. #Help: Digital Humanitarianism and the Remaking of International Order; Oxford University Press: Oxford, UK, 2023. [Google Scholar]
  30. Cinnamon, J. Humanitarian Mapping. In International Encyclopedia of Human Geography, 2nd ed.; Kobayashi, A., Ed.; Elsevier: Oxford, UK, 2020; pp. 121–128. [Google Scholar] [CrossRef]
  31. Štampach, R.; Herman, L.; Trojan, J.; Tajovská, K.; Řezník, T. Humanitarian Mapping as a Contribution to Achieving Sustainable Development Goals: Research into the Motivation of Volunteers and the Ideal Setting of Mapathons. Sustainability 2021, 13, 13991. [Google Scholar] [CrossRef]
  32. Taft-Morales, M. Haiti Earthquake: Crisis and Response; Congressional Research Service: Washington, DC, USA, 2010. Available online: https://sgp.fas.org/crs/row/R41023.pdf (accessed on 22 May 2025).
  33. Meier, P. Digital Humanitarians: How Big Data Is Changing the Face of Humanitarian Response; CRC Press: Boca Raton, FL, USA; Routledge: New York, NY, USA, 2015; Available online: https://www.taylorfrancis.com/books/mono/10.1201/b18023/digital-humanitarians-patrick-meier (accessed on 22 May 2025).
  34. Kankanamge, N.; Yigitcanlar, T.; Goonetilleke, A.; Kamruzzaman, M. Can volunteer crowdsourcing reduce disaster risk? A systematic review of the literature. Int. J. Disaster Risk Reduct. 2019, 35, 101097. [Google Scholar] [CrossRef]
  35. Solís, P.; McCusker, B.; Menkiti, N.; Cowan, N.; Blevins, C. Engaging global youth in participatory spatial data creation for the UN sustainable development goals: The case of open mapping for malaria prevention. Appl. Geogr. 2018, 98, 143–155. [Google Scholar] [CrossRef]
  36. Nilashi, M.; Boon, O.K.; Tan, G.; Lin, B.; Abumalloh, R. Critical Data Challenges in Measuring the Performance of Sustainable Development Goals: Solutions and the Role of Big-Data Analytics. Harv. Data Sci. Rev. 2023, 5, 1–36. [Google Scholar] [CrossRef]
  37. Yin, Y.; Guo, L.; Thebault-Spieker, J. Productivity or Equity? Tradeoffs in Volunteer Microtasking in Humanitarian OpenStreetMap. Proc. ACM-Hum.-Comput. Interact. 2024, 8, 1–34. [Google Scholar] [CrossRef]
  38. United Nations Office for Disaster Risk Reduction. Global Assessment Report on Disaster Risk Reduction 2022: Our World at Risk: Transforming Governance for a Resilient Future; Technical Report; United Nations: Geneva, Switzerland, 2022; Available online: https://www.undrr.org/gar/gar2022-our-world-risk-gar#container-downloads (accessed on 22 May 2025).
  39. Aitsi-Selmi, A. Reflections on a science and technology agenda for 21st century disaster risk reduction: Based on the scientific content of the 2016 UNISDR science and technology conference on the implementation of the sendai framework for disaster risk reduction 2015–2020. Int. J. Disaster Risk Sci. 2016, 7, 1–29. [Google Scholar] [CrossRef]
  40. Gaspari, F.; Stucchi, L.; Bratic, G.; Jovanovic, D.; Ponti, C.; Biagi, L.G.A.; Brovelli, M.A. Innovation in Teaching: The Polimappers Collaborative and Humanitarian Mapping Course at Politecnico Di Milano. Int. Arch. Photogramm. Remote Sens. Spat. Inf. Sci. 2021, 46, 63–69. [Google Scholar] [CrossRef]
  41. Solís, P.; Rajagopalan, S.; Villa, L.; Mohiuddin, M.B.; Boateng, E.; Wavamunno Nakacwa, S.; Peña Valencia, M.F. Digital humanitarians for the Sustainable Development Goals: YouthMappers as a hybrid movement. J. Geogr. High. Educ. 2022, 46, 80–100. [Google Scholar] [CrossRef]
  42. Radford, T.; Kateregga, G.; Machmud, H.; Redhead, C.; Mwanja, I. Youth and Humanitarian Action: Open Mapping Partnerships for Disaster Response and the SDGs. In Open Mapping Towards Sustainable Development Goals; Solís, P., Zeballos, M., Eds.; Sustainable Development Goals Series; Springer International Publishing: Cham, Switzerland, 2023; pp. 345–355. [Google Scholar] [CrossRef]
  43. Albuquerque, J.P.d.; Herfort, B.; Eckle, M. The Tasks of the Crowd: A Typology of Tasks in Geographic Information Crowdsourcing and a Case Study in Humanitarian Mapping. Remote Sens. 2016, 8, 859. [Google Scholar] [CrossRef]
  44. HOT. HOT Tasking Manager. Available online: https://tasks.hotosm.org (accessed on 20 January 2025).
  45. MapSwipe. Available online: https://mapswipe.org/en/ (accessed on 20 January 2025).
  46. Ushahidi. About Ushahidi. Available online: https://www.ushahidi.com/about/our-story/ (accessed on 20 January 2025).
  47. Ittoo, A.; Nguyen, L.M.; van den Bosch, A. Text analytics in industry: Challenges, desiderata and trends. Comput. Ind. 2016, 78, 96–107. [Google Scholar] [CrossRef]
  48. Han, J.; Kamber, M.; Pei, J. (Eds.) 2—Getting to Know Your Data. In Data Mining, 3rd ed.; The Morgan Kaufmann Series in Data Management Systems; Morgan Kaufmann: Boston, MA, USA, 2012; pp. 39–82. [Google Scholar] [CrossRef]
  49. Remote Mapping in Malawi: Supporting Field Operations. Available online: https://www.missingmaps.org/blog/2023/06/02/Malawi-MSF-Cholera-Cyclone-Response/ (accessed on 22 April 2025).
  50. USAID TerresEauVie Activity. 2019. Available online: https://winrock.org/projects/terreseauvie-rise-ii/ (accessed on 22 April 2025).
  51. Schott, M.; Lautenbach, S.; Größchen, L.; Zipf, A. Openstreetmap Element Vectorisation—A Tool For High Resolution Data Insights And Its Usability in the Land-Use and Land-Cover Domain. Int. Arch. Photogramm. Remote Sens. Spat. Inf. Sci. 2022; XLVIII-4-W1-2022, 395–402. [Google Scholar] [CrossRef]
  52. Monitoring Forest Change—El Carmen (1)|MapSwipe. Available online: https://mapswipe.org/en/projects/-NhbfISzxa2V8cpZSRap/ (accessed on 22 May 2025).
  53. Ruzindana, E.; Gaspari, F.; Ntakobangize, E.; Ponti, C.; Biraghi, C.A.; Kilsedar, C.E.; Tadi, M.; Muindi, Z.; Agenga, P.; Mugeha, L. Open Data Addressing Challenges Associated with Informal Settlements in the Global South. In Open Mapping Towards Sustainable Development Goals; Solís, P., Zeballos, M., Eds.; Sustainable Development Goals Series; Springer International Publishing: Cham, Switzerland, 2023; pp. 13–27. [Google Scholar] [CrossRef]
  54. Chakraborty, A.; Wilson, B.; Sarraf, S.; Jana, A. Open data for informal settlements: Toward a user’s guide for urban managers and planners. J. Urban Manag. 2015, 4, 74–91. [Google Scholar] [CrossRef]
Figure 1. Humanitarian mapping in the SDG data flow model (source: [7], reworked by authors). From the bottom to the top, the three stages of the data flow: Data inputs, national data integration, and global output and reporting. HM contribution is in other sources of data, which is highlighted in blue.
Ijgi 14 00307 g001
Figure 2. Methodological workflow of this study. The vertical axis represents the two main aspects of this paper: (A) the SDG indicator analysis, and (B) the HM projects. The horizontal axis represents the three processes of the study: (I) pre-processing—definitions and framework preparation; (II) analysis—data extraction and investigation; (III) synthesis—mapping data to reveal findings. The numbers of the boxes from 1 to 7 indicate the sequential methodological components implemented across both analytical dimensions.
Ijgi 14 00307 g002
Figure 3. The filtering process consists of three sequential steps. Firstly, the recentness of the project is considered. Secondly, its contribution is evaluated. Finally, its uniqueness is taken into account. Data that has passed is shown in blue, while data that has not passed is shown in red.
Ijgi 14 00307 g003
Figure 4. The potential for HM contributions to the SDGs (source: generated by the authors; see more in Table A1). Vertical axis represents the goals, and horizontal axis is the number of each indicator. In each goal there are three adjacent columns with the colors dark blue (HM-I), light blue (HM-E), and light red (not affected by HM approaches). The hatches represent data availability: crossed hatch for tier I, diagonal stripe for the mixture of tier I and tier II, and solid for tier II.
Ijgi 14 00307 g004
Figure 5. The SDG contributions of three HM approaches: digitization, classification, and conflation. For each chart, the horizontal axis represents the goals and the vertical axis represents the number of indicators involved in each approach.
Ijgi 14 00307 g005
Figure 6. Geographical distribution of the recent non-duplicated projects of three HM platforms: HOT-TM, MapSwipe, Ushahidi.
Ijgi 14 00307 g006aIjgi 14 00307 g006b
Figure 7. Summary of the HM contributions to the SDGs. In this diagram, the horizontal axis represents the SDGs in order; the vertical axis represents GI-benefited indicators for each goal. Each indicator is represented as a square, in which the fill color is categorized into one of three groups based on the contributive potential of HM. Indicators with realized projects are highlighted with a red border and a symbol in the center, representing the platform on which the project(s) exist.
Ijgi 14 00307 g007
Figure 8. Geographical distribution of recent non-duplicated HM projects with (a) introduced indicators (296 projects), (b) exclusive indicators (23 projects), (c) low-data-availability indicators (21 projects).
Ijgi 14 00307 g008aIjgi 14 00307 g008b
Figure 9. Screenshot of the web application for monitoring HM contributions to the SDGs. Each column represents one goal. In each row, the corresponding indicators are put in numerical order. The blank cells represent the indicators with no potential for HM contribution, light blue is for the indicators enhanced by HM, and dark blue is for indicators introduced by HM. The black-stroked cells represent the indicators already contributed by actual projects.
Ijgi 14 00307 g009
Table 1. A comparison of the three selected platforms in terms of accessibility, data input, project type, and contribution methods.
HOT-TMMapSwipeUshahidi
AccessibilityWeb browserWeb browser, mobile applicationWeb browser
Data sourcesSatelliteSatelliteMixed (email, news, other sources)
Project typeDigitizationClassificationConflation
Project geographic borderPredefinedPredefinedNon-defined
Project managementProjectProjectDeployment
Task unitTaskTaskPost
Task numberLimitedLimitedUnlimited
Data contributionOSMProper serverProper server
Table 2. Number of indicators contributed by HM platforms. The total number is computed considering the number of non-duplicated indicators.
PlatformIntroduced Indicators (a)Exclusive Indicators (b)Low-Data-Availability Indicators (c)Total Number of Unique Indicators
HOT-TM1111827
MapSwipe72112
Ushahidi71115
(a) Indicators that were not in GEO and IAEG-SDG-WG-GI but introduced in this study. (b) Indicators that are contributed by only one HM platform. (c) Indicators classified in tier II and tier I/II.
Disclaimer/Publisher’s Note: The statements, opinions and data contained in all publications are solely those of the individual author(s) and contributor(s) and not of MDPI and/or the editor(s). MDPI and/or the editor(s) disclaim responsibility for any injury to people or property resulting from any ideas, methods, instructions or products referred to in the content.