


Developing a Hybrid Model to Enhance the Robustness of Interpretability for Landslide Susceptibility Assessment
 ,
,
Abstract
1. Introduction
2. Materials
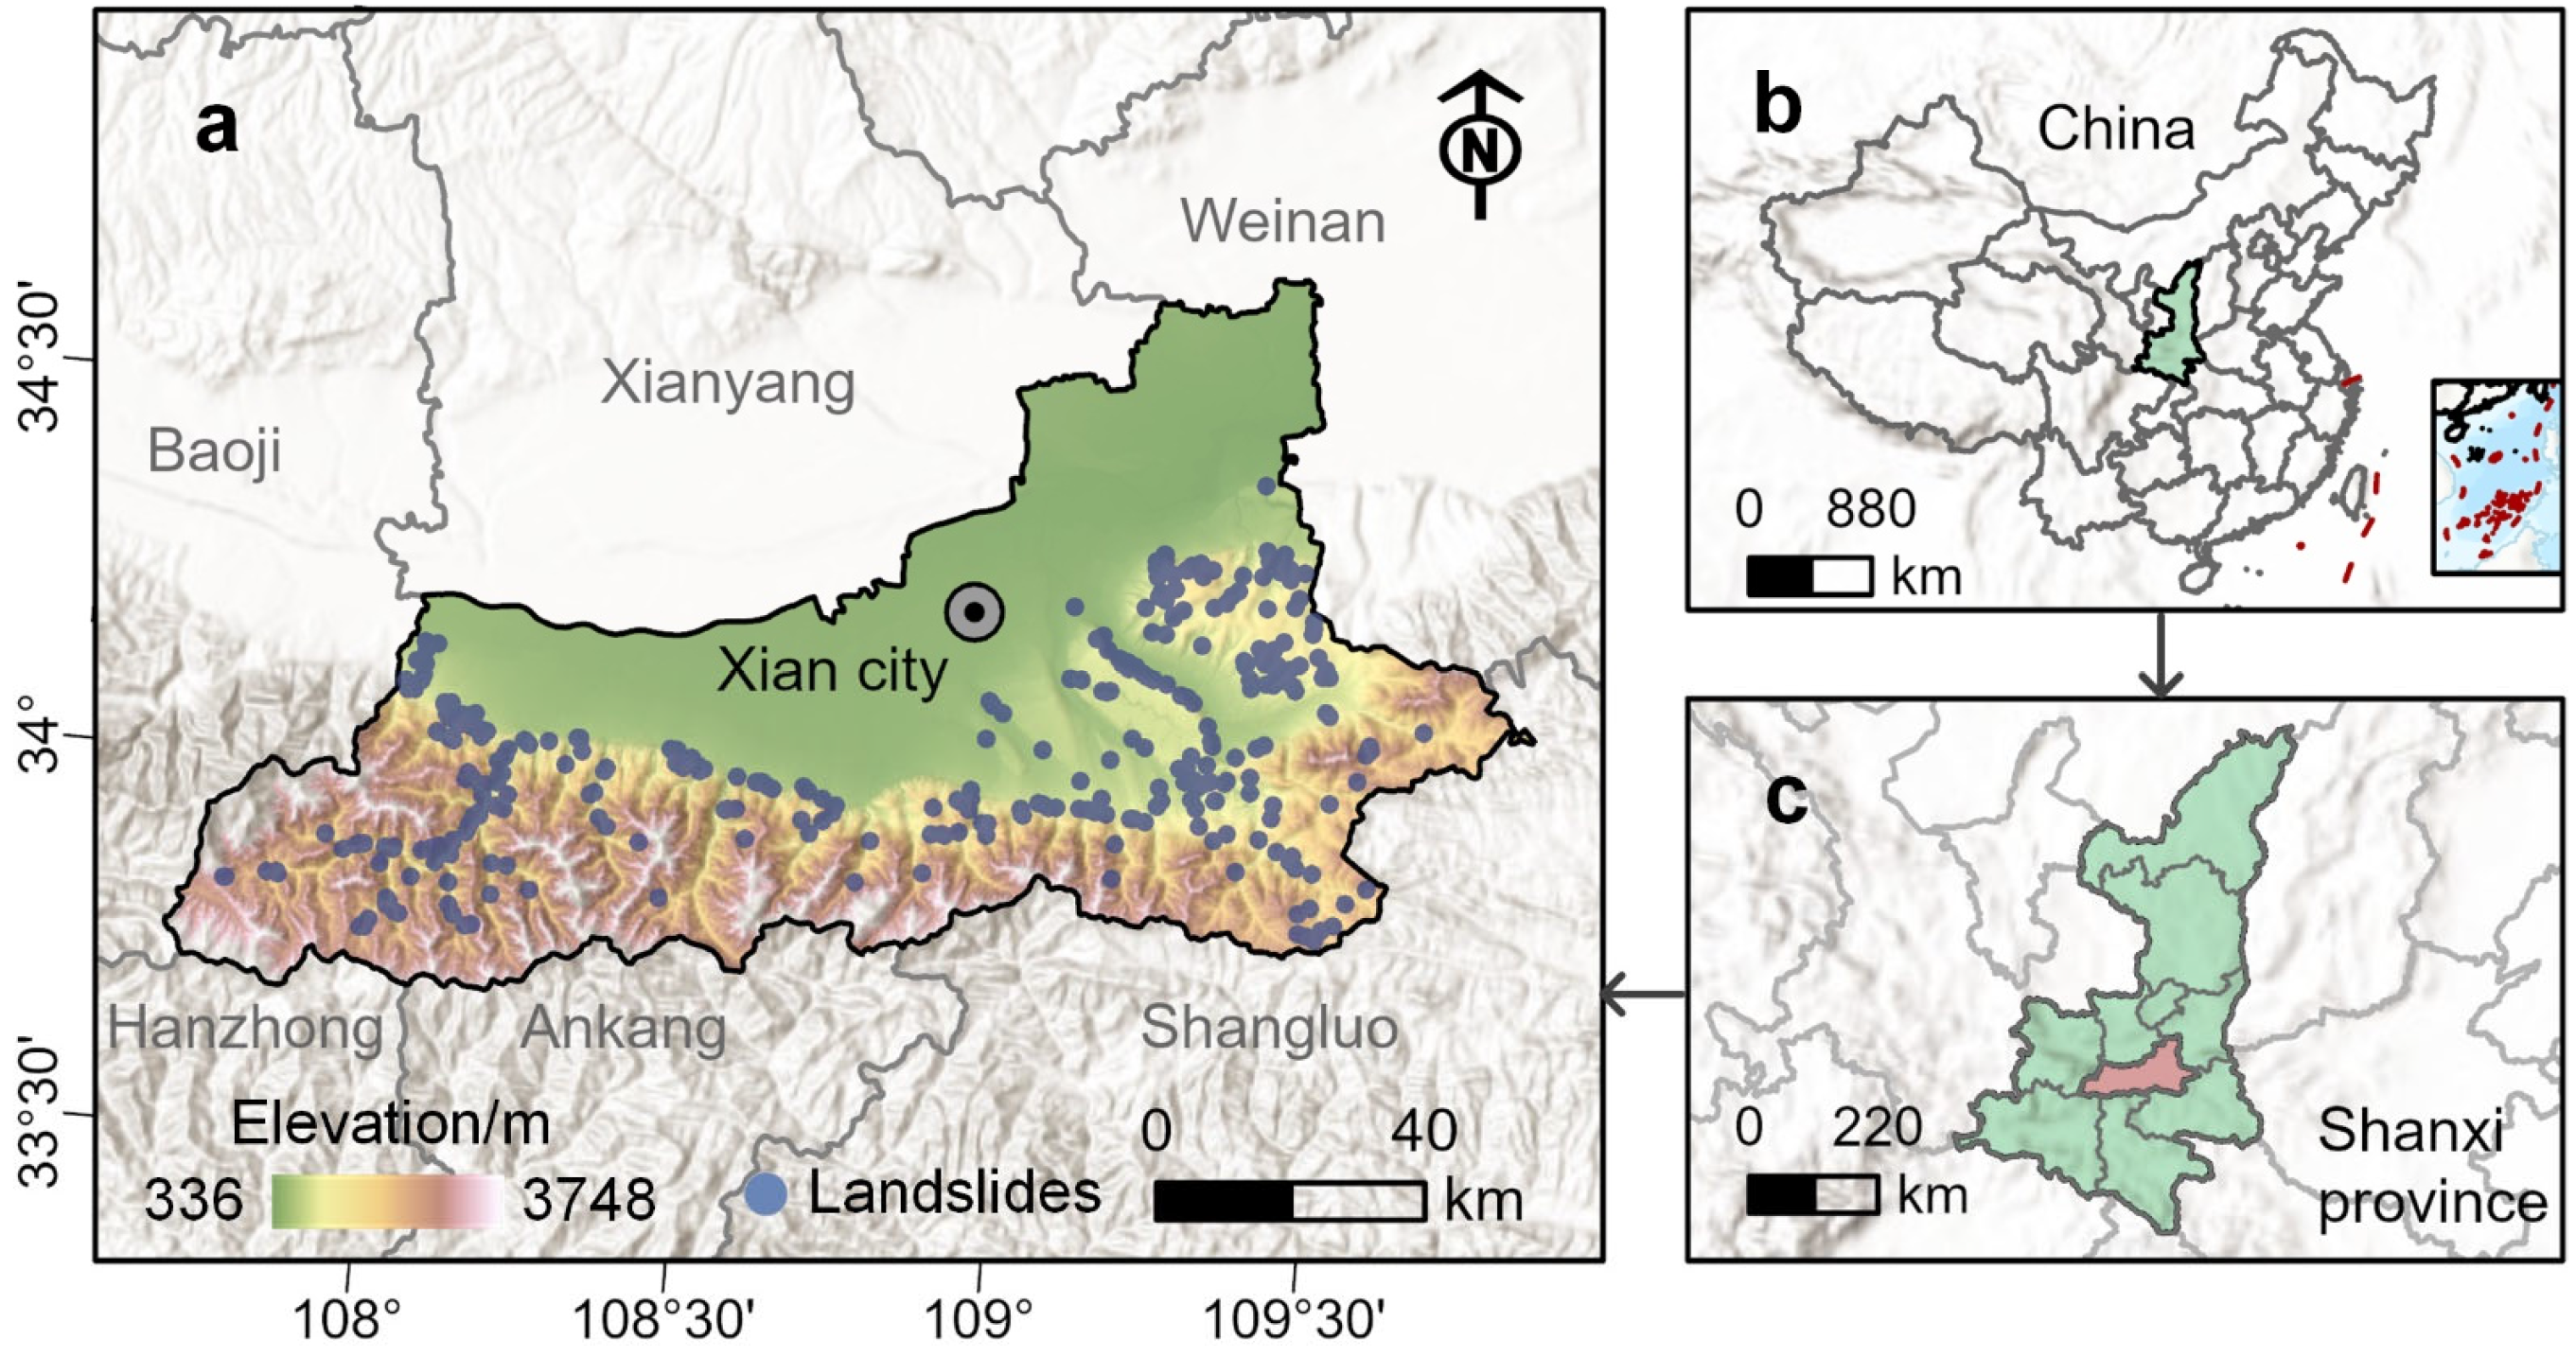
2.1. Study Area
2.2. Data
2.2.1. Landslide Inventory
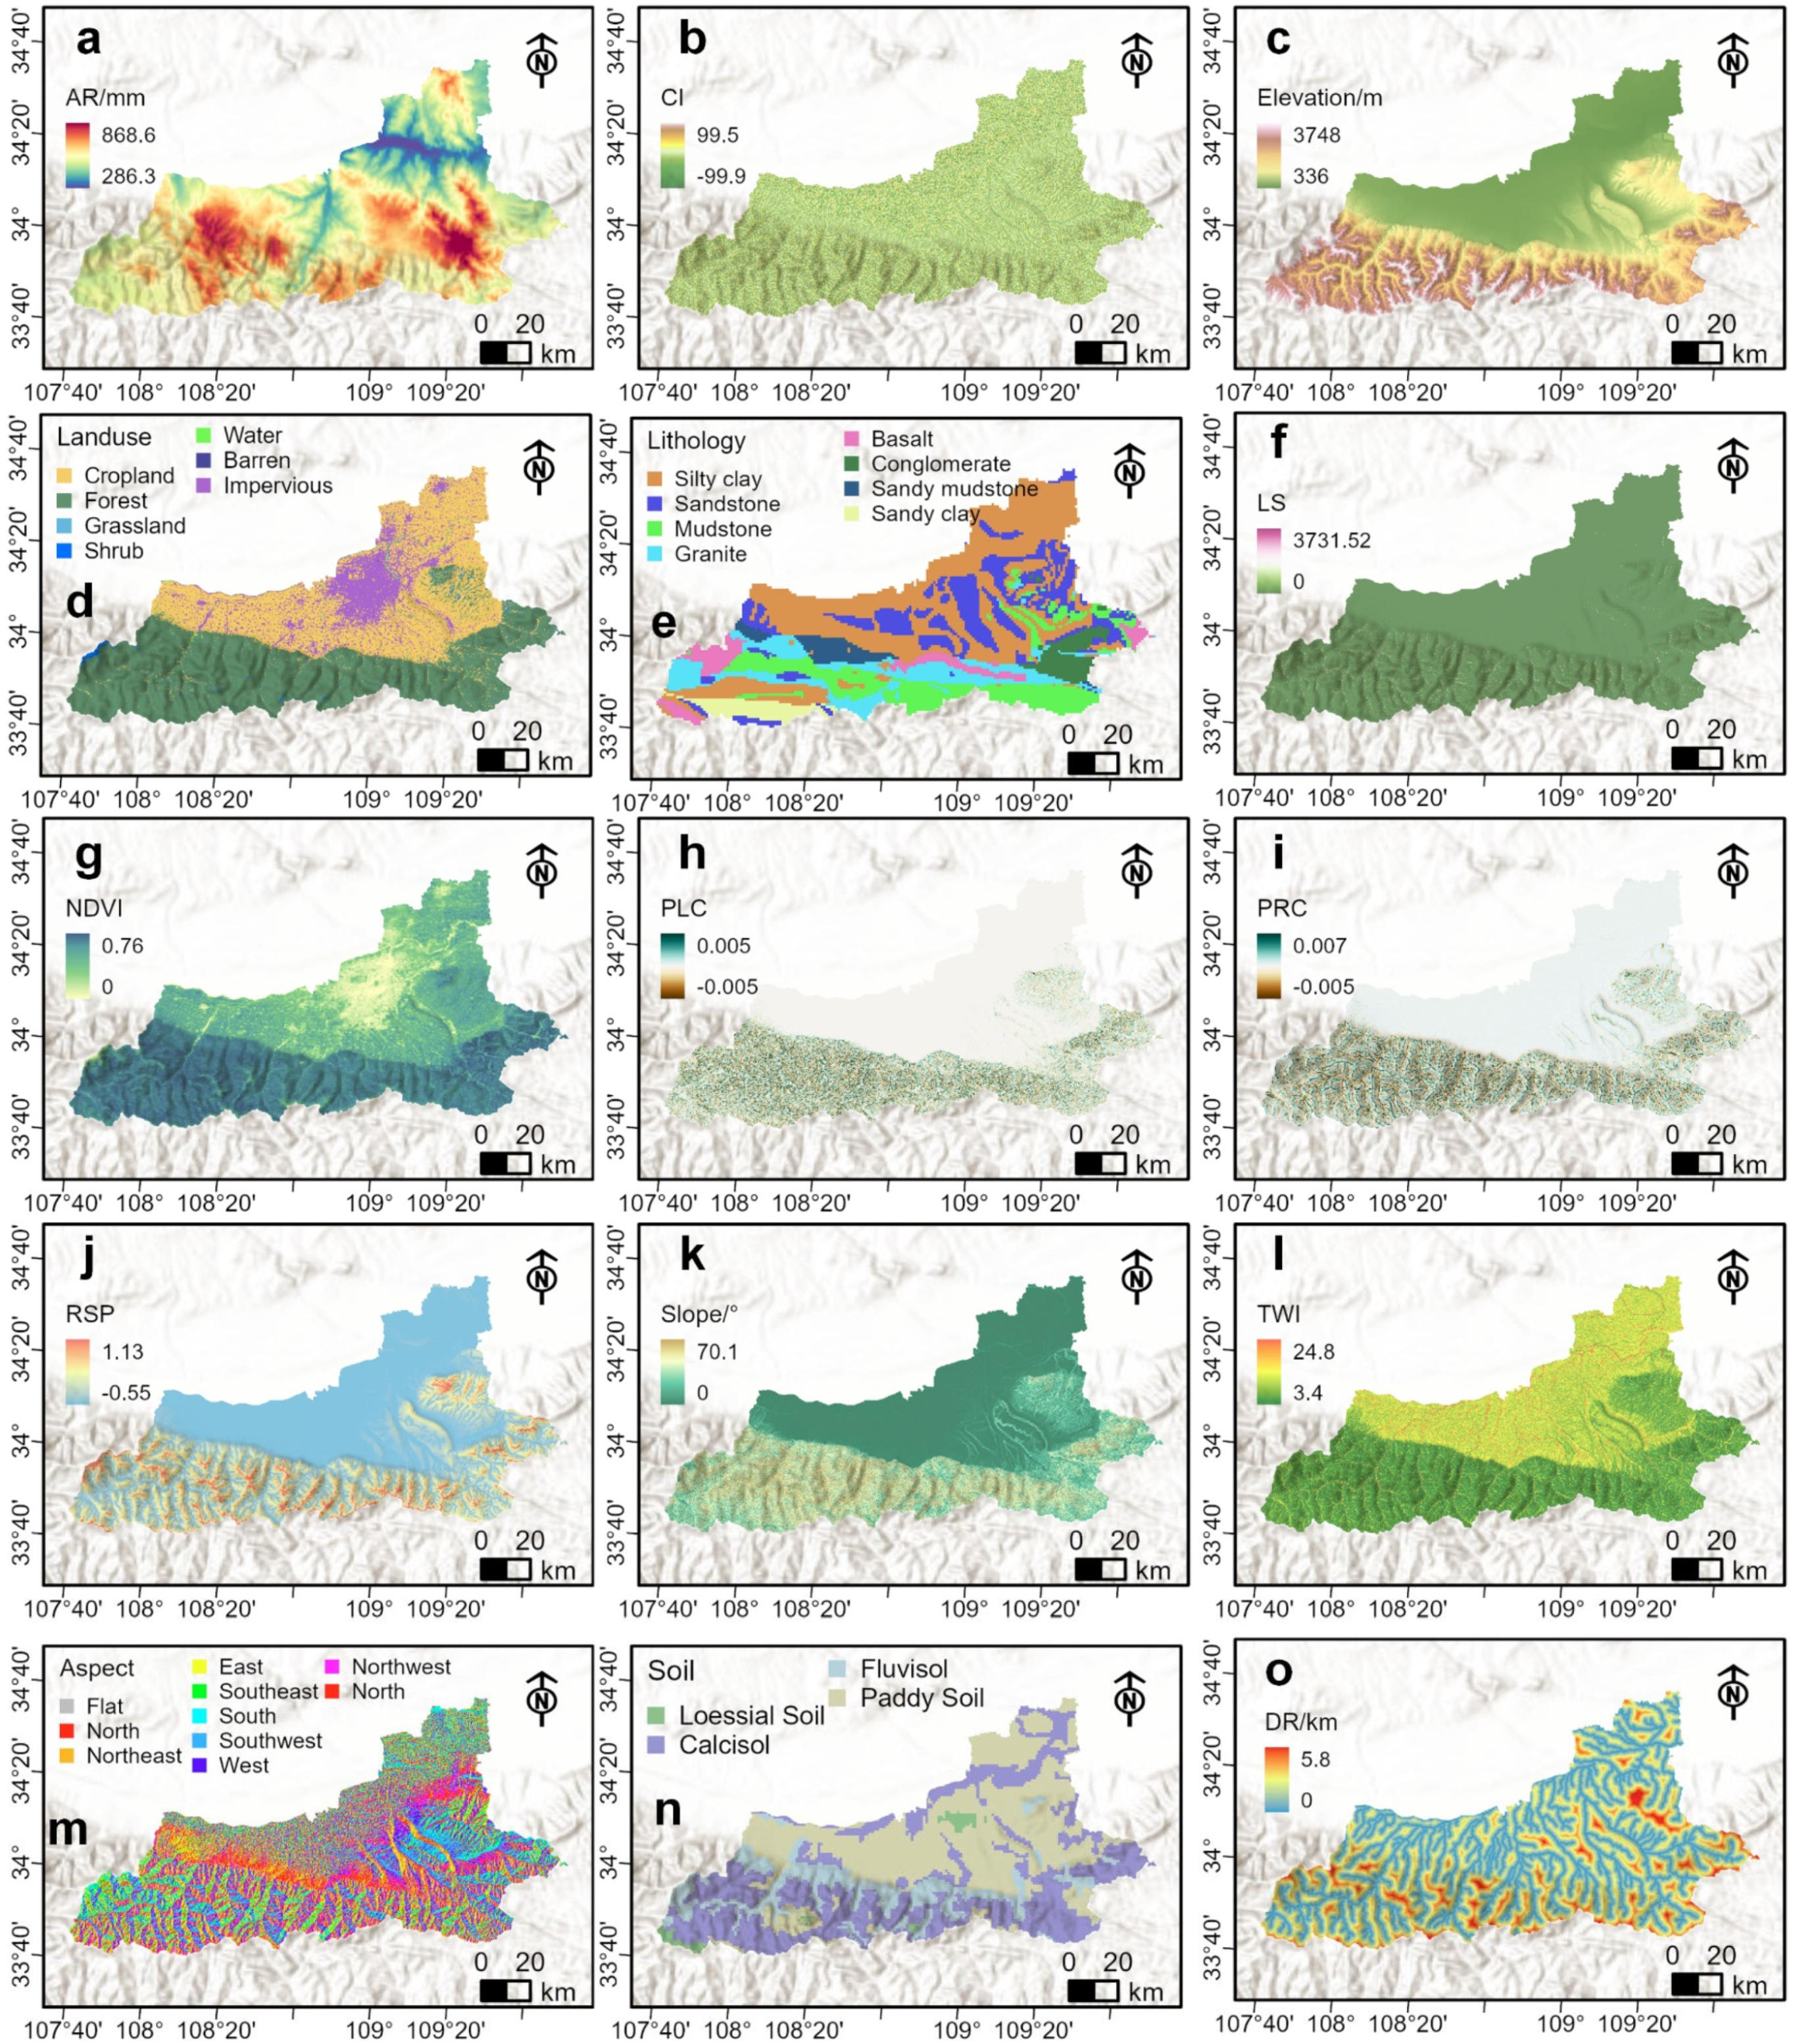
2.2.2. Landslide Conditioning Factors
3. Methodology
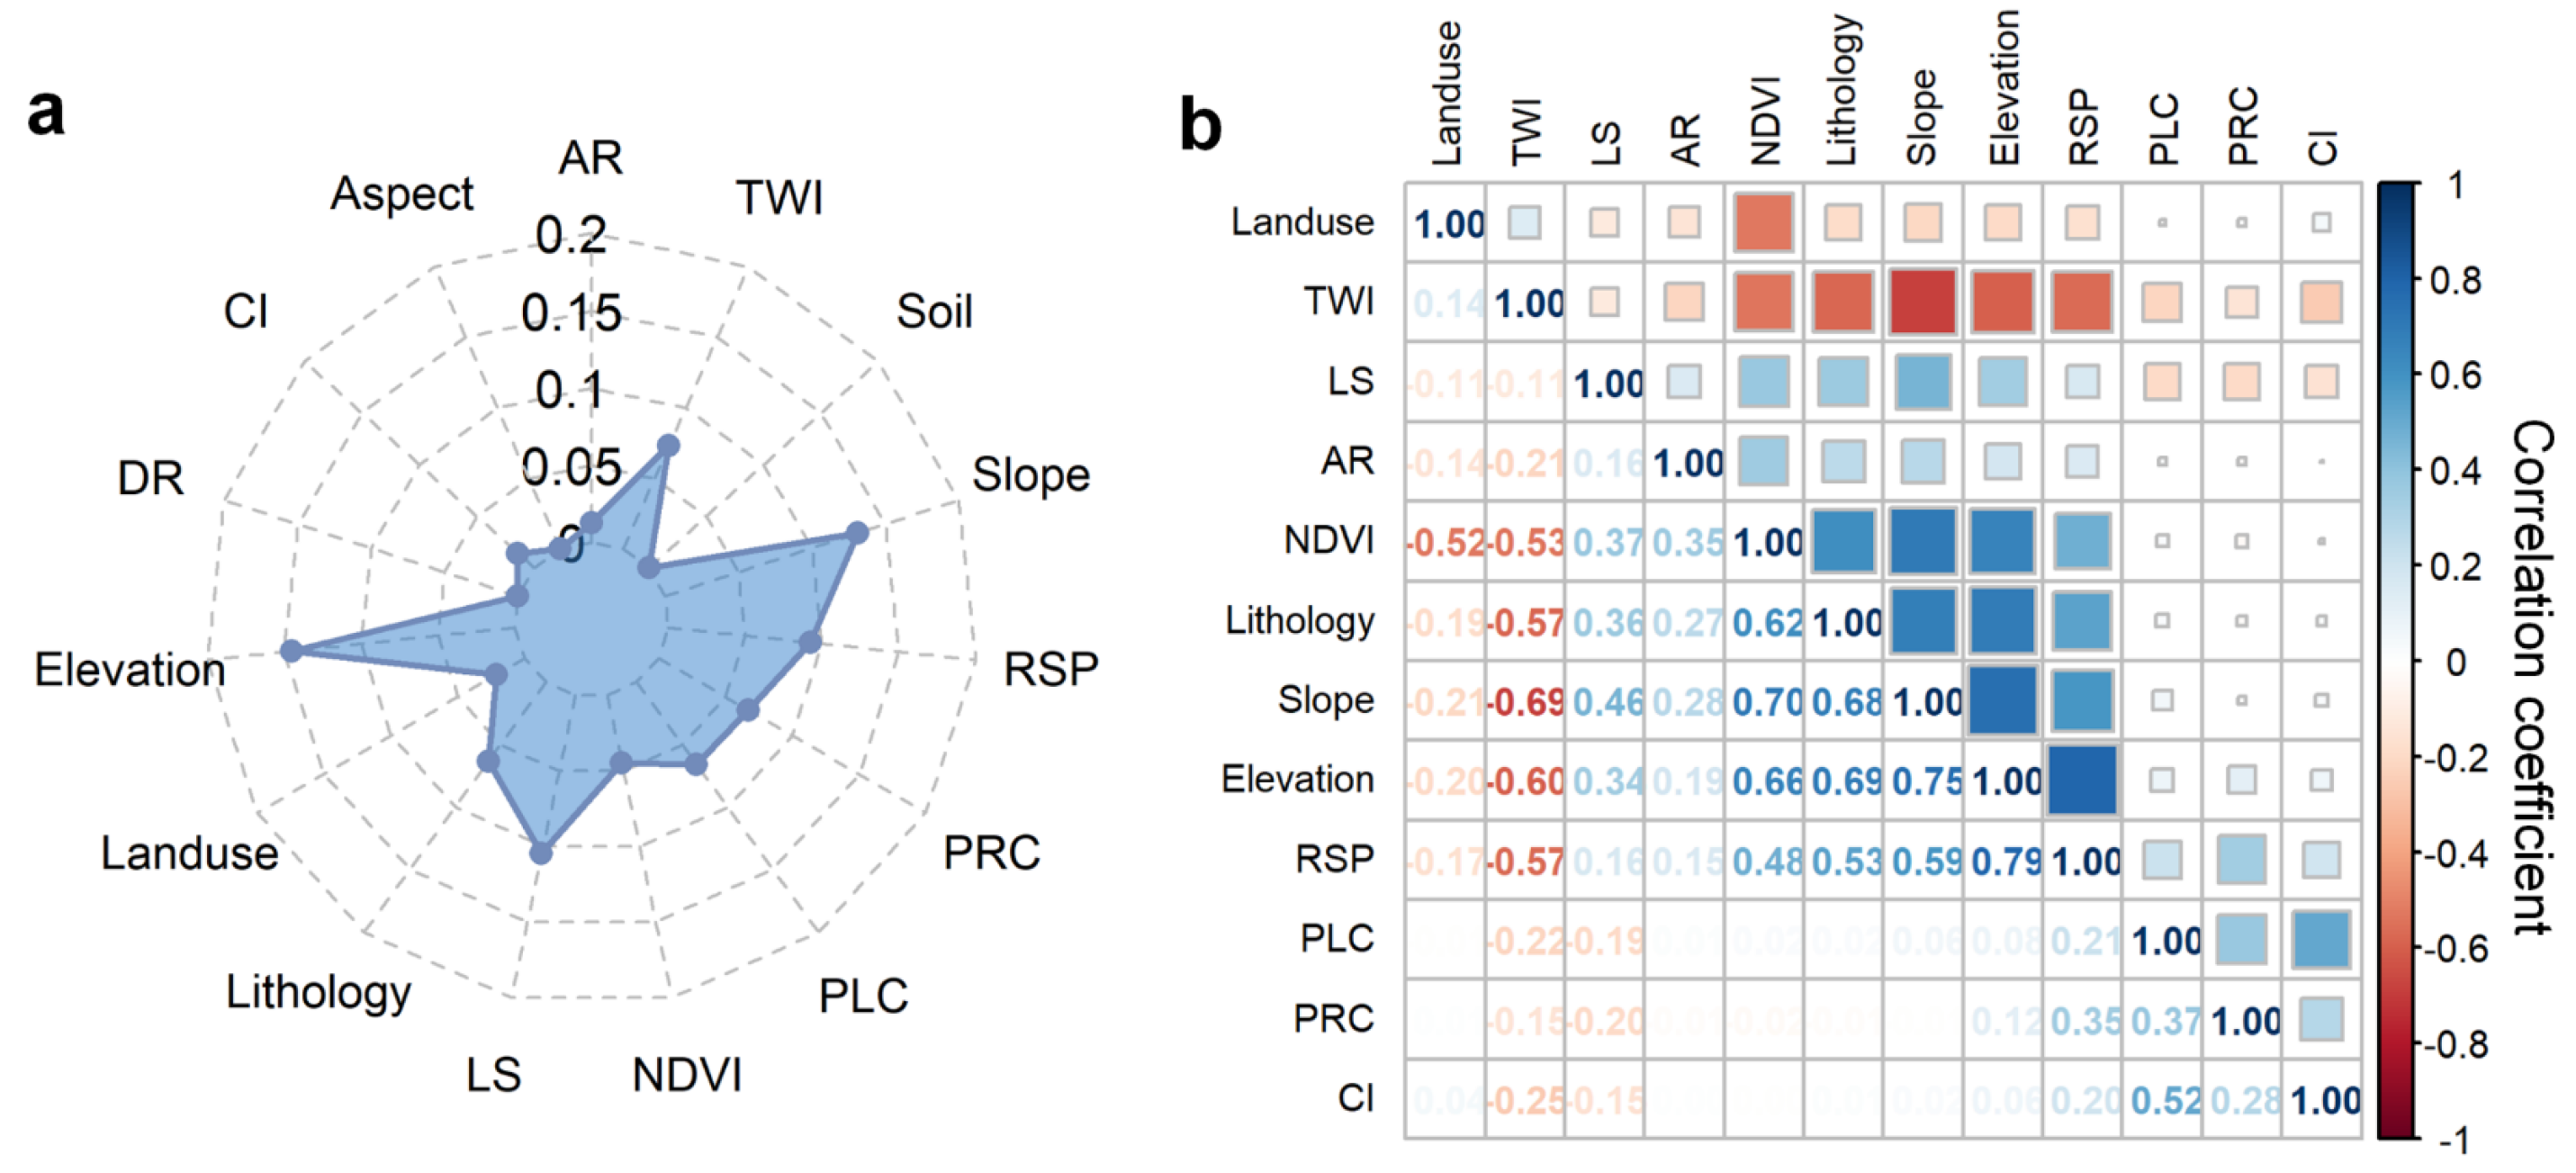
3.1. Feature Selection Methods
3.1.1. Pearson Correlation Analysis
3.1.2. Information Gain Rate
3.2. Baseline Machine Learning Models
3.2.1. LightGBM Model
3.2.2. XGBoost Model
3.2.3. Random Forest Model
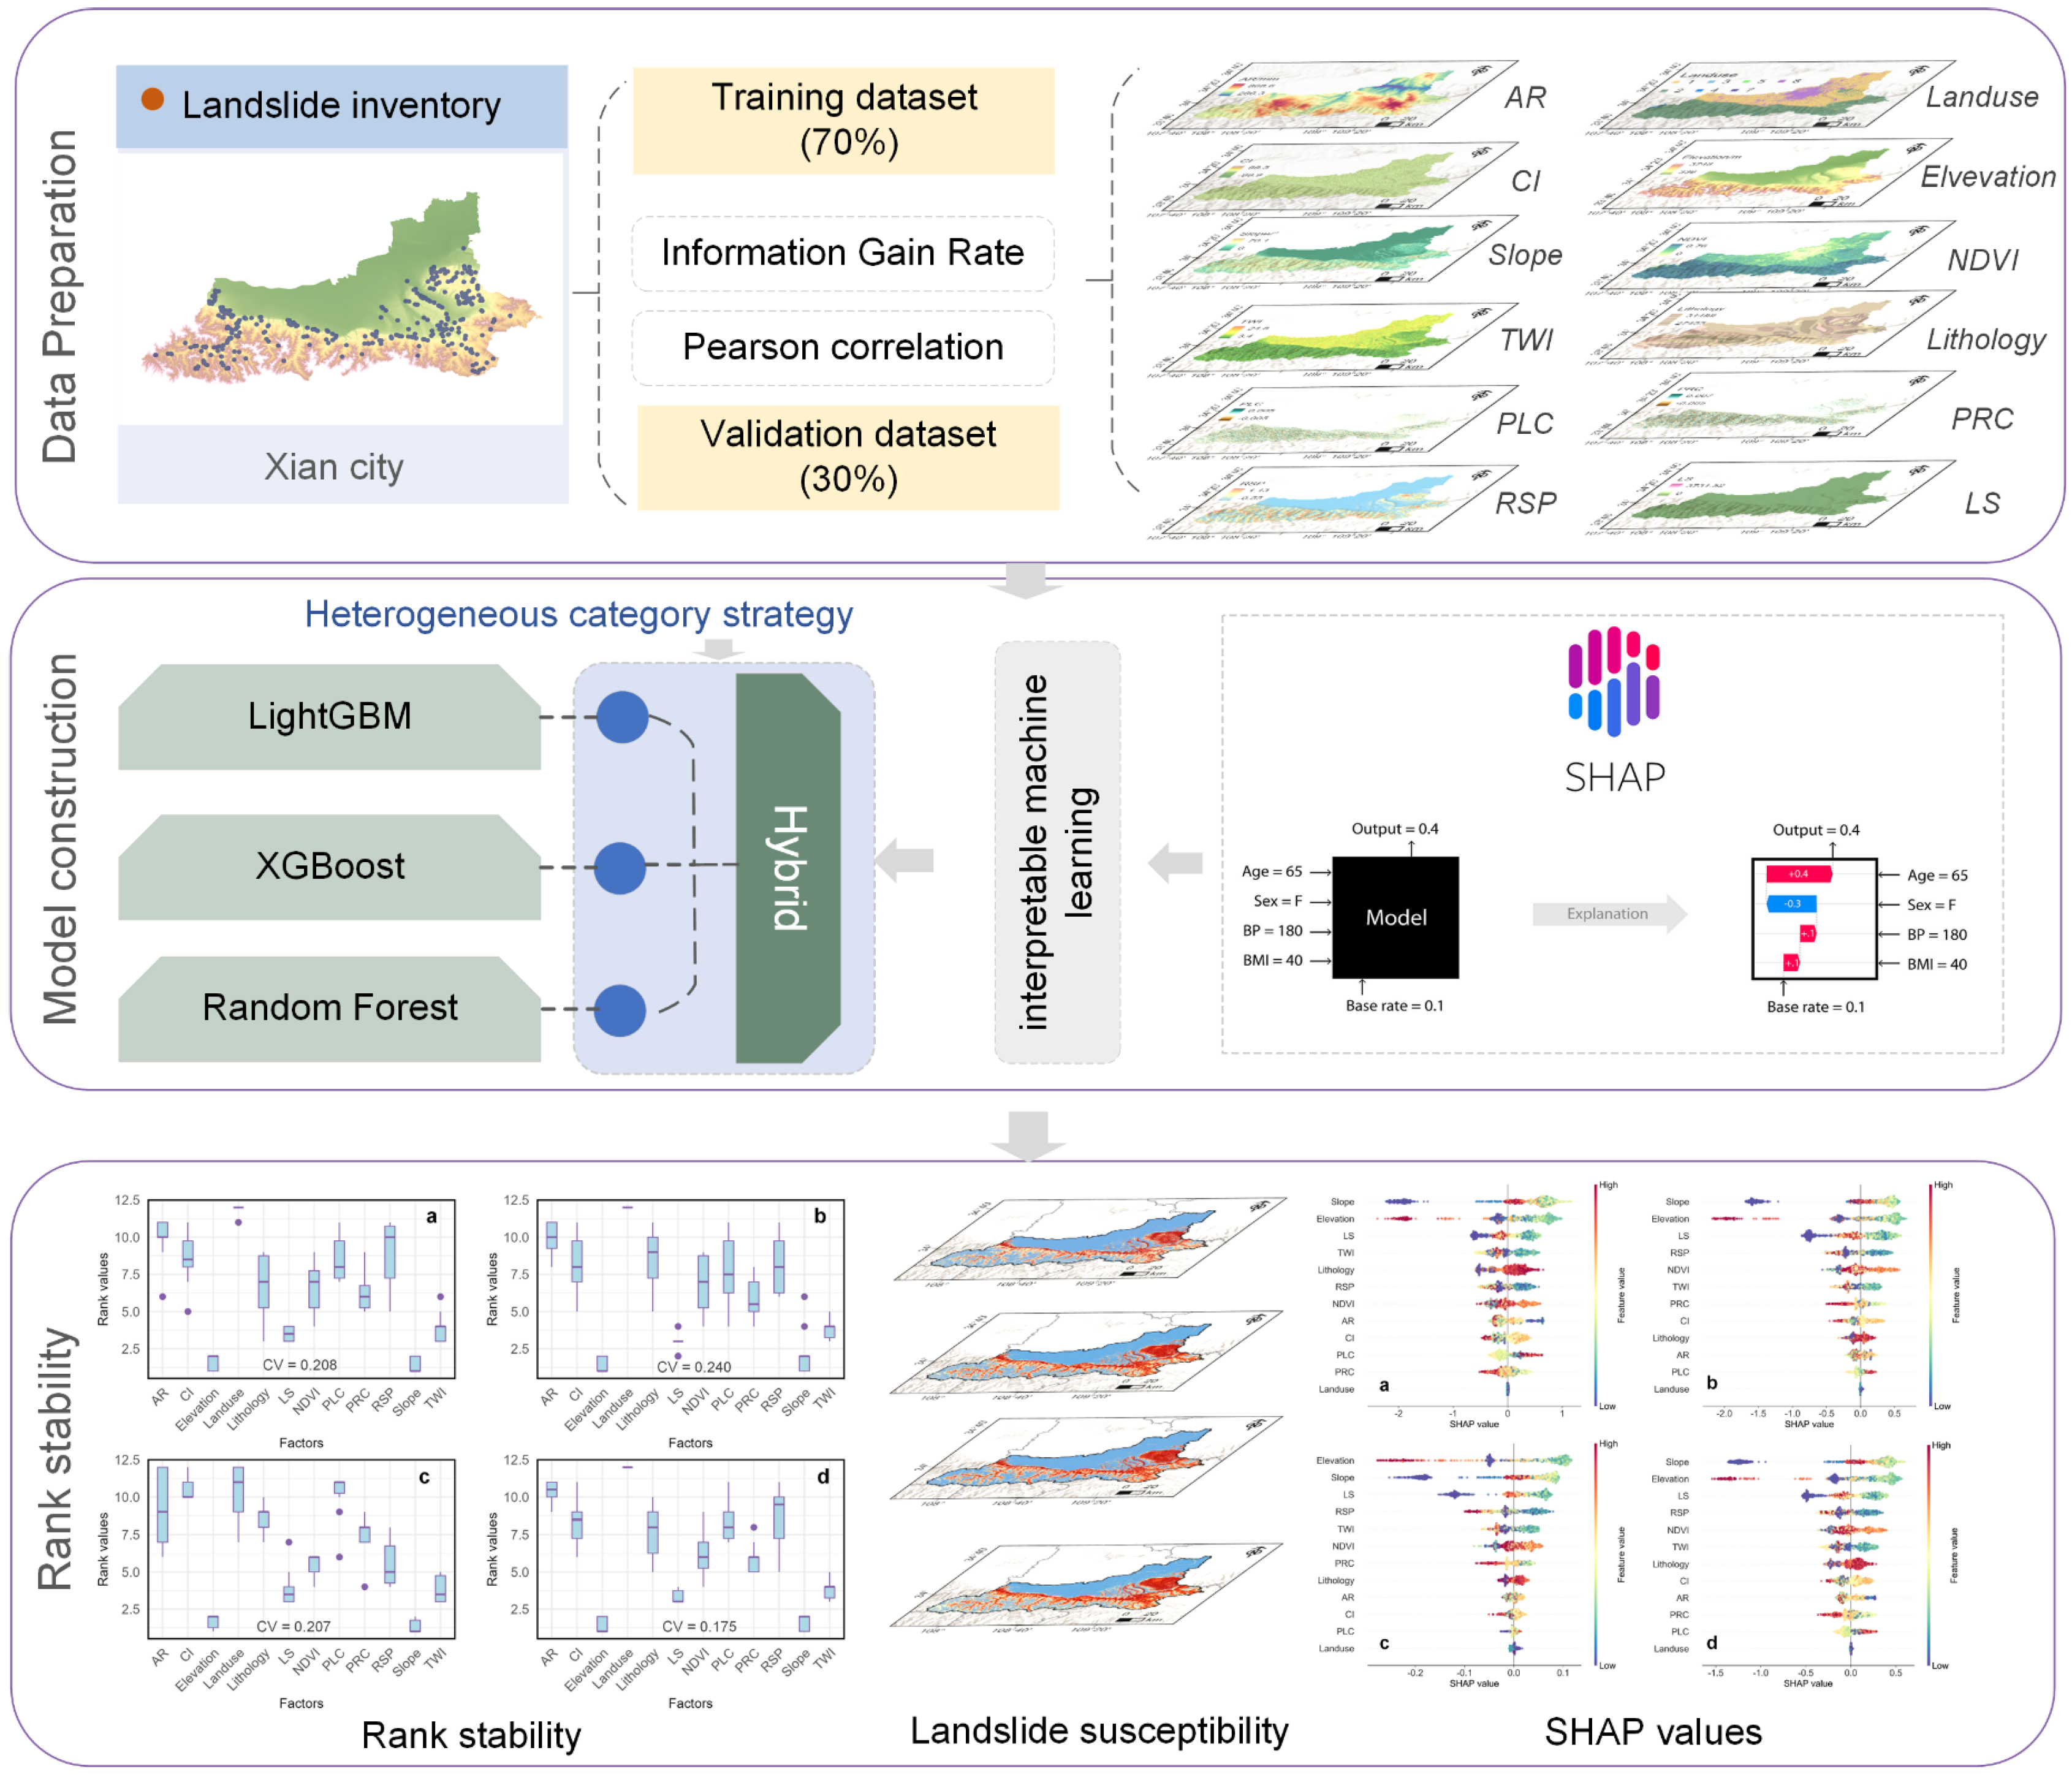
3.3. Construction of Interpretable Hybrid Model
3.3.1. Heterogeneous Category Strategy
3.3.2. Shapley Additive Explanations
3.4. The Evaluation for Model Performance and Interpretive Robustness
4. Results
4.1. Feature Selection
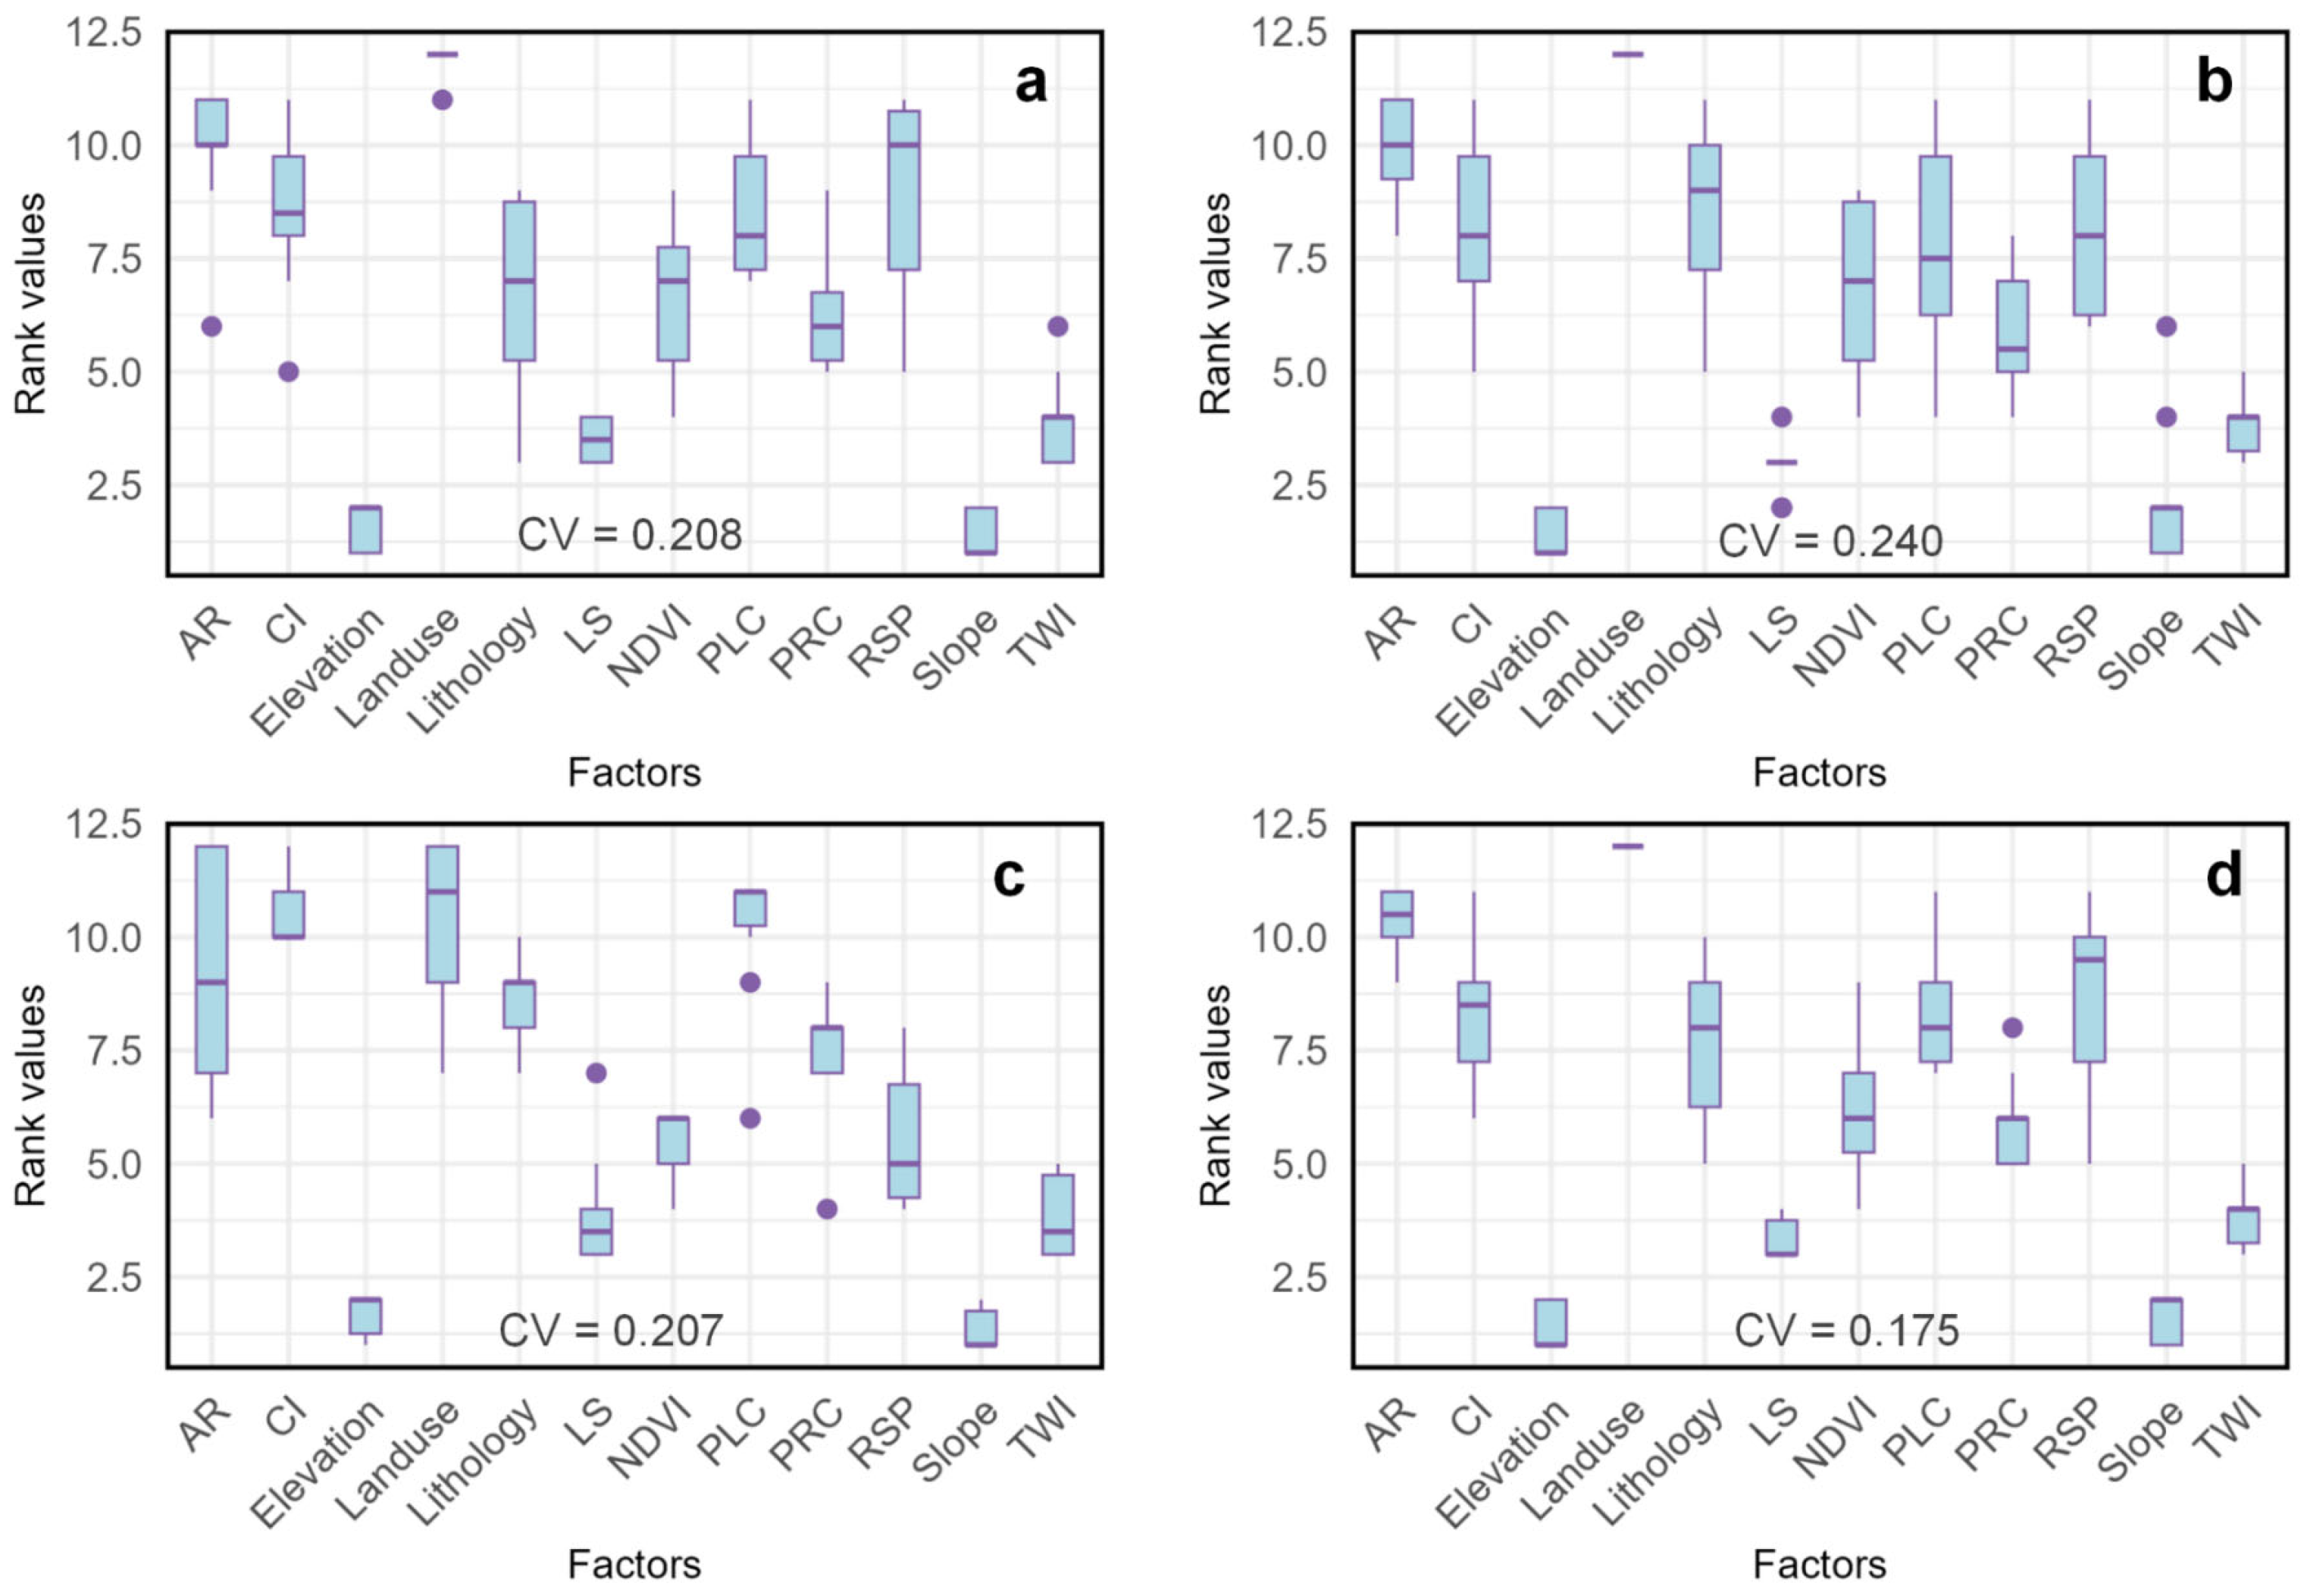
4.2. Interpretive Robustness and Model Performance
4.3. Landslide Susceptibility Mapping
4.4. Interpretation of Landslide Susceptibility
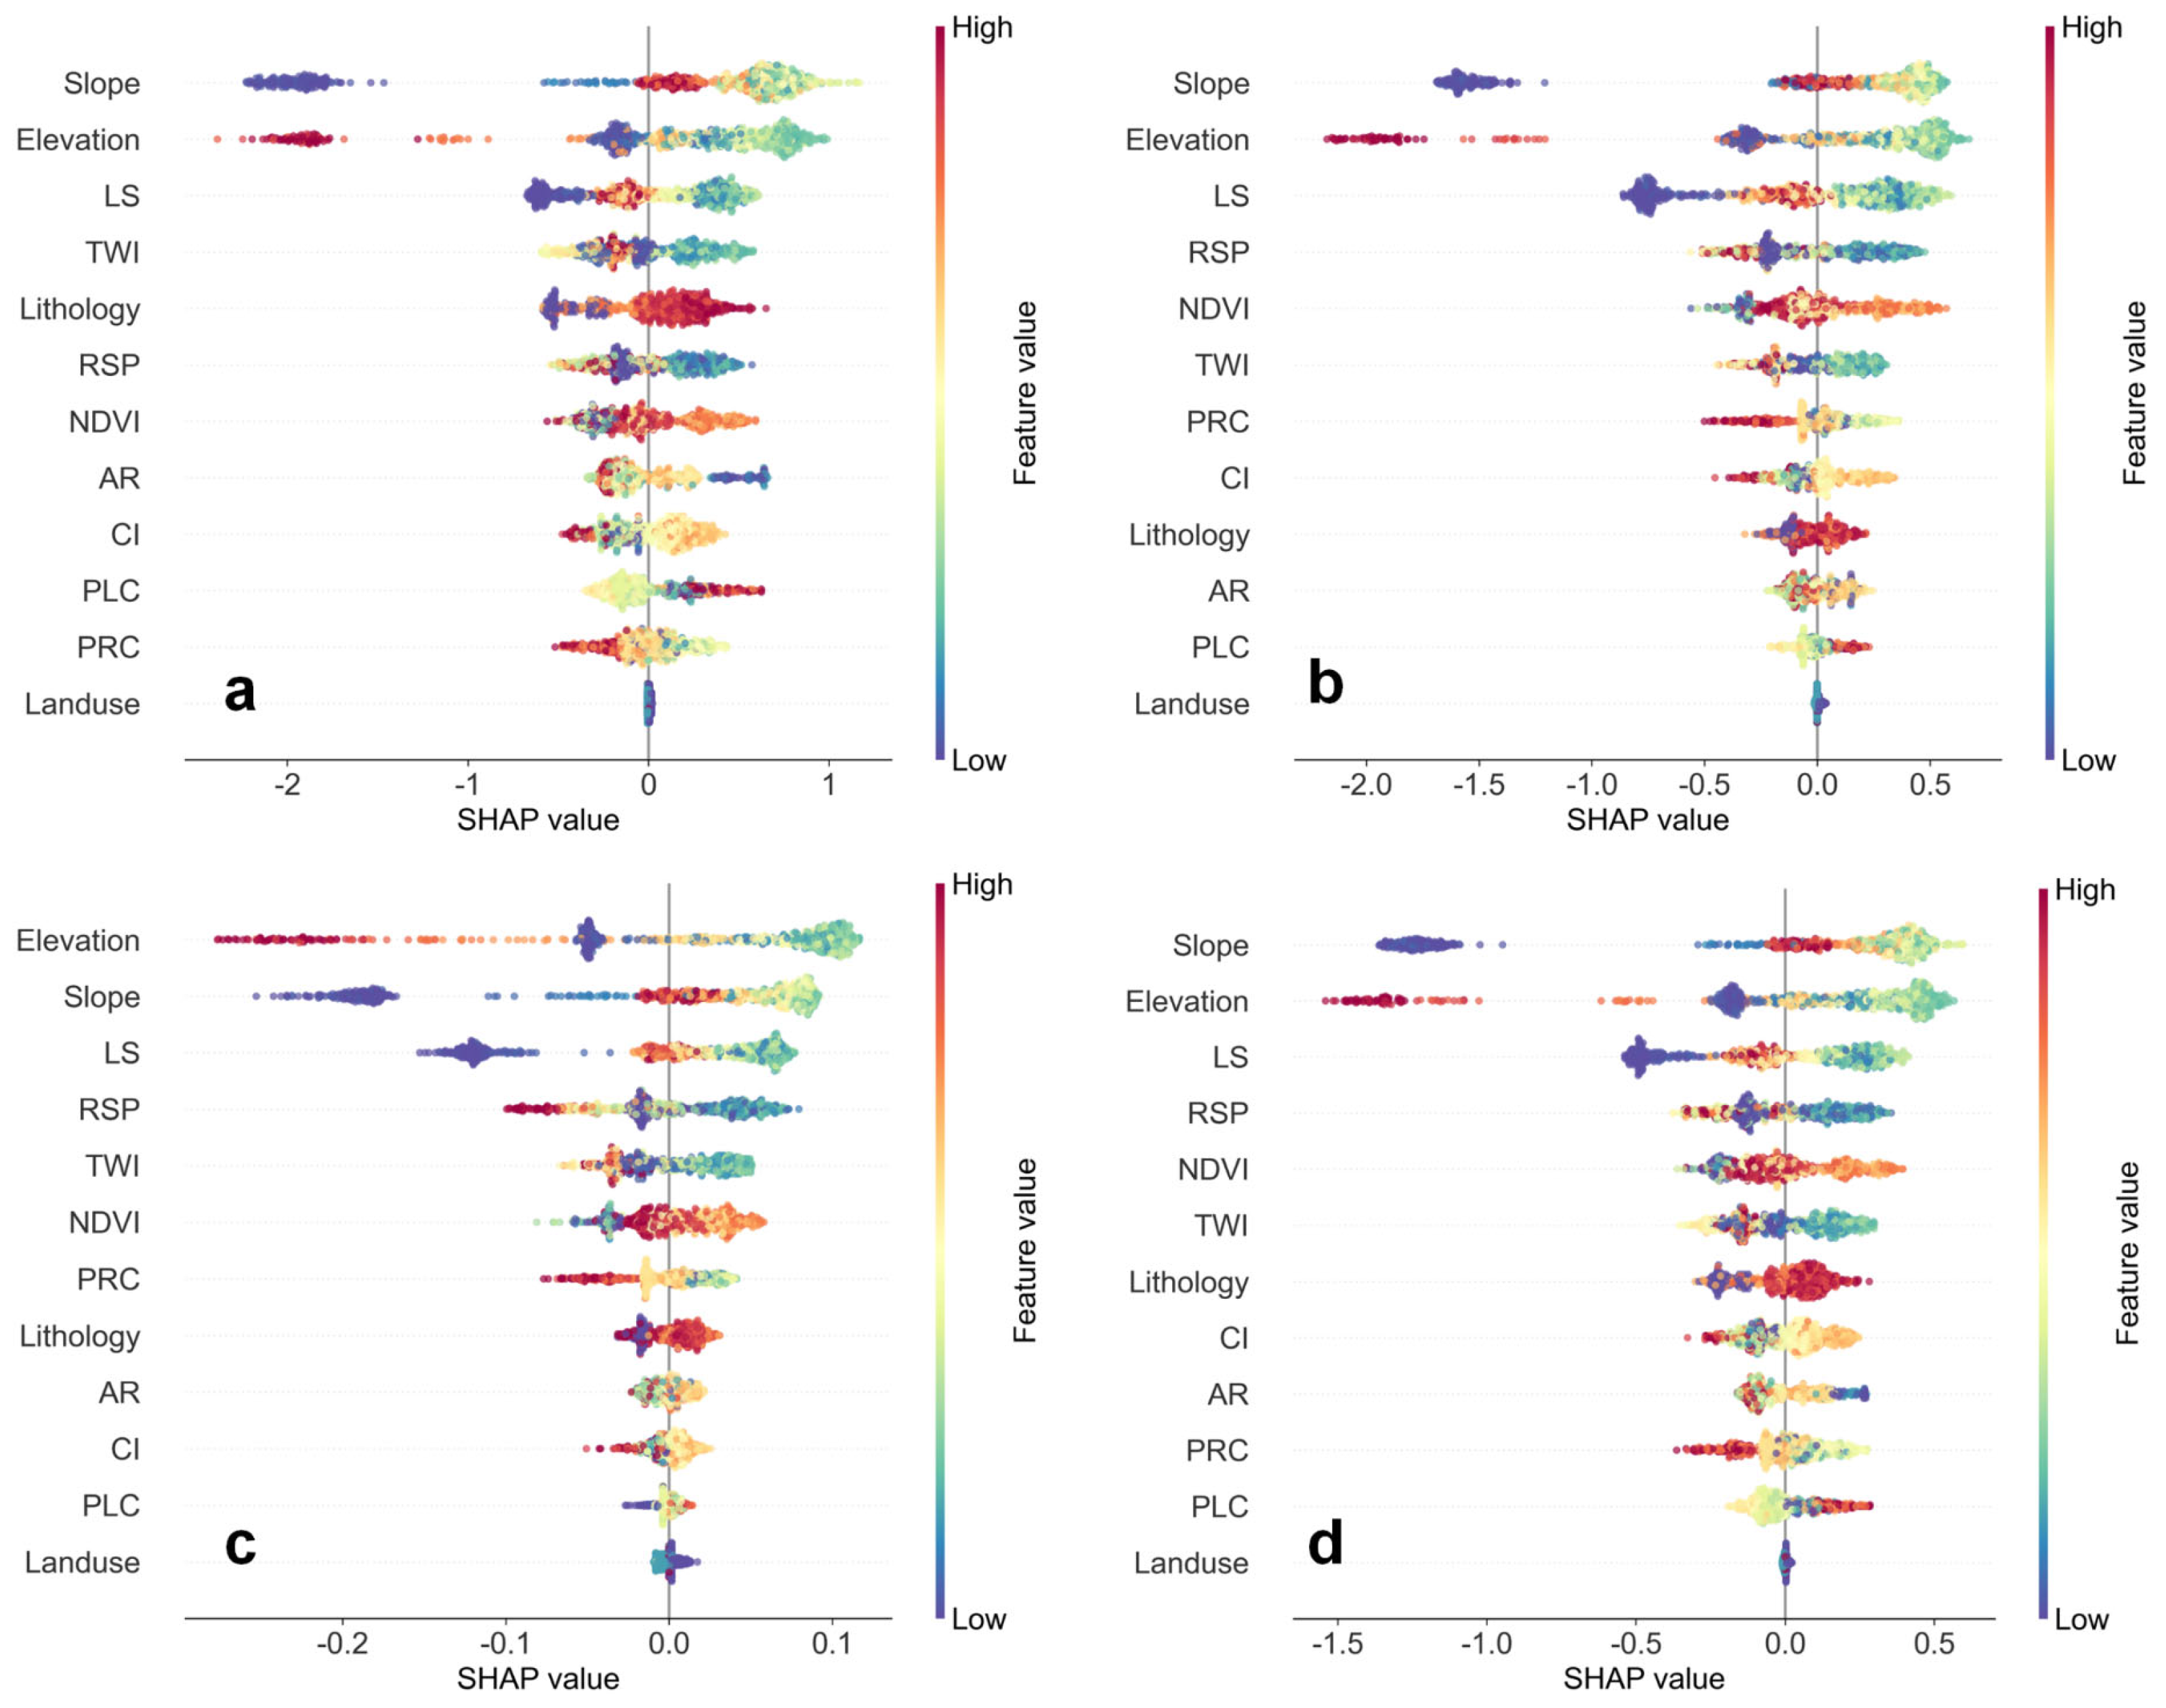
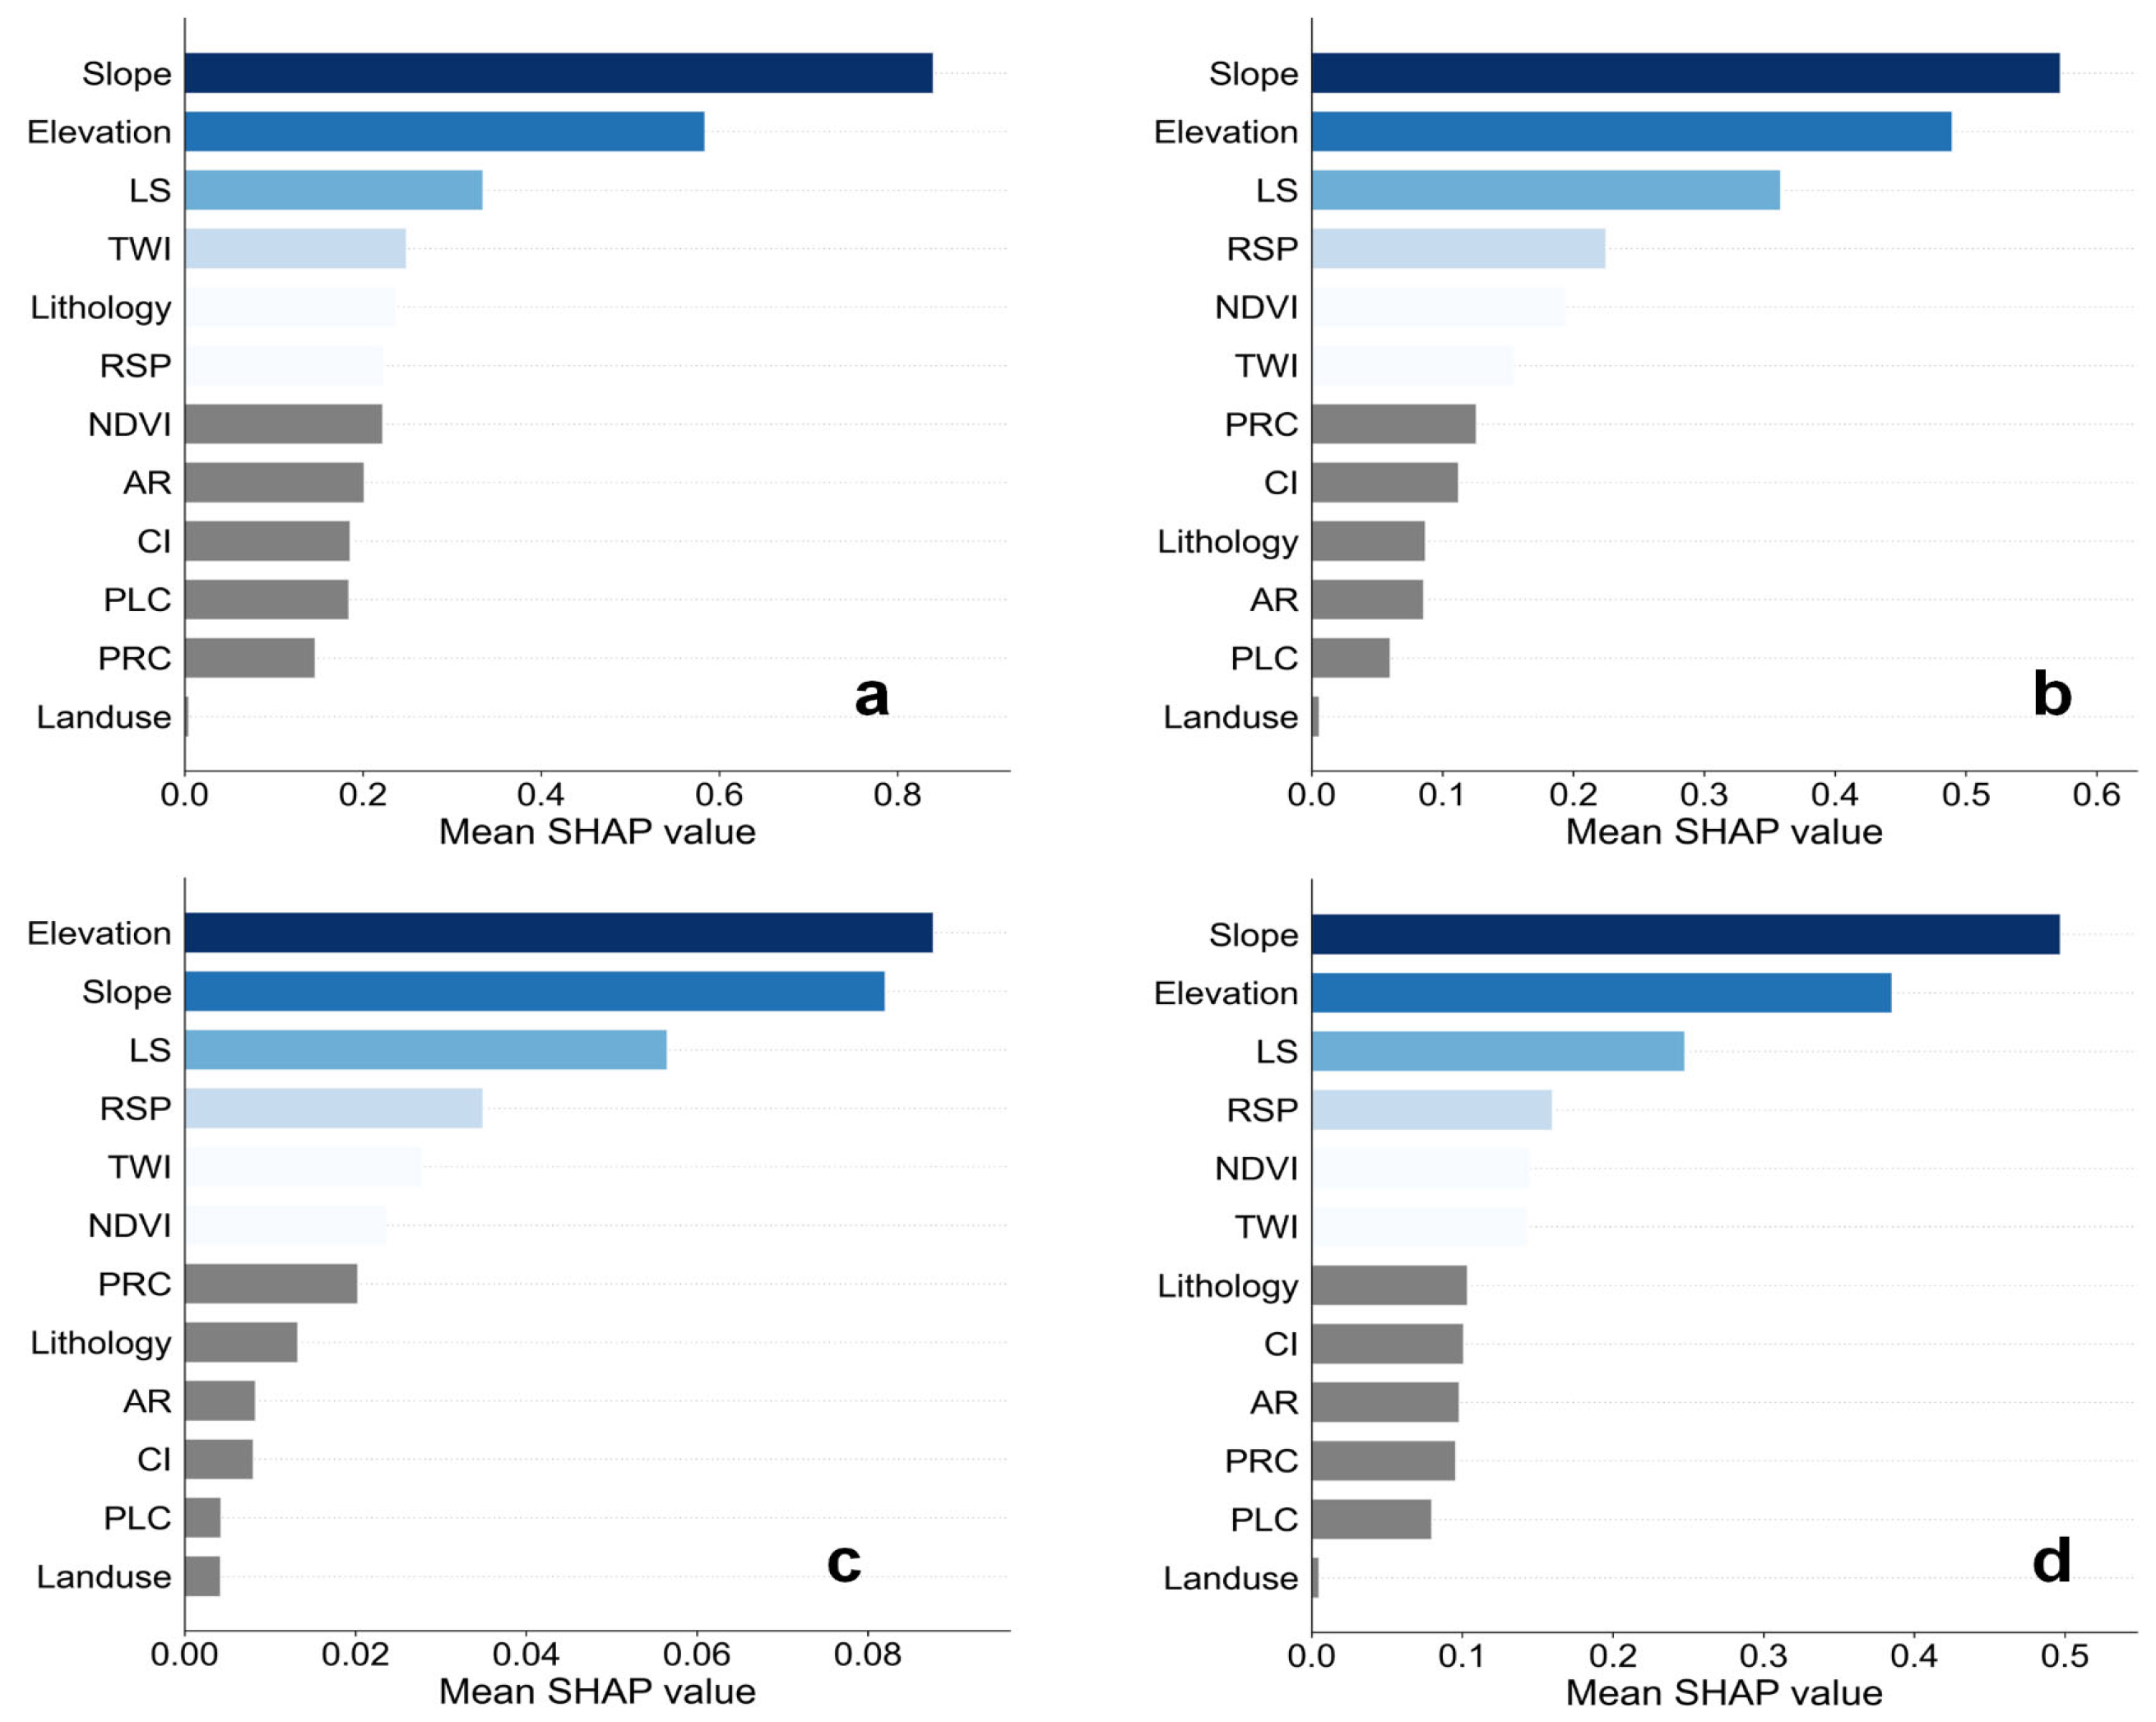
4.4.1. Global Interpretation
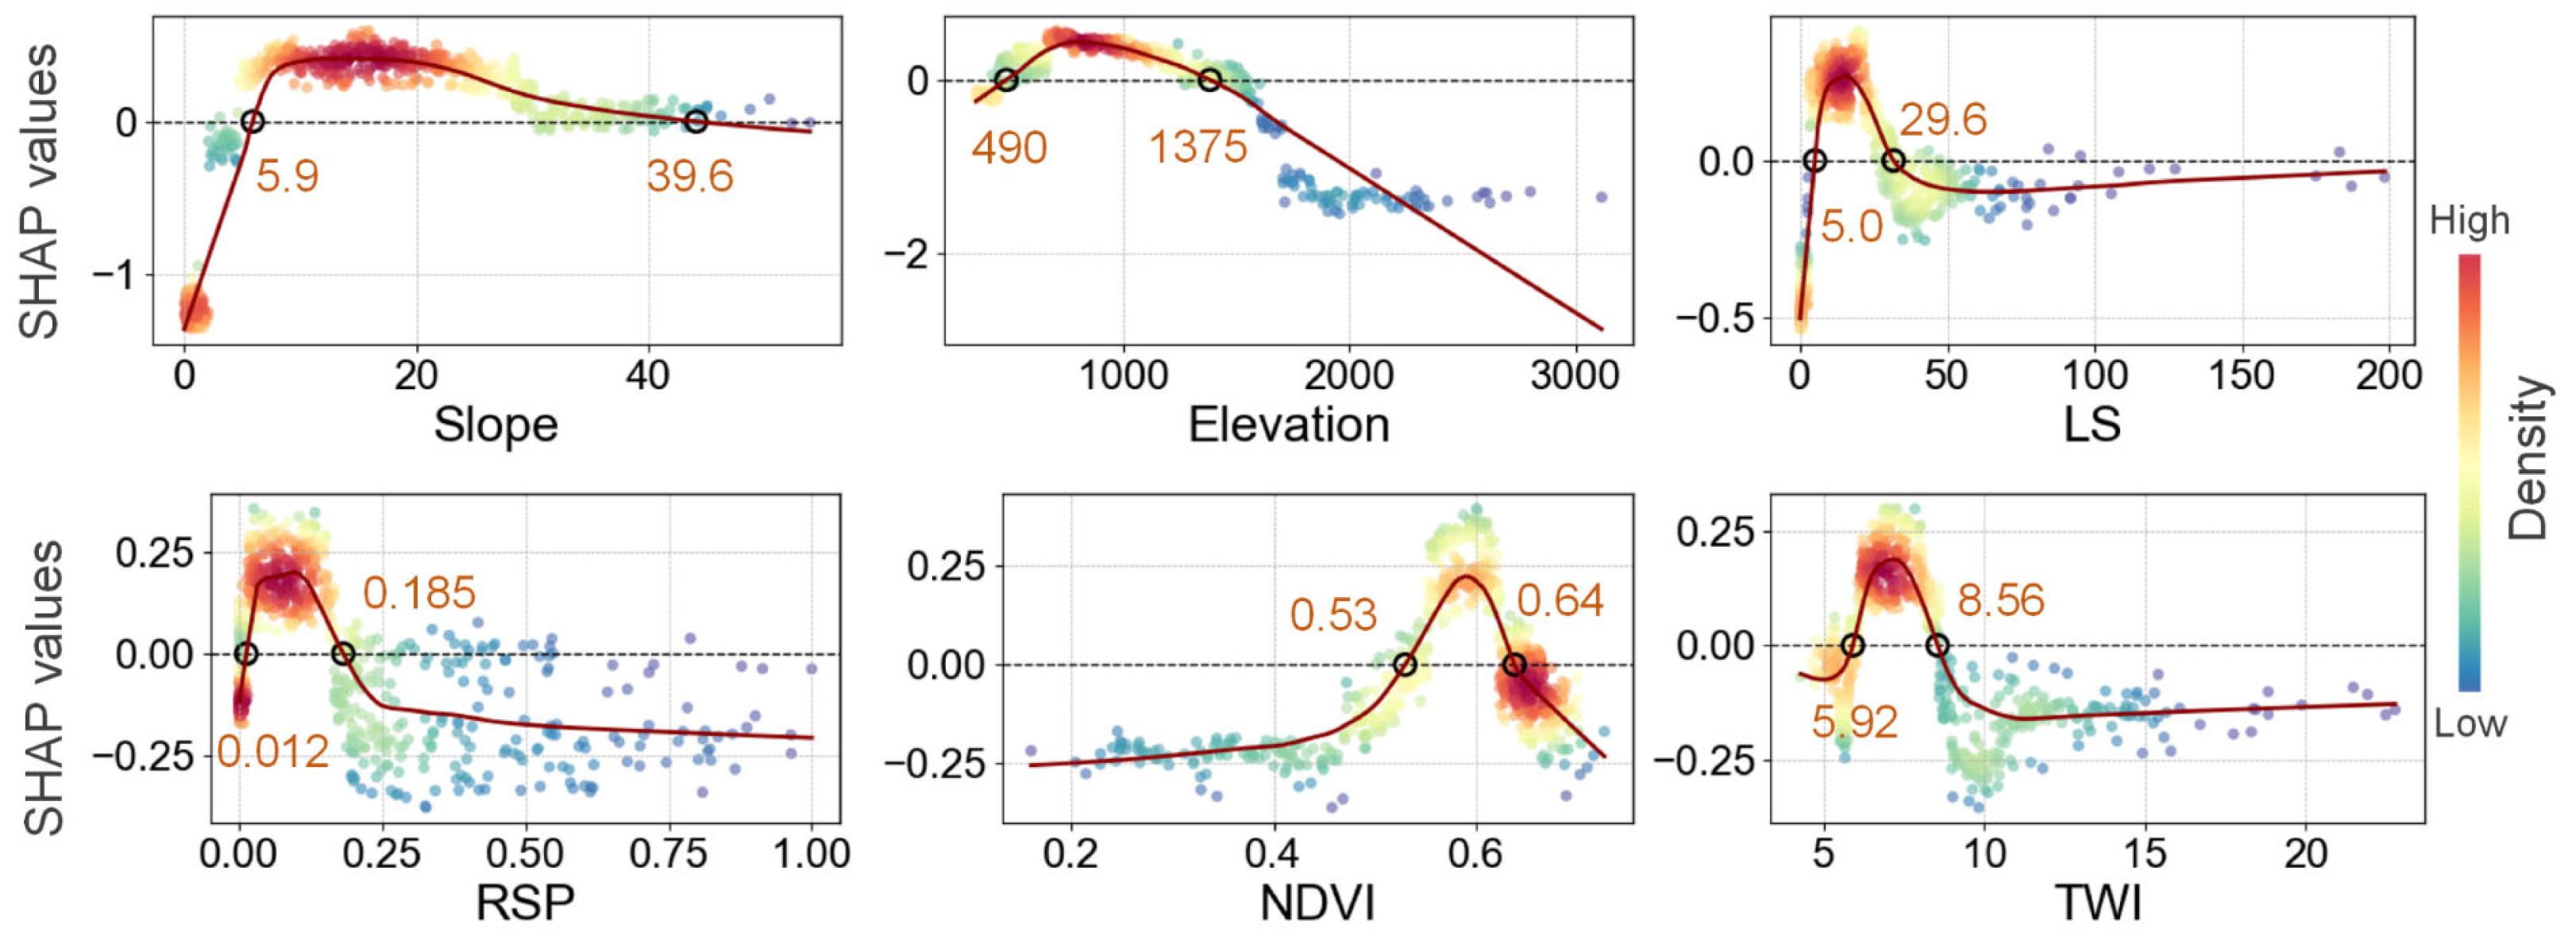
4.4.2. Marginal Effects of Driving Factors
5. Discussion
5.1. The Advances of the Hybrid Model
5.2. Interpretability of Driving Factors
5.3. Implication and Limitation
6. Conclusions
- (1)
- The hybrid model demonstrates superior robustness, with a coefficient variation (CV) value of 0.175, significantly lower than the CV values exceeding 0.2 for the baseline models. This indicates more reliable feature rankings across folds.
- (2)
- Although the hybrid model does not drastically outperform the individual models, it maintains competitive predictive accuracy, with an AUC of 0.87, accuracy of 0.80, precision of 0.79, recall of 0.87, and F1 score of 0.83. This highlights its effectiveness in providing stable and consistent results for landslide susceptibility mapping.
- (3)
- The study identifies critical threshold values for factors like slope (5.9° to 39.6°) and elevation (490 m to 1375 m), which demonstrate nonlinear relationships with landslide susceptibility. These insights contribute to a more nuanced understanding of the factors influencing landslide occurrence.
Author Contributions
Funding
Data Availability Statement
Conflicts of Interest
References
- Ado, M.; Amitab, K.; Maji, A.K.; Jasińska, E.; Gono, R.; Leonowicz, Z.; Jasiński, M. Landslide Susceptibility Mapping Using Machine Learning: A Literature Survey. Remote Sens. 2022, 14, 3029. [Google Scholar] [CrossRef]
- Liu, S.; Wang, L.; Zhang, W.; He, Y.; Pijush, S. A comprehensive review of machine learning-based methods in landslide susceptibility mapping. Geol. J. 2023, 58, 2283–2301. [Google Scholar] [CrossRef]
- Azarafza, M.; Azarafza, M.; Akgün, H.; Atkinson, P.M.; Derakhshani, R. Deep learning-based landslide susceptibility mapping. Sci. Rep. 2021, 11, 24112. [Google Scholar] [CrossRef] [PubMed]
- Gariano, S.L.; Guzzetti, F. Landslides in a changing climate. Earth-Sci. Rev. 2016, 162, 227–252. [Google Scholar] [CrossRef]
- Reichenbach, P.; Rossi, M.; Malamud, B.D.; Mihir, M.; Guzzetti, F. A review of statistically-based landslide susceptibility models. Earth-Sci. Rev. 2018, 180, 60–91. [Google Scholar] [CrossRef]
- Wang, H.; Zhang, L.; Luo, H.; He, J.; Cheung, R.W.M. AI-powered landslide susceptibility assessment in Hong Kong. Eng. Geol. 2021, 288, 106103. [Google Scholar] [CrossRef]
- Achu, A.L.; Aju, C.D.; Di Napoli, M.; Prakash, P.; Gopinath, G.; Shaji, E.; Chandra, V. Machine-learning based landslide susceptibility modelling with emphasis on uncertainty analysis. Geosci. Front. 2023, 14, 101657. [Google Scholar] [CrossRef]
- Zeng, T.; Wu, L.; Peduto, D.; Glade, T.; Hayakawa, Y.S.; Yin, K. Ensemble learning framework for landslide susceptibility mapping: Different basic classifier and ensemble strategy. Geosci. Front. 2023, 14, 101645. [Google Scholar] [CrossRef]
- Pourghasemi, H.R.; Kornejady, A.; Kerle, N.; Shabani, F. Investigating the effects of different landslide positioning techniques, landslide partitioning approaches, and presence-absence balances on landslide susceptibility mapping. CATENA 2020, 187, 104364. [Google Scholar] [CrossRef]
- Lin, Q.; Lima, P.; Steger, S.; Glade, T.; Jiang, T.; Zhang, J.; Liu, T.; Wang, Y. National-scale data-driven rainfall induced landslide susceptibility mapping for China by accounting for incomplete landslide data. Geosci. Front. 2021, 12, 101248. [Google Scholar] [CrossRef]
- Huang, F.; Ye, Z.; Jiang, S.-H.; Huang, J.; Chang, Z.; Chen, J. Uncertainty study of landslide susceptibility prediction considering the different attribute interval numbers of environmental factors and different data-based models. CATENA 2021, 202, 105250. [Google Scholar] [CrossRef]
- Liu, J.; Jiyan, W.; Junnan, X.; Weiming, C.; Yi, L.; Yifan, C.; Yufeng, H.; Yu, D.; Wen, H.; Yang, G. Assessment of flood susceptibility mapping using support vector machine, logistic regression and their ensemble techniques in the Belt and Road region. Geocarto Int. 2022, 37, 9817–9846. [Google Scholar] [CrossRef]
- Marzini, L.; D’Addario, E.; Papasidero, M.P.; Chianucci, F.; Disperati, L. Influence of Root Reinforcement on Shallow Landslide Distribution: A Case Study in Garfagnana (Northern Tuscany, Italy). Geosciences 2023, 13, 326. [Google Scholar] [CrossRef]
- Zhu, A.-X.; Miao, Y.; Liu, J.; Bai, S.; Zeng, C.; Ma, T.; Hong, H.J.C. A similarity-based approach to sampling absence data for landslide susceptibility mapping using data-driven methods. Catena 2019, 183, 104188. [Google Scholar] [CrossRef]
- Huang, Y.; Zhao, L. Review on landslide susceptibility mapping using support vector machines. CATENA 2018, 165, 520–529. [Google Scholar] [CrossRef]
- Abbaszadeh Shahri, A.; Spross, J.; Johansson, F.; Larsson, S. Landslide susceptibility hazard map in southwest Sweden using artificial neural network. CATENA 2019, 183, 104225. [Google Scholar] [CrossRef]
- Sun, D.; Wen, H.; Wang, D.; Xu, J. A random forest model of landslide susceptibility mapping based on hyperparameter optimization using Bayes algorithm. Geomorphology 2020, 362, 107201. [Google Scholar] [CrossRef]
- Song, Y.; Niu, R.; Xu, S.; Ye, R.; Peng, L.; Guo, T.; Li, S.; Chen, T. Landslide Susceptibility Mapping Based on Weighted Gradient Boosting Decision Tree in Wanzhou Section of the Three Gorges Reservoir Area (China). ISPRS Int. J. Geo-Inf. 2019, 8, 4. [Google Scholar] [CrossRef]
- Wu, Y.; Ke, Y.; Chen, Z.; Liang, S.; Zhao, H.; Hong, H. Application of alternating decision tree with AdaBoost and bagging ensembles for landslide susceptibility mapping. CATENA 2020, 187, 104396. [Google Scholar] [CrossRef]
- Liu, R.; Yang, X.; Xu, C.; Wei, L.; Zeng, X. Comparative Study of Convolutional Neural Network and Conventional Machine Learning Methods for Landslide Susceptibility Mapping. Remote Sens. 2022, 14, 321. [Google Scholar] [CrossRef]
- Wang, N.; Zhang, H.; Dahal, A.; Cheng, W.; Zhao, M.; Lombardo, L. On the use of explainable AI for susceptibility modeling: Examining the spatial pattern of SHAP values. Geosci. Front. 2024, 15, 101800. [Google Scholar] [CrossRef]
- Lv, J.; Zhang, R.; Shama, A.; Hong, R.; He, X.; Wu, R.; Bao, X.; Liu, G. Exploring the spatial patterns of landslide susceptibility assessment using interpretable Shapley method: Mechanisms of landslide formation in the Sichuan-Tibet region. J. Environ. Manag. 2024, 366, 121921. [Google Scholar] [CrossRef]
- Padarian, J.; McBratney, A.B.; Minasny, B. Game theory interpretation of digital soil mapping convolutional neural networks. SOIL 2020, 6, 389–397. [Google Scholar] [CrossRef]
- Zhang, J.; Ma, X.; Zhang, J.; Sun, D.; Zhou, X.; Mi, C.; Wen, H. Insights into geospatial heterogeneity of landslide susceptibility based on the SHAP-XGBoost model. J. Environ. Manag. 2023, 332, 117357. [Google Scholar] [CrossRef]
- Pradhan, B.; Dikshit, A.; Lee, S.; Kim, H. An explainable AI (XAI) model for landslide susceptibility modeling. Appl. Soft Comput. 2023, 142, 110324. [Google Scholar] [CrossRef]
- Jiang, S.; Sweet, L.-b.; Blougouras, G.; Brenning, A.; Li, W.; Reichstein, M.; Denzler, J.; Shangguan, W.; Yu, G.; Huang, F.; et al. How Interpretable Machine Learning Can Benefit Process Understanding in the Geosciences. Earth’s Future 2024, 12, e2024EF004540. [Google Scholar] [CrossRef]
- Bommer, P.L.; Kretschmer, M.; Hedström, A.; Bareeva, D.; Höhne, M.M.-C. Finding the Right XAI Method—A Guide for the Evaluation and Ranking of Explainable AI Methods in Climate Science. Artif. Intell. Earth Syst. 2024, 3, e230074. [Google Scholar] [CrossRef]
- Panigrahi, B.; Razavi, S.; Doig, L.E.; Cordell, B.; Gupta, H.V.; Liber, K. On Robustness of the Explanatory Power of Machine Learning Models: Insights From a New Explainable AI Approach Using Sensitivity Analysis. Water Resour. Res. 2025, 61, e2024WR037398. [Google Scholar] [CrossRef]
- Ullah, M.; Li, J.; Wadood, B. Analysis of Urban Expansion and its Impacts on Land Surface Temperature and Vegetation Using RS and GIS, A Case Study in Xi’an City, China. Earth Syst. Environ. 2020, 4, 583–597. [Google Scholar] [CrossRef]
- Yang, Z.; Song, J.; Cheng, D.; Xia, J.; Li, Q.; Ahamad, M.I. Comprehensive evaluation and scenario simulation for the water resources carrying capacity in Xi’an city, China. J. Environ. Manag. 2019, 230, 221–233. [Google Scholar] [CrossRef]
- Liu, X.; Shao, S.; Shao, S. Landslide susceptibility zonation using the analytical hierarchy process (AHP) in the Great Xi’an Region, China. Sci. Rep. 2024, 14, 2941. [Google Scholar] [CrossRef]
- Zhuang, J.; Peng, J.; Iqbal, J.; Liu, T.; Liu, N.; Li, Y.; Ma, P. Identification of landslide spatial distribution and susceptibility assessment in relation to topography in the Xi’an Region, Shaanxi Province, China. Front. Earth Sci. 2015, 9, 449–462. [Google Scholar] [CrossRef]
- Li, D.; Wang, J.; Shi, K. Research on the Investigation and Value Evaluation of Historic Building Resources in Xi’an City. Buildings 2023, 13, 2244. [Google Scholar] [CrossRef]
- Wu, W.; Zhang, Q.; Singh, V.P.; Wang, G.; Zhao, J.; Shen, Z.; Sun, S. A Data-Driven Model on Google Earth Engine for Landslide Susceptibility Assessment in the Hengduan Mountains, the Qinghai–Tibetan Plateau. Remote Sens. 2022, 14, 4662. [Google Scholar] [CrossRef]
- Li, W.-Y.; Liu, C.; Hong, Y.; Zhang, X.-H.; Wan, Z.-M.; Saharia, M.; Sun, W.-W.; Yao, D.-J.; Chen, W.; Chen, S.; et al. A public Cloud-based China’s Landslide Inventory Database (CsLID): Development, zone, and spatiotemporal analysis for significant historical events, 1949–2011. J. Mt. Sci. 2016, 13, 1275–1285. [Google Scholar] [CrossRef]
- Guo, Z.; Tian, B.; Zhu, Y.; He, J.; Zhang, T. How do the landslide and non-landslide sampling strategies impact landslide susceptibility assessment?—A catchment-scale case study from China. J. Rock Mech. Geotech. Eng. 2024, 16, 877–894. [Google Scholar] [CrossRef]
- Sharma, N.; Saharia, M.; Ramana, G.V. High resolution landslide susceptibility mapping using ensemble machine learning and geospatial big data. CATENA 2024, 235, 107653. [Google Scholar] [CrossRef]
- Yu, X.; Chen, H. Research on the influence of different sampling resolution and spatial resolution in sampling strategy on landslide susceptibility mapping results. Sci. Rep. 2024, 14, 1549. [Google Scholar] [CrossRef]
- Selamat, S.N.; Majid, N.A.; Taha, M.R. Multicollinearity and spatial correlation analysis of landslide conditioning factors in Langat River Basin, Selangor. Nat. Hazards 2025, 121, 2665–2684. [Google Scholar] [CrossRef]
- Hong, H.; Liu, J.; Zhu, A.X. Modeling landslide susceptibility using LogitBoost alternating decision trees and forest by penalizing attributes with the bagging ensemble. Sci. Total Environ. 2020, 718, 137231. [Google Scholar] [CrossRef]
- Liu, Q.; Huang, D.; Tang, A.; Han, X. Model performance analysis for landslide susceptibility in cold regions using accuracy rate and fluctuation characteristics. Nat. Hazards 2021, 108, 1047–1067. [Google Scholar] [CrossRef]
- Yu, L.; Cao, Y.; Zhou, C.; Wang, Y.; Huo, Z. Landslide Susceptibility Mapping Combining Information Gain Ratio and Support Vector Machines: A Case Study from Wushan Segment in the Three Gorges Reservoir Area, China. Appl. Sci. 2019, 9, 4756. [Google Scholar] [CrossRef]
- Quinlan, J.R. Induction of decision trees. Mach. Learn. 1986, 1, 81–106. [Google Scholar] [CrossRef]
- Ke, G.; Meng, Q.; Finley, T.; Wang, T.; Chen, W.; Ma, W.; Ye, Q.; Liu, T.-Y. Lightgbm: A highly efficient gradient boosting decision tree. In Proceedings of the 31st Annual Conference on Neural Information Processing Systems (NIPS 2017), Long Beach, CA, USA, 4–9 December 2017. [Google Scholar]
- Sun, D.; Wu, X.; Wen, H.; Shi, S.; Gu, Q. Improving generalization performance of landslide susceptibility model considering spatial heterogeneity by using the geomorphic label-based LightGBM. Bull. Eng. Geol. Environ. 2024, 83, 361. [Google Scholar] [CrossRef]
- Wang, Y.; Ling, Y.; Chan, T.O.; Awange, J. High-resolution earthquake-induced landslide hazard assessment in Southwest China through frequency ratio analysis and LightGBM. Int. J. Appl. Earth Obs. Geo-Inf. 2024, 131, 103947. [Google Scholar] [CrossRef]
- Sun, D.; Chen, D.; Zhang, J.; Mi, C.; Gu, Q.; Wen, H. Landslide Susceptibility Mapping Based on Interpretable Machine Learning from the Perspective of Geomorphological Differentiation. ISPRS Int. J. Geo-Inf. 2023, 12, 1018. [Google Scholar] [CrossRef]
- Chen, T.; Guestrin, C. XGBoost. In Proceedings of the 22nd ACM SIGKDD International Conference on Knowledge Discovery and Data Mining, San Francisco, CA, USA, 13–17 August 2016. [Google Scholar]
- Loksa, D.; Ko, A.J. The role of self-regulation in programming problem solving process and success. In Proceedings of the ACM Conferences on International Computing Education Research, Melbourne, VIC, Australia, 8–12 September 2016. [Google Scholar]
- Zhang, Y.; Deng, L.; Han, Y.; Sun, Y.; Zang, Y.; Zhou, M. Landslide Hazard Assessment in Highway Areas of Guangxi Using Remote Sensing Data and a Pre-Trained XGBoost Model. Remote Sens. 2023, 15, 3350. [Google Scholar] [CrossRef]
- Pradhan, A.M.S.; Kim, Y.-T. Rainfall-Induced Shallow Landslide Susceptibility Mapping at Two Adjacent Catchments Using Advanced Machine Learning Algorithms. ISPRS Int. J. Geo-Inf. 2020, 9, 569. [Google Scholar] [CrossRef]
- Breiman, L. Random Forests. Mach. Learn. 2001, 45, 5–32. [Google Scholar] [CrossRef]
- Akinci, H.; Kilicoglu, C.; Dogan, S. Random Forest-Based Landslide Susceptibility Mapping in Coastal Regions of Artvin, Turkey. ISPRS Int. J. Geo-Inf. 2020, 9, 553. [Google Scholar] [CrossRef]
- Sun, D.; Xu, J.; Wen, H.; Wang, D. Assessment of landslide susceptibility mapping based on Bayesian hyperparameter optimization: A comparison between logistic regression and random forest. Eng. Geol. 2021, 281, 105972. [Google Scholar] [CrossRef]
- Zhou, S.; Zhang, D.; Wang, M.; Liu, Z.; Gan, W.; Zhao, Z.; Xue, S.; Müller, B.; Zhou, M.; Ni, X.; et al. Risk-driven composition decoupling analysis for urban flooding prediction in high-density urban areas using Bayesian-Optimized LightGBM. J. Clean. Prod. 2024, 457, 142286. [Google Scholar] [CrossRef]
- Pourghasemi, H.R.; Yousefi, S.; Kornejady, A.; Cerdà, A. Performance assessment of individual and ensemble data-mining techniques for gully erosion modeling. Sci. Total Environ. 2017, 609, 764–775. [Google Scholar] [CrossRef] [PubMed]
- Liu, D.; Cao, C.; Dubovyk, O.; Tian, R.; Chen, W.; Zhuang, Q.; Zhao, Y.; Menz, G. Using fuzzy analytic hierarchy process for spatio-temporal analysis of eco-environmental vulnerability change during 1990–2010 in Sanjiangyuan region, China. Ecol. Indic. 2017, 73, 612–625. [Google Scholar] [CrossRef]
- Sun, D.; Ding, Y.; Wen, H.; Zhang, F.; Zhang, J.; Gu, Q.; Zhang, J. SHAP-PDP hybrid interpretation of decision-making mechanism of machine learning-based landslide susceptibility mapping: A case study at Wushan District, China. Egypt. J. Remote Sens. Space Sci. 2024, 27, 508–523. [Google Scholar] [CrossRef]
- Bacanin, N.; Perisic, M.; Jovanovic, G.; Damaševičius, R.; Stanisic, S.; Simic, V.; Zivkovic, M.; Stojic, A. The explainable potential of coupling hybridized metaheuristics, XGBoost, and SHAP in revealing toluene behavior in the atmosphere. Sci. Total Environ. 2024, 929, 172195. [Google Scholar] [CrossRef]
- He, Y.; Ding, M.; Duan, Y.; Zheng, H.; He, W.; Liu, J. Debris flows dynamic risk assessment and interpretable Shapley method-based driving mechanisms exploring—A case study of the upper reach of the Min River. Ecol. Indic. 2025, 173, 113400. [Google Scholar] [CrossRef]
- Xiong, J.; Pei, T.; Qiu, T. A Novel Framework for Spatiotemporal Susceptibility Prediction of Rainfall-Induced Landslides: A Case Study in Western Pennsylvania. Remote Sens. 2024, 16, 3526. [Google Scholar] [CrossRef]
- Liu, J.; Zhao, X.; Chen, Y.; Sun, H.; Gu, Y.; Xu, S. Uncertainty pattern and an integration strategy in flood susceptibility modeling: Limited sample size. J. Hydrol. 2025, 658, 133184. [Google Scholar] [CrossRef]
- Kavzoglu, T.; Kutlug Sahin, E.; Colkesen, I. An assessment of multivariate and bivariate approaches in landslide susceptibility mapping: A case study of Duzkoy district. Nat. Hazards 2015, 76, 471–496. [Google Scholar] [CrossRef]
- Le, X.H.; Choi, C.; Eu, S.; Yeon, M.; Lee, G. Quantitative evaluation of uncertainty and interpretability in machine learning-based landslide susceptibility mapping through feature selection and explainable AI. Front. Environ. Sci. 2024, 12, 1424988. [Google Scholar] [CrossRef]
- Hong, H.; Miao, Y.; Liu, J.; Zhu, A.X. Exploring the effects of the design and quantity of absence data on the performance of random forest-based landslide susceptibility mapping. CATENA 2019, 176, 45–64. [Google Scholar] [CrossRef]
- Rudin, C.; Chen, C.; Chen, Z.; Huang, H.; Semenova, L.; Zhong, C. Interpretable machine learning: Fundamental principles and 10 grand challenges. Stat. Surv. 2022, 16, 1–85. [Google Scholar] [CrossRef]
- Wang, Y.; Liu, Y.; Cao, Z.; Zhang, D. Prediction of contraction channel scour depth: Based on interpretability analysis and PCA-enhanced SVR. J. HydroInform. 2024, 26, 3287–3305. [Google Scholar] [CrossRef]
- Chen, C.; Fan, L. Interpretability of Statistical, Machine Learning, and Deep Learning Models for Landslide Susceptibility Mapping in Three Gorges Reservoir Area; Cornell University: Ithaca, NY, USA, 2024. [Google Scholar]
- Caleca, F.; Confuorto, P.; Raspini, F.; Segoni, S.; Tofani, V.; Casagli, N.; Moretti, S. Shifting from traditional landslide occurrence modeling to scenario estimation with a “glass-box” machine learning. Sci. Total Environ. 2024, 950, 175277. [Google Scholar] [CrossRef]
- Huang, F.; Mao, D.; Jiang, S.-H.; Zhou, C.; Fan, X.; Zeng, Z.; Catani, F.; Yu, C.; Chang, Z.; Huang, J.; et al. Uncertainties in landslide susceptibility prediction modeling: A review on the incompleteness of landslide inventory and its influence rules. Geosci. Front. 2024, 15, 101886. [Google Scholar] [CrossRef]
- Lineback Gritzner, M.; Marcus, W.A.; Aspinall, R.; Custer, S.G. Assessing landslide potential using GIS, soil wetness modeling and topographic attributes, Payette River, Idaho. Geomorphology 2001, 37, 149–165. [Google Scholar] [CrossRef]
- Moazzam, M.F.U.; Vansarochana, A.; Boonyanuphap, J.; Choosumrong, S.; Rahman, G.; Djueyep, G.P. Spatio-statistical comparative approaches for landslide susceptibility modeling: Case of Mae Phun, Uttaradit Province, Thailand. SN Appl. Sci. 2020, 2, 384. [Google Scholar] [CrossRef]
- Hua, Y.; Wang, X.; Li, Y.; Xu, P.; Xia, W. Dynamic development of landslide susceptibility based on slope unit and deep neural networks. Landslides 2021, 18, 281–302. [Google Scholar] [CrossRef]
- Conforti, M.; Ietto, F. Modeling Shallow Landslide Susceptibility and Assessment of the Relative Importance of Predisposing Factors, through a GIS-Based Statistical Analysis. Geosciences 2021, 11, 333. [Google Scholar] [CrossRef]
- Wang, F.; Xu, P.; Wang, C.; Wang, N.; Jiang, N. Application of a GIS-Based Slope Unit Method for Landslide Susceptibility Mapping along the Longzi River, Southeastern Tibetan Plateau, China. ISPRS Int. J. Geo-Inf. 2017, 6, 172. [Google Scholar] [CrossRef]


| Factors | Data | Source of Data | Time | Resolution |
|---|---|---|---|---|
| AR | Annual spatially interpolated dataset of meteorological elements in China | Resource and Environmental Science Data Platform (https://www.resdc.cn/) (accessed on 3 February 2024) | 1960–2020 | 1 km |
| Elevation | Digital Elevation Model (DEM) | Shuttle Radar Topography Mission (SRTM, https://www.earthdata.nasa.gov/sensors/srtm) (accessed on 13 February 2024) | 2000 | 90 m |
| CI | ||||
| LS | ||||
| PLC | ||||
| PRC | ||||
| Slope | ||||
| RSP | ||||
| TWI | ||||
| Aspect | ||||
| Lithology | Lithology | China Geological Survey (https://www.cgs.gov.cn/) (accessed on 13 February 2024) | / | 1:10,000 |
| NDVI | MOD13A1 | (https://lpdaac.usgs.gov/products/mod13a1v006/) (accessed on 15 February 2024) | 2020 | 500 m |
| Land use | CLCD | https://zenodo.org/records/5816591#.ZAWM3BVBy5c (accessed on 21 February 2024) | 2020 | 30 m |
| DR | River | HydroSHEDS (https://www.hydrosheds.org/) (accessed on 18 February 2024) | 2013 | / |
| Soil | Soil | National Earth System Science Data Center (accessed on 25 February 2024) | / | 1:1,000,000 |
| Models | AUC | Accuracy | Precision | Recalls | F1 scores |
|---|---|---|---|---|---|
| LightGBM | 0.86 | 0.78 | 0.77 | 0.88 | 0.82 |
| XGBoost | 0.87 | 0.79 | 0.79 | 0.83 | 0.81 |
| Random Forest | 0.86 | 0.78 | 0.77 | 0.86 | 0.81 |
| Hybrid | 0.87 | 0.8 | 0.79 | 0.87 | 0.83 |
| Models | LightGBM | XGBoost | Random Forest | Hybrid |
|---|---|---|---|---|
| LightGBM | 0 | ** | ** | ** |
| XGBoost | 8573.9 | 0 | ** | ** |
| Random Forest | 12,033.8 | 736.6 | 0 | ** |
| Hybrid | 7757.3 | 1283.1 | 3921.1 | 0 |
| Susceptibility | LightGBM | XGBoost | Random Forest | Hybrid | ||||
|---|---|---|---|---|---|---|---|---|
| P/% | FR | P/% | FR | P/% | FR | P/% | FR | |
| Very low | 49.38 | 0.01 | 51.08 | 0.01 | 35.17 | 0.00 | 42.72 | 0.01 |
| Low | 17.13 | 0.17 | 13.38 | 0.15 | 23.46 | 0.02 | 20.44 | 0.07 |
| Medium | 10.19 | 0.42 | 11.23 | 0.49 | 14.65 | 0.57 | 11.79 | 0.47 |
| High | 11.24 | 1.92 | 11.98 | 1.56 | 14.99 | 1.67 | 12.72 | 1.61 |
| Very high | 12.06 | 5.85 | 12.33 | 5.84 | 11.73 | 5.63 | 12.33 | 5.96 |
Disclaimer/Publisher’s Note: The statements, opinions and data contained in all publications are solely those of the individual author(s) and contributor(s) and not of MDPI and/or the editor(s). MDPI and/or the editor(s) disclaim responsibility for any injury to people or property resulting from any ideas, methods, instructions or products referred to in the content. |
© 2025 by the authors. Published by MDPI on behalf of the International Society for Photogrammetry and Remote Sensing. Licensee MDPI, Basel, Switzerland. This article is an open access article distributed under the terms and conditions of the Creative Commons Attribution (CC BY) license (https://creativecommons.org/licenses/by/4.0/).
Share and Cite
Yan, X.; Zhang, D.; Han, Y.; Li, T.; Zhong, P.; Ning, Z.; Tan, S. Developing a Hybrid Model to Enhance the Robustness of Interpretability for Landslide Susceptibility Assessment. ISPRS Int. J. Geo-Inf. 2025, 14, 277. https://doi.org/10.3390/ijgi14070277
Yan X, Zhang D, Han Y, Li T, Zhong P, Ning Z, Tan S. Developing a Hybrid Model to Enhance the Robustness of Interpretability for Landslide Susceptibility Assessment. ISPRS International Journal of Geo-Information. 2025; 14(7):277. https://doi.org/10.3390/ijgi14070277
Chicago/Turabian StyleYan, Xiao, Dongshui Zhang, Yongshun Han, Tongsheng Li, Pin Zhong, Zhe Ning, and Shirou Tan. 2025. "Developing a Hybrid Model to Enhance the Robustness of Interpretability for Landslide Susceptibility Assessment" ISPRS International Journal of Geo-Information 14, no. 7: 277. https://doi.org/10.3390/ijgi14070277
APA StyleYan, X., Zhang, D., Han, Y., Li, T., Zhong, P., Ning, Z., & Tan, S. (2025). Developing a Hybrid Model to Enhance the Robustness of Interpretability for Landslide Susceptibility Assessment. ISPRS International Journal of Geo-Information, 14(7), 277. https://doi.org/10.3390/ijgi14070277