Article

Airborne Lidar Refines Georeferencing Austro-Hungarian Maps from the First and Second Military Surveys

Department of Theoretical Geodesy and Geoinformatics, Faculty of Civil Engineering, Slovak University of Technology in Bratislava, Radlinského 11, 810 05 Bratislava, Slovakia
*
Author to whom correspondence should be addressed.
ISPRS Int. J. Geo-Inf. 2025, 14(7), 274; https://doi.org/10.3390/ijgi14070274
Submission received: 27 March 2025 / Revised: 10 July 2025 / Accepted: 11 July 2025 / Published: 15 July 2025

Abstract

This paper explores ways to improve the coordinate transformation of maps from the First and Second Military Surveys of the Austro-Hungarian Monarchy using airborne laser scanning (ALS) data. The paper analyses the current positional accuracy of georeferenced maps from the first two military mappings from available spatial data sources. Several areas of interest with different terrain ruggedness (plain, undulated terrain, mountains) were selected for analysis to investigate whether terrain ruggedness has an impact on the accuracy of these maps. The next part of the paper deals with the georeferencing of military mapping maps using current, mid-20th-century maps and ALS data using affine and second-degree polynomial transformations. The paper concludes with a statistical analysis and evaluation of the potential of ALS data for solving this type of problem. The results obtained in the paper indicate that ALS data can be a suitable source for finding control points to transform early topographic maps.

1. Introduction

The maps from the First and Second Military Surveys of the Austro-Hungarian Monarchy, which are the subject of this article, can be classified as early topographic maps that show the landscape in different periods of history. Thus, they provide important information about the development of towns, villages, settlements and the whole country. Information on the historical development of the landscape can be applied in various sectors and applications.
Due to the methods of data collection, these maps no longer meet current demands for accuracy. Nevertheless, due to their historical value, they have been georeferenced several times by different institutions and researchers using various contemporary data sources, other historical maps and different transformations.
In this paper, we examined two versions of the first two military mappings used for research activities in Slovakia [1,2,3], one from the ARCANUM map provider [4,5] and the other from the Slovak Environment Agency (SEA) [6]. In the next sections of the paper, the possibility of georeferencing these maps using ALS data is explored. Four areas of interest with different terrain ruggedness were selected, each consisting of four adjacent map sheets, in order to examine the consistency of the map sheets at their edges. The increase or decrease in the number of control points in each territory was also investigated. In the first phase, the maps were georeferenced using control points found on contemporary or historical data sources. Then, we used points identified on airborne laser scanning (ALS) data.
The First Military Survey was georeferenced and statistically assessed in some previous works [7,8,9,10]. The achieved accuracy varied from approximately 250 to 1350 m. The georeferencing and statistical evaluation of the Second Military Survey was conducted in [7,8,9,10,11,12], with achieved accuracy ranging from approximately 40 to 200 m. Other historical maps were georeferenced in many other works [13,14,15,16,17,18,19,20,21,22,23,24,25,26,27,28,29,30,31]. In these works, older maps [9,10,14,17,19,20,21,29,31] and aerial photographs [7,16,20,22,24,25,29] were most commonly used to identify control points. Less common sources were GNSS (global navigation satellite systems) surveys [7,17,19,22], ALS data [7,29], or maps provided by OpenStreetMap [26,28]. The methods also differed depending on whether the maps were small-scale or large-scale. The authors most frequently used road intersections [7,9,10,15,16,19,20,23,27,31] and churches [7,9,10,13,19,20,23,31] as control points. In addition to these two main features, bridges, buildings and other elements [7,10,15,16,19,20,23,24,25,27] were also used. In [8,18], the authors georeferenced the maps to the corners of the map sheets (map sheet index). The georeferencing of historical cadastral and military map sheets was performed by computing the projected coordinates of the four corner points, which could be derived directly from the original sheet labelling system. This approach relies on the consistent structure and projection parameters of the original surveys (e.g., Cassini–Soldner projection with a defined local datum such as Buda-1821), allowing automated or semi-automated rectification without the need to identify ground control points on modern maps. It significantly streamlines the process while preserving the internal consistency of the archival map series. The affine transformation [15,17,21,23,27,31], the thin plate spline [10,15,20,27,31], the Helmert transformation [15,16,20,21] and the polynomial transformation of the second degree [9,21] were the most used. In this article, we also used affine transformation and the polynomial transformation of the second degree, which have a simple mathematical basis and are commonly available in GIS software (ArcGIS Pro). These transformations are widely used in GIS, usually striking a balance between flexibility and stability.
The aim of this paper is to investigate whether the use of ALS data will improve the achieved accuracy of georeferencing compared to georeferencing using only contemporary and early topographic maps. After identifying control points on the reference maps (see Section 2), we searched for all these control points on the ALS data as well. Subsequently, we also searched for such control points on the ALS data that we could not identify on the maps used. The military mappings were georeferenced separately using the points on the mapping data and separately using the ALS data. For both, we calculated statistics to evaluate the results.
The paper is structured as follows: In the Section 2, we describe the data used (military mappings and maps used to search for control points), the areas of interest, and the method of selecting control points and georeferencing. The Section 3 Results section provides the results obtained in the form of basic statistics, tables, and figures. In the Section 4, we summarise the results and recommendations.

2. Materials and Methods

2.1. Military Mapping

The First Military Survey (also known as “Josephine mapping”) [32] was carried out between 1769 and 1785. The territory of present-day Slovakia was divided into 210 map sheets with a uniform mean scale of 1:28,800. The map sheets were not based on any cartographic foundation and did not have a uniform position, which meant that they could not be combined into a single unit. The elevations were depicted by hatching. Muller’s map at a scale of 1:137,000 was used as a base.
The Second Military Survey (otherwise known as the “Franciscan mapping”) [32] took place from 1810 to 1869. The territory was divided into 1025 map sheets with a scale of 1:28,800. The mapping was based on a trigonometric network and reduced cadastral maps. The maps used Cassini–Soldner equidistant transverse position projection.

2.2. Data Used for Georeferencing

Various maps, both historical and contemporary, were used to identify control points for georeferencing. Their parameters are described below and summarised in Table 1.

2.2.1. Historical Orthophoto Mosaic of Slovakia

A historical orthophoto mosaic was created by processing black-and-white aerial photographs from the years 1940 to 1950 from the archive of the Topographic Institute in Banská Bystrica. The orthophoto map covers the entire territory of Slovakia with a resolution of 0.50 m. It was created within the project of the Centre of Excellence for Decision Support in Forest and Landscape, Technical University of Zvolen (TUZVO) and is available at [33].

2.2.2. Orthophoto Mosaic of the Slovak Republic

We used the orthophoto mosaic from the first production cycle (2017–2019) created under the auspices of the Geodetic and Cartographic Institute Bratislava (GCI) and the National Forestry Centre (NFC). The orthophotos have a spatial resolution of 0.25 m/pixel, achieved by the use of the Vexcel UltraCam Xp and Leica RCD 30 cameras for imaging. The orthophoto mosaic is divided into 10,278 map sheets with dimensions of 2.5 × 2 km (10,000 × 8000 pixels) and uses the S-JTSK coordinate system (EPSG: 5514) [34,35].

2.2.3. Special Maps 1:75,000

In 1933, in addition to the new 1:20,000 scale mapping, the re-mapping of special maps continued. The maps from the 3rd military mapping were supplemented with a kilometre grid so that they could be used to identify targets. However, their positional inaccuracy and outdated content reduced the usability of the kilometre grid [36].

2.2.4. Military Topographic Mapping 1:25,000

The mapping of Czechoslovakia for military purposes at a scale 1:25,000 was carried out in 1952–1957 in the S-52 coordinate system (a temporary military system derived from S-JTSK) [37]. Seventy percent of the territory was mapped by photogrammetry and the rest by combined methods.

2.2.5. Military Topographic Mapping 1:10,000

After the completion of the 1:25,000 scale mapping, the 1:10,000 scale mapping started [37]. The implementation began after the agreement about the geodetic services of the Eastern bloc countries, and the S-42 coordinate system was used. The military sector was involved in mapping only about 20% of the territory (mainly in border areas and military training areas). The mapping was completed in 1971.

2.2.6. Distance Map of Hungary 1:75,000

The distance map of Hungary was created between 1897 and 1903 [38] to determine distances between villages or road junctions. It shows roads in red and information on the lengths of individual sections. Railways, villages and names of villages are displayed in black. The blue colour was used for watercourses, water areas and their names. The thickness of the line indicates the traffic density.

2.2.7. Base Map of the Slovak Republic 1:10,000

The base map consists of 2818 map sheets covering the entire territory of the Slovak Republic and uses the S-JTSK coordinate system. It contains a position map, an elevation map and a description. For this article, the topography is important. It includes settlements, individual objects, point fields, kilometre coordinate grid, communications, water supply and administrative boundaries. It was made using analogue photogrammetry [39].

2.2.8. Airborne Laser Scanning Data (ALS)

The ALS data and their classification by the provider (Geodesy, Cartography and Cadastre Authority of the Slovak Republic—GCCA SR/ÚGKK SR) were used as the most up-to-date data source. They allowed the interpolation of the data into raster form at a resolution of 25 cm per pixel. The interpolation and visualisation used the class 02—ground and the class 06—buildings. The visualisation was produced using the ALS data from the first data collection cycle (2017–2021). The minimum point density of the last reflection is 20–40 points/m2. More details about the ALS data collection are given, for example, in [40]. The positional accuracy of the point clouds is higher than 0.30 m [41]. The quality of these datasets was investigated in [40].

2.2.9. Specialised Visualisation of ALS Data

Linear interpolation was used for the interpolation of ALS data, as it leaves clearly recognisable artefacts (edges of triangles) in the absence of points. Thus, the unintentional interpretation of artefacts, which is present when other interpolations are used, can be avoided during visual interpretation of the data. The interpolation was performed using the LidarTINGridding tool in the Whitebox GAT environment (version 1.4.0).
Data from ALS were used in the form of an integrated visualisation developed by Tibor Lieskovský at the Department of Theoretical Geodesy and Geoinformatics of the Faculty of Civil Engineering of the Slovak University of Technology (KGGI SvF STU) [42]. The integrated visualisation is based on the principle that consists of the colour-coded representation of concavity and convexity of “low-frequency phenomena” at different scales (5–20 m radius) and methods based on the principle of the Local Relief Model [43]. This allows capturing non-distinct features such as disused fields, roads, etc.
This approach is combined with the representation of “high frequency phenomena” such as existing roads, watercourses and different types of paved surfaces. These are expressed by the contrast derived using tools based on the “sky view factor” method [42]. Concave elements are shown in yellow shades, convex elements in blue shades and the dynamics of change are expressed by the intensity of the red colour. The data visualised in this way are complemented by a shaded DEM of the present buildings, thus obtaining very precise information about their position, free from distortions typical of aerial photography (mainly radial distortion).
This visualisation is available in 1 m/pixel and 0.25 m/pixel resolutions, with the 0.25 m/pixel resolution having a light and a dark version. Examples of the visualisation variants are shown in Figure 1 and Figure 2.
From Figure 1 and Figure 2, we can see that the visualisations display historic roads and riverbeds, in addition to clearly identifiable existing features such as the roadway and stream. For example, it is even possible to see the direction of field cultivation [44].

2.3. Areas of Interest

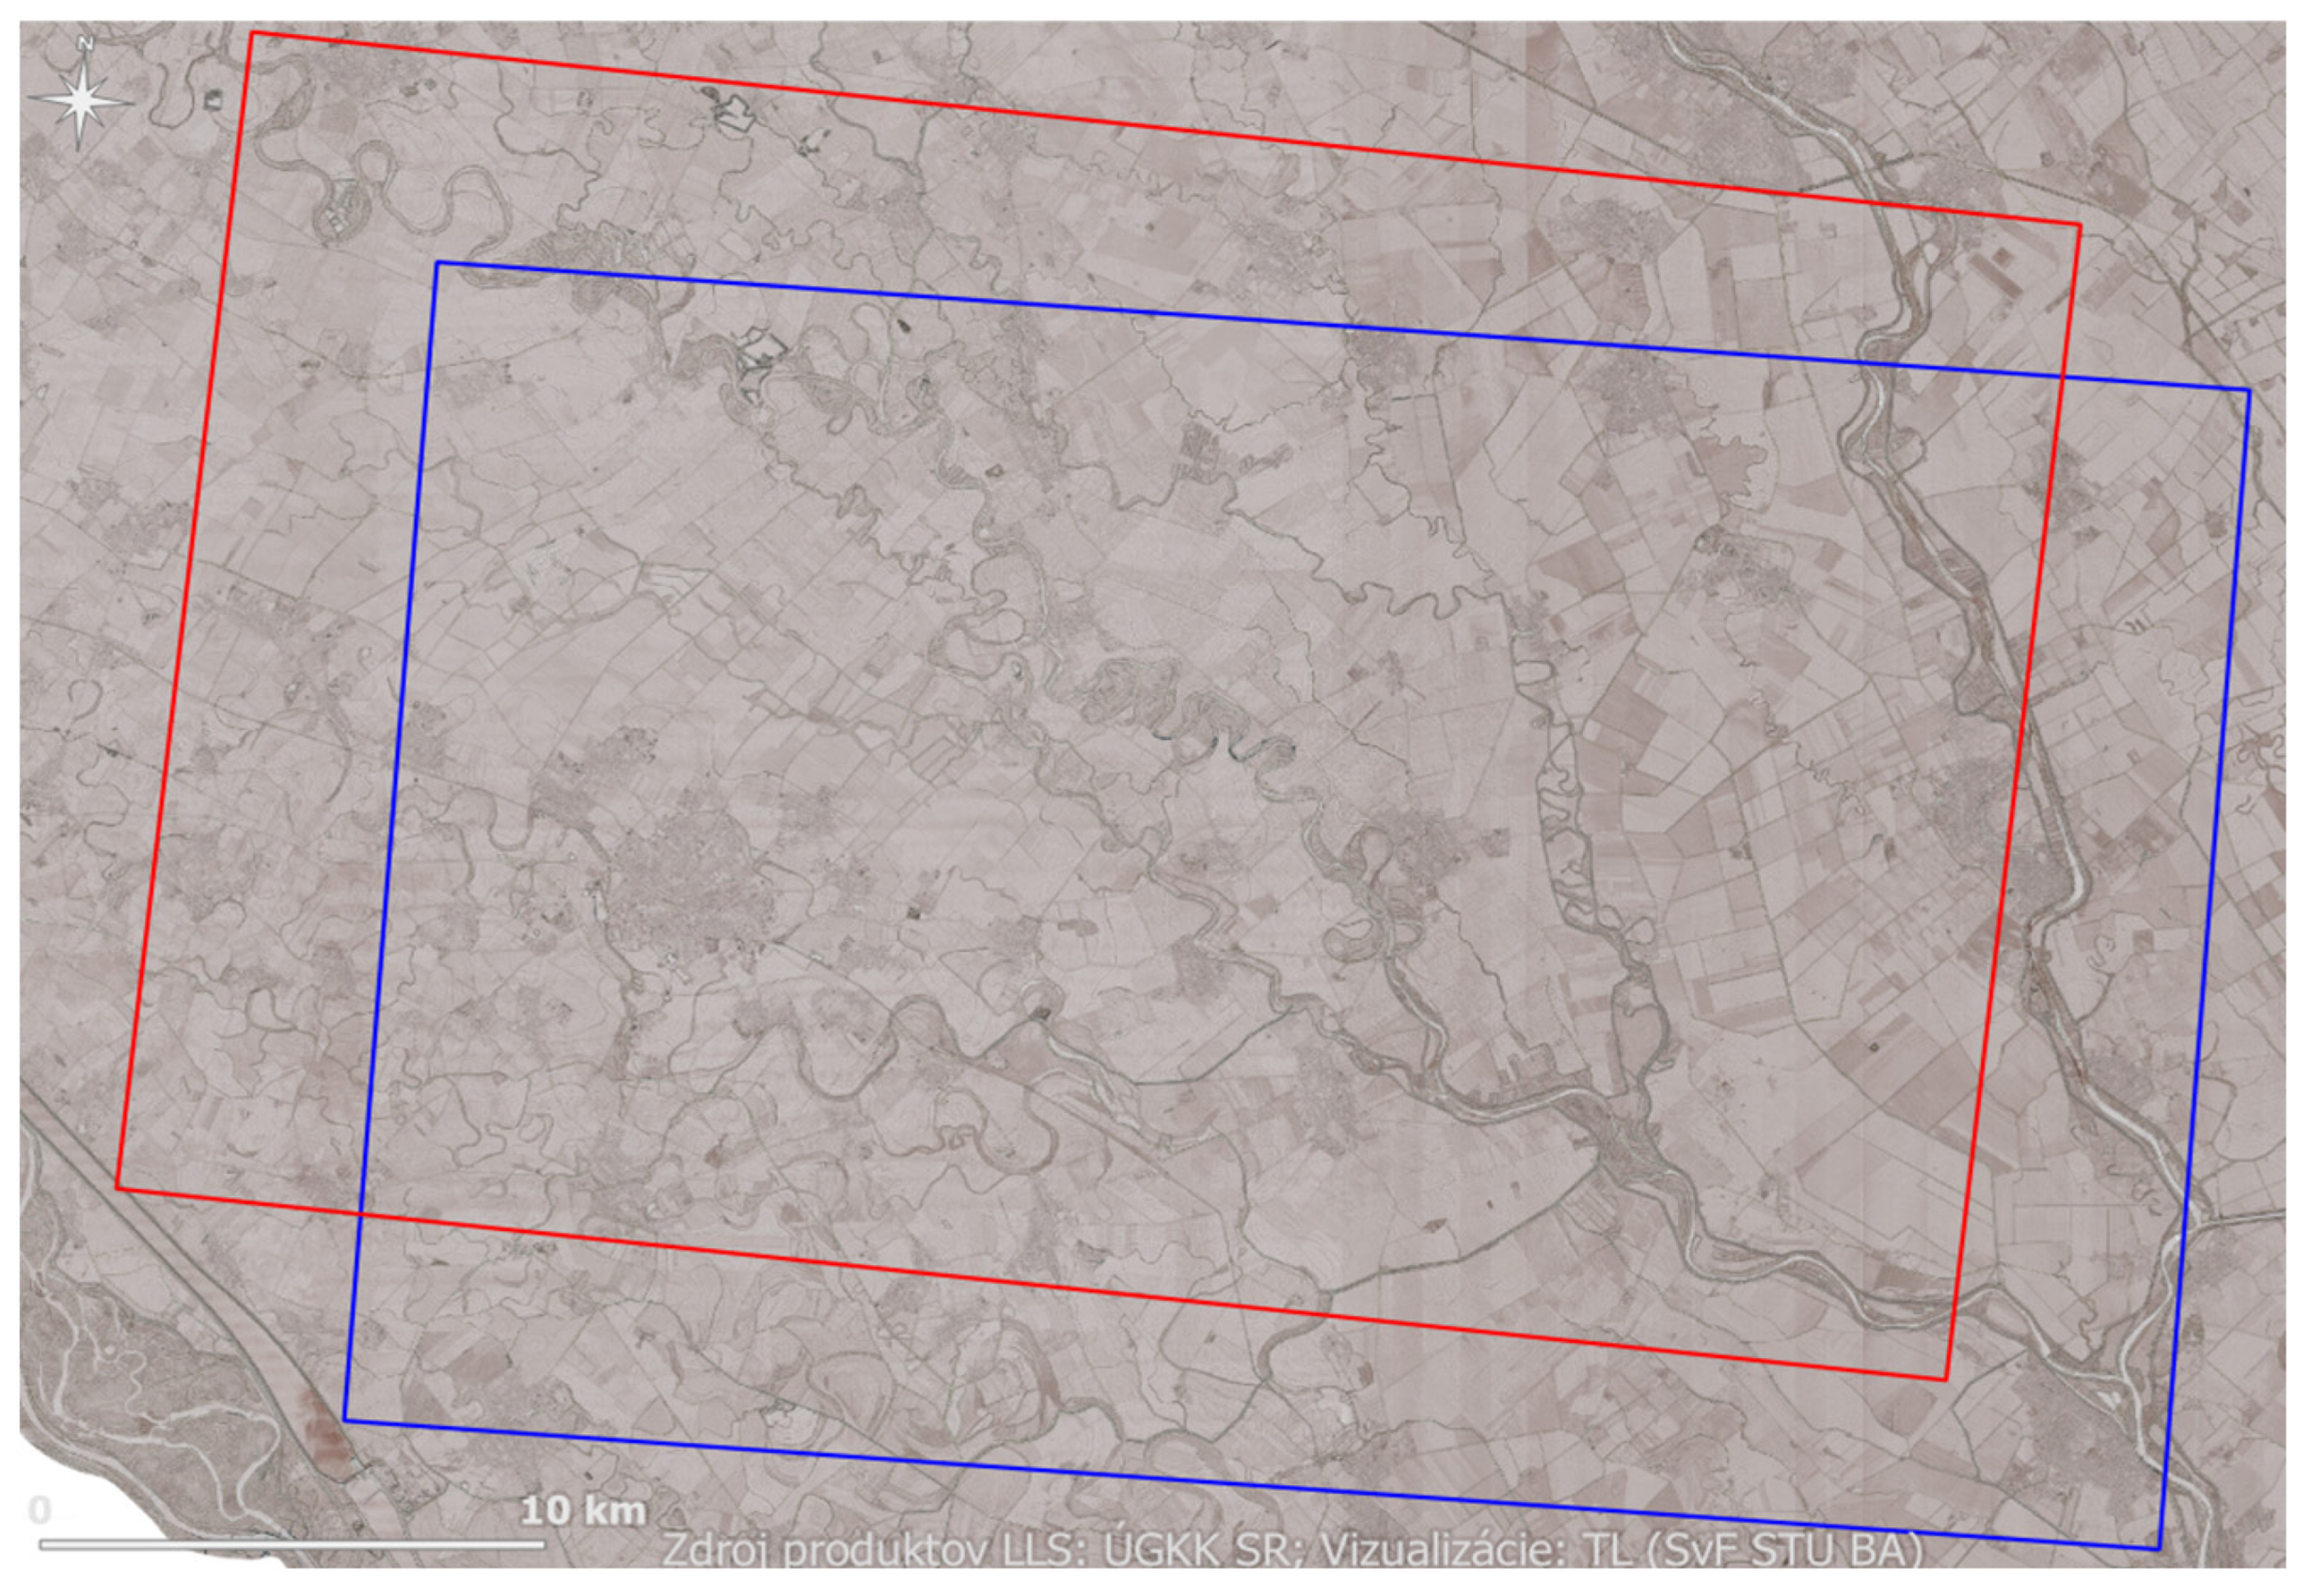
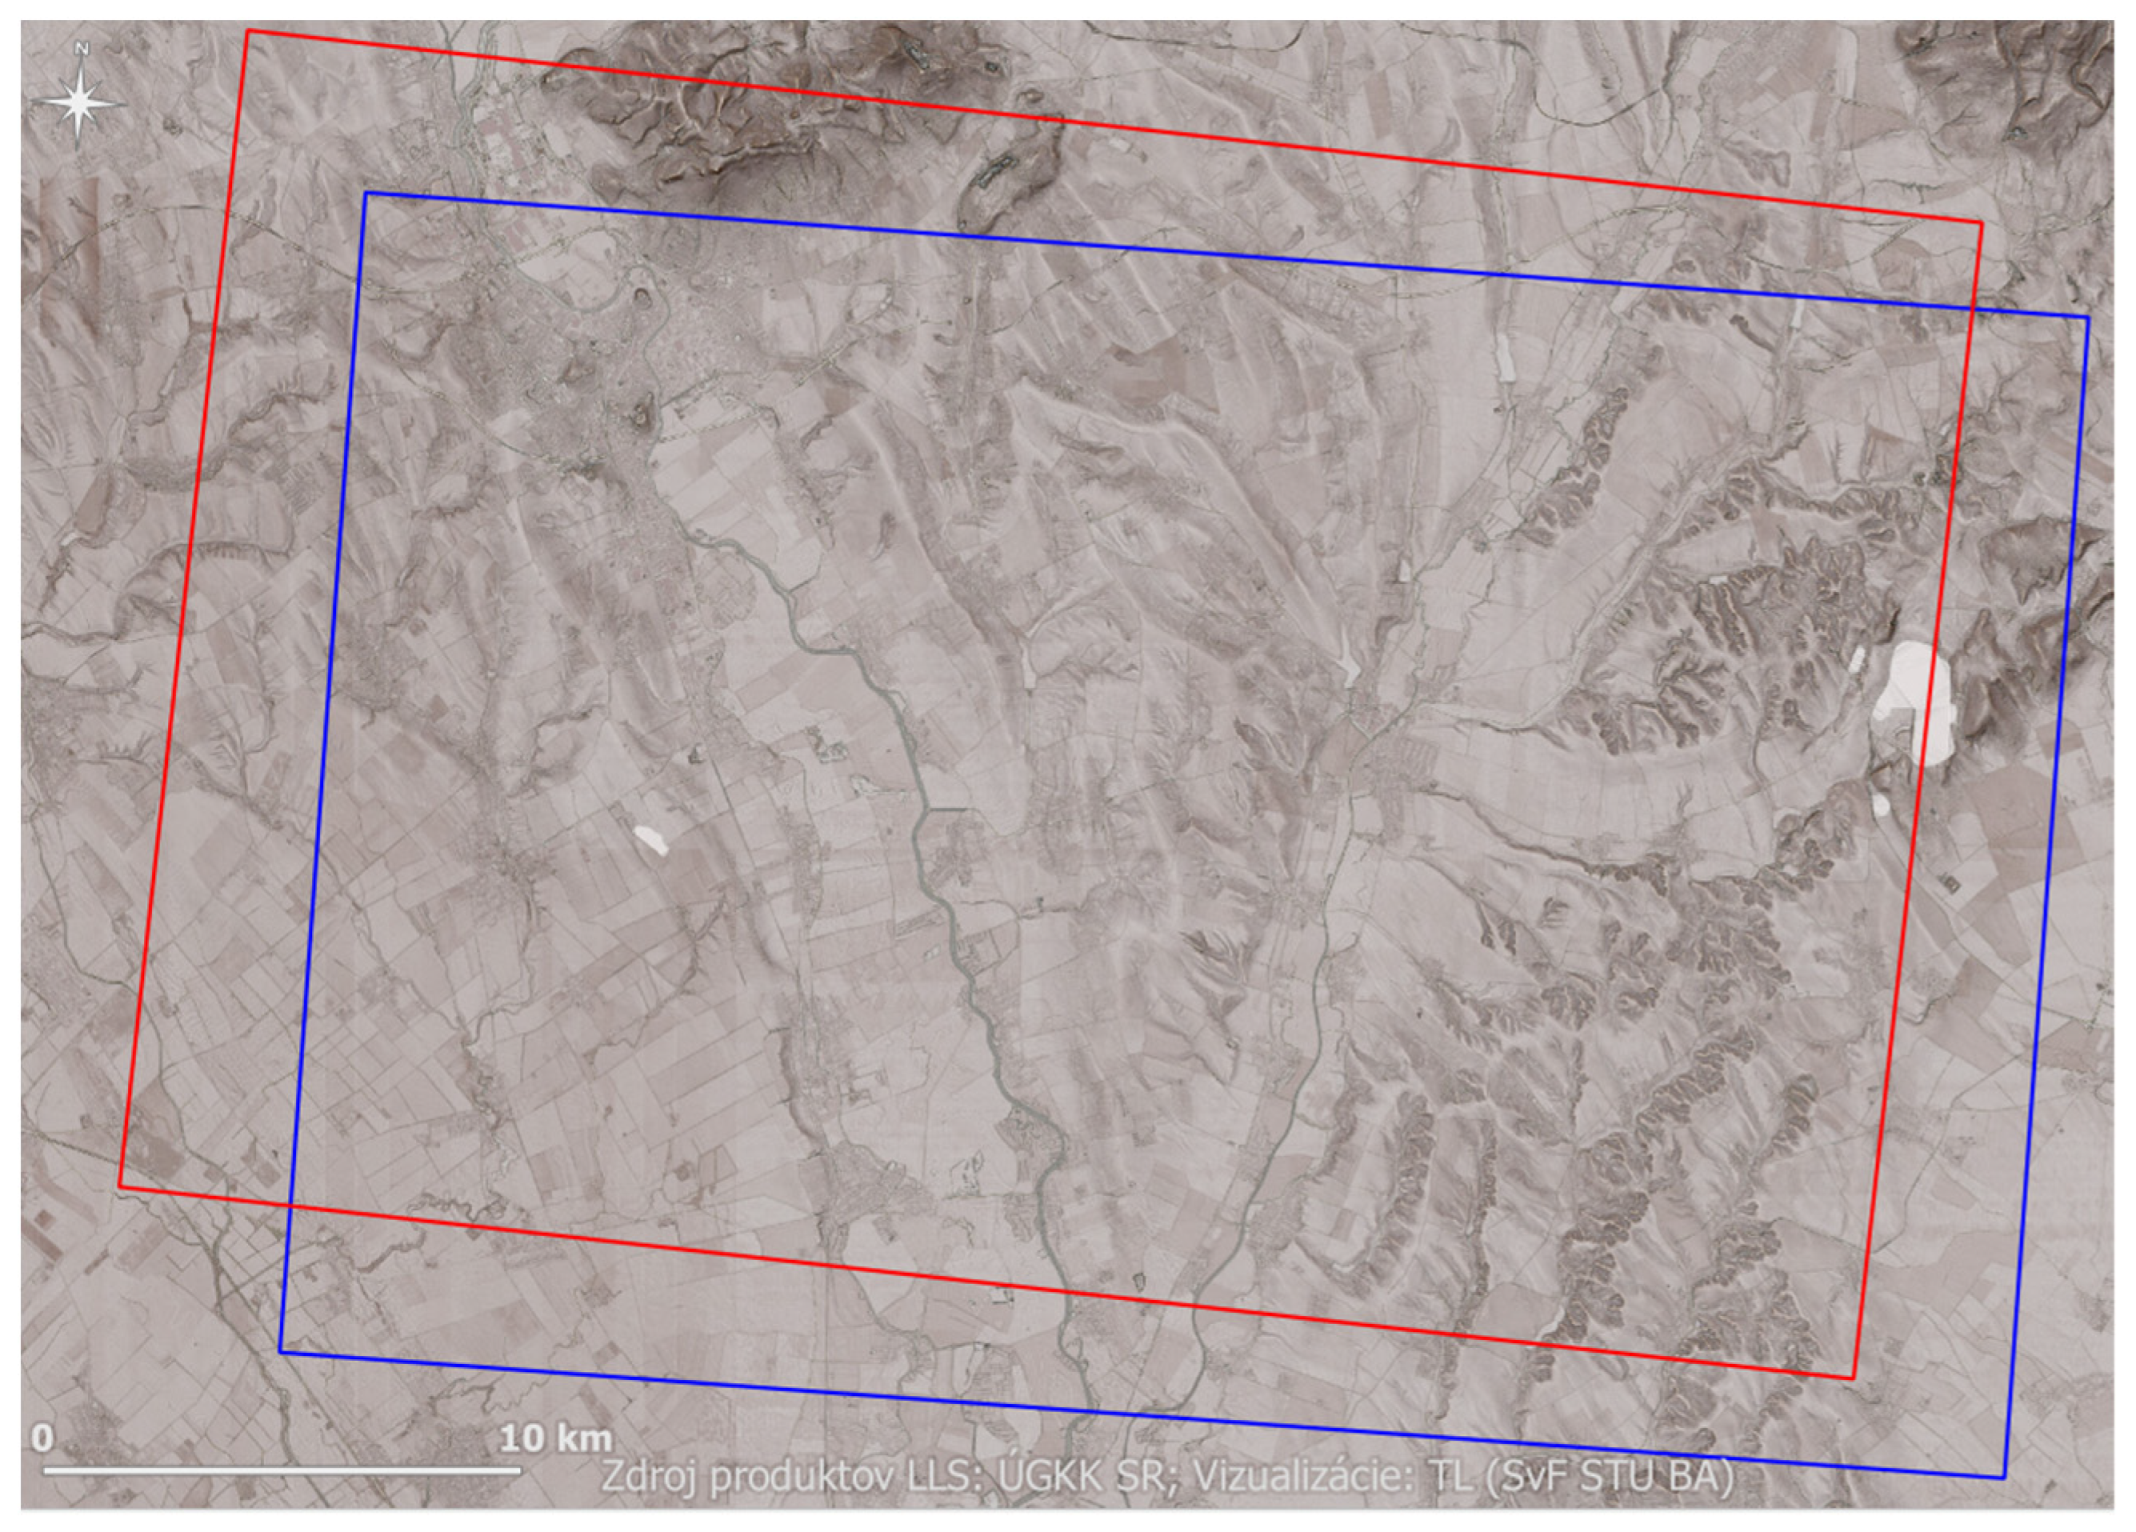
Within the scope of the work, we explored 4 sites with different landforms. Each territory consisted of 4 adjacent map sheets in both the First and Second Military Surveys. The locations of the sites within Slovakia are shown in Figure 3.
The Danube Lowland (Figure 4) was chosen because of its flatness. In the First Military Survey, these are map sheets VIII-10, VIII-10, IX-9 and IX-10. In the Second Military Survey, these are map sheets XXVI-45, XXVI-46, XXVII-45 and XXVII-46.
The second area of interest is the undulating terrain in the surroundings of the town of Vráble (Figure 5). The area is depicted on the map sheets X-10, X-11, XI-12 and XI-13 in the First Military Survey and on the map sheets XXVIII-43, XXVIII-44, XXIX-43 and XXIX-44 in the Second Military Survey.
The third area of interest is a moderately rugged mountainous area of Považský Inovec (Figure 6). On the maps of the First Military Survey, it is depicted on map sheets IX-3, IX-4, X-5 and X-6. In the Second Military Survey, it is on map sheets XXVII-39, XXVII-40, XXVIII-39 and XXVIII-40.
The last area represents rugged mountains of Veporské Vrchy (Figure 7). In the First Military Survey, it corresponds with map sheets XVI-9, XVI-10, XVII-9 and XVII-10. In the Second Military Survey, with map sheets XXXIV-39, XXXIV-40, XXXV-39 and XXXV-40.

2.4. Identifying Control Points and Data Processing

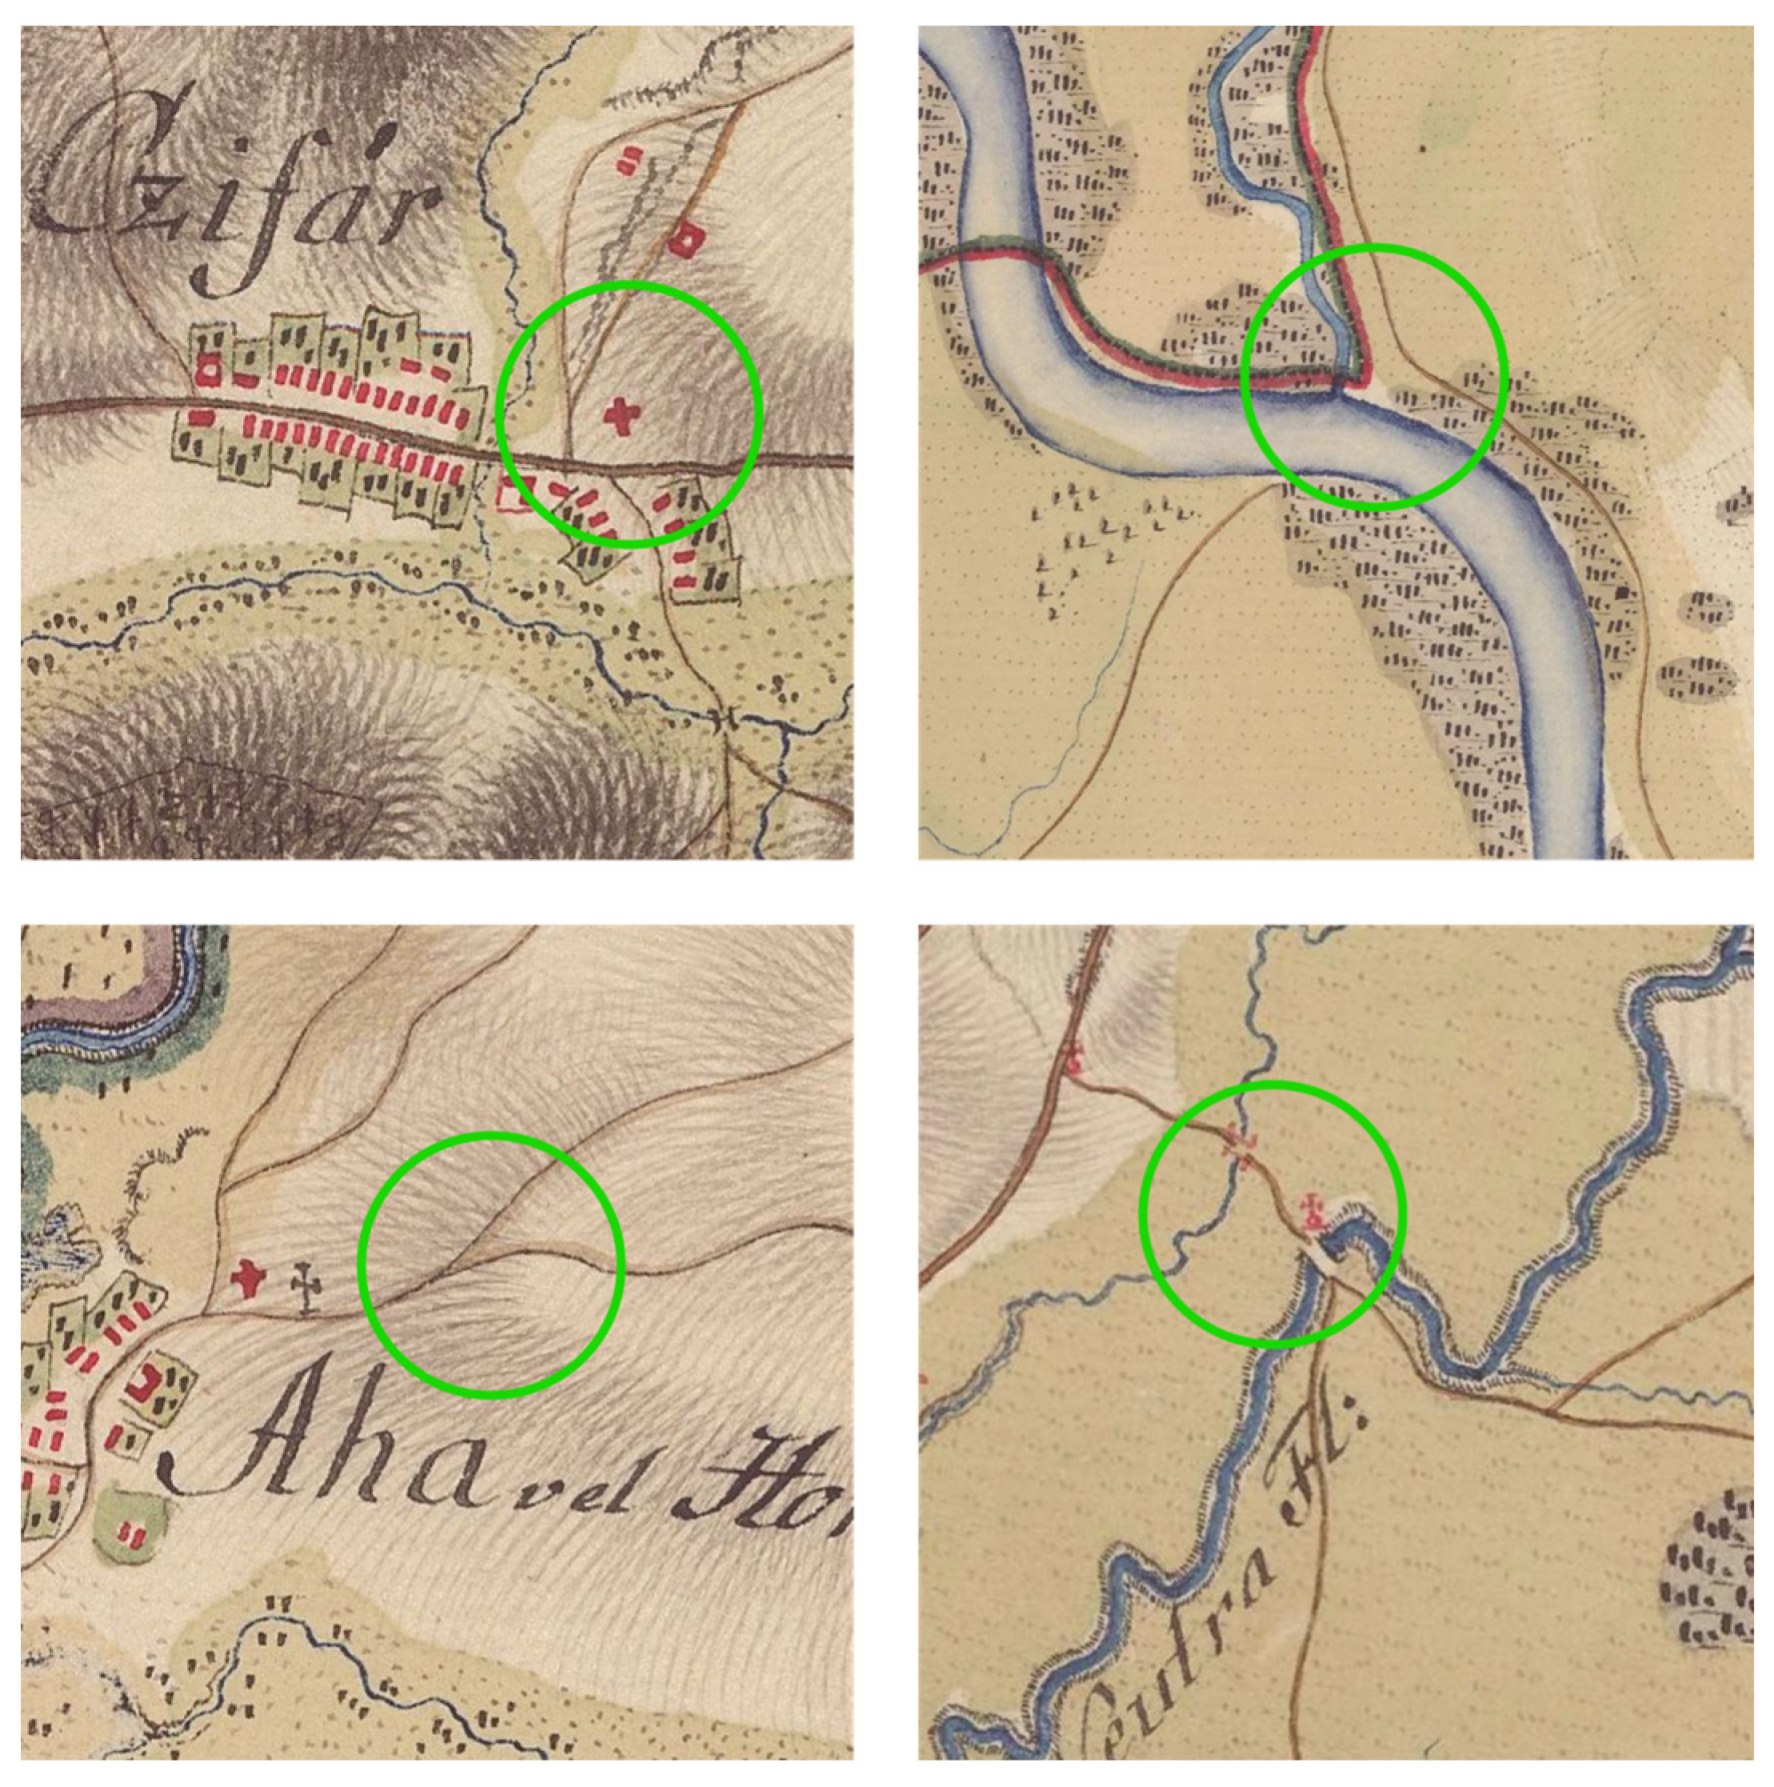
In the search for control points, we attempted to distribute them evenly over the areas of interest, and covering areas on edges and corners of the map sheet was also a priority (when possible). The control points were chosen as easily identifiable objects on the military mapping maps, mainly churches (centre), bridges (centre or edge of the map symbol), crossroads and river confluences. A more detailed description of the map features of the Second Military Survey can be found in [45]. A sample of the control points is shown in Figure 8 and Figure 9.
The control points on the military maps were then linked in the GIS software environment in a vector layer with the points on the maps mentioned in the previous section (Section 2.2), thus also providing information about the distance between the pair of points. For each pair of points, we also recorded which point it was and on which type of map the control point was found. These attributes were later used in the calculation of statistics and ranking point categories according to their accuracy (for more details, see the Supplementary Materials S1 and S2).

2.5. Georeferencing of Areas of Interest and Assessing the Accuracy of Georeferencing Existing Maps

Georeferencing was performed in ArcGIS Pro 3.2, which includes affine and second- degree polynomial transformations and also allows real-time tracking of map sheet deformations and automatically calculates residuals for a sufficient number of control points. Before georeferencing, it was necessary to crop the map sheets so that only map windows remained (and also to check the contact of the map sheets).
In the affine transformation, at least 3 pairs of points are required. However, a larger number of pairs of points distributed over the whole transformed image is needed for better results. In the second-degree polynomial transformation, 6 control points are needed, and, as in the affine transformation, it is true that with a higher number of control points (at least 7), higher transformation accuracy can be achieved. We first georeferenced the maps using the control points found in the map data and then separately using the points found in the ALS data.
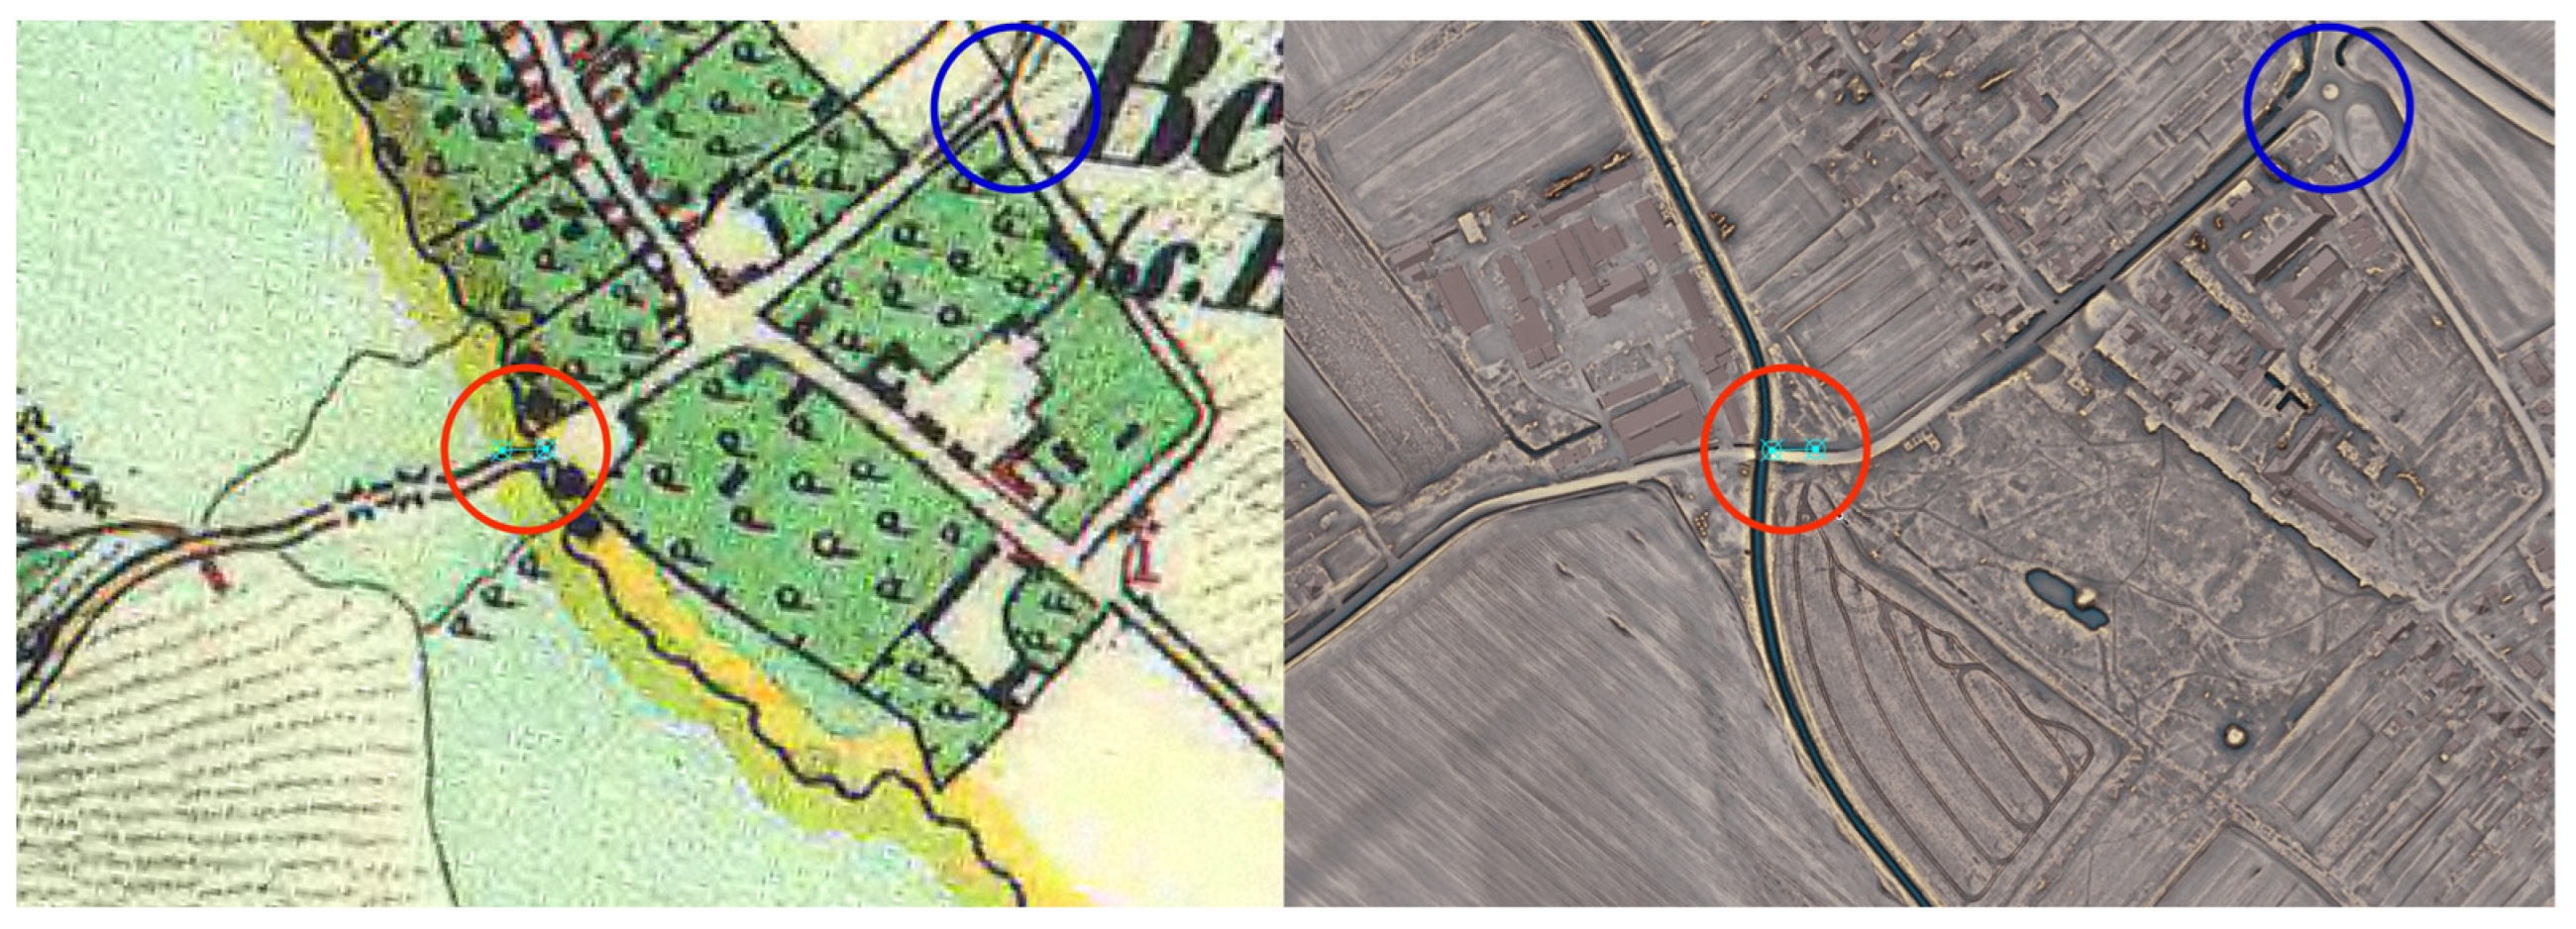
Both military mappings and both of their georeferencing (by ARCANUM and SEA) were analysed separately, with each area of interest analysed separately. We also examined the magnitudes of the deviations on the different types of control points and maps. Mean values and mean deviations of distances between points on military mapping and the used maps were calculated. We then found outliers using the interquartile range (IQR) [46] and recalculated the statistics again. Note that not all the control points were always used for georeferencing, as the residuals on some of them reached large values, and it turned out that they are not control points, even though they seemed to be (Figure 10). They were probably misinterpreted or not truly control points, or the objects considered had been changed in the meantime. Therefore, these points were excluded from the final transformation process.

2.6. Testing the Accuracy of Georeferenced Maps Using the Leave-One-Out Test

To evaluate the accuracy of the georeferenced maps, we applied a leave-one-out test. In this approach, we systematically omitted each control point from the georeferencing process one at a time, re-performed the georeferencing without that point, and then assessed the positional accuracy of the resulting georeferenced map at the omitted point. We conducted these tests separately for the First and Second Military Surveys, and both the affine transformation and the second-degree polynomial transformation.

3. Results

3.1. Assessment of the Current Georeferencing of Military Mapping Maps

Table 2 lists the results (mean distances and standard deviations) obtained for each area of interest and georeferencing for the First Military Survey. We applied outlier detection statistics, IQR (Table 2), to better detect potentially misidentified points (Figure 10). For example, Figure 10 shows a point on the bridge that is not a control point but could be incorrectly considered one. These points should then be excluded from further processing (based on individual assessment), and the accuracy parameters should be calculated without them (Table 2, last column). In Table 3, each category of control points is ordered by the achieved accuracy.
Table 4 and Table 5 show these statistics for the Second Military Survey.
Based on the accuracy of the maps used (Table 3 and Table 5), we calculated the statistics considering only the vectors to points on the most reliable source. These vectors represent connecting lines between points on the military map and their reference map location, and distances in Table 2 and Table 4 are the sizes of these vectors. If a given control point was identifiable on multiple reference layers, we selected the coordinates from the reference that overall yielded the highest precision (as determined by preliminary error analysis; for more details, see Supplementary Materials).

3.2. Increasing the Number of Checkpoints Using Specialised ALS Data Visualisation

At the same time, we searched for control points on the ALS data.
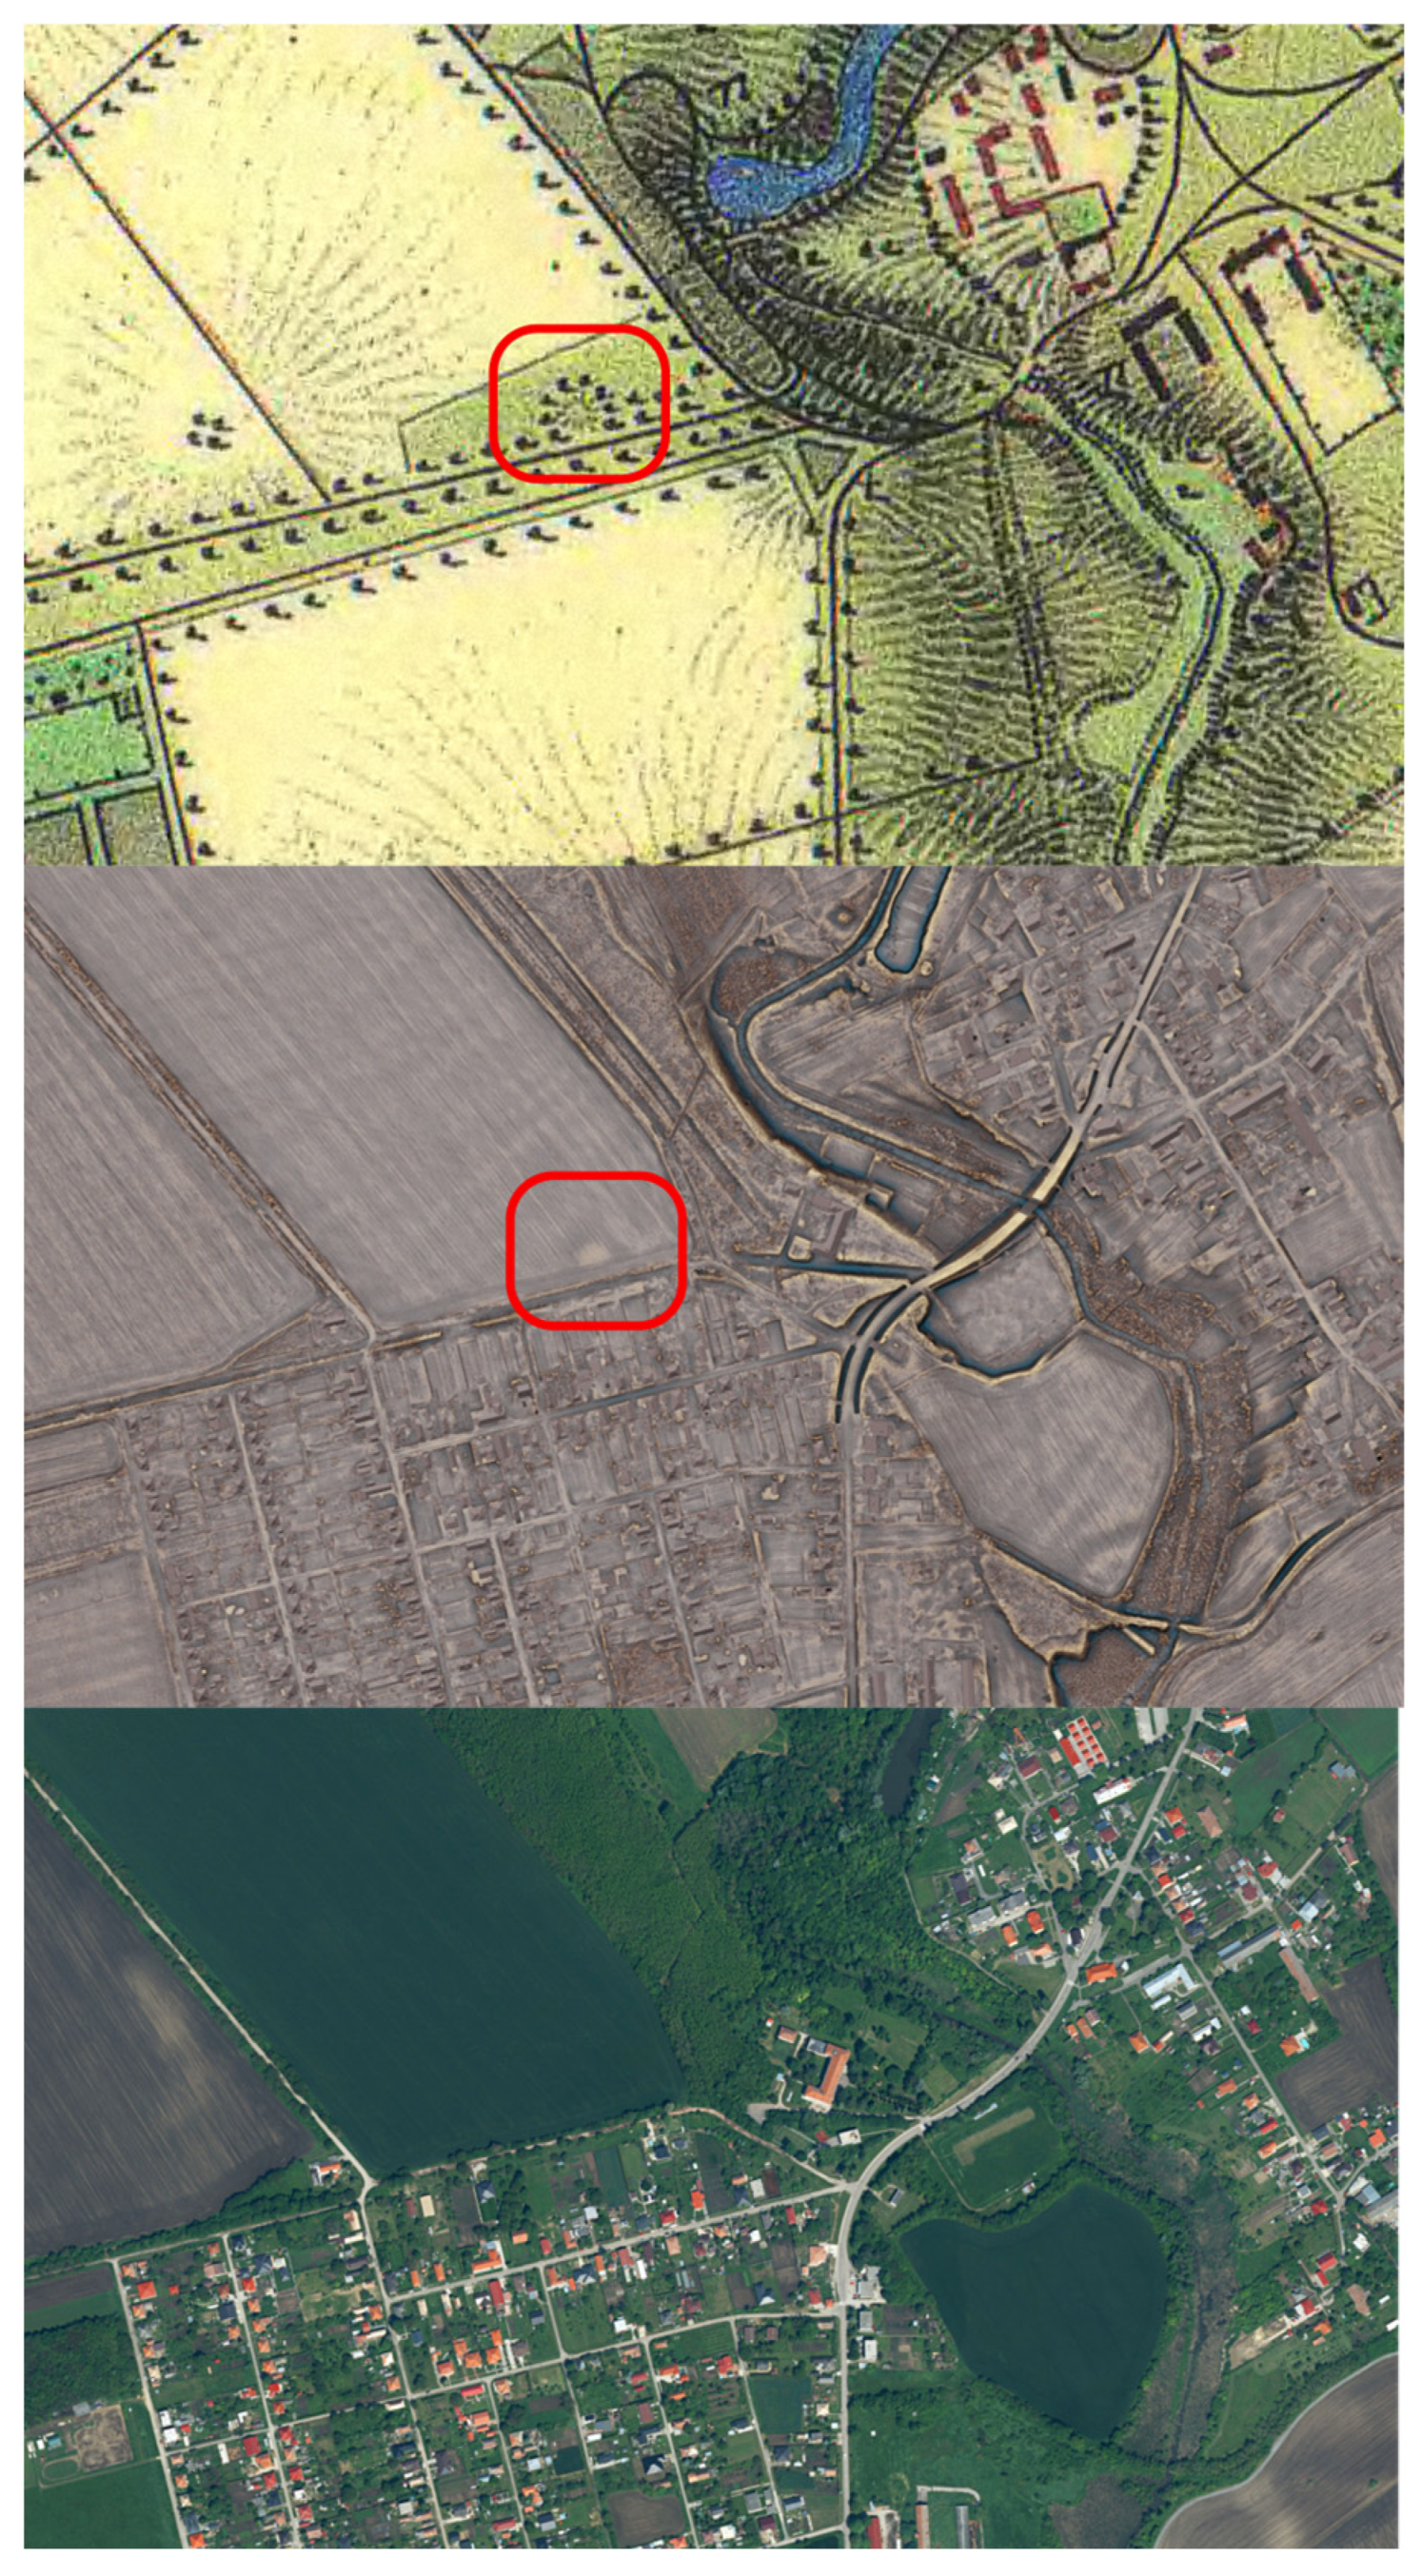
In Table 6, we can observe an increase in the number of control points when using ALS data. Here, the “Maps” columns contain the number of control points identifiable on early topographic maps and current maps, as described in Section 2.4. The control point identifiable on the best reference map was always used (see Table 3 and Table 5). For example, if the control point on the map was identified on the Historical Orthophoto mosaic and also on the Special Map of Hungary 1:75,000, then we used the control point from the Historical Orthophoto mosaic because it ranked higher in Table 3 and Table 5. The number of control points from ALS is higher because we have also managed to find features that are not visible on the maps. For example, Figure 11 shows a situation in which a control point (elevation) is visible and found on the ALS visualisation but not on the orthophotomap. The percentage increases in the number of control points are also shown in Table 6.

3.3. Our Georeferencing of Areas of Interest Based on ALS Data

As written above (Section 2.5), for georeferencing, we used the affine transformation and second-degree polynomial transformation. The resulting residuals using the affine transformation are shown in Table 7 (the First Military Survey) and Table 8 (the Second Military Survey). The resulting residuals using the second-degree polynomial transformation can be found in Table 9 (the First Military Survey) and Table 10 (the Second Military Survey). The results suggest the possibility of improving the transformation by using control points from ALS data.
As for the problem of connecting map sheets, which occurs in these cases, it can be solved by combining map sheets from the entire area of interest into a mosaic and then georeferencing it as a whole, like in the works of [7,8,9,15,30,31]. However, in this work, we focused on transforming each map sheet separately.
Subsequently, a second-degree polynomial transformation was used for georeferencing. The results for the First Military Survey are shown in Table 9. The results for the georeferencing of the Second Military Survey are presented in Table 10.
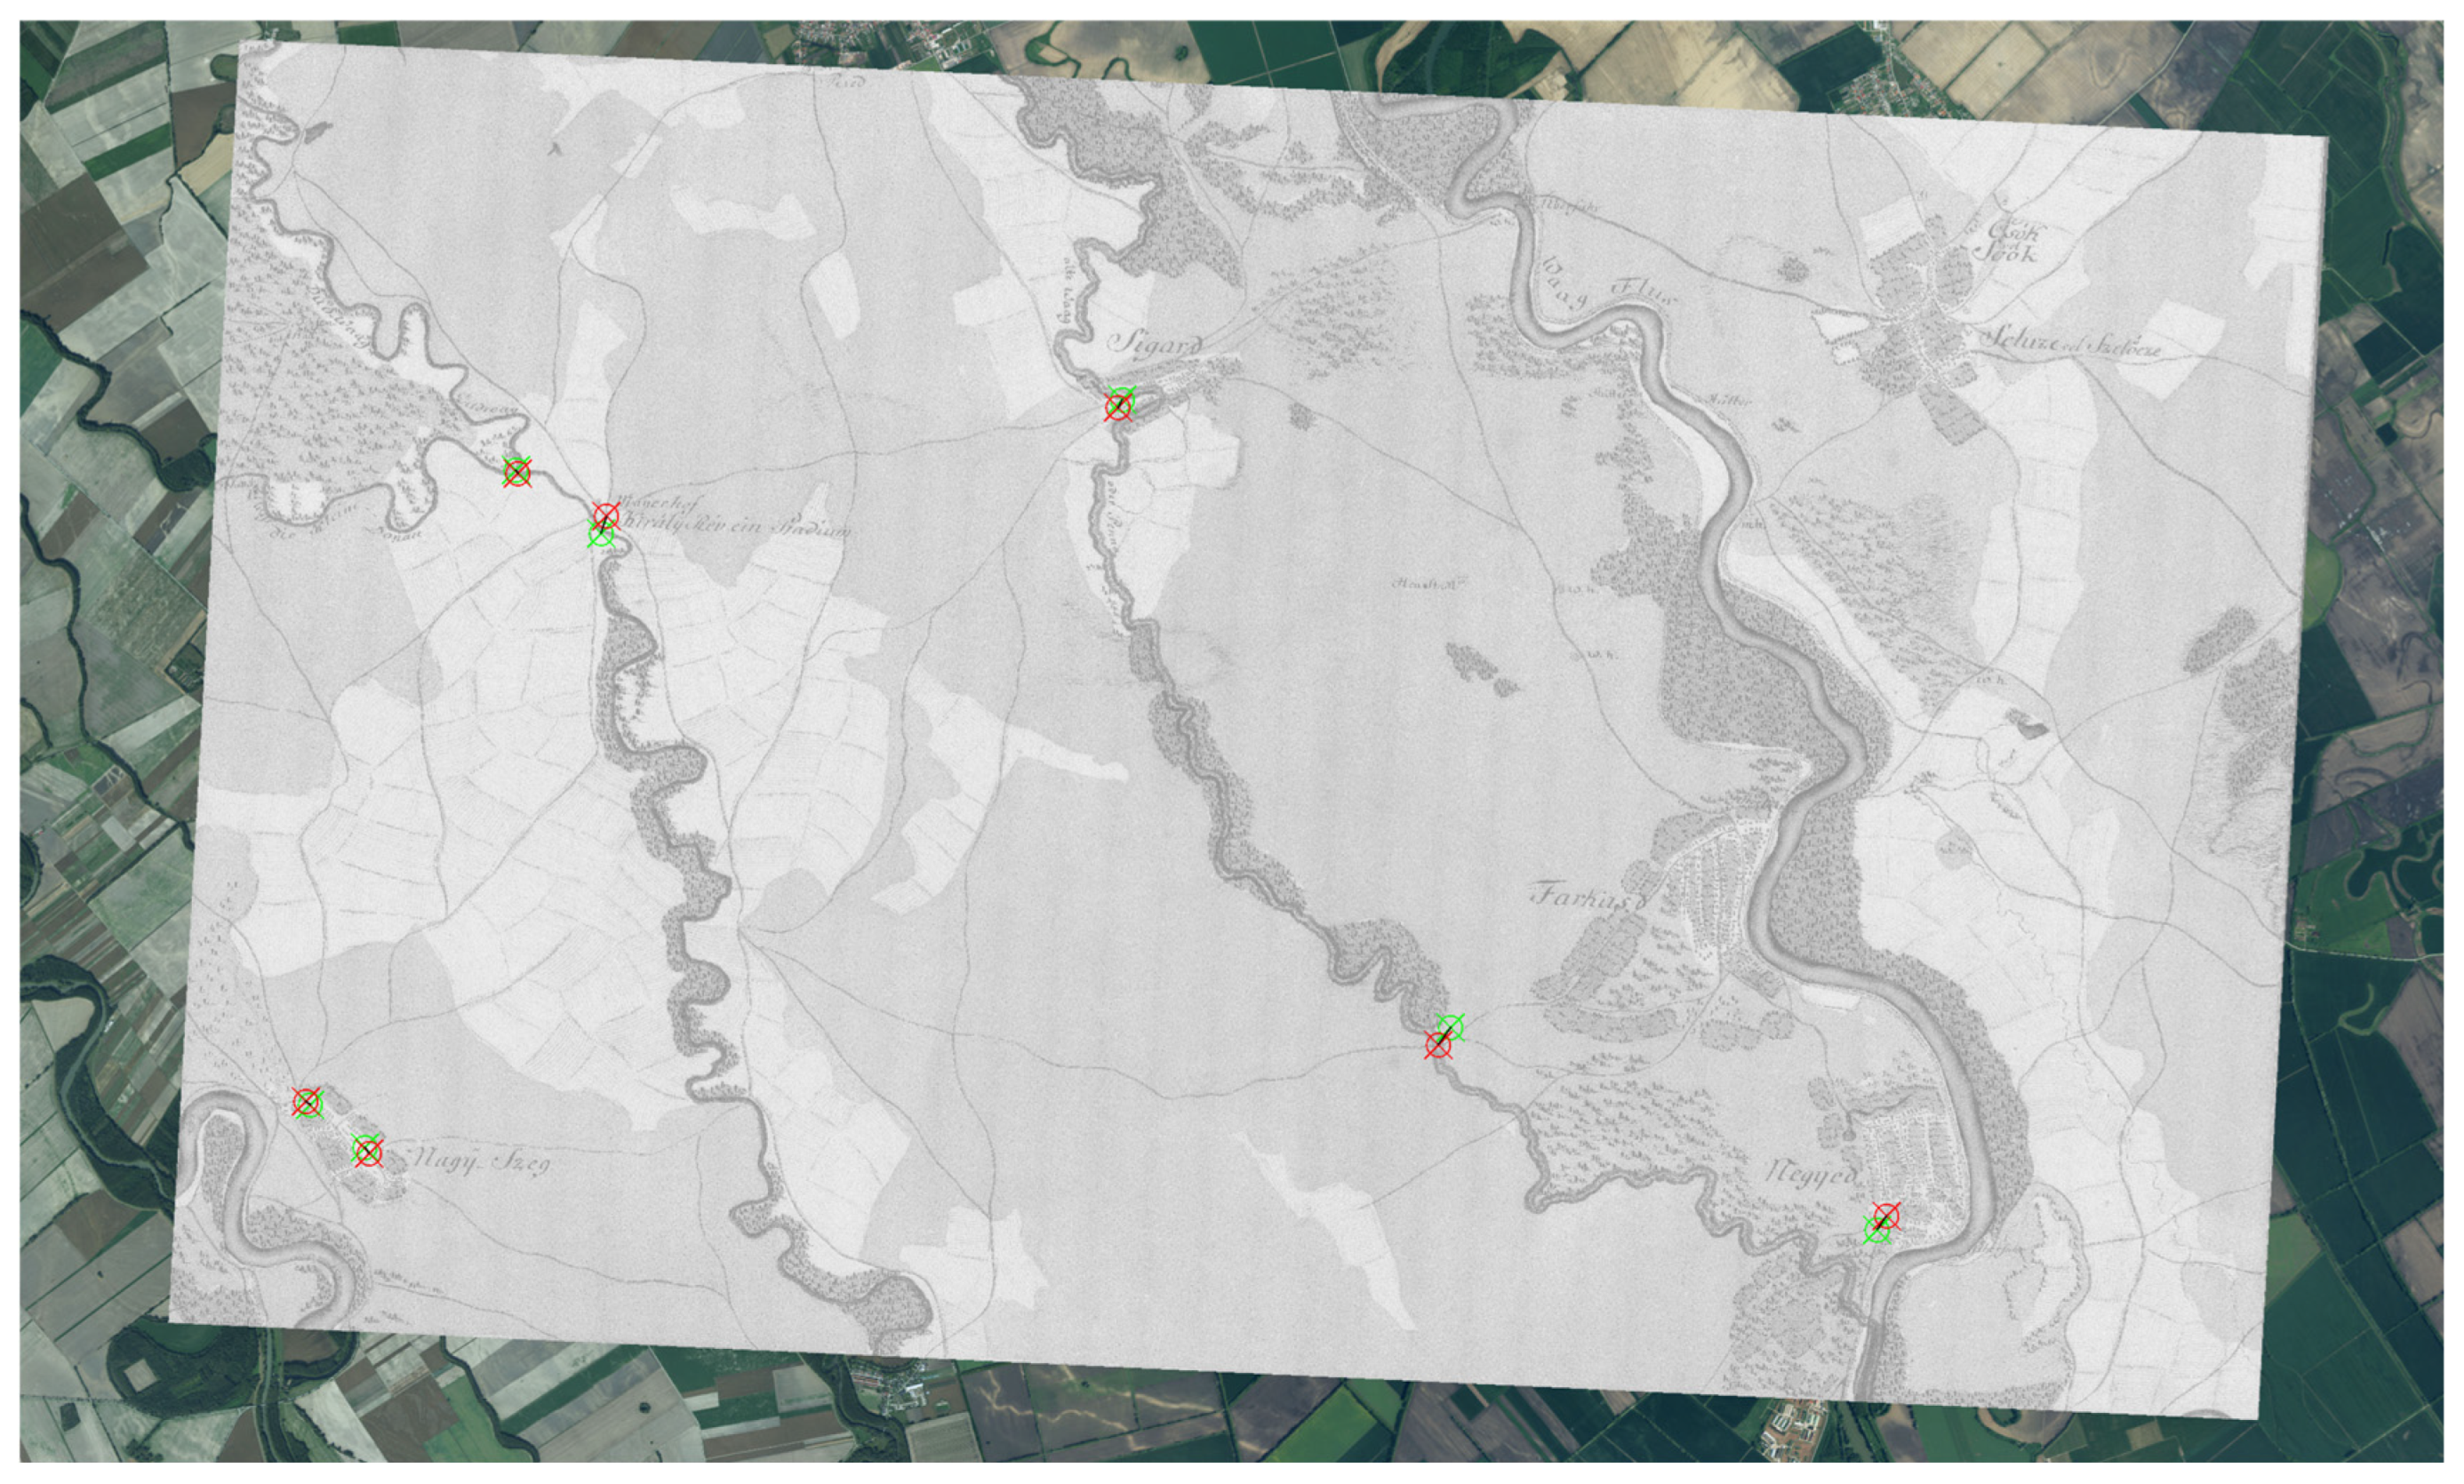
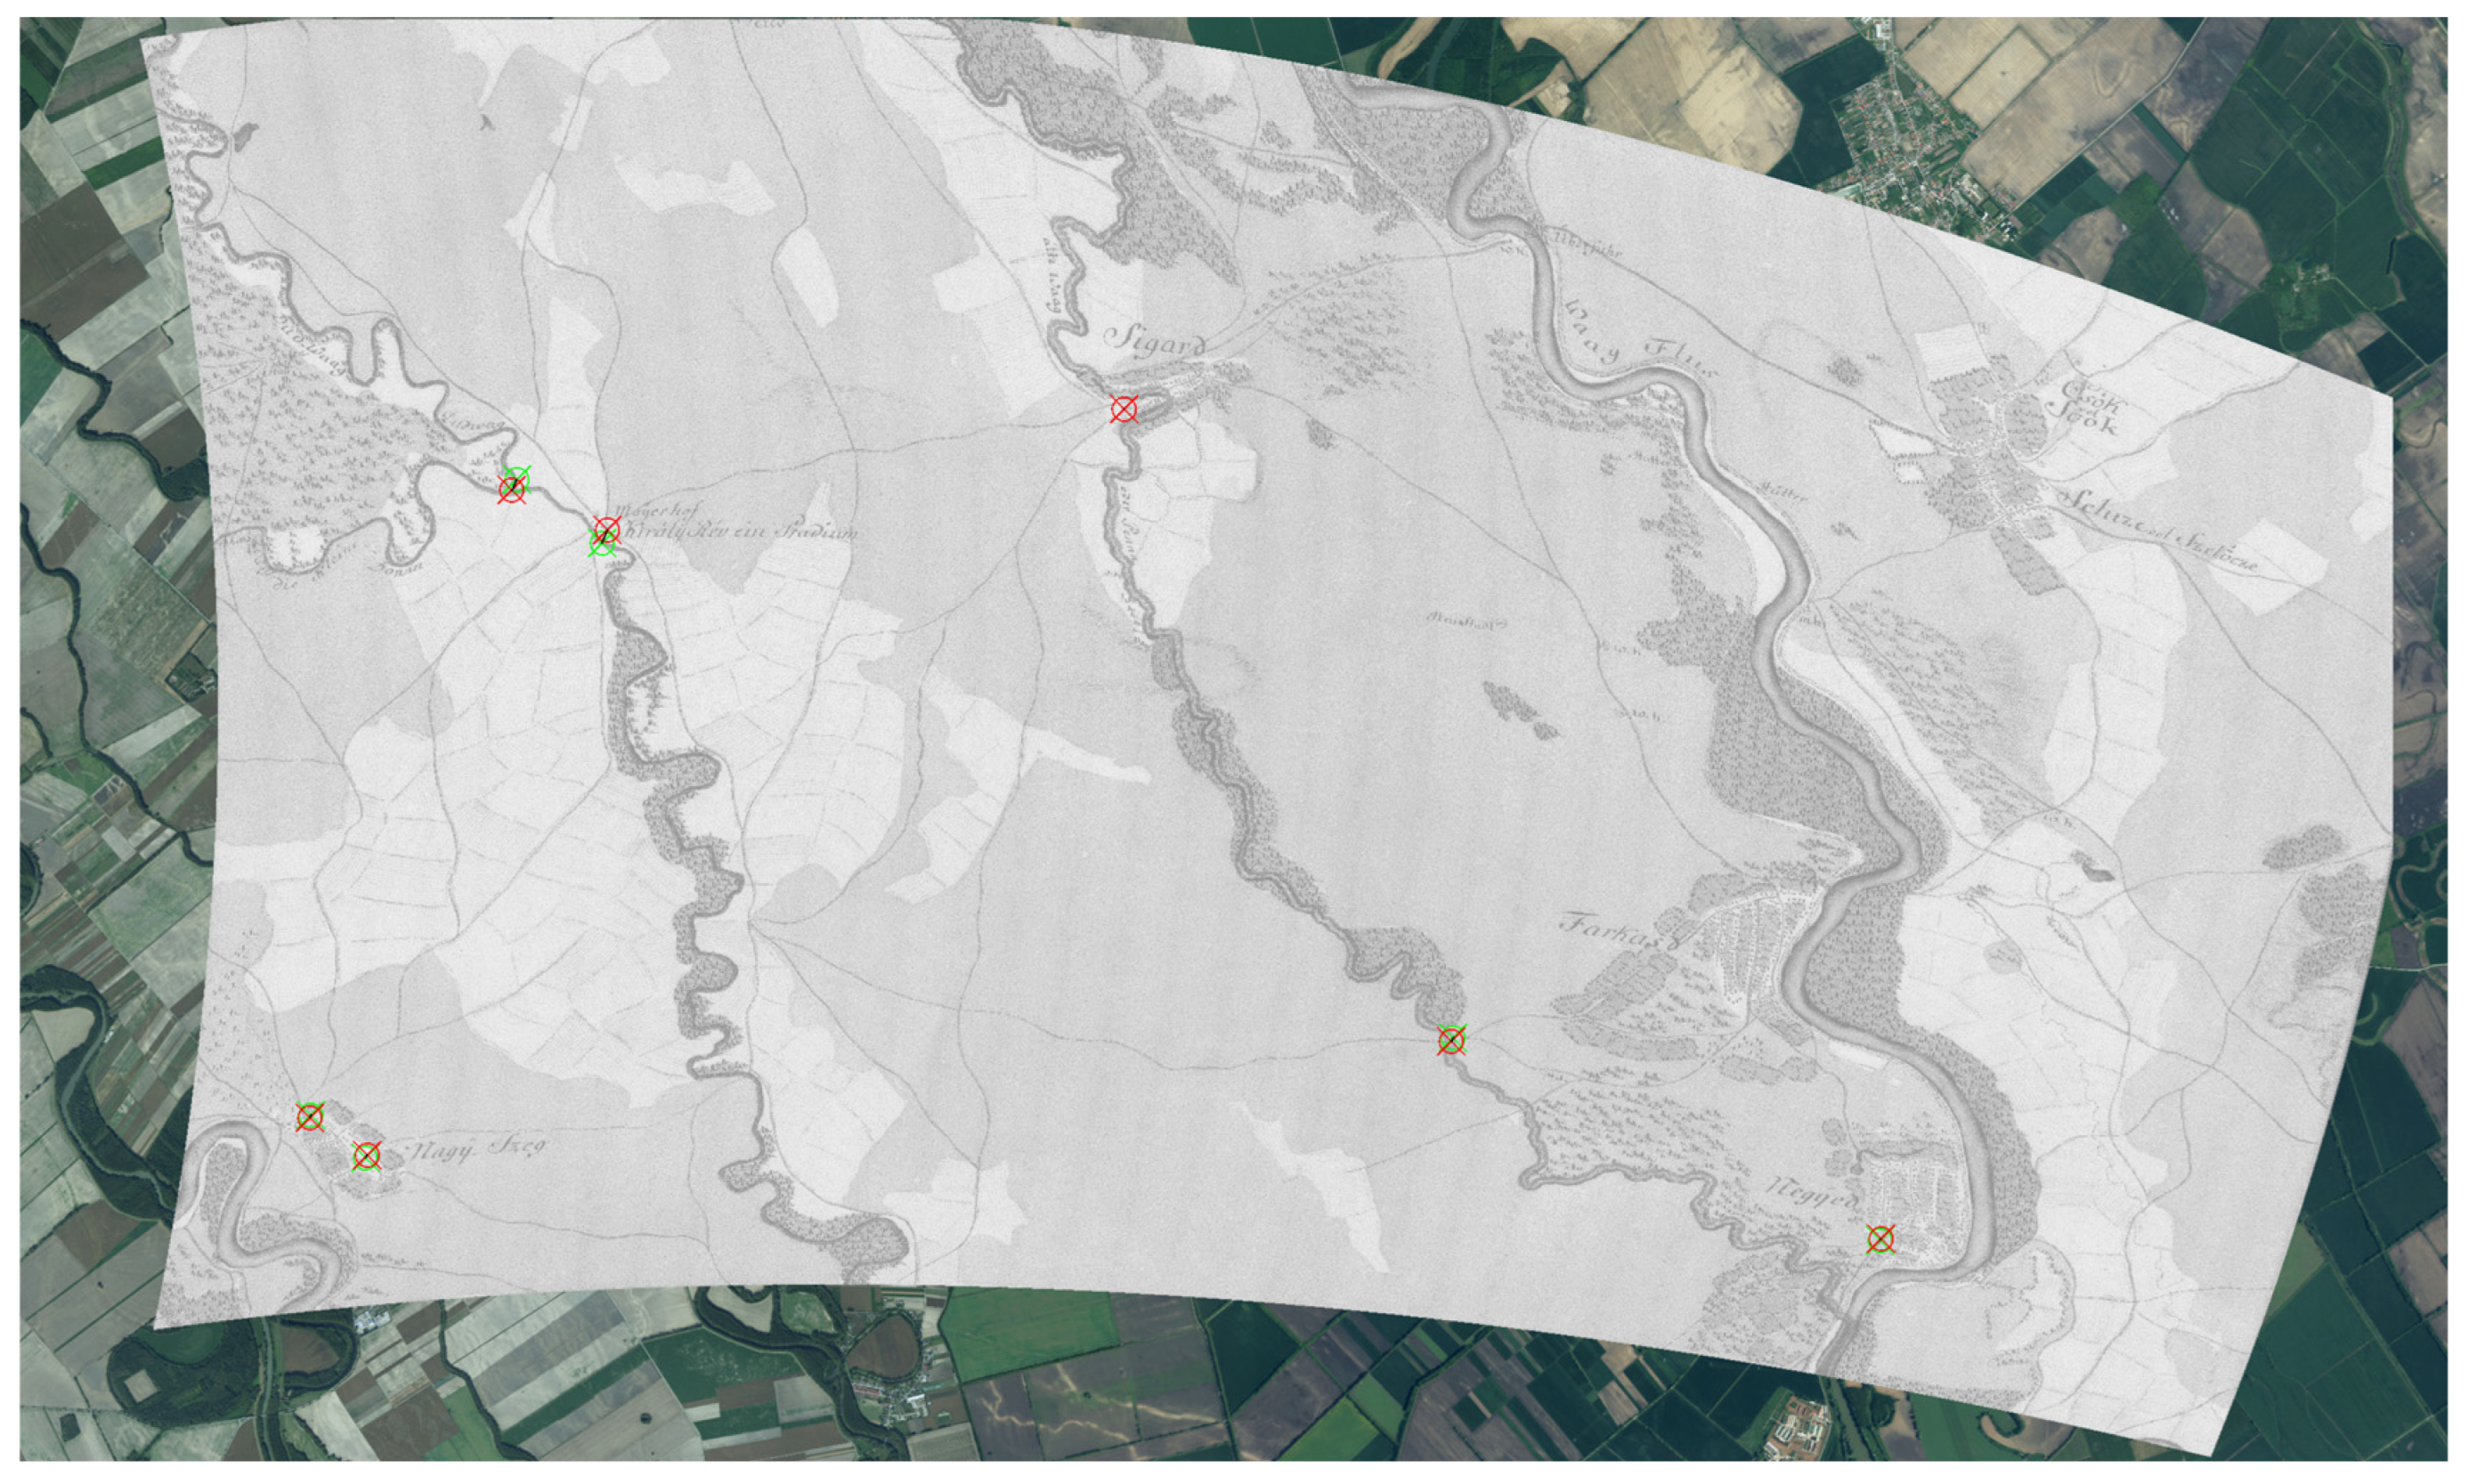
As might be expected, in the second-degree polynomial transformation, the map sheets do not preserve their shape in the same way as in the affine transformation. The example of such a deformation, which could occur if we use a second-degree polynomial transformation and only a few poorly distributed control points, is the map sheet IX-10 from the First Military Survey. An example of the transformation of this map sheet by the two transformations is shown in Figure 12 (affine transformation) and Figure 13 (second-degree polynomial transformation). Such a deformation could have been prevented by a larger number of control points with better distribution. Figure 12 and Figure 13 also show the distribution of the control points found on this map sheet (green and red markers).
Table 2, Table 4, Table 7, Table 8, Table 9 and Table 10 show that, in general, this work achieves better results on more undulating terrain and low mountains with respect to the residuals obtained. This may be because flatter terrain is more suitable for construction and so is more susceptible to change. Intensive agricultural activity on the lowland, and hence heavy ploughing, made many topographical features disappear. On the plain, the landscape is also being reshaped by natural activity (meandering of watercourses) and anthropogenic activity (regulation of watercourses in the 20th century, collectivisation of the landscape and the disappearance of historical landscape structures). At the same time, significant features on the hills (churches, castles and other buildings) were less visible on the plain, which reduced the possibilities of orientation during surveying.
In mountainous areas, it is often also difficult to find a sufficient number of control points (Table 9). Figure 14 demonstrates more control points found in mountainous areas using ALS data (bottom) compared to map sources (top). Showing that it is possible to find more control points using ALS is one of the most important results of this work. In addition, the better distribution of points within the raster then allows for more reliable georeferencing.
The results of the validation using the leave-one-out test are summarised in Table 11 and Table 12.
For both mappings, we observed that the least accurate results were typically found in areas with mountains (Table 11 and Table 12). In the case of the First Military Survey, affine transformation yielded slightly better results, whereas for the Second Military Survey, the second-degree polynomial transformation appeared to be the better choice, although the differences in RMS values were not substantial. In one case, map sheet 09-10 (First Military Survey), we recorded a very high deviation under the second-degree polynomial transformation (Table 11). However, this map sheet is the same one with a problematic distribution of a small number of control points mentioned above (Figure 11 and Figure 12).
For the First Military Survey, the highest georeferencing accuracy was achieved for map sheets with the largest number of control points, specifically sheets 11-12 and 11-13, which contained 22 and 23 points, respectively. Similarly, for the Second Military Survey, the most reliable results were obtained on sheets with 23 or more control points. It should be noted that in both cases, the best georeferencing accuracy was achieved in areas with undulating terrain.
We would like to emphasise that the values shown in Table 11 and Table 12 were calculated by omitting one, often important, control point. Of course, the results could be even better if all control points were used for georeferencing.

4. Discussion

In the first part of the paper, we analysed two previous georeferencing efforts of the First and Second Military Surveys on four different types of landscape. The statistics are interpreted numerically in Table 2, Table 4, Table 7 and Table 8.
In the First Military Survey, better results were obtained in the georeferencing made by ARCANUM [3,4]. The best results were obtained on the undulating terrain, and the worst results were obtained on the lowland and high mountains.
In the Second Military Survey, better georeferencing results were achieved by ARCANUM on undulating terrain and low mountains. Similarly to the First Military Survey, the worst figures were obtained on flat terrain and high mountains. This may be due to the lack of measurable points in the lowland concerning the measurement methods used at that time, and the lack of utilisation of those areas because of often flooded land or wetland areas. Another reason for this result may be the fact that flat terrain is more likely to be reshaped by different developments compared to rugged terrain [47]. In case of high mountains, control points are more difficult to find, and in addition, these areas may have been mapped with less accuracy in the past than populated, lower-lying areas.
Churches and bridges appear to be the most accurately identified control points. Churches have always been used as landmarks, and their position can be considered constant. The position of bridges and especially crossings may have changed over the years, or new ones may have been built close to the original ones plotted on the maps under study (Table 3 and Table 5). The most accurate map sources are the products of aerial photography. The sources are also arranged according to their reliability, which is due to the newer and more accurate methods used to create them.
Table 6 shows the numerical percentage change in the number of control points. For both mappings, the increase is greatest in the high mountains and specifically at points at river confluences or in areas with changed vegetation (Figure 11). The average increase in the number of control points for both mappings is around 30–50%. However, in forested and mountainous areas, it is important to distinguish between historic roads and new forest roads. Meandering watercourses in lowlands can also be particularly problematic, as their current position often does not correspond to their historical course.
We found that in the lowland area of the Second Military Survey, in exceptional cases, incorporating ALS points resulted in a slight increase in the mean error (Table 10). One possible explanation is that the existing control points were already well-distributed and sufficiently accurate, so the addition of new points, some of which may have contained minor identification errors, introduced slight distortions. Similarly, in flat terrain, the ALS data did not significantly improve the results in some cases, possibly because features such as roads and rivers are already well represented on aerial photographs and maps.
Table 7 shows that the number of points increased in most of the First Military Survey sheets using the ALS data, but at the same time, the residuals increased in a small number of the map sheets. For the Second Military Survey (Table 8), the number of control points used likewise increased when ALS data were used, and at the same time, the residuals decreased in isolated cases.
The results of the analysis of georeferencing accuracy and the validation of georeferenced maps indicate lower achieved accuracies in areas of low and especially high mountains. In both cases, however, forest cover and the presence of settlements can also be considered important factors. On map sheets where human activities were present in mountainous areas (e.g., settlements, isolated farms, pits, and mining activities), it was possible to identify several control points regardless of the type of terrain. Conversely, if the area (e.g., its edges) was covered by forest and the land was not intensively used, the number of identifiable control points decreased, resulting in lower accuracy as determined by validation.
A similar pattern was observed on the plains (Danubian Lowland), particularly in the case of the First Military Survey. In areas where permanent human activity was limited (e.g., map sheets IX-10 and IX-11), the number of control points was lower, which was reflected in the validation results of the georeferenced maps. During the period of the Second Military Survey, the lowlands had already been intensively modified [48,49] by water management projects, which significantly increased land use and settlement (e.g., homesteads, estates, farms). This, in turn, led to a substantial increase in the number of identifiable control points, as well as in their positional accuracy. The undulating landscape was also historically subject to relatively intensive agricultural use (fields, vineyards, meadows) and was densely settled. This is reflected in the low degree of forest cover, as fertile soils were more profitably utilised for agricultural purposes. Such a settled landscape is also interconnected by a relatively dense network of roads, which enabled the reliable identification of several control points in both the First and Second Military Surveys. This factor also contributed to the high positional accuracy achieved during the mapping of this area.
From Table 7, Table 8, Table 9 and Table 10, we can see that smaller residuals were achieved on most of the map sheets when using the second-degree polynomial transformation compared to the affine transformation, as expected. In this paper, we focused on affine and second-degree polynomial transformations because they are widely used and strike a balance between flexibility and stability. Thin plate spline, while used in some studies [10,15,20,27,31], can overfit when control points are sparse, and Helmert can be too rigid given the distortions in the historical maps. However, the aim of the article was not to select a suitable transformation method but to increase the number and reliability of control points.
The results of georeferencing maps from the First Military Survey correspond to the results of previous works, such as [7,8,9,11]. In [4], an accuracy of approximately 250 m is reported. In the case of affine transformation, in work [9], an accuracy of 1000–1300 m is achieved, and in the case of polynomial transformation, 280–390 m. The accuracy of the Second Military Survey was tested, for example, in works [7] (about 40 m) and [11] (about 200 m). According to our results, it is possible to reduce these values by applying ALS data (see Table 11 and Table 12). One of the options for improving georeferencing is to add control points from ALS to existing points from other map sources. However, in this work, we have chosen separate georeferencing to better assess this data source. Detailed results of statistical analyses are presented in the Supplementary Materials.
Finally, based on the results obtained, it can be argued that ALS data can be used for georeferencing various historical maps in the future. Although the achieved residuals were not significantly different in some cases, in all cases, we observed a significant increase in the number of control points we were able to identify. This is also facilitated by the specially developed visualisation of ALS data [42]. Specialised visualisation of ALS data with advanced forms of interpretation is addressed, for example, in the work [50]. The special visualisation of ALS data allows for the identification of a larger number of identical points that are not visible on conventional map materials (making it easier, for example, to identify elements under vegetation or building ruins). It also facilitates a more even and homogeneous distribution of control points across the entire map sheet.
Another contribution of this work is that the increase in the number of control points allows us to also use other, more complex transformations for georeferencing.

5. Conclusions

The aim of the work was to investigate the accuracy of two versions of georeferencing of the First and Second Military Surveys (by ARCANUM and SEA) in four areas with different landscapes. The main idea was to investigate whether it is possible to improve the transformations of military mapping maps and other historical maps using specialised ALS data visualisations. For the actual georeferencing, in the first stage, we used contemporary data, mid-20th-century data, and in the second stage, we used ALS data. Although we did not achieve better residuals in absolutely all cases when georeferencing using ALS data, the use of ALS data visualisations to transform historical data has great potential due to the higher number of control points found. This increase enables the application of other types of transformations (e.g., more suitable for dealing with deformed historical maps), enhancing the accuracy and flexibility of the georeferencing process. This potential was particularly evident in the case of maps of the Second Military Survey. Maps of the First Military Survey were primarily limited by the technology of data collection and display, and secondarily by the change of the landscape over time (larger time gap, significant changes in the landscape in the given periods).
Based on the results, ALS data and their visualisation represent a suitable source for future use in georeferencing historical maps.

Supplementary Materials

The following supporting information can be downloaded at https://www.mdpi.com/article/10.3390/ijgi14070274/s1. File S1: Detailed results of statistical processing and analysis of georeferenced maps from the First military survey; File S2: Detailed results of statistical processing and analysis of georeferenced maps from the Second military survey. Explanation of abbreviations in file names: 1M—First military survey, 2M—Second military survey, FL—lowlands, UL—undulaiting terrain, LM—low mountains, HM –high mountains, aff—affine transformation, pol2—second-degree polynomial transformation.

Author Contributions

Conceptualisation, Tibor Lieskovský, Tadeáš Kotleba and Renata Ďuračiová; methodology, Tibor Lieskovský and Tadeáš Kotleba; formal analysis and software, Tadeáš Kotleba and Jakub Šperka; programming, Tadeáš Kotleba and Jakub Šperka; validation, Tadeáš Kotleba, Tibor Lieskovský, Renata Ďuračiová; investigation, Tadeáš Kotleba and Tibor Lieskovský; resources, Tadeáš Kotleba, Tibor Lieskovský and Renata Ďuračiová; data curation, Tadeáš Kotleba and Tibor Lieskovský; writing—original draft preparation, Tadeáš Kotleba, Tibor Lieskovský and Renata Ďuračiová; visualisation, Tadeáš Kotleba and Tibor Lieskovský; original draft revision, Tibor Lieskovský and Renata Ďuračiová; supervision, Tibor Lieskovský and Renata Ďuračiová; project administration, Tibor Lieskovský and Renata Ďuračiová; funding acquisition, Tibor Lieskovský and Renata Ďuračiová. All authors have read and agreed to the published version of the manuscript.

Funding

This research was funded by the Slovak Research and Development Agency under Contract No. APVV-22-0151 and by grants VEGA 2/0035/22 and VEGA 1/0626/25 of the Scientific Grant Agency of the Ministry of Education, Science, Research, and Sport of the Slovak Republic and the Slovak Academy of Sciences.

Institutional Review Board Statement

Not applicable.

Informed Consent Statement

Not applicable.

Data Availability Statement

The data presented in this study are available from the corresponding author upon request (due to a data volume of more than 16 GB). The input lidar data is also available at: https://www.skgeodesy.sk/sk/ (accessed on 14 November 2024). The data are freely available, but the user is obliged to state the source as follows: “ÚGKK SR”.

Acknowledgments

We would like to thank the anonymous reviewers for reading the article and providing valuable suggestions to improve it. We also thank Alexandra Bucha Rášová for her assistance in editing and correcting the text.

Conflicts of Interest

The authors declare no conflicts of interest.

References

  1. Lieskovský, J.; Kaim, D.; Balázs, P.; Boltižiar, M.; Chmiel, M.; Grabska, E.; Király, G.; Konkoly-Gyuró, É.; Kozak, J.; Antalová, K.; et al. Historical Land Use Dataset of the Carpathian Region (1819–1980). J. Maps 2018, 14, 644–651. [Google Scholar] [CrossRef]
  2. Kanianska, R.; Kizeková, M.; Nováček, J.; Zeman, M. Land-Use and Land-Cover Changes in Rural Areas during Different Political Systems: A Case Study of Slovakia from 1782 to 2006. Land Use Policy 2014, 36, 554–566. [Google Scholar] [CrossRef]
  3. Horáčková, Š.; Pišút, P.; Falťan, V.; Chovanec, P.; Petrovič, F. Historical changes and vegetation development after intensive peat extraction in the lowland mires of Slovakia. Appl. Ecol. Environ. Res. 2018, 16, 5025–5045. [Google Scholar] [CrossRef]
  4. ARCANUM. Historical Maps. 2025. Available online: https://www.arcanum.com/en/technology/historical-maps/ (accessed on 12 November 2024).
  5. Timár, G.; Molnár, G.; Székely, B.; Biszak, S.; Varga, J.; Jankó, A. Digitized Maps of the Habsburg Empire—The Map Sheets of the Second Military Survey and Their Georeferenced Version; Arcanum: Budapest, Hungary, 2006; 59p, Available online: https://static-cdn.arcanum.com/media/mapire/pub/mkf_booklet.pdf (accessed on 12 November 2024).
  6. Zeman, M. The old map series on Slovakia and its www presentation. Cartogr. Lett. 2012, 20, 55–61. Available online: https://gis.fns.uniba.sk/kartografickelisty/archiv/KL20/6.pdf (accessed on 15 January 2025). (In Slovak).
  7. Zimova, R.; Pestak, J.; Veverka, B. Historical Military Mapping of the Czech Lands–Cartographic Analysis. In Proceeding of the First International Conference on Cartography and GIS, Borovets, Bulgaria, 25–28 January 2006; p. 36. [Google Scholar]
  8. Timár, G.; Biszak, S.; Székely, B.; Molnár, G. Digitized Maps of the Habsburg Military Surveys—Overview of the Project of ARCANUM Ltd. (Hungary). In Preservation in Digital Cartography; Jobst, M., Ed.; Lecture Notes in Geoinformation and Cartography; Springer: Berlin/Heidelberg, Germany, 2010; pp. 273–283. ISBN 978-3-642-12732-8. [Google Scholar]
  9. Janata, T.; Cajthaml, J. Georeferencing of Multi-Sheet Maps Based on Least Squares with Constraints—First Military Mapping Survey Maps in the Area of Czechia. Appl. Sci. 2020, 11, 299. [Google Scholar] [CrossRef]
  10. Affek, A. Georeferencing of Historical Maps Using GIS, as Exemplified by the Austrian Military Surveys of Galicia. Geogr. Pol. 2013, 86, 375–390. [Google Scholar] [CrossRef]
  11. Timár, G. GIS Integration of the Second Military Survey Sections—A Solution Valid on the Territory of Slovakia and Hungary. Cartogr. Lett. 2004, 12, 119–126. Available online: https://gis.fns.uniba.sk/kartografickelisty/archiv/KL12/13.pdf (accessed on 15 November 2024).
  12. Veverka, B.; Čechurová, M. Georeferencing of maps of the 2nd and 3rd military mapping. Cartogr. Lett. 2003, 11, 103–113. (In Czech) [Google Scholar]
  13. Talich, M.; Soukup, L.; Havrlant, J.; Ambrožová, K.; Böhm, O.; Antoš, F. New procedure for georeferencing maps of the 3rd military mapping. Cartogr. Lett. 2013, 21, 35–49. (In Czech) [Google Scholar]
  14. Bitelli, G.; Cremonini, S.; Gatta, G. Cartographic Heritage: Toward Unconventional Methods for Quantitative Analysis of Pre-Geodetic Maps. J. Cult. Herit. 2014, 15, 183–195. [Google Scholar] [CrossRef]
  15. Brovelli, M.A.; Minghini, M. Georeferencing Old Maps: A Polynomial-Based Approach for Como Historical Cadastres. e-Perimetron 2012, 7, 97–110. [Google Scholar]
  16. Kersten, T.; Stößel, L.; Lindstaedt, M. Digitisation and Georeferencing of an Oversized Historical Map of the Bailiwick of Neuland (Winsen/Luhe) Using Structure-from-Motion (SFM) Photogrammetry. KN-J. Cartogr. Geogr. Inf. 2024, 74, 53–69. [Google Scholar] [CrossRef]
  17. Baiocchi, V.; Lelo, K. Georeferencing the Historical Maps of Rome Between the Seventeenth and Eighteenth Centuries. In Proceedings of the CIPA 2005 XX International Symposium, Torino, Italy, 26 October 2005; p. 5. [Google Scholar]
  18. Timár, G.; Biszak, S. Digitizing and Georeferencing of the Historical Cadastral Maps (1856-60) of Hungary. In Proceedings of the 5th International Workshop on Digital Approaches in Cartographic Heritage, Vienna, Austria, 22–23 February 2010; Livieratos, E., Gartner, G., Eds.; pp. 559–564. [Google Scholar] [CrossRef]
  19. Hvizdák, L.; Tometzová, D.; Iannaccone, B.; Šoltésová, M.; Domaracká, L.; Kyšeľa, K. Old Mine Map Georeferencing: Case of Marsigli’s 1696 Map of the Smolník Mines. Int. J. Geo-Inf. 2023, 12, 345. [Google Scholar] [CrossRef]
  20. López González, C.; Orozco Carpio, P.R.; Romaní López, C. Urban Historiography and Graphic Reconstruction of a Historic Area in Valencia, Spain. Heritage 2024, 7, 5547–5568. [Google Scholar] [CrossRef]
  21. Bozzano, M.; Sguerso, D.; Zatelli, P.; Zendri, D.; Besana, A. Accuracy Evaluation for Plan-Reliefs and Historical Maps Created during WWI in Northern Italy. Int. J. Geo-Inf. 2024, 13, 101. [Google Scholar] [CrossRef]
  22. Malaperdas, G.; Grethe, R.; Zacharias, N. Depicting the Past: The Value of Old Maps and Topographic Diagrams in Cultural Heritage through GIS. J. Archaeol. Sci. Rep. 2023, 52, 104276. [Google Scholar] [CrossRef]
  23. Skaloš, J.; Weber, M.; Lipský, Z.; Trpáková, I.; Šantrůčková, M.; Uhlířová, L.; Kukla, P. Using Old Military Survey Maps and Orthophotograph Maps to Analyse Long-Term Land Cover Changes—Case Study (Czech Republic). Appl. Geogr. 2011, 31, 426–438. [Google Scholar] [CrossRef]
  24. Bai, X.; Xu, H. Understanding Spatial Growth of the Old City of Nanjing during 1850–2020 Based on Historical Maps and Landsat Data. Egypt. J. Remote Sens. Space Sci. 2023, 26, 25–41. [Google Scholar] [CrossRef]
  25. Liu, G.; Li, J.; Nie, P. Tracking the History of Urban Expansion in Guangzhou (China) during 1665–2017: Evidence from Historical Maps and Remote Sensing Images. Land Use Policy 2022, 112, 105773. [Google Scholar] [CrossRef]
  26. Luft, J.; Schiewe, J. Automatic Content—Based Georeferencing of Historical Topographic Maps. Trans. GIS 2021, 25, 2888–2906. [Google Scholar] [CrossRef]
  27. Howe, N.R.; Weinman, J.; Gouwar, J.; Shamji, A. Deformable Part Models for Automatically Georeferencing Historical Map Images. In Proceedings of the 27th ACM SIGSPATIAL International Conference on Advances in Geographic Information Systems, Chicago, IL, USA, 5–8 November 2019; ACM: New York, NY, USA, 2019; pp. 540–543. [Google Scholar]
  28. Luft, J.; Schiewe, J. Content-Based Image Retrieval for Map Georeferencing. Proc. Int. Cartogr. Assoc. 2021, 4, 1–8. [Google Scholar] [CrossRef]
  29. Gavette, P.; Page-Schmit, K. Utilizing Historic Cartography in 3D for Archaeological Prospection on Alcatraz. In Proceedings of the 2018 3rd Digital Heritage International Congress (DigitalHERITAGE) Held Jointly with 2018 24th International Conference on Virtual Systems & Multimedia (VSMM 2018), San Francisco, CA, USA, 26–30 October 2018; IEEE: New York, NY, USA, 2018; pp. 1–4. [Google Scholar]
  30. Timár, G.; Kiss, E. Web Publication of Schmitt’s Map of Southern Germany (1797)—The Projection of the Map Based on Archival Documents and Geospatial Analysis. Int. J. Geo-Inf. 2024, 13, 207. [Google Scholar] [CrossRef]
  31. Kuna, J.; Panecki, T.; Zawadzki, M. Methodology of Mosaicking and Georeferencing for Multi-Sheet Early Maps with Irregular Cuts Using the Example of the Topographic Chart of the Kingdom of Poland. Int. J. Geo-Inf. 2024, 13, 249. [Google Scholar] [CrossRef]
  32. Király, G.; Walz, U.; Podobnikar, T.; Czimber, K. Georeferencing of Historical Maps—Methods and Experiences. In Spatial Information Systems for Transnational Environmental Management of Protected Areas and Regions in the Central European Space; Rhombos-Verlag: Berlin, Germany, 2008; pp. 53–63. [Google Scholar]
  33. Technická Univerzita vo Zvolene. Historical Orthophoto Map of Slovakia. Available online: https://mapy.tuzvo.sk/hofm/ (accessed on 14 November 2024). (In Slovak).
  34. Dekan, T.; Honec, V.; Ševčík, M.; Potisk, P.; Michalík, Ľ. Technical Report 1st Orthophoto Mosaic Production Cycle of the Slovak Republic 2017–2019. 2021. Available online: https://www.geoportal.sk/files/zbgis/orto/technicka_sprava_ortofotomozaika_sr_2017-2019.pdf (accessed on 15 November 2024). (In Slovak).
  35. Geodetický a kartografický ústav Bratislava. Orthophoto Mosaic of Slovak Republic 2022. Available online: https://www.geoportal.sk/sk/zbgis/ortofotomozaika/ (accessed on 14 November 2024). (In Slovak).
  36. Slovenské Múzeum Máp Slovakia on Maps Part 10—Special Map, Scale 1:75 000 (1936) 2020. Available online: https://www.muzeummap.sk/slovensko-na-mapach-10-cast-specialna-mapa-mierky-175-000-1936/ (accessed on 14 November 2024). (In Slovak).
  37. Jakubík, J. Development of Military Cartography in Slovakia. Cartogr. Lett. 2012, 20, 28–38. (In Slovak) [Google Scholar]
  38. Belák, A.; Ďurková, E.; Dekan, T. Collections of the Central Archives of Geodesy and Cartography and Their Digitization 30th Slovak Geodetic Days 2023; Chamber of Surveyors and Cartographers: Žilina, Slovakia, November 2023; Available online: https://kgk.sk/wp-content/uploads/2023/10/Belak-a-kol_UAGK.pdf (accessed on 1 June 2025). (In Slovak)
  39. Geodetický a Kartografický Ústav Bratislava Basic Maps 2021. Available online: https://www.geoportal.sk/sk/smd/zakladne-mapy/ (accessed on 14 November 2024). (In Slovak).
  40. Leitmannová, K.; Galová, L.; Lieskovský, T.; Bisták, P.; Zachar, J. The Project of Aerial Laser Scanning of the Slovak Republic and Its Use in the Management of Archaeological Heritage Protection. Geodet. A Kartogr. Obz. 2022, 68, 53–68. (In Slovak) [Google Scholar]
  41. Geodetický a Kartografický Ústav Bratislava. Airborne Laser Scanning—DEM 2024. Available online: https://www.geoportal.sk/sk/zbgis/lls/ (accessed on 15 November 2024). (In Slovak).
  42. Lieskovský, J.; Lieskovský, T.; Hladíková, K.; Štefunková, D.; Hurajtová, N. Potential of Airborne LiDAR Data in Detecting Cultural Landscape Features in Slovakia. Landsc. Res. 2022, 47, 539–558. [Google Scholar] [CrossRef]
  43. Kokalj, Ž.; Hesse, R. Airborne Laser Scanning Raster Data Visualization; ZRC SAZU: Ljubljana, Slovenia, 2017; Volume 14, ISBN 978-961-254-984-8. [Google Scholar]
  44. Lieskovský, J.; Lieskovský, T.; Košanová, S.; Bírová, L. Application of LiDAR Visualisations for Mapping the Tillage Direction. Soil Water Res. 2024, 19, 200–209. [Google Scholar] [CrossRef]
  45. Fencík, R.; Lieskovský, T.; Kačmárová, B. Reconstruction of the transport network of the second military mapping. Cartogr. Lett. 2019, 27, 51–71. [Google Scholar]
  46. Dekking, F.M.; Kraaikamp, C.; Lopuhaä, H.P.; Meester, L.E. A Modern Introduction to Probability and Statistics; Springer: London, UK, 2005; 483p. [Google Scholar] [CrossRef]
  47. Lieskovský, J.; Kenderessy, P.; Špulerová, J.; Lieskovský, T.; Koleda, P.; Kienast, F.; Gimmi, U. Factors affecting the persistence of traditional agricultural landscapes in Slovakia during the collectivization of agriculture. Landsc. Ecol. 2014, 29, 867–877. [Google Scholar] [CrossRef]
  48. Procházka, J.; Pišút, P. Meandering lowland channel alterations in the period 1782–1900 (Váh River, Sereď-Komárno section). Geogr. Cassoviensis 2015, IX, 45–55. Available online: https://uge-share.science.upjs.sk/webshared/GCass_web_files/articles/GC-2014-9-1/04Prochazka_Pisut_tlac1.pdf (accessed on 1 November 2024).
  49. Pišút, P. Channel evolution of the pre-channelized Danube River in Bratislava, Slovakia (1712–1886). Earth Surf. Process. Landf. 2002, 27, 369–390. [Google Scholar] [CrossRef]
  50. Štular, B.; Lozi’c, E.; Eichert, S. Airborne LiDAR-Derived Digital Elevation Model for Archaeology. Remote Sens. 2021, 13, 1855. [Google Scholar] [CrossRef]
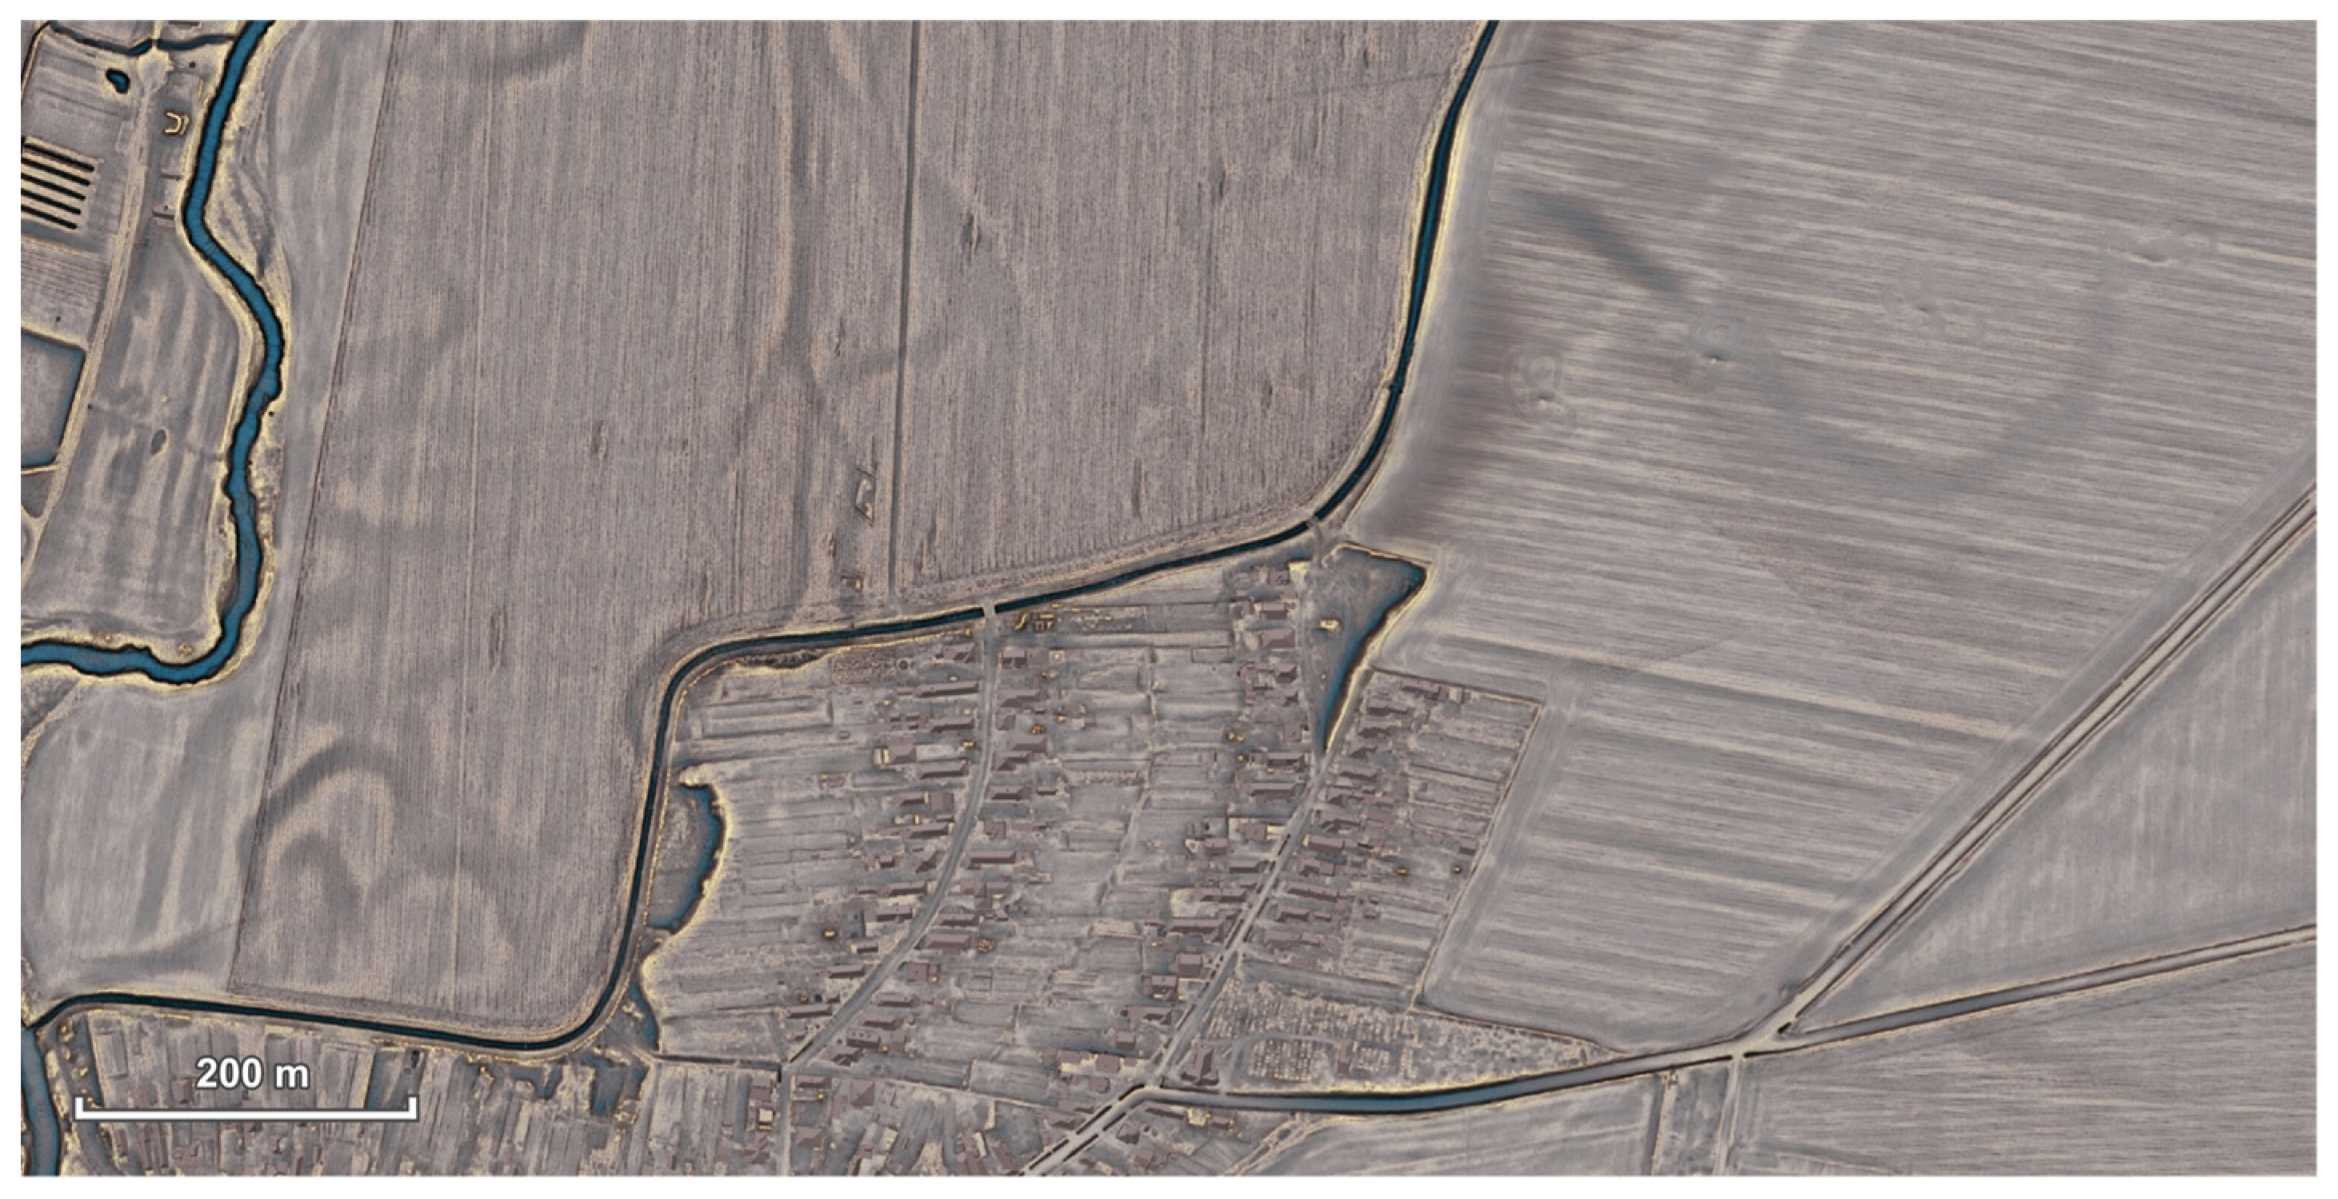
Figure 1. Sample LiDAR data visualisation by KGGI SvF STU (25 cm/pixel; light, convex features are shown in blue-green, while concave features are depicted in yellow, and the dynamics of relief changes are represented by variations in red intensity).
Ijgi 14 00274 g001
Figure 2. Sample LiDAR data visualisation by KGGI SvF STU (1 m/pixel; convex features are shown in blue-green, while concave features are depicted in yellow, and the dynamics of relief changes are represented by variations in red intensity).
Ijgi 14 00274 g002
Figure 3. Areas of interest within the territory of Slovakia.
Ijgi 14 00274 g003
Figure 4. Danube Lowland (the First Military Survey—blue; the Second Military Survey—red).
Ijgi 14 00274 g004
Figure 5. Surroundings of Vráble with the undulating terrain (the First Military Survey—blue; the Second Military Survey—red).
Ijgi 14 00274 g005
Figure 6. Považský Inovec—low mountains area (the First Military Survey—blue; the Second Military Survey—red).
Ijgi 14 00274 g006
Figure 7. Veporské Vrchy—a high mountain area (the First Military Survey—blue; the Second Military Survey—red).
Ijgi 14 00274 g007
Figure 8. Example of control points from the First Military Survey (upper left—church; upper right—river confluence; lower left—crossroad; lower right—bridge).
Ijgi 14 00274 g008
Figure 9. Example of control points from the Second Military Survey (upper left—church; upper right—river confluence; lower left—crossroad; lower right—bridge).
Ijgi 14 00274 g009
Figure 10. Seemingly a control point (intersection of road and river/bridge) on a historical map (left) and ALS data (right), but in reality, both the road and the watercourse have been changed (marked in red). On the right edge of the scene, however, a crossroad is identifiable in both images, which can be used as a control point (marked in blue).
Ijgi 14 00274 g010
Figure 11. Example of a control point (mound; top) that is visible on the ALS visualisation (middle) but not on the orthophotomap (bottom; data source: ÚGKK SR).
Ijgi 14 00274 g011
Figure 12. Map sheet IX-10 georeferenced by affine transformation.
Ijgi 14 00274 g012
Figure 13. Map sheet IX-10 georeferenced by the second-degree polynomial transformation.
Ijgi 14 00274 g013
Figure 14. Comparison of control points found in mountainous areas using ALS data (bottom) compared to available map sources (top).
Ijgi 14 00274 g014
Table 1. List of reference data.
NameHistorical
Orthophoto Mosaic
of Slovakia
Orthophoto Mosaic
of the Slovak Republic
Special Maps
1:75,000
Military Topographic Mapping 1:25,000Military Topographic Mapping 1:10,000Distance Map
of Hungary 1:75,000
Base Map of the Slovak Republic
1:10,000
ALS Data
Year of issue19492019193319571971190320022023
Reference systemS-JTSK (EPSG 5514)S-JTSK (EPSG 5514)S-JTSK (EPSG 5514)S-52 (temporary military system derived from
S-JTSK)
S-42 (EPSG 37257)WGS 84 (EPSG 3857)S-JTSK (EPSG 5514)S-JTSK03 (EPSG 8353)
Scale1:5000N/A1:75,0001:25,0001:10,0001:75,0001:10,000N/A
Resolution0.50 m/pix0.25 m/pixN/AN/AN/AN/AN/Amin. 5 pts/m2
No. of map sheets10,20110,278N/A6701096N/A281842
FormatWMSWMS (TIF + TFW)WMTSWMTSWMTSWMSWMS (TIF + TFW)LAS
ProviderTUZVOÚGKK SRME SRME SRME SRÚGKK SRÚGKK SRÚGKK SR
Table 2. Comparison of the results of the First Military Survey.
First Military SurveyAll PointsFiltered Points (Outliers Filtered with IQR)
No. of pts.Mean Distance [m]Standard Deviation
[m]
No. of pts.Mean Distance [m]Standard Deviation
[m]
LowlandsARCANUM44426.25261.7144426.25261.71
SEA44769.59313.3542730.86262.96
Undulating terrainARCANUM83143.3079.7480134.3866.02
SEA83341.74129.4481331.36112.44
Low
mountains
ARCANUM70297.18215.7468279.18190.79
SEA70314.32232.6265265.61153.08
High mountainsARCANUM45287.78231.3742239.49146.71
SEA45952.14236.3245952.14236.32
Table 3. Ranking of map sources by precision.
First Military Survey
TerrainPointSource
1.Undulating1.Bridge1.Orthophoto mosaic of the Slovak Republic
2.Low mountains2.Church2.Historical Orthophoto mosaic
3.High mountains3.Crossroad3.Base map of the Slovak Republic 1:10,000
4.Lowlands4.River confluence4.Military topographic mapping (1:10,000; 1:25,000)
5. 5.Special map of Hungary 1:75,000
6. 6.Distance map of Hungary 1:75,000
Table 4. Comparison of the results of the Second Military Survey.
Second Military SurveyAll PointsFiltered Points (Outliers Filtered with IQR)
No. of pts.Mean Distance [m]Standard Deviation
[m]
No. of pts.Mean Distance [m]Standard Deviation
[m]
LowlandsARCANUM9287.8538.569287.8538.56
SEA9257.2855.348752.7522.80
Undulating terrainARCANUM11346.8425.6410843.3220.02
SEA11353.0625.0711353.0625.07
Low
mountains
ARCANUM9937.1624.319533.8216.95
SEA9957.6233.119653.7923.44
High mountainsARCANUM9061.8948.128553.2730.04
SEA9060.0744.308856.4737.57
Table 5. Ranking of areas, points and sources by precision (the Second Military Survey).
Second Military Survey
TerrainPointSource
1.Undulating1.Church1.Orthophoto mosaic of the Slovak Republic
2.Low mountains2.Bridge2.Historical Orthophoto mosaic
3.Lowlands3.Crossroad3.Base map of the Slovak Republic 1:10,000
4.High mountains4.River confluence4.Military topographic mapping (1:10,000; 1:25,000)
5. 5.Special map of Hungary 1:75,000
6. 6.Distance map of Hungary 1:75,000
Table 6. Percentage changes in the number of control points.
TerrainFirst Military SurveySecond Military Survey
MapsALS DataDiffIn%MapsALS DataDiffIn%
Together1682437544.64%28639410837.76%
Lowlands35451028.57%74921824.32%
Undulating terrain60832338.33%891132426.97%
Low
mountains
42702866.67%66993350.00%
High mountains31451445.16%57903357.89%
Table 7. Results of the transformation of the First Military Survey (affine transformation).
First Military SurveyMap DataALS Data
AreaMap SheetNo.
of pts.
Total
Residuals [m]
No.
of pts.
Total
Residuals [m]
LowlandsVIII-0911202.9313160.76
VIII-101060.891546.49
IX-107107.30863.94
IX-117111.71988.44
Undulating terrainX-1014103.641884.35
X-1115107.022083.55
XI-1217131.542379.35
XI-1314124.312282.28
Low mountainsIX-0310297.9514140.04
IX-0410168.0522121.97
X-059204.2118186.84
X-0613153.091692.93
High mountainsXVI-098152.8110135.04
XVI-108176.5811108.49
XVII-097121.8211118.89
XVII-10893.921380.19
Table 8. Results of the transformation of the Second Military Survey (affine transformation).
Second Military SurveyMap DataALS Data
AreaMap SheetNo.
of pts.
Total
Residuals [m]
No.
of pts.
Total
Residuals [m]
LowlandsXXVI-451933.962128.25
XXVI-462343.312926.15
XXVII-451725.962321.94
XXVII-461542.941929.58
Undulating terrainXXVIII-432630.963322.42
XXVIII-441924.522321.15
XXIX-432329.083022.08
XXIX-442136.872723.31
Low mountainsXXVII-391455.032327.22
XXVII-401826.282723.94
XXVIII-391531.112724.42
XXVIII-401932.122239.26
High mountainsXXXIV-391771.922466.30
XXXIV-401337.102536.56
XXXV-391275.221669.01
XXXV-401565.802539.29
Table 9. Results of the transformation of the First Military Survey (the polynomial transformation of the second degree).
First Military SurveyMap DataALS Data
AreaMap SheetNo.
of pts
Total
Residuals
[m]
No.
of pts
Total
Residuals
[m]
LowlandsVIII-0911138.931390.65
VIII-101058.051540.67
IX-10759.82831.09
IX-11730.16942.74
Undulating terrainX-101483.361873.80
X-111591.872083.55
XI-1217103.872369.21
XI-131479.792266.89
Low
mountains
IX-0310166.171481.26
IX-0410112.912286.39
X-059120.0818114.20
X-0613119.471690.97
High
mountains
XVI-09864.561085.56
XVI-10848.241192.98
XVII-09747.751167.27
XVII-10893.921352.17
Table 10. Results of the transformation of the Second Military Survey (polynomial transformation of the second degree).
Second Military SurveyMap DataALS Data
AreaMap SheetNo.
of pts
Total
Residuals
[m]
No.
of pts
Total
Residuals
[m]
LowlandsXXVI-451928.592124.42
XXVI-462337.992922.62
XXVII-451719.962321.90
XXVII-461538.601919.91
Undulating terrainXXVIII-432627.663316.03
XXVIII-441918.512315.59
XXIX-432319.963016.43
XXIX-442136.872717.31
Low
mountains
XXVII-391432.502320.79
XXVII-401822.482721.06
XXVIII-391527.522720.58
XVIII-401926.862222.75
High
mountains
XXXIV-391771.922455.06
XXXIV-401327.222521.51
XXXV-391237.931631.92
XXXV-401552.382536.51
Table 11. Results of the validation using the leave-one-out test (the First Military Survey).
Map SheetTerrainNo. of ptsAffine Transformation RMS [m]Second-Degree Polynomial Transformation
RMS [m]
08-09Lowlands13214.98233.53
08-10Lowlands1557.2082.27
9-10Lowlands8102.915822.06
09-11Lowlands9137.94167.07
10-10Undulating18100.08112.18
10-11Undulating20115.66114.70
11-12Undulating2392.7498.63
11-13Undulating2299.22104.16
09-03Low mountains14193.70211.34
09-04Low mountains22151.81125.58
10-05Low mountains18232.17190.43
10-06Low mountains16115.20164.83
16-09High mountains10197.01288.70
16-10High mountains11155.16557.22
17-09High mountains11180.56233.02
17-10High mountains13104.21114.32
Table 12. Results of the validation using the leave-one-out test (the Second Military Survey).
Map SheetTerrainNo. of ptsAffine Transformation RMS [m]Second-Degree Polynomial Transformation
RMS [m]
26-45Lowlands2133.3340.16
26-46Lowlands2929.2828.17
27-45Lowlands2325.8632.35
27-46Lowlands1935.4730.54
28-43Undulating3325.0219.39
28-44Undulating2324.8021.13
29-43Undulating3024.8921.11
29-44Undulating2726.6221.94
27-39Low mountains2331.9930.53
27-40Low mountains2727.2131.10
28-39Low mountains2728.2525.60
28-40Low mountains2247.8735.22
34-39High mountains2477.8277.50
34-40High mountains2545.5232.22
35-39High mountains1693.3265.67
35-40High mountains2544.0748.96
Disclaimer/Publisher’s Note: The statements, opinions and data contained in all publications are solely those of the individual author(s) and contributor(s) and not of MDPI and/or the editor(s). MDPI and/or the editor(s) disclaim responsibility for any injury to people or property resulting from any ideas, methods, instructions or products referred to in the content.