Article

Spatiotemporal Evolution and Driving Factors of Coupling Coordination Degree Between New Urbanization and Urban Resilience: A Case of Huaihai Economic Zone

1
School of Mechanics and Civil Engineering, China University of Mining and Technology, Xuzhou 221116, China
2
School of Management Science and Engineering, Anhui University of Finance and Economics, Bengbu 233030, China
3
School of Information Engineering, Zhongnan University of Economics and Law, Wuhan 430073, China
4
School of Architecture and Design, China University of Mining and Technology, Xuzhou 221116, China
*
Author to whom correspondence should be addressed.
ISPRS Int. J. Geo-Inf. 2025, 14(7), 271; https://doi.org/10.3390/ijgi14070271
Submission received: 1 June 2025 / Revised: 4 July 2025 / Accepted: 7 July 2025 / Published: 9 July 2025

Abstract

Rapid urbanization and climate extremes expose cities to multi-dimensional risks, necessitating the coordinated development of new urbanization and urban resilience for achieving urban sustainability. While existing studies focus on core economic zones like the Yangtze River Delta, secondary economic cooperation regions remain understudied. This study examined the Huaihai Economic Zone (HEZ)—a quadri-provincial border area—by constructing the evaluation systems for new urbanization and urban resilience. The development indices of the two systems were measured using the entropy weight-CRITIC method. The spatiotemporal evolution characteristics of their coupling coordination degree (CCD) were analyzed through a CCD model, while key driving factors influencing the CCD were investigated using a grey relational analysis model. The results indicated that both the new urbanization construction and urban resilience development indices in the HEZ exhibited a steady upward trend during the study period, with the urban resilience development index surpassing the new urbanization construction index. The new urbanization index increased from 0.3026 (2013) to 0.4702 (2023), and the urban resilience index increased from 0.3520 (2013) to 0.6366 (2023). The CCD between new urbanization and urban resilience reached 0.7368 by 2023, with 80% of cities in the HEZ achieving good coordination types. The variation of the CCD among cities was minimal, revealing a spatially clustered coordinated development pattern. In terms of driving factors, economic development level, public service capacity, and municipal resilience level were identified as core drivers for enhancing coupling coordination. Infrastructure construction, digital capabilities, and spatial intensification served as important supports, while ecological governance capacity remained a weakness. This study establishes a transferable framework for the coordinated development of secondary economic cooperation region, though future research should integrate diverse data sources and expand indicator coverage for higher precision. Moreover, the use of linear models to analyze the key driving factors of the CCD has limitations. The incorporation of non-linear techniques can better elucidate the complex interactions among factors.

1. Introduction

Urbanization development is a critical pathway for promoting urban sustainability. Since the reform and opening-up policy was initiated in 1978, China has achieved remarkable progress in urbanization, with the urbanization rate rising from 17.92% in 1978 to 67% in 2024 [1,2]. However, the continuous expansion of urban scales and population concentration have led to significant challenges, including overconsumption of natural resources, intensified human-land conflicts, and spatial security crises, which contradict the principles of high-quality and sustainable urban development. The new urbanization strategy, proposed to address these issues, emphasizes coordinated human-land development [3]. By optimizing urban spatial layouts, adhering to green development principles, and accelerating economic and industrial transformation, this strategy aims to mitigate the impacts of expanding human activities and natural disasters, thereby advancing sustainable urban practices [4]. Enhancing urban resilience can reduce losses caused by spatial risks, resolve disturbances during urbanization, and foster harmonious human-land relationships, laying a foundation for high-quality urban development. Strengthening urban resilience to address foreseeable disasters and acute shocks ensures the healthy operation of urbanization [5,6]. Therefore, as cities evolve into large-scale, complex systems, ensuring their stable functioning has become a pivotal issue for sustainable development. The dual strategies of new urbanization and resilient city construction are mutually reinforcing: integrating resilience into urbanization processes is essential for creating livable, resilient, and smart cities, and for achieving people-centered urbanization [7,8].
The interaction between new urbanization and urban resilience encompasses both synergistic and stress effects. On one hand, new urbanization drives improvements in urban consumption capacity and infrastructure through population agglomeration and spatial expansion, while industrial upgrading and green technological innovation further enhance spatial development and innovation, providing resources to strengthen resilience [9,10]. Conversely, urban resilience supports urbanization through ecological conservation, risk buffering, and institutional optimization, forming a positive feedback loop of “urbanization-resilience enhancement” [6,11]. However, when urbanization intensity exceeds the carrying capacity of urban populations, land, ecosystems, and resources, stress effects such as increased population density and exposure, severe industrial pollution, disordered land development, and surging energy consumption emerge. These effects amplify spatial risks, impose pressure on resilience-building, and trigger a negative feedback pathway of “scale expansion-resilience decline” [8,12]. Thus, while new urbanization facilitates high-quality spatial development, resilient cities provide safeguards against internal and external risks. Only through their coupled coordination can urban sustainability be effectively advanced [13,14]. Based on these dynamics, this study constructs a multi-dimensional evaluation system to measure the development levels of new urbanization and urban resilience, employing a coupling coordination degree (CCD) model to investigate their coordinated interactions.
Three strands of research are closely related to this study. (1) Intrinsic logic of interaction relationship between new urbanization, urban resilience, and other urban subsystems. Some scholars have explored the intrinsic relationship through conceptual elaboration, mechanism construction, and quantitative analysis. For instance, Fan et al. [15] and He et al. [16] argued that urban resilience is an inherent requirement of new urbanization, while new urbanization serves as a key initiative to enhance resilience, with the two systems exhibiting mutual adaptability. Conversely, Li et al. [17] emphasized that their interaction involves both synergistic promotion and constraining effects. To systematically reveal the theoretical mechanisms of the interaction relationship between urbanization, urban resilience, and other urban subsystems, some researchers have adopted perspectives such as co-evolution [18], environmental regulation [19], high-quality development [20], and territorial space efficiency [21]. Tu et al. [22] and Yang et al. [23] quantified the relationship using relative development models and GIS spatial analysis in the Yangtze River Economic Belt and Chongqing municipality, respectively. (2) Evaluation of the coupling coordination degree (CCD) between new urbanization and urban resilience. Current studies focus on refining evaluation frameworks, diversifying methodologies, and expanding research scales. Scholars have developed systems like “scale-density-morphology” [24] and “pressure-state-response” [25] to assess urban resilience. Zhu et al. [26] proposed a social-ecological system (SES)-PSR framework to evaluate resilience interactions in SESs. Jiang et al. [27] quantified urban resilience from an SES perspective, while Han et al. [28] examined the coupling mechanism among urban resilience subsystems. Spatiotemporal evolution patterns have also been investigated across regions and scales. For instance, Guo [29] analyzed the coupling coordination between new urbanization and ecological resilience in Qingdao, and Ma et al. [30] studied this relationship in Anhui Province. Mu et al. [31] applied the Theil index, standard deviation ellipse, and grey prediction model, and Wang et al. [32] used landscape security and CCD model to analyze the coordination in Beijing-Tianjin-Hebei Urban Agglomeration. Li et al. [33] addressed research gaps by focusing on arid cities. He et al. [34] further explored spatial coupling patterns at a national scale. (3) Key Drivers of the CCD between new urbanization and urban resilience. Studies employ models like Tobit regression to identify factors influencing the CCD [25,33]. Liu et al. [35] introduced a coordination influence index to quantify the promoting or hindering effects of indicators on the CCD. Zhao et al. [36] utilized the factor contribution model to pinpoint critical drivers of urban resilience, while Fan et al. [15] applied geographical detector to uncover spatial heterogeneity in driving forces.
While existing studies on the CCD between new urbanization and urban resilience provided a solid theoretical foundation, several gaps remain: (1) Conceptual and methodological limitations. Despite abundant research on spatiotemporal evolution patterns, inconsistencies persist in the measurement systems for new urbanization and urban resilience. Further exploration is needed to align evaluation frameworks with the intrinsic characteristics of both systems, such as the connotation of “people-centered” urbanization and the dynamic nature of resilience [4,8,37]. (2) Inadequate evaluation dimensions and methods. Current indicator systems often overlook critical aspects of smart urbanization, such as digital capacity enhancement and intelligent governance. Moreover, reliance on objective weighting methods (e.g., entropy weight) may introduce errors by neglecting inter-indicator conflicts. (3) Regional and scale constraints. Most studies focused on core economic zones like the Yangtze River Economic Belt [38,39,40], the Yellow River Basin [25,41], and the Beijing-Tianjin-Hebei region [42], leaving strategic yet underdeveloped areas—particularly secondary strategic regions and resource-intensive urban clusters—understudied. To address these gaps, this study selected the Huaihai Economic Zone (HEZ) as a case to investigate the coupling coordination between new urbanization and urban resilience.
This study aims to quantify new urbanization and urban resilience development levels in HEZ (2013–2023), analyze spatiotemporal evolution of the CCD, and identify key drivers of the CCD. We constructed evaluation systems for the new urbanization system from four dimensions (economic urbanization, population urbanization, spatial urbanization, and smart urbanization) and urban resilience from three stages (pressure resilience, state resilience, and response resilience). The entropy weight–CRITIC method was applied to measure development levels, while the CCD model and grey relational analysis were used to analyze spatiotemporal evolution patterns and identify key drivers. This approach aims to advance synergistic development between new urbanization and urban resilience, fostering high-quality and sustainable growth in the HEZ. The specific arrangement of the structure of this study is as follows. Section 2 describes methods and data, Section 3 presents results, and Section 4 concludes with policy suggestions and research limitations.

2. Materials and Methods

2.1. Theoretical Mechanism Analysis

New urbanization and urban resilience constitute a complex adaptive system characterized by bidirectional feedback. The new urbanization system encompasses population (scale and quality), economy (industrial upgrading and green technology), space (scale and intensity of construction land expansion), society (public services and environmental awareness), and smart governance (digital management and intelligent operations) subsystems [9,43]. Its typical features include population growth, economic development, spatial expansion, technological advancement, and social inclusion. The urban resilience system covers resistance (environmental capacity and resource reserves), adaptability (climate regulation and disaster buffering), recovery (pollution degradation and ecological restoration), and renovation (technology transformation and systemic learning) dimensions, collectively enhancing a city’s capacity to withstand pressures, maintain functional states, and respond to disruptions [8,44,45]. These two systems achieve dynamic coupling through resource flows (population, energy, capital, land), pressure transmission (climate change, resource consumption, ecological stress), and response feedback (economic restructuring, policy regulation, technological innovation) [14,40]. Their coupling coordination represents the equilibrium between synergistic and threshold effects, forming interconnected, mutually reinforcing relationships that enable sustainable urban development.
Synergistic effects manifest through bidirectional positive feedback pathways. Specifically, new urbanization facilitates industrial upgrading and capital accumulation, driving increased investment in green technology research and development while advancing clean production technologies. This process directly strengthens the adaptability and renovation dimensions of urban resilience—particularly risk buffering, technology transformation, and systemic learning capabilities—thereby enhancing resource utilization efficiency and environmental carrying capacity [46,47]. Improved urban resilience subsequently feeds back into new urbanization through eco-friendly land development and smart public services, elevating the effectiveness of new urbanization. This establishes a closed-loop gain pathway of “industrial innovation→resilience enhancement→urban upgrading”. Simultaneously, population urbanization elevates residents’ environmental literacy and governance participation, strengthening societal supervision and regulatory functions. This enhances recovery resilience such as pollution control efficiency and adaptive resilience including community disaster preparedness, significantly mitigating negative externalities like heat island effects and urban flooding [7,48]. Optimized living environments and public safety further attract high-quality talent, creating a cycle of “population quality improvement→resilience optimization→enhanced urban attractiveness”.
Threshold effects operate through negative feedback mechanisms imposing rigid constraints. Population and economic urbanization drive spatial transformation, manifesting as increased construction density and expanded urban development boundaries. However, disorderly construction land sprawl fragments suitable development spaces and encroaches upon ecological areas, damaging urban resilience system [49]. When the intensity of construction land expansion exceeds the regeneration thresholds of ecosystems, ecological fragmentation causes a precipitous decline in urban ecological connectivity indices. This reduces surface permeability, significantly increasing the probability of urban flooding disasters [50]. Consequently, deteriorating spatial livability impedes urban expansion, ultimately triggering systemic collapse of urban resilience. Furthermore, when the industrial land proportion becomes excessive, systemic instability risks increase non-linearly through chain reactions of “pollution intensification→environmental capacity contraction→enterprise relocation”, compelling economic urbanization deceleration. This threshold effect creates vicious “expansion–degradation” cycles. These negative feedback loops forcibly constrain both new urbanization and urban resilience construction.
Consequently, new urbanization and urban resilience exhibit coexisting promotion and constraint effects, maintaining tightly coupled coordination. On one hand, urbanization-driven demand growth depends fundamentally on urban resilience system support, while resilience strengthening relies on resource agglomeration from new urbanization advancement [16]. On the other hand, their mutual feedback operates through climate pressures, resource consumption, and risk propagation processes, where population, economic, and spatial urbanization exert pressures that alter urban system states and prompt systemic responses [51]. From a system dynamics perspective, their interaction forms non-linear feedback cycles. Synergistic effects drive co-evolution through mutual reinforcement, such as industrial upgrading enhancing infrastructure resilience or population growth increasing adaptive capacity. Threshold effects emerge when resource consumption exceeds critical boundaries, causing coordination collapse—for instance, the excessive construction land expansion constraining resilience development or high industrial land proportion reducing new urbanization momentum. As essential components of human–environment systems, new urbanization, and urban resilience fundamentally reflect the contradiction between anthropogenic pressures and environmental resource carrying capacity. Incompatible development trajectories hinder urban progress and threaten systemic security; only coordinated coupling enables high-quality urban development. Therefore, research on spatiotemporal patterns and influencing factors of their coupling coordination in the HEZ proves crucial for achieving regional synergy and sustainable development.

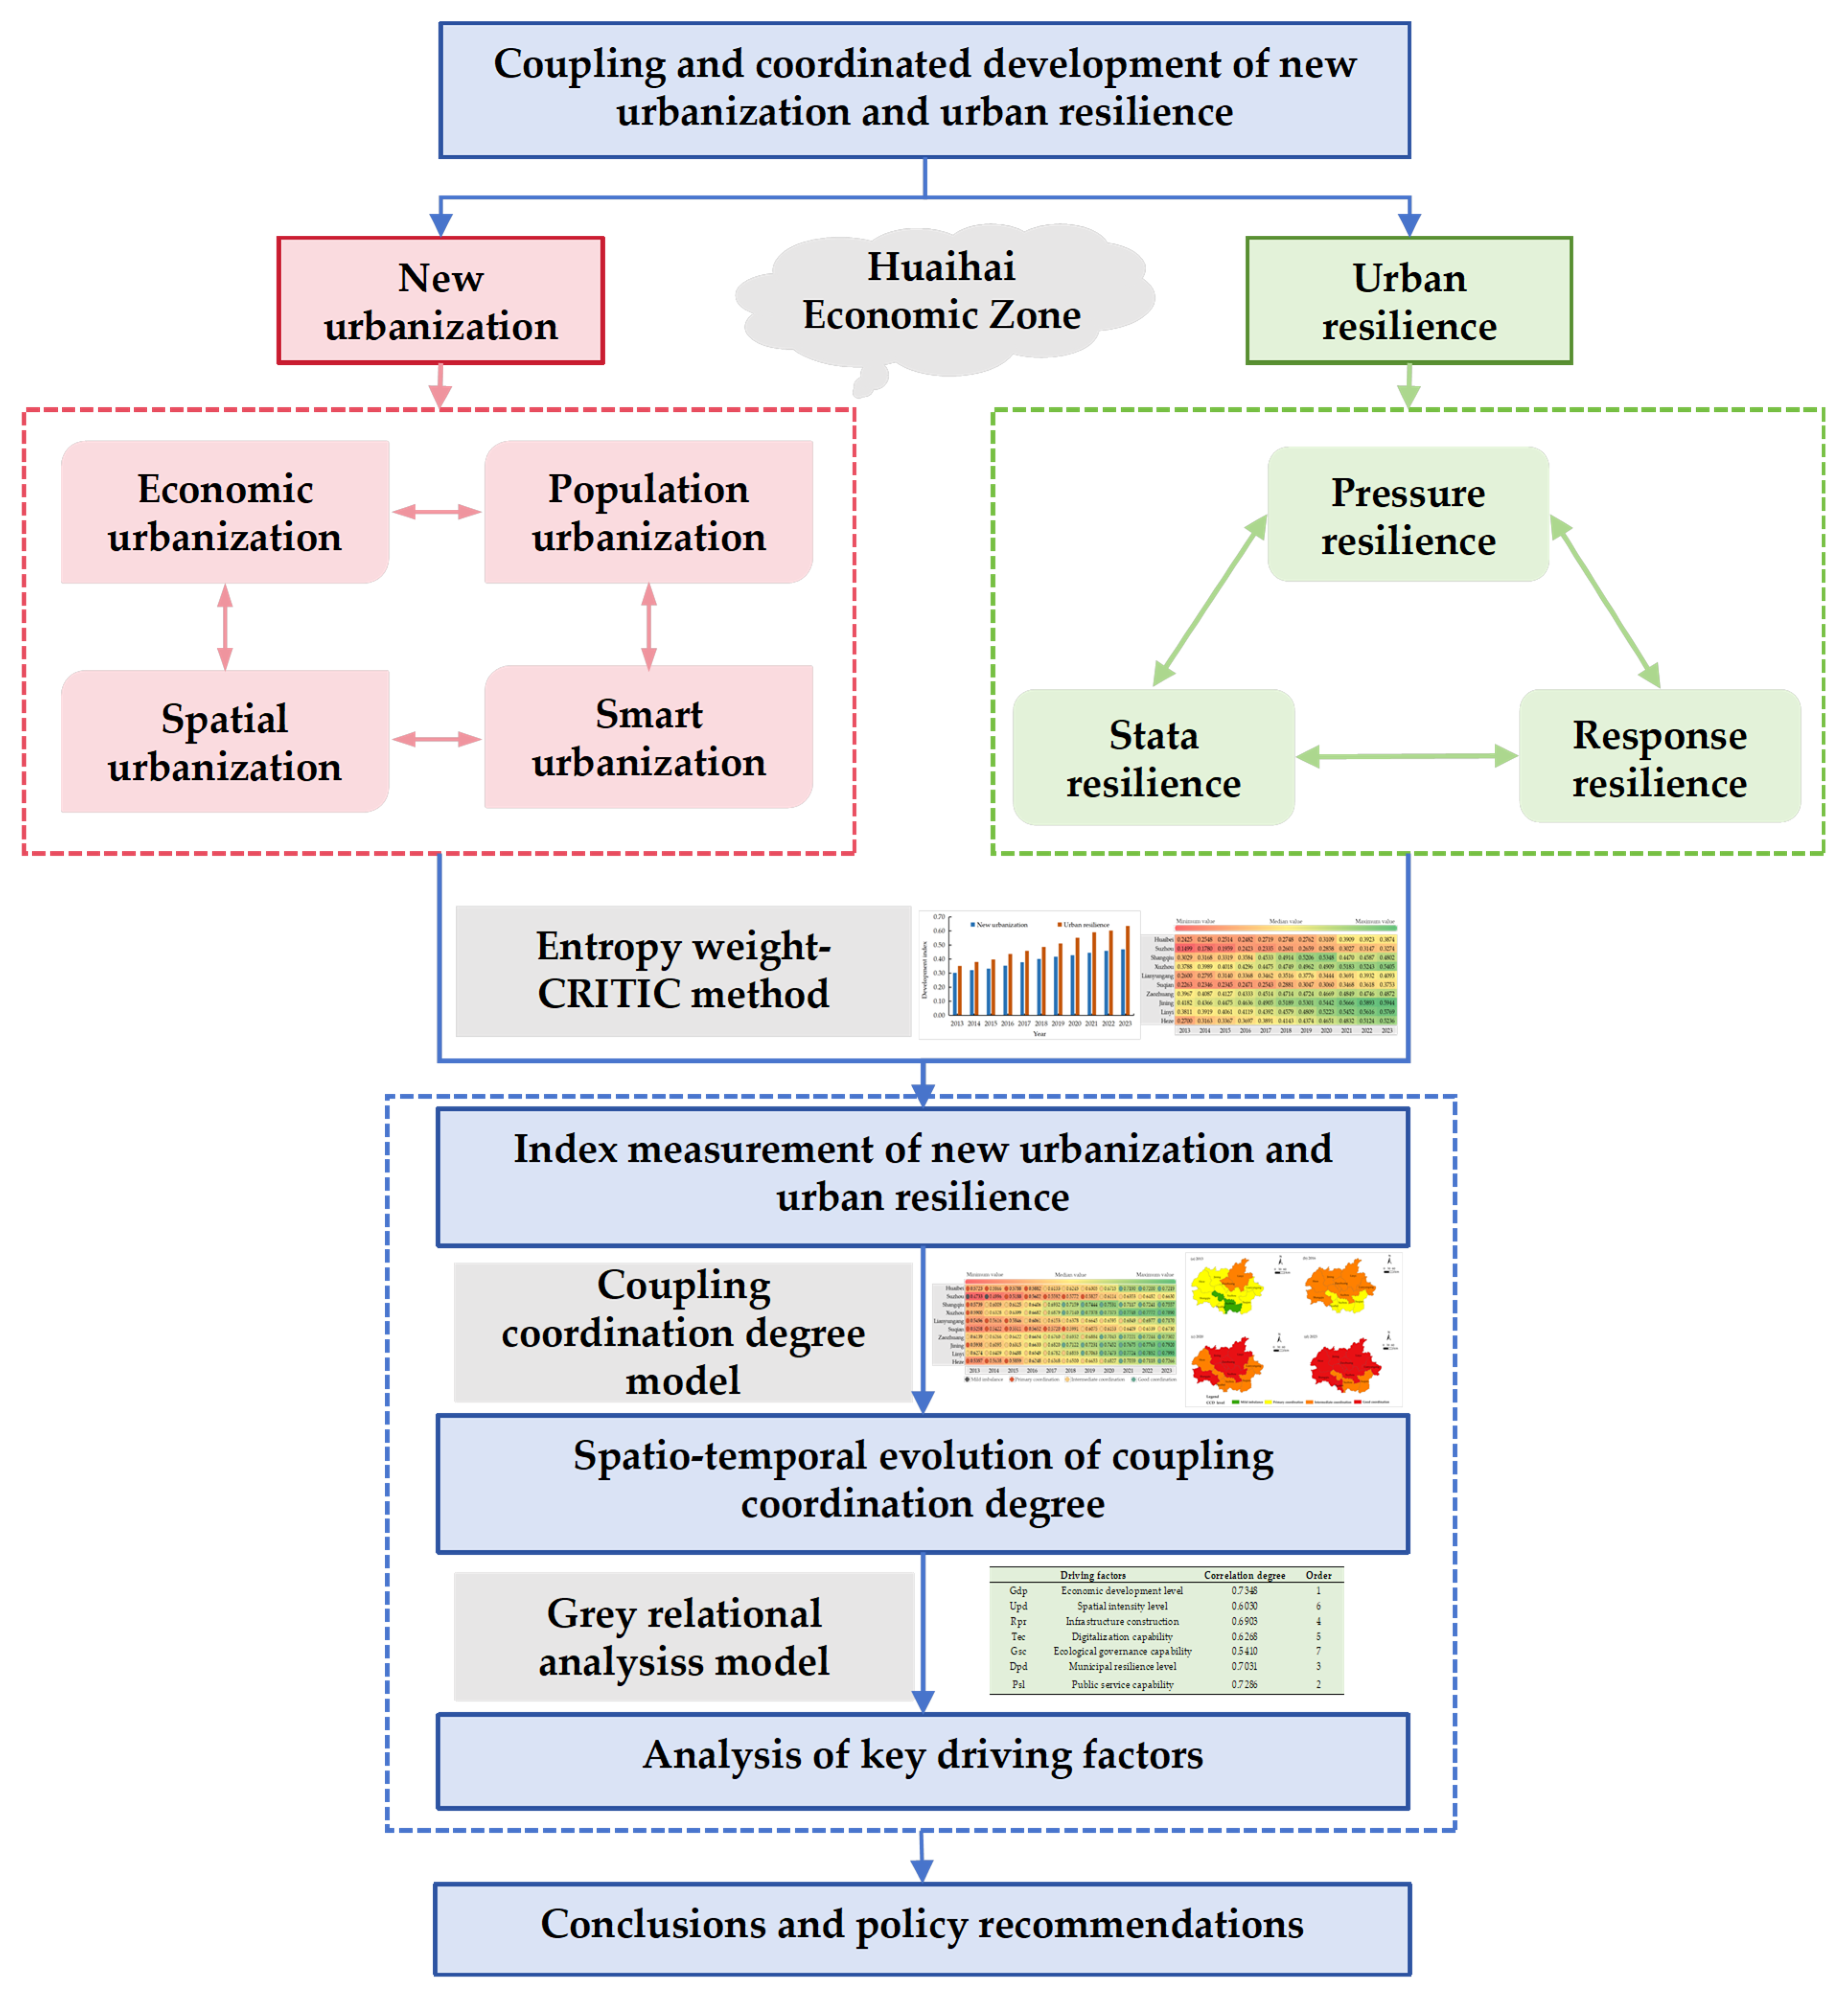
2.2. Research Framework

In order to achieve the research objectives, the research framework was developed, as shown in Figure 1. Firstly, based on the conceptual connotations of new urbanization and urban resilience, evaluation systems are constructed from four dimensions (economic urbanization, population urbanization, spatial urbanization, and smart urbanization) [14,39,52] and three stages (pressure–state–response) [45,49,53]. The development indices of both systems are calculated using a hybrid approach integrating the entropy weight method and the CRITIC method. Secondly, the CCD between new urbanization and urban resilience across cities in the HEZ is analyzed using a CCD model to reveal its spatiotemporal evolution characteristics. Finally, the grey relational analysis model is employed to identify critical factors influencing the CCD, followed by policy recommendations to enhance their coordinated development. On this basis, policy suggestions are put forward to promote the coupling and coordinated development of new urbanization and urban resilience in the HEZ.

2.3. Study Area and Data Sources

The HEZ is situated in a critical transitional area between China’s eastern coastal regions and the inland, spanning 10 prefecture-level cities at the intersection of Jiangsu, Shandong, Henan, and Anhui Provinces (as shown in Figure 2). It covers a total area of 96,000 km2, with a combined GDP exceeding 6.5 trillion yuan and a population of over 130 million. The cities within the zone are geographically close and well-connected by transportation networks, facilitating frequent population movement and economic activities.
Firstly, Xuzhou, the economic hub of the HEZ, achieved a GDP of 953.7 billion yuan in 2024, leading the region with an economic growth rate of over 7%. Linyi and Jining contributed 610.5 billion and 580 billion yuan, respectively. Zaozhuang and Suqian recorded growth rates of over 9%, while Jining, Shangqiu, and Huaibei lagged behind. Huaibei, the smallest city in terms of both area and population, had a GDP of only 140.6 billion yuan in 2024 with a growth rate of 2.93%, facing significant challenges in transforming from a resource-based city. Secondly, as a “crossroads” connecting the north and south, the HEZ is a potential area with the superposition of national strategies. Xuzhou, relying on its engineering machinery industry cluster, complements Linyi’s logistics hub and Jining’s inland waterway shipping. Lianyungang leverages its port advantages to undertake industrial transfer, while Suqian focuses on cultivating an innovative ecosystem for emerging industries. With the implementation of policies such as the “Yangtze River Delta Regional Integrated Development Plan” and the “Huaihe River Ecological Economic Belt Development Plan,” the strategic role of the HEZ has become more prominent. It enhances a land–sea integrated open development pattern through the Xuzhou Huaihai International Land Port and Lianyungang’s status as a key node in the Belt and Road Initiative. Additionally, it advances ecological conservation and economic transformation via the Huaihe River Ecological Economic Belt. Thirdly, the “Huaihai Economic Zone High-Quality Collaborative Development Plan” and other cooperation framework agreements have driven urban development within the region. Linyi, Suzhou, Xuzhou, and Zaozhuang have signed the “Cross-Provincial River Basin Upstream-Downstream Sudden Water Pollution Incident Joint Prevention and Control Mechanism Framework Agreement” to jointly deal with cross-boundary water pollution incidents. Lianyungang, Suqian, Linyi, and Jining have conducted joint law enforcement against “scattered, chaotic, and polluting” enterprises in border areas. By strengthening industrial development collaboration to build a regional market and deepening ecological environment joint prevention and control to establish a cross-regional ecological governance and environmental protection linkage mechanism, a more beautiful new HEZ is being jointly built.
However, the future development of the HEZ still faces multiple challenges. (1) There is a significant gap in urbanization levels between the central city Xuzhou (urbanization rate of 68.4%) and peripheral cities (such as Suzhou with 49.2%). There are also large economic disparities among resource-based cities (Xuzhou with 953.7 billion yuan, Jining with 586.7 billion yuan, Zaozhuang with 236.8 billion yuan, and Huaibei with 140.6 billion yuan). The insufficient capacity of the central city to radiate and drive the region results in a stepped urbanization gradient within the area. (2) The Yishuisi River basin and other cross-provincial ecological units are fragmented by administrative boundaries, leading to inconsistent flood control facility standards. Differences in urban infrastructure construction weaken the synergistic development effect of the region and lead to a fragmented regional resilience construction. (3) Administrative differences lead to high policy coordination costs. The lack of a permanent coordination body at the provincial level makes it difficult to implement policies such as ecological compensation and industrial transfer due to interprovincial competition. Against this backdrop, this study focuses on the 10 prefecture-level cities within the HEZ to analyze the CCD between new urbanization and urban resilience from 2013 to 2023. Data were sourced from the China City Statistical Yearbook, China Urban Construction Statistical Yearbook, provincial statistical yearbooks, government bulletins, and the EPS database. Within the 2013–2023 panel dataset, sporadic missing values (<1.7% of total observations) occurred in four indicators: the proportion of employees in secondary and tertiary industries, per capita urban road area, industrial sulfur dioxide emissions, and industrial solid waste generation. Missing data imputation was implemented according to indicator characteristics: temporally continuous variables (e.g., the proportion of employees, per capita urban road area) utilized linear interpolation, whereas volatile indicators (e.g., sulfur dioxide emissions, solid waste generation) employed either a three-year moving average or adjacent-year mean substitution based on data fluctuation patterns.

2.4. Construction Evaluation Index Systems

2.4.1. New Urbanization Evaluation System

The high-quality development of new urbanization emphasizes the orderly expansion of the urban scale while taking into account the balanced development of the urban system. Based on the development concept of new urbanization in the new period, its connotation involves population, economy, ecology, spatial, and other dimensions, which has become an academic consensus [24,30,52,54]. However, few studies have included smart urbanization in the evaluation system, which obviously cannot fully meet the needs of the new development stage [55]. Referring to the existing research, this study measures the new urbanization construction index from the four subsystems of population urbanization, economic urbanization, spatial urbanization, and smart urbanization. (1) Population urbanization is the direct embodiment of population scale and structure, and also the core of urbanization development. The urbanization rate of permanent residents, urban population density, and other indicators are selected to reflect the degree of population scale, and the proportion of employees in secondary and tertiary industries is selected to investigate the rationality of population structure. (2) Economic urbanization should not only focus on the strength and potential of industrial development but also consider the improvement of urban residents’ living standards. Per capita GDP should be selected to measure the economic development strength of regional cities, the proportion of secondary and tertiary industries’ combined output value in the GDP should be selected to reflect the urban industrial structure, the potential of urban economic development should be reflected from the side, and the per capita consumption expenditure of urban residents should be selected to represent the quality of life of urban residents [56]. (3) Spatial urbanization involves the rationality of urban infrastructure construction and spatial layout, which is expressed by the area of built-up area, the proportion of construction land area, and the per capita urban road area. (4) Smart urbanization mainly examines the intelligent development degree of the urban system, selects the number of mobile phone users and internet broadband subscribers at the end of the year to measure the intelligent coverage level of the urban system, and selects the proportion of science and technology expenditure in fiscal expenditure to reflect the support for the development of smart urbanization technology.

2.4.2. Urban Resilience Evaluation System

Urban resilience refers to the ability of cities to recover and adapt after being disturbed by internal and external risk factors [57,58]. Under the background of increasingly complex extreme weather and climate change, and the increasingly prominent contradiction between resource and environment damage and the human-land relationship, how to measure the ability of cities to face unknown risks and make responses is particularly important [6,11]. The PSR model provides a framework for describing the operational mechanism of urban resilience, and the urban resilience development index can be evaluated across three dimensions: pressure resilience, state resilience, and response resilience [45,59]. Stress resilience is used to measure the impact and constraint degree of economic and social development and human activities on urban space; state resilience refers to the stability and risk resistance of natural resources and infrastructure in urban space; response resilience can reflect the rapid recovery and adaptability of urban space after stress impact [58,60]. The city system is impacted by pressure, and the pressure resilience disperses the impact to the rest of the system. The state resilience senses the system pressure and transmits the information to the response resilience. Under the cooperation of pressure resilience and state resilience, the response resilience relies on the internal system digestion, absorption, and adjustment of the city system, and feeds back to the pressure resilience and state resilience [50,61]. According to the indexes selected from the relevant literature in recent years, the urban resilience index system is constructed from three dimensions: pressure resilience, state resilience, and response resilience [13,49,62]. (1) Pressure resilience refers to the capacity of an urban system to resist disturbances caused by internal and external pressures. Industrial wastewater, sulfur dioxide, and solid waste are selected to measure the main pressure sources in urban production, life, and daily operation. (2) State resilience refers to the recovery ability of the urban system in the face of disturbance. Indicators such as per capita disposable income, the green coverage rate of the built-up area, harmless treatment volume of domestic waste, and the density of drainage pipes in the built-up area are selected to characterize the state resilience of the urban system at the economic level, ecological environmental condition, infrastructure construction, public service capacity, and other dimensions. (3) Response resilience refers to the adaptability of the urban system after absorbing shocks. From the aspects of the human resource reserve, public resources, and environmental governance, the number of students in colleges and universities, health technicians, and per capita park green space are selected to explain the response resilience of the urban system. Specific indicators are listed in Table 1.

2.5. Research Methods

2.5.1. Entropy Weight–CRITIC Method

In order to improve the objectivity and scientific nature of the evaluation index weight distribution, the entropy weight method and CRITIC method are used to combine weighting. The entropy weight method quantifies the dispersion degree of indexes through information entropy and objectively characterizes the difference of data distribution but ignores the correlation among indexes [63,64]. The CRITIC method measures variability and conflict simultaneously and identifies low redundancy and high contribution indicators but is insensitive to low dispersion features [39]. The two methods can complement each other and construct an index weight method with information completeness and structural explanatory power. The specific formulas are as follows.
Firstly, standardize the positive and negative indicators.
x i j = x i j min x 1 j , x 2 j , , x n j max x 1 j , x 2 j , , x n j min x 1 j , x 2 j , , x n j
x i j = max x 1 j , x 2 j , , x n j x i j max x 1 j , x 2 j , , x n j min x 1 j , x 2 j , , x n j
In the formula, x i j is the original value and x i j is the standardized value.
Secondly, calculate the proportion of indicators ( p i j ), the entropy value ( e j ), the information entropy redundancy ( g j ), and the weight value ( ω 1 ).
p i j = x i j i = 1 n x i j
e j = 1 ln n i = 1 n p i j ln p i j
g j = 1 e j
ω 1 = g j j = 1 m g j  
Thirdly, calculate the coefficient of variation ( σ j ), information content ( I j ), and CRITIC weight of the indicators ( ω 2 ).
σ j = 1 n i = 1 n x i j x ¯ j 2 , υ j = σ j x ¯ j
c j = i = 1 n 1 r i j , I j = υ j × c j
ω 2 = I j j = 1 m I j
Finally, calculate the comprehensive weight value ( ω j ) and the index values of the two systems ( U ).
ω j = α ω 1 + β ω 2
U = j = 1 m w j × x i j
In the formula, ω 1 is the weight of the entropy weight method, ω 2 is the weight of the CRITIC method, and ω j is the comprehensive weight value. It is considered that the two methods have the same status, and the values of α and β are both 0.5. U is the comprehensive index of new urbanization construction and urban resilience development.

2.5.2. The CCD Model

The CCD model can reflect the coordination degree among multiple systems [65,66]. New urbanization and urban resilience are closely related, and coupling degree can be used to explain the degree of interdependence between them. However, when the evaluation index of the two systems is low and the value is similar, it is easy to appear as a high coupling state. Therefore, the coordination degree is introduced to reflect the coordinated development level of the interaction between the two systems.
C = 2 U 1 × U 2 ( U 1 + U 2 ) 2
T = α U 1 + β U 2
D = C × T
where U1 and U2 represent the development levels of new urbanization and urban resilience, respectively; C, T, and D denote coupling degree, comprehensive coordination index, and the CCD; α and β are weights reflecting the relative importance of urbanization and resilience, and the two systems are considered to be equally important, with values of 0.5 [67,68]. Based on the measurement results of the CCD between new urbanization and urban resilience in the HEZ, the CCD is divided into four grades: mild imbalance (0.4, 0.5], primary coordination (0.5, 0.6], intermediate coordination (0.6, 0.7], and good coordination (0.7, 0.8] [14,69,70]. This classification scheme aligns with the phased theoretical framework of coupled coordination system evolution, wherein 0.5 denotes the synergistic threshold for system coordination initiation, and 0.7 signifies the steady-state threshold characterizing high-level synergy. This interval-based delineation has been empirically validated in analogous studies [25,35,42].

2.5.3. Grey Relational Analysis

The core advantage of grey relational analysis lies in its ability to quantify association strength through geometric curve similarity. The grey relational model can reflect the proximity order of evaluation objects to an ideal reference. This makes it ideal for identifying dominant factors in small-sample systems with limited data. Given our panel dataset (10 cities × 11 years), complex non-linear models risk overfitting, whereas grey relational analysis requires no distributional assumptions and maintains inherent robustness. By applying this model, we calculate the relational degrees between the CCD of new urbanization and urban resilience and its driving factors in the HEZ. Specifically, the CCD is set as the reference sequence, while the driving factors influencing the CCD are treated as comparison sequences [39]. The detailed computational steps are as follows.
ε i ( k ) = min i min k y ( k ) x i ( k ) + ρ max i max k y ( k ) x i ( k ) y ( k ) x i ( k ) + ρ max i max k y ( k ) x i ( k )
S i = 1 n k = 1 n ε i ( k )
where Si is the grey relational grade, ε i ( k ) is grey the relational coefficient, min i min k y ( k ) x i ( k ) and max i max k y ( k ) x i ( k ) denote the range minimum and range maximum, respectively, and ρ (resolution coefficient) is set to 0.5, for k = 1, 2, …, n.

3. Results and Discussion

3.1. Spatiotemporal Evolution Characteristics of New Urbanization and Urban Resilience

3.1.1. Temporal Evolution of New Urbanization and Urban Resilience

The measurement results of new urbanization and urban resilience in the HEZ are shown in Figure 3. During the study period, the index of new urbanization and urban resilience showed a steady growth trend. Specifically, the new urbanization index increased from 0.3026 in 2013 to 0.4702 in 2023, an increase of 55.39%, with an average annual growth rate of 4.51%; the urban resilience index increased from 0.3520 in 2013 to 0.6366 in 2023, an increase of 80.85%, with an average annual growth rate of 6.10%. The new urbanization index is in the low range of 0.3026–0.4702 as a whole, indicating that it is still in the development stage of improving quality and efficiency; the urban resilience development index is stable in the median range of 0.3520–0.6366, indicating that the construction of a safe and resilient city has formed a scale. During the study period, the urban resilience index has always been ahead of the new urbanization index, confirming that the region has effectively improved the robustness and safety of the urban system through measures such as the implementation of ecological protection projects, infrastructure resilience reconstruction, and risk prevention and control system construction. This indicates that the HEZ prioritizes urban safety resilience construction—enhancing systemic risk resistance and response capacity—over rapid urbanization. The relatively lagging development trend of new urbanization not only exposes the restriction of traditional path dependence on the transformation process but also indicates the possibility space of releasing development potential through institutional innovation, underscoring the imperative for smarter policy interventions to elevate the new urbanization quality [30]. The continuous enhancement of the development level of the two systems verifies that urbanization construction and resilience development have significant synergistic effects.
As shown in Figure 4, the new urbanization development index across cities in the HEZ exhibited significant disparities. The index ranged from 0.1499–0.4182 in 2013 to 0.3274–0.5944 in 2023. The range in the new urbanization index narrowed from 0.2683 in 2013 to 0.2670 in 2023. The gap of the new urbanization level among regions continues to exist. The development index and growth rate of new urbanization construction of core cities such as Jining, Linyi, Xuzhou, and Heze are relatively high, which can realize leapfrog development relying on policy dividends and industrial upgrading. However, the late start of new urbanization construction in Huaibei, Suzhou, Suqian, and other marginal cities leads to a low initial level, which is limited by factors such as dependence on the agricultural industry and resource industry path, insufficient industrial undertaking capacity and imperfect industrial structure, which makes the growth rate of new urbanization construction not grow by leaps and bounds, and the new urbanization construction index has been hovering at a low level for a long time [71,72]. In addition, after the implementation of the Huaihe River Ecological Economic Belt Development Plan in 2016, Xuzhou, Jining, and other cities will accelerate the flow of population and capital to the core cities of urban agglomerations through the construction of transportation hubs and the concentration of innovative elements, which may lead to increased pressure on urban resources and environment [73,74]. In the future, multi-center strategies and cross-regional urban industrial cooperation will be needed to crack the shackles of peripheral city development and alleviate the excessive polarization of core cities. Promote the evolution of regional new urbanization construction to a balanced and high-quality development stage.
As shown in Figure 5, the urban resilience development index in the HEZ was at a low level at the beginning. During the study period, the range of the urban resilience development index increased from 0.1093 in 2013 to 0.1845 in 2023, with a maximum of 0.2088 in 2021. This may be because in the process of local government development, blindly carrying out “sprawling expansion” urban expansion behavior destroys the relationship between human beings and ecology. This policy orientation of short-term pursuit of development speed conflicts with the goal of high-quality development of new urbanization, resulting in the lack of long-term consistency in urban resilience construction. From a regional perspective, Jining, Lianyungang, Xuzhou, and other cities have achieved a leap in urban resilience through ecological restoration and systematic governance, while Linyi, Huaibei, and Shangqiu improved steadily based on their urban system status quo [46,75]. However, the regional vulnerability differentiation is significant. Resource-based cities such as Zaozhuang are subject to the aging of municipal infrastructure and ecological environment deficit, and the improvement of urban resilience is relatively slow. Suqian, Suzhou, and other marginal cities have a low level of urban resilience development under external shocks, exposing the shortcomings of urban resilience construction [68,76].

3.1.2. Spatial Pattern Analysis of New Urbanization and Urban Resilience

Using the Natural Breaks method in ArcGIS 10.8 software, the new urbanization and urban resilience indices of cities in the HEZ were classified into five tiers (low, medium–low, medium, medium–high, and high). Four characteristic years (2013, 2016, 2020, and 2023) were selected to analyze the spatiotemporal evolution of their spatial patterns, as shown in Figure 6 and Figure 7.
As shown in Figure 6, the new urbanization index of cities in the HEZ exhibited a persistent “high in the north and low in the south” spatial pattern from 2013 to 2023, with significant development gaps between northern and southern regions. The growth rate of new urbanization in each city varies significantly. Specifically, in 2013, most cities were categorized as low-tier, with only four reaching the medium tier, including Jining at the medium–high tier. By 2016, the overall development level improved, with low-tier cities transitioning to medium–low-tier. In 2020, high-tier cities (Jining, Linyi, and Shangqiu) emerged for the first time. By 2023, a high-tier circle structure represented by Linyi, Xuzhou, Jining, and Heze formed and radiated outward. Notably, Shangqiu regressed from high-tier to medium–high-tier, likely due to over-reliance on traditional industries, trade contraction-induced overcapacity, and rising population outflow Meanwhile, Xuzhou and Jining as core cities have accelerated the effect of resource agglomeration, further strengthening the suction effect of core cities.
As shown in Figure 7, the level of urban resilience in the HEZ shows a continuous optimization trend. In 2013, the overall area presented the characteristic of low value agglomeration, with only Huaibei and Linyi at the medium–low tier. By 2016, a phenomenon of grade leap emerged. Shangqiu and Huaibei entered the medium tier, while the rest of the cities reached the medium–low tier. In 2020, all cities emerged from the low-value level and remained at the medium tier or above, forming four medium-tier cities and five medium–high-tier cities. Among them, Huaibei became a high-tier city for the first time. In 2023, the number of high-tier cities increased by five, bringing the total to six. There were two medium–high-tier cities and two medium-tier cities, respectively. It is worth noting that the five newly added high-tier cities were previously all medium–high-tier cities, reflecting the trend of regional urban resilience building shifting from point-based and sheet-based improvement to coordinated improvement.

3.2. Spatiotemporal Evolution of the CCD Between New Urbanization and Urban Resilience

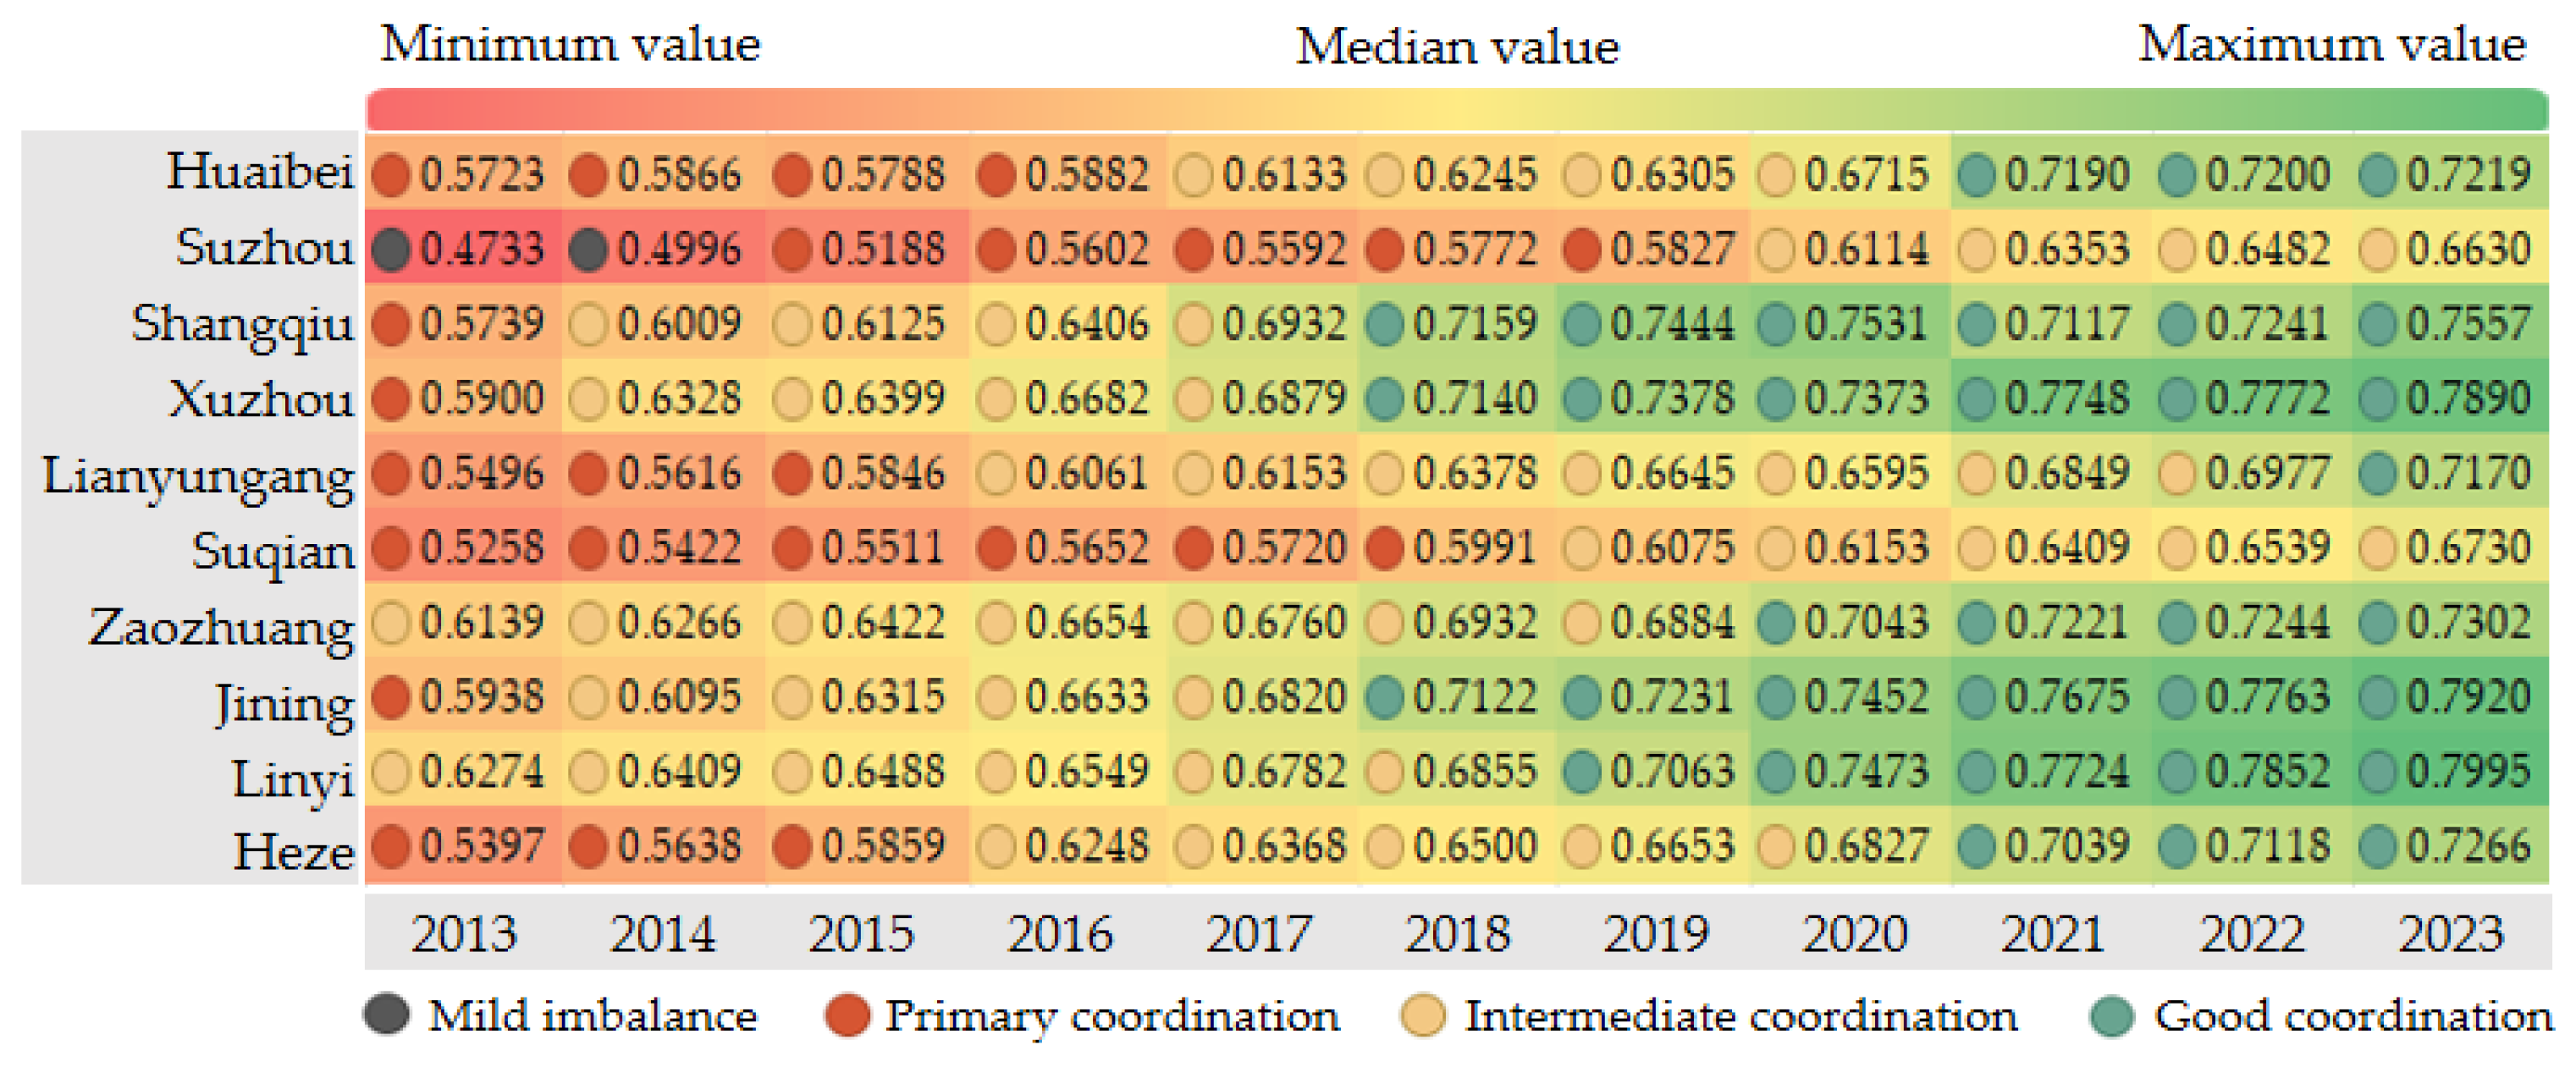
3.2.1. Temporal Evolution of the CCD Between New Urbanization and Urban Resilience

As shown in Figure 8, the CCD between new urbanization and urban resilience of each city in the HEZ exhibited a fluctuating upward trend from 2013 to 2023, reflecting a dynamic interaction and gradual optimization between the two systems. The regional average value of the CCD rose steadily from 0.5660 in 2013 to 0.7368 in 2023, with an average annual growth rate of 2.65%, indicating that the synergy effect of the two systems has been continuously enhanced. The CCD of individual cities ranged narrowly between 0.4733 and 0.7995. All cities in the HEZ exhibited upward trends, with no city experiencing a sustained decline, indicating that the region has entered a phase of benign interaction. In 2023, the CCD values of Xuzhou, Jining, and Linyi reached 0.7890, 0.7920, and 0.7995, respectively, which are significantly higher than the regional average, forming a high-coordination core cluster. In contrast, Suzhou and Suqian had the lowest initial CCD values in 2013 (0.4733 and 0.5258, respectively). By 2023, their CCD values increased to 0.663 and 0.673, respectively, but these values remained at a relatively low level within the region. This situation highlights several issues, reflecting persistent challenges such as agricultural dependency, weak industrial capacity, and inadequate infrastructure. Zaozhuang, affected by the transformation from a resource-based city, has a relatively low average annual growth rate of 1.78%, with a CCD value of 0.7302 in 2023, which is below the level of core cities. Shangqiu experienced a sharp CCD drop to 0.7117 in 2021 (from 0.7531 in 2020), likely due to traditional industrial overcapacity and population outflow, but partially recovered to 0.7557 by 2023. The acceleration of CCD growth in most cities in 2016 coincides with the implementation of the Huaihe River Ecological Economic Belt Development Plan, which confirms the synergistic driving effect of ecological governance and infrastructure investment [77,78].

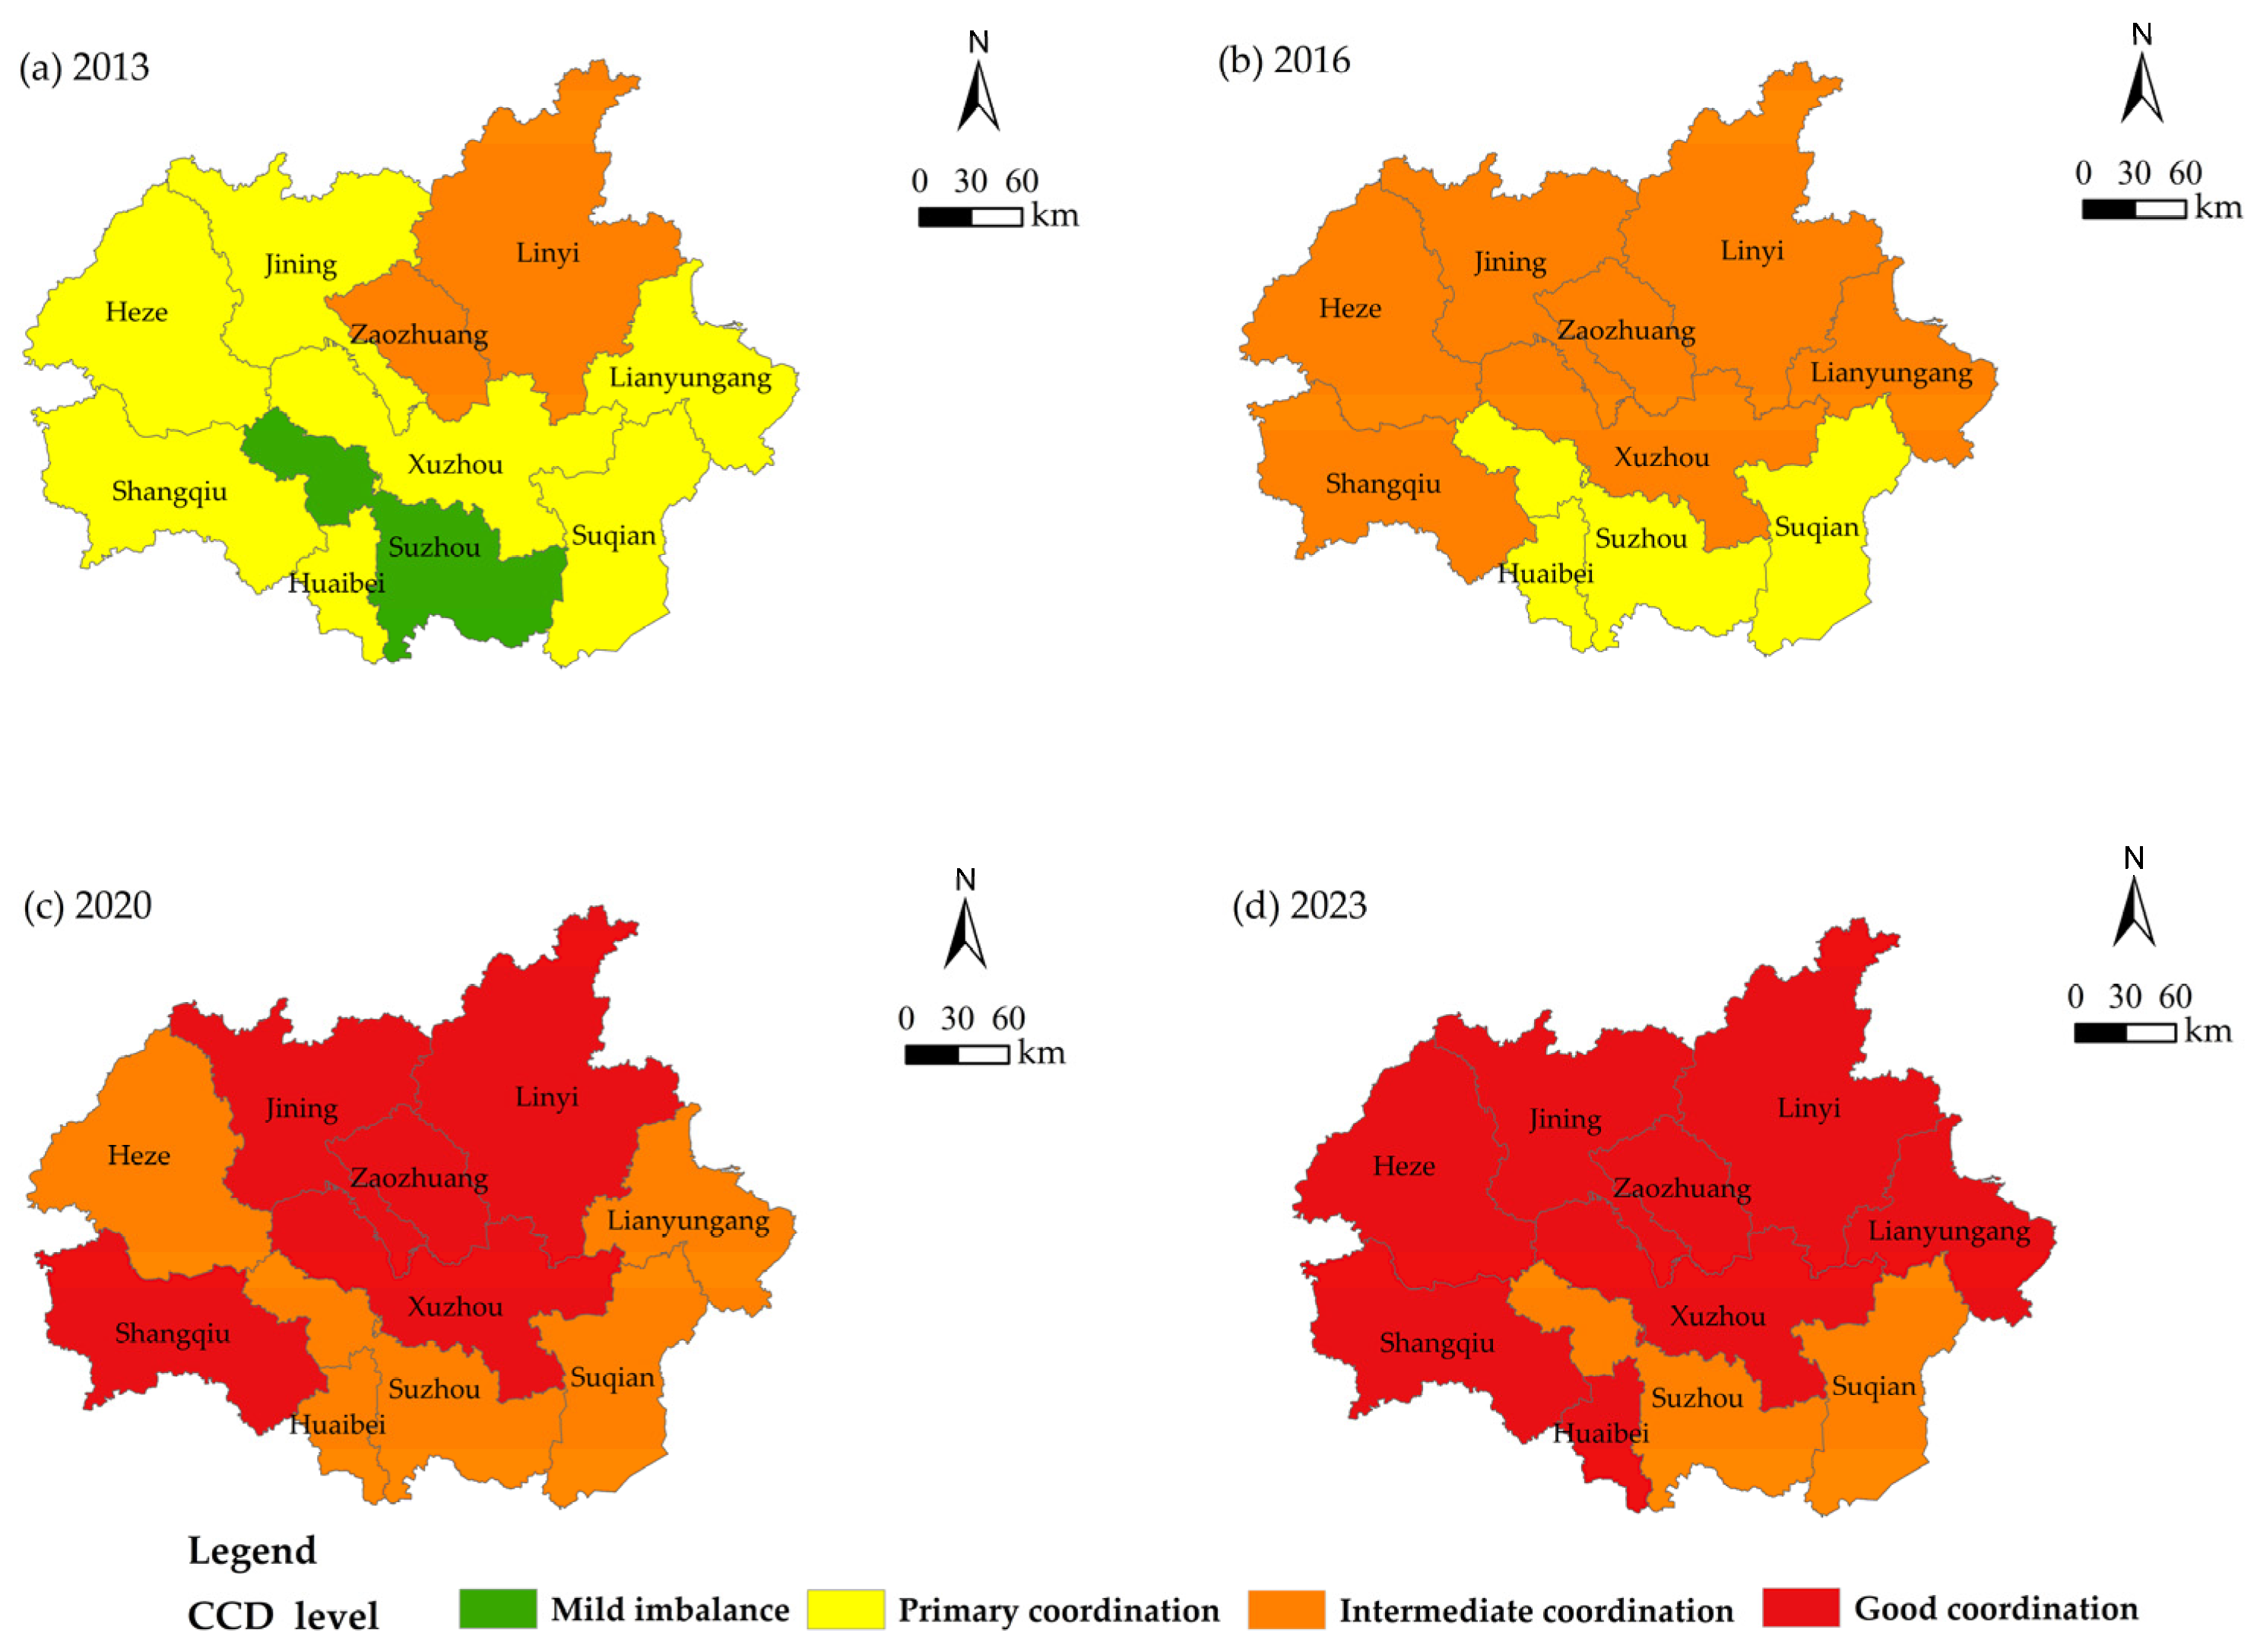
3.2.2. Spatial Evolution of the CCD Between New Urbanization and Urban Resilience

As shown in Figure 9, the CCD between new urbanization and urban resilience in the HEZ exhibited progressive improvement from 2013 to 2023. In 2013, most cities in the HEZ had reached the primary coordination level, Linyi and Zaozhuang were at the intermediate coordination level, while Suzhou was the only city in mild imbalance, and no large-scale imbalanced situation occurred. The number of coordinated-type cities was much greater than that of imbalanced-type cities, indicating that the coupling and coordination of new urbanization and urban resilience in the HEZ was relatively good. In 2016, all cities reached coordination types, with three cities in primary coordination and seven cities in intermediate coordination, marking a significant regional uplift. Suzhou has transformed from the imbalanced type to the coordinated type. In 2020, the CCD experienced a notable leap, with all cities in the region being above intermediate coordination or higher. Among them, Linyi, Xuzhou, Zaozhuang, Jining, and Shangqiu achieved good coordination. In 2023, the coordination level was further developed, and three additional cities of good coordination type were added, presenting a high-agglomeration coordinated development pattern. Mainly, cities such as Linyi, Xuzhou, and Jining played a leading role as core cities.
The spatial evolution of the CCD in the HEZ exhibits a distinct four-phase trajectory. Initially (2013), a north–south dichotomy manifested as unipolar development, with medium-coordination clusters dominating northern cities (Linyi and Zaozhuang), while Suzhou emerged as the mild imbalance city, marking a pronounced development trough. By 2016, spatial integration intensified significantly: Suzhou attained the coordination threshold alongside five cities advancing to intermediate coordination, collectively bridging the north–south developmental discontinuity to achieve region-wide coordination. Subsequent structural reorganization (2020) yielded an axial multi-nodal corridor along the Beijing–Shanghai High-Speed Railway, anchoring high-coordination hubs (Linyi, Xuzhou, Zaozhuang, and Jining) that contrasted sharply with persistent intermediate-coordination peripheries (Suqian and Suzhou). Ultimately (2023), cluster intensification expanded the Linyi–Xuzhou–Jining growth triangle’s radiative influence, incorporating Lianyungang, Heze, and Huaibei into high-coordination tiers. Persistent transitional gaps between Suzhou and core northern cities underscore enduring core–periphery structural tensions. The sustained improvement in the CCD across the HEZ can be attributed to three inter connected drivers. First, the HEZ’s geostrategic advantages—its pivotal location at the intersection of the Belt and Road Initiative and the Beijing–Shanghai–Longhai Railway Hub provided a robust foundation for infrastructure development and urban resilience construction. This geographic centrality facilitated efficient resource allocation, enhanced connectivity, and risk mitigation capabilities [74,79]. Second, cities consistently pursued dual pathways of ecological conservation and urban development, balancing green initiatives (e.g., watershed protection strategy, urban pollution control) with strategic urbanization (e.g., smart city construction, industrial green upgrading). This dual approach fostered systemic synergy, ensuring that resilience-building complemented rather than constrained urbanization. Finally, through policy coordination, collaborative governance frameworks, and inter-city industrial integration, these initiatives significantly enhanced regional collaboration. By pooling resources and harmonizing development agendas, cities mitigated inter-regional competition, and collectively addressed systemic vulnerabilities [76,80].

3.3. Key Driving Factors for the CCD Between New Urbanization and Urban Resilience

The coupling coordination development between new urbanization and urban resilience in the HEZ is influenced by multiple factors. This study comprehensively selected positive indicators that strongly reflect the performance of new urbanization and urban resilience. Using a grey relational model, we quantitatively analyzed the driving factors of their CCD. The selection of driving factors followed a rigorous dual-phase protocol to ensure theoretical validity and statistical robustness. First, literature consensus screening identified indicators with established relevance to the coupling between new urbanization and urban resilience, combined with the actual situation and existing research results [66,68,70,81], and several key driving factors were identified. Second, to diagnose multi-collinearity and ensure the reliability of influencing factors, a correlation coefficient matrix (|r|) was computed among all driving factors. The final seven drivers exhibited maximum inter-factor correlation of |r|< 0.6, confirming their non-redundant contribution to CCD dynamics. To mitigate potential multi-collinearity effects, variance inflation factor (VIF) diagnostics were conducted prior to driver analysis. As summarized in Table 2, all driving factors demonstrated VIF values well below the critical threshold of 5 (maximum VIF = 3.41), confirming the absence of severe multi-collinearity. This statistical verification ensures the reliability of subsequent grey relational analysis. Select per capita gross domestic product (Gdp) to represent the level of economic development, urban population density (Upd) to represent the degree of spatial intensification, per capita urban road area (Rpr) to represent infrastructure construction, the number of internet broadband subscribers (Tec) to represent digital capability, the green coverage rate of the built-up area (Gsc) to represent ecological governance capability, the density of drainage pipes in the built-up area (Dpd) represent the level of municipal resilience, and the number of health technicians per 10,000 people (Psl) represents the capacity of public services. The above seven indicators are the key driving factors influencing the CCD. The CCD between new urbanization and urban resilience in the HEZ was designated as the reference sequence. The seven drivers above served as comparison sequences. Grey relational grades between the CCD and each driver were calculated, thereby quantifying their relevance (results detailed in Table 2).
As shown in Table 2, the grey relational grades between the CCD of new urbanization and urban resilience in the HEZ and its driving factors all exceed 0.5. This indicates that there are significant correlations and strong promoting effects between the selected factors and the CCD. The influence hierarchy of driving factors on the CCD is ranked as follows: economic development level > public service capacity > municipal resilience level > infrastructure construction > digital capability > spatial intensification degree > ecological governance capacity. Among these, economic development level, public service capacity, and municipal resilience level exhibit relational degrees exceeding 0.7, indicating that there are core drivers for enhancing the CCD. Specifically, the economic development level provides foundational financial support for the synergy of urbanization and resilience construction. The public service capacity directly embodies the “people-centered” principle of new urbanization by optimizing healthcare, education, and other public service resources to strengthen social resilience. The municipal resilience level serves as the underlying foundation for the orderly operation of the urban system. Infrastructure construction, as a critical support for ensuring the coordinated development of the two systems, plays a vital role in advancing new urbanization through transportation network construction. Establishing integrated multi-modal transport systems reduces logistics costs, optimizes population mobility efficiency, and strengthens infrastructure service resilience. Digital capacity building, by integrating data resources among various government departments, conducting real-time monitoring of each subsystem of urbanization construction and urban resilience, and linking risk early warning with emergency management, can effectively enhance the efficiency and capacity of urban governance. The spatial intensification degree reflects the spatial allocation efficiency of land, population, and other elements during the process of urbanization. Through regional differentiated governance and spatial layout optimization, the functions and values of regional cities can be released. Ecological governance capacity, with a relational degree of 0.5410, remains the weakest link. It is necessary to further strengthen the investment in the protection, restoration, and governance of the ecological environment to address coordination imbalances.

4. Conclusions and Suggestions

4.1. Main Conclusions

Taking the HEZ as the research object, this study measures the development indices of new urbanization construction and urban resilience development and analyzes their spatial evolution patterns. The CCD model is used to measure the CCD between new urbanization and urban resilience, and the spatiotemporal evolution characteristics of the CCD in the HEZ are revealed. The key driving factors affecting the CCD between new urbanization and urban resilience are explored by using the grey relational analysis model. The main conclusions are as follows.
(1)
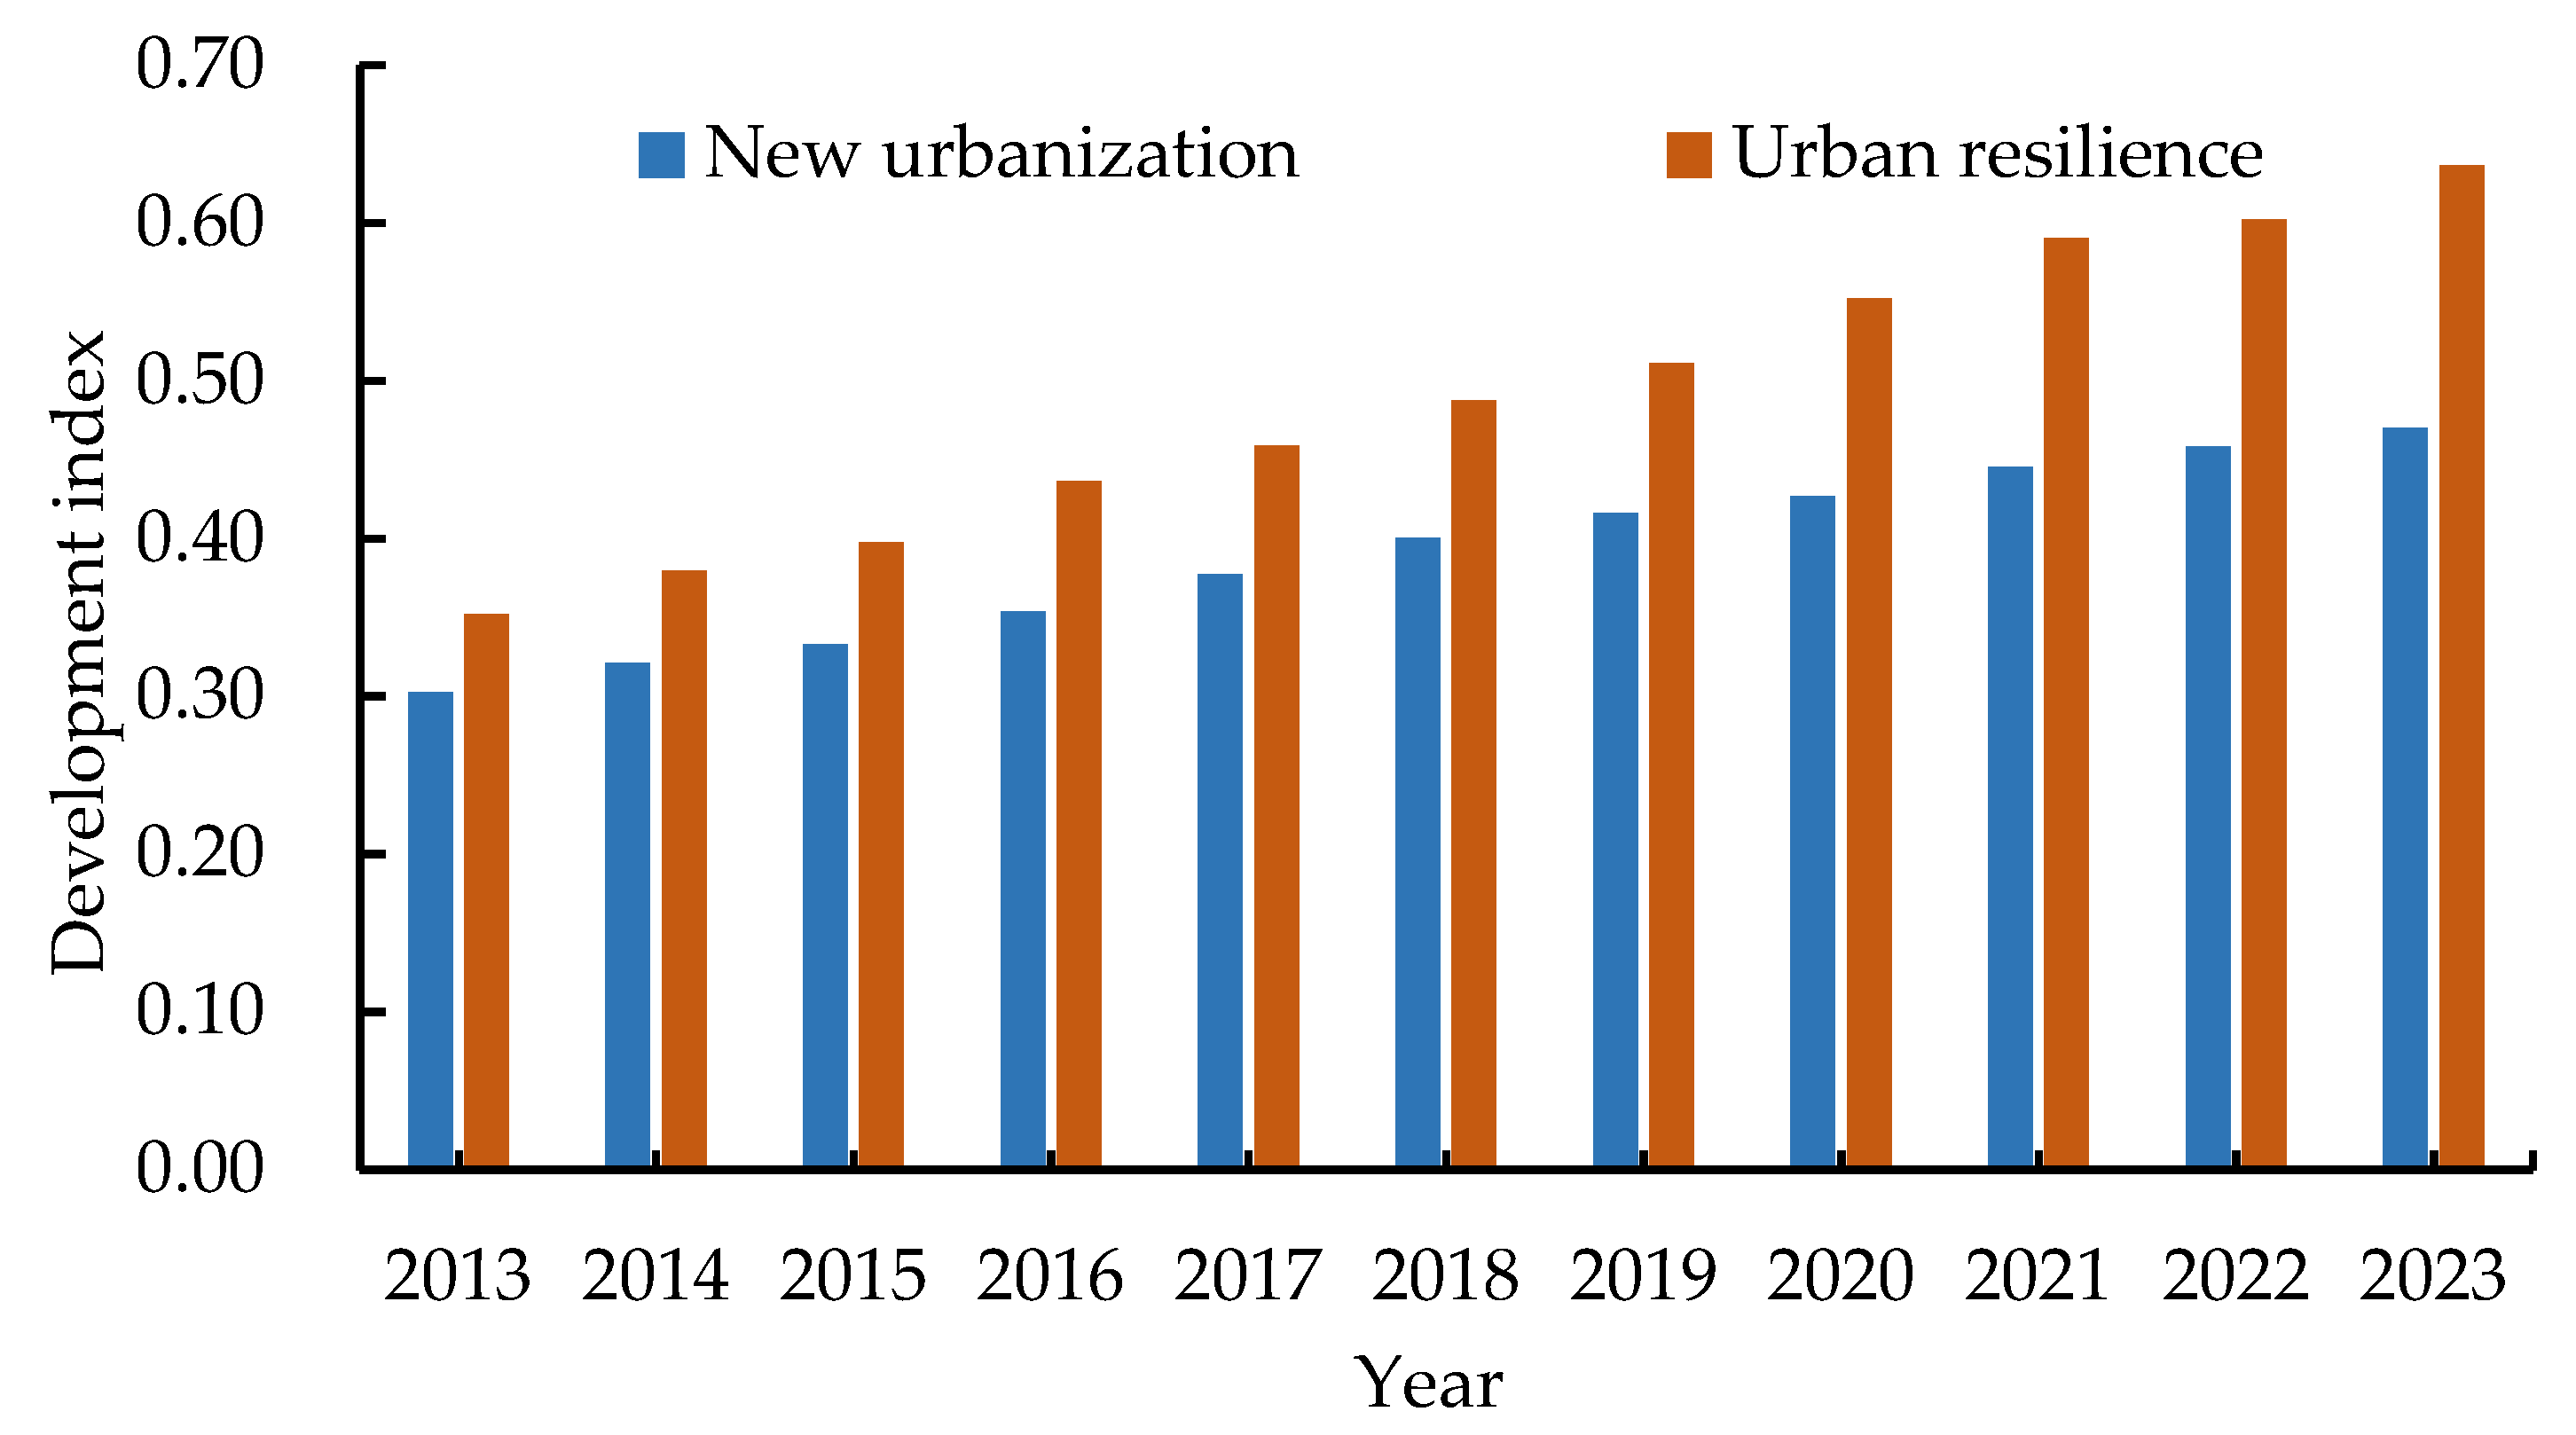
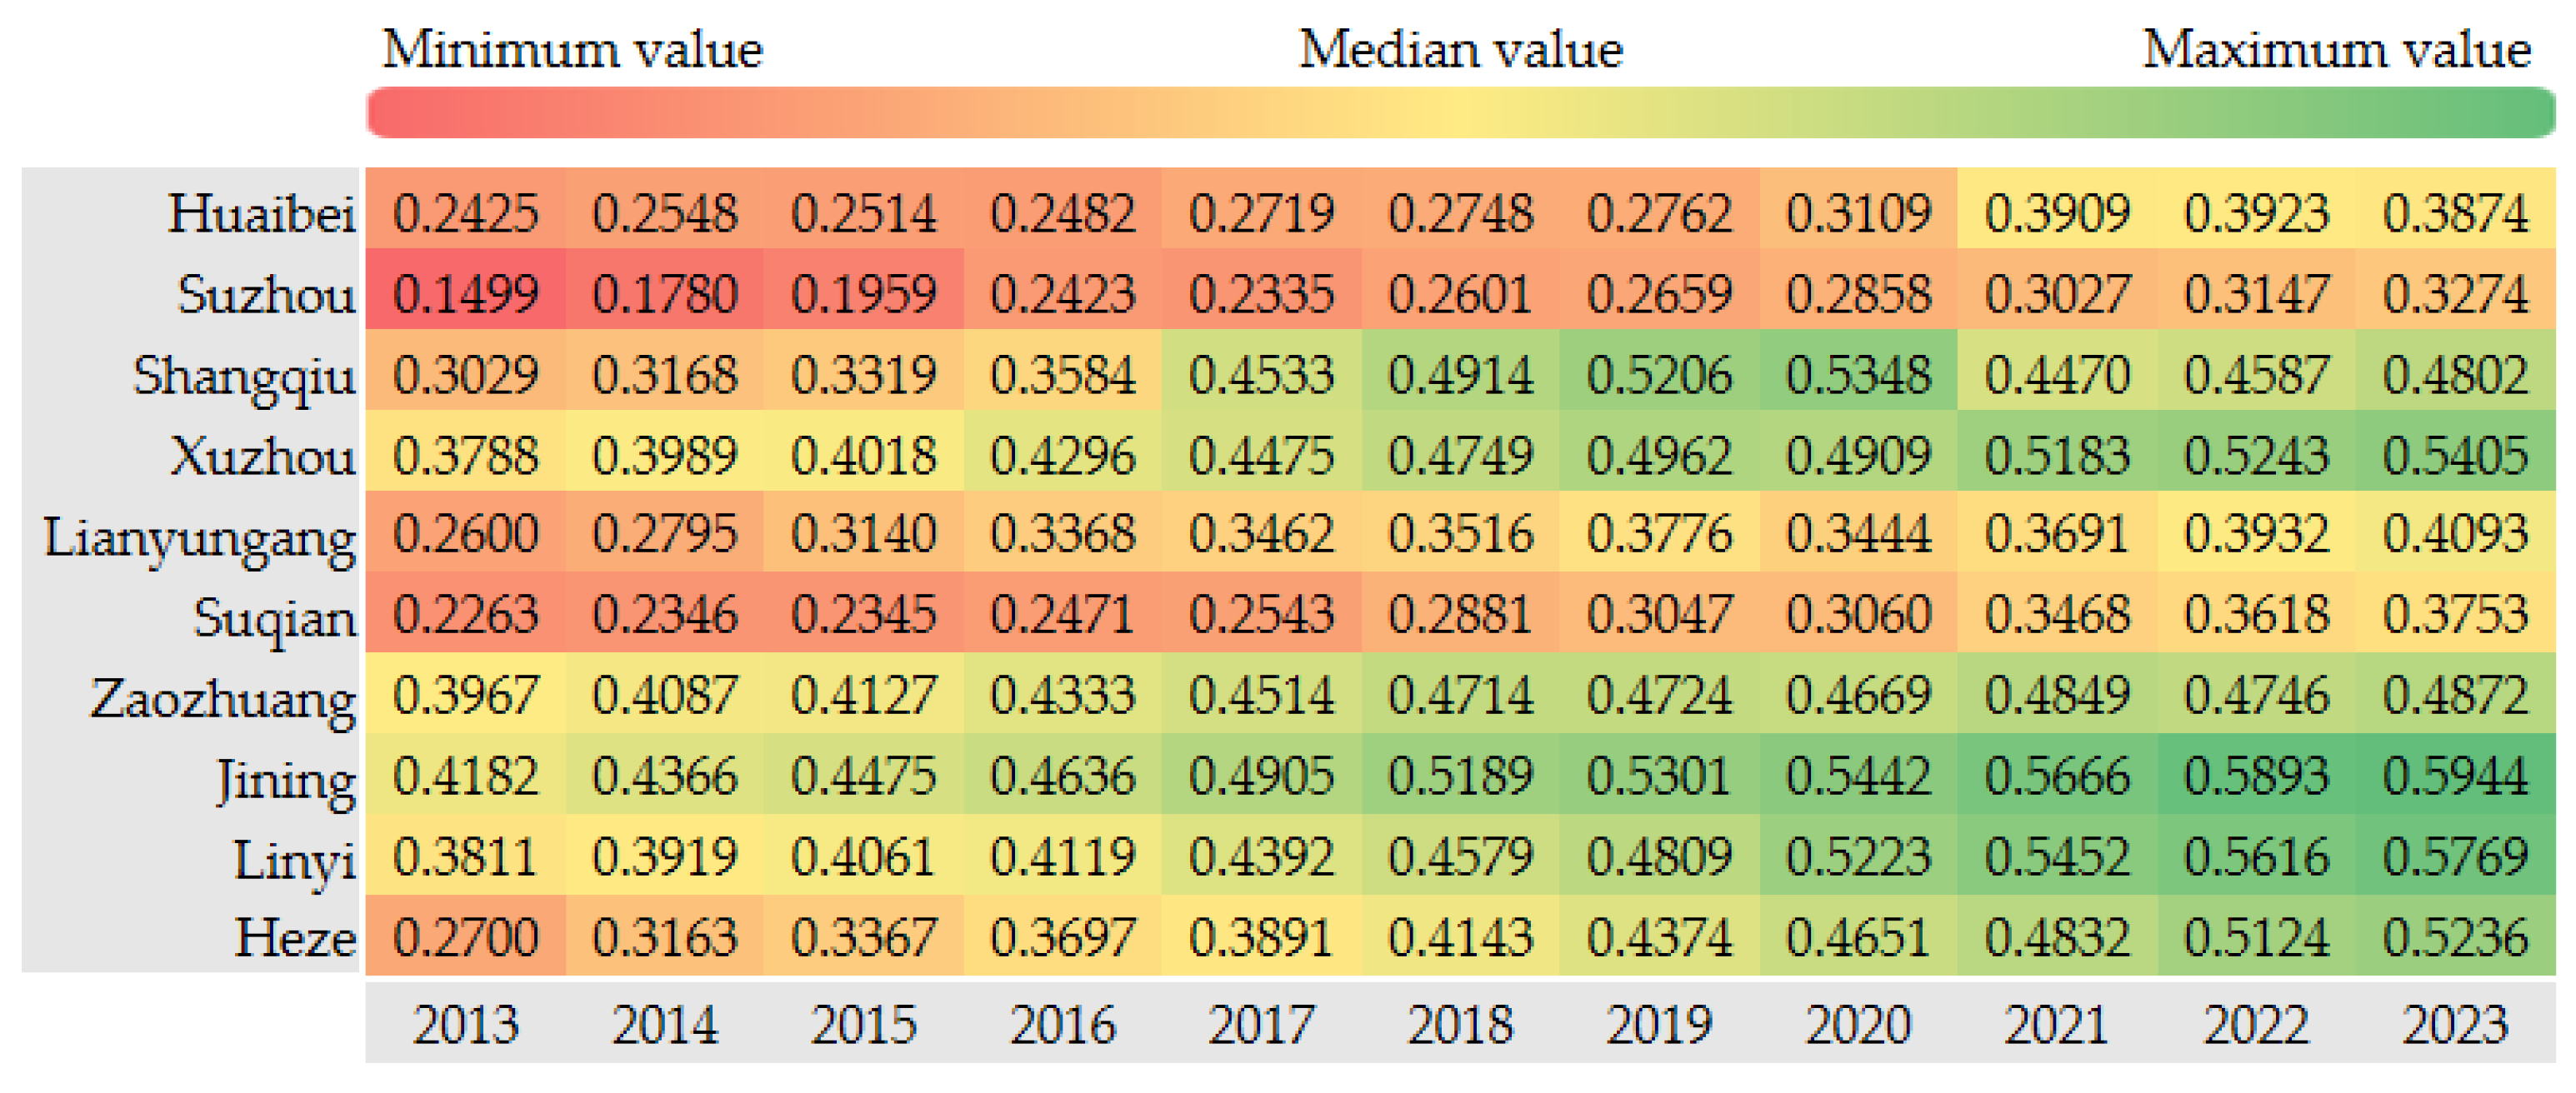
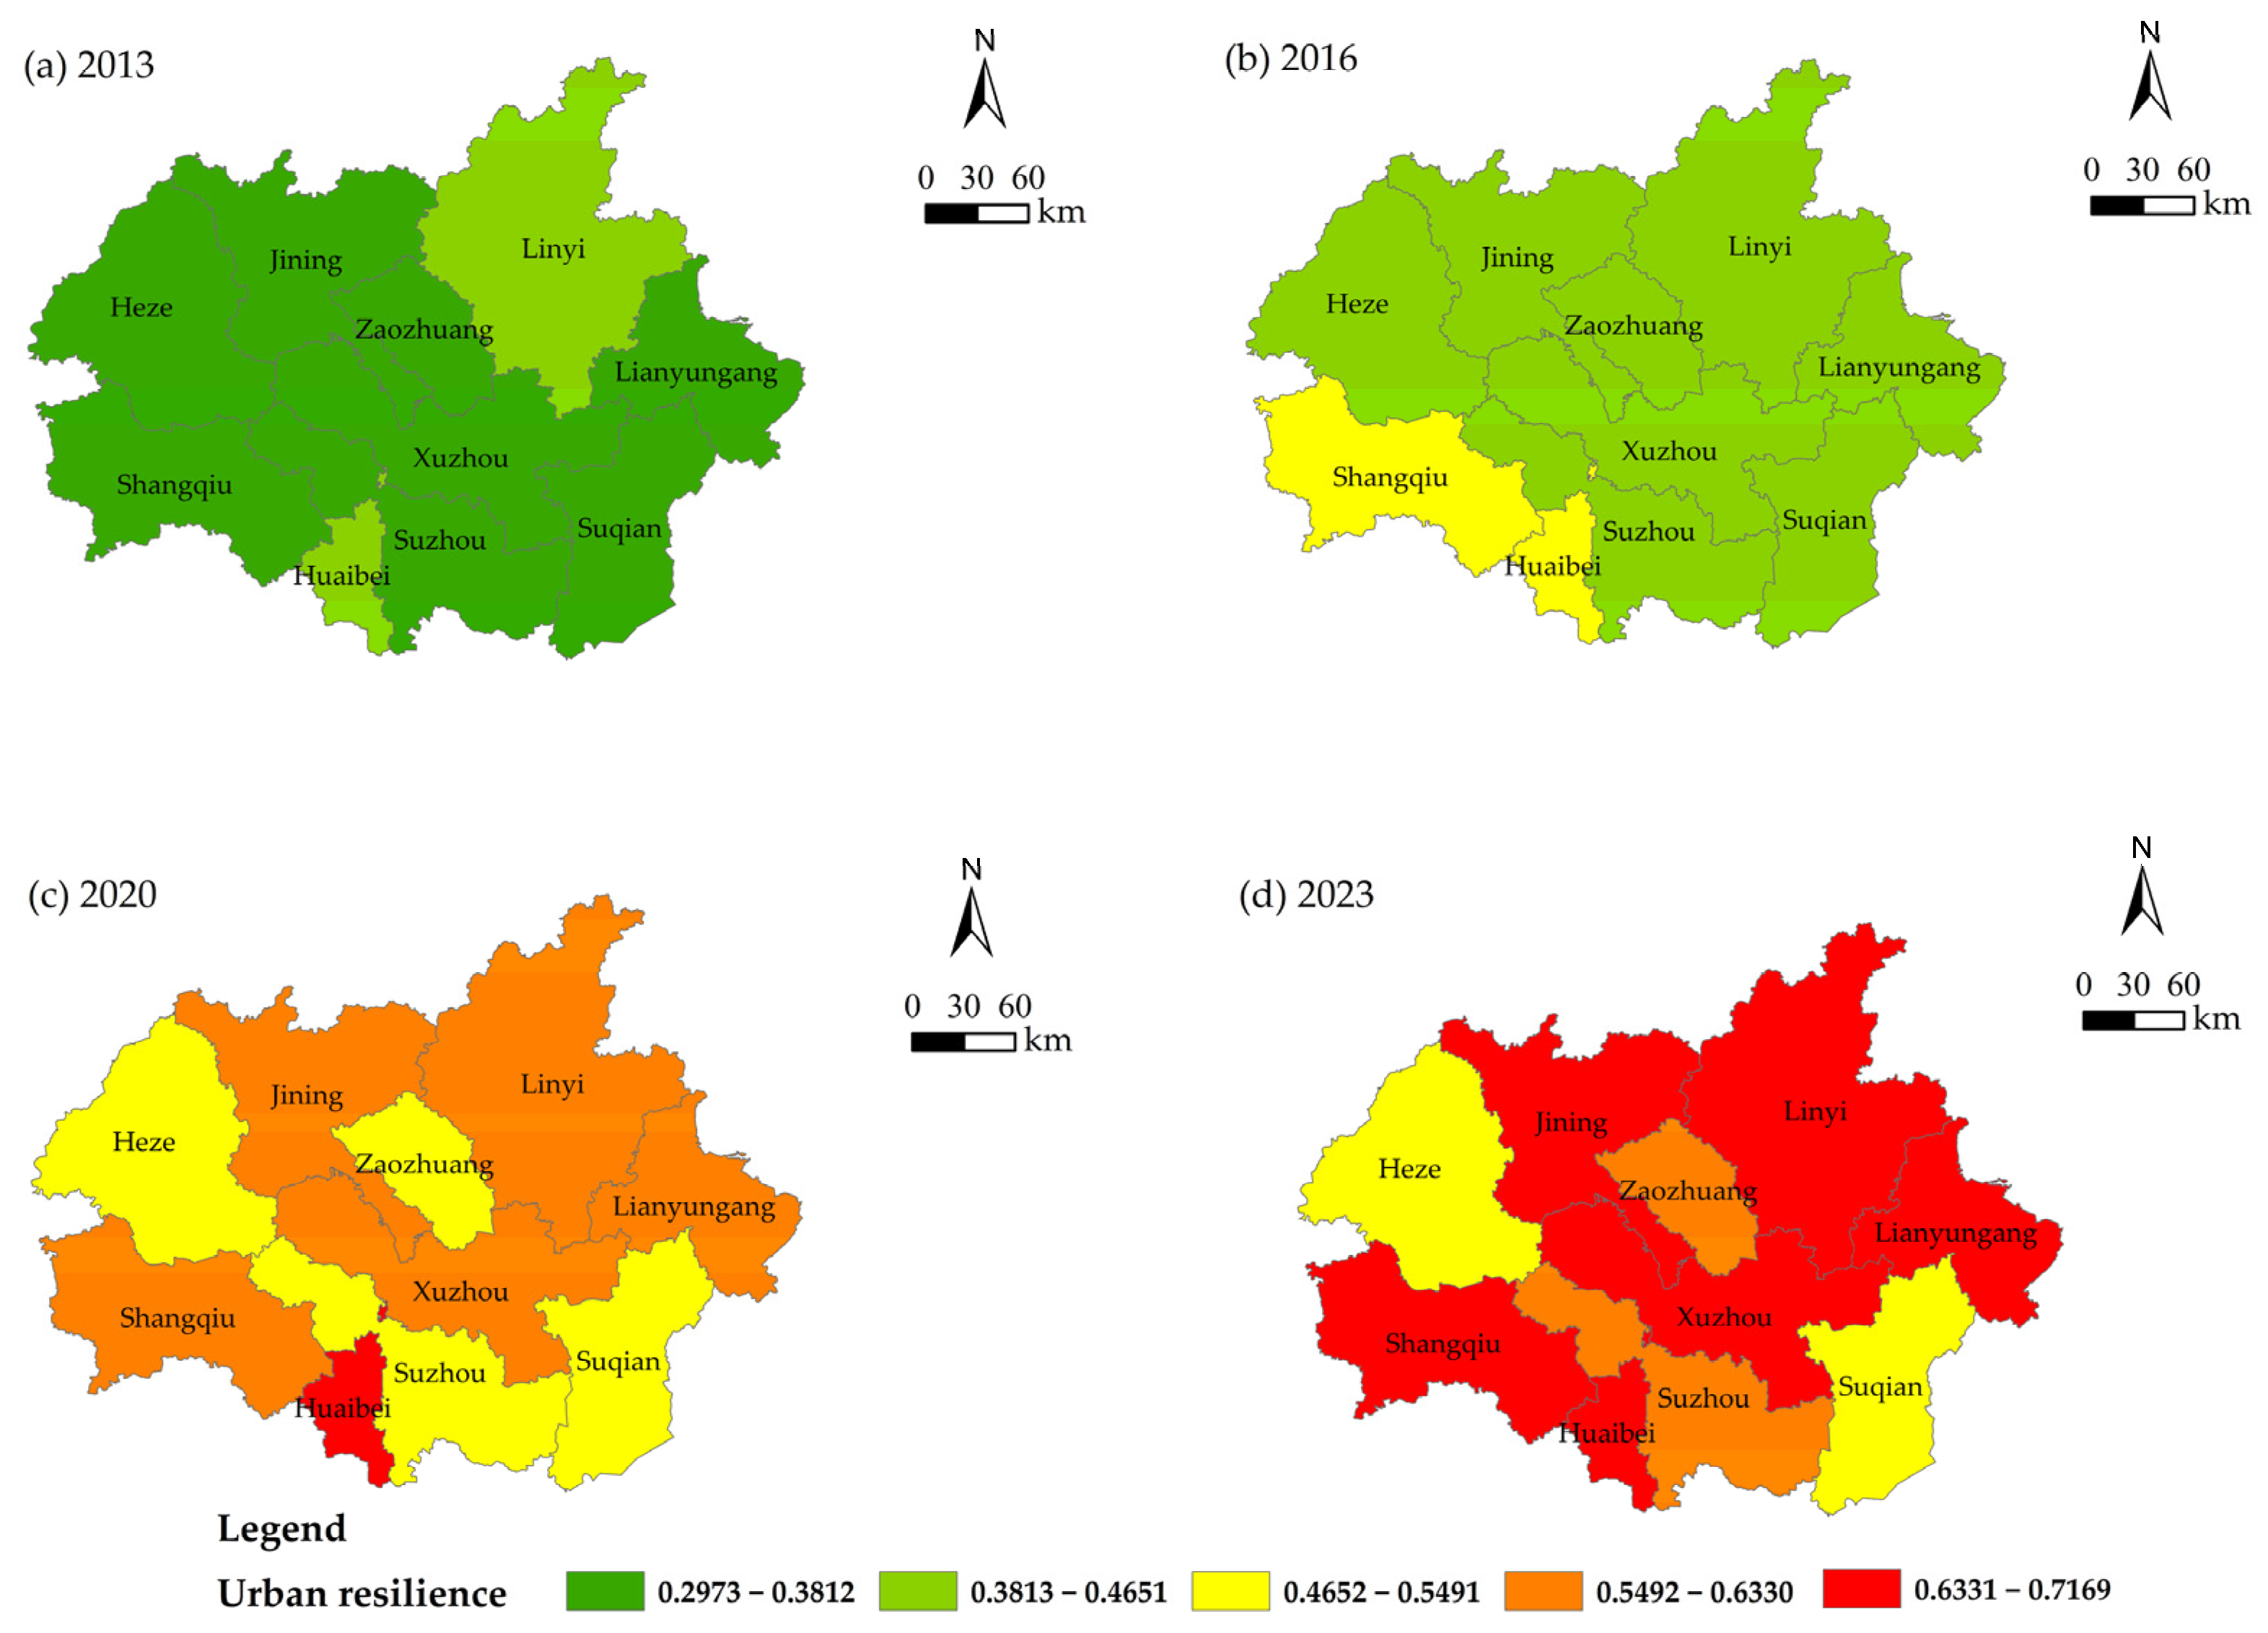
The development indices of new urbanization construction and urban resilience development. In terms of time series evolution, the new urbanization and urban resilience in the HEZ showed a steady upward trend from 2013 to 2023, and the growth rate of urban resilience was slightly higher than that of new urbanization. During the study period, the new urbanization construction index ranged between 0.30 and 0.47, the development level was relatively low, and there was still further improvement. The urban resilience development index ranged between 0.35 and 0.64, with the initial achievements in development. In terms of spatial evolution, the new urbanization generally presents the spatial characteristics of a “north–high, south–low” spatial pattern, and the distribution of urban resilience develops from regional distribution to regional overall improvement. Core cities like Xuzhou, Linyi, and Jining exhibited high levels of new urbanization construction and urban resilience development, with diminishing gradients toward peripheral areas, particularly weak in southern marginal cities.
(2)
The CCD between new urbanization and urban resilience. In the temporal evolution, the CCD of cities in the HEZ fluctuates upward, the overall horizontal interval span is small, and the development of cities is relatively balanced. In terms of spatial evolution, the HEZ generally presents a pattern of high aggregation and coordinated development. In 2013, only Suzhou was categorized as imbalanced, and the rest of the cities were coordinated types. The coordination type of the CCD has experienced evolution from primary coordination to good coordination, and the coordination type of cities presents a patchy distribution, which benefits from the great efforts made by regional cities in transportation interconnection and industrial cooperation.
(3)
Key driving factors affecting the CCD. As the core driving factors affecting the coordinated development of new urbanization and urban resilience, the economic development level, public service capacity, and municipal resilience level (correlation degree >0.7) promote their coordinated development through industrial transformation and upgrading, the rational allocation of public resources, and the improvement of municipal resilience facilities. Infrastructure construction and digitalization capacity improve the CCD by optimizing transportation network layout and strengthening smart city governance, respectively. Spatial intensity reveals regional differences in urban land resource allocation efficiency, which requires regional differential management to balance polarization effects and prevent inefficient development and utilization. Due to insufficient investment, ecological governance capacity (correlation degree is 0.5410) has become a key weakness affecting coordinated development. Urban ecological environment governance projects and regional ecological collaborative protection projects should be continuously carried out to constantly improve the regional ecological compensation mechanism.
Furthermore, these findings resonate with yet diverge from comparable studies on the coupling coordination between urbanization and resilience. Similar to cases in the Yangtze River Delta [38,40], southwestern China [15], arid region [33], and Shandong Peninsula [14], the HEZ demonstrates steady growth in both new urbanization and urban resilience indices, indicating consistent progress. The rising CCD in the HEZ also reveals core–periphery disparities (e.g., Xuzhou’s high coordination vs. Suzhou’s lag), confirming that economic agglomeration exacerbates spatial inequality—a pattern consistent with multiple case studies [35,54,65]. While cross-regional collaborative governance enables higher coordination levels elsewhere, this mechanism remains underdeveloped in the HEZ due to inter-provincial administrative fragmentation. The HEZ’s progress primarily stems from economic development, public service facilities, and municipal infrastructure investment. This suggests emerging economies may prioritize material capital over institutional innovation during early resilience-building phases, aligning with conclusions from seminal studies [68,80].

4.2. Suggestions for Optimization

As a special geographical unit spanning four provinces, the HEZ demonstrates positive momentum in coordinated development while confronting deep-seated challenges stemming from administrative barriers.
(1)
Border depression effect in resource allocation. The provincial allocation of construction land quotas has created a paradoxical phenomenon in inter-provincial border areas (e.g., the Xuzhou–Suzhou junction zone), characterized by duplicative infrastructure construction alongside public service vacuums. Industrial funds from the four provinces predominantly concentrate on provincial capitals and hinterland cities, resulting in restricted capital mobility. Consequently, infrastructure investment within the HEZ remains insufficient, with cross-provincial infrastructure projects accounting for a disproportionately small share of total investment.
(2)
Responsibility evasion dilemma in ecological governance. Transboundary rivers such as the Yi River and Shu River exhibit fragmented watershed management due to the “upstream pollution, downstream remediation” conflict. Furthermore, disaster prevention facilities operate within provincially isolated systems, exemplified by the non-interoperability between Shandong’s rainstorm early warning systems and Jiangsu’s emergency response platforms. This institutional fragmentation creates “resilience facility islands” that impede coordinated cross-regional disaster response.
(3)
Implementation challenges in policy coordination. The pollution remediation standards for industrial land in different provinces are different, and the environmental protection standards are also inconsistent, which has led to the migration of high polluting enterprises to low standard areas. The mismatch of assessment incentives has led to a higher weight of GDP assessment in various provinces and cities, while less attention is paid to urban resilience, which promotes the short-term behavior of “rebuilding and neglecting protection”.
Given the findings and characteristics of coordinated development in the HEZ, along with its practical challenges, we propose the following policies to strengthen new urbanization and urban resilience coupling coordination for high-quality regional development.
(1)
Construct a new urbanization construction system with gradient linkage. Due to the imbalance of economic and social development among regional cities, the transformation and upgrading paths of cities are also different. It is necessary to rely on the core driving force and comparative advantages of cities, clarify the functional orientation of cities, and establish a gradient development mode of “core leading function–complementary characteristic linkage”. Firstly, strengthen the radiation efficiency of core cities, build core leading cities with Xuzhou, Jining, and Linyi as the core, and build a Xuzhou–Jining–Linyi innovation axis. Xuzhou focuses on the development of high-end equipment manufacturing and industrial innovation clusters and radiates technical resources southward in conjunction with university research institutes; Jining relies on ecological resources to develop an ecological economy, builds ecological restoration demonstration bases in the lower reaches of the Yellow River, and explores the resource replacement mechanism of “ecological bank”; Linyi builds a commercial logistics trade hub in the HEZ and builds a digital supply chain platform covering southern Shandong and northern Jiangsu. Secondly, improve the regional function supplement. Lianyungang should focus on the construction of automated container terminals and sea–rail intermodal intelligent dispatching systems, and develop port-based bulk commodity trading centers; Zaozhuang and Huaibei should explore the transformation and development paradigm of resource-based cities, focus on cultivating new energy battery materials and industrial solid waste recycling industries, and promote the transformation of old industrial zones. Finally, strengthen the characteristic linkage development. Suzhou and Suqian should build smart agriculture and characteristic agriculture demonstration zones by introducing an agricultural Internet of Things management system; Shangqiu and Heze should rely on high-speed rail hubs to build cross-border e-commerce comprehensive experimental zones, supporting “one-stop” cross-border trade service platforms, and creating a gateway to the opening up of Central Plains Urban Agglomerations, thereby restructuring traditional industrial path dependence.
(2)
Implement a precise reinforcement strategy for resilience short boards. In the process of promoting new urbanization, population migration, industrial pollution, soil erosion, and other problems have caused serious oppression of ecological and municipal systems. Given the weak links of ecological and municipal systems, the resilient development strategy of “zonal governance and facility upgrading” should be adopted. On the one hand, differential management and control shall be carried out, the ecological red line shall be maintained, green and effective ecological resilience promotion means shall be implemented, and green ecological security development pattern shall be constructed. For example, the “development–restoration” linkage system should be implemented for resource-based cities such as Huaibei, Jining, and Xuzhou, focusing on measures such as mine re-greening, wetland reconstruction, and green infrastructure reconstruction. A compensation mechanism for the withdrawal of high-pollution and high-emission enterprises should be established, and the original site of the enterprise should be preferentially transformed into an emergency material reserve or disaster prevention park. On the other hand, municipal resilience facilities improvement projects and strengthening public emergency infrastructure construction should be carried out. Increase capital investment in urban municipal roads, underground pipe networks, emergency management, etc., and strengthen the ability of urban systems to withstand risks. In order to eliminate the edge effect, actively promote urban cooperation, simultaneously establish a regional compensation mechanism for resilient elements, and improve the resource integration and factor flow rate among cities. For example, ecological node urban ecological conservation areas can sell ecological quotas to regional industrial cities through carbon sink transactions to realize cross-regional transformation of ecological values.
(3)
Innovate regional collaborative governance mechanisms. Regional cities should further strengthen ecological environment governance, optimize infrastructure construction and public service allocation, and increase industrial transformation and upgrading, so as to enhance intra-regional coordination, and form a green and sustainable urban development model. Externally, based on the common interests of coordinated regional development, to stimulate regional vitality and development advantages. For example, Xuzhou, Jining, and other cities with high scientific and technological innovation levels should radiate their technological advantages to surrounding cities to improve the scientific and technological innovation level of surrounding cities. Resource-based cities such as Zaozhuang, Huaibei, and Suzhou should accelerate green transformation to provide resource support for surrounding cities. In addition, integrate data resources of 10 cities in the HEZ, build a unified “Huaihai Smart City Cloud Brain” to integrate multi-source data (urban geographic information, ecological information, social information and government data, etc.) for real-time monitoring, risk early warning, and intelligent resource dispatch, fostering a “regional linkage and technological empowerment” governance framework to achieve coordinated and sustainable urban management.

4.3. Research Limitations and Prospects

(1)
Limitations in multi-source data integration. Although the current evaluation systems constructed in the study cover multi-dimensional indicators such as economy, population, and smart, the data source is still mainly statistical data, which does not fully integrate multi-source heterogeneous data such as remote sensing images, real-time monitoring of the Internet of Things and social media, and may ignore high-precision spatiotemporal dynamic information [67,68]. The dimension of smart urbanization focuses on infrastructure coverage and lacks a dynamic evaluation of digital governance effectiveness and citizen participation. The reliance on single data sources risks compromising the comprehensiveness and timeliness of the indicator system.
(2)
Insufficient analysis of regional disparity mechanisms. Although the study reveals the “north–high, south–low” pattern and core–periphery disparities in the CCD between new urbanization and urban resilience in the HEZ, there is a lack of quantitative analysis of the deep mechanism of the underlying mechanisms. In addition, although the grey relational analysis model identifies the influence ranking of driving factors, it does not reveal the spatial heterogeneity of driving forces in combination with spatial econometrics models (such as geographically weighted regression and spatial metrology model [54,82]), resulting in a less systematic explanation of the causes of regional differences.
(3)
Inadequate consideration of dynamic interactions and long-term effects. Although this study focused on the spatiotemporal evolution of the study area from 2013 to 2023, it did not include longer-period data or scenario simulations (such as climate change, policy interventions, path dependence, etc.), limiting the assessment of external shocks on the CCD over extended periods [17,21,40,61]. Additionally, the model does not consider the non-linear feedback mechanism between new urbanization and urban resilience, which may underestimate the complexity of system synergy. The grey relational analysis model mainly detects monotonic relationships, which may overlook complex non-linearities and is not suitable for systems with threshold effects. In terms of analyzing the key factors influencing the CCD, considering the limitations of the existing linear models, it is important to further explore the use of non-linear models (such as random forests, ridge regression, etc.) to more accurately reveal the mechanisms of action of each factor and provide a more robust theoretical basis for regional safety resilience and sustainable development.
(4)
Methodology transferability framework. The proposed methodology is transferable to regions confronting analogous challenges of urbanization–resilience coordination (e.g., Hohhot–Baotou–Ordos–Yulin region, northern Slope of Tianshan Mountain in Xinjiang, Changsha–Zhuzhou–Xiangtan Metropolitan Circle, and western Taiwan Straits Economic Zone). However, context-specific adaptations are essential. For resource-based regions (e.g., Hohhot–Baotou–Ordos–Yulin region), increase the weights of industrial transformation and ecological governance in both new urbanization and urban resilience systems to reflect mining impacts on sustainable development [27]. For data-scarce areas (e.g., northern Slope of Tianshan Mountain), adopt simplified indicator systems as low-cost alternatives. For data-rich zones (e.g., western Taiwan Straits Economic Zone), leverage multi-source metrics such as nighttime light intensity to invert economic urbanization levels, or design context-specific indicators to avoid mechanistic application of the framework [56,61,77]. Additionally, dynamic threshold calibration is necessary. While linear CCD divisions are pragmatic, future work should calibrate region-specific thresholds using clustering algorithms. The CCD classification thresholds (e.g., 0.6 for intermediate coordination) must be recalibrated based on regional baseline conditions [21,35,83]. This ensures spatial sensitivity and methodological adaptability.

Author Contributions

Conceptualization, Heng Zhang and Jiang Chang; methodology, Heng Zhang and Shuang Li; software, Shuang Li; validation, Heng Zhang, Jiang Chang, and Shuang Li; formal analysis, Heng Zhang; investigation, Heng Zhang and Shuang Li; data curation, Shuang Li; writing—original draft preparation, Heng Zhang and Shuang Li; writing—review and editing, Heng Zhang and Jiang Chang; visualization, Heng Zhang and Jiang Chang; supervision, Heng Zhang and Jiang Chang; project administration, Heng Zhang; funding acquisition, Heng Zhang. All authors have read and agreed to the published version of the manuscript.

Funding

This research was funded by the National Natural Science Foundation of China (grant number 42401352).

Data Availability Statement

The data presented in this study are available upon request from the corresponding author.

Acknowledgments

The authors would like to express their sincere gratitude to the editor and the anonymous reviewers for their insightful and constructive comments.

Conflicts of Interest

The authors declare no conflicts of interest.

References

  1. Yao, S.; Zhang, P.; Yu, C.; Li, G.; Wang, C. The theory and practice of new urbanization in China. Sci. Geogr. Sin. 2014, 34, 641–647. [Google Scholar] [CrossRef]
  2. Sun, G. New urbanization: Development evolution, strategic thinking and institutional supply. Economist 2025, 3, 77–86. [Google Scholar] [CrossRef]
  3. Li, B.Q.; Chen, C.L.; Hu, B.L. Governing urbanization and the New Urbanization Plan in China. Environ. Urban 2016, 28, 515–534. [Google Scholar] [CrossRef]
  4. Guan, X.; Wei, H.; Lu, S.; Dai, Q.; Su, H. Assessment on the urbanization strategy in China: Achievements, challenges and reflections. Habitat Int. 2018, 71, 97–109. [Google Scholar] [CrossRef]
  5. Leichenko, R. Climate change and urban resilience. Curr. Opin. Environ. Sustain. 2011, 3, 164–168. [Google Scholar] [CrossRef]
  6. Shamsuddin, S. Resilience resistance: The challenges and implications of urban resilience implementation. Cities 2020, 103, 102763. [Google Scholar] [CrossRef]
  7. Mallick, S.K.; Das, P.; Maity, B.; Rudra, S.; Pramanik, M.; Pradhan, B.; Sahana, M. Understanding future urban growth, urban resilience and sustainable development of small cities using prediction-adaptation-resilience (PAR) approach. Sustain. Cities Soc. 2021, 74, 103196. [Google Scholar] [CrossRef]
  8. Amirzadeh, M.; Sobhaninia, S.; Sharifi, A. Urban resilience: A vague or an evolutionary concept? Sustain. Cities Soc. 2022, 81, 103853. [Google Scholar] [CrossRef]
  9. Shan, Z.; Huang, Y. An analysis of the concept, goals, contents, planning strategies and misunderstandings of new urbanization. Urban Plan. Forum 2013, 2, 16–22. [Google Scholar]
  10. Fang, C. Basic rules and key paths for high-quality development of the new urbanization in China. Geogr. Res. 2019, 38, 13–22. [Google Scholar]
  11. Chen, C.K.; Xu, L.L.; Zhao, D.Y.; Xu, T.; Lei, P. A new model for describing the urban resilience considering adaptability, resistance and recovery. Saf. Sci. 2020, 128, 104756. [Google Scholar] [CrossRef]
  12. Zeng, X.; Yu, Y.C.; Yang, S.; Lv, Y.; Sarker, M.N.I. Urban Resilience for Urban Sustainability: Concepts, Dimensions, and Perspectives. Sustainability 2022, 14, 2481. [Google Scholar] [CrossRef]
  13. Datola, G. Implementing urban resilience in urban planning: A comprehensive framework for urban resilience evaluation. Sustain. Cities Soc. 2023, 98, 104821. [Google Scholar] [CrossRef]
  14. Tang, H.; Yang, M.; Li, M.; Zhang, L.; Shao, Z. Research on coupling coordination of urban resilience and new-type urbanization in the Shandong Peninsula Urban Agglomeration. Areal Res. Dev. 2024, 43, 85–90+126. [Google Scholar]
  15. Fan, H.; Zhao, C. Research on the coupling coordination relationship between urbanization and ecological resilience in southwest China. Res. Soil Water Conserv. 2025, 32, 340–352. [Google Scholar] [CrossRef]
  16. He, X.; Shi, C.; Peng, K. Spatial-temporal adaptation and interactive response of new-type urbanization and ecological resilience in the middle reaches of the Yangtze River. Resour. Environ. Yangtze Basin 2024, 33, 699–714. [Google Scholar]
  17. Li, Y.; Li, M. Coupling coordination, spatial-temporal patterns and dynamic impact of the new urbanization and ecological resilience in the Yangtze River Economic Belt. Resour. Environ. Yangtze Basin 2024, 33, 2329–2341. [Google Scholar]
  18. Zhou, C.; Zheng, X.; Yang, Q. Coevolution of new urbanization and rural revitalization and its citizenization effect. Geogr. Res. 2024, 43, 3265–3288. [Google Scholar]
  19. Shi, C.; He, X. Influence of environmental regulation on urban ecological resilience:a case study of urban agglomeration in the middle reaches of the Yangtze River. J. Shaanxi Norm. Univ. Nat. Sci. Ed. 2023, 51, 56–71. [Google Scholar] [CrossRef]
  20. Ou, J.; Xu, C.; Chen, D. High-quality development of new urbanization in Guangdong province: Spatio-temporal evolution, influencing factors. Econ. Geogr. 2023, 43, 78–87. [Google Scholar] [CrossRef]
  21. Gen, Y.; Li, X.; Chen, J.; Liu, X.; Zhang, J.; Cheng, J. Coupling relationship and transition mechanism between resilience and efficiency in China’s territorial space. Acta Ecol. Sin. 2024, 44, 6003–6019. [Google Scholar] [CrossRef]
  22. Tu, D.H.; Cai, Y.Y.; Liu, M.B. Coupling coordination analysis and spatiotemporal heterogeneity between ecosystem services and new-type urbanization: A case study of the Yangtze River Economic Belt in China. Ecol. Indic. 2023, 154, 110535. [Google Scholar] [CrossRef]
  23. Yang, C.; Zeng, W.; Yang, X. Coupling coordination evaluation and sustainable development pattern of geo-ecological environment and urbanization in Chongqing municipality, China. Sustain. Cities Soc. 2020, 61, 102271. [Google Scholar] [CrossRef]
  24. Wang, S.; Cui, Z.; Lin, J.; Xie, J.; Su, K. Coupling relationship between urbanization and ecological resilience in the Pearl River Delta. Acta Geogr. Sin. 2021, 76, 973–991. [Google Scholar]
  25. Guo, H.; Liu, X. Coupling and coordination mechanism of new urbanization and ecological resilience in central cities along the Yellow River. East China Econ. Manag. 2023, 37, 101–109. [Google Scholar] [CrossRef]
  26. Zhu, S.Y.; Feng, H.B.; Arashpour, M.; Zhang, F. Enhancing urban flood resilience: A coupling coordinated evaluation and geographical factor analysis under SES-PSR framework. Int. J. Disaster Risk Reduct. 2024, 101, 104243. [Google Scholar] [CrossRef]
  27. Jiang, Y.; Ouyang, J.; Zhang, J. Evolution of social-ecological system resilience and its mainobstacle factors in resource-based cities: A case study of Panzhihua. Resour. Sci. 2024, 46, 2064–2077. [Google Scholar]
  28. Han, S.; Wang, B.; Ao, Y.B.; Bahmani, H.; Chai, B.B. The coupling and coordination degree of urban resilience system: A case study of the Chengdu-Chongqing urban agglomeration. Environ. Impact Assess. Rev. 2023, 101, 107145. [Google Scholar] [CrossRef]
  29. Guo, H. The coupling and coordinated development of new-type urbanization and ecological resilience in Qingdao: Based on the comparison of the central cities along the Yellow River. J. China Univ. Pet. Ed. Soc. Sci. 2023, 39, 22–31. [Google Scholar] [CrossRef]
  30. Ma, H.; Chu, J.; Li, J. A study on the coupling coordination between urban resilience and urbanization in Anhui Province. World Surv. Res. 2023, 7, 28–37. [Google Scholar] [CrossRef]
  31. Mu, X.F.; Fang, C.L.; Yang, Z.Q. Spatio-temporal evolution and dynamic simulation of the urban resilience of Beijing-Tianjin-Hebei urban agglomeration. J. Geogr. Sci. 2022, 32, 1766–1790. [Google Scholar] [CrossRef]
  32. Wang, D.; Long, H.; Wang, K.; Wang, H.; Chai, H.; Gao, J. Coupling coordination analysis of urbanization intensity and ecological resilience in Beijing-Tianjin-Hebei. Acta Ecol. Sin. 2023, 43, 6321–6331. [Google Scholar]
  33. Li, S.; Liu, H. Spatio-temporal pattern evolution of coupling coordination between urbanization and ecological resilience in arid region: A case of Ningxia Hui Autonomous Region. Arid. Land Geogr. 2022, 45, 1281–1290. [Google Scholar]
  34. He, S.; Li, H.; Qin, M.; Wang, X.; Yang, Z. Spatial analysis of the coupling of new urbanization and urban resilience in China and research on its influencing factors. J. Henan Univ. Nat. Sci. 2024, 54, 540–553. [Google Scholar] [CrossRef]
  35. Liu, H.; Wang, G.; Zhang, P.; Wang, Z.; Zhang, L. Spatio-temporal evolution and coordination influence of coupling coordination between new urbanization and ecological resilience in Fenhe River Basin. J. Nat. Resour. 2024, 39, 640–667. [Google Scholar]
  36. Zhao, Z.; Hu, Z.; Han, X.; Chen, L.; Li, Z. Evaluation of Urban Resilience and Its Influencing Factors: A Case Study of the Yichang–Jingzhou–Jingmen–Enshi Urban Agglomeration in China. Sustainability 2024, 16, 7090. [Google Scholar] [CrossRef]
  37. Chen, M.; Gong, Y.; Lu, D.; Ye, C. Build a people-oriented urbanization: China’s new-type urbanization dream and Anhui model. Land Use Policy 2019, 80, 1–9. [Google Scholar] [CrossRef]
  38. Zhou, Q.; Liu, D. Study on the coordinated development of urban resilience and urbanization level in the urban agglomeration of Yangtze River Delta. Res. Soil Water Conserv. 2020, 27, 286–292. [Google Scholar] [CrossRef]
  39. Zhang, Y.; Liu, Q.; Li, X. Spatiotemporal evolution of the coupling coordination of urban resilience and new urbanization in the urban agglomeration of Yangtze River delta. Urban Probl. 2022, 5, 17–27. [Google Scholar] [CrossRef]
  40. Peng, K.J.; He, X.R.; Xu, C.X. Coupling Coordination Relationship and Dynamic Response between Urbanization and Urban Resilience: Case of Yangtze River Delta. Sustainability 2023, 15, 2702. [Google Scholar] [CrossRef]
  41. Li, H.Y.; Hu, C.X.; Zhu, M.Y.; Hong, J.R.; Wang, Z.J.; Fu, F.; Zhao, J.Q. Study on the coupled and coordinated development of urban resilience and urbanization level in the Yellow River Basin. Environ. Dev. Sustain. 2024. [Google Scholar] [CrossRef]
  42. Sun, J.; Zhai, N.N.; Mu, H.R.; Miao, J.C.; Li, W.X.; Li, M.F. Assessment of urban resilience and subsystem coupling coordination in the Beijing-Tianjin-Hebei urban agglomeration. Sustain. Cities Soc. 2024, 100, 105058. [Google Scholar] [CrossRef]
  43. He, G.; Yang, J.; Bao, K.; Zhou, Q. Analysis for the spatial correlation and the impact of the newly urbanized trend on the regional eco-environment quality. J. Saf. Environ. 2020, 20, 1958–1966. [Google Scholar] [CrossRef]
  44. Walker, B.; Holling, C.S.; Carpenter, S.R.; Kinzig, A.P. Resilience, Adaptability and Transformability in Social-ecological Systems. Ecol. Soc. 2004, 9, 5. [Google Scholar]
  45. Wan, Z.; Zhao, C.; Zhu, J.; Ma, X.; Chen, J.; Wang, J. Assessment and Prediction of Coastal Ecological Resilience Based on the Pressure–State–Response (PSR) Model. Land 2024, 13, 2130. [Google Scholar] [CrossRef]
  46. Song, Y.; Gao, Y.; Zhang, S.; Dong, H.; Liu, X. Research on the Coupling Coordination and Driving Mechanisms of New-Type Urbanization and the Ecological Environment in China’s Yangtze River Delta. Sustainability 2024, 16, 5308. [Google Scholar] [CrossRef]
  47. Huang, J.; Zhong, P.; Zhang, J.; Zhang, L. Spatial-temporal differentiation and driving factors of ecological resilience in the Yellow River Basin, China. Ecol. Indic. 2023, 154, 110763. [Google Scholar] [CrossRef]
  48. Liao, Z.; Zhang, L. Analyzing and predicting the urbanization and ecological resilience coupling and coordination of Guangdong Province. Humanit. Soc. Sci. Commun. 2024, 11, 1322. [Google Scholar] [CrossRef]
  49. Feng, X.; Zeng, F.; Loo, B.P.Y.; Zhong, Y. The evolution of urban ecological resilience: An evaluation framework based on vulnerability, sensitivity and self-organization. Sustain. Cities Soc. 2024, 116, 105933. [Google Scholar] [CrossRef]
  50. Zhou, M.; He, Q.; Gu, Y.; Wang, K.; Shen, Z. Urban Flood Resilience Assessment of Prefecture-Level Cities in Yangtze River Delta. ISPRS Int. J. Geo-Inf. 2025, 14, 108. [Google Scholar] [CrossRef]
  51. Yang, L.; Xu, Y.; Zhu, J.Q.; Sun, K.Y. Spatiotemporal Evolution and Influencing Factors of the Coupling Coordination of Urban Ecological Resilience and New Quality Productivity at the Provincial Scale in China. Land 2024, 13, 1998. [Google Scholar] [CrossRef]
  52. Wei, C.; Wu, Z.; Li, R.; Xing, J.; Zhang, M. Urbanization quality measurement and its coordinated development in counties of Hubei province. Econ. Geogr. 2023, 43, 95–105. [Google Scholar] [CrossRef]
  53. Yin, S.; Zhou, Y.; Zhang, C.; Wu, N. Impact of regional integration policy on urban ecological resilience: A case study of the Yangtze River Delta region, China. J. Clean. Prod. 2024, 485, 144375. [Google Scholar] [CrossRef]
  54. LÜ, L.; Kan, D. Interactive coupling and driving factors of new urbanization and water ecological resilience based on a study in Central China. Chin. J. Agric. Resour. Reg. Plan. 2025, 46, 103–116. [Google Scholar]
  55. He, Z.; Wu, Z.; Wang, Z.; He, R.; Ji, L.; Ma, C.; Deng, X. Path to peak emissions and smart urbanization. Urban Plan. Forum 2021, 6, 37–44. [Google Scholar] [CrossRef]
  56. Hou, L.; Cui, M. A new insight to investigate the developmental resilience of Chengdu-Chongqing twin-city economic circle based on ecological niche theory. J. Asian Archit. Build. Eng. 2024, 1–13. [Google Scholar] [CrossRef]
  57. Meerow, S.; Newell, J.P.; Stults, M. Defining urban resilience: A review. Landsc. Urban Plan. 2016, 147, 38–49. [Google Scholar] [CrossRef]
  58. Zhang, Z.X.; Bai, Y. Spatiotemporal Evolutionary Features and Disorder Factor Diagnosis of Urban Resilience. J. Urban Plan. Dev. 2024, 150, 05024031. [Google Scholar] [CrossRef]
  59. Yi, R.; Chen, Y.N.; Chen, A. Evaluating urban climate resilience in the Yangtze River Delta urban agglomeration: A novel method integrating the DPSIR model and Sustainable Development Goals. J. Environ. Manag. 2025, 376, 124517. [Google Scholar] [CrossRef]
  60. Wang, K.; Zhang, B.; Jiang, S.; Ding, R. Urban Ecological Economic Resilience in China: Spatio-Temporal Evolution, Influencing Factors, and Trend Prediction. Systems 2024, 12, 525. [Google Scholar] [CrossRef]
  61. Wang, K.; Ding, R.; Xiao, W.; Liang, J.; Peng, L.; Jiang, S. Ecological economic resilience in China: Systematic performances, structural characteristics and evolutionary predictions. Environ. Dev. Sustain. 2025. [Google Scholar] [CrossRef]
  62. Chen, J.; Ma, H.; Yang, S.; Zhou, Z.; Huang, J.; Chen, L. Assessment of Urban Resilience and Detection of Impact Factors Based on Spatial Autocorrelation Analysis and GeoDetector Model: A Case of Hunan Province. ISPRS Int. J. Geo-Inf. 2023, 12, 391. [Google Scholar] [CrossRef]
  63. Xiao, W.; Chen, W.; Deng, X. Coupling and coordination of coal mining intensity and social-ecological resilience in China. Ecol. Indic. 2021, 131, 108167. [Google Scholar] [CrossRef]
  64. Chen, X.; Liu, X. Geographical Detection Analysis and Spatiotemporal Disparity Characteristics of the Coupling Coordination Development between Urbanization and the Eco-Environment. Sustainability 2023, 15, 3931. [Google Scholar] [CrossRef]
  65. Zhao, W.; Luo, J. Spatial-temporal pattern evolution of the coupling and coordination of urbanization and ecological resilience in the Three Gorges Reservoir Area. Resour. Environ. Yangtze Basin 2024, 33, 1888–1904. [Google Scholar]
  66. Zhang, N.; Wang, Y. Coupling coordination and driving factors of new urbanization and water environment in Yangtze River Economic Belt. Resour. Environ. Yangtze Basin 2024, 33, 572–583. [Google Scholar]
  67. Qu, S.; Jiang, Y.; Gao, J.; Wang, L.; Chen, Q.; Zhang, Y.; Huang, F. Revealing the Coupling Coordination of Social–Ecological System Resilience: Insights From the Southwest Karst Rural Area, China. Land Degrad. Dev. 2024, 36, 1255–1268. [Google Scholar] [CrossRef]
  68. Ning, X.; Zhao, J.; An, Y. Urbanization and urban ecological resilience in resource-based cities: Coupling coordination and its key factors. Environ. Dev. Sustain. 2024. [Google Scholar] [CrossRef]
  69. Wu, C.; Ren, H. Coupled Coordination and the Spatial Connection Network Analysis of New Urbanization and Ecological Resilience in the Urban Agglomeration of Central Guizhou, China. Land 2024, 13, 1256. [Google Scholar] [CrossRef]
  70. Chang, Q.; Sha, Y.; Chen, Y. The Coupling Coordination and Influencing Factors of Urbanization and Ecological Resilience in the Yangtze River Delta Urban Agglomeration, China. Land 2024, 13, 111. [Google Scholar] [CrossRef]
  71. Liu, X.; Xi, Y. Quality evaluation and regional difference analysis of new urbanization in the core area of Huaihai economic zone. Hubei Agric. Sci. 2023, 62, 227–232. [Google Scholar] [CrossRef]
  72. Zheng, Z.; Zhu, Y.; Qiu, F.; Wang, L. Coupling Relationship Among Technological Innovation, Industrial Transformation and Environmental Efficiency: A Case Study of the Huaihai Economic Zone, China. Chin. Geogr. Sci. 2022, 32, 686–706. [Google Scholar] [CrossRef]
  73. Zhou, B.; Ou, X.; Li, Z.; Qian, J. Coupling and Coordination Analysis of High-quality Development System in Huaihai Economic Zone. Resour. Dev. Mark. 2020, 36, 1239–1245. [Google Scholar]
  74. Teng, G.; Chen, L.; Zhang, T.; Li, L.; Xiao, J.; Ma, L. The Spatiotemporal Evolution of Land Use Ecological Efficiency in the Huaihai Economic Zone: Insights from a Multi-Dimensional Framework and Geospatial Modeling. Land 2025, 14, 883. [Google Scholar] [CrossRef]
  75. Yao, X.; Chen, Y.; Zheng, X.; Li, H.; Chen, Y.; Kong, L.; Ou, C. Spatiotemporal characteristics and influential factors of coupling coordination degree of urbanization and ecological environment in the Huaihe River ecological economic belt. Sci. Rep. 2025, 15, 12287. [Google Scholar] [CrossRef]
  76. Zhang, G.; Zhu, Y.; He, G.; Tu, Q. Coupling Evolution and Spatial-Temporal Variation of Industrial Development and Ecological Efficiency under Undesirable Output Constraint. Pol. J. Environ. Stud. 2022, 31, 3415–3428. [Google Scholar] [CrossRef]
  77. Yu, T.; Jia, S.; Zhang, Y.; Cui, X. How can urban expansion and ecological preservation be balanced? A simulation of the spatial dynamics of production-living-ecological spaces in the Huaihe River Eco-Economic Belt. Ecol. Indic. 2025, 171, 113192. [Google Scholar] [CrossRef]
  78. Song, M.; Xie, Q. Evaluation of Urban Competitiveness of the Huaihe River Eco-Economic Belt Based on Dynamic Factor Analysis. Comput. Econ. 2019, 58, 615–639. [Google Scholar] [CrossRef]
  79. Zhao, Y.; He, G.; Bao, K.; Zhu, Y.; Yang, J.; Ruan, J.; Wang, Y. Assessment of spatial–temporal differences of industrial eco-efficiency in the huaihe river economic belt. GeoJournal 2022, 88, 1703–1720. [Google Scholar] [CrossRef]
  80. Liu, J.; Wang, H.; Hui, L.; Tang, B.; Zhang, L.; Jiao, L. Identifying the Coupling Coordination Relationship between Urbanization and Ecosystem Services Supply–Demand and Its Driving Forces: Case Study in Shaanxi Province, China. Remote Sens. 2024, 16, 2383. [Google Scholar] [CrossRef]
  81. He, J.; Wang, M.; Wang, D.; Zhe, C. Coupling coordinated development of urban resilience and scientific and technological innovation in the Grand Canal Area. Areal Res. Dev. 2024, 43, 53–60. [Google Scholar]
  82. Zhou, X.; Wang, H.; Duan, Z.; Zhou, G. Exploring the impacts of urbanization on ecological resilience from a spatiotemporal heterogeneity perspective: Evidence from 254 cities in China. Environ. Dev. Sustain. 2024. [Google Scholar] [CrossRef]
  83. Wu, P.; Duan, Q.X.; Zhou, L.G.; Wu, Q.; Deveci, M. Spatial-temporal evaluation of urban resilience in the Yangtze River Delta from the perspective of the coupling coordination degree. Environ. Dev. Sustain. 2025, 27, 409–431. [Google Scholar] [CrossRef]
Figure 1. Research framework.
Ijgi 14 00271 g001
Figure 2. Study area.
Ijgi 14 00271 g002
Figure 3. Temporal trends of the development indices of new urbanization and urban resilience.
Ijgi 14 00271 g003
Figure 4. New urbanization index of cities in the HEZ.
Ijgi 14 00271 g004
Figure 5. Urban resilience index of cities in the HEZ.
Ijgi 14 00271 g005
Figure 6. Spatial characteristics of new urbanization in the HEZ.
Ijgi 14 00271 g006
Figure 7. Spatial characteristics of urban resilience in the HEZ.
Ijgi 14 00271 g007
Figure 8. Temporal Evolution of the CCD between new urbanization and urban resilience.
Ijgi 14 00271 g008
Figure 9. Spatial evolution of the CCD between new urbanization and urban resilience in the HEZ.
Ijgi 14 00271 g009
Table 1. Evaluation index system of new urbanization and urban resilience.
SystemEvaluation
Dimension
Indicator LayerIndicator
Direction
UnitWeight
New
Urbanization
system
Population
urbanization
Urbanization rate of permanent residents+%0.0532
Urban population density+People/km20.1690
The proportion of employees in secondary and tertiary industries+%0.0324
Economic
urbanization
Per capita GDP+Yuan0.0653
Proportion of secondary and tertiary industries’ combined output value in the GDP+%0.0470
Per capita consumption expenditure of urban residents+Yuan0.0480
Spatial
urbanization
Built-up area+km20.0899
Proportion of construction land area+%0.1419
Per capita urban road area+m2/person0.0601
Smart
urbanization
Year-end mobile phone subscribers+10,000 person0.0783
Number of internet broadband subscribers+10,000 person0.1192
Proportion of science and technology expenditure in fiscal expenditure+%0.0956
Urban
Resilience
system
Pressure
resilience
Industrial wastewater discharge10,000 tons0.0921
Industrial sulfur dioxide emissionsTon0.0616
Industrial solid waste generation10,000 tons0.1181
State
resilience
Per capita disposable income of urban residents+Yuan0.1144
The green coverage rate of built-up area+%0.0387
Harmless treatment volume of domestic waste+10,000 tons0.1854
The density of drainage pipes in built-up area+km/km20.0527
Response
resilience
Number of higher education students per 10,000 person+Person0.1520
Number of health technicians per 10,000 person+Person0.1205
Per capita park green space area+m2/person0.0646
Table 2. VIF values and grey relational grades between CCD and driving factors.
Driving FactorsVIFGrey Relational GradesOrder
GdpEconomic development level2.050.73481
UpdSpatial intensity level3.410.60306
RprInfrastructure construction2.250.69034
TecDigitalization capability2.050.62685
GscEcological governance capability1.740.54107
DpdMunicipal resilience level1.440.70313
PslPublic service capability1.720.72862
Disclaimer/Publisher’s Note: The statements, opinions and data contained in all publications are solely those of the individual author(s) and contributor(s) and not of MDPI and/or the editor(s). MDPI and/or the editor(s) disclaim responsibility for any injury to people or property resulting from any ideas, methods, instructions or products referred to in the content.

