
A Multi-Objective Optimization and Decision Support Framework for Natural Daylight and Building Areas in Community Elderly Care Facilities in Land-Scarce Cities

Abstract
1. Introduction
2. Literature Review
2.1. The Impact of Indoor Natural Lighting on the Elderly
2.2. Research on Building Performance Based on Multi-Objective Optimization
2.3. Decision Support Methods for Optimal Solutions
2.4. Research Innovation and Objectives
- (1)
- This study proposes an optimization framework for CECF in land-constrained urban environments. The framework integrates natural daylight performance simulation with a SOM neural network. It is applied to elderly residential communities in Beijing to verify its practicality and adaptability, providing a reference for future applications in similar urban contexts.
- (2)
- The study innovatively combines Spearman rank correlation analysis with interpretable machine learning models (Random Forest + SHAP) to overcome the limitations of traditional linear models. This approach effectively reveals the nonlinear coupling mechanisms between design parameters and daylighting performance. The SHAP values quantify the contribution of each parameter to overall performance, offering theoretical support for designing elderly care facilities in densely built urban environments.
- (3)
- The study introduces a SOM neural network to construct a topology-preserving mapping model, which projects high-dimensional optimization objectives onto a two-dimensional feature plane. This enables intuitive pattern recognition within the solution set and addresses the “curse of dimensionality” commonly encountered in MOO.
3. Research Methods
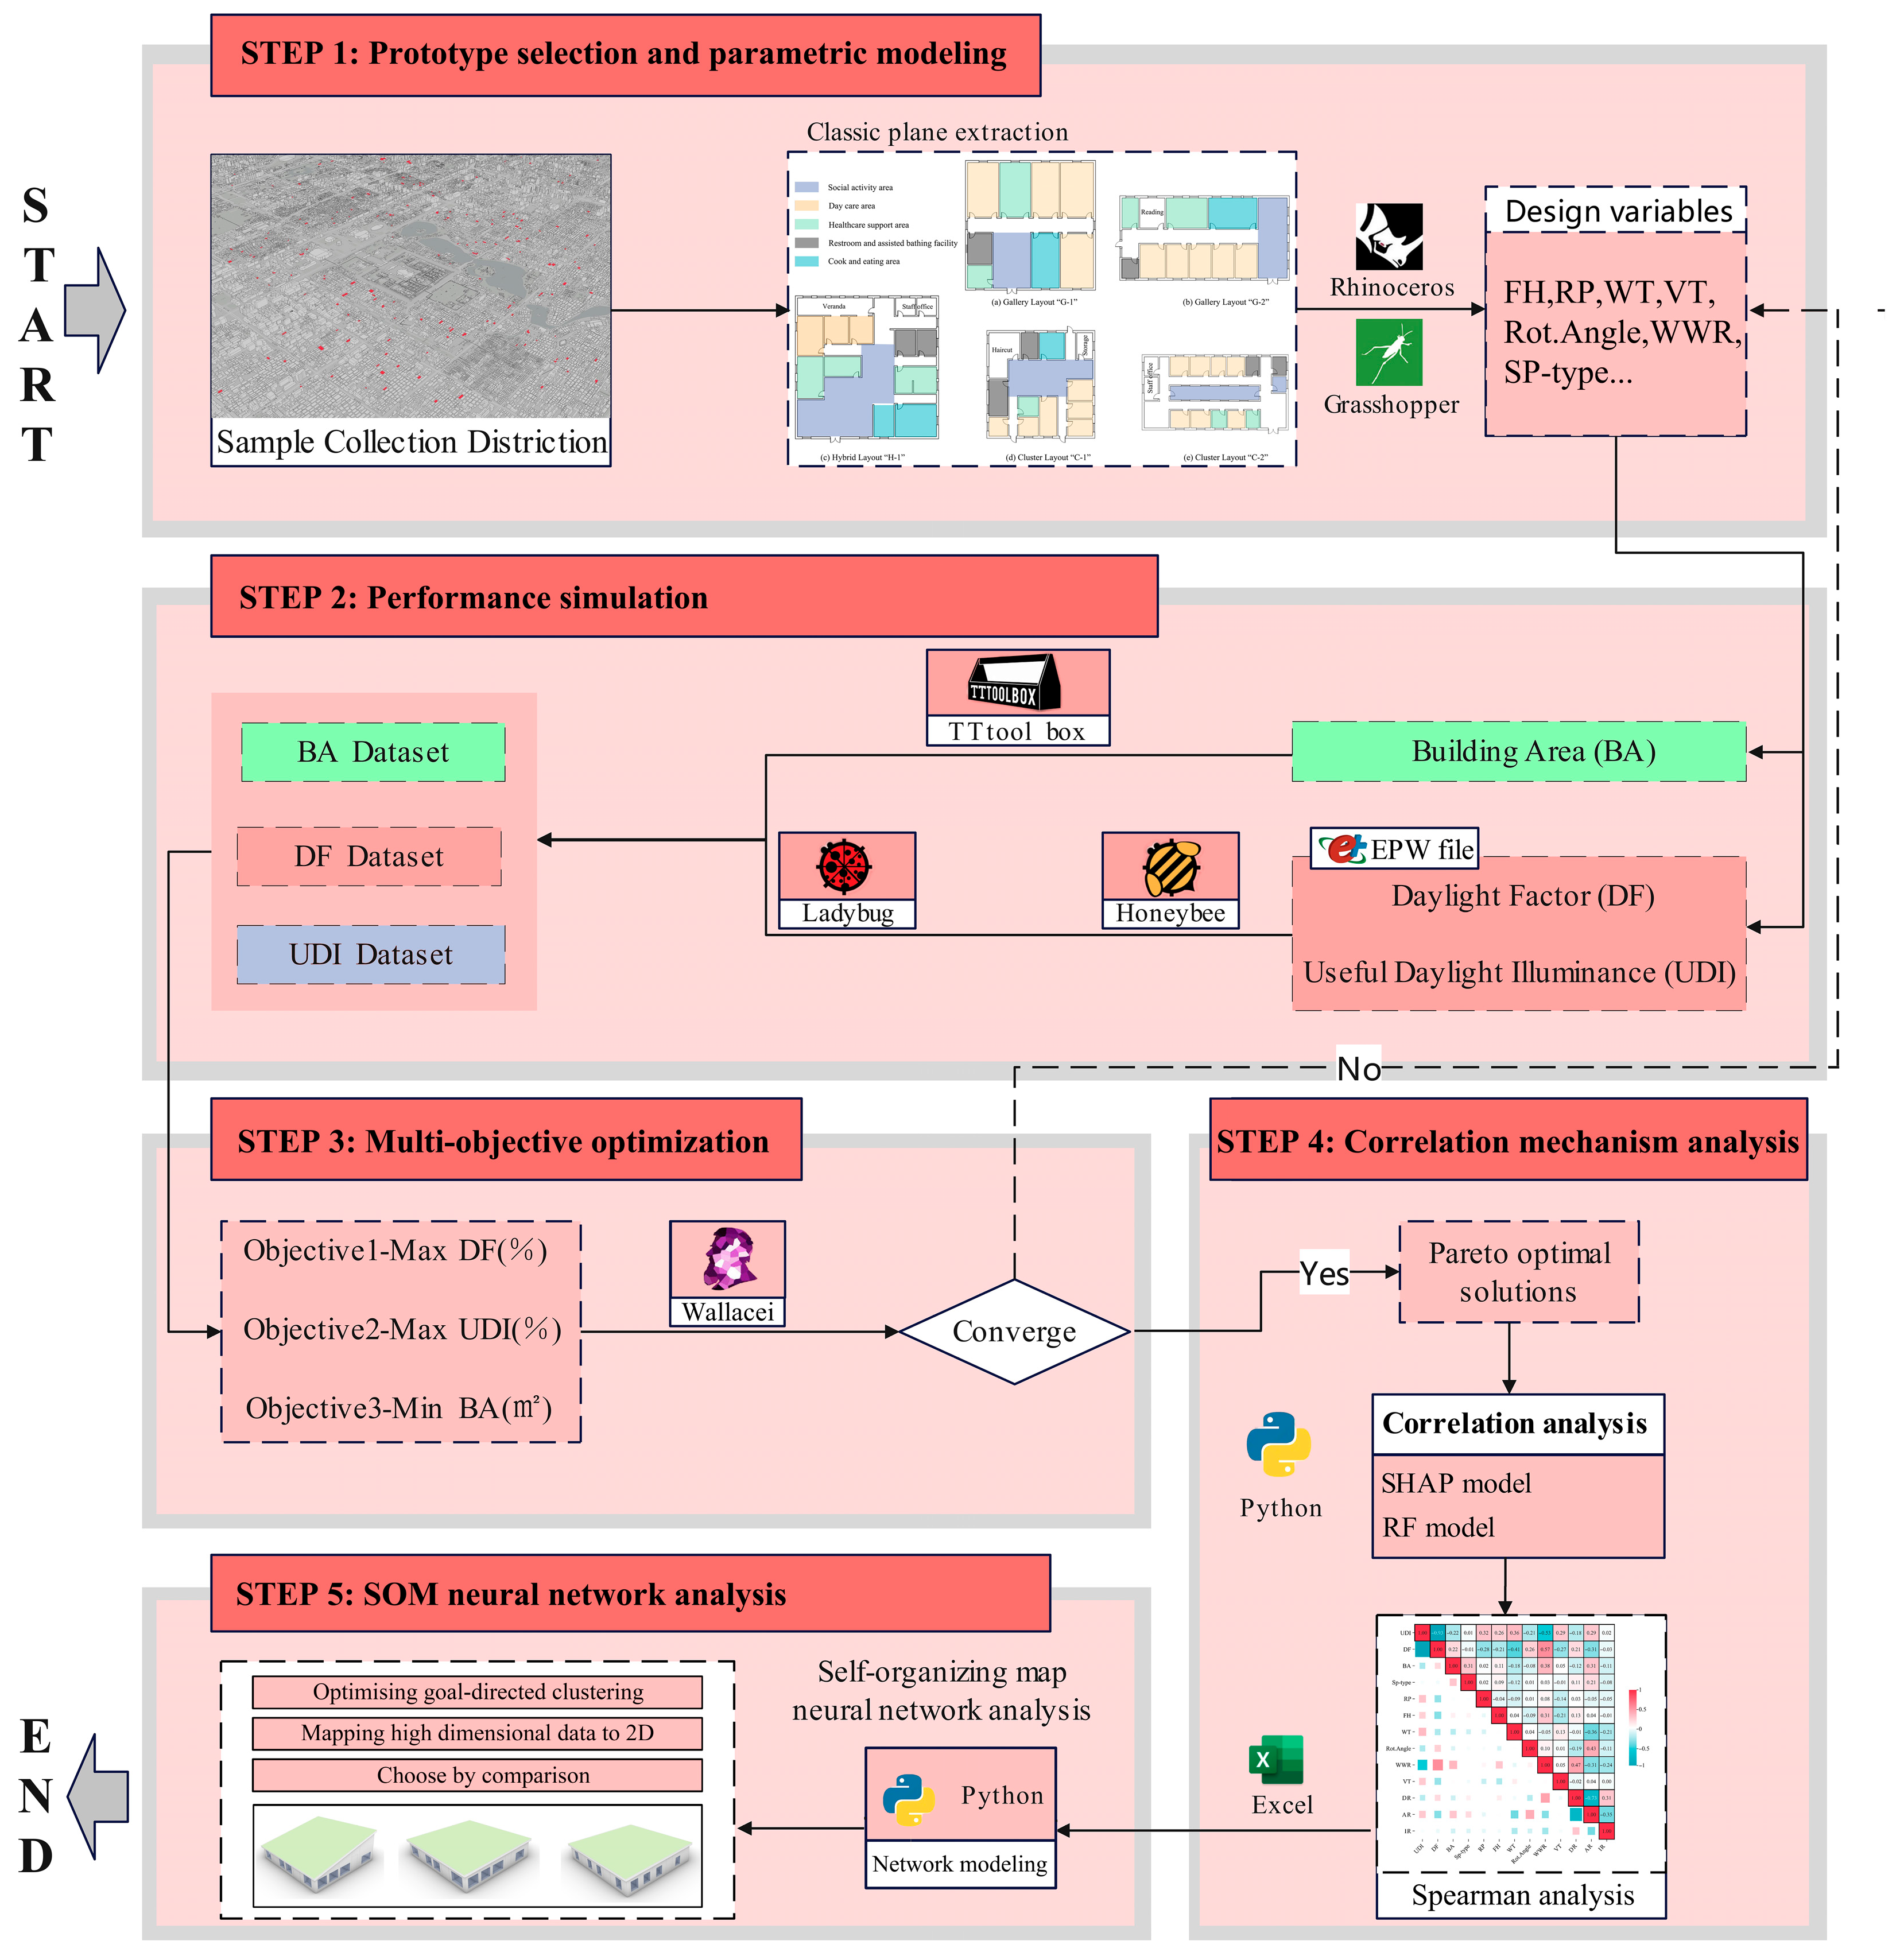
3.1. Research Framework
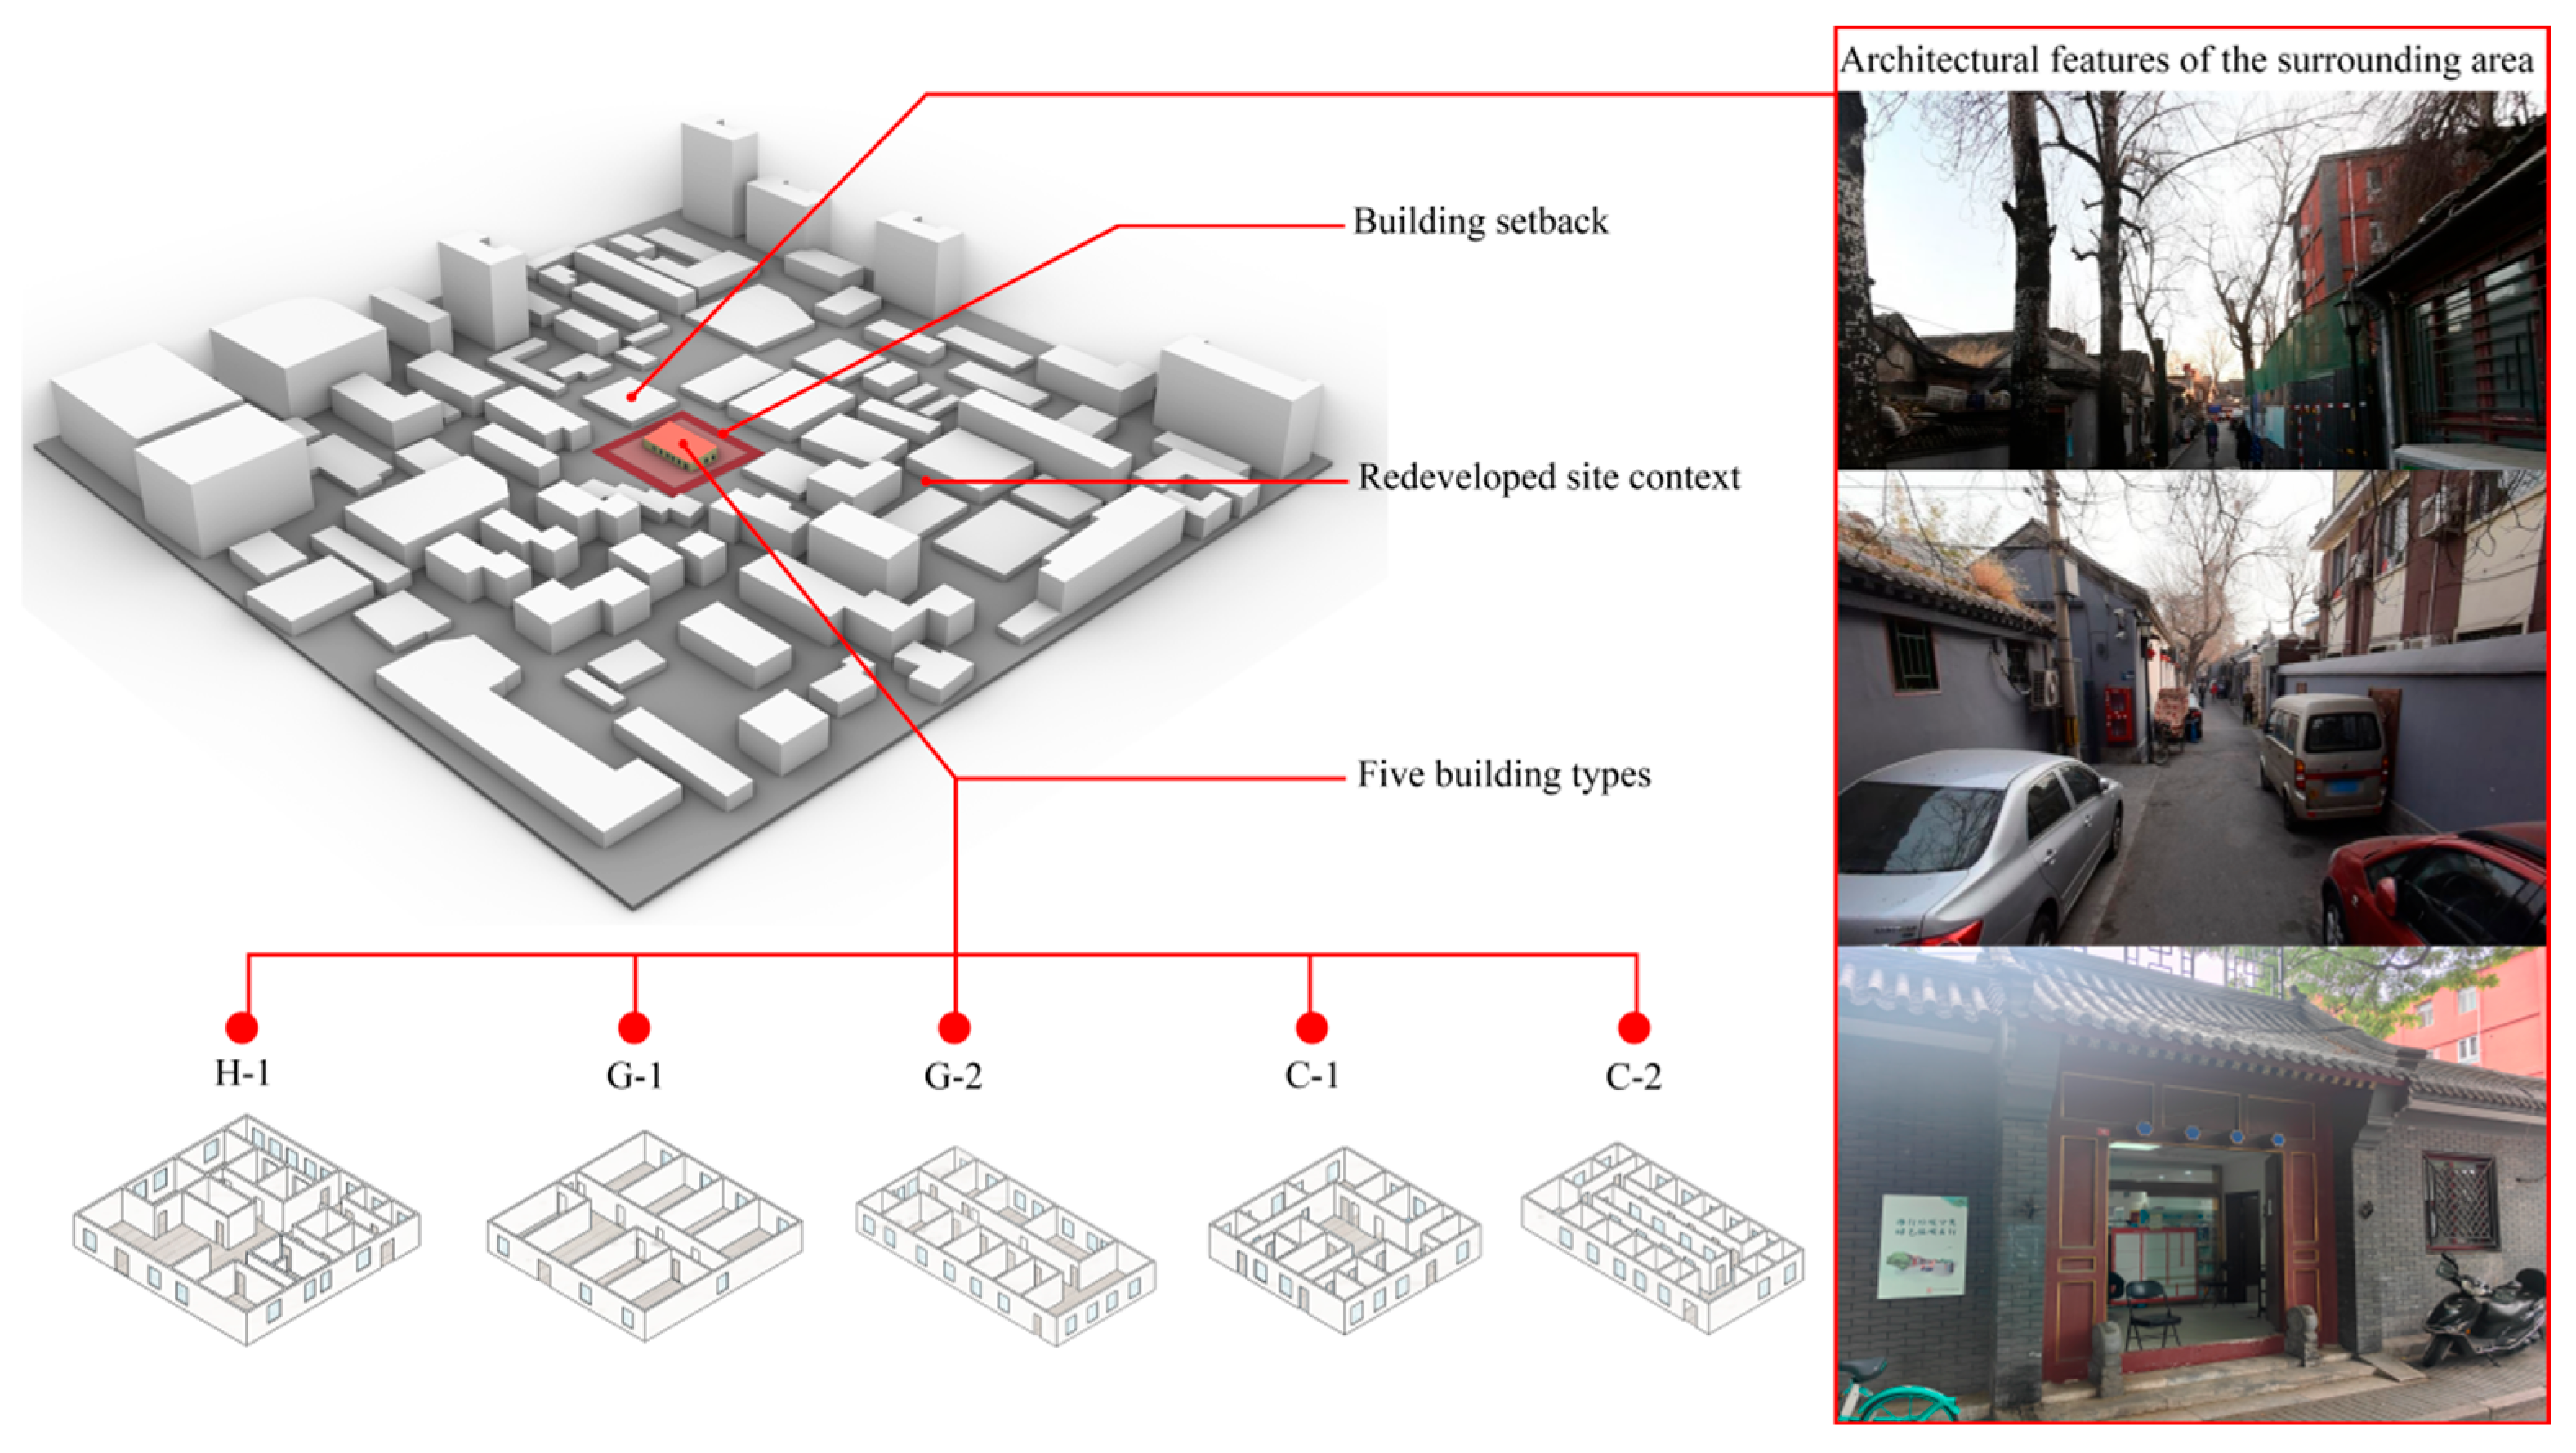
3.2. Study Area
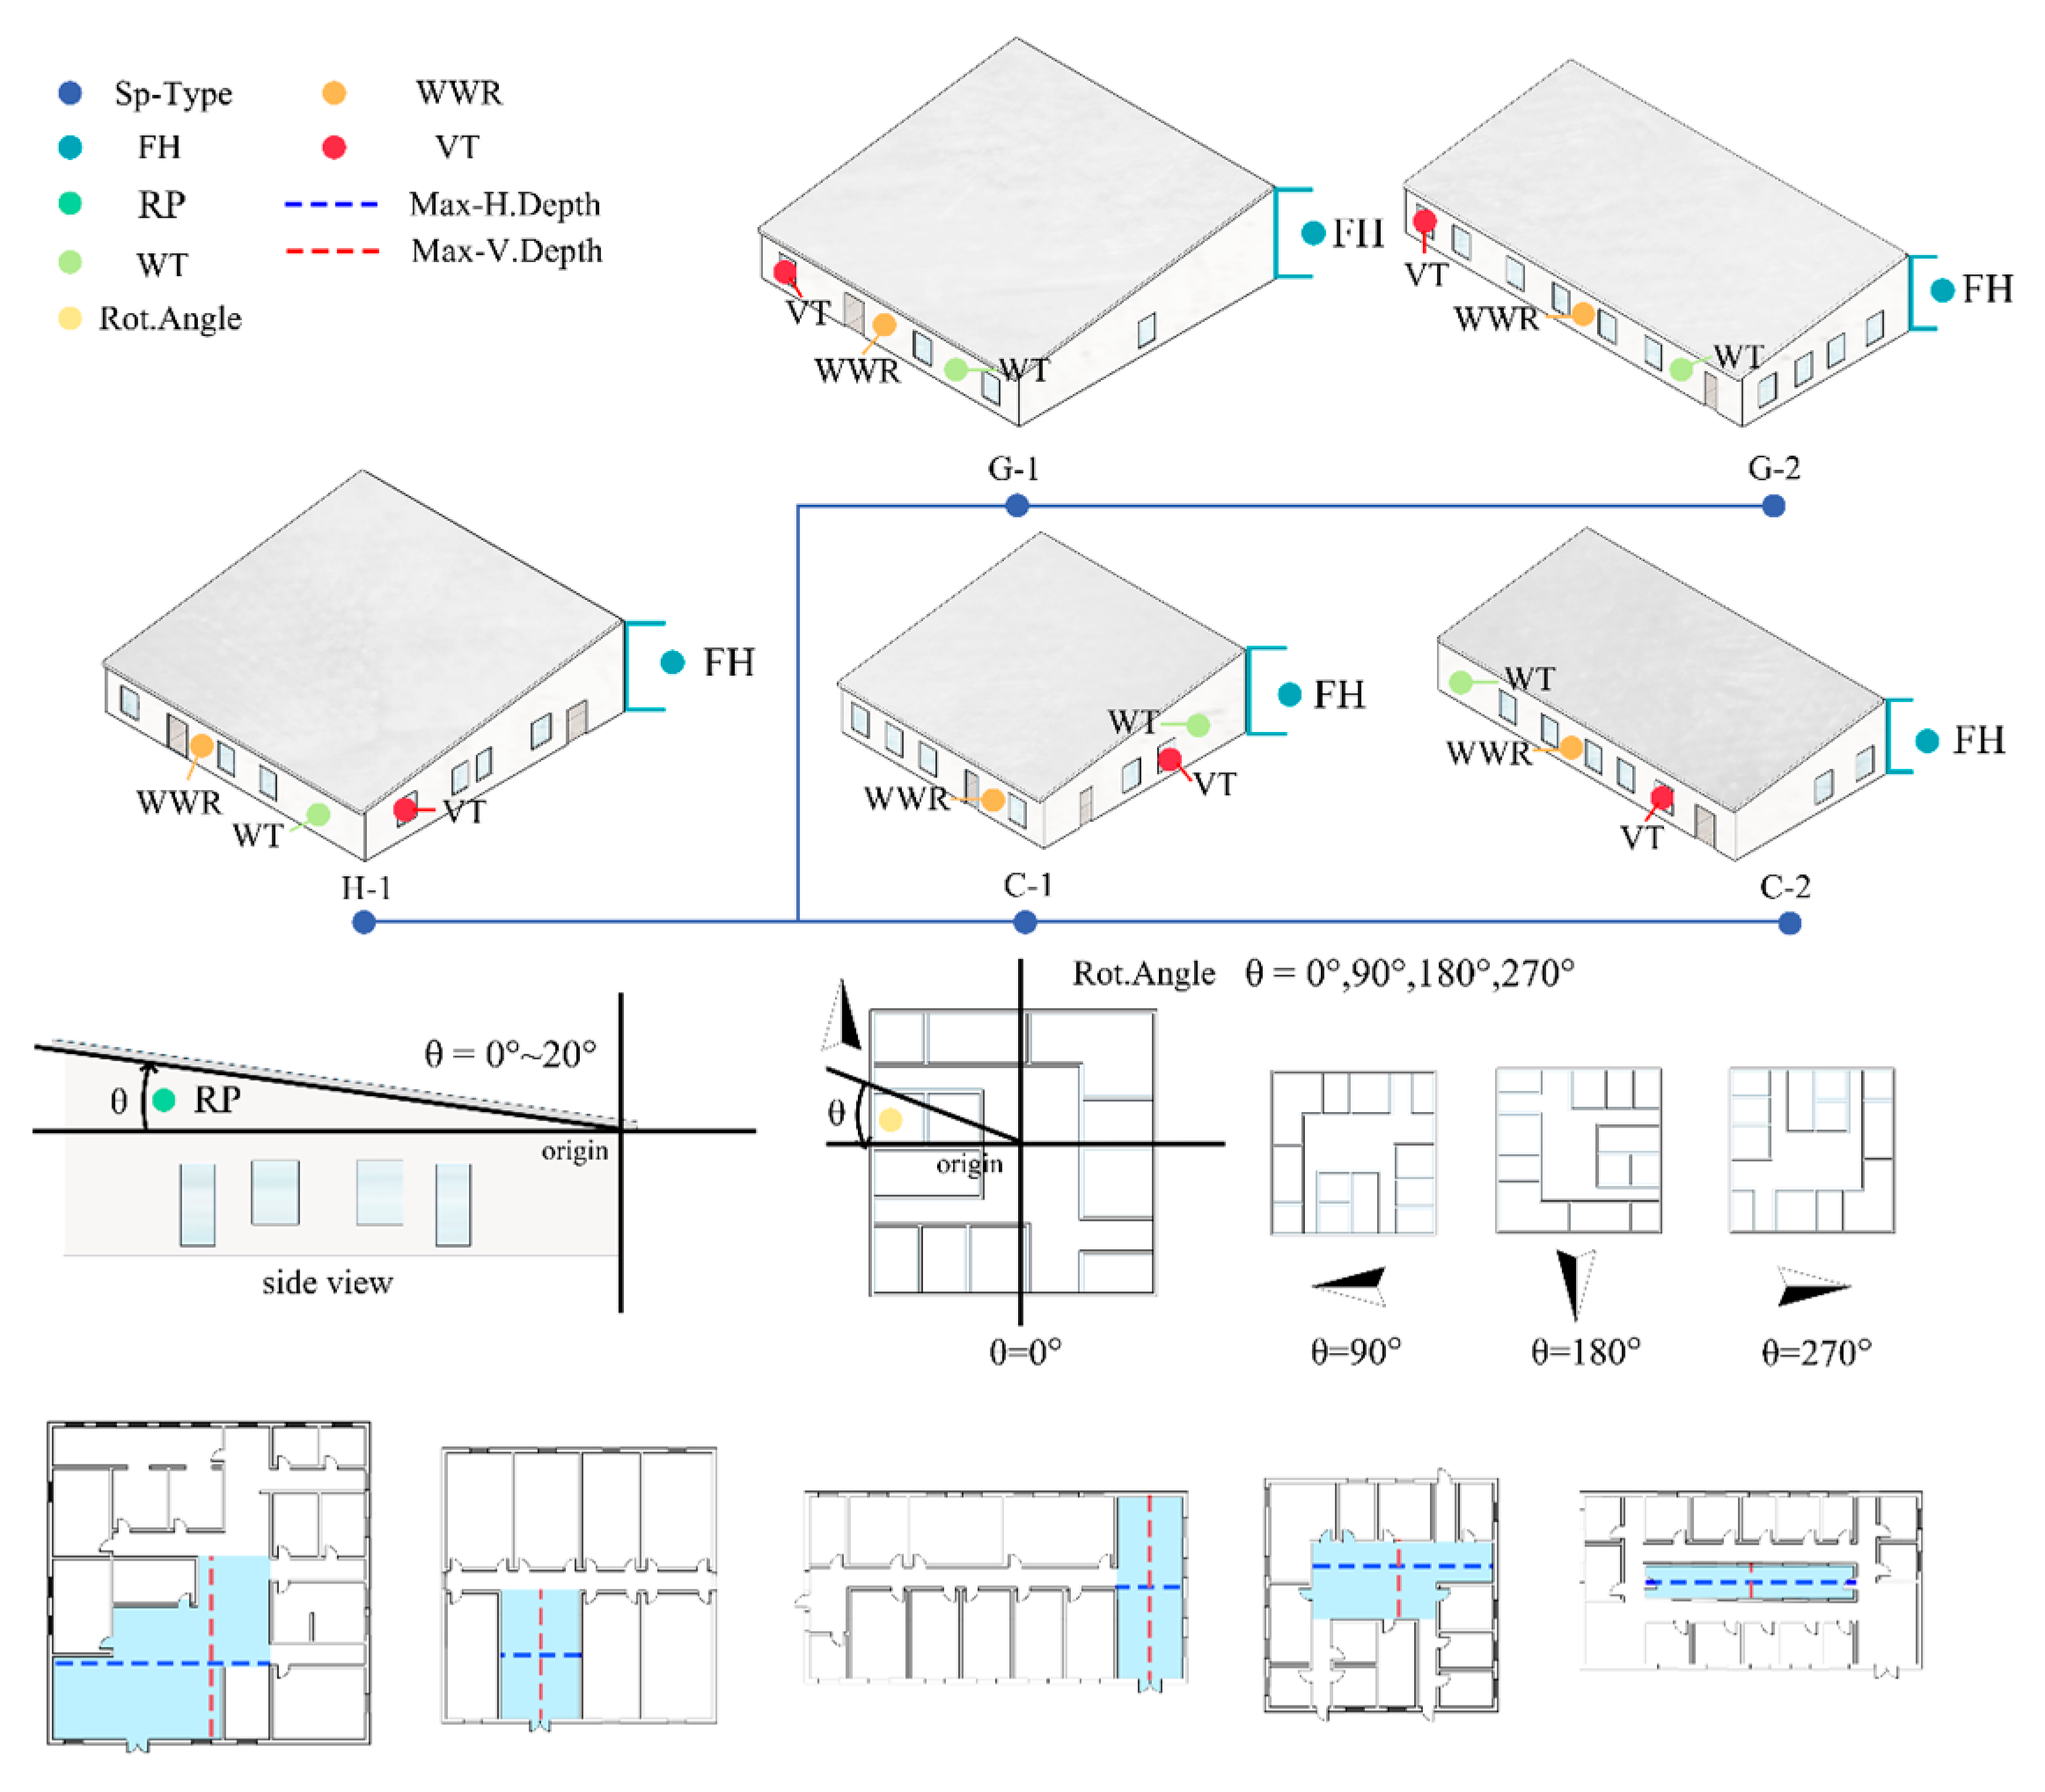
3.3. Typology Abstraction and Variable Setting
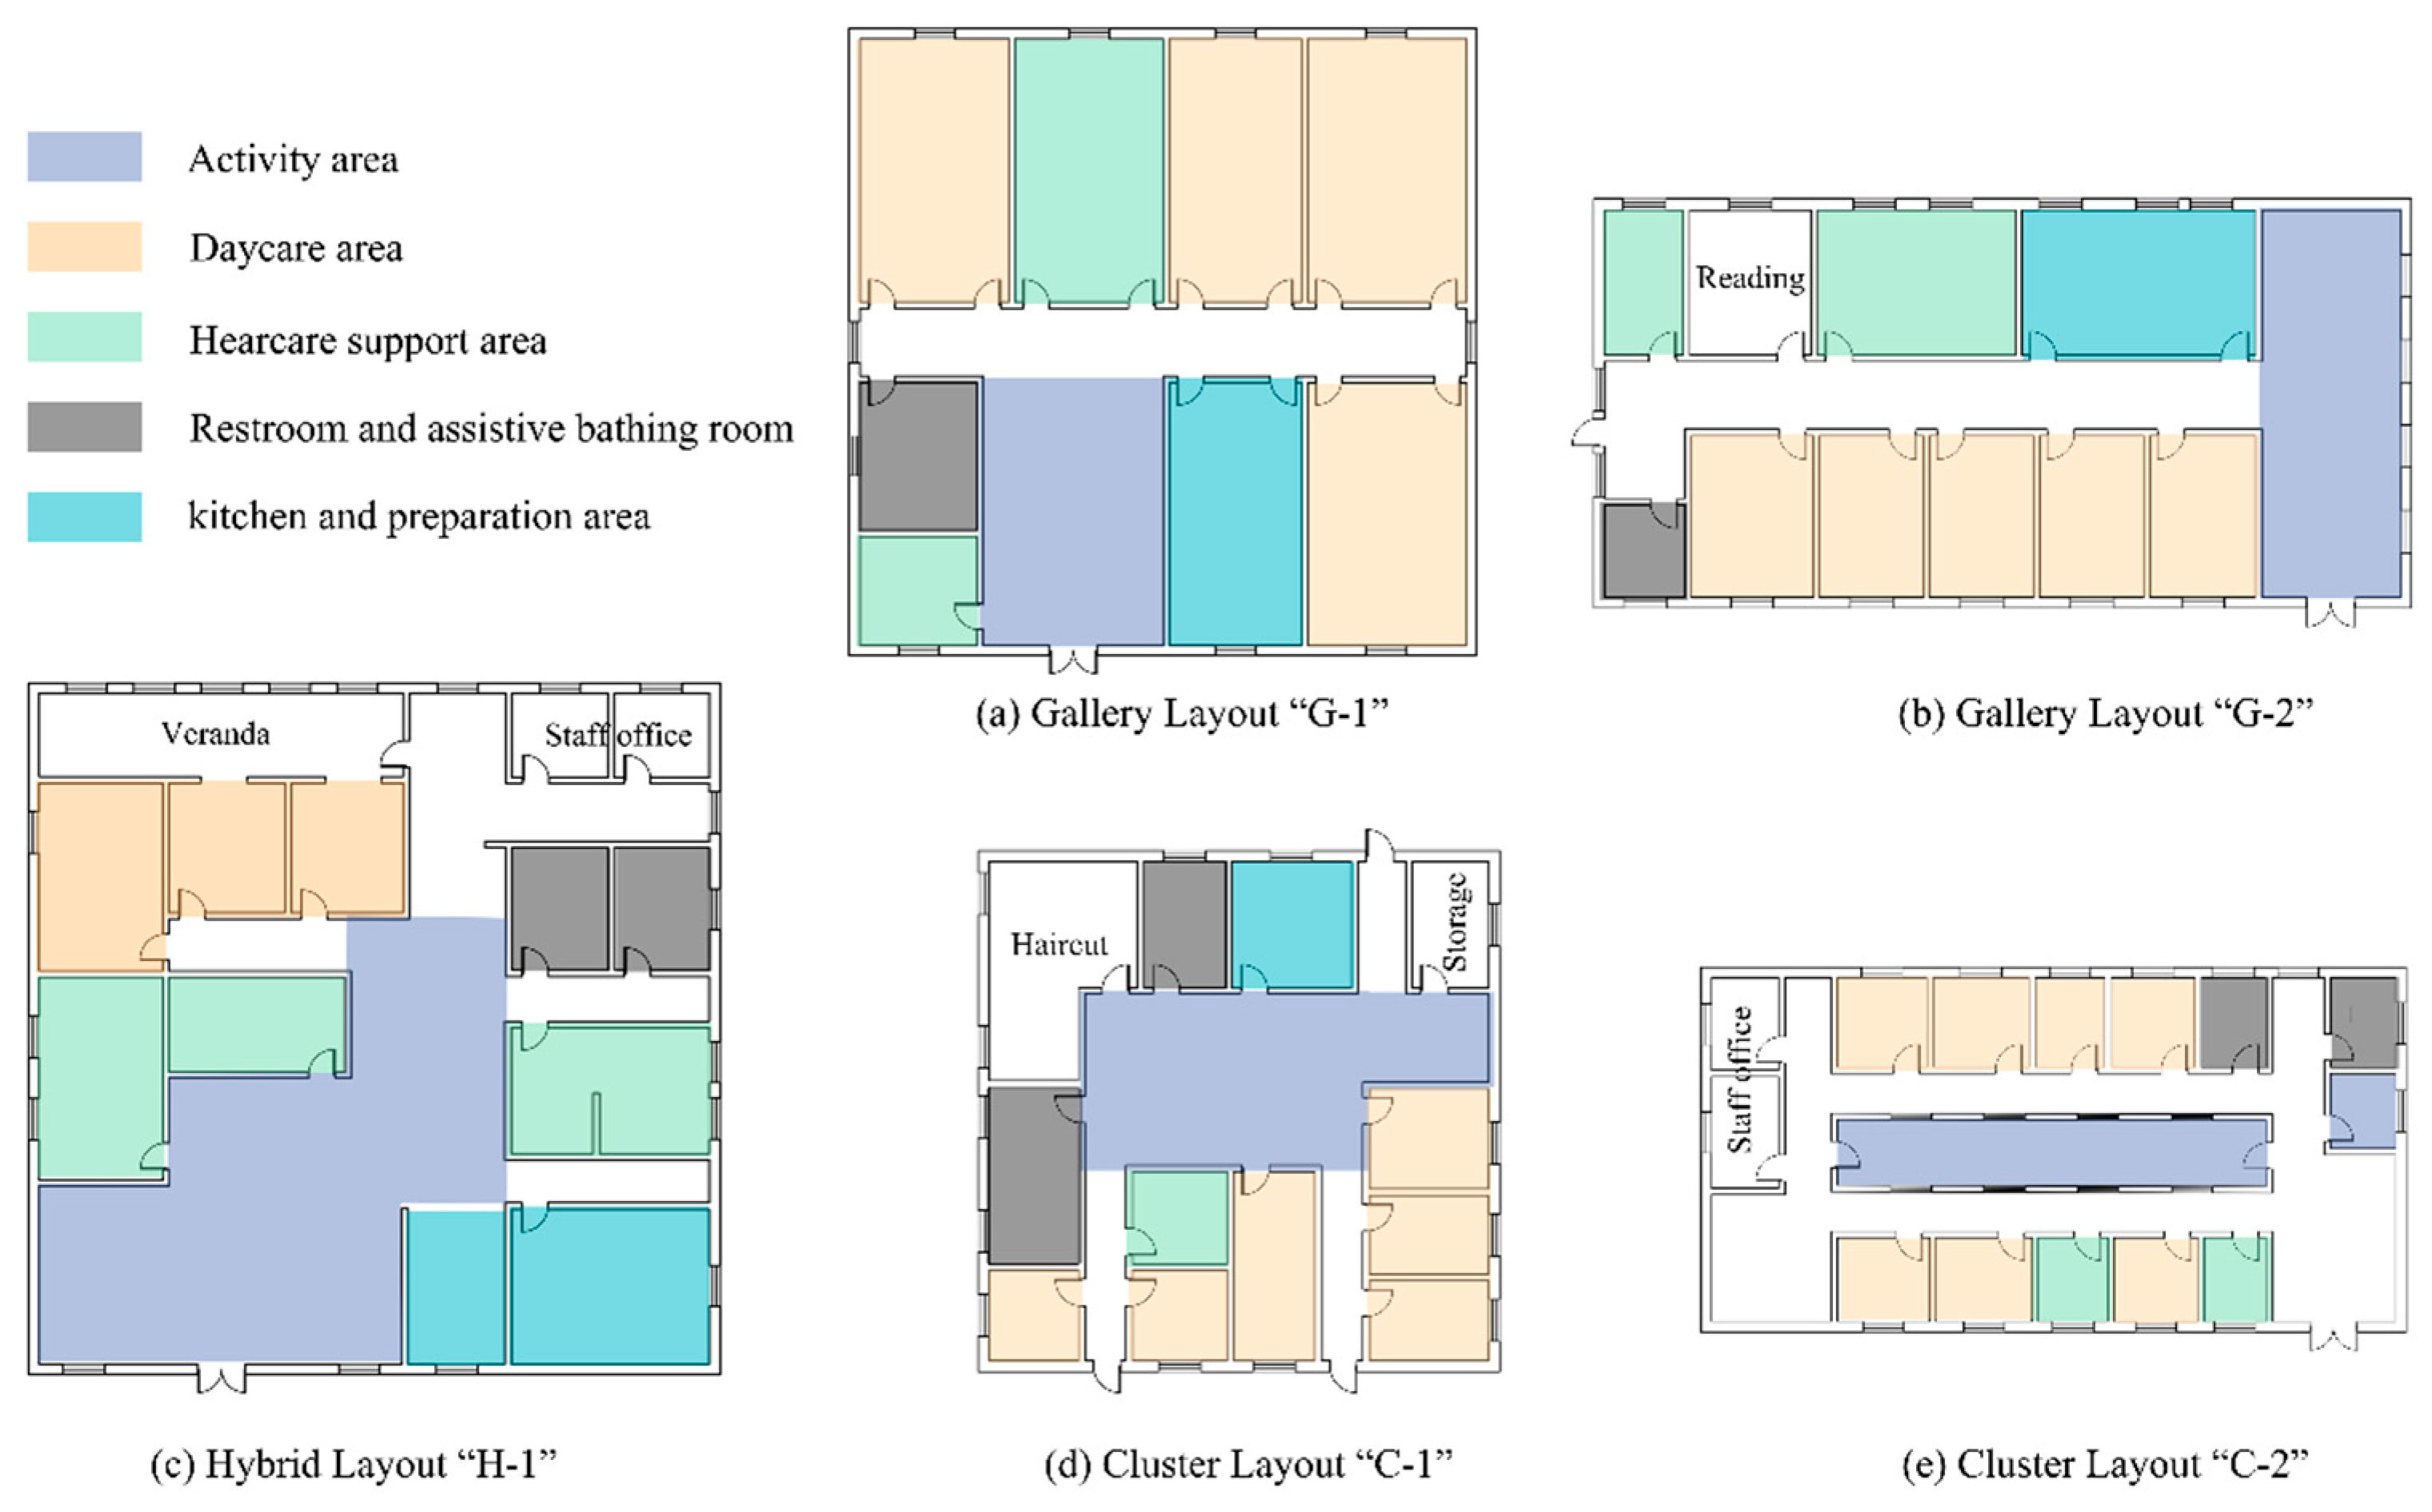
3.3.1. Sample Selection and Typology Abstraction
- (3)
- Point-type building—cluster layout (see Figure 3d);
- (4)
- Slab-type building—cluster layout (see Figure 3e).
- (5)
- Point-type building—hybrid layout (see Figure 3c). This is a combination of the above two layout features, possessing characteristics of both linear and centralized organization.
3.3.2. Constraint Conditions and Generation Mechanism Design
3.3.3. Definition of Core Functional Spaces
3.4. Simulation and Calculation of Optimization Objectives
3.4.1. Evaluation Indicators for Optimization Objectives
- 1.
- UDI
- 2.
- DF: Daylight Factor
- 3.
- BA: Building Area
3.4.2. Simulation Parameters and Calculation Steps
- 1.
- UDI and DF Simulation
- 2.
- BA Calculation
3.5. MOO
3.6. Ensemble Learning Method and Spearman Correlation Coefficient
3.7. SOM Neural Network
4. Research Results
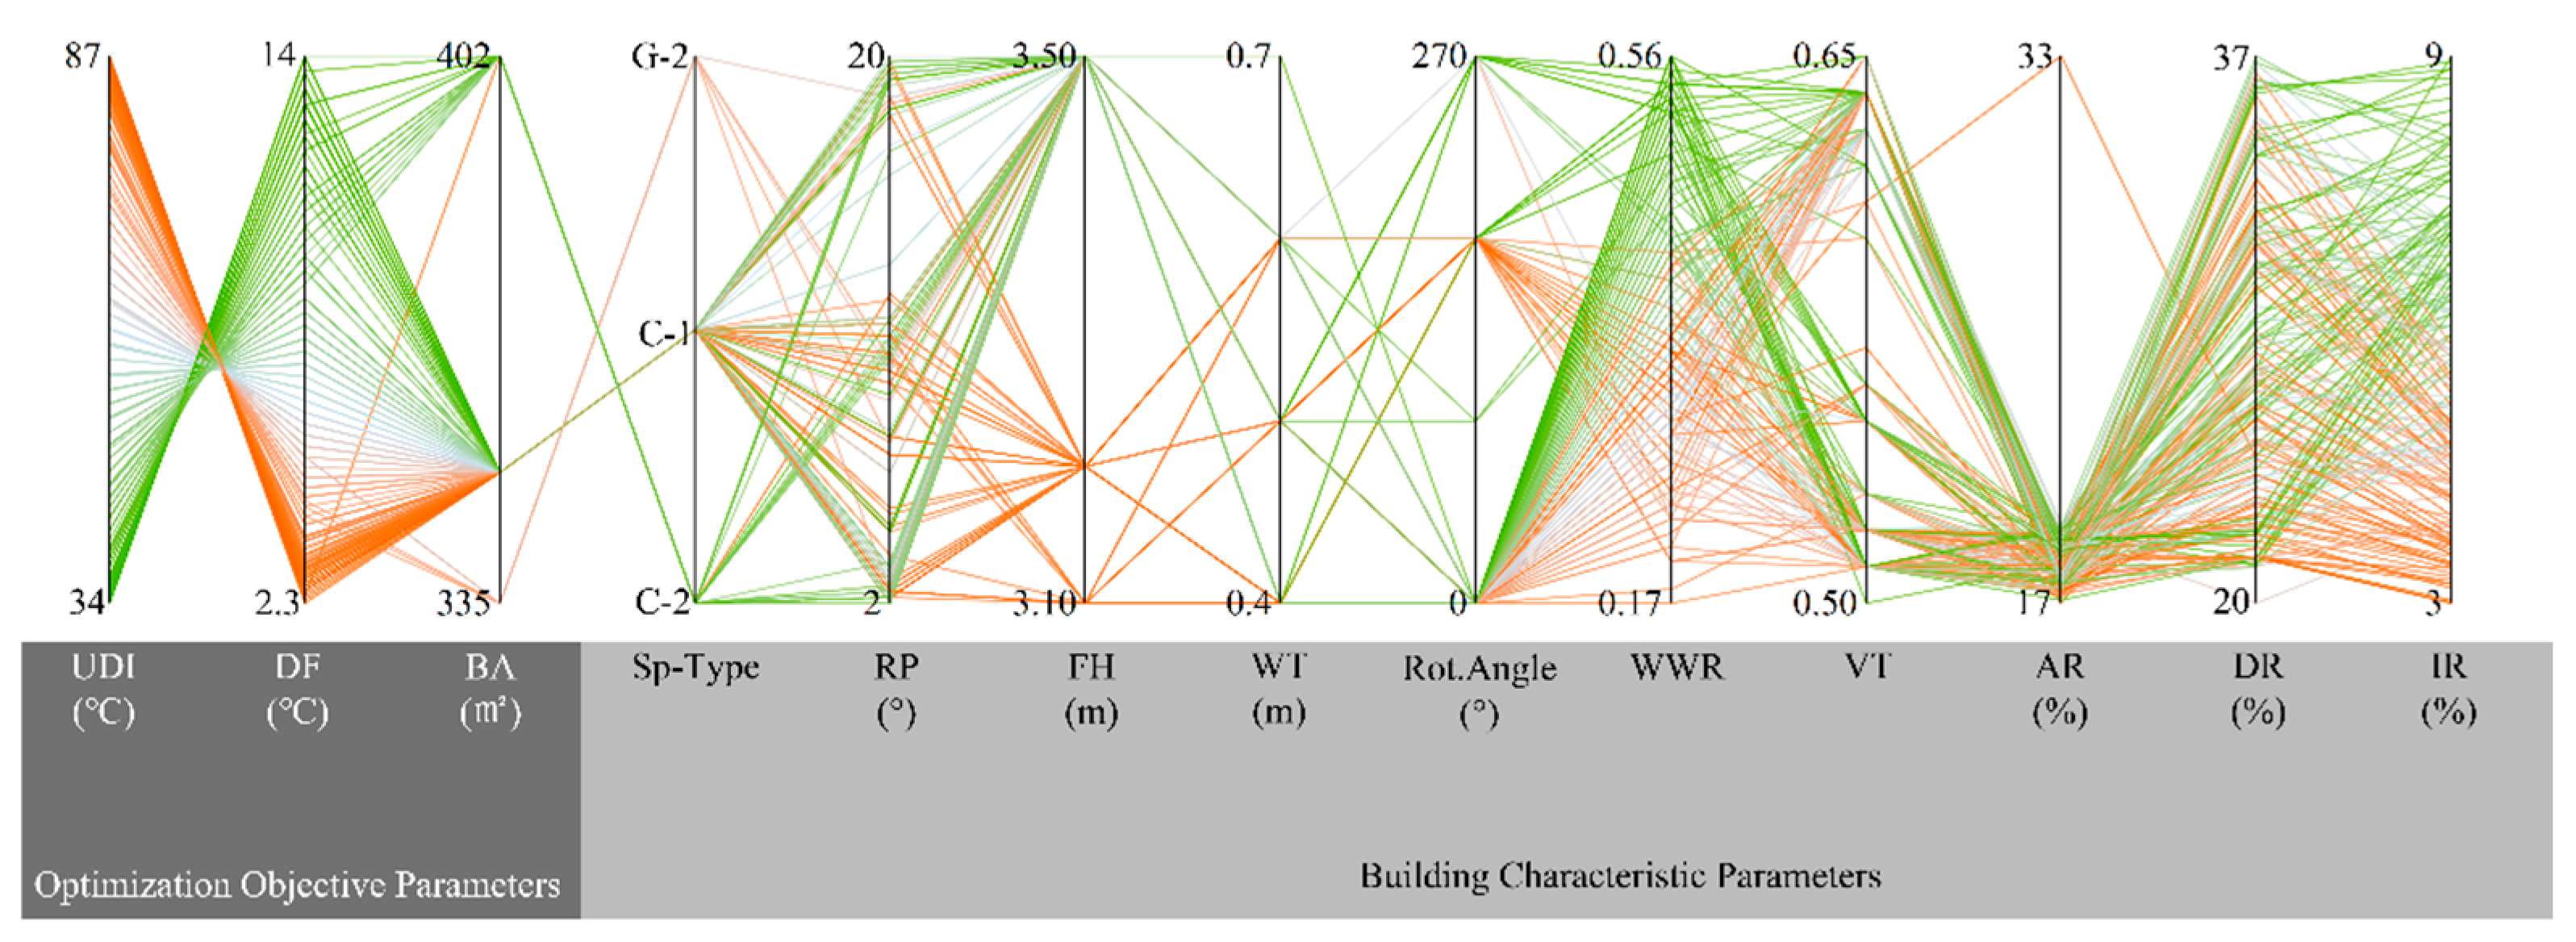
4.1. MOO Results
4.2. Spearman Correlation Analysis Results
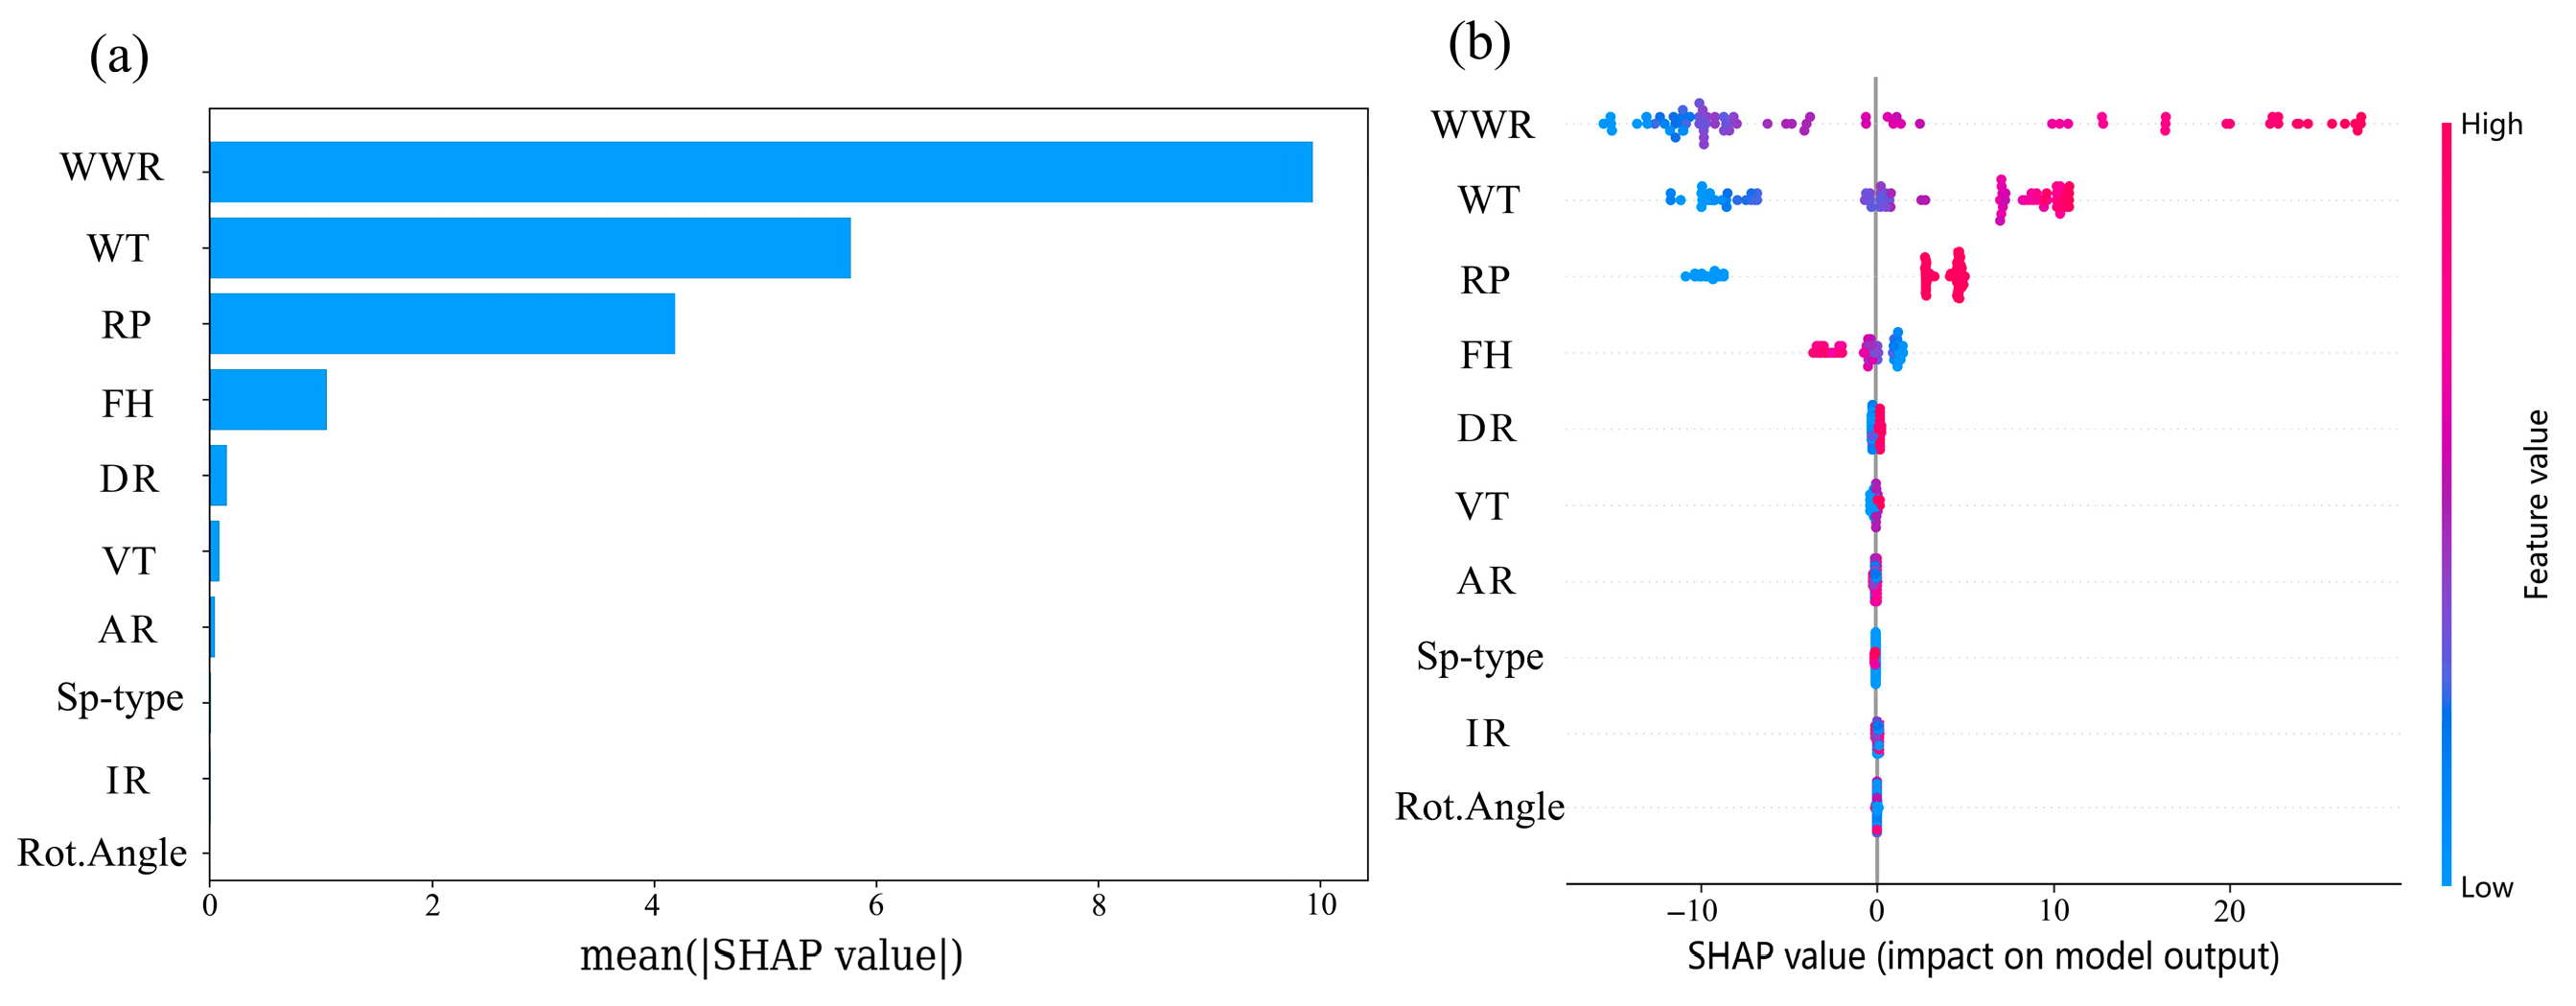
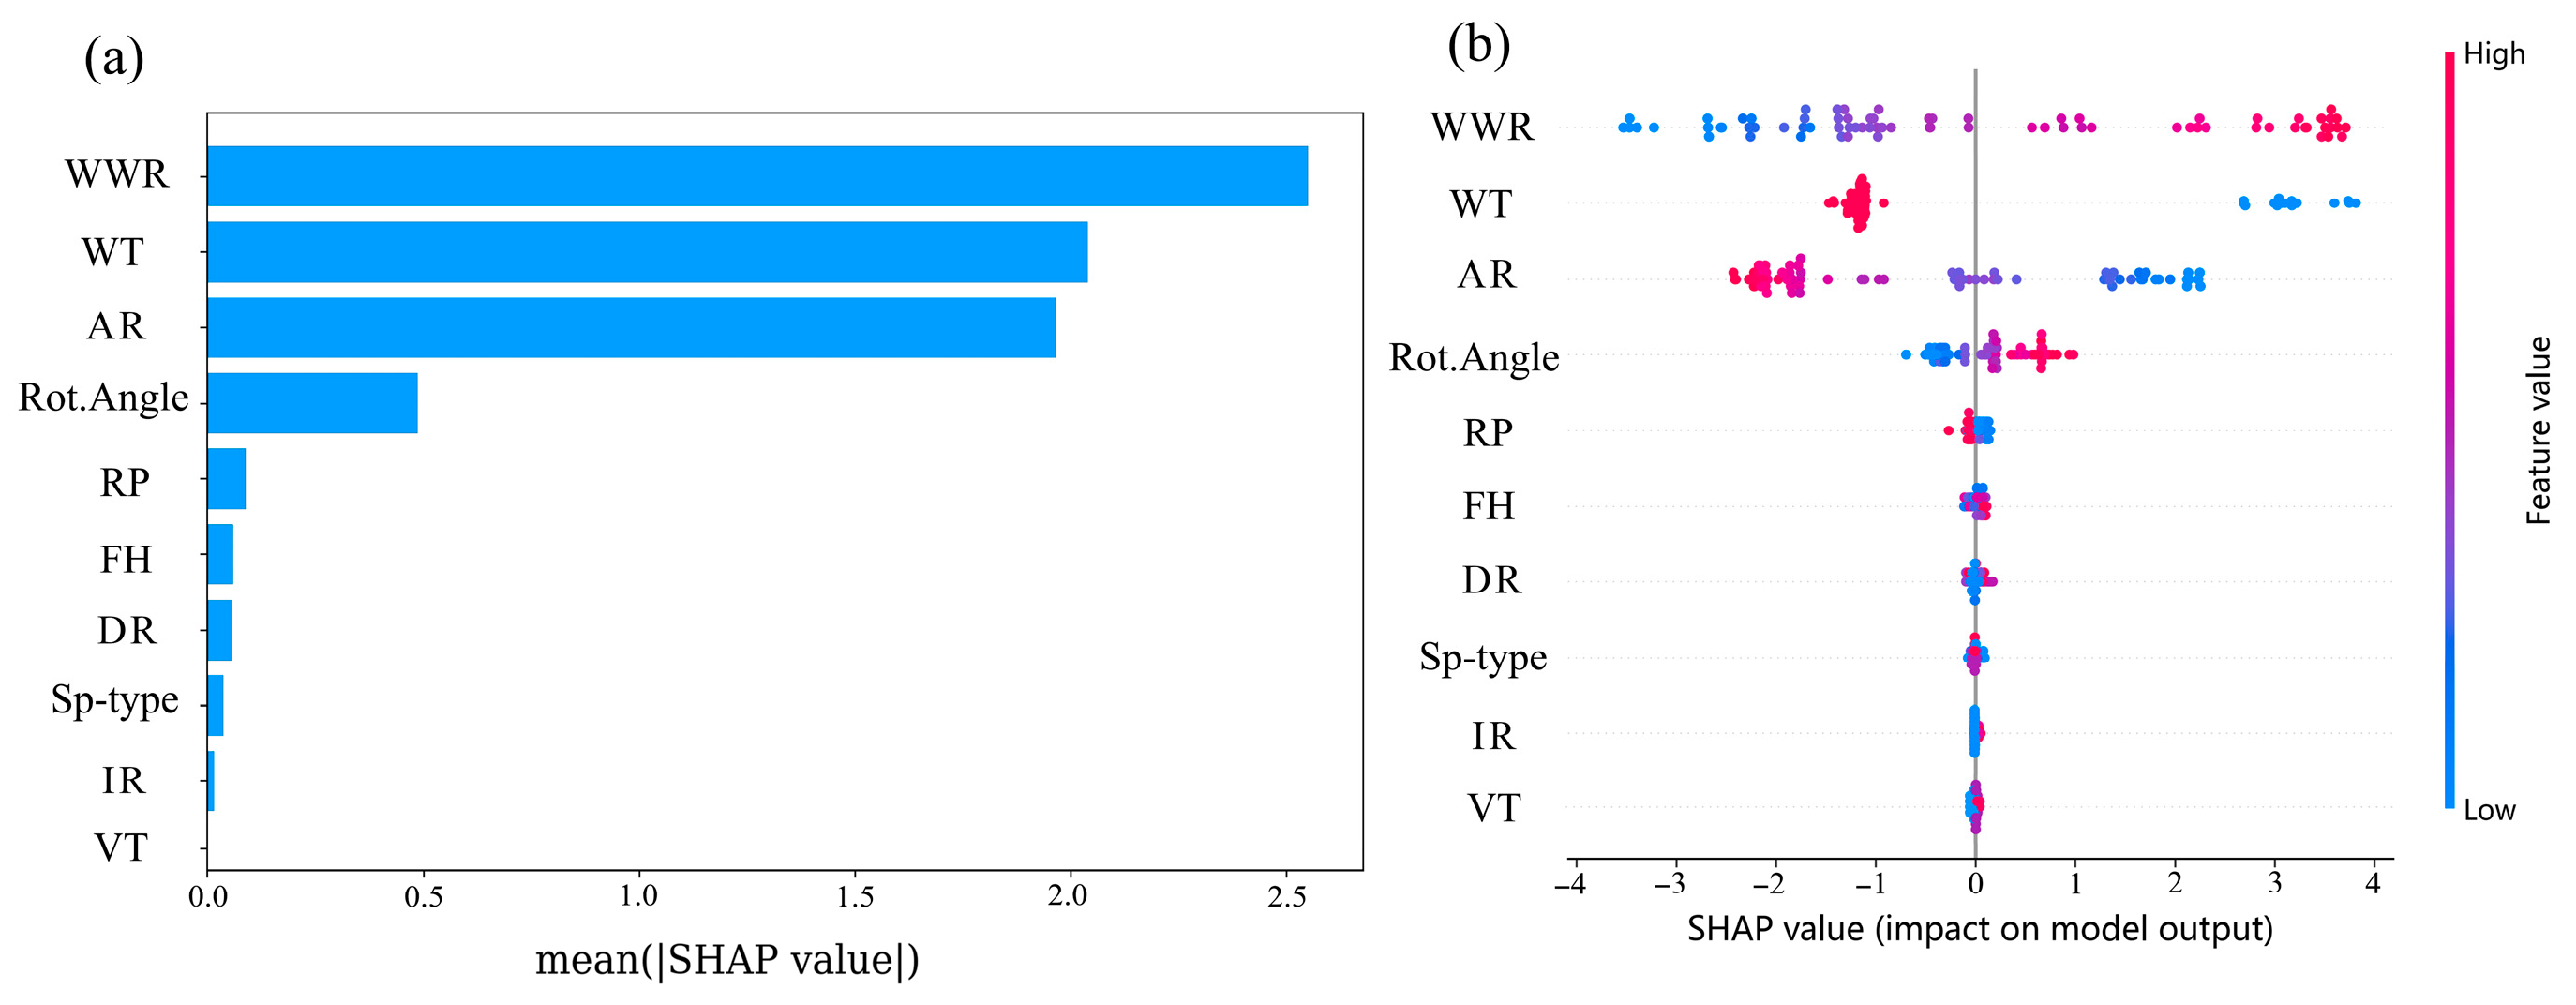
4.3. Ensemble Learning and SHAP Model Results
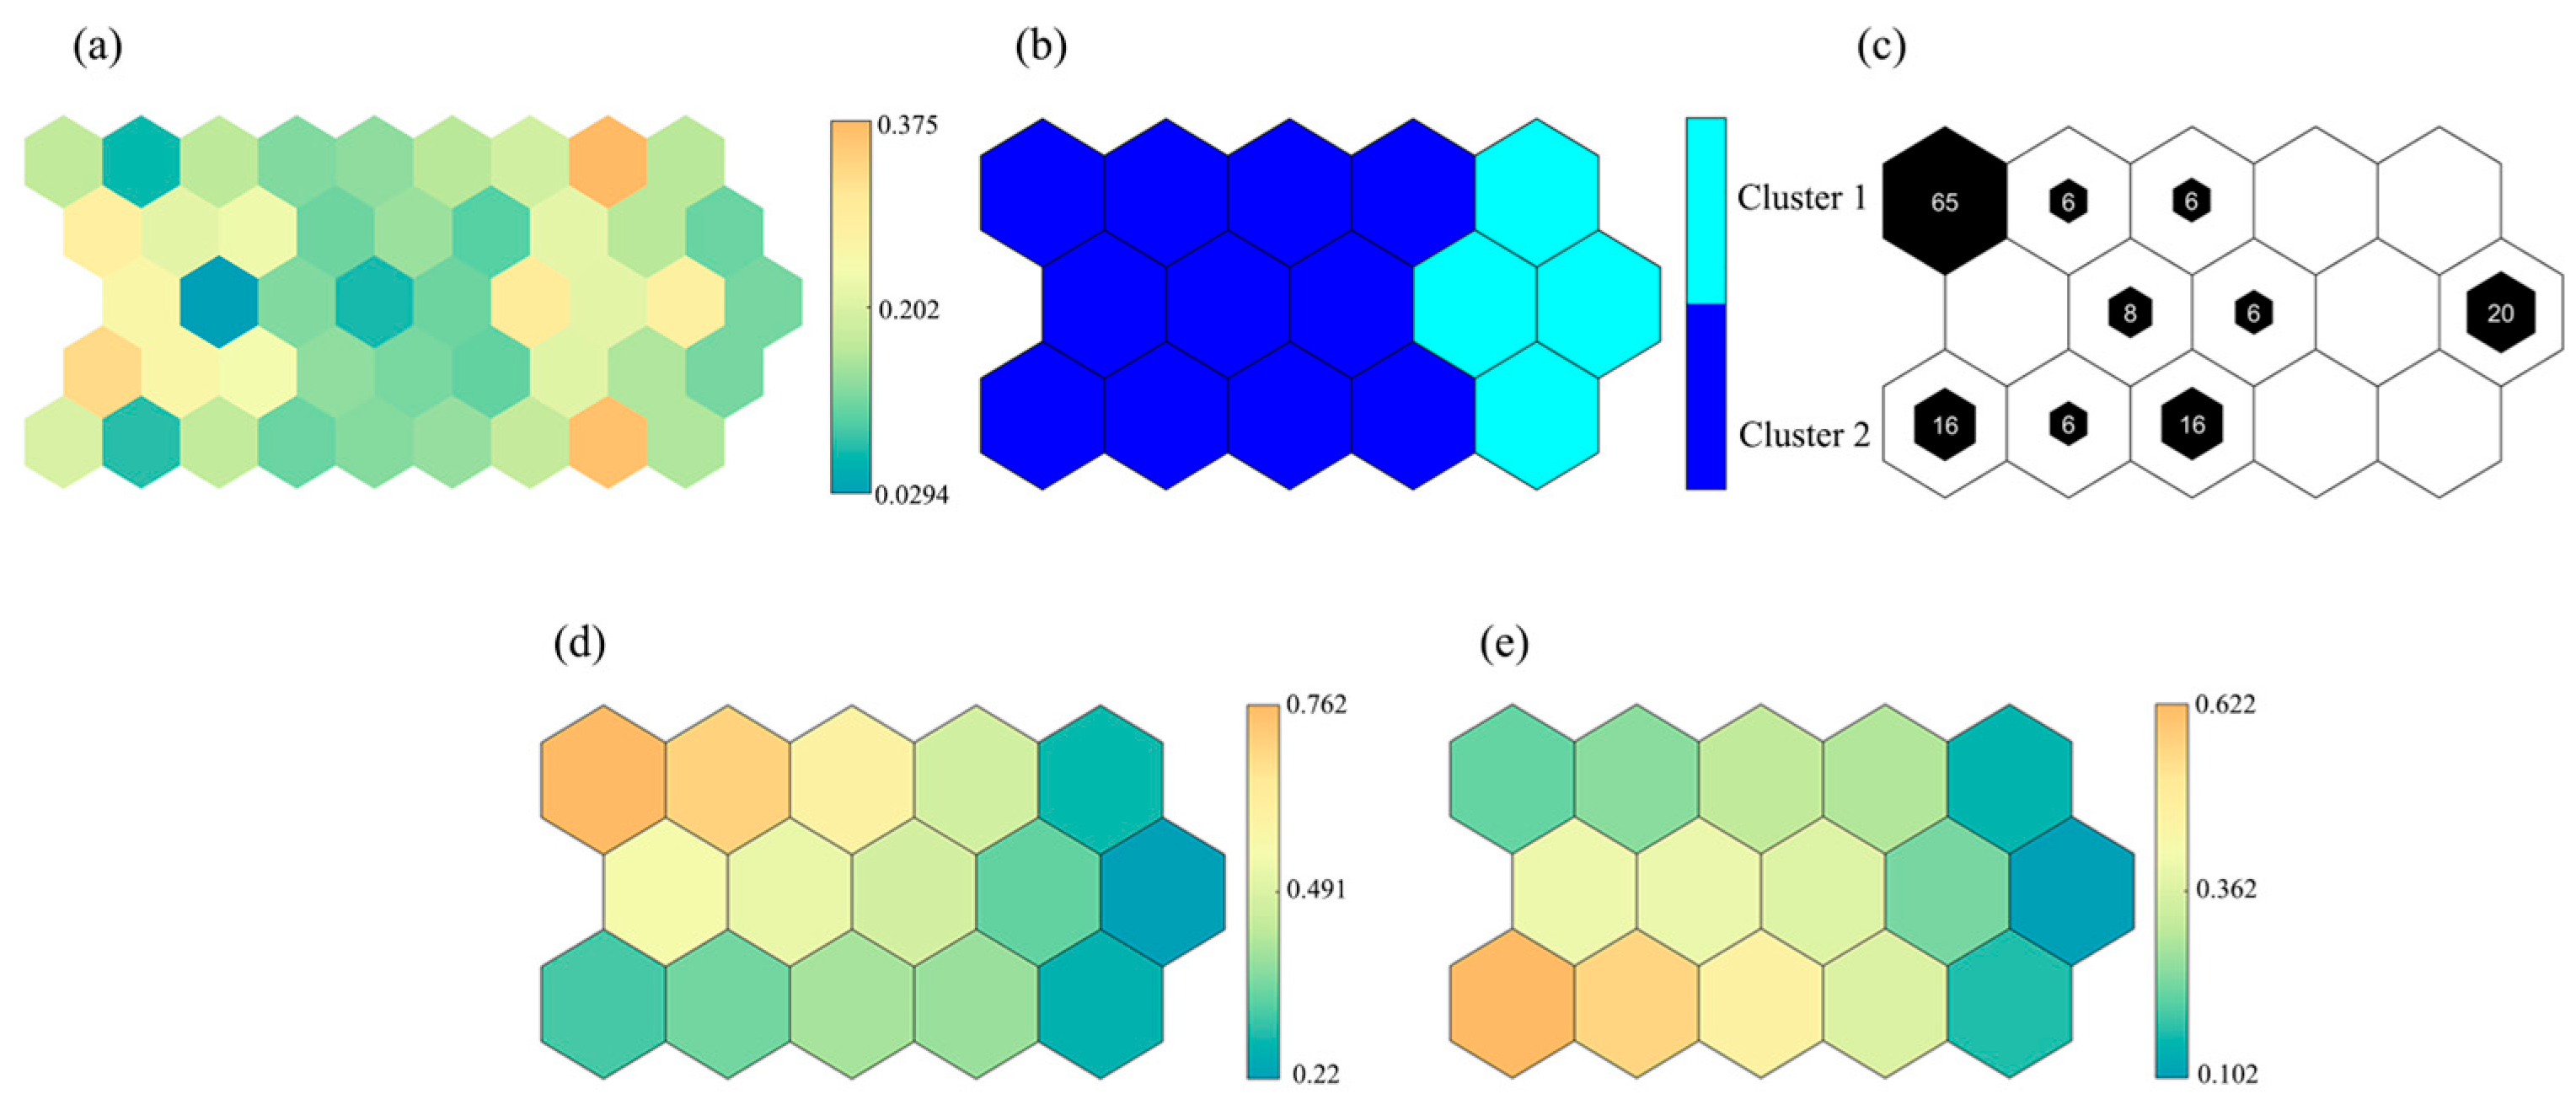
4.4. SOM Neural Network Screening Results
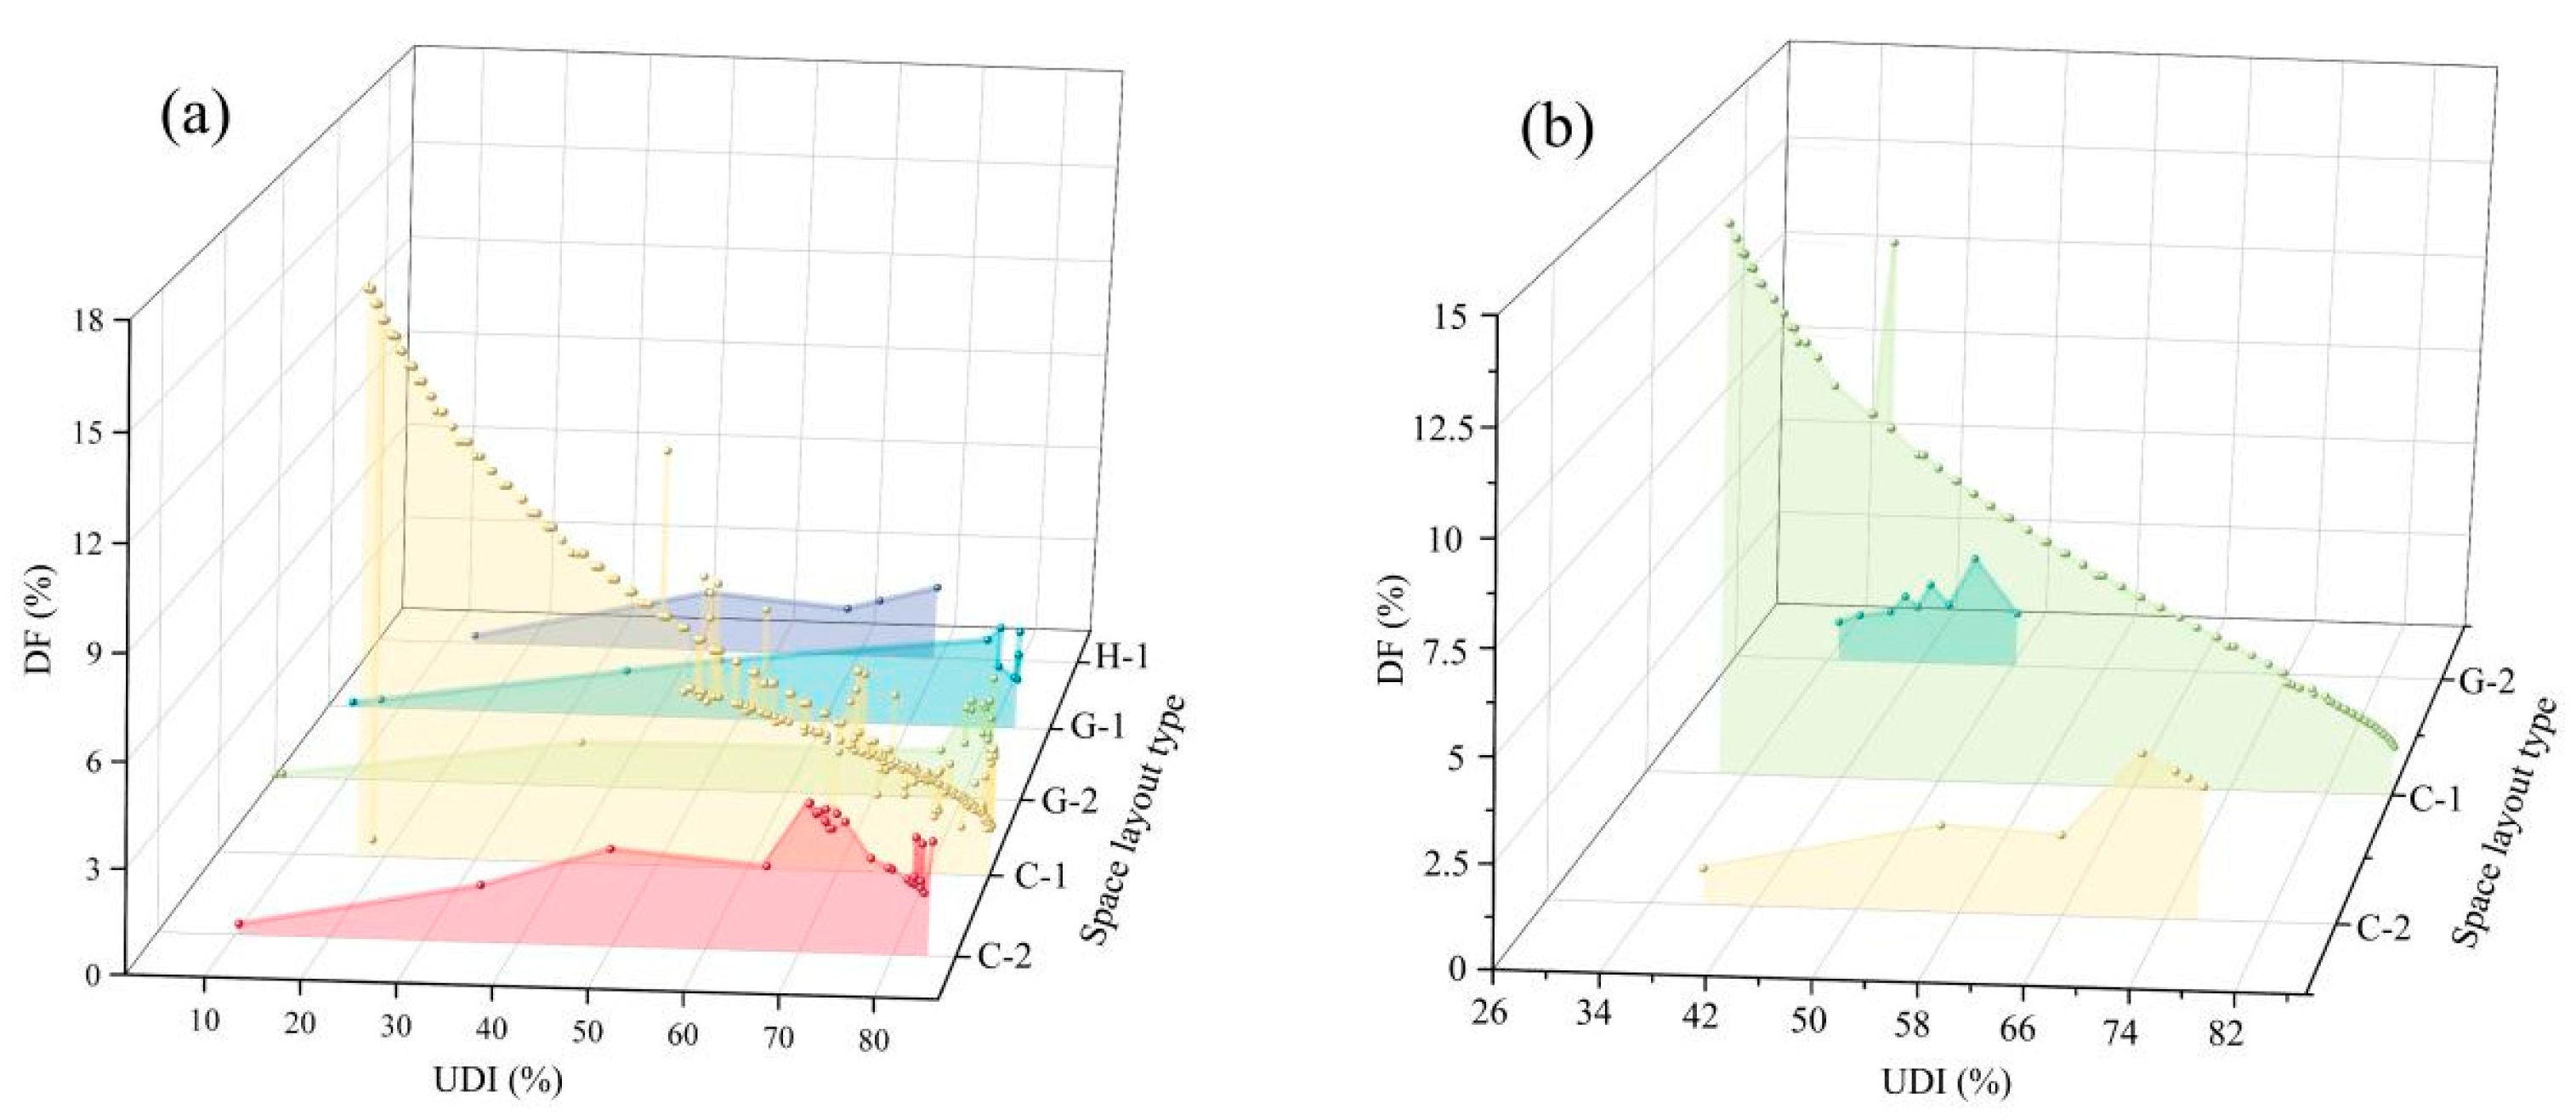
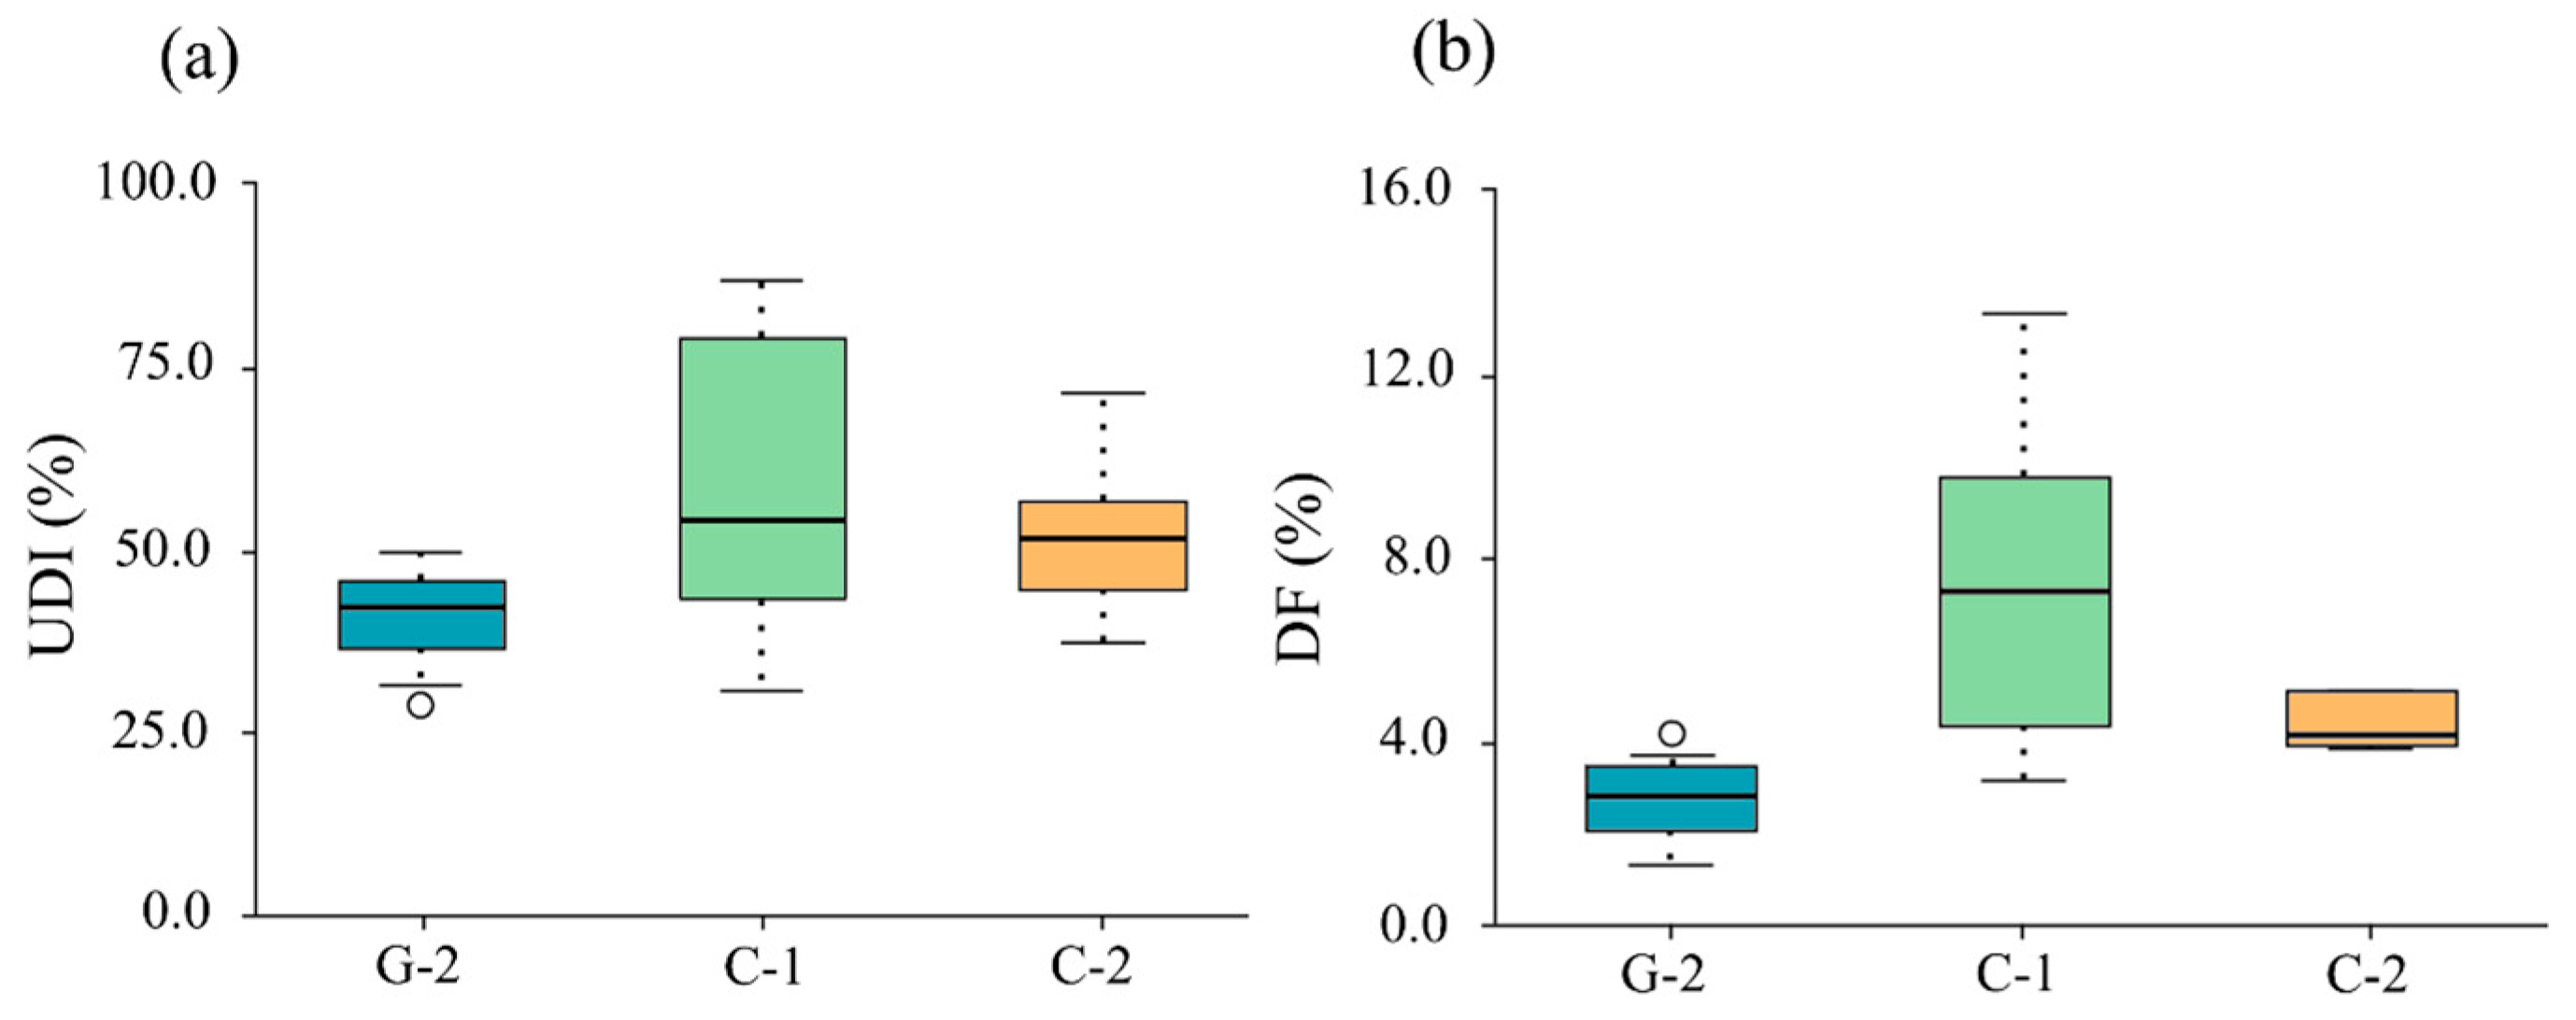
4.4.1. Selection of Building Types
4.4.2. Daylighting Performance-Oriented SOM Clustering
5. Conclusions
- (1)
- When both UDI and DF meet the comfort standards for the elderly, a minimum building area of 351 square meters is sufficient to balance both. This area ensures adequate natural lighting indoors and avoid excessive glare that could damage the elderly’s eyesight, thereby improving the quality and safety of the indoor lighting environment.
- (2)
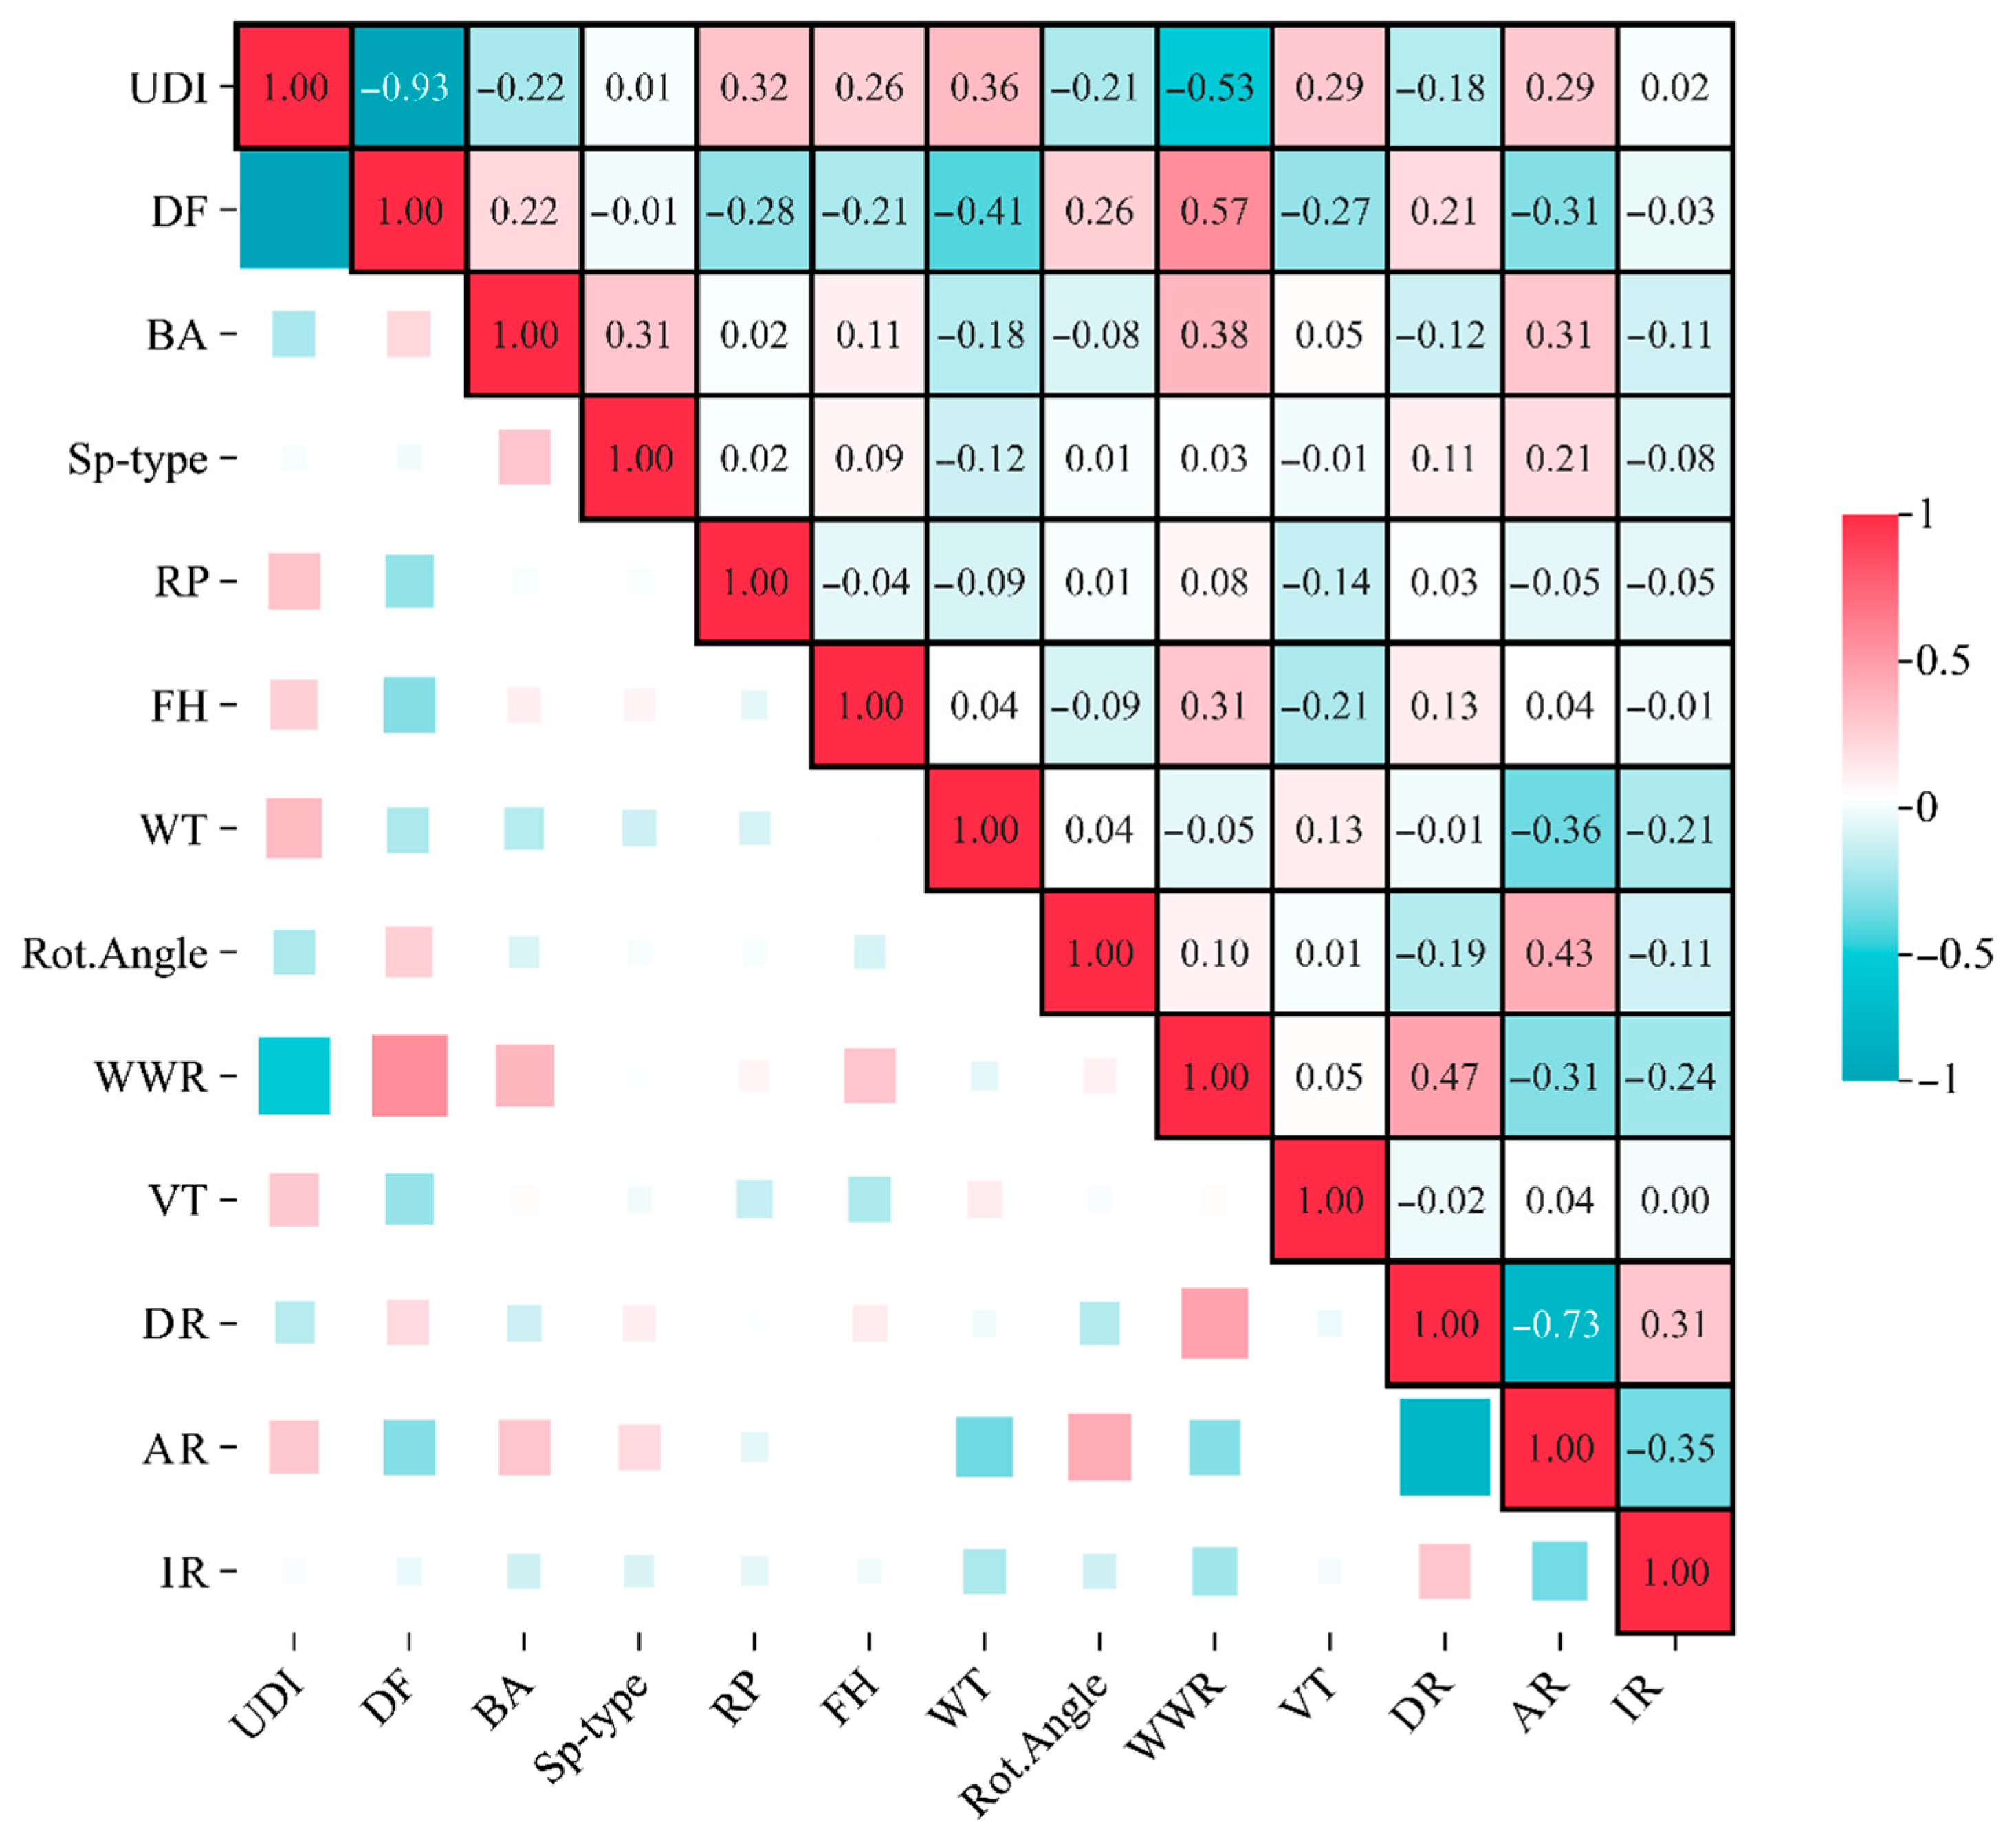
- There is a linear relationship between building characteristic parameters and lighting indicators. UDI shows a significant negative correlation with WWR (−0.53), and positive correlations with WT (0.36) and RP (0.32), but DF shows a significant positive correlation with WWR (0.57) and negative correlations with WT, AR, and RP. UDI and DF also exhibit a significant negative correlation with each other (−0.93), indicating a trade-off between the two in the optimization process.
- (3)
- Ensemble learning and SHAP interpretability analysis reveal nonlinear relationships between WWR, WT, RP, FH, UDI, and DF. In particular, a negative correlation between FH and UDI was discovered using ensemble learning methods, suggesting that adjusting building floor heights has the potential to regulate the lighting environment. This also validates the complementary advantages of nonlinear methods and Spearman methods in building performance analysis.
- (4)
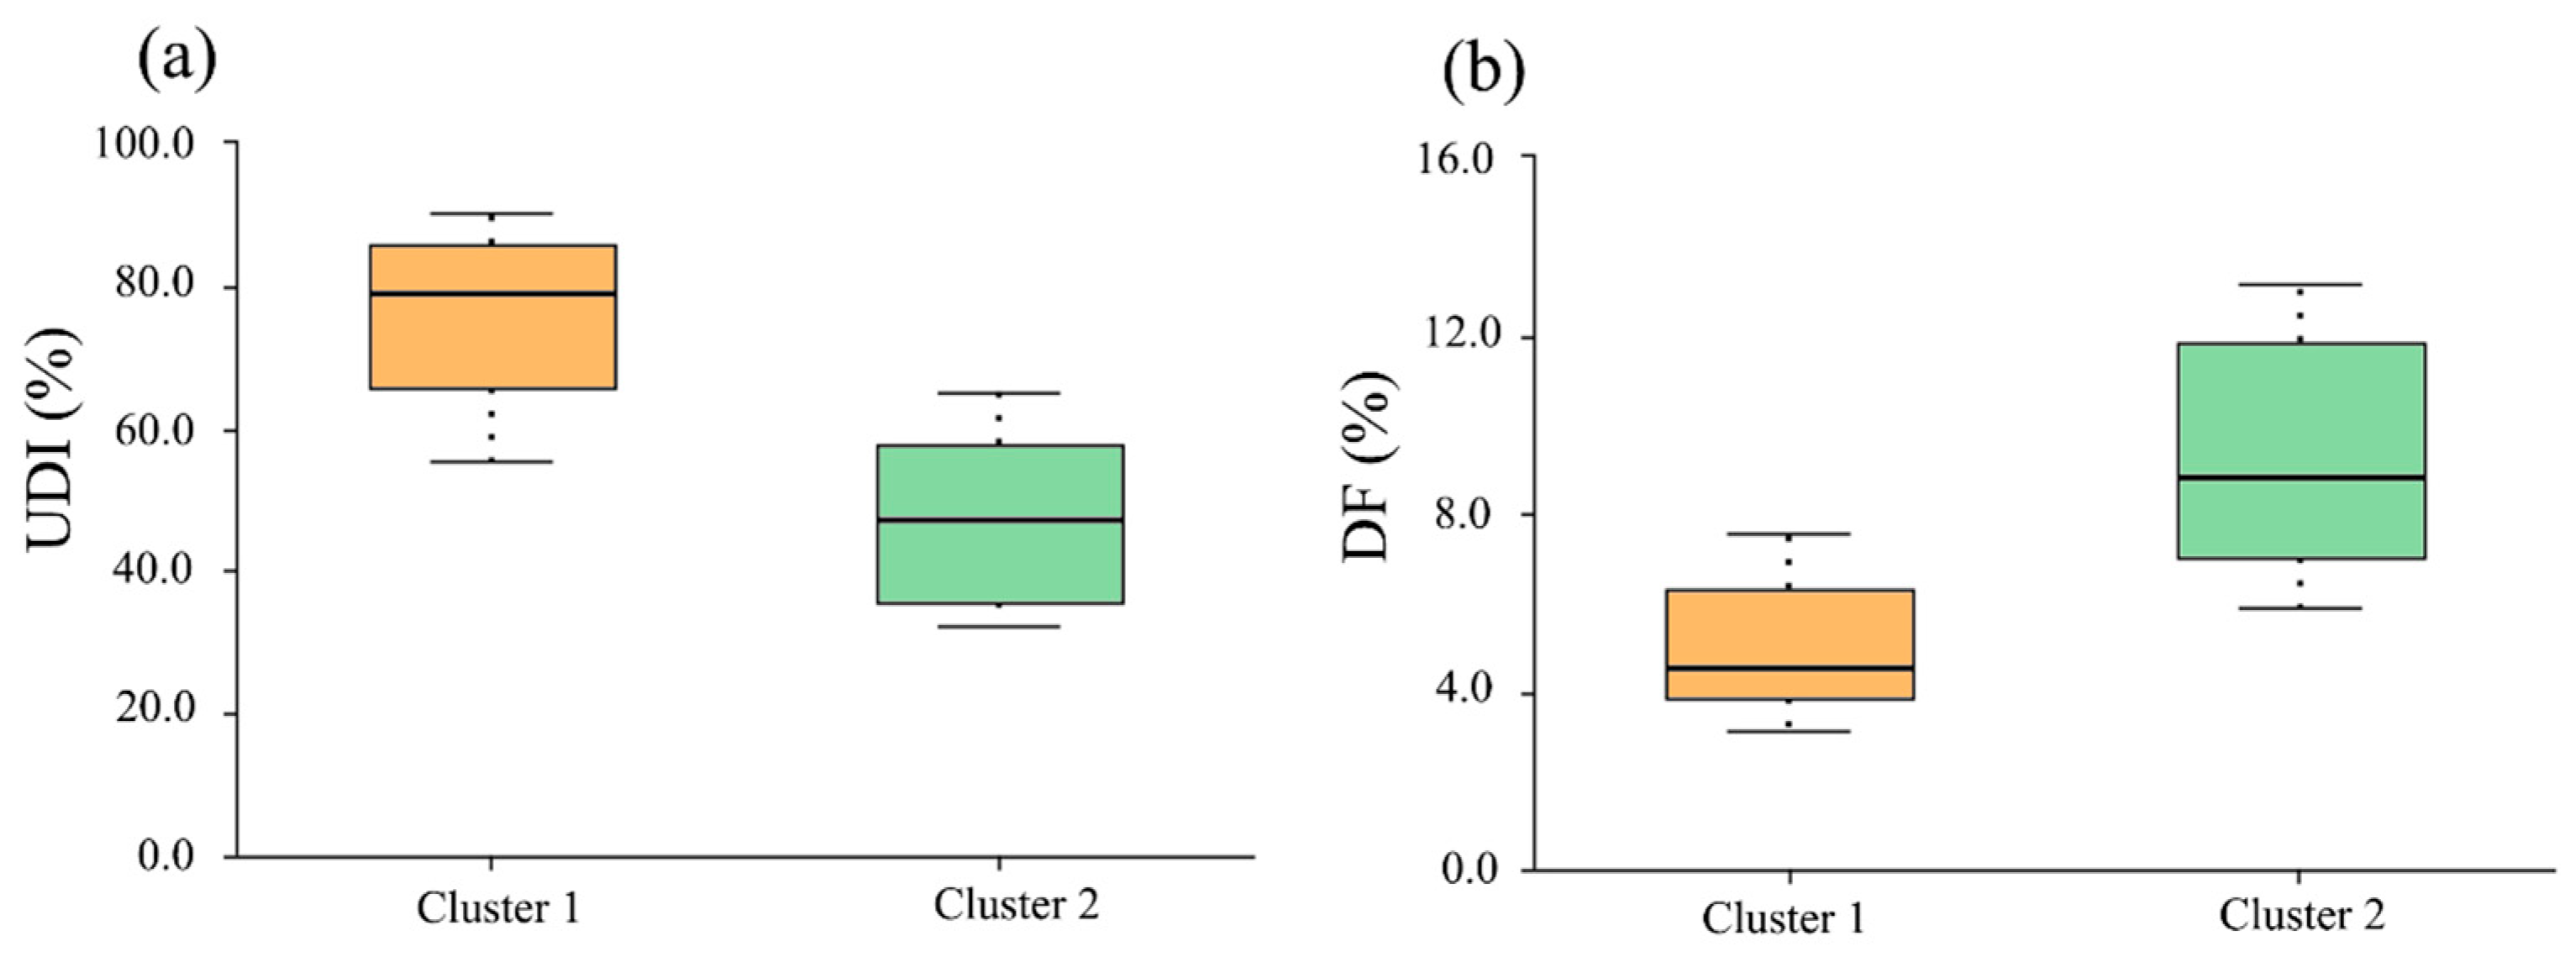
- The SOM neural network introduced in this study replaces the clustering methods or subjective decisions typically used in traditional optimization frameworks, helping to pinpoint the optimal building solutions. After mapping 149 Pareto solutions to a two-dimensional neural network space, two clusters were identified. solutions in Cluster 1 performed excellently in both UDI and DF dimensions (UDI: 67% to 87%; DF: 3.5% to 7%), showing good sunlight duration and controllable glare risks, and better meeting the elderly’s demand for a comfortable natural lighting environment. The final three representative solutions were selected for reference.
- (1)
- Recommended Building Type:
- (2)
- Window-to-Wall Ratio (WWR) Control:
- (3)
- Optimization of Building Orientation and Roof Slope:
- (4)
- Proportion Control of Large Activity Rooms:
Author Contributions
Funding
Informed Consent Statement
Data Availability Statement
Acknowledgments
Conflicts of Interest
Abbreviations
| CECF | Community-Based Elderly Care Facilities |
| SHAP | SHapley Additive exPlanations |
| SOM | Self-Organizing Map |
| MOO | Multi-Objective Optimization |
| WWR | Window-To-Wall Ratio |
| NSGA-II | Non-Dominated Sorting Genetic Algorithm II |
| GA | Genetic Algorithms |
| MOPSO | Multi-Objective Particle Swarm Optimization |
| DIANA | Divisive Analysis |
| CECSs | Community Elderly Care Stations |
| GIS | Geographic Information System |
| DAS | Direct Adaptive Subdivision |
| AM | Ante Meridiem |
| PM | Post Meridiem |
| MOGO | Multi-Objective Genetic optimization |
| AR | Activity Room Ratio |
| DR | Daycare Room Ratio |
| IR | Healthcare Support Room Ratio |
| UDI | Useful Daylight Illuminance |
| DF | Daylight Factor |
| BA | Building Area |
References
- World Population Prospects 2024: Summary of Results. Available online: https://desapublications.un.org/publications/world-population-prospects-2024-summary-results (accessed on 21 February 2025).
- Lutz, W.; Sanderson, W.; Scherbov, S. The Coming Acceleration of Global Population Ageing. Nature 2008, 451, 716–719. [Google Scholar] [CrossRef]
- Zhang, L.; Ren, H.; Li, C. Study on the Development Characteristics and Spatial and Temporal Patterns of Population Ageing in 31 Central Cities in China. Front. Public Health 2024, 12, 1341455. [Google Scholar] [CrossRef]
- Ning, J. Analysis of the Impact of Population Aging on the Economy and Countermeasures—Take China as an Example. Highlights Sci. Eng. Technol. 2024, 94, 70–75. [Google Scholar] [CrossRef]
- The Number of Various Elderly Care Institutions and Facilities in China Has Reached 410,000, Doubling Compared to 2019. China News Service, 22 October 2024. Available online: https://www.mca.gov.cn/zt/n2892/n2896/c1662004999980001961/content.html (accessed on 21 February 2025).
- Colantoni, A.; Grigoriadis, E.; Sateriano, A.; Venanzoni, G.; Salvati, L. Cities as Selective Land Predators? A Lesson on Urban Growth, Deregulated Planning and Sprawl Containment. Sci. Total Environ. 2016, 545–546, 329–339. [Google Scholar] [CrossRef]
- Seto, K.C.; Sánchez-Rodríguez, R.; Fragkias, M. The New Geography of Contemporary Urbanization and the Environment. Annu. Rev. Environ. Resour. 2010, 35, 167–194. [Google Scholar] [CrossRef]
- Li, L.H.; Zheng, X.Q.; Xiang, W.N. Research on the Spatial Distribution Law of Building Density in Beijing Based on GIS. China Popul. Resour. Environ. 2008, 18, 122–127. [Google Scholar]
- Achieving the targets set out in the 14th Five-Year Plan ahead of schedule—Over 65%, urbanisation enters the “second half”. Xinhua News Agency, 29 March 2023. Available online: https://www.xinhuanet.com/politics/2023-03/29/c_1129473788.htm (accessed on 5 July 2025).
- Chen, H.; Jia, B.; Lau, S.S.Y. Sustainable Urban Form for Chinese Compact Cities: Challenges of a Rapid Urbanized Economy. Habitat Int. 2008, 32, 28–40. [Google Scholar] [CrossRef]
- Zhang, X.Q. The Trends, Promises and Challenges of Urbanisation in the World. Habitat Int. 2016, 54, 241–252. [Google Scholar] [CrossRef]
- Guan, X.; Wei, H.; Lu, S.; Dai, Q.; Su, H. Assessment on the Urbanization Strategy in China: Achievements, Challenges and Reflections. Habitat Int. 2018, 71, 97–109. [Google Scholar] [CrossRef]
- Han, J.; Fontanos, P.; Fukushi, K.; Herath, S.; Heeren, N.; Naso, V.; Cecchi, C.; Edwards, P.; Takeuchi, K. Innovation for Sustainability: Toward a Sustainable Urban Future in Industrialized Cities. Sustain. Sci. 2012, 7, 91–100. [Google Scholar] [CrossRef]
- Langston, C.; Wong, F.K.W.; Hui, E.C.M.; Shen, L.-Y. Strategic Assessment of Building Adaptive Reuse Opportunities in Hong Kong. Build. Environ. 2008, 43, 1709–1718. [Google Scholar] [CrossRef]
- Xiang, L.; Yu, A.T.W.; Tan, Y.; Shan, X.; Shen, Q. Senior Citizens’ Requirements of Services Provided by Community-Based Care Facilities: A China Study. Facilities 2019, 38, 52–71. [Google Scholar] [CrossRef]
- Ravetz, J. State of the Stock—What Do We Know about Existing Buildings and Their Future Prospects? Energy Policy 2008, 36, 4462–4470. [Google Scholar] [CrossRef]
- Wu, J.; Li, Z.; Yang, T.; Xie, L.; Liu, J. Daylighting Enhancement in Traditional Military Settlement Dwellings of Xiangxi, China: A Study on Cost-Effective and Heritage-Consistent Renovation Approaches. Energy Build. 2024, 316, 114356. [Google Scholar] [CrossRef]
- Wang, Z.; Wang, X.; Dong, Z.; Li, L.; Li, W.; Li, S. More Urban Elderly Care Facilities Should Be Placed in Densely Populated Areas for an Aging Wuhan of China. Land 2023, 12, 220. [Google Scholar] [CrossRef]
- Wu, H.-W.; Kumar, P.; Cao, S.-J. Implementation of Green Infrastructure for Improving the Building Environment of Elderly Care Centres. J. Build. Eng. 2022, 54, 104682. [Google Scholar] [CrossRef]
- Mendes, A.; Bonassi, S.; Aguiar, L.; Pereira, C.; Neves, P.; Silva, S.; Mendes, D.; Guimarães, L.; Moroni, R.; Teixeira, J.P. Indoor Air Quality and Thermal Comfort in Elderly Care Centers. Urban Clim. 2015, 14, 486–501. [Google Scholar] [CrossRef]
- Jiao, Y.; Yu, Y.; Yu, H.; Wang, F. The Impact of Thermal Environment of Transition Spaces in Elderly-Care Buildings on Thermal Adaptation and Thermal Behavior of the Elderly. Build. Environ. 2023, 228, 109871. [Google Scholar] [CrossRef]
- Rodríguez, M.; Seseña, S.; Valiente, N.; Palop, M.L.; Rodríguez, A. Indoor Air Quality in Elderly Care Centers: A Multidisciplinary Approach. Build. Environ. 2024, 262, 111832. [Google Scholar] [CrossRef]
- Chenari, B.; Dias Carrilho, J.; Gameiro Da Silva, M. Towards Sustainable, Energy-Efficient and Healthy Ventilation Strategies in Buildings: A Review. Renew. Sustain. Energy Rev. 2016, 59, 1426–1447. [Google Scholar] [CrossRef]
- Ye, W.; Zhang, X.; Gao, J.; Cao, G.; Zhou, X.; Su, X. Indoor Air Pollutants, Ventilation Rate Determinants and Potential Control Strategies in Chinese Dwellings: A Literature Review. Sci. Total Environ. 2017, 586, 696–729. [Google Scholar] [CrossRef]
- Mazurek, K.A.; Li, L.; Klein, R.J.; Rong, S.; Mullan, A.F.; Jones, D.T.; St. Louis, E.K.; Worrell, G.A.; Chen, C.Y. Investigating the Effects of Indoor Lighting on Measures of Brain Health in Older Adults: Protocol for a Cross-over Randomized Controlled Trial. BMC Geriatr. 2024, 24, 816. [Google Scholar] [CrossRef]
- Su, Y.; Gong, A.; Wang, C.; Han, Y.; Gao, W. Exploring Thermal Comfort for the Older Adults: A Comparative Study in Dalian City’s Diverse Living Environments. Front. Archit. Res. 2025, 14, 812–824. [Google Scholar] [CrossRef]
- Morales-Bravo, J.; Navarrete-Hernandez, P. Enlightening Wellbeing in the Home: The Impact of Natural Light Design on Perceived Happiness and Sadness in Residential Spaces. Build. Environ. 2022, 223, 109317. [Google Scholar] [CrossRef]
- Du, X.; Zhang, Y.; Zhao, S. Research on Interaction Effect of Thermal, Light and Acoustic Environment on Human Comfort in Waiting Hall of High-Speed Railway Station. Build. Environ. 2022, 207, 108494. [Google Scholar] [CrossRef]
- Hwang, T.; Kim, J.T. Effects of Indoor Lighting on Occupants’ Visual Comfort and Eye Health in a Green Building. Indoor Built Environ. 2011, 20, 75–90. [Google Scholar] [CrossRef]
- Zeng, X.; Luo, P.; Wang, T.; Wang, H.; Shen, X. Screening Visual Environment Impact Factors and the Restorative Effect of Four Visual Environment Components in Large-Space Alternative Care Facilities. Build. Environ. 2023, 235, 110221. [Google Scholar] [CrossRef]
- Jong-Woei Whang, A.; Wang, C.-C.; Chen, Y.-Y. Design of Cascadable Optical Unit to Compress Light for Light Transmission Used for Indoor Illumination. Renew. Energy 2009, 34, 2280–2295. [Google Scholar] [CrossRef]
- Li, D.H.W.; Tsang, E.K.W.; Cheung, K.L.; Tam, C.O. An Analysis of Light-Pipe System via Full-Scale Measurements. Appl. Energy 2010, 87, 799–805. [Google Scholar] [CrossRef]
- Samant, S. A Critical Review of Articles Published on Atrium Geometry and Surface Reflectances on Daylighting in an Atrium and Its Adjoining Spaces. Archit. Sci. Rev. 2010, 53, 145–156. [Google Scholar] [CrossRef]
- Ngarambe, J.; Adilkhanova, I.; Uwiragiye, B.; Yun, G.Y. A Review on the Current Usage of Machine Learning Tools for Daylighting Design and Control. Build. Environ. 2022, 223, 109507. [Google Scholar] [CrossRef]
- Ma, J.; Inoue, T.; Fang, Q.; Li, K.; Li, M. A Study on Optimal Opening Configuration for Art Museum Exhibition Space Considering Daylight Performance, Indoor Thermal Comfort, and Energy Consumption. Sustainability 2023, 15, 16431. [Google Scholar] [CrossRef]
- Li, D.H.W.; Tsang, E.K.W. An Analysis of Daylighting Performance for Office Buildings in Hong Kong. Build. Environ. 2008, 43, 1446–1458. [Google Scholar] [CrossRef]
- Sinoo, M.M.; Van Hoof, J.; Kort, H.S.M. Light Conditions for Older Adults in the Nursing Home: Assessment of Environmental Illuminances and Colour Temperature. Build. Environ. 2011, 46, 1917–1927. [Google Scholar] [CrossRef]
- Yang, H.; Guo, B.; Shi, Y.; Jia, C.; Li, X.; Liu, F. Interior Daylight Environment of an Elderly Nursing Home in Beijing. Build. Environ. 2021, 200, 107915. [Google Scholar] [CrossRef]
- Yang, E.; Ismail, A.; Kim, Y.; Erdogmus, E.; Boron, J.; Goldstein, F.; DuBose, J.; Zimring, C. Multidimensional Environmental Factors and Sleep Health for Aging Adults: A Focused Narrative Review. Int. J. Environ. Res. Public Health 2022, 19, 15481. [Google Scholar] [CrossRef]
- Maksoud, A.; Hussien, A.; Mushtaha, E.; Alawneh, S.I.A.-R. Computational Design and Virtual Reality Tools as an Effective Approach for Designing Optimization, Enhancement, and Validation of Islamic Parametric Elevation. Buildings 2023, 13, 1204. [Google Scholar] [CrossRef]
- Gerhardsson, K.M.; Hassan, M.; Tornberg, Å.B.; Schmidt, S.M. Usability and Feasibility of an Online Intervention for Older Adults to Support Changes to Routines and the Home (‘Light, Activity and Sleep in My Daily Life’). BMC Public Health. 2024, 24, 2808. [Google Scholar] [CrossRef]
- Kumar, S.; Underwood, S.H.; Masters, J.L.; Manley, N.A.; Konstantzos, I.; Lau, J.; Haller, R.; Wang, L.M. Ten Questions Concerning Smart and Healthy Built Environments for Older Adults. Build. Environ. 2023, 244, 110720. [Google Scholar] [CrossRef]
- Ashe, M.C. Indoor Environments and Promoting Physical Activity Among Older People. In The Palgrave Handbook of Ageing and Physical Activity Promotion; Nyman, S.R., Barker, A., Haines, T., Horton, K., Musselwhite, C., Peeters, G., Victor, C.R., Wolff, J.K., Eds.; Springer International Publishing: Cham, Switzerland, 2018; pp. 467–483. ISBN 978-3-319-71290-1. [Google Scholar]
- Cilasun Kunduraci, A.; Karagözler, S.; SeviNç Karci, Z. Indoor Environmental Quality in Residential Care Facilities: A Scoping Review with Design Focus. Mimar. Bilim. Ve Uygulamaları Derg. MBUD 2023, 8, 123–145. [Google Scholar] [CrossRef]
- Nabil, A.; Mardaljevic, J. Useful Daylight Illuminances: A Replacement for Daylight Factors. Energy Build. 2006, 38, 905–913. [Google Scholar] [CrossRef]
- Cubukcuoglu, C.; Cilasun Kunduraci, A.; Asadollahi Asl Zarkhah, S. Indoor Environmental Quality Optimisation Model for Institutional Care Rooms of Elderly People. Buildings 2023, 13, 2625. [Google Scholar] [CrossRef]
- Tao, Y.; Gou, Z.; Yu, Z.; Fu, J.; Chen, X. The Challenge of Creating Age-Friendly Indoor Environments in a High-Density City: Case Study of Hong Kong’s Care and Attention Homes. J. Build. Eng. 2020, 30, 101280. [Google Scholar] [CrossRef]
- Juda, M.; Liu-Ambrose, T.; Feldman, F.; Suvagau, C.; Mistlberger, R.E. Light in the Senior Home: Effects of Dynamic and Individual Light Exposure on Sleep, Cognition, and Well-Being. Clocks Sleep 2020, 2, 557–576. [Google Scholar] [CrossRef]
- Liu, F.; Li, Y.; Gao, X.; Du, J. The Association between Perceived Housing Environment and Health and Satisfaction among the Older Adults during the COVID-19 Pandemic: A Cross-Sectional Survey in Northern China. Buildings 2023, 13, 2875. [Google Scholar] [CrossRef]
- Gábrová, L. Comparison between Dynamic and Static Metrics for Daylight Evaluation in the Case of Obstructed Buildings. AMM 2016, 861, 477–484. [Google Scholar] [CrossRef]
- Van Hoof, J.; Kort, H.S.M.; Duijnstee, M.S.H.; Rutten, P.G.S.; Hensen, J.L.M. The Indoor Environment and the Integrated Design of Homes for Older People with Dementia. Build. Environ. 2010, 45, 1244–1261. [Google Scholar] [CrossRef]
- Falkenberg, H.K.; Kvikstad, T.M.; Eilertsen, G. Improved Indoor Lighting Improved Healthy Aging at Home – an Intervention Study in 77-Year-Old Norwegians. J. Multidiscip. Healthc. 2019, 12, 315–324. [Google Scholar] [CrossRef]
- Koster, D.; Rafiee, A.; Brembilla, E. The Effect of Urban Density on Compliance with Indoor Visual and Non-Visual Daylight Targets: A Dutch Case Study. Sustain. Cities Soc. 2025, 120, 106149. [Google Scholar] [CrossRef]
- Mesa, N.A.; Corica, L.; Pattini, A. Evaluation of the Potential of Natural Light to Illuminate Buildings in Dense Urban Environment. A Study in Mendoza, Argentina. Renew. Energy 2011, 36, 2414–2423. [Google Scholar] [CrossRef]
- Steemers, K. Energy and the City: Density, Buildings and Transport. Energy Build. 2003, 35, 3–14. [Google Scholar] [CrossRef]
- Tan, P.Y.; Ismail, M.R.B. Building Shade Affects Light Environment and Urban Greenery in High-Density Residential Estates in Singapore. Urban For. Urban Green. 2014, 13, 771–784. [Google Scholar] [CrossRef]
- Li, J.; Wang, Y.; Xia, Y.; Song, Y.; Xie, H. Optimization of Urban Block Form by Adding New Volumes for Capacity Improvement and Solar Performance Using a Multi-Objective Genetic Algorithm: A Case Study of Nanjing. Buildings 2022, 12, 1710. [Google Scholar] [CrossRef]
- Wang, L.; Janssen, P.; Chen, K.W.; Tong, Z.; Ji, G. Subtractive Building Massing for Performance-Based Architectural Design Exploration: A Case Study of Daylighting Optimization. Sustainability 2019, 11, 6965. [Google Scholar] [CrossRef]
- Zhang, Z.; Yao, J.; Zheng, R. Multi-Objective Optimization of Building Energy Saving Based on the Randomness of Energy-Related Occupant Behavior. Sustainability 2024, 16, 1935. [Google Scholar] [CrossRef]
- Liu, Y.; Chen, K.; Ni, E.; Deng, Q. Optimizing Classroom Modularity and Combinations to Enhance Daylighting Performance and Outdoor Platform through ANN Acceleration in the Post-Epidemic Era. Heliyon 2023, 9, e21598. [Google Scholar] [CrossRef]
- Besbas, S.; Nocera, F.; Zemmouri, N.; Khadraoui, M.A.; Besbas, A. Parametric-Based Multi-Objective Optimization Workflow: Daylight and Energy Performance Study of Hospital Building in Algeria. Sustainability 2022, 14, 12652. [Google Scholar] [CrossRef]
- Budaiwi, I.M.; Abdul Fasi, M. Assessing the Energy-Saving Potential and Visual Comfort of Electrochromic Smart Windows in Office Buildings: A Case Study in Dhahran, Saudi Arabia. Sustainability 2023, 15, 9632. [Google Scholar] [CrossRef]
- Chen, Z.; Hammad, A.; Kamardeen, I.; Haddad, A. Optimising Window Design on Residential Building Facades by Considering Heat Transfer and Natural Lighting in Nontropical Regions of Australia. Buildings 2020, 10, 206. [Google Scholar] [CrossRef]
- Society for Research on Education, Design, and Architecture (SEDARCH), Ottawa, Canada; Kharvari, F. A Field-Validated Multi-Objective Optimization of the Shape and Size of Windows Based on Daylighting Metrics in Hot-Summer Mediterranean and Dry Summer Continental Climates. J. Daylighting 2020, 7, 222–237. [Google Scholar] [CrossRef]
- Khidmat, R.P.; Fukuda, H.; Kustiani. Design Optimization of Hyperboloid Wooden House Concerning Structural, Cost, and Daylight Performance. Buildings 2022, 12, 110. [Google Scholar] [CrossRef]
- Lu, Y.; Wolf, T.; Kang, J. Optimization of Facade Design Based on the Impact of Interior Obstructions to Daylighting. Build. Simul. 2016, 9, 1–14. [Google Scholar] [CrossRef]
- Ghamari, M.; Sundaram, S. Solar Window Innovations: Enhancing Building Performance through Advanced Technologies. Energies 2024, 17, 3369. [Google Scholar] [CrossRef]
- Rezaei, F.; Sangin, H.; Heiranipour, M.; Attia, S. Multi-Objective Optimization of Window and Light Shelf Design in Office Buildings to Improve Occupants’ Thermal and Visual Comfort. J. Daylighting 2024, 11, 55–68. [Google Scholar] [CrossRef]
- Ciardiello, A.; Rosso, F.; Dell’Olmo, J.; Ciancio, V.; Ferrero, M.; Salata, F. Multi-Objective Approach to the Optimization of Shape and Envelope in Building Energy Design. Appl. Energy 2020, 280, 115984. [Google Scholar] [CrossRef]
- Kabiri, E.; Maftouni, N. Multiple Objective Energy Optimization of a Trade Center Building Based on Genetic Algorithm Using Ecological Materials. Sci. Rep. 2024, 14, 9366. [Google Scholar] [CrossRef]
- Liu, J.; Li, Z.; Zhong, Q.; Wu, J.; Xie, L. Multi-Objective Optimization of Daylighting Performance and Energy Consumption of Educational Buildings in Different Climatic Zones of China. J. Build. Eng. 2024, 95, 110322. [Google Scholar] [CrossRef]
- Fang, Y.; Cho, S.; Wang, Y.; He, L. Sensitivity Analysis and Multi-Objective Optimization of Skylight Design in the Early Design Stage. Energies 2023, 17, 219. [Google Scholar] [CrossRef]
- Gassar, A.A.A.; Koo, C.; Kim, T.W.; Cha, S.H. Performance Optimization Studies on Heating, Cooling and Lighting Energy Systems of Buildings during the Design Stage: A Review. Sustainability 2021, 13, 9815. [Google Scholar] [CrossRef]
- Zhao, L.; Zhang, W.; Wang, W. BIM-Based Multi-Objective Optimization of Low-Carbon and Energy-Saving Buildings. Sustainability 2022, 14, 13064. [Google Scholar] [CrossRef]
- Konak, A.; Coit, D.W.; Smith, A.E. Multi-Objective Optimization Using Genetic Algorithms: A Tutorial. Reliab. Eng. Syst. Saf. 2006, 91, 992–1007. [Google Scholar] [CrossRef]
- Delgarm, N.; Sajadi, B.; Kowsary, F.; Delgarm, S. Multi-Objective Optimization of the Building Energy Performance: A Simulation-Based Approach by Means of Particle Swarm Optimization (PSO). Appl. Energy 2016, 170, 293–303. [Google Scholar] [CrossRef]
- Vukadinović, A.; Radosavljević, J.; Đorđević, A.; Protić, M.; Petrović, N. Multi-Objective Optimization of Energy Performance for a Detached Residential Building with a Sunspace Using the NSGA-II Genetic Algorithm. Sol. Energy 2021, 224, 1426–1444. [Google Scholar] [CrossRef]
- Yu, W.; Li, B.; Jia, H.; Zhang, M.; Wang, D. Application of Multi-Objective Genetic Algorithm to Optimize Energy Efficiency and Thermal Comfort in Building Design. Energy Build. 2015, 88, 135–143. [Google Scholar] [CrossRef]
- Bre, F.; Fachinotti, V.D. A Computational Multi-Objective Optimization Method to Improve Energy Efficiency and Thermal Comfort in Dwellings. Energy Build. 2017, 154, 283–294. [Google Scholar] [CrossRef]
- Bandaru, S.; Ng, A.H.C.; Deb, K. Data Mining Methods for Knowledge Discovery in Multi-Objective Optimization: Part A—Survey. Expert Syst. Appl. 2017, 70, 139–159. [Google Scholar] [CrossRef]
- Hakimi-Asiabar, M.; Ghodsypour, S.H.; Kerachian, R. Deriving Operating Policies for Multi-Objective Reservoir Systems: Application of Self-Learning Genetic Algorithm. Appl. Soft Comput. 2010, 10, 1151–1163. [Google Scholar] [CrossRef]
- Giagkiozis, I.; Fleming, P.J. Methods for Multi-Objective Optimization: An Analysis. Inf. Sci. 2015, 293, 338–350. [Google Scholar] [CrossRef]
- Suga, K.; Kato, S.; Hiyama, K. Structural Analysis of Pareto-Optimal Solution Sets for Multi-Objective Optimization: An Application to Outer Window Design Problems Using Multiple Objective Genetic Algorithms. Build. Environ. 2010, 45, 1144–1152. [Google Scholar] [CrossRef]
- Okabe, T.; Oya, Y.; Yamamoto, G.; Sato, J.; Matsumiya, T.; Matsuzaki, R.; Yashiro, S.; Obayashi, S. Multi-Objective Optimization for Resin Transfer Molding Process. Compos. Part Appl. Sci. Manuf. 2017, 92, 1–9. [Google Scholar] [CrossRef]
- Li, Y.; Wu, H. A Clustering Method Based on K-Means Algorithm. Phys. Procedia 2012, 25, 1104–1109. [Google Scholar] [CrossRef]
- Li, T.; Rezaeipanah, A.; Tag El Din, E.M. An Ensemble Agglomerative Hierarchical Clustering Algorithm Based on Clusters Clustering Technique and the Novel Similarity Measurement. J. King Saud Univ. Comput. Inf. Sci. 2022, 34, 3828–3842. [Google Scholar] [CrossRef]
- Shahidinejad, A.; Ghobaei-Arani, M.; Masdari, M. Resource Provisioning Using Workload Clustering in Cloud Computing Environment: A Hybrid Approach. Clust. Comput. 2021, 24, 319–342. [Google Scholar] [CrossRef]
- Shi, X.; Tian, Z.; Chen, W.; Si, B.; Jin, X. A Review on Building Energy Efficient Design Optimization Rom the Perspective of Architects. Renew. Sustain. Energy Rev. 2016, 65, 872–884. [Google Scholar] [CrossRef]
- Bre, F.; Roman, N.; Fachinotti, V.D. An Efficient Metamodel-Based Method to Carry out Multi-Objective Building Performance Optimizations. Energy Build. 2020, 206, 109576. [Google Scholar] [CrossRef]
- Astudillo, C.A.; Oommen, B.J. Topology-Oriented Self-Organizing Maps: A Survey. Pattern Anal. Appl. 2014, 17, 223–248. [Google Scholar] [CrossRef]
- Delgado, S.; Higuera, C.; Calle-Espinosa, J.; Morán, F.; Montero, F. A SOM Prototype-Based Cluster Analysis Methodology. Expert Syst. Appl. 2017, 88, 14–28. [Google Scholar] [CrossRef]
- Palomo, E.J.; North, J.; Elizondo, D.; Luque, R.M.; Watson, T. Application of Growing Hierarchical SOM for Visualisation of Network Forensics Traffic Data. Neural Netw. 2012, 32, 275–284. [Google Scholar] [CrossRef]
- Ramírez-Alonso, G.; Chacón-Murguía, M.I. Auto-Adaptive Parallel SOM Architecture with a Modular Analysis for Dynamic Object Segmentation in Videos. Neurocomputing 2016, 175, 990–1000. [Google Scholar] [CrossRef]
- He, C.; Li, M.; Zhang, C.; Chen, H.; Zhong, P.; Li, Z.; Li, J. A Self-Organizing Map Approach for Constrained Multi-Objective Optimization Problems. Complex Intell. Syst. 2022, 8, 5355–5375. [Google Scholar] [CrossRef]
- Liang, J.; Qiao, K.; Yue, C.; Yu, K.; Qu, B.; Xu, R.; Li, Z.; Hu, Y. A Clustering-Based Differential Evolution Algorithm for Solving Multimodal Multi-Objective Optimization Problems. Swarm Evol. Comput. 2021, 60, 100788. [Google Scholar] [CrossRef]
- Yi, Y.K. Building Facade Multi-Objective Optimization for Daylight and Aesthetical Perception. Build. Environ. 2019, 156, 178–190. [Google Scholar] [CrossRef]
- Zawidzki, M.; Szklarski, J. Multi-Objective Optimization of the Floor Plan of a Single Story Family House Considering Position and Orientation. Adv. Eng. Softw. 2020, 141, 102766. [Google Scholar] [CrossRef]
- Mandal, B.; Roy, P.K. Multi-objective Optimal Power Flow Using Grasshopper Optimization Algorithm. Optim. Control Appl. Methods 2024, 45, 623–645. [Google Scholar] [CrossRef]
- Ladybug, version 1.8.0. Software for Technical Computation. Ladybug Tools: Fairfax, VA, USA, 2024.
- Honeybee, version 1.8.0. Software for Technical Computation. Ladybug Tools: Fairfax, VA, USA, 2024.
- EnergyPlus, version 24.1.0. Software for Technical Computation. Department of Energy: Washington DC, USA, 2024.
- Radiance, version 6.0a. Software for Technical Computation. Radsite: Lawrence Berkeley National Laboratory: Berkeley, CA, USA, 2025.
- TT Toolbox, version 2.0.7. Software for Technical Computation. Thornton Tomasetti: New York, NY, USA, 2024.
- Evolutionary Engine for Grasshopper3D, version 2.7. Software for Technical Computation. Wallacei Team: London, UK, 2022.
- Python, version 3.13.0. Software for Technical Computation. Python Software Foundation: Beaverton, OR, USA, 2024.
- Beijing Elderly Career Development Report; Beijing Municipal Civil Affairs Bureau: Beijing, China, 2024. Available online: https://mzj.beijing.gov.cn/art/2024/10/21/art_4490_735482.html (accessed on 21 February 2025).
- Statistics of the Civil Affairs Bureau; Beijing Municipal Civil Affairs Bureau: Beijing, China, 2025. Available online: https://mzj.beijing.gov.cn/art/2025/1/2/art_10834_684684.html (accessed on 21 February 2025).
- Wen, F.; Zhang, Y.; Du, P.; Zhang, Z.; Zhang, B.; Zhang, Y. Factors Influencing the Usage Frequency of Community Elderly Care Facilities and Their Functional Spaces: A Multilevel Based Study. Buildings 2024, 14, 1827. [Google Scholar] [CrossRef]
- JGJ 113-2015; Technical Specification for Application of Architectural Glass. Ministry of Housing and Urban-Rural Development of People’s Republic of China: Beijing, China, 2015.
- GB/T 39866-2012; Technical Requirements for the Ancillary Frames of Architectural Doors and Windows. State Administtation for Market Regulation: Beijing, China, 2012.
- JGJ 450-2018; Standard for Design of Care Facilities for the Aged. Ministry of Housing and Urban-Rural Development of People’s Republic of China: Beijing, China, 2018.
- Harkouss, F.; Fardoun, F.; Biwole, P.H. Multi-Objective Optimization Methodology for Net Zero Energy Buildings. J. Build. Eng. 2018, 16, 57–71. [Google Scholar] [CrossRef]
- Ascione, F.; Bianco, N.; De Masi, R.F.; De Stasio, C.; Mauro, G.M.; Vanoli, G.P. Multi-Objective Optimization of the Renewable Energy Mix for a Building. Appl. Therm. Eng. 2016, 101, 612–621. [Google Scholar] [CrossRef]
- Ieva, F.; Ronzulli, M.; Romo, J.; Paganoni, A.M. A Spearman Dependence Matrix for Multivariate Functional Data. J. Nonparametric Stat. 2025, 37, 82–104. [Google Scholar] [CrossRef]
- Zhang, W.-Y.; Wei, Z.-W.; Wang, B.-H.; Han, X.-P. Measuring Mixing Patterns in Complex Networks by Spearman Rank Correlation Coefficient. Phys. A Stat. Mech. Its Appl. 2016, 451, 440–450. [Google Scholar] [CrossRef]


| Building Type | Layout | Symbolic | Area (m2) |
|---|---|---|---|
| Point | Hybrid Layout | H-1 | 673 |
| Gallery Layout | G-1 | 525 | |
| Cluster Layout | C-1 | 351 | |
| Slab | Cluster Layout | C-2 | 335 |
| Gallery Layout | G-2 | 402 |
| Classification | Design Parameter | Symbols | Range | Units | Baseline |
|---|---|---|---|---|---|
| Building form | Building Type | Sp-Type | 0, 1, 2, 3, 4, 5 | - | - |
| Floor Height | FH | 3 to 4 | m | 3.4 | |
| Roof Slope | RP | 0 to 15 | ° | - | |
| Wall Thickness | WT | 0.4 to 0.7 | m | 0.5 | |
| Space Rotation Angle | Rot. Angle | 0, 1, 2, 3, 4 | - | 2.8 | |
| Large space | Vertical Depth of Activity room | Max. V. Depth | −0.15 to 0.15 | % | 0 |
| Horizontal Depth of Activity room | Max. H. Depth | −0.15–0.15 | % | 0 | |
| Window | Window-to-Wall Ratio | WWR | 0.2 to 0.6 | - | 0.14 |
| Window VT (visible transmittance) | VT | 0.5 to 0.65 | - | 0.5 |
| Parameter | Symbol | Equation | Number |
|---|---|---|---|
| Activity room ratio | AR (%) | (1) | |
| Daycare room ratio | DR (%) | (2) | |
| Healthcare support room ratio | IR (%) | (3) |
| Parameter | Classification | Boundary Condition Settings | Boundary Condition |
|---|---|---|---|
| DF and UDI | Software | Grasshopper/Ladybug/Honeybee | - |
| Time scale | Simulation period | 8:00 a.m. to 5:00 p.m. | |
| Material properties | Window pollution reduction factor | 0.90 | |
| Wall reflectance | 0.80 | ||
| Floor reflectance | 0.40 | ||
| Ceiling reflectance | 0.80 | ||
| Window reflectance | 0.45 | ||
| Ground reflectance | 0.40 | ||
| Grid segmentation | Mesh grid size | 0.5 × 0.5 m | |
| Test surface distance from floor | 0.75 m | ||
| Sky Model | - | Perez sky model |
| Crossover Probability | Mutation Probability | Crossover Distribution Index | Mutation Distribution Index | Random Seed | Generation Count | Generation Size |
|---|---|---|---|---|---|---|
| 0.9 | 0.9 | 20 | 20 | 1 | 40 | 50 |
| Model | Training Set R2 | Testing Set R2 |
|---|---|---|
| UDI | 0.9681 | 0.8419 |
| DF | 0.9706 | 0.9102 |
Disclaimer/Publisher’s Note: The statements, opinions and data contained in all publications are solely those of the individual author(s) and contributor(s) and not of MDPI and/or the editor(s). MDPI and/or the editor(s) disclaim responsibility for any injury to people or property resulting from any ideas, methods, instructions or products referred to in the content. |
© 2025 by the authors. Published by MDPI on behalf of the International Society for Photogrammetry and Remote Sensing. Licensee MDPI, Basel, Switzerland. This article is an open access article distributed under the terms and conditions of the Creative Commons Attribution (CC BY) license (https://creativecommons.org/licenses/by/4.0/).
Share and Cite
Wen, F.; Zhang, L.; Jiang, L.; Sun, W.; Jin, T.; Zhang, B. A Multi-Objective Optimization and Decision Support Framework for Natural Daylight and Building Areas in Community Elderly Care Facilities in Land-Scarce Cities. ISPRS Int. J. Geo-Inf. 2025, 14, 272. https://doi.org/10.3390/ijgi14070272
Wen F, Zhang L, Jiang L, Sun W, Jin T, Zhang B. A Multi-Objective Optimization and Decision Support Framework for Natural Daylight and Building Areas in Community Elderly Care Facilities in Land-Scarce Cities. ISPRS International Journal of Geo-Information. 2025; 14(7):272. https://doi.org/10.3390/ijgi14070272
Chicago/Turabian StyleWen, Fang, Lu Zhang, Ling Jiang, Wenqi Sun, Tong Jin, and Bo Zhang. 2025. "A Multi-Objective Optimization and Decision Support Framework for Natural Daylight and Building Areas in Community Elderly Care Facilities in Land-Scarce Cities" ISPRS International Journal of Geo-Information 14, no. 7: 272. https://doi.org/10.3390/ijgi14070272
APA StyleWen, F., Zhang, L., Jiang, L., Sun, W., Jin, T., & Zhang, B. (2025). A Multi-Objective Optimization and Decision Support Framework for Natural Daylight and Building Areas in Community Elderly Care Facilities in Land-Scarce Cities. ISPRS International Journal of Geo-Information, 14(7), 272. https://doi.org/10.3390/ijgi14070272