Article

Understanding the Impact of Street Environments on Traffic Crash Risk from the Perspective of Aging People: An Interpretable Machine Learning Approach

Department of Land Surveying and Geo-Informatics, The Hong Kong Polytechnic University, 181 Chatham Road South, Hong Kong, China
*
Author to whom correspondence should be addressed.
ISPRS Int. J. Geo-Inf. 2025, 14(7), 248; https://doi.org/10.3390/ijgi14070248
Submission received: 9 May 2025 / Revised: 14 June 2025 / Accepted: 20 June 2025 / Published: 26 June 2025

Abstract

As the aging population grows rapidly, the traffic risks faced by older adults have become a growing concern for age-friendly transportation planning. While prior studies have investigated the relationship between traffic crashes and the built environment, they often treat the population as homogeneous and ignore the fine-grained characteristics of the street environment. This study addresses these gaps by examining how fine-grained street environments influence crash risks, with a particular focus on aging people. Specifically, we use segmented street view images to train models that predict crash risk levels based on normalized crash frequencies, with separate models developed for older and non-older populations. Interpretable machine learning methods are then employed to identify key environmental contributors and to compare their spatial contribution patterns across age groups. Our findings reveal that the traffic crash risk of older adults is more strongly influenced by street environment indicators, both positive and negative, indicating their greater sensitivity to environmental conditions. Moreover, the contribution of street features differs significantly between age groups, not only in overall trends but also in the spatial patterns of their impact. Our research uncovers age-specific interactions with the street environment and emphasizes the need for differentiated transportation planning approaches.

1. Introduction

As urban populations around the world continue to age, improving road safety for aging people emerges as a critical priority in developing age-friendly transportation systems. According to the Hong Kong Transport Department (HKTD), the proportion of traffic crashes involving aging individuals has increased from 18.6 % in 2020 to 21.0 % in 2023. The risk of fatality in traffic crashes also rises significantly with age. Despite improvements in road infrastructure and traffic management, aging adults face distinct challenges due to sensory impairments [1,2], physical limitations [3], and declines in cognitive functioning [4,5,6]. When combined with complex or unsafe street environments, these factors place aging people at heightened risk.
Previous studies mainly focus on evaluating the association between traffic crashes and the configuration of the built environment for significant crash predictors [7]. Several significant built-environment characteristics, such as population [8,9], intersections designing [10,11], and land-use characteristics [12,13], have been addressed in many studies. However, most studies focus on general populations. Fine-grained street-level characteristics remain underexplored, with limited focus on aging individuals, partly because the total number of crashes involving them is relatively small. In particular, it remains unclear how street environments uniquely influence traffic crash risks for aging adults and how these effects differ from those experienced by younger people.
To address these gaps, this study applies interpretable machine learning methods to examine the influence of street environment indicators on traffic crash risks, with a particular focus on aging people. We utilize Street View Images (SVIs) to extract real-world scenes from the perspective of road users. SVIs provide a detailed street-level perspective for assessing built settings and have been successfully used in studies on urban issues including crime rates [14,15], public health [16,17], and economic activity [18,19]. By applying image segmentation algorithms, we objectively quantify street-level features and convert them into visual quality indicators that abstract the street environment [20,21].
To focus specifically on aging people, we divide crash data into two groups based on the age of casualties: older and non-older. For each group, crash incidents are aggregated into hexagonal units, which are then classified into three levels of crash risk. This classification-based approach, rather than relying on a continuous regression model, helps prevent the overinterpretation of minor fluctuations in crash counts, which may not represent meaningful differences in actual risk. Based on the street environment indicators of each hexagonal unit, Random Forest (RF) classifiers are trained to predict crash risk levels. We then apply interpretable techniques, such as Shapley Additive exPlanations (SHAPs) and Partial Dependence Plots (PDPs), to analyze the contribution of each indicator and compare model results across age groups. Unlike prior studies that focus mainly on global contribution trends, our analysis further investigates the spatial distribution of indicator contributions and the interaction effects between variables.
Our main contributions are threefold:
  • We examine how street environments influence traffic crashes involving older people, highlighting the greater sensitivity of older people to the street environment.
  • We identify specific street environment indicators that impact traffic safety differently for older and non-older people, providing insights for urban planning policies to improve roadway safety for older adults.
  • We compare the spatial patterns of street environment contributions across age groups and reveal the age-specific interactions among different indicators.
We believe our research offers a fine-grained perspective for transportation planning aimed at improving traffic safety for aging people and provides new insights for developing age-friendly urban environments.

2. Literature Review

2.1. Built Environment and Traffic Crashes

Traffic crashes result from a complex interplay of factors, including individual characteristics [22,23], traffic-related behaviors [24,25], and the built environment. Among these factors, the built environment plays a significant important role, as it influences traffic volume, road conditions, and vehicle speeds, which are key determinants of traffic exposure and crash risk [7].
Although many studies highlight a strong association between the built environment and traffic crashes, findings remain inconsistent. As one of the most commonly studied factors, density has shown both positive and negative correlations with traffic safety, with results varying across geographic contexts. Some studies suggest that higher population density increases traffic conflicts and injury crash rates [8,12], while others report lower pedestrian crash rates in denser areas [9]. Similarly, the relationship between intersection density and crash risk is also mixed [10,11].
A frequently cited reason for the varied outcomes in traffic studies is that greater urban density creates more opportunities for conflicts between vehicles and pedestrians, thereby increasing the chances of collisions [26,27]. In contrast, increased density compels vehicles traveling through an area to reduce speed, which in turn lessens the severity of collisions [28].
Land use composition is another important determinant of crash risk. Higher crash rates are typically associated with commercial zones and mixed land uses, reflecting increased exposure among vulnerable road users [12,29]. However, the effects of residential and industrial land use also do not yield consistent results. For instance, the relationship between residential land use and crash risk may depend on the buffer radius around signalized intersections [13]. Likewise, industrial land use has been linked to both increased and decreased crash rates across different studies [11,13].
Since the majority of traffic accidents happen on streets, the characteristics of the streetscape microenvironment are also crucial for road safety. Traditional methods of collecting these features, such as manual surveys and field inventories, have been widely used to document infrastructure elements like signage, road design, and lighting [30,31]. However, these methods are labor-intensive, costly, and often subject to observer bias.
Recent progress in machine learning has led to a growing reliance on SVIs for evaluating streetscape environments [19,32]. Image segmentation techniques applied to SVIs are some of the most commonly adopted methods. These techniques enable the automatic extraction of comprehensive street-level features, facilitating large-scale and unbiased assessments of their impacts on traffic safety [33,34]. Another widely used approach, object detection methods, excels at examining the influence of specific street elements on traffic incidents [11,35].
Despite these advances, little attention has been paid to how street environment factors affect different age groups. Aging people, due to declining physical and perceptual capabilities, are particularly vulnerable in traffic environments, and their interaction with the street environment may differ significantly from that of younger people [36]. While many studies examine traditionally built environment factors in terms of aging people, few have explored the specific role of street-level environments in shaping elderly road safety. To address this gap, our study separates the population into the older and non-older groups, examining their respective relationships with street environments.

2.2. Road Safety of Aging Population

Due to the natural aging process, the aging population faces a higher risk of traffic crashes and experiences greater mortality rates compared to other age groups [37]. This increased risk comes from age-related declines in sensory, physical, and cognitive functions, all of which are important for traffic safety.
Sensory deterioration, particularly in vision and hearing, plays a central role. Declines in visual acuity [1,38] and hearing ability [2,39] reduce general mobility and impair the ability to perceive traffic environments accurately.
For example, reduced vision motion sensitivity leads to both reductions in hit rate and increases in false alarm rate in spotting moving objects [40]. This makes it difficult for older adults to detect oncoming vehicles, leading to risky crossing choices [41]. Likewise, hearing problems also make it hard for them to hear nearby vehicles, raising the risk of falls [39]. Weaker muscles and joints from physical aging further reduce safety, as they limit mobility and stability [3,42]. As a result, slower walking and delayed reactions make it challenging for elderly pedestrians to handle traffic safely, increasing the chance of serious injuries in crashes.
In addition to the sensory and physical systems, cognitive decline also affects the mobility and safety of aging people. Slower information processing reduces their ability to understand complex road environments [5,43], navigate unfamiliar routes [4], and maintain concentration [6,44], which decreases the safeness of traffic decisions for the aging population.
Another cognitive challenge is the reduced ability to filter and manage multiple, often conflicting, streams of traffic information. This difficulty is especially evident in real-world settings: collisions involving individuals over 65 frequently occur in complex scenarios, such as two-way undivided streets [45,46]. Older pedestrians also tend to engage more often in unsafe behaviors like jaywalking and may struggle with stability when crossing wide or extended intersections [47]. Other cognitive changes including declines in proprioceptive and vestibular systems further reduce balance and spatial awareness, which contribute to falls and increased crash risk [5,48].
Altogether, these age-related changes reduce older adults’ mobility and increase their traffic-related risks. Thus, the unique vulnerabilities of aging people suggest that the same street features may have varying effects on safety depending on age. Accordingly, this study examines how specific street environment indicators affect traffic crash risk for both older and non-older people.

3. Study Area and Data

3.1. Study Area

The study area for this research is Hong Kong, a densely populated metropolitan region with complex urban and natural landscapes. Due to its mountainous terrain, only 25.6 % of the land is developed, resulting in a sharp contrast between the compact, vibrant city center and the quiet, sparsely populated countryside. This diverse landscape supports a wide range of land uses and a highly interconnected transport network, making Hong Kong a compelling setting to investigate the interactions between urban design and road safety.
Hong Kong is also undergoing significant demographic change, with a rapidly aging population that intensifies traffic safety concerns. The proportion of residents aged 65 and over is projected to rise from 20.5 % in 2021 to 36.0 % by 2046 [49]. Reinforcing this trend, HKTD data indicate that traffic crashes involving aging individuals rose from 18.6 % in 2020 to 21.0 % in 2023. This growing vulnerability among aging adults underscores the need to better understand how the built environment influences traffic risk across different age groups.
For spatial analysis, this study divides the region into hexagonal study units with a spatial resolution of 500 m2. Hexagonal grids are preferred over rectangular ones as they more closely approximate circular shapes, offer more uniform connectivity, and reduce orientation bias caused by edge effects [50]. Moreover, considering that environmental features may exert a continuous influence on road user behavior, rather than acting only at the precise location of the crash, using hexagonal grids allows us to better capture general spatial patterns and behavioral trends. To ensure relevance to road safety, units without a road network or comprising over 90 % natural land, where vehicles and traffic crashes are uncommon, are omitted. After filtering, the final study area consists of 1141 hexagonal units, as shown in Figure 1.

3.2. Data Collection

Traffic crashes are shaped by the interplay of diverse environmental and social factors. In this study, we incorporate data from multiple sources, including SVIs, land use, points of interest (POIs), and demographic statistics, to capture a wide range of contextual variables relevant to traffic crash risk. Table A1 and Table A2 summarize the 25 variables included in our analysis. Before modeling, we examine all variables for multicollinearity using the Variance Inflation Factor (VIF), and exclude those with VIF > 10 to ensure model stability.

3.2.1. Traffic Crash Data

The traffic crash dataset is obtained from the HKTD, covering 81,527 crash incidents recorded between January 2019 and December 2023. Each record includes detailed attributes such as the number of casualties, age, gender, injury severity, exact crash location (latitude and longitude), time of occurrence, etc. The crash coordinates are geocoded with high spatial precision using GPS-based formal reporting protocols, rather than being approximated or manually mapped. The HKTD, as the governmental authority responsible for managing road safety and traffic records, operates a mature and stable crash reporting system. Given the official nature and completeness of this system, the dataset captures the vast majority of crash events. This dataset has also been widely adopted in prior studies on traffic safety in Hong Kong [51,52].
To facilitate spatial analysis, we aggregate crash counts to the hexagonal study units. Since traffic crash frequency often correlates with road length, we normalize the number of crashes N i in each unit i by the total road length L i to obtain a standardized crash rate:
C i = N i L i
This normalization allows for fairer comparisons across areas with varying road densities [53,54].

3.2.2. Street View Images

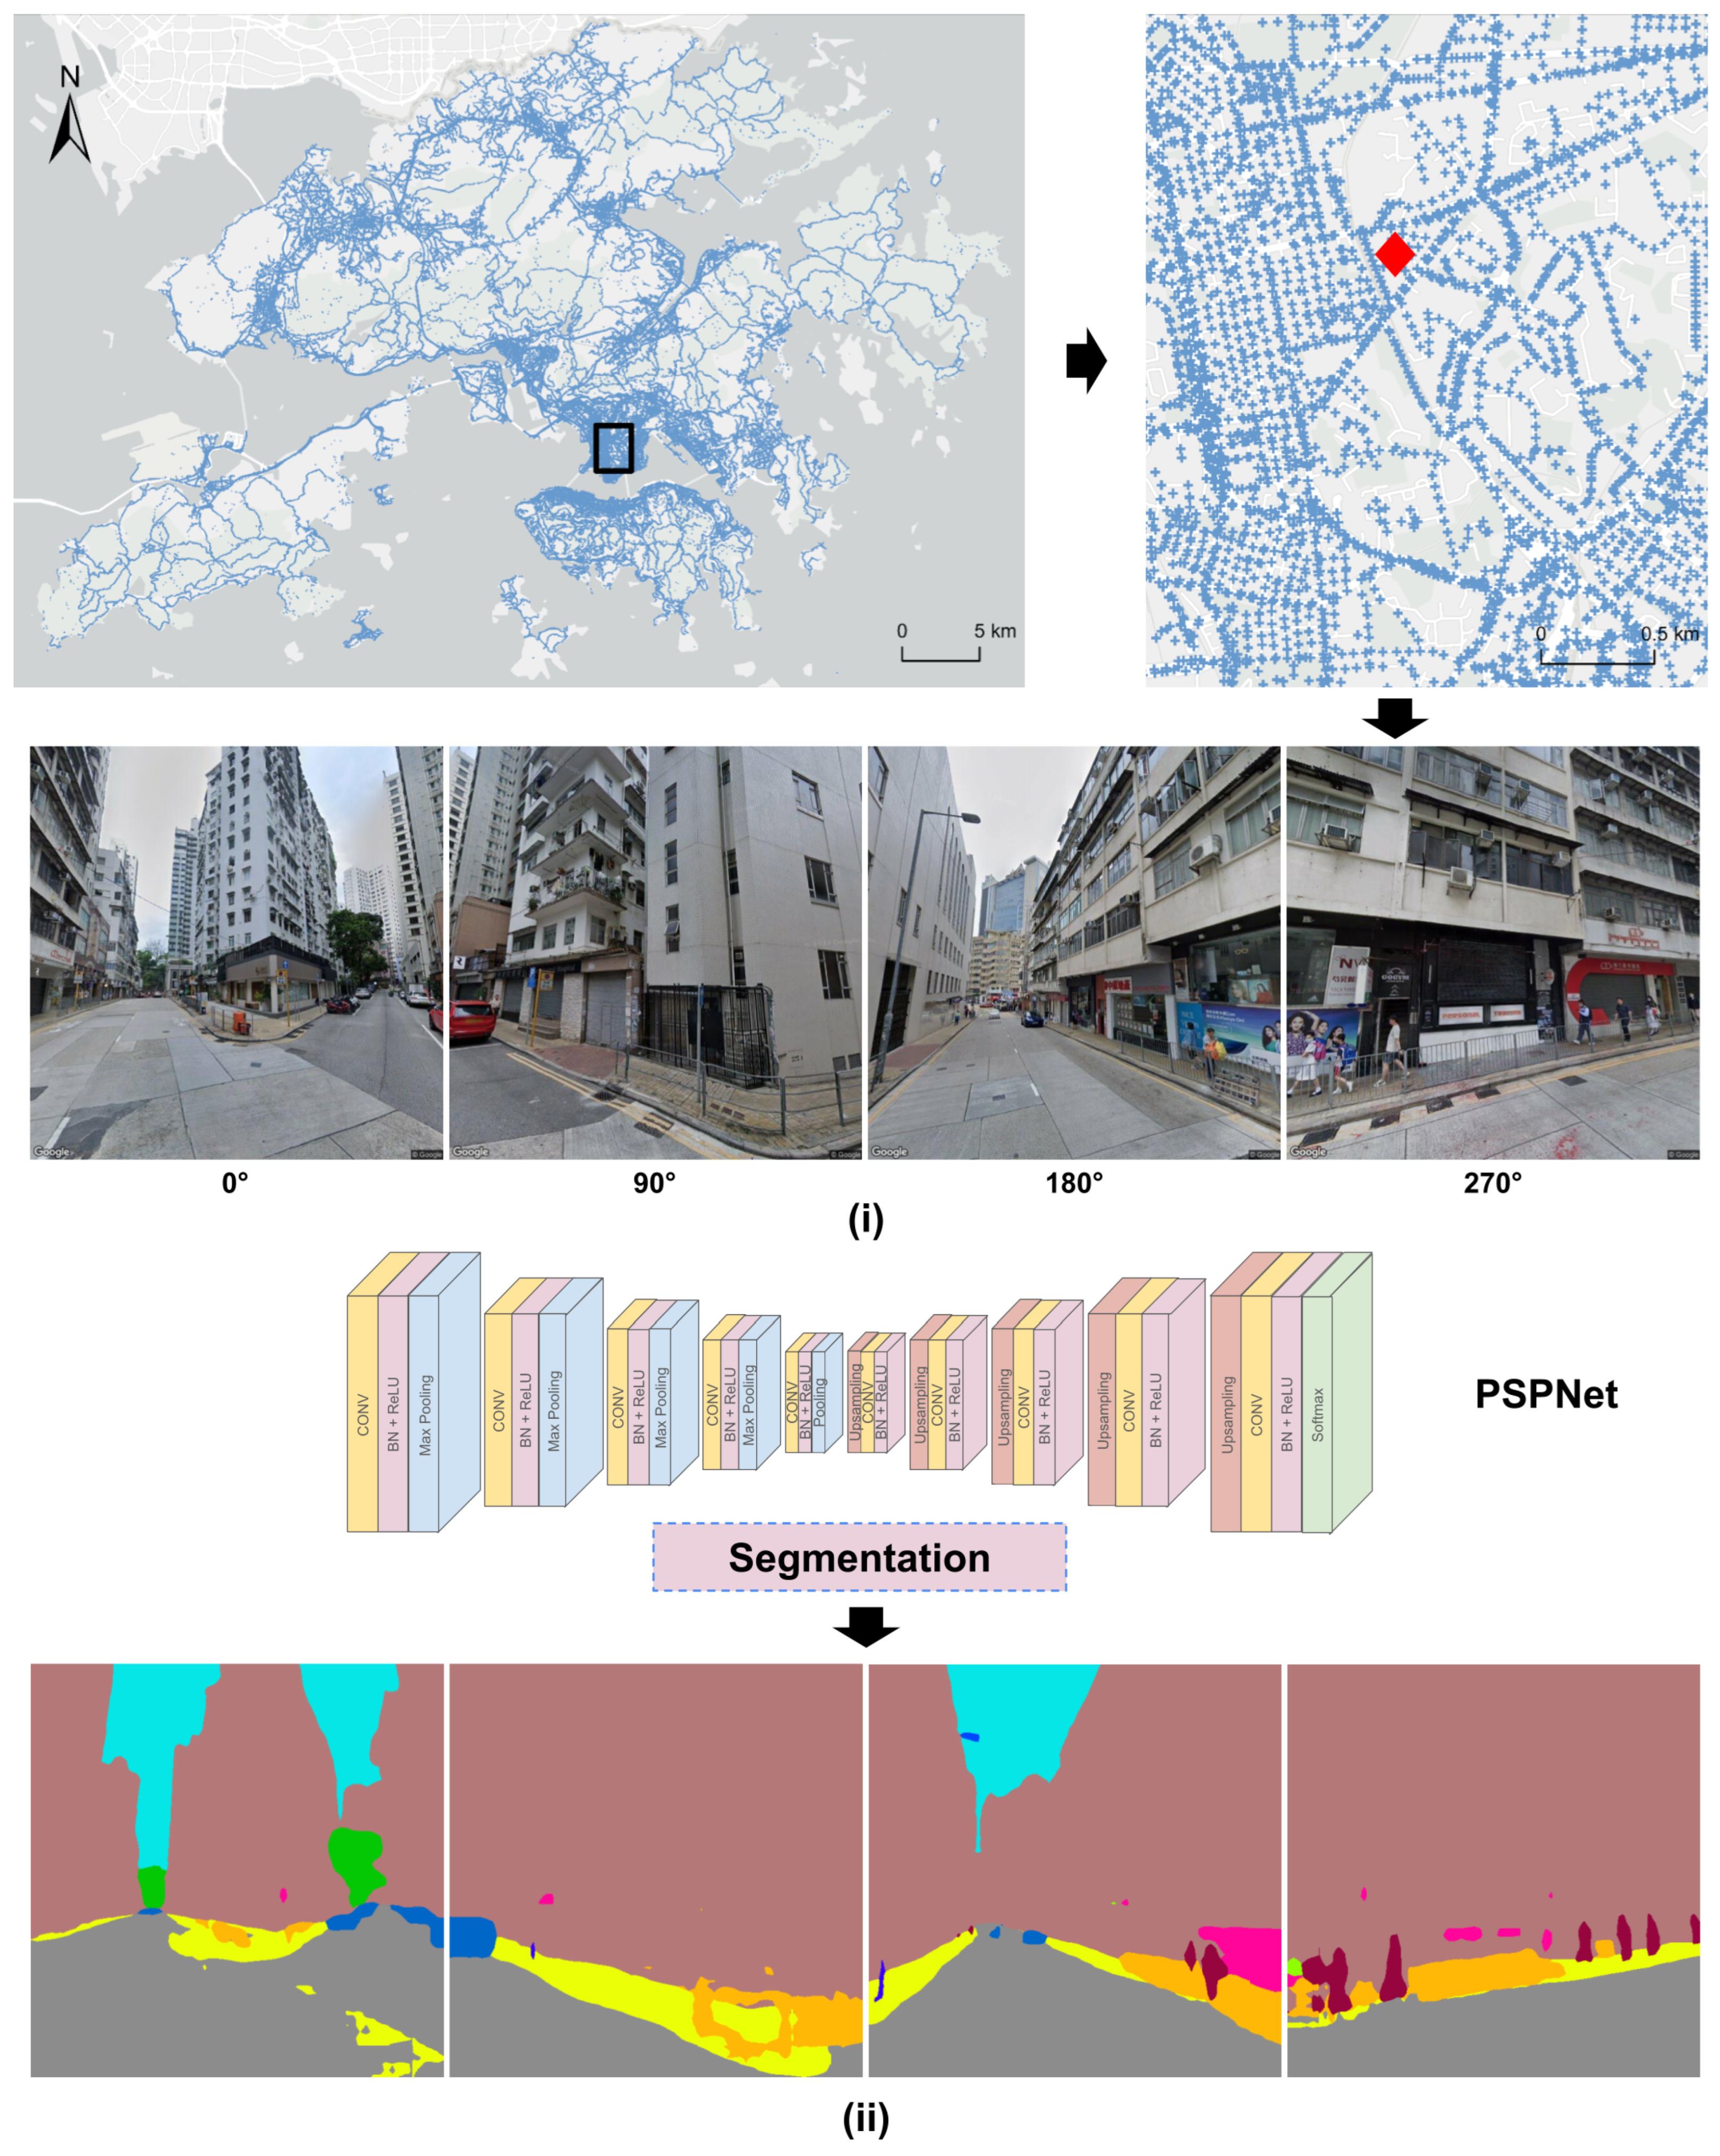
To capture the visual characteristics of the street environment, we collect SVIs from Google Maps. Sampling is performed at 50-m intervals along the road network, resulting in 103 , 609 unique sampling points. As shown in Figure 2i, the spatial distribution of sample points reflects Hong Kong’s highly clustered urban form, where over 60 % of land remains undeveloped. At each location, four images are retrieved at azimuth angles of 0 , 90 , 180 , and 270 , providing full coverage of the surrounding street environment. In total, we collect 414,436 images at a resolution of 640 × 640 pixels.

3.2.3. Built Environment Data

Because people’s traffic behavior is shaped by the broader urban context, we incorporate built environment and demographic variables alongside street environment features [7]. These variables serve as control factors that complement the visual indicators extracted from SVIs, helping to isolate the specific effects of the streetscape on traffic crash risk. A summary of all variables and supporting references is provided in Table A1.
Following previous research, we include land use data that have been consistently shown to influence traffic crashes [12,37,55]. The land use dataset, sourced from Planning Department [56], covers seven built-up categories. We exclude classes such as “other” and “transportation” due to limited interpretive value or high multicollinearity with other variables. For each hexagonal unit, we compute the proportion of each land use type and a land use mix index using Shannon Entropy to capture functional diversity.
We also incorporate POI data, which provides a finer-grained view of urban functionality and is widely used to supplement land use information [57,58]. Our POI dataset, obtained from Amap API (API documentation: https://lbs.amap.com/api, accessed on 13 December 2024) includes 299,692 entries across 21 categories. To reduce multicollinearity and focus on crash-relevant features, we exclude POI types that strongly overlap with land use data or lack empirical links to crash occurrence. We retain POIs related to hospitals, shopping areas, and public infrastructure—facilities most strongly associated with human activity and traffic exposure [53,58]. The number of POIs in each retained class is aggregated within each hexagon.
Finally, demographic data from the 2021 Hong Kong Census [59] is used to represent socioeconomic conditions and population structure, which are also known to affect road safety outcomes [60]. Variables include demographic characteristics and household income levels at the hexagonal level.
These datasets are integrated into a unified feature set alongside the street environment indicators. This integration enables a more comprehensive analysis that captures the interplay between the built environment, social conditions, and street environment features, allowing for a more accurate assessment of environmental impacts on crash risks.

4. Methods

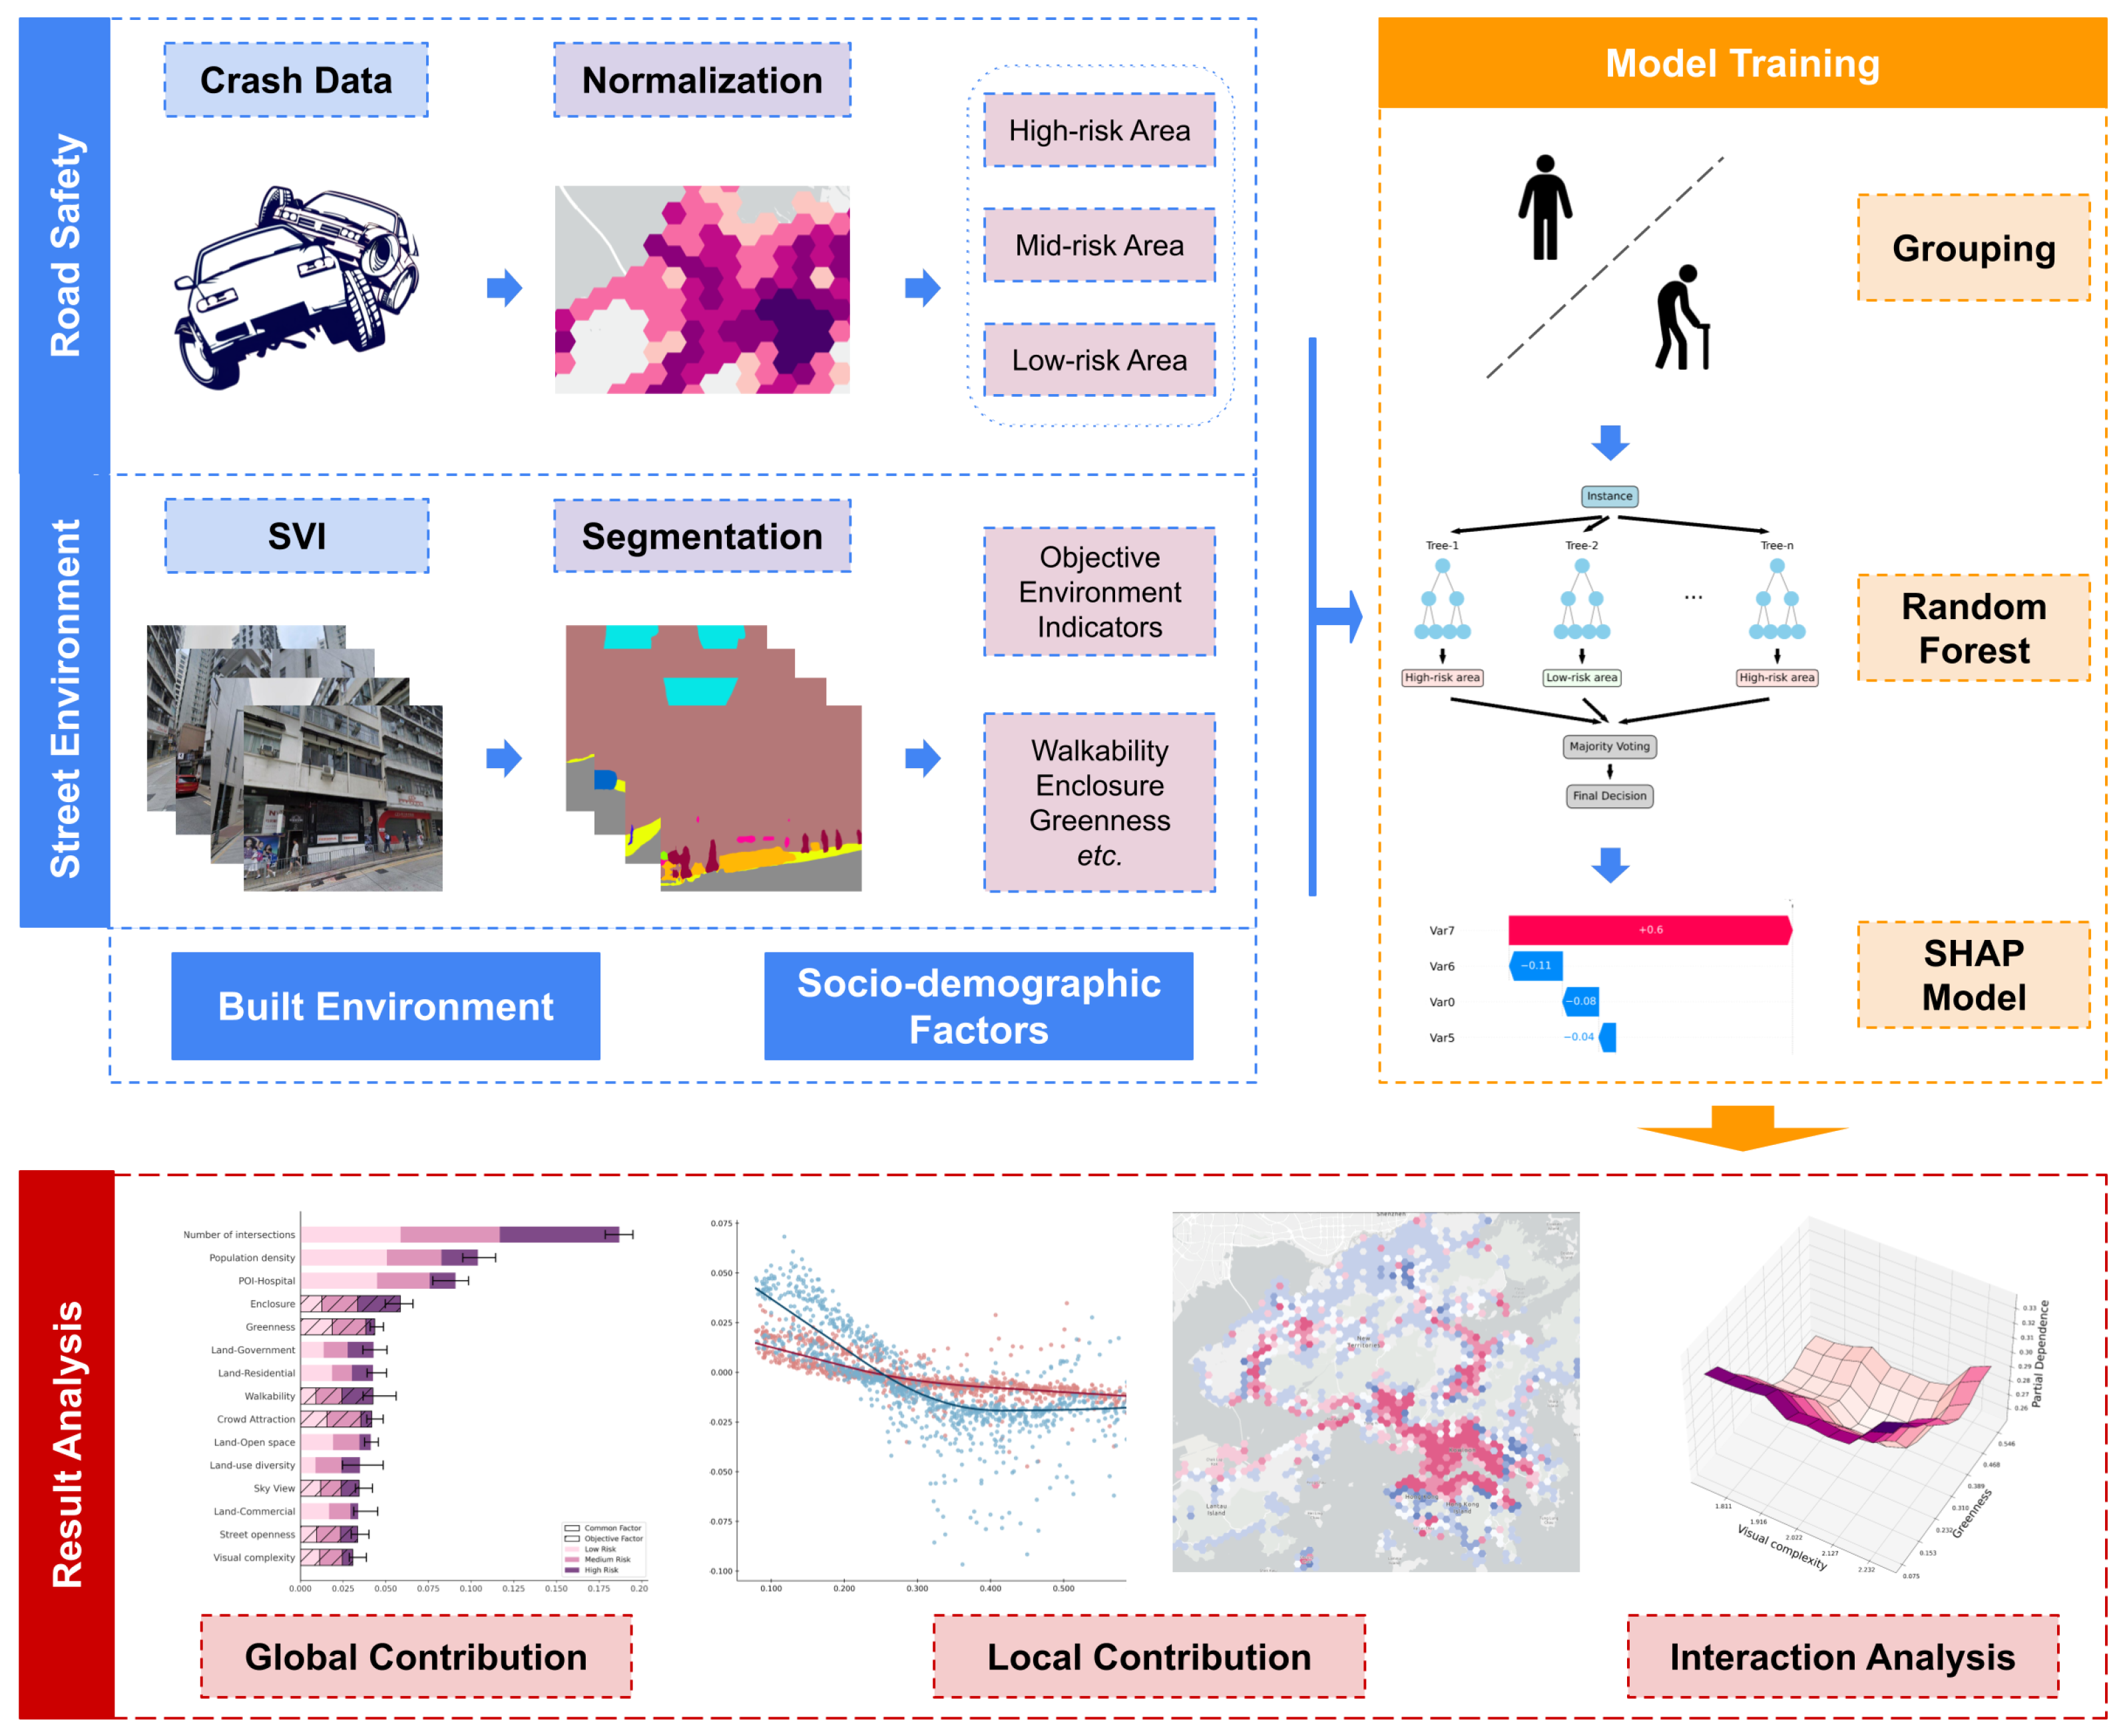
Figure 3 presents the overall framework developed to investigate the relationship between the street environment and traffic crashes. First, we measure street environmental characteristics by performing semantic segmentation on SVIs and aggregating the indicators into hexagonal spatial units. Then, we group normalized traffic crash counts into two categories based on the age of casualties: the older group (casualties aged 60 and above) and the non-older group (casualties under 60).
We use 60 years old as the threshold, which is commonly adopted in aging and transportation studies [61,62]. Clinical studies show that trauma-related mortality, particularly relevant to traffic crashes, increases notably after age 60, while individuals aged 55–59 have outcomes similar to younger adults [63,64]. Moreover, using 65 as the cutoff results in a severe class imbalance, with more spatial units recording zero crashes for the older group, which weakens model robustness and increases bias.
Finally, we classify study areas into different traffic risk levels according to the normalized traffic crash counts. RF models are then separately trained for the older and non-older groups to predict risk levels. Finally, interpretable machine learning methods are applied to explain the prediction outputs, identify influencing factors, and explore spatial pattern of contribution.

4.1. Street Environment Measurement

SVIs offer great potential for large-scale and automatic perception of street environments [14,32]. Considering that street environmental characteristics are significantly associated with traffic crashes and injury severity, we apply semantic image segmentation to extract street features from SVIs. We utilize the Pyramid Scene Parsing Network (PSPNet), a state-of-the-art deep learning model trained on the ADE20K dataset, to perform semantic segmentation [65,66] (Figure 2ii).
Specifically, we used PSPNet with a ResNet-101 backbone, which achieves a pixel-wise accuracy of 81.70 % and a mean Intersection-over-Union (mIoU) of 44.14 % on the test set. The model was trained with a batch size of 16, a learning rate of 0.01 , and for 100 epochs. The dataset was split into 80 % for training, 8 % for validation, and 12 % for testing. Training was conducted using eight NVIDIA GeForce RTX 2080 Ti GPUs over approximately 20 h. The ADE20K dataset covers 150 categories, including both indoor and outdoor elements. However, some categories are not well-suited for analyzing street environments. For example, greenness is classified into palm, plant, and tree separately. Thus, relying solely on the pixel ratios of raw segmentation outputs is insufficient to fully capture the street environment.
To better represent street characteristics, we adopt established methodologies to transform segmentation results into higher-level street environment indicators, including greenness, enclosure, walkability, crowd attraction, sky view, and water view [20,21,67]. The calculation of these indicators is detailed in Table A2. For each hexagonal unit, we calculate the average values of the indicators across all corresponding SVIs to represent the local street environment.
Moreover, we compute the Shannon Entropy of the top 50 segmentation categories within each study unit to capture the diversity of visual information, referred to as visual complexity, which is particularly important when analyzing traffic crashes involving aging individuals [32,43].

4.2. Training Models of Traffic Crashes

Traffic crash data in Hong Kong exhibit substantial zero inflation, mainly due to the mountainous terrain and the highly clustered nature of developed areas. This zero inflation can lead to biased and unstable estimates when using regression models. Therefore, instead of using a regression model, we classify the study units into three risk categories: low-risk areas with no recorded traffic crashes, mid-risk areas with normalized crash counts below the average, and high-risk areas with normalized crash counts above the average. Compared to the regression model, this classification approach helps to avoid overinterpreting minor differences in crash counts, recognizing that small variations do not necessarily reflect meaningful differences in risk. Moreover, the street environment itself exhibits smoothness across nearby study units, further supporting the use of a classification approach.
We use RF classifiers to model traffic crash risks separately for the older and non-older groups. The RF algorithm is particularly well-suited for small sample sizes due to its bagging technique, which aggregates the results of multiple decision trees trained on bootstrapped datasets [68]. Thus, RF has been widely adopted in traffic safety studies due to its strong predictive performance and ability to capture complex relationships [69,70]. To ensure the reliability of our models, we perform 5-fold cross-validation and evaluate classification performance. By training the models separately, we can better understand how factors may differentially affect crash risks for older versus non-older road users.
To compare the effects of the built environment across age groups, we use the same set of features to train separate models for the older and non-older groups. Older adults are generally more vulnerable to traffic risks due to factors such as physical frailty and diminished attentional capacity, making these vulnerabilities a crucial factor in explaining their increased risks. By using the same input variables for both groups, we aim to isolate how these age-related vulnerabilities interact with the street environment, as reflected in the differing effect patterns of environmental indicators on crash risk. This approach avoids potential biases introduced by differing model structures and enables a fair, group-wise comparison. We then apply SHAP values and PDPs to interpret how feature importance and marginal effects vary between the groups, revealing age-specific sensitivities to environmental conditions.

4.3. Interpretable Machine Learning Methods

While machine learning models like RF offer strong predictive accuracy, interpreting the influence of individual variables remains a challenge. Thus, we incorporate interpretable machine learning techniques to explore how different factors influence the classification of traffic risk.
First, we use SHAP to assess the contribution of each feature [71]. SHAP values are grounded in game theory and evaluate the contribution of each feature to the prediction. They are defined as the conditional expectation function of the original model, E [ f ( x ) x S ] , where S denotes the set of indices corresponding to the observed variables, x S represents the observed feature values, and E [ f ( x ) ] indicates the base predicted value when no feature information is known. To approximate E [ f ( x ) x S ] , the SHAP value ϕ j for feature j is defined as follows:
ϕ j = E [ f ( x ) x S { j } ] E [ f ( x ) x S ] = S { x 1 , , x p } { x j } | S | ! ( p | S | 1 ) ! p ! ( f x ( S { x j } ) f x ( S ) )
where p is the number of features, S is a subset of features, and f x ( S ) is the model’s prediction using only the features in S. The global analysis of SHAP is to decompose any prediction into the sum of individual feature contributions, offering an intuitive and fair explanation of feature importance.
However, although global analysis offers insights into overall feature contributions, it does not directly illustrate how individual features influence predictions. Therefore, we also employ local SHAP analysis to examine the variation in each variable’s contribution and to compare the spatial patterns of indicators across different age groups.
Moreover, we also use PDPs to further analyze the marginal effects of individual variables and the interactions between features [72]. Using Monte Carlo approximation, the partial dependence function for feature set A is estimated as follows:
f ^ A ( x A ) = 1 n i = 1 n f ^ ( x A , X C ( i ) )
where n is the number of samples, X C ( i ) represents the remaining features, and f ^ is the trained model. In this research, to capture potential interaction effects between features, we generate two-way PDPs with A = 2 , providing deeper insights into the interaction effect between factors on traffic crash risk.

5. Experimental Results

5.1. Spatial Patterns of Traffic Crashes

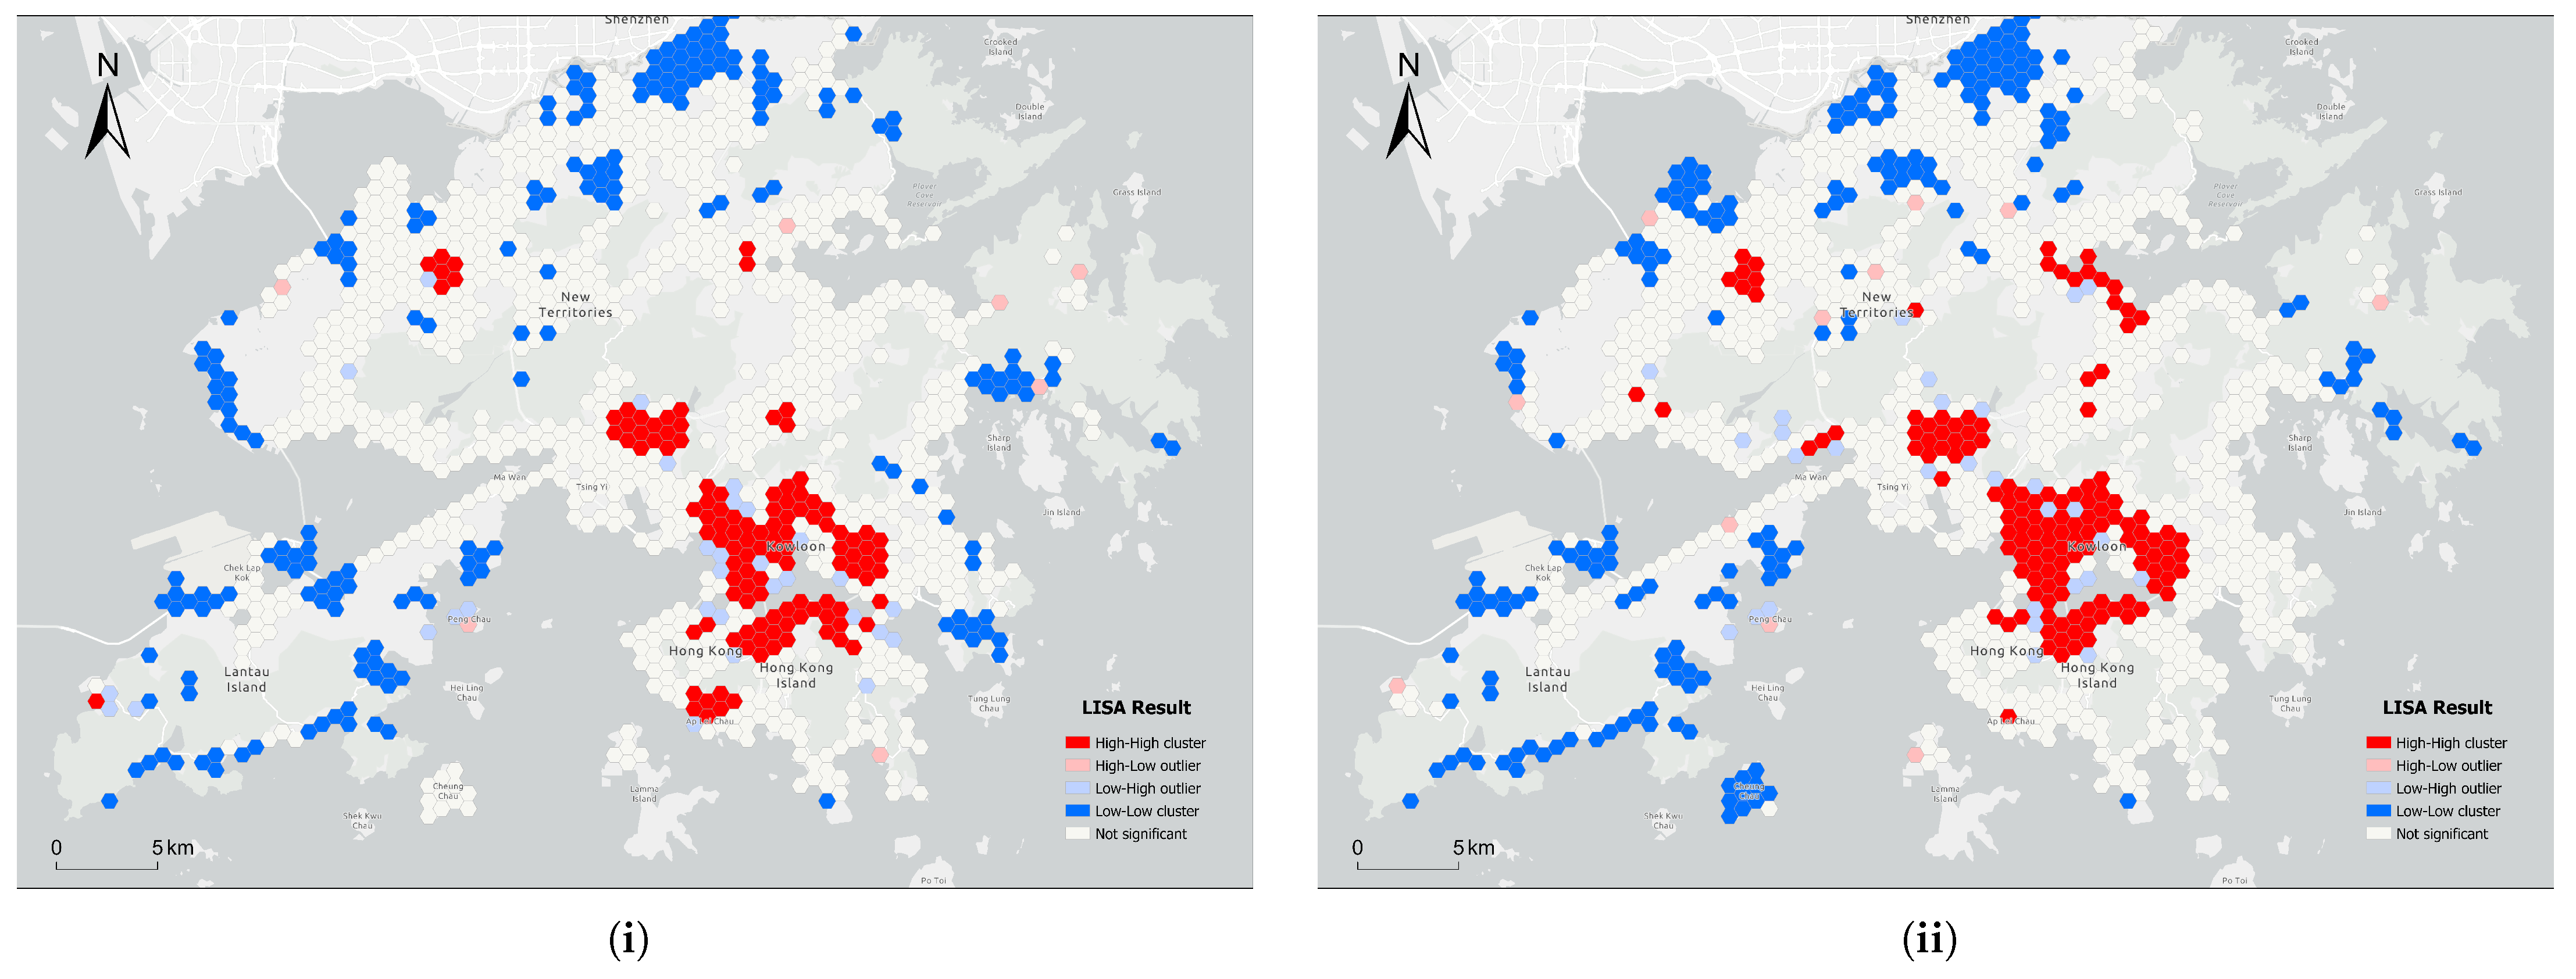
After categorizing the traffic crash dataset into the older and non-older groups based on casualty age, we normalize traffic crash counts into corresponding hexagonal units. Figure 1 illustrates the spatial distribution of normalize traffic crash counts: (i) for the older group and (ii) for the non-older group. Both groups show clear clustering of high-risk areas in Kowloon and the northern part of Hong Kong Island, which are regions known for dense urbanization, high population density, and complex road networks. However, notable differences emerge between the two groups. The non-older group exhibits a broader and more continuous spread of high-risk areas, extending into district fringes and areas adjacent to natural landscapes. This wider distribution is attributed to the greater mobility of the younger population, whereas mobility limitations in aging adults likely constrain their exposure to certain environments [73].
Interestingly, although peripheral areas generally present higher risk to the non-older group, certain isolated units show particularly high risk levels for the older group. For instance, in North District, northern Sai Kung District, and northern Yuen Long District (marked A, B, and C in Figure 1), the older group presents scattered high-risk units amidst surrounding low-risk areas, forming fragmented and spatially discontinuous patterns. This phenomenon may relate to the local built environment, where street designs and environments may inadequately address the safety and mobility needs of aging road users [74]. These observations underscore the importance of separately analyzing road safety for aging adults.
To further quantify spatial patterns, we employ Moran’s I statistic to assess the spatial autocorrelation of normalized crash counts. The results indicate significant spatial clustering for both groups: the older group exhibits a Moran’s I of 0.045 ( p < 0.001 ), while the non-older group shows stronger clustering with a Moran’s I of 0.120 ( p < 0.001 ). These findings are consistent with the visual patterns observed.
Next, we identify local spatial heterogeneity and spatial outliers by applying Local Moran’s I (LISA). As shown in Figure 4, both groups present “high-high” clusters (in red) in urbanized areas and “low-low” clusters (in blue) at the district fringes. The non-older group exhibits a broader distribution of “high-high” areas across Kowloon and northern Hong Kong Island, suggesting that younger individuals possess greater mobility compared to older individuals. This results in a wider range of activities and, consequently, heightened exposure to traffic crash risks. Meanwhile, although the number of “low-low” units is similar between the two groups, their spatial distribution varies. North District has more “low-low” areas for the non-older group, possibly due to a lower proportion of younger residents in rural Hong Kong areas. In contrast, Sai Kung District has more “low-low” areas for the older group, consistent with its lower proportion of elderly residents.

5.2. Modeling Traffic Crashes

We train RF classifiers to predict the crash risk level (low-risk, mid-risk, high-risk) of units, based on a set of 25-dimensional feature vectors. Separate models are built for the older and non-older groups to capture potential differences in influencing factors. To ensure model robustness and generalizability, we perform 5-fold cross-validation. The model for the older group achieves an average overall accuracy of 74.06 % , while the model for the non-older group attains 69.33 % . Notably, the classification accuracy for high-risk areas reaches 79.70 % for the older group and 74.51 % for the non-older group. These performance levels indicate a strong ability to differentiate crash risk levels and provide a reliable foundation for subsequent interpretation of street environmental influences.

5.3. Global Interpretability Analysis

After modeling the traffic crash data, we link SHAP analysis with RF classifiers to establish an interpretable framework. This framework aims to understand the contribution of street environment indicators in shaping crash risk outcomes. We first examine the global contribution of each feature to the model predictions. Global contributions are calculated by averaging the magnitude of SHAP values across all predictions for each class and then summing the results across the three risk classes. This aggregated measure reflects the overall influence of each variable.
As shown in Figure 5i,ii for the older and non-older groups, the top three contributing factors are consistent across groups: number of intersections, population density, and hospital density. However, the detailed effects differ. Hospital density exerts a stronger influence on traffic crashes in the older group compared to the non-older group, with global SHAP values of 0.1380 and 0.0945 , respectively. This disparity becomes even more pronounced when predicting high-risk areas, where hospital density contributes 0.0680 for the older group but only 0.0469 for the non-older group. These results align with previous studies showing that hospital density is positively associated with traffic crashes [36,75], while our analysis highlights its particularly strong influence on aging people. Although the contributions of number of intersections and population density are generally similar between the two groups, their effects also differ when focusing on high-risk areas. Interestingly, the number of intersections contributes more to high-risk predictions for the non-older group ( 0.057 ) compared to the older group ( 0.025 ), whereas population density shows a stronger contribution for the older group ( 0.061 ) than for the non-older group ( 0.047 ). This can be explained by the fact that higher intersection density, while increasing traffic conflict opportunities, also forces vehicles to decelerate, encouraging greater driver caution and benefiting vulnerable road users like aging adults [36]. In contrast, higher population density generally increases crash risk for both groups, but especially for aging adults due to age-related declines in decision-making and hazard detection abilities [76].
Within the top 10 factors ranked by contribution, street environment indicators account for five factors in the older group and four in the non-older group. Figure 5iii highlights the comparison in the ranking of street environment indicators between the two groups. In particular, enclosure, walkability, and crowd attraction rank highly for the older group (fourth, sixth, and seventh), with SHAP values of 0.1191 , 0.0589 , and 0.0577 , respectively. Although these factors also appear in the top 10 for the non-older group, their contributions are significantly lower ( 0.0587 , 0.0439 , and 0.0423 ), indicating that street environment factors are crucial for both models but play an even greater role for aging people. Moreover, two variables demonstrate contrasting effects between groups. Visual complexity significantly contributes to crash risk for the older group (SHAP value = 0.0477) but has a notably lower contribution for the non-older group (0.0375). This suggests that visual complexity has a greater impact on aging individuals, possibly due to the decline in visual abilities associated with aging. Conversely, greenness ranks higher in importance for the non-older group (SHAP value = 0.0494) than for the older group (0.0315). These differences underscore that street environments affect traffic safety differently across age groups.

5.4. Local Contribution Analysis

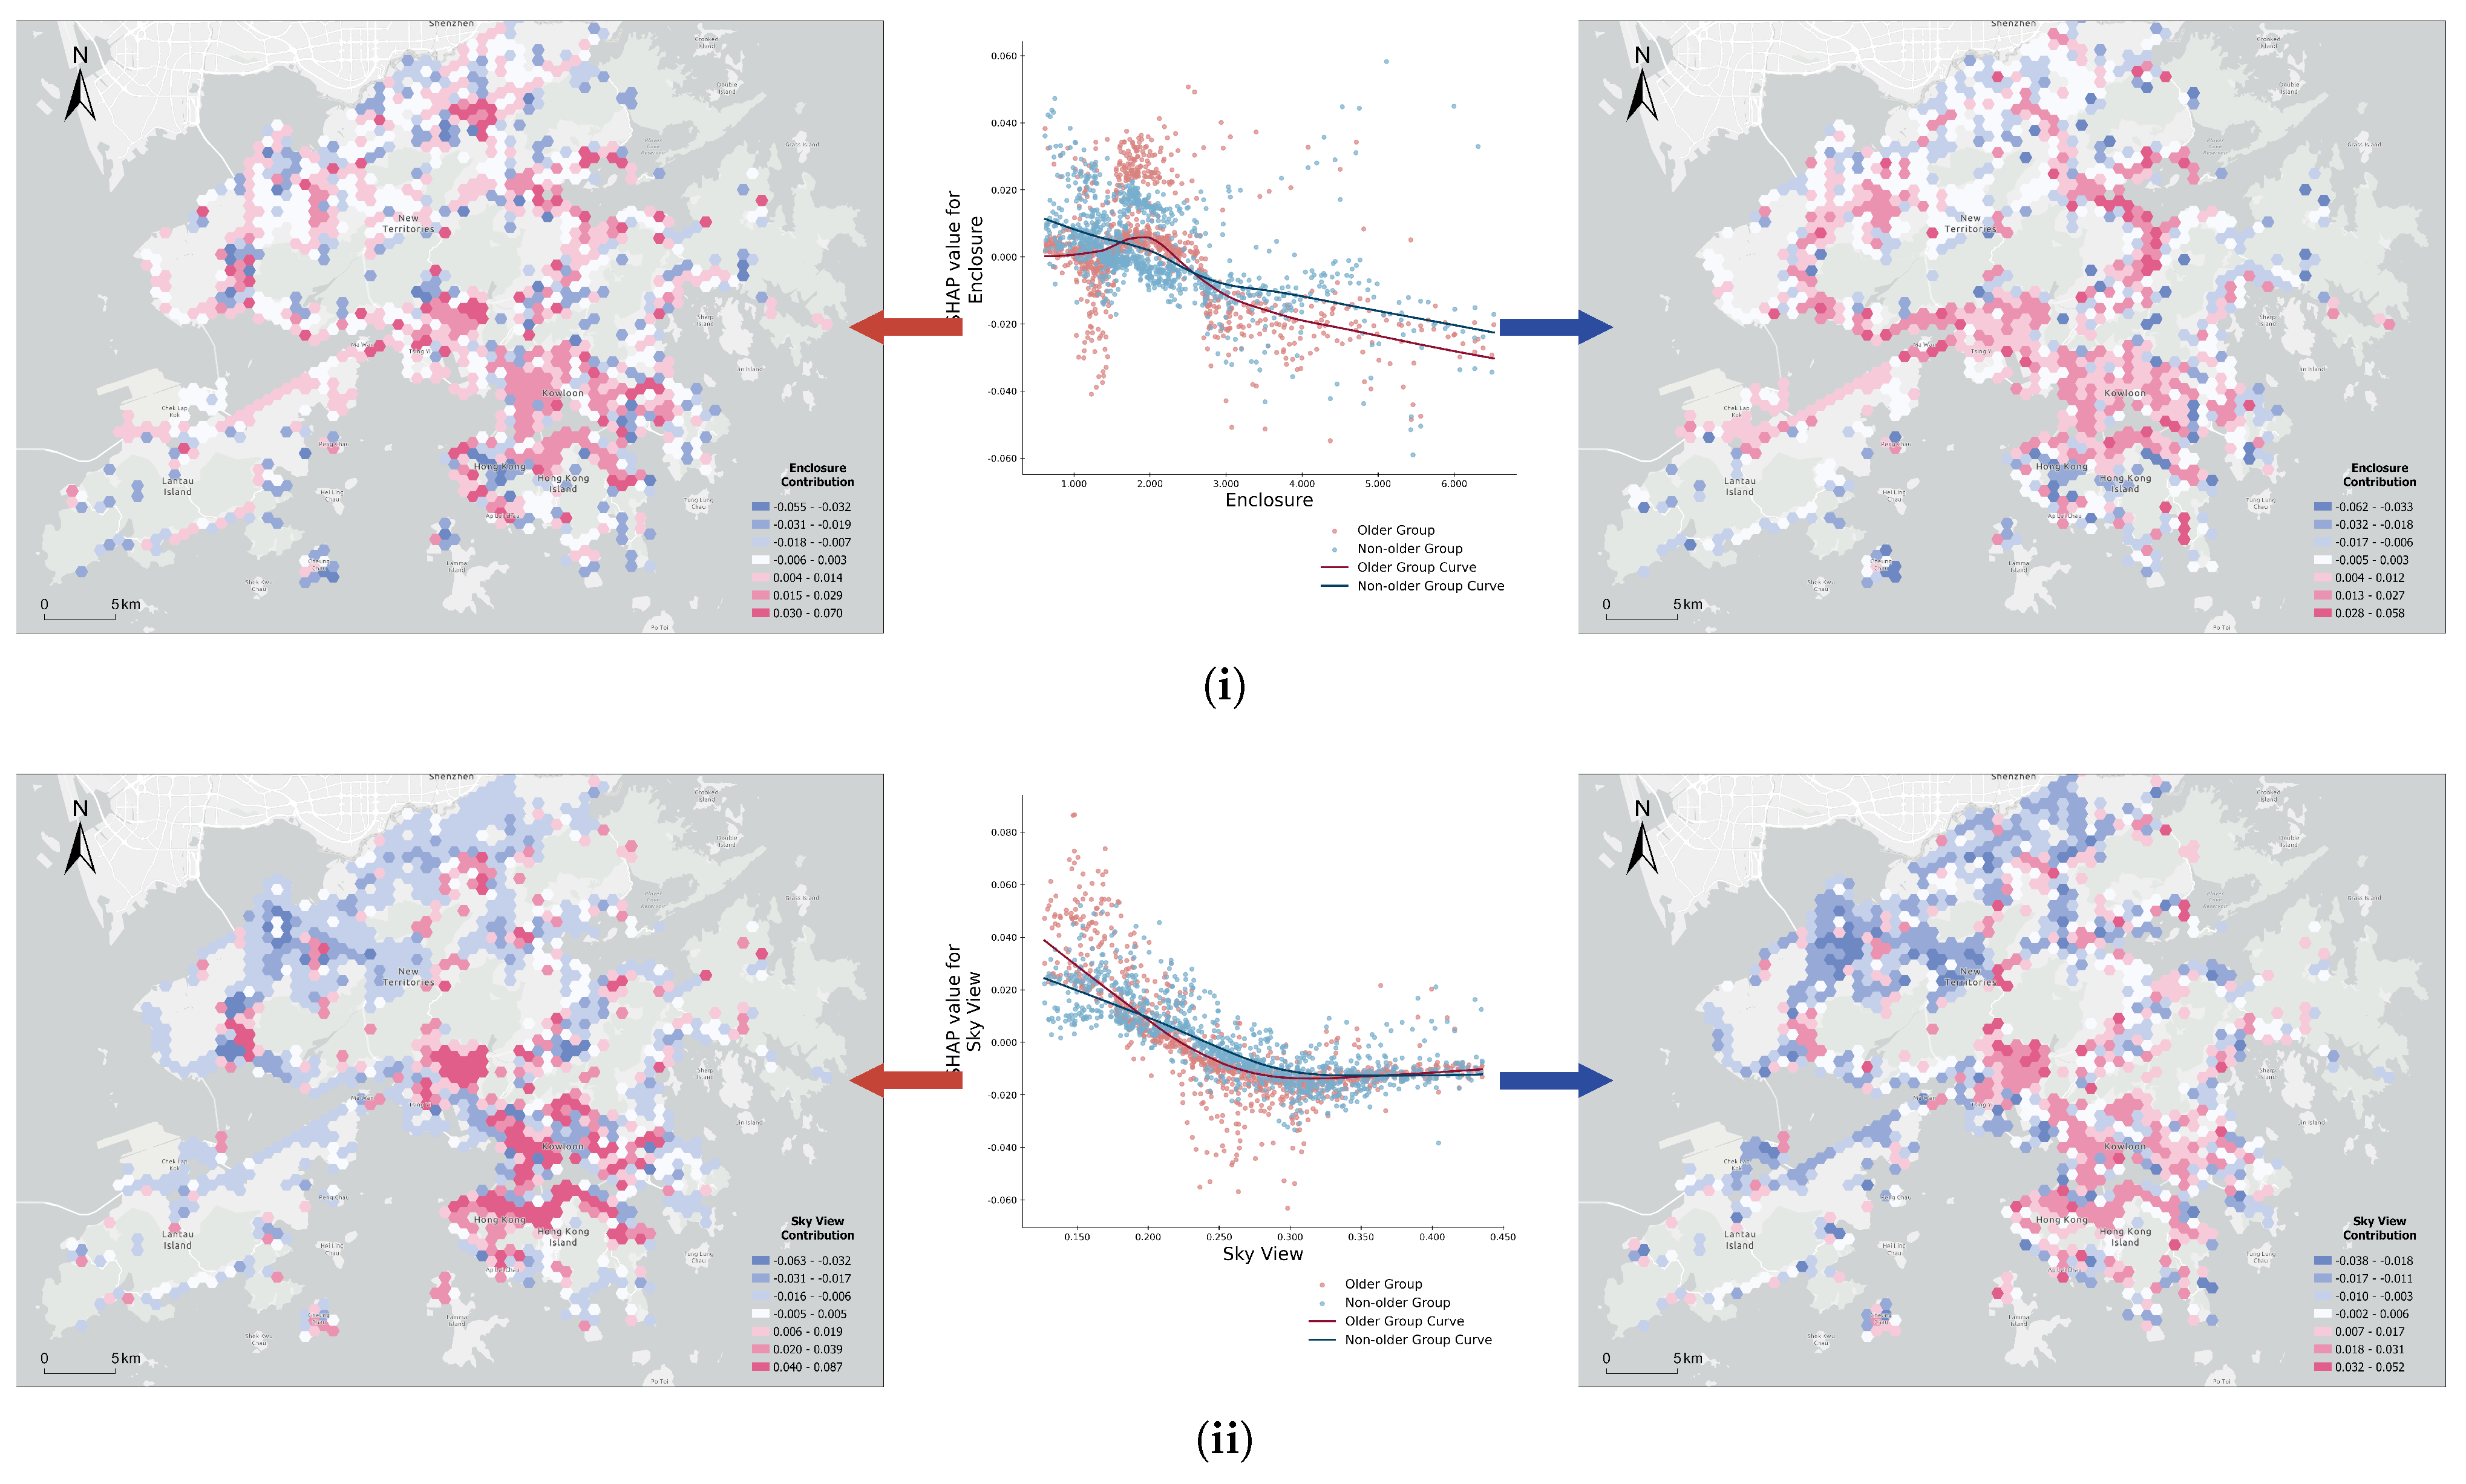
While global SHAP analysis identifies which features are important overall, it does not explain how these features influence crash risk at specific locations or varying feature values. To address this, we conduct local SHAP analysis focused on high-risk level, exploring how the local contributions of street environment variables change with their own values and comparing corresponding spatial patterns between two groups. Our aim is to observe variations in the influence of street environment factors across groups and locations.
Based on their relative local contributions, we categorize six key street environment variables (selected from the top-ranked global features) into three groups: (1) variables showing similar decreasing trends in both groups, (2) variables showing similar increasing trends in both groups, and (3) variables showing different trends between the two groups. We illustrate these patterns through local SHAP plots and spatial distribution maps to reveal spatially nonstationary relationships between street environmental characteristics and traffic crash risk.

5.4.1. Variables with Similar Decreasing Trends

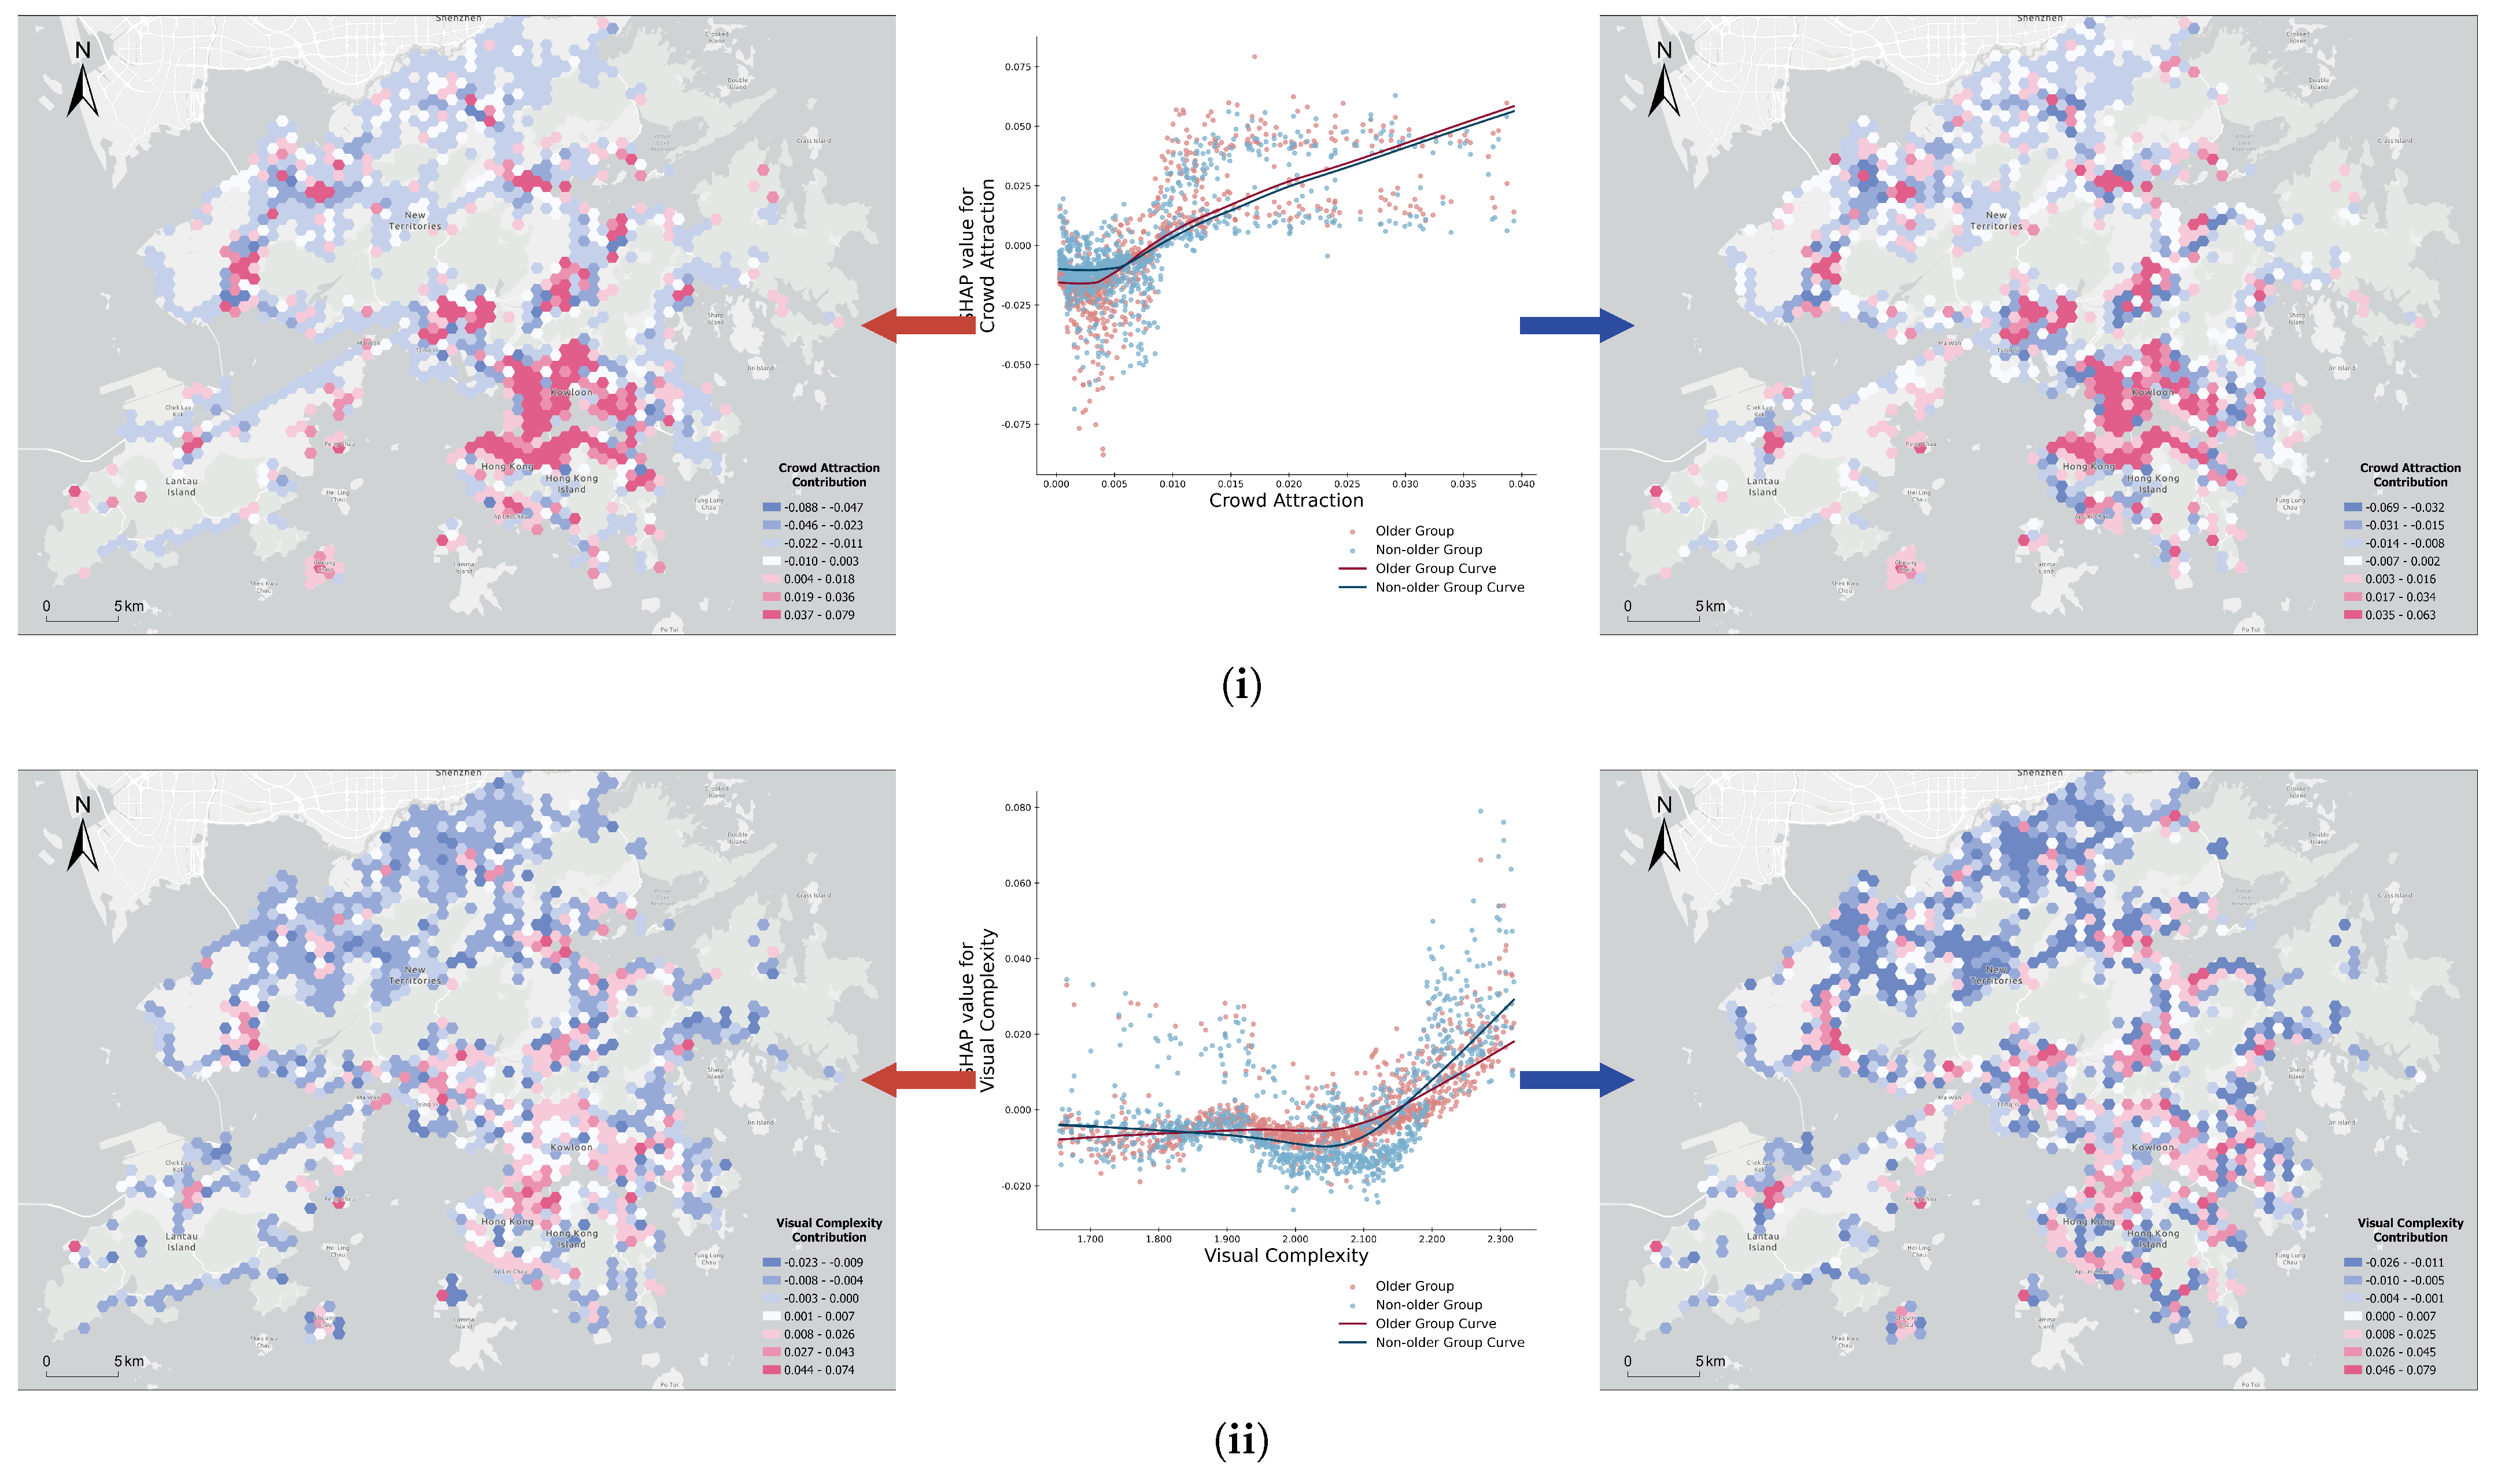
Both enclosure and sky view exhibit decreasing SHAP contributions as their values increase (Figure 6). As enclosure increases, the street environment becomes more physically constrained, with more obstacles and narrower roads, enhancing the complexity and squeezing effect. Despite this, the SHAP values for enclosure shift from positive to negative around a value of 2.0 for both age groups. This suggests that moderately enclosed environments can reduce crash risk, because they encourage drivers to slow down and pay closer attention to their surroundings [77]. In the older group, crash risk initially rises slightly with increasing enclosure before declining. Spatially, the highest positive SHAP values for enclosure among aging adults are concentrated in areas like Yau Tsim Mong District and Kwai Tsing District, where moderately dense buildings create partially enclosed environments; however, in the most densely built areas, such as the core of Yau Tsim Mong District, this positive effect diminishes.
Similarly, sky view shows decreasing trends in both age groups, with SHAP contributions becoming negative beyond approximately 0.2. These trends indicate that larger sky view values, which reflect larger open views in street environments, are associated with lower crash risks. Specifically, spatial analysis reveals that in highly developed areas like Kowloon City District and the northern parts of Hong Kong Island, positive SHAP values for sky view are much higher for the older group. These areas are characterized by dense tall buildings and limited sky visibility, suggesting that a restricted sky view further elevates crash risk for aging people.

5.4.2. Variables with Similar Increasing Trends

Visual complexity and crowd attraction both show increasing SHAP contributions as their values rise (Figure 7). When visual complexity exceeds approximately 2.20, it positively affects crash risk, indicating that highly complex visual environments increase risk for both age groups. Interestingly, in peripheral urban areas such as the northern New Territories, lower visual complexity is associated with reduced crash risk for the non-older group, but this association is not evident in the older group. This is due to age-related declines in visual motion sensitivity, which impair aging individuals’ ability to detect and respond to hazards, even in environments with less complexity [38,40].
In contrast, the effect of crowd attraction is more straightforward. As crowd attraction increases, SHAP contributions in both models rise steadily, exhibiting a similar spatial pattern. This indicates a strong relationship between densely populated street environments and higher traffic crash risk. Crowd attraction complements population density by capturing dynamic population flows in street spaces, underscoring the importance of incorporating real-time population movement instead of relying solely on census figures when analyzing traffic crash risks.

5.4.3. Variables with Different Trends

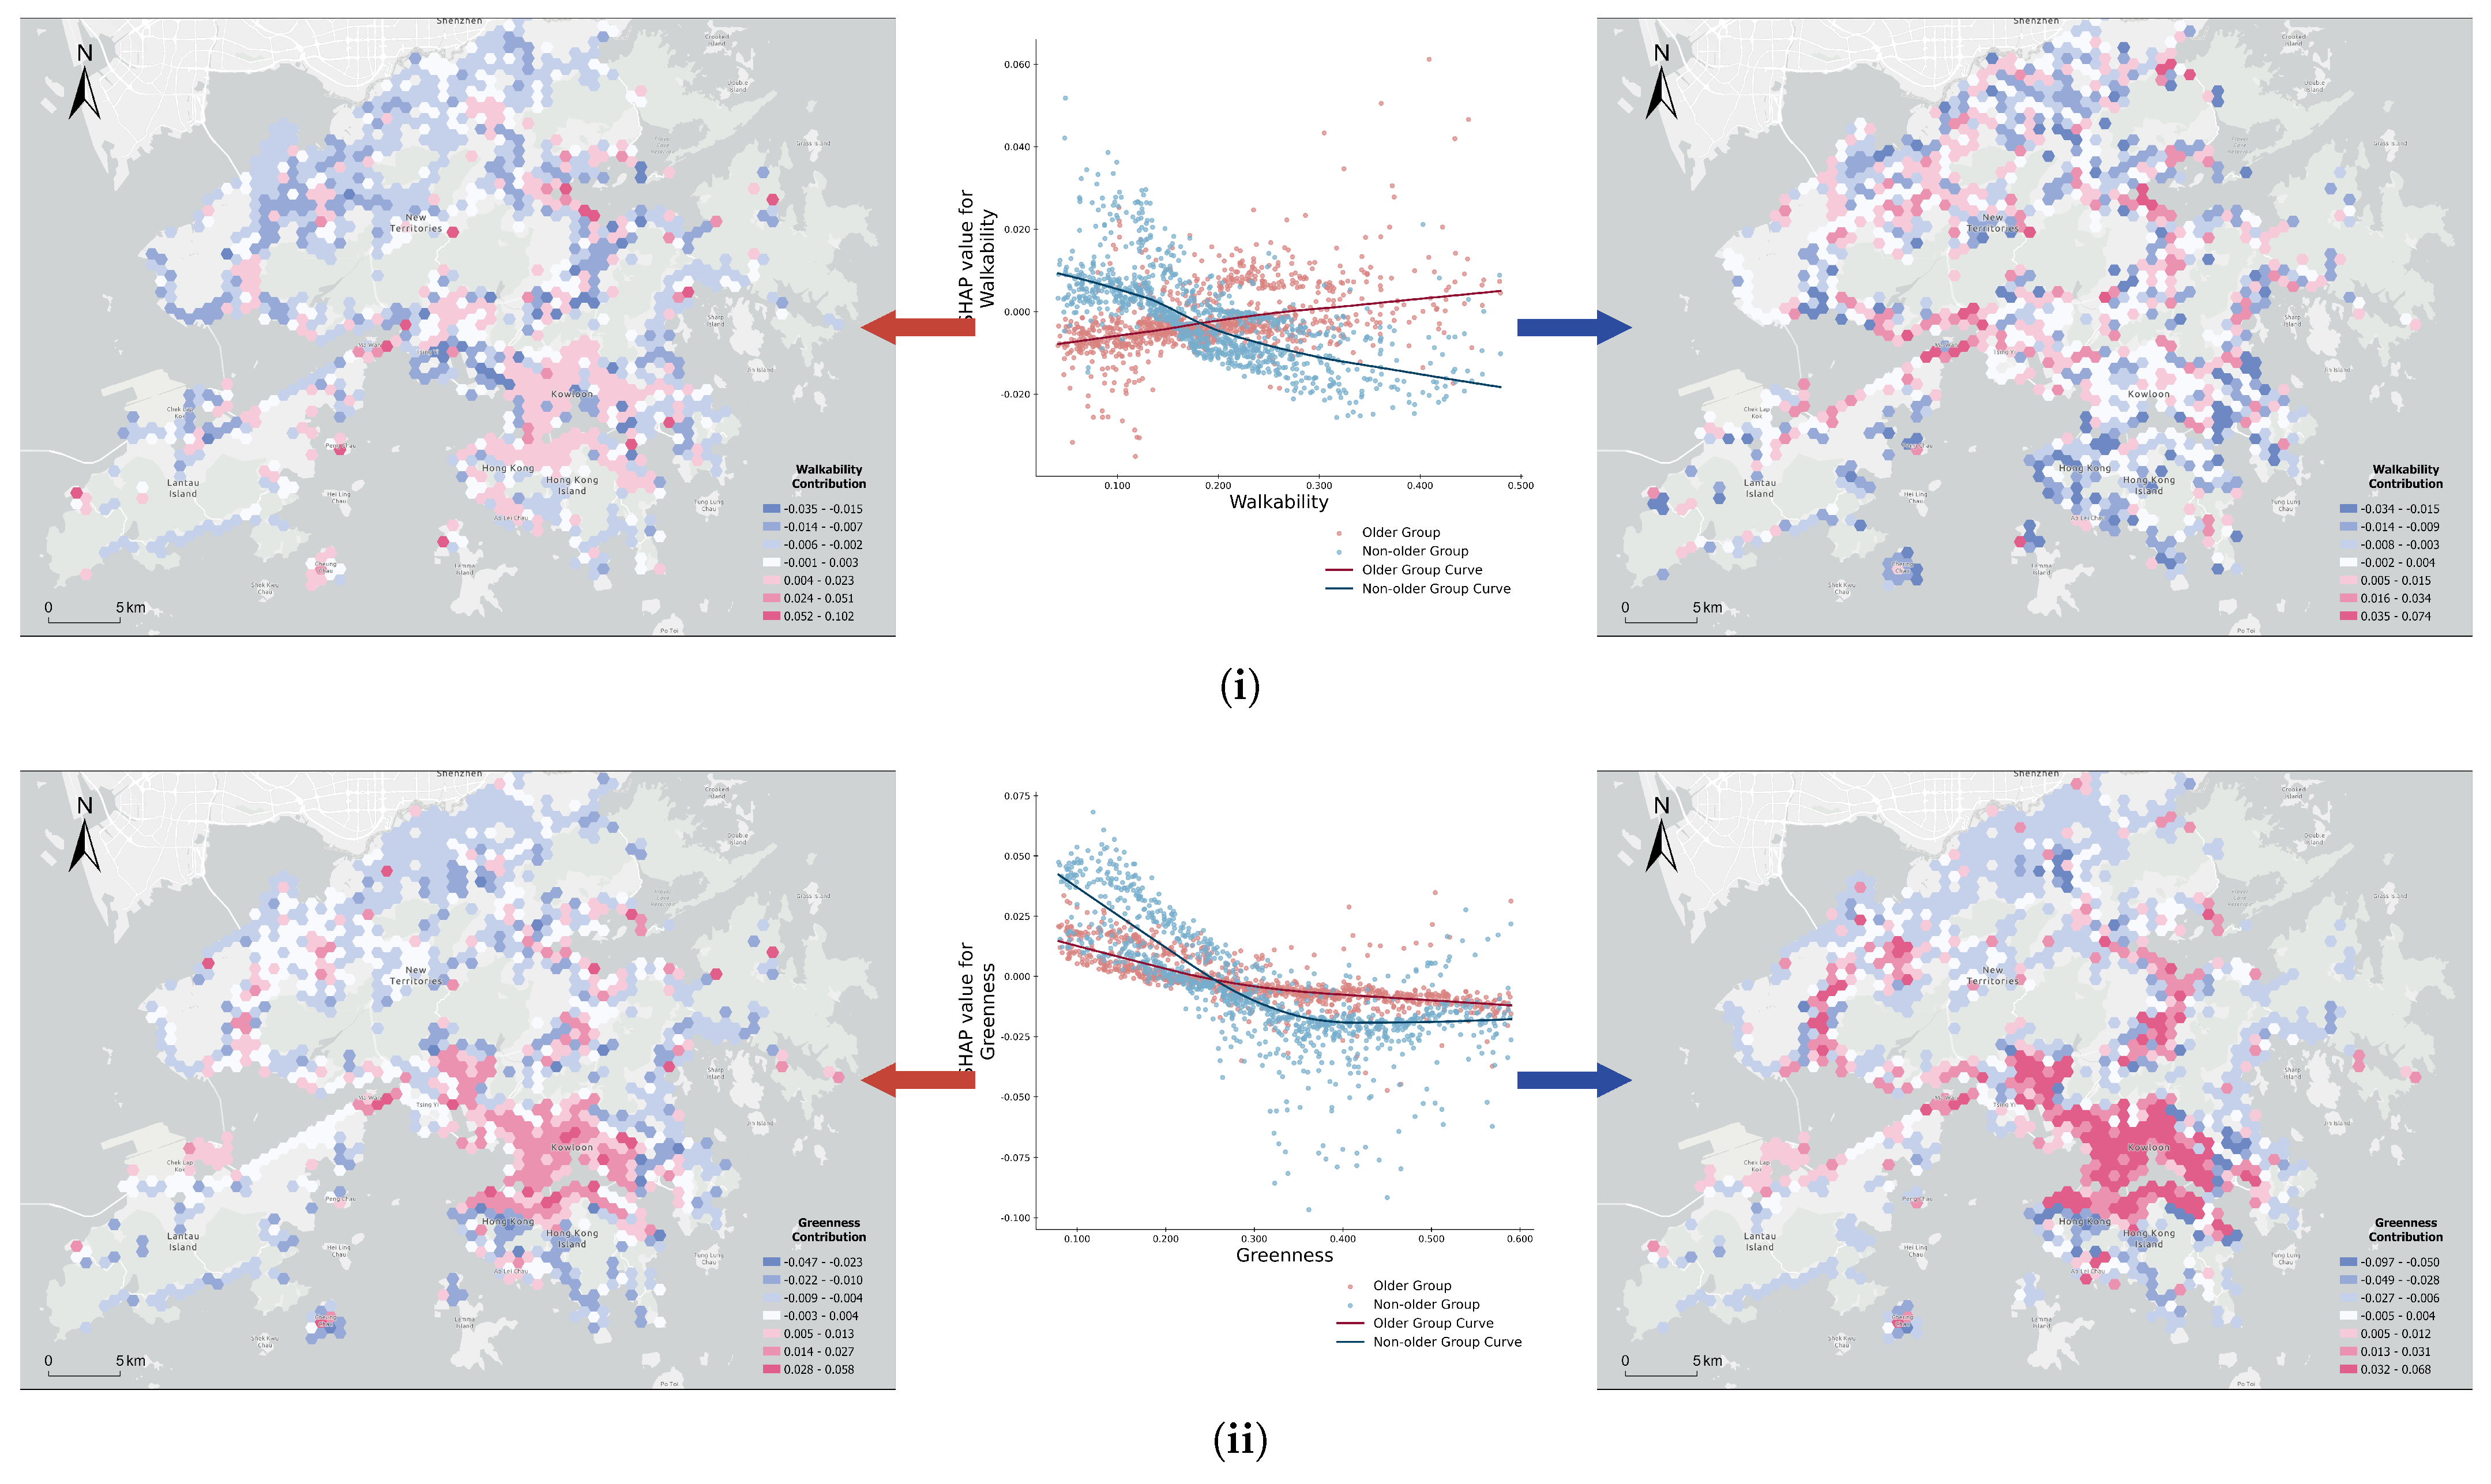
Figure 8 shows that the contributions of walkability and greenness exhibit different trends across age groups as their values increase. As walkability increases, SHAP values become positive at an index of 0.25 for the older group, while they turn negative at 0.15 for the non-older group. This suggests that highly walkable environments, while generally safer for younger people, may paradoxically elevate risks for aging people. Spatially, positive SHAP contributions for aging adults are concentrated in central areas of Hong Kong, including Kowloon and northern Hong Kong Island, whereas such patterns are not observed among younger individuals. These regions tend to have more walkable streets and well-developed road infrastructure, reinforcing the observed trend.
With respect to greenness, both groups exhibit a decreasing trend, with contributions turning negative around a greenness level of 0.25 , although the patterns differ. For the older group, the contribution decreases steadily and modestly, reaching only a slightly negative value. In contrast, the non-older group shows a rapid initial decline, followed by a consistently more negative contribution beyond a greenness level of 0.35 . Interestingly, at low levels of greenness, the risk of traffic crashes is higher for the non-older group, because younger people have more traffic behaviors in dense urban areas with limited vegetation, such as city centers [78]. However, as greenness increases, younger people experience a more pronounced reduction in risk, potentially due to active engagement with green spaces that supports their mobility and spatial awareness. Aging people, on the other hand, may not fully benefit from green environments due to mobility limitations and reduced cognitive or visual perception, which may dampen the safety-enhancing effects of greenery.
In summary, our local SHAP analysis reveals not only the varying influence of key street environment indicators on crash risk, but also the differences in spatial distribution of their contributions across areas. Importantly, the effects differ significantly between older and non-older groups, underscoring the necessity of age-sensitive urban design and intervention strategies. Because of the complexity of these relationships, we next explore the interaction effects between multiple street environment indicators, to better understand how combinations of features jointly influence crash risks.

5.5. Interaction Effect Analysis

While SHAP values inherently capture both main effects and higher-order interactions, they do not isolate specific pairwise interactions between street environment indicators. Therefore, we additionally apply two-way PDP analysis to explicitly examine interaction effects between key indicators. Although PDP is limited in capturing complex high-order interactions and relies on model fitting, combining it with SHAP enhances interpretability and provides a more focused assessment of interaction effects [20,79]. In our results, we observe consistent general trends of individual features across both SHAP and PDP analyses. This cross-method agreement supports the interpretability and reliability of our interaction effect analysis.
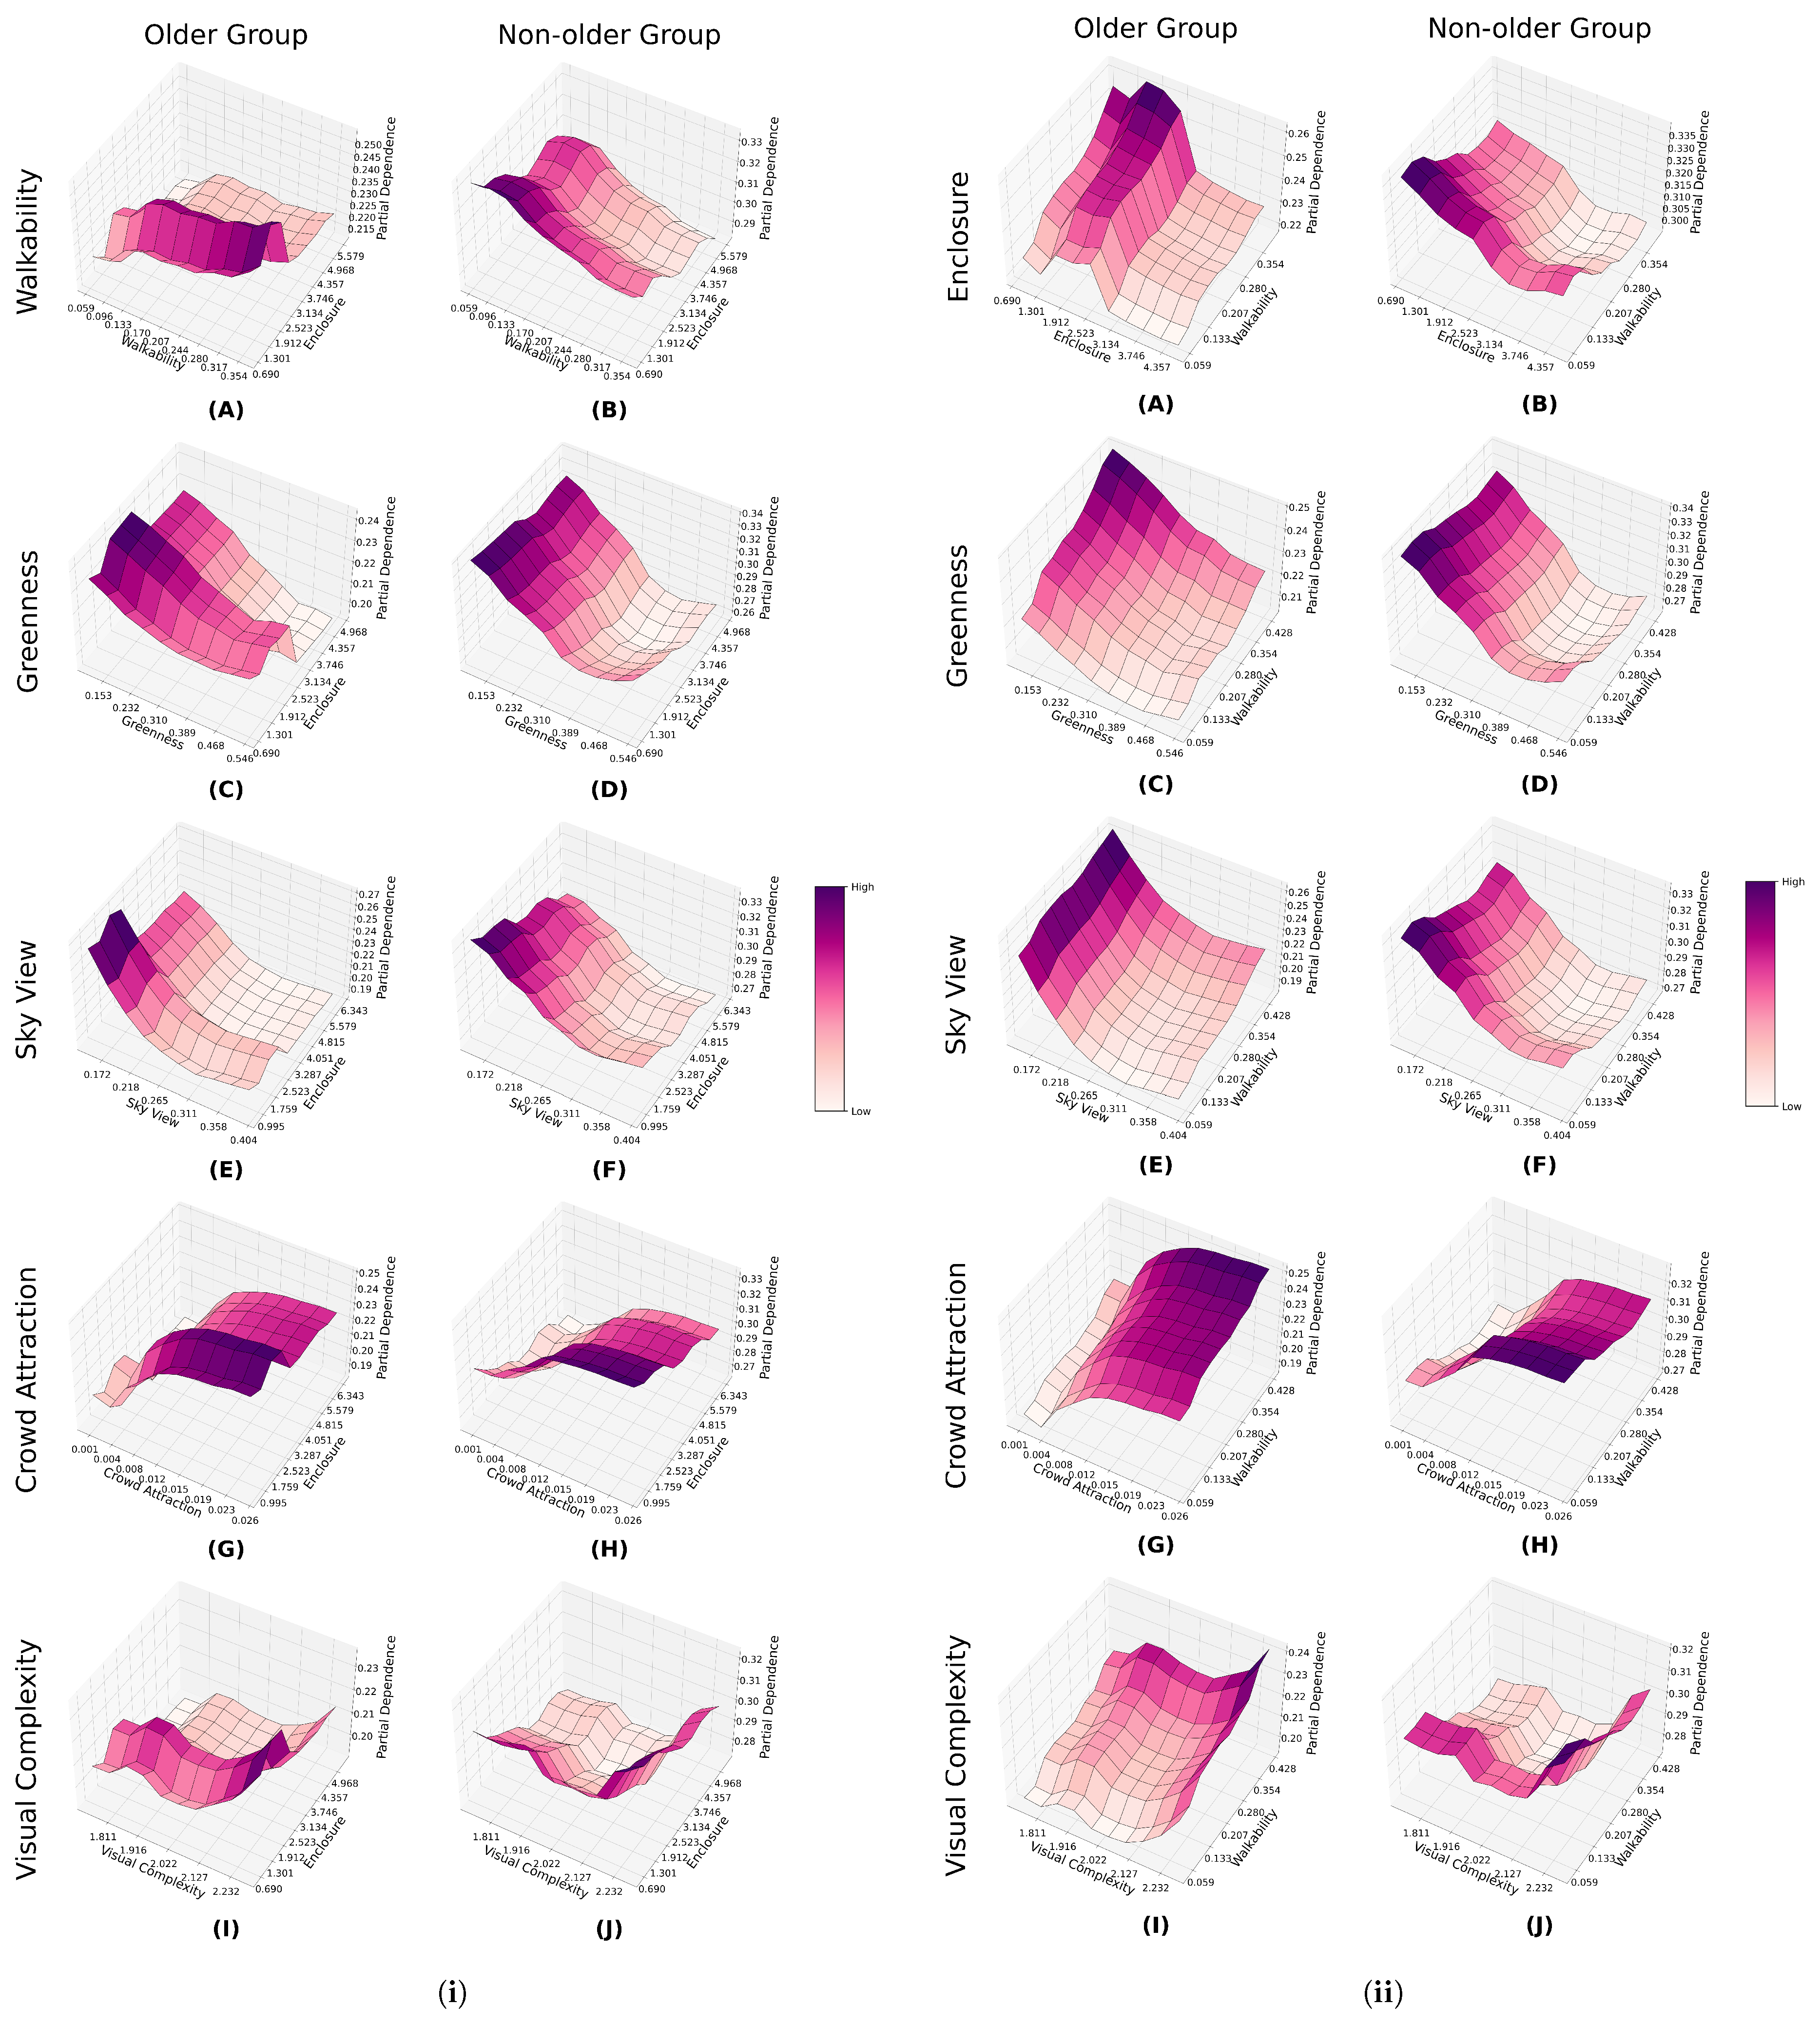
Relying on two-way PDP analysis, our aim is to reveal how the prediction of high-risk areas varies with the interaction between pairs of key indicators. We focus on two top-contributing indicators, which are enclosure and walkability, and examine their interactions with other variables. As shown in Figure 9, light-pink intervals represent the lowest partial dependence values, indicating minimal risk of traffic crashes at those levels, whereas dark-purple intervals denote the highest values, corresponding to higher crash risk.
Enclosure shows synergistic effects with greenness (Figure 9(iC,iD)), suggesting that increased greenery can amplify the negative impact of enclosure on traffic risks. In contrast, enclosure shows antagonism with crowd attraction (Figure 9(iG,iH)), because densely populated streets intensify cognitive load and reduce visual openness, undermining the benefits of enclosure. Interestingly, enclosure interacts differently with walkability and visual complexity across age groups. In the non-older group, enclosure shows strong synergism with walkability (Figure 9(iA)), suggesting that enclosed and pedestrian-friendly streets both slow vehicles and promote attentiveness, thereby improving safety. However, for aging adults, this interaction shifts toward moderate antagonism (Figure 9(iB)). In this case, the safety benefits of higher enclosure are reduced or even reversed due to their increased traffic exposure in more walkable areas and age-related challenges in maintaining attention [6,80]. With visual complexity, enclosure again shows different interaction effects, as shown in Figure 9(iI,iJ). For aging individuals, the interaction is antagonistic, confirming that complex street environments reduce traffic comprehension and heighten this reduction in enclosed settings [5,81]. Conversely, for younger people, moderate levels of both enclosure and visual complexity lead to the lowest crash risk, reflecting a balance of contributions between an enclosed street environment and stimulating visual information.
Walkability shows similar antagonistic interactions with greenness and sky view as a factor in the older group, whereas such interactions are largely absent in the non-older group, as shown in Figure 9(iiC–iiF). This suggests that visual openness and greenery can mitigate the increased risk that results from heightened traffic exposure in highly walkable environments for the elderly by reducing psychological stress and enhancing their ability to interpret and navigate the surroundings. Additionally, walkability shows complex interactions with visual complexity, which is shown in Figure 9(iiI,iiJ). For aging people, these variables interact synergistically, suggesting that increased traffic exposure combined with reduced environmental comprehension amplifies crash risk. In contrast, for younger people, moderate levels of both walkability and visual complexity are linked to the lowest crash risk, whereas the combination of low walkability and high visual complexity corresponds to the highest risk.
Overall, these results highlight the importance of considering interaction effects in urban street design. While walkability and enclosure offer potential safety benefits, their impact varies substantially by age group and is strongly influenced by other environmental attributes.

6. Discussion and Conclusions

As the global population continues to age, understanding the unique risks faced by aging people becomes increasingly vital for developing inclusive and age-friendly cities. While prior studies have identified various factors contributing to traffic risks faced by aging people, relatively few have examined how the street-level environment influences these risks. In this study, we applied interpretable machine learning methods to examine how street environment indicators influence traffic crashes across age groups, with a particular focus on the differential impacts on older versus non-older population. Spatial analysis reveals that high-risk areas for older group are more scattered and less spatially clustered compared to those for non-older groups, due to age-related differences such as reduced mobility and slower reaction times. Even under similar street conditions, aging people face different levels of risk, emphasizing the need for age-specific analyses when exploring the link between traffic safety and the streetscape.
Our SHAP analysis identifies intersection density, population density, and hospital density as the top predictors for both groups. Notably, population and hospital density contribute more strongly to crash risk for aging people, particularly in high-risk areas, underscoring that their heightened vulnerability increases their susceptibility to harm in complex environments [36,75]. The consistently high contributions of street environment indicators in both models highlight their central role in shaping traffic crash risk. Most indicators have an even greater impact in the older group than in the non-older group, showing the greater sensitivity of aging people to the street environment.
Focusing on specific indicators, as summarized in Table 1, we categorize indicators into three groups based on their contribution trends, turning points, and key impact areas. First, enclosure and sky view exhibit consistent decreasing contributions in both groups, suggesting that enclosed environments and greater visual openness reduce crash risks. Second, crowd attraction and visual complexity show increasing trends across both groups, indicating that dense and visually complex street environments enhance crash risks. Third, walkability and greenness show divergent trends. For aging individuals, increased walkability steadily raises crash risk, while it decreases for younger individuals. The increase in greenness is associated with a continuous reduction in crash risk for aging individuals, whereas for the non-older group, the risk drops rapidly before stabilizing at a steady negative contribution. Even in cases where contribution trends are similar, their spatial distributions often diverge, highlighting the need to examine both the similarities and differences in how street environments influence traffic crash risk across age groups.
Beyond individual effects, we explore interaction effects between key indicators using two-way PDPs. We focus on enclosure and walkability, the top-ranking indicators for both groups. Enclosure shows synergism with greenness, which amplifies its risk-reducing impact, while its benefits are reduced when combined with high crowd attraction, showing antagonism. However, the interaction between enclosure and walkability varies by age. For the non-older group, these two features together enhance safety by lowering speed and increasing attentiveness, while for the older group, this interaction turns antagonistic due to greater traffic exposure and heightened vulnerability in walkable yet enclosed settings. Moreover, walkability interacts antagonistically with greenness and sky view among aging people, suggesting that increasing greenery and visual openness can help counterbalance the increased risks associated with walkable environments. Meanwhile, visual complexity exhibits a distinct pattern. In the non-older group, medium levels of complexity consistently minimize crash risk when combined with other indicators. In contrast, among aging individuals, higher visual complexity consistently amplifies risk, reflecting challenges related to declining visual acuity and reduced attentional capacity [6,44].
Overall, our findings confirm that the street environment plays a pivotal role in shaping traffic safety outcomes and its effects are strongly age-dependent. Aging people face heightened crash risks due to greater sensitivity to environmental conditions, whereas younger individuals tend to benefit from walkability and moderate levels of environmental complexity. These insights highlight the need for age-friendly street design that balances safety, exposure, and environmental complexity to create safer and more inclusive cities for everyone.

6.1. Effects of Street Environment Indicators

Street environments play a crucial role in shaping patterns of human behavior and movement, thereby significantly affecting road safety [15]. Building on this, our study derives indicators of street visual quality from segmentation results of SVIs and explores their influence on traffic crashes.
Our SHAP analysis shows that street environment indicators have a strong influence on crash risk, especially for aging people. This supports previous findings that aging people are more vulnerable to environmental deficiencies due to age-related declines in mobility, vision, and attentiveness [33,55]. Notably, our indicators derived from aggregated segmented SVIs demonstrate greater predictive power than those based on individual segmentation categories used in previous studies. The improved performance underscores the advantage of transforming raw segmentation outputs into interpretable indicators, which better capture the characteristics of urban street environments by addressing redundancy among homogeneous visual categories in the training set.
Among all environmental indicators, enclosure emerges as the most influential, with a generally negative contribution to crash risk in both groups. This aligns with prior findings suggesting that physical barriers like buildings or walls, although visually obstructive, can enhance safety by forcing drivers to reduce speed and increase vigilance [77,82]. However, this protective effect is less consistent for aging people. For them, moderate levels of enclosure may raise crash risks by limiting their visual motion sensitivity and situational awareness [41]. This is reflected in the spatial clustering of higher positive SHAP values for enclosure in central Hong Kong. Sky view, which reflects the visual openness of the street environment, also shows a decreasing trend in contribution to traffic risk across both age groups. This trend is consistent with previous studies suggesting that higher sky visibility improves observational conditions, enhancing pedestrian and driver awareness [11,53]. Yet again, the spatial patterns differ: streets with limited sky view pose greater risks for aging people, confirming that visual openness is especially vital for people with diminished visual acuity and attention [1,83].
In contrast, both visual complexity and crowd attraction exhibit increasing trends in their contributions to crash risk. Visually complex and densely populated streets are known to overload cognitive processing, reducing the ability to respond quickly in emergency situations [32]. Thus, for the older group, positive contributions to traffic risks concentrate more in specific areas with marked street features like Central District and Kowloon City District. These spatial differences reveal a key insight: while general trends may appear similar across age groups, the impact of the street environment is more spatially pronounced and clustered in the older group.
Walkability and greenness show divergent trends across age groups. Higher walkability in street environments encourages greater use by aging people, thereby increasing their exposure to traffic hazards [84]. Meanwhile, walkable areas typically feature more intersections, complex crossings, and frequent interactions between vehicles and pedestrians [85,86]. These features raise crash risks for aging people, who may struggle with slower walking speed, reduced balance, and other age-related challenges. Our findings align with previous studies showing that higher walkability is associated with increased traffic crash and injury risk for aging people [87,88]. However, for the non-older group, our results show lower walkability is linked to a higher risk of traffic crashes, providing further evidence of the inconsistent effects of walkability reported in previous studies [82].
As for greenness, higher levels are significantly associated with reduced crash risk, but the trends differ between the two groups. Two key mechanisms may explain this pattern. First, road greenery increases people’s attention to traffic conditions, especially for drivers [78,89]. Second, street environments with more greenery are commonly situated away from urban regions with fewer residents [11,53]. Together, these factors help explain why younger individuals experience a more substantial reduction in crash risk. But for older group, the decreasing trend in greenness is steady but modest. While green environments are generally beneficial, aging people may not be able to fully utilize or engage with them due to mobility limitations and reduced visual and cognitive perception. As a result, the reduction in risk is less dramatic for them.
In summary, although we use the same features and modeling process for both age groups, the contribution patterns and spatial distributions of environmental indicators differ. These differences suggest that age-related decline influences how the street environment affects traffic crash risks. For example, due to sensory deterioration, older adults benefit less from enclosure but gain greater protection from sky view factors than younger individuals. Similarly, the reduced protective effect of greenness and the amplified risk associated with higher visual complexity highlight the attentional and cognitive challenges faced by the aging population. These findings support our interpretation that aging adults have a higher crash risk due to age-related declines in seeing, understanding, and reacting to their surroundings environments. Moreover, while some indicators show consistent overall trends across groups, their spatial patterns of contribution differ, which also reflect the greater environmental sensitivity of aging people. These findings emphasize the need to consider both global and spatially heterogeneous effects of street environments when designing age-friendly traffic safety interventions.

6.2. Interaction Effect Analysis

Prior studies have focused mostly on the main effects of each factor, but few have explored how different features of the street environment interact with each other. In this study, we go further by analyzing how key factors interact to influence crash risk. Specifically, we explore interactions involving two top-contributing factors: enclosure and walkability. In the non-older group, both show intricate interactions with visual complexity, where crash risk is lowest at moderate levels of visual complexity. This suggests that moderate levels may enhance attention among younger people, whereas excessive complexity may be overstimulating and a lack of complexity may offer insufficient cues, both of which can undermine safety [32]. In contrast, older adults experience a continuous rise in traffic risk due to the interaction effect as visual intricacy increases. This reflects age-related vulnerability to complex visual conditions, which limit their ability to extract helpful cues from busy environments [90].
We also find that enclosure has strong synergistic interactions with both greenness and sky view. These natural features appear to reduce the mental stress of confined spaces and enhance attentiveness, strengthening the protective effect of enclosure [89]. Notably, greenness and sky view also reduce the higher exposure-related risk of walkable environments among older adults. This effect is not seen in the non-older group. In highly walkable environments, greater exposure and navigation challenges increase crash risks for older adults, but greenery and open views enhance their safety by playing a stronger compensatory role, confirming that aging populations are more sensitive to street environments.
In summary, our analysis of interaction effects reveals that multifaceted improvements to the street environment can significantly enhance traffic safety beyond what can be achieved by modifying individual features alone, especially for the aging population.

6.3. Research Contribution

Addressing the growing concern of traffic safety among older adults, this study presents new evidence on how street environments differentially impact age groups. While previous research has emphasized the general influence of the built environment on traffic crashes, our work goes further by specifically examining fine-grained street-level characteristics and their varying effects on older and non-older populations.
Our findings reveal not only the heightened risk faced by aging people but also the greater sensitivity of this group to environmental complexity. This highlights the need to address the specific vulnerabilities of aging adults in urban design. Moreover, we identify distinct street environment indicators that contribute to crash risks, and show how their effects differ by age. By comparing these differentiated impacts, we highlight the need for age-sensitive design guidelines that respond to the specific needs of aging people. Additionally, in contrast to previous studies that examine street environment effects in isolation, we reveal how these effects vary spatially by age group and how different environmental factors interact in influencing crash risks. By unpacking how street features intersect with age-related vulnerabilities, this study offers actionable guidance for urban planners and policymakers aiming to build safer, more inclusive transport environments.

6.4. Policy Implication

This study offers several practical implications for urban planning and design regulations aimed at improving road safety for older adults. First, while walkability generally enhances safety for younger people, our findings show it may increase exposure and potential danger for aging people. This highlights the need for walkability guidelines to be age-sensitive, and road design regulations should also incorporate age-friendly measures in areas with high walkability, including those with wide sidewalks and extended pedestrian refuges. Specifically, walkable areas should also implement age-friendly tools such as designated safe passageways and reduced speed limits to significantly enhance safety for aging people [36]. Second, increasing sky view and greenness was found to reduce crash risk across all ages, with especially strong protective effects for the elderly in high-traffic-exposure scenarios. To support these benefits, planning guidelines should promote skyline openness through appropriate building height-to-street width ratios and incorporate more green or open spaces between structures [7]. Third, visual complexity was shown to increase traffic risk among older adults and diminish the effectiveness of other safety features. To mitigate these risks, urban regulations should limit unnecessary visual stimuli, such as excessive billboards and unrelated signage, especially in areas with high pedestrian activity among the elderly. Furthermore, road design regulations should recommend additional age-friendly interventions in visually complex settings, such as large-font traffic signs, audible crossing signals, and clear path markings [91].
In summary, planners and traffic engineers should prioritize the identification of high-risk environments for aging people, such as areas with low greenness, reduced sky view, or high visual complexity, and implement targeted protective features [92]. Creating age-friendly streets requires a nuanced approach that considers both environmental design and the diverse needs of urban populations.

6.5. Limitations and Future Work

One key limitation of this study lies in the robustness of the underlying data. While the crash dataset used is official and was collected through a standardized reporting system over a five-year period, which provides a solid foundation for our spatial and age-specific analysis, it still presents certain limitations. These include the potential underreporting of minor incidents and occasional imprecision in location information, which may introduce bias into the results. In addition, the SVIs used to extract street environment features may not always be up to date. In rapidly evolving or underrepresented urban areas, outdated imagery can limit the accuracy and timeliness of the extracted environmental indicators. This temporal mismatch may compromise the reliability of environmental representations used in the analysis. To overcome these limitations, future studies should combine diverse data sources and evaluate findings across multiple sources for comparison. In particular, field observations and structured surveys can help capture personal experiences and perceptions of road safety, especially among aging populations. These methods enable researchers to capture heterogeneity within the aging population, including variations in physical condition, sensory perception, and mobility, which may influence crash vulnerability in different ways. For example, the traffic behaviors of a 60-year-old individual can differ significantly from those of someone who is 90 years old. Moreover, video footage captured during actual travel could provide richer and real-time representations of the street environment, which helps to validate SVI-based indicators. By combining manual data collection with large-scale geospatial datasets, future work could improve accuracy, contextual sensitivity, and policy relevance in traffic safety research.
Another limitation concerns our reliance on model fitting. Our models achieved strong predictive performance, which supports the reliability of our interaction analysis. While our approach effectively captures nonlinear associations between the street environment and crash risks, it lacks the strict causal analysis of other frameworks. Unfortunately, the resolution and granularity of our current dataset constrain our ability to apply causal inference methods. In future work, we aim to collect higher-resolution crash data with more contextual variables to enable causal analysis using techniques such as causal machine learning.

Author Contributions

Conceptualization, Ketong Shen and Jian Liu; methodology, Ketong Shen and Jian Liu; validation, Ketong Shen; formal analysis, Ketong Shen; investigation, Ketong Shen, Jian Liu, and Xintao Liu; resources, Xintao Liu; data curation, Ketong Shen; writing—original draft preparation, Ketong Shen; writing—review and editing, Ketong Shen, Jian Liu, and Xintao Liu; visualization, Ketong Shen; supervision, Xintao Liu; project administration, Xintao Liu; funding acquisition, Xintao Liu. All authors have read and agreed to the published version of the manuscript.

Funding

This research was funded by the RGC Research Impact Fund (PolyU as PC) (R5011-23).

Data Availability Statement

The dataset is available on request from the authors.

Conflicts of Interest

The authors declare no conflicts of interest.

Appendix A. Factor Information

Table A1. The neighborhood environmental variables and definitions.
VariablesDescriptionReferences
Socio-
demographic
Factor
Population densityNumber of residential population per km2[37,93]
Gender ratioThe ratio of the number of males per 1000 females
Proportion of childrenThe proportion of people who are under 15 years old (%)
Proportion of elderlyThe proportion of people who are aged 65 or above (%)
Education levelThe proportion of people whose highest level of education attended is post-secondary (%)
Median incomeThe median of monthly domestic household income (HK$)
House priceMedian monthly domestic household rent (HK$)
Land Use
Factor
IndustryProportion of industry land use areas[12,29,37,55,94]
ResidentialProportion of residential land use areas
CommercialProportion of commercial land use areas
GovernmentProportion of government land use areas
Open spaceProportion of open space land use areas
Land use diversityDiversity level of land use using Shannon Entropy; C is set of all land use categories, and D i means density of ith category:
Land - use Diversity = i C D i l n ( D i )
Density
Factor
Number of intersectionsNumber of intersections in the hexagonal unit[57,58]
Urban furnitureThe average number of street furniture (e.g., traffic light, street light, pole) observed across all street views in the hexagonal unit
HospitalNumber of hospital POIs in the hexagonal unit
ShopNumber of shop POIs in the hexagonal unit
PublicNumber of public infrastructure POIs in the hexagonal unit
Table A2. The street environmental variables and definitions.
VariablesDescriptionReferences
Water viewThe pixel ratio of water view in the SVIs:
Water view = P water + P sea + P bridge
Sky viewThe pixel ratio of sky in the SVIs P sky [32,33,55]
GreennessThe visible vegetation in the SVIs captures the green view:
Greenness = P tree + P plant + P grass + P palm
EnclosureHow the street environment shapes pedestrians’ sense of confinement:
Enclosure = P building + P tree P road + P pavement + P fence
[20,67]
WalkabilityHow well the street environment supports and encourages walking by being accessible and pedestrian-friendly:
Walkability = P pavement P road
Crowd attractionConcentration of people relative to the available road space, indicating how densely populated a street is:
Crowd attraction = P person P road + P pavement
[20,21]
Visual complexityThe variety and richness of elements within street views, captured through Shannon Entropy to quantify diversity:
Visual complexity = { · } s e g P { · } l n ( P { · } )
[32,43]
P { · } denotes pixel ratio of { · } segmentation category. Note that pavement includes sidewalk, path, and stair. Pixel ratio is calculated via proportion of category pixels to total pixels.

References

  1. Harwood, R.H. Visual problems and falls. Age Ageing 2001, 30, 13–18. [Google Scholar] [CrossRef] [PubMed]
  2. Edwards, J.D.; Lister, J.J.; Lin, F.R.; Andel, R.; Brown, L.; Wood, J.M. Association of hearing impairment and subsequent driving mobility in older adults. Gerontologist 2017, 57, 767–775. [Google Scholar] [CrossRef]
  3. Landi, F.; Liperoti, R.; Russo, A.; Giovannini, S.; Tosato, M.; Capoluongo, E.; Bernabei, R.; Onder, G. Sarcopenia as a risk factor for falls in elderly individuals: Results from the ilSIRENTE study. Clin. Nutr. 2012, 31, 652–658. [Google Scholar] [CrossRef]
  4. Salthouse, T.A.; Siedlecki, K.L. Efficiency of route selection as a function of adult age. Brain Cogn. 2007, 63, 279–286. [Google Scholar] [CrossRef]
  5. Cicchino, J.B.; McCartt, A.T. Critical older driver errors in a national sample of serious US crashes. Accid. Anal. Prev. 2015, 80, 211–219. [Google Scholar] [CrossRef]
  6. Ragland, D.R.; Satariano, W.A.; MacLeod, K.E. Reasons given by older people for limitation or avoidance of driving. Gerontologist 2004, 44, 237–244. [Google Scholar] [CrossRef]
  7. Merlin, L.A.; Guerra, E.; Dumbaugh, E. Crash risk, crash exposure, and the built environment: A conceptual review. Accid. Anal. Prev. 2020, 134, 105244. [Google Scholar] [CrossRef]
  8. Qiao, S.; Yeh, A.G.O.; Zhang, M.; Yan, X. Effects of state-led suburbanization on traffic crash density in China: Evidence from the Chengdu City Proper. Accid. Anal. Prev. 2020, 148, 105775. [Google Scholar] [CrossRef]
  9. Guerra, E.; Dong, X.; Kondo, M. Do denser neighborhoods have safer streets? Population density and traffic safety in the Philadelphia region. J. Plan. Educ. Res. 2019, 0739456X19845043. [Google Scholar] [CrossRef]
  10. Dumbaugh, E.; Rae, R. Safe urban form: Revisiting the relationship between community design and traffic safety. J. Am. Plan. Assoc. 2009, 75, 309–329. [Google Scholar] [CrossRef]
  11. Yue, H. Investigating the influence of streetscape environmental characteristics on pedestrian crashes at intersections using street view images and explainable machine learning. Accid. Anal. Prev. 2024, 205, 107693. [Google Scholar] [CrossRef] [PubMed]
  12. Chen, P.; Sun, F.; Wang, Z.; Gao, X.; Jiao, J.; Tao, Z. Built environment effects on bike crash frequency and risk in Beijing. J. Saf. Res. 2018, 64, 135–143. [Google Scholar] [CrossRef]
  13. Miranda-Moreno, L.F.; Morency, P.; El-Geneidy, A.M. The link between built environment, pedestrian activity and pedestrian–vehicle collision occurrence at signalized intersections. Accid. Anal. Prev. 2011, 43, 1624–1634. [Google Scholar] [CrossRef] [PubMed]
  14. Salesses, P.; Schechtner, K.; Hidalgo, C.A. The collaborative image of the city: Mapping the inequality of urban perception. PLoS ONE 2013, 8, e68400. [Google Scholar] [CrossRef] [PubMed]
  15. Fan, Z.; Zhang, F.; Loo, B.P.; Ratti, C. Urban visual intelligence: Uncovering hidden city profiles with street view images. Proc. Natl. Acad. Sci. USA 2023, 120, e2220417120. [Google Scholar] [CrossRef]
  16. Wang, R.; Yuan, Y.; Liu, Y.; Zhang, J.; Liu, P.; Lu, Y.; Yao, Y. Using street view data and machine learning to assess how perception of neighborhood safety influences urban residents’ mental health. Health Place 2019, 59, 102186. [Google Scholar] [CrossRef]
  17. Zhang, T.; Huang, B.; Yan, Y.; Lin, Y.; Wong, H.; Wong, S.Y.s.; Chung, R.Y.N. Associations of residential greenness with unhealthy consumption behaviors: Evidence from high-density Hong Kong using street-view and conventional exposure metrics. Int. J. Hyg. Environ. Health 2023, 249, 114145. [Google Scholar] [CrossRef]
  18. Wu, C.; Du, Y.; Li, S.; Liu, P.; Ye, X. Does visual contact with green space impact housing prices? An integrated approach of machine learning and hedonic modeling based on the perception of green space. Land Use Policy 2022, 115, 106048. [Google Scholar] [CrossRef]
  19. Zhou, Y.; Thill, J.C.; Liu, X.; Zhong, C.; Tu, W. Measuring and understanding changes in the physical built environment of cities with street view images. Urban Informatics 2025, 4, 3. [Google Scholar] [CrossRef]
  20. Rui, J. Exploring the association between the settlement environment and residents’ positive sentiments in urban villages and formal settlements in Shenzhen. Sustain. Cities Soc. 2023, 98, 104851. [Google Scholar] [CrossRef]
  21. Ma, S.; Wang, B.; Liu, W.; Zhou, H.; Wang, Y.; Li, S. Assessment of street space quality and subjective well-being mismatch and its impact, using multi-source big data. Cities 2024, 147, 104797. [Google Scholar] [CrossRef]
  22. Almadi, A.I.; Al Mamlook, R.E.; Almarhabi, Y.; Ullah, I.; Jamal, A.; Bandara, N. A fuzzy-logic approach based on driver decision-making behavior modeling and simulation. Sustainability 2022, 14, 8874. [Google Scholar] [CrossRef]
  23. Deniz, P.; Lajunen, T.; Özkan, T.; Gaygısız, E. Masculinity, femininity, and angry drivers: Masculinity and femininity as moderators between driver anger and anger expression style among young drivers. Accid. Anal. Prev. 2021, 161, 106347. [Google Scholar] [CrossRef] [PubMed]
  24. Singh, H.; Kathuria, A. Analyzing driver behavior under naturalistic driving conditions: A review. Accid. Anal. Prev. 2021, 150, 105908. [Google Scholar] [CrossRef] [PubMed]
  25. Guo, M.; Zhao, X.; Yao, Y.; Yan, P.; Su, Y.; Bi, C.; Wu, D. A study of freeway crash risk prediction and interpretation based on risky driving behavior and traffic flow data. Accid. Anal. Prev. 2021, 160, 106328. [Google Scholar] [CrossRef]
  26. Ewing, R.; Dumbaugh, E. The built environment and traffic safety: A review of empirical evidence. J. Plan. Lit. 2009, 23, 347–367. [Google Scholar] [CrossRef]
  27. Cespedes, L.; Ayuso, M.; Santolino, M. Effect of population density in aging societies and severity of motor vehicle crash injuries: The case of Spain. Eur. Transp. Res. Rev. 2024, 16, 48. [Google Scholar] [CrossRef]
  28. Wang, S.; Gao, K.; Zhang, L.; Yu, B.; Easa, S.M. Geographically weighted machine learning for modeling spatial heterogeneity in traffic crash frequency and determinants in US. Accid. Anal. Prev. 2024, 199, 107528. [Google Scholar] [CrossRef]
  29. Ding, H.; Sze, N.; Li, H.; Guo, Y. Roles of infrastructure and land use in bicycle crash exposure and frequency: A case study using Greater London bike sharing data. Accid. Anal. Prev. 2020, 144, 105652. [Google Scholar] [CrossRef]
  30. Weich, S.; Burton, E.; Blanchard, M.; Prince, M.; Sproston, K.; Erens, B. Measuring the built environment: Validity of a site survey instrument for use in urban settings. Health Place 2001, 7, 283–292. [Google Scholar] [CrossRef]
  31. Boarnet, M.G.; Forsyth, A.; Day, K.; Oakes, J.M. The street level built environment and physical activity and walking: Results of a predictive validity study for the Irvine Minnesota Inventory. Environ. Behav. 2011, 43, 735–775. [Google Scholar] [CrossRef]
  32. Cai, Q.; Abdel-Aty, M.; Zheng, O.; Wu, Y. Applying machine learning and google street view to explore effects of drivers’ visual environment on traffic safety. Transp. Res. Part C Emerg. Technol. 2022, 135, 103541. [Google Scholar] [CrossRef]
  33. Ye, Y.; He, J.; Hu, J.; Sun, S.; Zhang, C.; Yan, X.; Wang, C.; Qin, P. Exploring the effect of driving environment on driver stress: A framework based on urban street view and explainable machine learning. J. Intell. Transp. Syst. 2025, 1–17. [Google Scholar] [CrossRef]
  34. Hamim, O.F.; Ukkusuri, S.V. Towards safer streets: A framework for unveiling pedestrians’ perceived road safety using street view imagery. Accid. Anal. Prev. 2024, 195, 107400. [Google Scholar] [CrossRef]
  35. Howlader, M.M.; Mannering, F.; Haque, M.M. Estimating crash risk and injury severity considering multiple traffic conflict and crash types: A bivariate extreme value approach. Anal. Methods Accid. Res. 2024, 42, 100331. [Google Scholar] [CrossRef]
  36. Lee, S.; Yoon, J.; Woo, A. Does elderly safety matter? Associations between built environments and pedestrian crashes in Seoul, Korea. Accid. Anal. Prev. 2020, 144, 105621. [Google Scholar] [CrossRef]
  37. Lee, J.; Gim, T.H.T. Analysing the injury severity characteristics of urban elderly drivers’ traffic accidents through the generalised ordered logit model: A case of Seoul, South Korea. J. Transp. Saf. Secur. 2022, 14, 1139–1164. [Google Scholar] [CrossRef]
  38. Lijarcio, I.; Useche, S.A.; Llamazares, J.; Montoro, L. Are your eyes “on the road”? Findings from the 2019 national study on vision and driving safety in Spain. Int. J. Environ. Res. Public Health 2020, 17, 3195. [Google Scholar] [CrossRef]
  39. Dunbar, G.; Holland, C.A.; Maylor, E.A. Older Pedestrians: A Critical Review of the Literature; Road Safety Research Report; The Department for Transport: London, UK, 2004. [Google Scholar]
  40. Norman, J.F.; Ramirez, A.B.; Bryant, E.N.; Adcock, P.; Parekh, H.; Brase, A.M.; Peterson, R.D. Aging and the visual perception of rigid and nonrigid motion. Sci. Rep. 2024, 14, 27657. [Google Scholar] [CrossRef]
  41. Paraskevoudi, N.; Balcı, F.; Vatakis, A. “Walking” through the sensory, cognitive, and temporal degradations of healthy aging. Ann. N. Y. Acad. Sci. 2018, 1426, 72–92. [Google Scholar] [CrossRef]
  42. Pham, L.A.T.; Nguyen, B.T.; Huynh, D.T.; Nguyen, B.M.L.T.; Tran, P.A.N.; Van Vo, T.; Bui, H.H.T.; Thai, T.T. Community-based prevalence and associated factors of sarcopenia in the Vietnamese elderly. Sci. Rep. 2024, 14, 17. [Google Scholar] [CrossRef] [PubMed]
  43. Biernacki, M.P.; Lewkowicz, R. How do older drivers perceive visual information under increasing cognitive load? Significance of personality on-road safety. Accid. Anal. Prev. 2021, 157, 106186. [Google Scholar] [CrossRef]
  44. Molnar, L.J.; Eby, D.W.; Charlton, J.L.; Langford, J.; Koppel, S.; Marshall, S.; Man-Son-Hing, M. Reprint of “Driving avoidance by older adults: Is it always self-regulation?”. Accid. Anal. Prev. 2013, 61, 272–280. [Google Scholar] [CrossRef]
  45. Kim, S.; Choi, S.; Kim, B.H. Analysis of factors affecting pedestrian safety for the elderly and identification of vulnerable areas in Seoul. Accid. Anal. Prev. 2025, 211, 107878. [Google Scholar] [CrossRef]
  46. Wilmut, K.; Purcell, C. Why are older adults more at risk as pedestrians? A systematic review. Hum. Factors 2022, 64, 1269–1291. [Google Scholar] [CrossRef]
  47. Dommes, A.; Cavallo, V.; Dubuisson, J.B.; Tournier, I.; Vienne, F. Crossing a two-way street: Comparison of young and old pedestrians. J. Saf. Res. 2014, 50, 27–34. [Google Scholar] [CrossRef]
  48. Ekstrom, A.D.; Hill, P.F. Spatial navigation and memory: A review of the similarities and differences relevant to brain models and age. Neuron 2023, 111, 1037–1049. [Google Scholar] [CrossRef]
  49. C &S Department. Hong Kong Population Projections for 2022 to 2046. Hong Kong: Census and Statistics Department. 2023. Available online: https://www.censtatd.gov.hk/en/EIndexbySubject.html?pcode=B1120015&scode=190 (accessed on 9 May 2025).
  50. Liu, J.; Meng, B.; Shi, C. A multi-activity view of intra-urban travel networks: A case study of Beijing. Cities 2023, 143, 104634. [Google Scholar] [CrossRef]
  51. Lian, T.; Loo, B.P. Cost of travel delays caused by traffic crashes. Commun. Transp. Res. 2024, 4, 100124. [Google Scholar] [CrossRef]
  52. Su, J.; Sze, N. Safety of walking trips accessing to public transportation: A Bayesian spatial model in Hong Kong. Travel Behav. Soc. 2022, 29, 125–135. [Google Scholar] [CrossRef]
  53. Hu, S.; Xing, H.; Luo, W.; Wu, L.; Xu, Y.; Huang, W.; Liu, W.; Li, T. Uncovering the association between traffic crashes and street-level built-environment features using street view images. Int. J. Geogr. Inf. Sci. 2023, 37, 2367–2391. [Google Scholar] [CrossRef]
  54. Liu, J.; Shen, K.; Liu, X.; Wu, C. Unravelling the multiple effects of multilevel neighborhood characteristics on traffic crash risk from a spatiotemporal heterogeneity perspective. Travel Behav. Soc. 2025, 40, 101044. [Google Scholar] [CrossRef]
  55. Yue, H. Investigating streetscape environmental characteristics associated with road traffic crashes using street view imagery and computer vision. Accid. Anal. Prev. 2025, 210, 107851. [Google Scholar] [CrossRef] [PubMed]
  56. Planning Department. Land Utilization in Hong Kong. 2023. Available online: https://www.pland.gov.hk/pland_en/info_serv/open_data/landu/ (accessed on 2 April 2025).
  57. Jia, R.; Khadka, A.; Kim, I. Traffic crash analysis with point-of-interest spatial clustering. Accid. Anal. Prev. 2018, 121, 223–230. [Google Scholar] [CrossRef]
  58. Chen, H.; Chen, H.; Liu, Z.; Sun, X.; Zhou, R. Analysis of factors affecting the severity of automated vehicle crashes using XGBoost model combining POI data. J. Adv. Transp. 2020, 2020, 8881545. [Google Scholar] [CrossRef]
  59. C & S Department. 2021 Population Census. 2021. Available online: https://www.census2021.gov.hk/en/district_profiles.html (accessed on 2 April 2025).
  60. Stoker, P.; Garfinkel-Castro, A.; Khayesi, M.; Odero, W.; Mwangi, M.N.; Peden, M.; Ewing, R. Pedestrian safety and the built environment: A review of the risk factors. J. Plan. Lit. 2015, 30, 377–392. [Google Scholar] [CrossRef]
  61. Halaweh, H.; Dahlin-Ivanoff, S.; Svantesson, U.; Willén, C. Perspectives of older adults on aging well: A focus group study. J. Aging Res. 2018, 2018, 9858252. [Google Scholar] [CrossRef]
  62. Wang, Z.; Yang, H.; Guo, Z.; Liu, B.; Geng, S. Socio-demographic characteristics and co-occurrence of depressive symptoms with chronic diseases among older adults in China: The China longitudinal ageing social survey. BMC Psychiatry 2019, 19, 310. [Google Scholar] [CrossRef]
  63. Bergeron, E.; Rossignol, M.; Osler, T.; Clas, D. Improving the TRISS methodology by restructuring age categories and adding comorbidities. J. Trauma Acute Care Surg. 2004, 56, 760–767. [Google Scholar] [CrossRef]
  64. Caterino, J.M.; Valasek, T.; Werman, H.A. Identification of an age cutoff for increased mortality in patients with elderly trauma. Am. J. Emerg. Med. 2010, 28, 151–158. [Google Scholar] [CrossRef]
  65. Zhao, H.; Shi, J.; Qi, X.; Wang, X.; Jia, J. Pyramid scene parsing network. In Proceedings of the IEEE Conference on Computer Vision and Pattern Recognition, Honolulu, HI, USA, 21–26 July 2017; pp. 2881–2890. [Google Scholar]
  66. Zhou, B.; Zhao, H.; Puig, X.; Fidler, S.; Barriuso, A.; Torralba, A. Scene parsing through ade20k dataset. In Proceedings of the IEEE Conference on Computer Vision and Pattern Recognition, Honolulu, HI, USA, 21–26 July 2017; pp. 633–641. [Google Scholar]
  67. He, J.; Zhang, J.; Yao, Y.; Li, X. Extracting human perceptions from street view images for better assessing urban renewal potential. Cities 2023, 134, 104189. [Google Scholar] [CrossRef]
  68. Breiman, L. Random forests. Mach. Learn. 2001, 45, 5–32. [Google Scholar] [CrossRef]
  69. Dai, J.; Tian, X.; Liu, L.; Zhang, H.; Fu, J.; Yu, M. The Intelligent Traffic Safety System Based on 6G Technology and Random Forest Algorithm. IEEE Trans. Intell. Transp. Syst. 2025. [Google Scholar] [CrossRef]
  70. Zhou, X.; Lu, P.; Zheng, Z.; Tolliver, D.; Keramati, A. Accident prediction accuracy assessment for highway-rail grade crossings using random forest algorithm compared with decision tree. Reliab. Eng. Syst. Saf. 2020, 200, 106931. [Google Scholar] [CrossRef]
  71. Lundberg, S.M.; Lee, S.I. A unified approach to interpreting model predictions. In Proceedings of the 31st Conference on Neural Information Processing Systems (NeurIPS 2017), Long Beach, CA, USA, 4–9 December 2017. [Google Scholar]
  72. Friedman, J.H. Greedy function approximation: A gradient boosting machine. Ann. Stat. 2001, 29, 1189–1232. [Google Scholar] [CrossRef]
  73. Szeto, W.; Yang, L.; Wong, R.; Li, Y.; Wong, S. Spatio-temporal travel characteristics of the elderly in an ageing society. Travel Behav. Soc. 2017, 9, 10–20. [Google Scholar] [CrossRef]
  74. Haustein, S.; Siren, A. Older people’s mobility: Segments, factors, trends. Transp. Rev. 2015, 35, 466–487. [Google Scholar] [CrossRef]
  75. Rahman, M.; Kockelman, K.M.; Perrine, K.A. Investigating risk factors associated with pedestrian crash occurrence and injury severity in Texas. Traffic Inj. Prev. 2022, 23, 283–289. [Google Scholar] [CrossRef]
  76. Tamakloe, R.; Zhang, K.; Kim, I. Temporal instability of the determinants of fatal/severe elderly pedestrian injury outcomes in intersections and non-intersections before, during, and after the COVID-19 pandemic. Accid. Anal. Prev. 2024, 205, 107676. [Google Scholar] [CrossRef]
  77. Peel, T.; Ahmed, M.; Ohara, N. Investigating safety effectiveness of Wyoming snow fence installations along a rural mountainous freeway. Transp. Res. Rec. 2017, 2613, 8–15. [Google Scholar] [CrossRef]
  78. PE, W.E.M.; Coppola, N.; Golombek, Y. Urban clear zones, street trees, and road safety. Res. Transp. Bus. Manag. 2018, 29, 136–143. [Google Scholar]
  79. Zhang, X.; Zhao, X.; Bian, Y.; Huang, J.; Yin, L. Interactive effects analysis of road, traffic, and weather characteristics on shared e-bike speeding risk: A data-driven approach. Accid. Anal. Prev. 2024, 207, 107755. [Google Scholar] [CrossRef] [PubMed]
  80. Lee, J.S.; Zegras, P.C.; Ben-Joseph, E. Safely active mobility for urban baby boomers: The role of neighborhood design. Accid. Anal. Prev. 2013, 61, 153–166. [Google Scholar] [CrossRef]
  81. Dommes, A.; Le Lay, T.; Vienne, F.; Dang, N.T.; Beaudoin, A.P.; Do, M.C. Towards an explanation of age-related difficulties in crossing a two-way street. Accid. Anal. Prev. 2015, 85, 229–238. [Google Scholar] [CrossRef]
  82. Zhang, K.; Tamakloe, R.; Cao, M.; Kim, I. Exploring fatal/severe pedestrian injury crash frequency at school zone crash hotspots: Using interpretable machine learning to assess the micro-level street environment. J. Transp. Geogr. 2024, 121, 104034. [Google Scholar] [CrossRef]
  83. Wang, R.; Lu, Y.; Zhang, J.; Liu, P.; Yao, Y.; Liu, Y. The relationship between visual enclosure for neighbourhood street walkability and elders’ mental health in China: Using street view images. J. Transp. Health 2019, 13, 90–102. [Google Scholar] [CrossRef]
  84. Barnett, D.W.; Barnett, A.; Nathan, A.; Van Cauwenberg, J.; Cerin, E.; on behalf of the Council on Environment and Physical Activity (CEPA)—Older Adults Working Group. Built environmental correlates of older adults’ total physical activity and walking: A systematic review and meta-analysis. Int. J. Behav. Nutr. Phys. Act. 2017, 14, 1–24. [Google Scholar] [CrossRef]
  85. Duim, E.; Lebrão, M.L.; Antunes, J.L.F. Walking speed of older people and pedestrian crossing time. J. Transp. Health 2017, 5, 70–76. [Google Scholar] [CrossRef]
  86. Theofilatos, A.; Ziakopoulos, A.; Oviedo-Trespalacios, O.; Timmis, A. To cross or not to cross? Review and meta-analysis of pedestrian gap acceptance decisions at midblock street crossings. J. Transp. Health 2021, 22, 101108. [Google Scholar] [CrossRef]
  87. Chong, S.; Mazumdar, S.; Jalaludin, B.; Hatfield, J. Associations between Walkability and pedestrian related injuries is modified by Sociodemographic characteristics. Injury 2022, 53, 3978–3986. [Google Scholar] [CrossRef]
  88. Rockhill, S.M.; Soto, G.W.; Whitfield, G.P.; Barry, V.; Fletcher, K. Associations between National walkability Index and Traffic-Related pedestrian Deaths, United States, 2017–2019. Transp. Res. Interdiscip. Perspect. 2025, 31, 101404. [Google Scholar] [CrossRef]
  89. Chiang, Y.C.; Ke, R.A.; Li, D.; Weng, P.Y. Greening and safety: The influence of road greenness on driver’s attention and emergency reaction time. Environ. Behav. 2022, 54, 1195–1226. [Google Scholar] [CrossRef]
  90. Lee, S.C.; Kim, Y.W.; Ji, Y.G. Effects of visual complexity of in-vehicle information display: Age-related differences in visual search task in the driving context. Appl. Ergon. 2019, 81, 102888. [Google Scholar] [CrossRef] [PubMed]
  91. Gálvez-Pérez, D.; Guirao, B.; Ortuño, A. Age-Friendly Urban Design for Older Pedestrian Road Safety: A Street Segment Level Analysis in Madrid. Sustainability 2024, 16, 8298. [Google Scholar] [CrossRef]
  92. Jurado Martins de Oliveira, G.; Lavieri, P.S.; Cunha, A.L. Integrating a non-gridded space representation into a graph neural networks model for citywide short-term crash risk prediction. Urban Inform. 2023, 2, 7. [Google Scholar] [CrossRef]
  93. Yu, C.Y.; Xu, M. Local variations in the impacts of built environments on traffic safety. J. Plan. Educ. Res. 2018, 38, 314–328. [Google Scholar] [CrossRef]
  94. Chen, P.; Zhou, J. Effects of the built environment on automobile-involved pedestrian crash frequency and risk. J. Transp. Health 2016, 3, 448–456. [Google Scholar] [CrossRef]
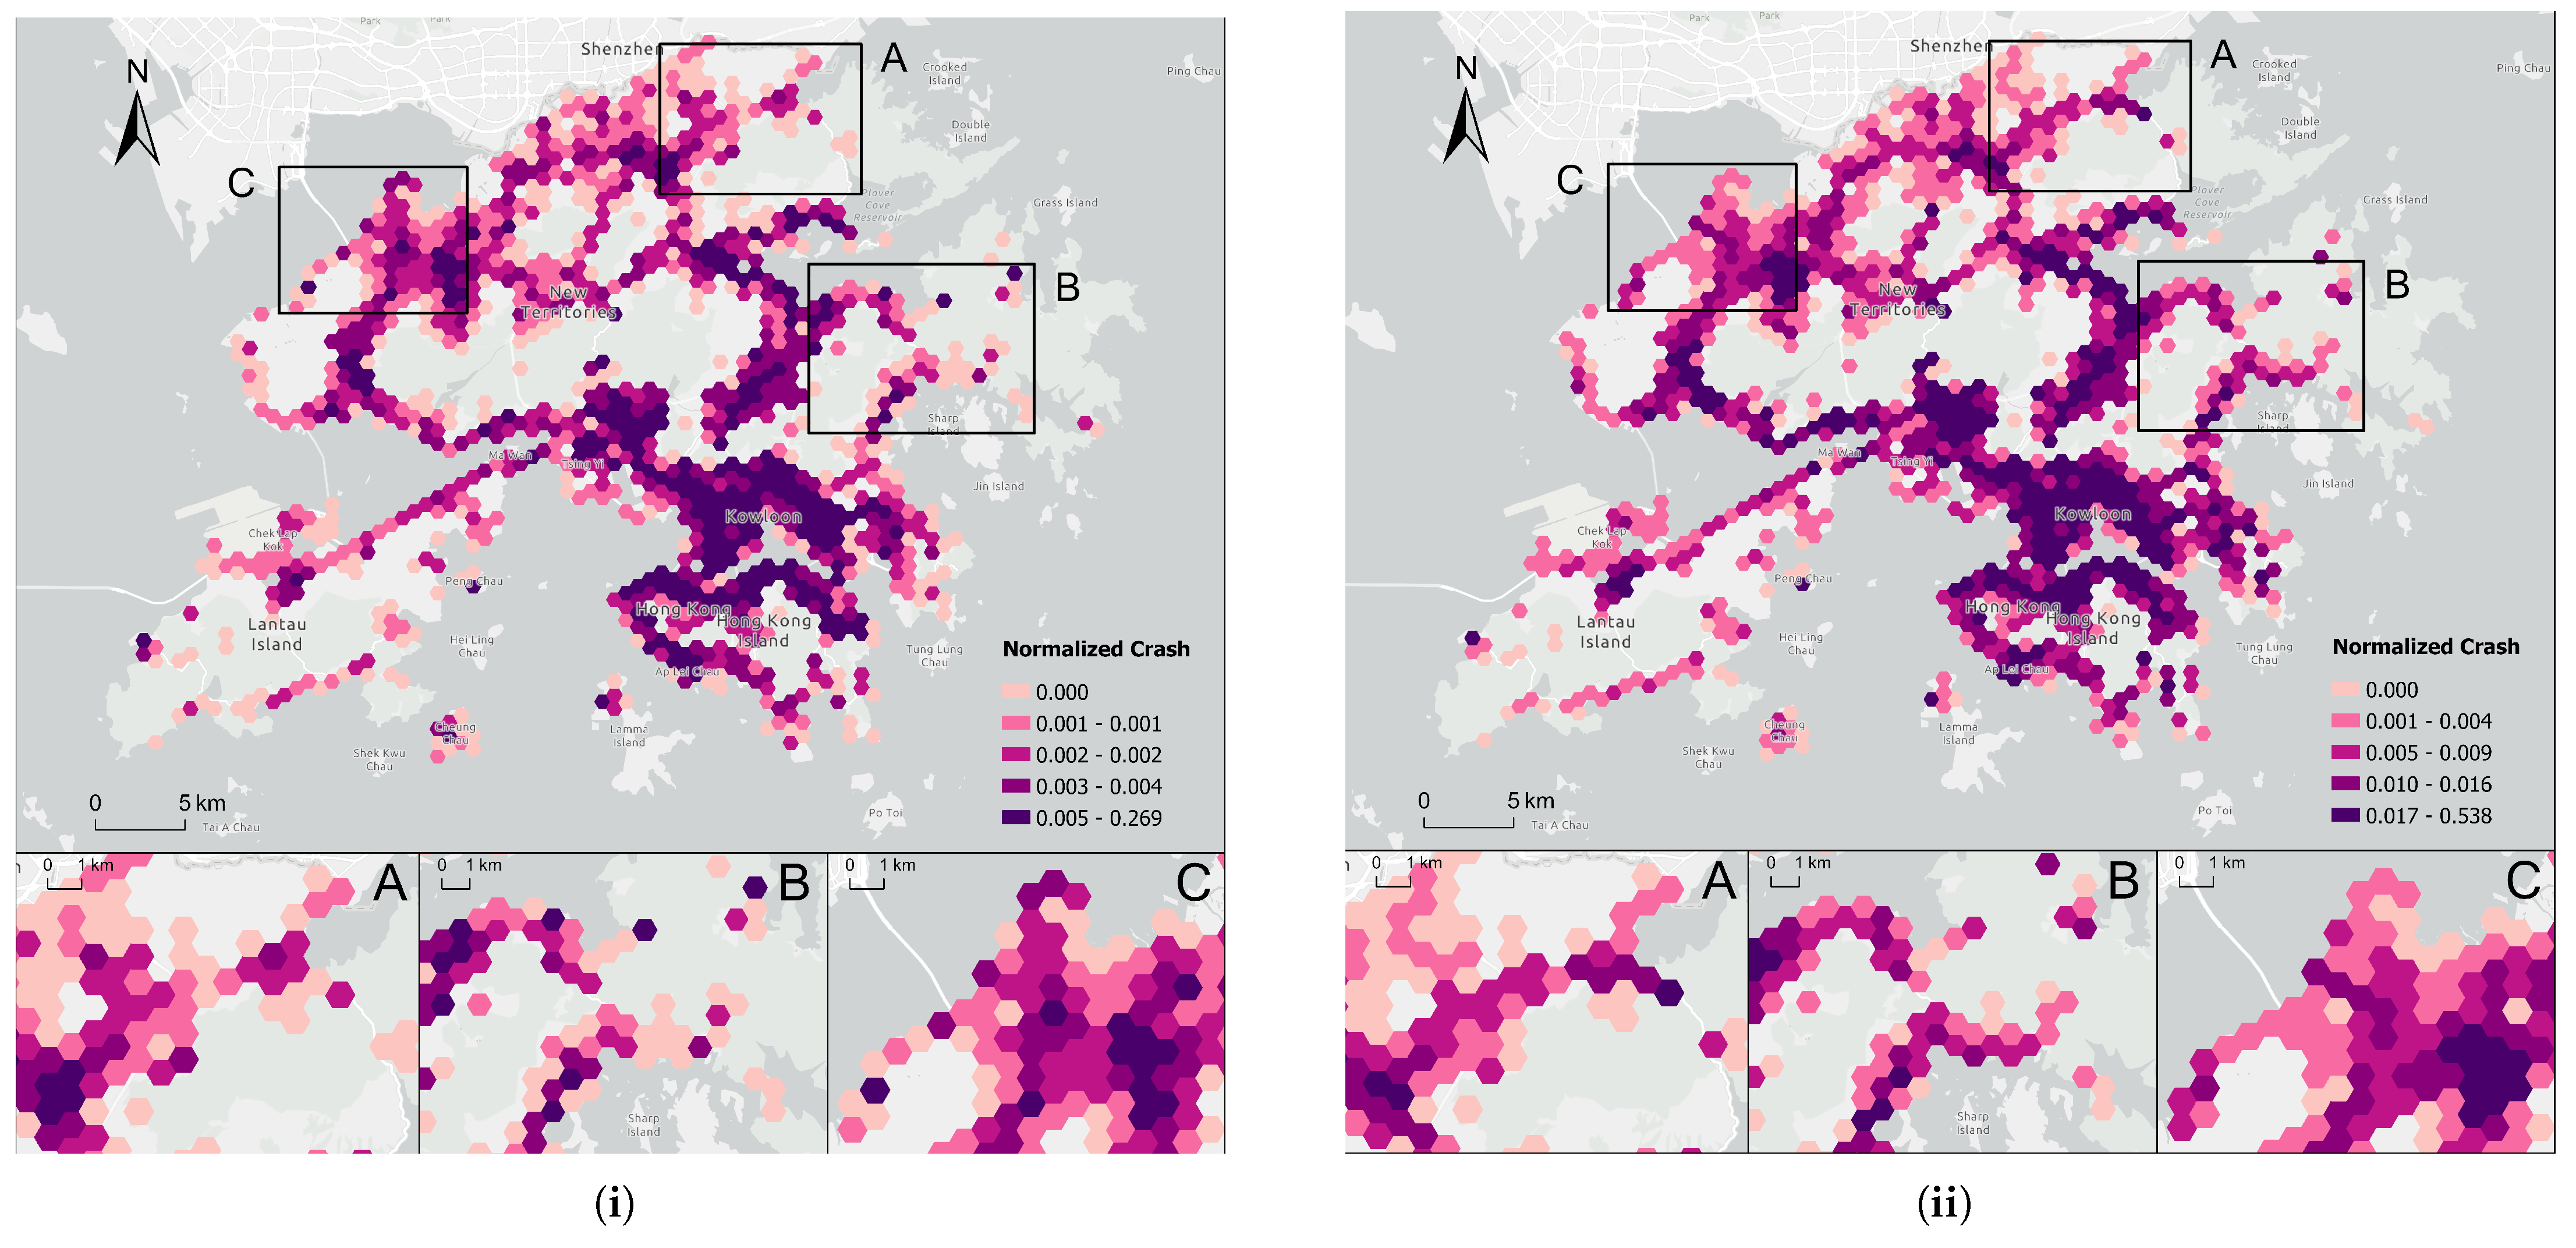
Figure 1. Spatial distribution of normalized traffic crashes. (i) Spatial distribution for older group. (ii) Spatial distribution for non-older group. (A–C) show details of study units in district fringe for comparison of two groups: (A) North District. (B) Sai Kung District. (C) Northern part of Yuen Long District.
Ijgi 14 00248 g001
Figure 2. Framework for collecting and processing SVIs. (i) Spatial distribution of sample points and examples of SVIs. (ii) Segmentation process of SVIs.
Ijgi 14 00248 g002
Figure 3. Methodology framework of the study.
Ijgi 14 00248 g003
Figure 4. Results of Local Moran’s I analysis. Blue shows “low-low” units, while red shows “high-high” units. (i) Results of older group. (ii) Results of non-older group.
Ijgi 14 00248 g004
Figure 5. Global feature contribution and summary of SHAP values: The SHAP value for each variable is obtained by summing the contributions across all three classes, reflecting the total impact on the model. For each class, different colors are used to represent the variable’s contribution to the prediction for that class. Specifically, low-risk, mid-risk, and high-risk areas are represented by light pink, light purple, and dark purple, respectively. Additionally, diagonal hatch lines are applied to highlight the street environment factors in the bar plot. (i) SHAP analysis for the older group. (ii) SHAP analysis for the non-older group. (iii) A comparison of factor contributions between the two groups, with street environment factors highlighted in orange for emphasis.
Ijgi 14 00248 g005
Figure 6. Spatial patterns and contribution trends of street environment variables with similar decreasing trends. The left map shows the spatial distribution of local contributions for the older group, and the right map shows the same for the non-older group. The center plot compares the trend of local contributions between the two models. (i) Enclosure. (ii) Sky view.
Ijgi 14 00248 g006
Figure 7. Spatial patterns and contribution trends of street environment variables with similar increasing trends. The left map shows the spatial distribution of local contributions for the older group, and the right map shows the same for the non-older group. The center plot compares the trend of local contributions between the two models. (i) Crowd attraction. (ii) Visual complexity.
Ijgi 14 00248 g007
Figure 8. Spatial patterns and contribution trends of street environment variables with different effect trends. The left map shows the spatial distribution of local contributions for the older group, and the right map shows the same for the non-older group. The center plot compares the trend of local contributions between the two models. (i) Walkability. (ii) Greenness.
Ijgi 14 00248 g008
Figure 9. Two-way PDP analysis showing the interaction between the top-contributing indicator and various other street environment indicators. The left column represents the older group, and the right column represents the non-older group. Subfigures (AJ) are arranged row-wise, from top to bottom and left to right, with each row corresponding to the indicator labeled at the beginning of that row. (i) The top-contributing indicator enclosure. (ii) The top-contributing indicator is walkability.
Ijgi 14 00248 g009
Table 1. Summary and guidance table for local SHAP result.
VariableGroupTrendThresholdImportant Areas
EnclosureOlder0.0; 2.5Yau Tsim Mong District and Kwai Tsing District
Non-older2.0Boundary of natural parks
Sky ViewOlder0.22Kowloon City District and Northern Hong Kong Island
Non-older0.25
Crowd AttractionOlder0.07Kowloon Area and Northern Hong Kong Island
Non-older0.07Kowloon Area and Northern Hong Kong Island
Visual ComplexityOlder 2.15
Non-older 2.15Kwai Tsing District
WalkabilityOlder0.25Kowloon Area and Northern Hong Kong Island
Non-older0.15
GreennessOlder0.28
Non-older 0.28
Disclaimer/Publisher’s Note: The statements, opinions and data contained in all publications are solely those of the individual author(s) and contributor(s) and not of MDPI and/or the editor(s). MDPI and/or the editor(s) disclaim responsibility for any injury to people or property resulting from any ideas, methods, instructions or products referred to in the content.