Article

Evaluating Real-Time and Scheduled Public Transport Data: Challenges and Opportunities

GIS Research Centre, Wales Institute of Social and Economic Research and Data (WISERD), Faculty of Computing, Engineering and Science, University of South Wales, Pontypridd CF37 1DL, UK
*
Author to whom correspondence should be addressed.
ISPRS Int. J. Geo-Inf. 2025, 14(7), 243; https://doi.org/10.3390/ijgi14070243
Submission received: 17 April 2025 / Revised: 5 June 2025 / Accepted: 20 June 2025 / Published: 25 June 2025

Abstract

Scheduled timetable information has been used extensively in studies concerned with estimating travel times in accessibility research. Fewer studies to date have involved the use of real-time public transport data to help investigate the impacts of travel disruptions or cancellations of service on reported spatial and temporal patterns of accessibility. The aims of this paper are to introduce, describe, and compare the salient features and relative merits of alternative data sources relating to real-time transport data that could be utilized in such applications. By drawing attention to the potential of real-time data originating from such sources, this study makes recommendations for those considering building on the use of scheduled data to incorporate travel time reliability within transport applications. We conclude by highlighting the need for further research that explores the potential of using openly available sources of real-time traffic data in studies that incorporate accessibility analysis.

1. Introduction

Researchers are increasingly taking advantage of new and innovative data sources to address a wide range of decision-making applications in transport management and policy studies [1,2,3,4,5]. GIS approaches have been used to calculate accessibility to a broad range of services using the General Transit Feed Specification (GTFS) open data format for public transportation schedules [6]. Authors such as Liu and Miller [3] have outlined the two data standards used in such studies to date, namely GTFS static and GTFS real-time expansion. The former relates to scheduled public transportation data, whilst the latter also uses vehicle location data to report bus locations and provide trip updates regarding expected arrival and departure times at each stop. These datasets have been used to seek comparisons between scheduled transit operations and travel times and route choice behaviours based on automatic vehicle location data (APC-AVL), as well as to examine the implications of variations in travel time service reliability. This is enabled by the inclusion of real-time information about movement patterns of buses, private transport, and daily variations in mobility patterns within transport networks [7,8,9,10,11,12,13]. Such research has often involved comparing scheduled GTFS data with real-time fleet-wide automatic vehicle location data to enable the impact of public transit delays to be investigated at detailed spatial and temporal scales [14,15,16,17]. Such data are used by public transport operators in their day-to-day performance measurement and reliability monitoring tasks and, increasingly, by researchers concerned with visualizing and analysing the potential impacts of service cancellations and delays on accessibility [18]. In this paper, we draw attention to online data sources that can be used to provide real-time estimates of travel times and outline their potential use in accessibility calculations concerned with examining the equity of transit provision.
We first describe and compare the salient characteristics of current sources of real-time transport data and consider their relative merits. This draws on relatively new sources of information, such as the Service Interface for Real-time Information Vehicle Monitoring (SIRI-VM) data, made available by the UK Department for Transport [19], and GTFS-RealTime (GTFS-RT) information, which provide continuous real-time data sources based on vehicle GPS traces. We demonstrate the need to examine the accessibility implications of adapting or adjusting bus schedules following short- or long-term changes (such as adverse road or weather conditions, unexpected roadblocks, or other forms of traffic disruption) on reaching destinations within specified timeframes. In so doing, this paper highlights the need for further research into the potential consequences of using scheduled travel times to estimate accessibility, as well as the discrepancies that may arise between this and the patterns revealed by actual travel data when drawing upon such sources.
This study makes three main contributions. First, it provides one of the first detailed evaluations of how GTFS-RT and SIRI-VM are implemented within the UK’s Bus Open Data Service (BODS), highlighting structural limitations such as missing GTFS-RT entities. Second, it offers a side-by-side comparison of GTFS, GTFS-RT, SIRI-VM, and SIRI-SX (Service Interface for Real-time Information - Situations Exchange) data sources using a consistent framework, which has not been undertaken in the existing literature. Third, it links real-time data formats with practical GIS-based accessibility modelling, demonstrated through a simple case study. While real-time information is already used in many cities for passenger-facing applications (e.g., trip planning and service arrival times), this study contributes original insight by repurposing these data for retrospective, network-level accessibility analysis, revealing structural data gaps, and showing how actual service performance can affect equity outcomes in ways that scheduled-only models may overlook. Together, these contributions offer both technical insight and applied value for researchers and transport planners.
The primary aim of this paper is to evaluate the value of live transit data formats by introducing and documenting the salient features of resources such as GTFS-RT and SIRI-VM. To achieve this, the study undertakes a detailed technical analysis of real-time data standards, examining their structure, functionality, and overall capabilities, comparing these with static GTFS schedules to elucidate their respective strengths and limitations. The paper also details a methodological framework for processing, storing, and integrating live transit data into accessibility models, outlining the procedures required to match and transform real-time data against static datasets. Furthermore, the research describes the potential use of such data to investigate how discrepancies between scheduled and observed bus services may impact accessibility outcomes and travel time reliability. This involves an assessment of the practical implications of utilizing live data for enhancing public transport operations, service reliability, and urban accessibility assessments. Finally, the study explores the potential for incorporating additional dynamic factors, such as service disruptions and operational changes, into real-time accessibility analyses, and concludes by offering recommendations for future research and advocating the development of interactive tools that leverage live data to support better informed transport planning and policy making.

2. The Use of Real-Time Data in Transport Studies

2.1. Background

There is a growing literature base concerned with the use of GTFS data in a wide range of transport applications, including modelling delay effects to the network that then impact on the reachability of areas in accessibility analysis [20,21,22,23]. A more recent study has been concerned with analysing big data to provide objective reviews of the strengths and current limitations of using data derived from smart cards, mobile phones, and automatic vehicle location (AVL) sources in supporting transport planning operations in the Lombardy Region of Italy [5]. Regarding the latter, automatic vehicle location data has been used to examine different aspects of bus performance; Aemmer et al. [24], for example, used bus network data for Seattle to develop an online visualization tool to examine the impacts of real-time data on a range of system performance measures. APC-AVL data have also been used to predict transit readership, estimate transit travel times, and investigate the wider aspects of service quality [8,25,26,27,28,29,30,31,32]. Such research has also drawn on space-time prism-based measures to examine the impact of short- and longer-term disruptions to the public transit system as evidenced by an analysis of GTFS-RT data [33].
GPS data, typically collected via onboard vehicle systems (automatic vehicle location units) and transmitted over mobile networks, have been widely used to create real-time location estimates. These estimates can be used to examine variations in the number of opportunities that can be reached within specified time periods, offering a more dynamic basis for accessibility analysis [34]. Such studies have alluded to the potential limitations of using scheduled service timetables in measuring accessibility [17,35,36,37]. Wessel et al. [37], for example, drew attention to the potential for using real-time vehicle location data to improve the accuracy of GTFS data to represent observed rather than scheduled transit services. Such data, they suggest, can be used to examine various elements of network performance, reliability, and accessibility. Through an analysis of average accessibility to jobs in Toronto using both scheduled and real-time (‘retrospective’) GTFS data for comparable periods, they found that “substantial aggregate accessibility differences exist between scheduled and observed services”. They further suggest that “this ‘error’ in the scheduled GTFS data may have implications for many types of measurements commonly derived from GTFS data.” [37] (p. 92). Wessel and Farber [17] examined the accessibility implications of replacing scheduled versus real-time GTFS for four American cities for job accessibility and found that using the scheduled data led to an overestimation of accessibility levels with distinct spatial patterns. Such real-time data have been made openly available in other national contexts and integrated with routing platforms such as OpenTripPlanner [38,39].

2.2. Accessibility Implications of Adopting Real-Time Data

Several research studies have investigated the implications of travel time reliability arising from disruptions, caused, for example, by short- and long-term travel conditions, on estimates of accessibility to opportunities by public transit [14,33,40,41,42]. Such studies have drawn attention to the need to reveal any discrepancies in the accessibility and potential equity of public transport provision, stemming from the inclusion of the actual performance of public transportation rather than relying on measures based on scheduled information. Liu et al. [33], for example, found that the inclusion of GPS-derived public transport real-time data can address an overestimation in accessibility measures based on schedule-based services in the city of Columbus, Ohio. More recently, Nalin et al. [42] have explored the impact of long-term disruptions (the closure of a main urban road) to the regular public transport service on accessibility in Bologna, Italy, using an open-source platform (Rapid Realistic Routing with R5 in R (r5r)). Their study uses a ‘real-time AVM-corrected GTFS’ dataset that uses delay data to compare cumulative accessibility measures for services such as healthcare, schools, and universities within travel time thresholds to examine access impacts. Their findings reveal variations in the accessibility and equity of provision when real-time public transport supply is compared with scheduled services based on static GTFS data. The impacts of such disruptions were also shown to vary between central and peripheral neighbourhoods, with important implications for accessibility and the equity of provision.
The social equity implications of such research have been investigated in other recent studies. Basso et al. [40], for example, derived GPS data from buses on the public transport network in Santiago, Chile, to compare access to education, health, and job opportunities across the city using disaggregate data on real-time rather than scheduled data for a single working week. Their findings of persistent inequalities in access to such opportunities across the city enabled the researchers to provide policy recommendations concerning the quality of public transport services that address the frequency of bus services and their coverage. Bimpou and Ferguson [14] examined day-to-day variability in travel times and found both spatial and temporal variations in the reliability of times based on real-time data with implications for accessibility losses. Similar conclusions that drew attention to the importance of data inaccuracies and day-to-day travel variability in actual public transport travel times drawn from historical GPS data on accessibility levels were found for a Brazilian city by Braga et al. [43]. They report that differences in accessibility when compared with those derived from scheduled GTFS data disproportionately impact low-income regions and have important implications for social equity in the city. They conclude by suggesting that issues such as variability in public transport travel times may be important considerations in estimating accessibility levels from such equity perspectives. Similar findings were evident for a region of Sweden where GTFS data (for both scheduled and actual services) were used to examine the implications of public transport access to employment opportunities [44]. Others have investigated the equity implications of travel time uncertainty using the example of transit-based accessibility to healthcare facilities in Columbus, Ohio [45]. Their findings suggest that “traditional measures of accessibility that do not consider the impact of travel time uncertainty cannot accurately capture the social and racial inequity in healthcare accessibility via transit” [45] (p. 1). Wessel et al. [37] draw attention to the potential bias in deriving measures from scheduled GTFS data alone, especially where there may be a mismatch with operational reality. In the next section, we describe the various live bus data feeds currently available to researchers interested in applying actual travel data and provide a detailed description of the information contained within each dataset.

3. Description and Characteristics of Real Time Transport Data

3.1. Sources of Data

The live transit data observed in this study are provided for the UK and are sourced from the Bus Open Data Service (BODS), an initiative maintained by the UK Department for Transport [46]. BODS provides open access to real-time public transport data, including both Service Interface for Real-time Information Vehicle Monitoring (SIRI-VM) data and General Transit Feed Specification-Realtime (GTFS-RT) feeds. It also supplies real-time disruptions data known as SIRI-SX. The web portal allows users to access both historical and live data streams. In some cases, registration may be required to access certain datasets or to obtain an API key, to ensure that usage adheres to the service’s guidelines. Once accessed, data can be integrated into GIS-based routing engines and analysis tools to calculate accessibility indicators for key services [47]. For example, the SIRI-VM data can be processed to match its journey references with the corresponding scheduled service codes, thus enabling the construction of a refined GTFS dataset that can then serve as the basis for subsequent accessibility analyses. This open-data approach not only enhances the reproducibility of the research but also supports the development of innovative, data-driven methodologies for urban accessibility assessment.

3.2. General Transit Feed Specification (GTFS) Data

The General Transit Feed Specification (GTFS) format, commonly derived from a set of files provided by public transport operators, offers a standardized and machine-readable representation of scheduled bus services [48,49]. Its structure is composed of several core files, essentially a set of relational tables, that together describe the planned transit network (see Figure 1). The trips.txt file details the individual journeys that take place along a route, while stop_times.txt specifies the scheduled arrival and departure times of buses at each stop. In addition, the routes.txt and stops.txt files provide metadata about the transit routes and the geographic locations of the stops, while the calendar.txt (or calendar_dates.txt) file outlines the days on which specific services operate, including any exceptions. This comprehensive technical structure facilitates interoperability with various GIS-based routing engines and accessibility analysis tools. By accurately reflecting planned or scheduled service operations, the base GTFS data format serves as a critical foundation for transit planning, allowing researchers to model and analyse the theoretical accessibility delivered through public transport networks.

3.3. SIRI-VM Data Processing

SIRI-VM data are delivered in an XML format that contains detailed vehicle location information, including precise GPS coordinates, timestamps, and unique journey references (see Table 1). This dataset enables the tracking of individual bus movements and offers frequent updates, typically every minute, which are essential for accurately capturing real-time service performance. Researchers can use this journey reference information to align these live data points with scheduled services, thereby enabling a direct comparison between planned and actual service delivery.
Figure 2 and Table 1 display an example of the data provided via a SIRI-VM stream. This data source offers a wide range of information from vehicle coordinates to journey codes. Among the many elements provided, the most valuable from an accessibility research perspective are the DatedVehicleJourneyCodes. These codes can be matched with the journey codes present in the GTFS data, thus enabling a direct comparison between live data and GTFS timetable data that has been uploaded by public transport operators. Table 1 presents the essential fields used in SIRI-VM feeds, which provide real-time information on vehicle location, journey progress, and estimated arrival time. These data are critical for tracking service reliability and comparing scheduled versus actual performance in accessibility analyses. This matching capability allows for accessibility analyses to then be based on actual service performance, rather than solely relying on best-case scenario timetable data. In other words, while scheduled data represents what should ideally occur, the SIRI-VM data provides an account of the trips that really happened, under the assumption that the buses have themselves reported this information accurately.
An example of the data flow obtained from the BODS-provided SIRI-VM (Vehicle Monitoring) feed is presented in Figure 2, while Table 1 details the various fields that may be present and includes an example of the type of information that may be received. The ResponseTimestamp and ValidUntil fields define a time frame for which the data is valid. The ProducerRef field identifies the source of the data, while RequestMessageRef is a unique reference to the query that generated the dataset. Each VehicleActivity entry represents a recorded vehicle update, with a timestamp (RecordedAtTime) and a unique identifier (ItemIdentifier). The MonitoredVehicleJourney object contains key details about each trip, such as its route number (LineRef), direction of travel (DirectionRef), and its operator details (OperatorRef). The FramedVehicleJourneyRef field can help researchers to link the real-time update to a scheduled service through the date (DataFrameRef) and unique trip ID (DatedVehicleJourneyRef).
The dataset also provides spatial and temporal information. VehicleLocation records the latitude and longitude position of a bus in real time, while Bearing indicates its current directional heading. Scheduled departure and arrival times are listed under OriginAimedDepartureTime and DestinationAimedArrivalTime, respectively, and these enable comparisons to be drawn between planned and actual performance. The Extensions section contains operator-specific tags like TicketMachineServiceCode, JourneyCode, and VehicleUniqueId, which are used internally by transit agencies for tracking and ticketing purposes. This structured dataset allows both transit agencies and academic researchers to analyse service reliability, to track vehicle movements in real time, and to assess any deviations from scheduled operations.

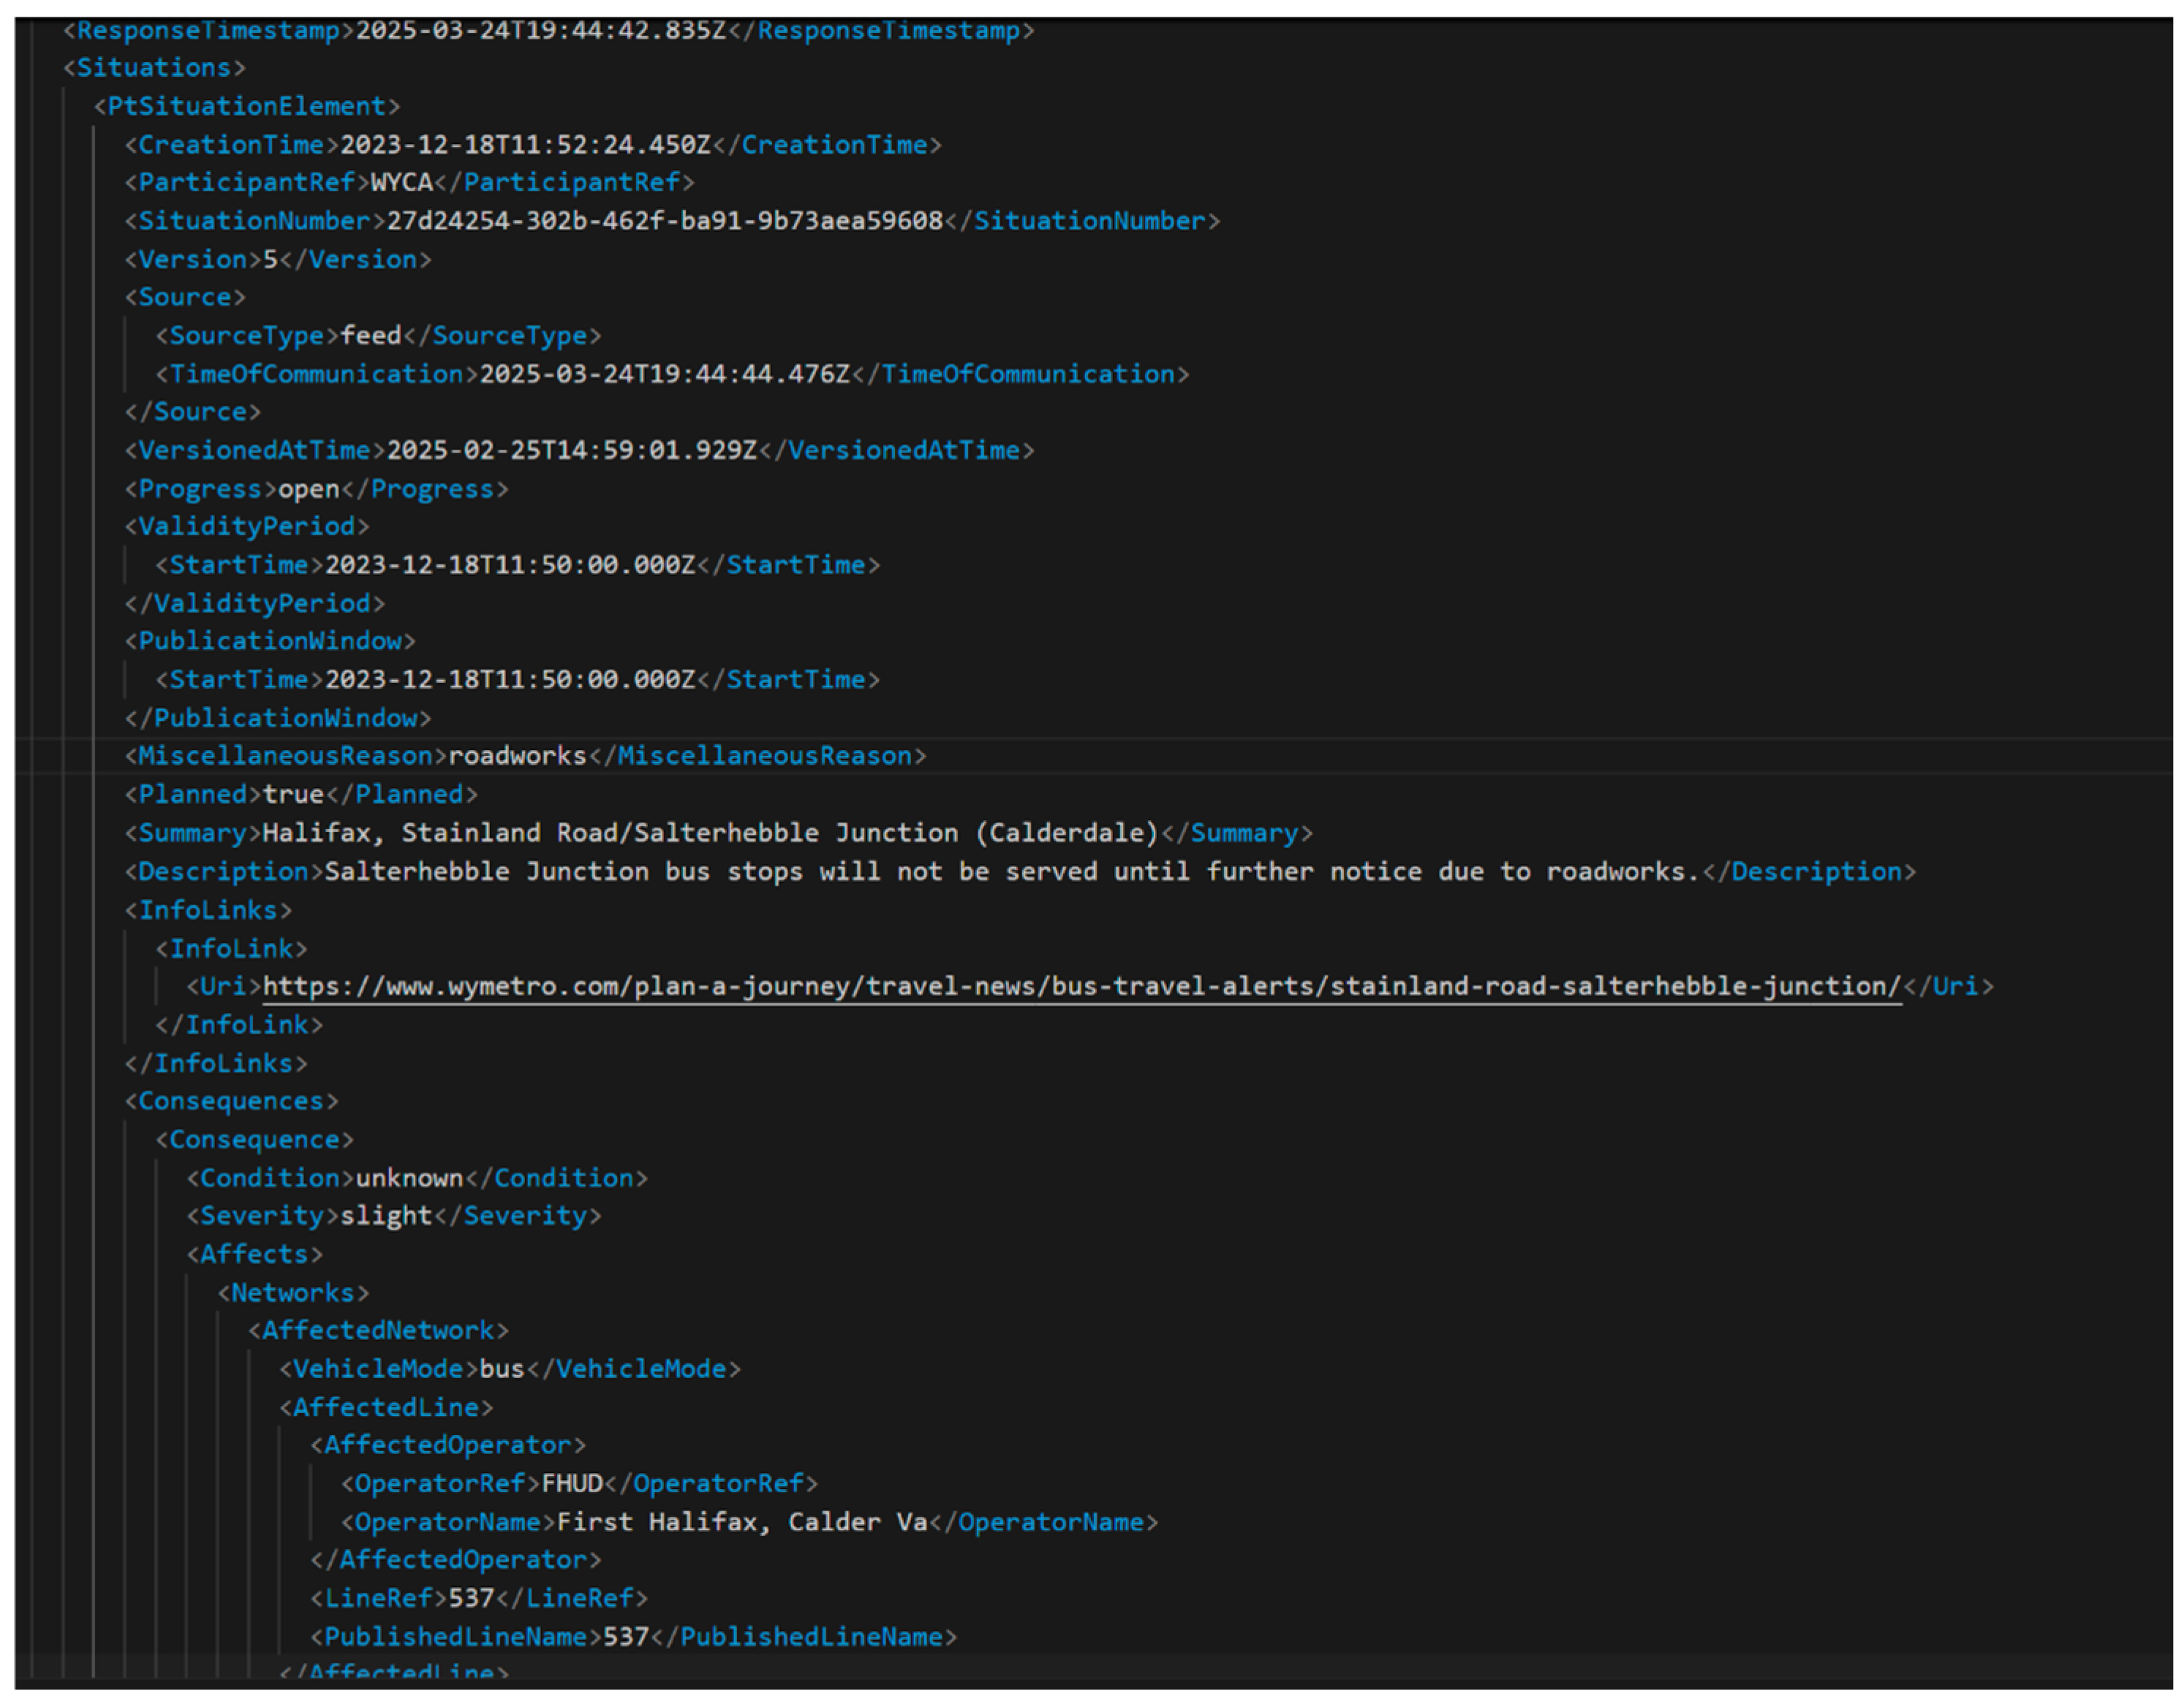
3.4. SIRI-SX Disruption Data
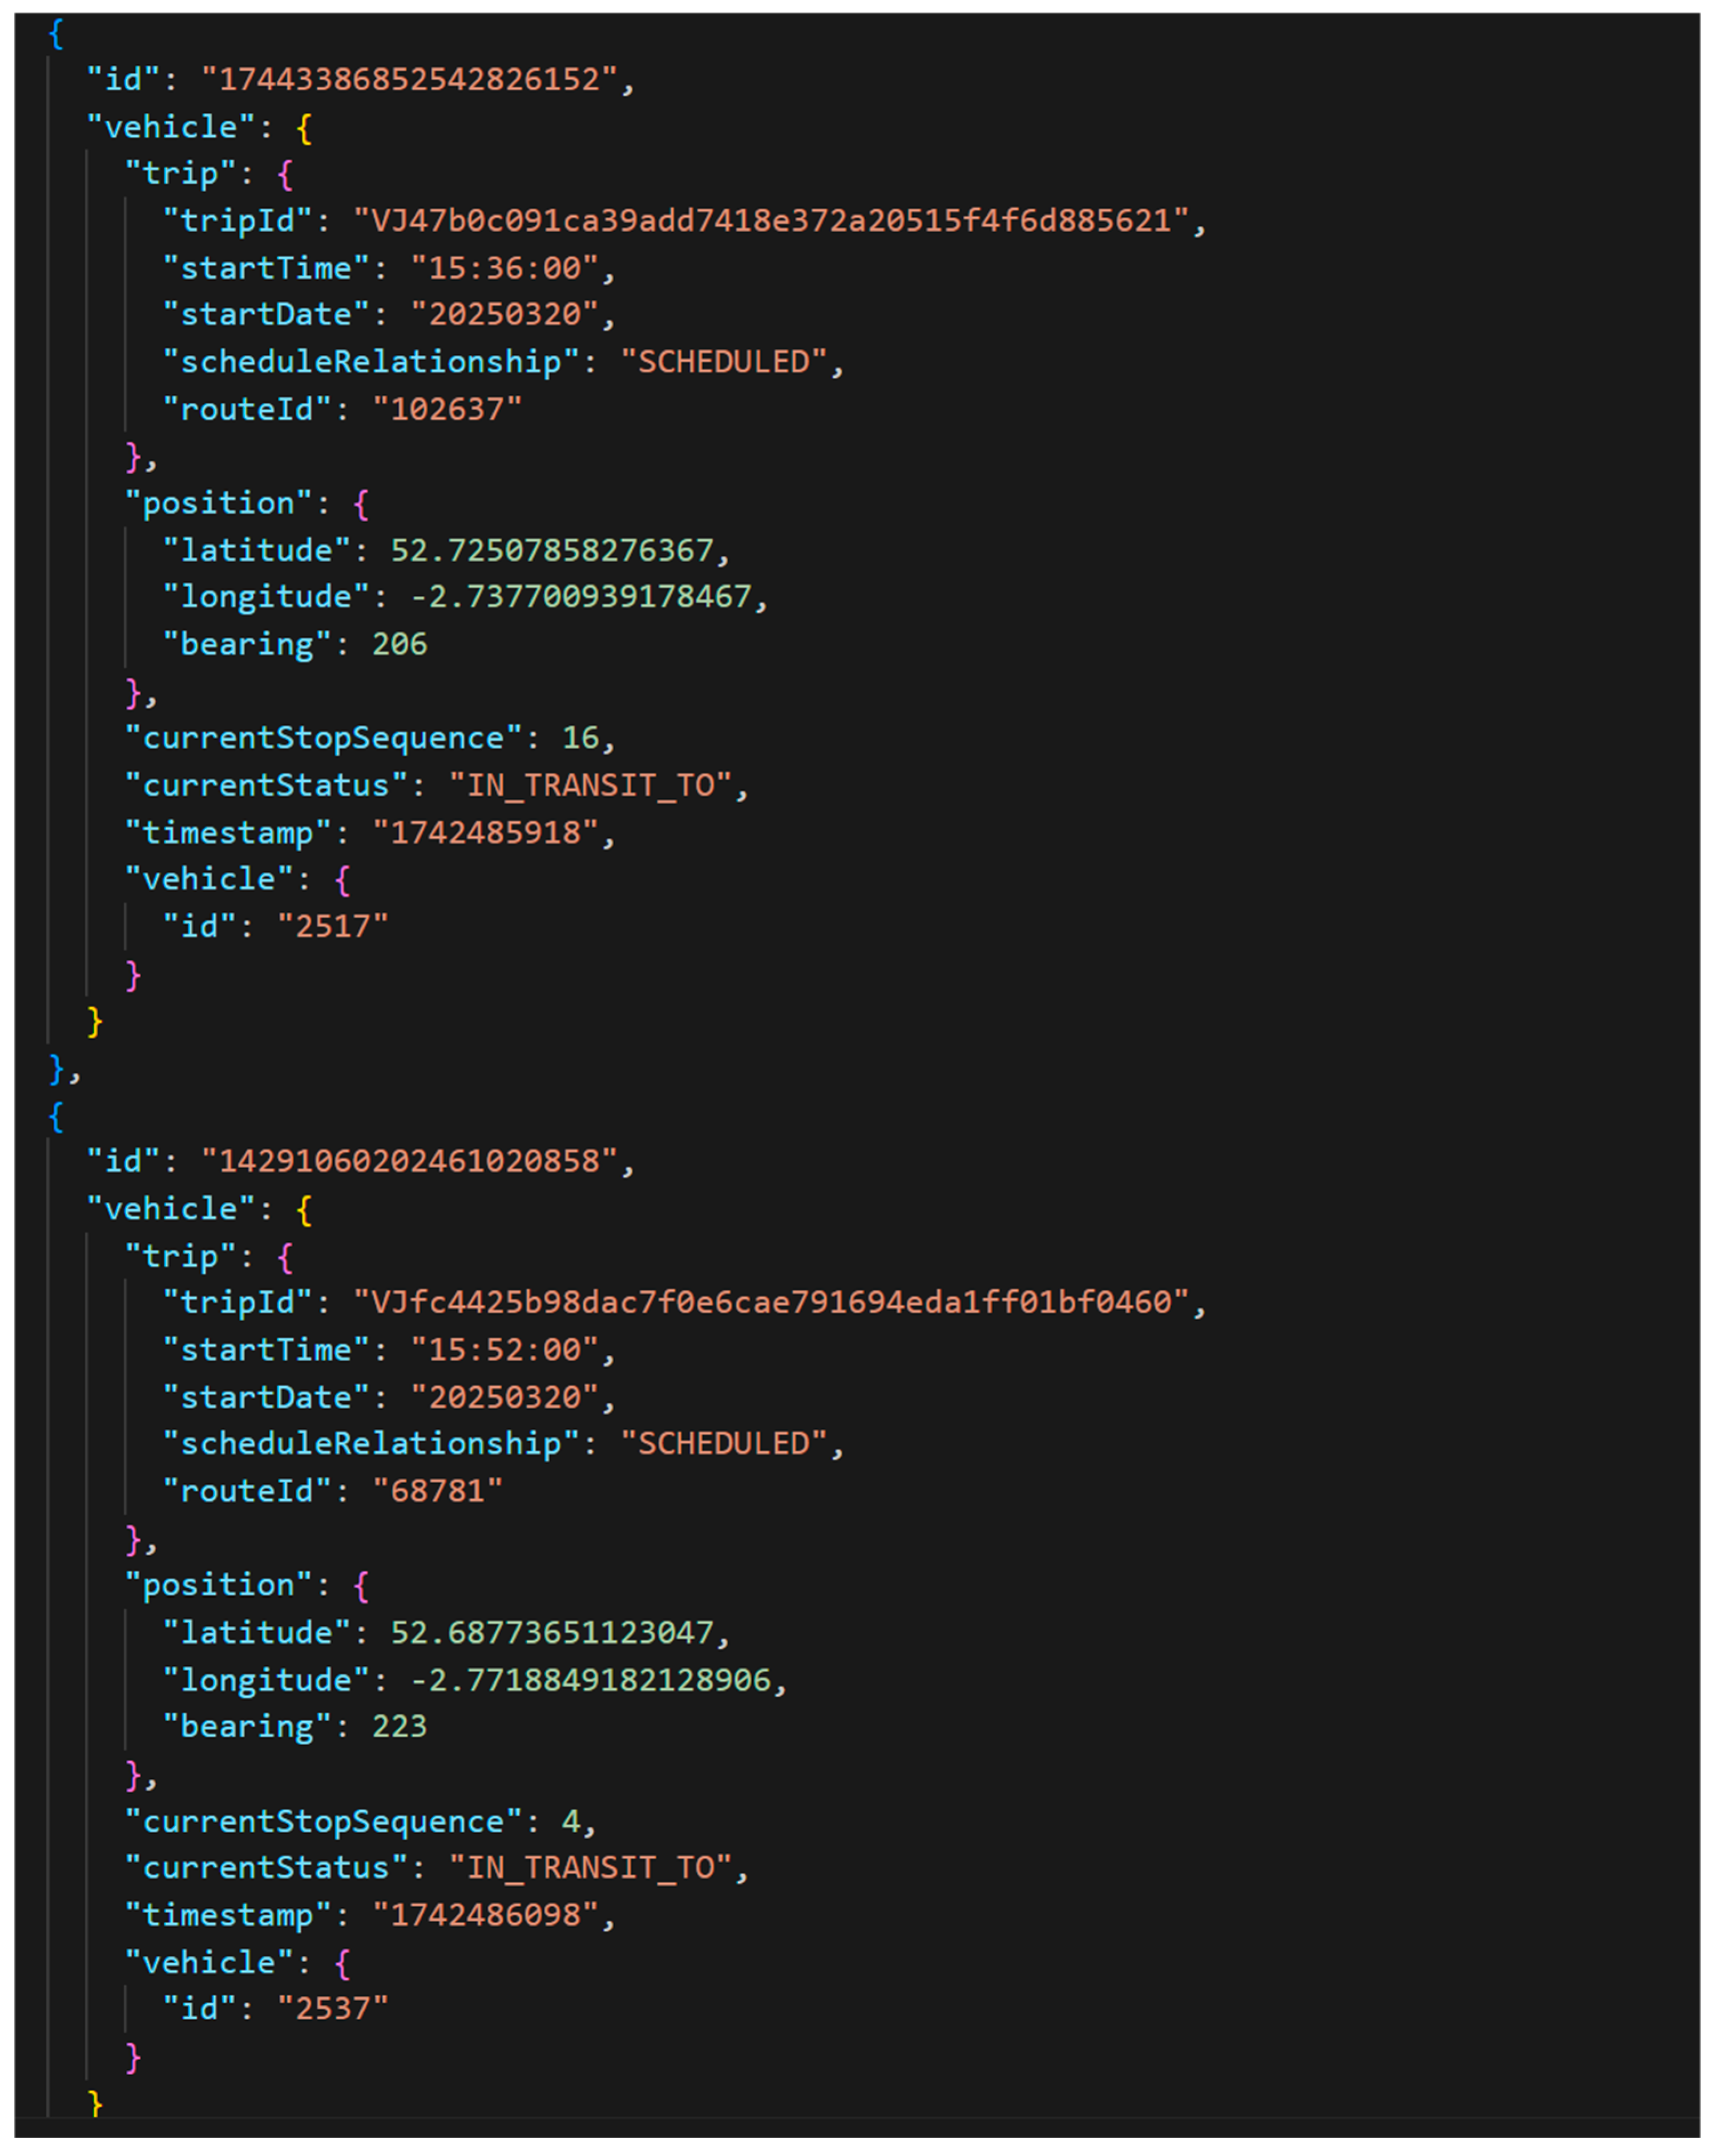
In addition to the continuous updates provided by SIRI-VM, the BODS service also includes a Situation Exchange component (SIRI-SX). This disseminates information regarding service disruptions, planned maintenance, and other operational incidents that might affect transit performance. Whereas SIRI-VM focuses on real-time vehicle locations and journey identifiers, SIRI-SX aims to provide contextual data to explain any deviations from scheduled services, such as trip delays, cancellations, or modifications in service provision. Incorporating SIRI-SX data into accessibility analyses can further enhance a researcher’s understanding of travel time variability by identifying the underlying causes of discrepancies between scheduled and actual service performance. This additional information is particularly valuable for refining models of real-world accessibility, offering a more nuanced assessment of transit reliability and its implications for spatial equity.
Figure 3 and Table 2 show how the SIRI-SX data is structured into multiple situation records, with each record offering a comprehensive description of an incident. Table 2 summarizes key fields in SIRI-SX feeds, which are used to report service disruptions, delays or cancellations. These messages offer important contextual information that complements vehicle tracking data and are vital for understanding service irregularities. The ResponseTimestamp and CreationTime fields ensure data reflect current conditions, while the SituationNumber serves as a unique identifier for each disruption event. To help understand the nature of a disruption, the MiscellaneousReason field is used to categorize the issue (e.g., roadworks, congestion, accident), and the Planned field indicates whether the event was anticipated or arose as an emergency. The validity period specifies a time range over which the disruption is expected to last, and PublicationWindow documents when the information was made available. The disruption’s impact is detailed under the Summary and Description fields, while Severity ranks its seriousness. The AffectedNetwork and AffectedLine data are used to identify which routes and which operators are impacted. Further specificity is provided by AffectedStopPoint, which lists affected stops and their coordinates. To help passengers adjust their journeys the Advice field provides re-routing suggestions, and InfoLinks provides external sources for further details. This highly structured approach enables transport agencies to communicate disruptions effectively, but it also allows researchers to analyse the frequency, duration, and impact of service interruptions.

3.5. GTFS-RT

Like SIRI, GTFS-RT provides a standardized format for disseminating real-time transit information, such as delays, cancellations, and modifications to bus arrival and departure times. Unlike static GTFS data, which only represents scheduled services, GTFS-RT dynamically reflects any changes in transit operations, potentially giving a more realistic picture of travel times and route reliability. The GTFS-RT format effectively combines the information that the two SIRI feeds provide, while also presenting additional information such as the specific time that buses arrive at each stop. GTFS-RT also offers live information regarding operational changes, such as delays, cancellations, and route modifications to scheduled services. The specification comprises several message types, including FeedHeader, TripUpdate, and VehiclePosition. The TripUpdate message communicates deviations from scheduled trip times, while VehiclePosition conveys the current geographic location of in-transit vehicles. Incorporating GTFS-RT data into transit analyses can allow for more accurate modelling of accessibility, as it captures the actual performance of the service rather than its planned delivery. This integration is particularly valuable for assessing travel time reliability and for identifying discrepancies between the scheduled and observed service levels, helping to inform both operational improvements and strategic planning.
Table 3 and Figure 4 present the various data fields of a GTFS-RT data stream. Table 3 outlines the primary GTFS-RT entities used in real-time public transport data: vehicle positions, trip updates, and service alerts. These fields enable the integration of live service information into accessibility models, supporting dynamic analysis of transport availability and reliability. The ID, TripID, and RouteID data can be used to help store, retrieve, and analyse the dataset, with the trip ID and route ID providing a direct link to the static GTFS data. The startTime, startDate, and currentstopsequence fields can then be exploited to compare the actual execution of a trip with its description in the static GTFS and thus identify any late or early arrivals. The schedule relationship and status fields provide context on a trip, supplying information regarding whether a trip is currently in transit or has been cancelled or diverted. Finally, the timestamp provides a context for the analysis by adding information about when the data were actually collected.
There is a general lack of published research to date that has exploited SIRI sources while, in contrast, GTFS-RT has been used in several US studies to analyse errors in static data based on US transit feeds [50]. Although such research reports on uses of GTFS-RT data, there are notable differences in the information provided in US data streams compared to the UK. The UK GTFS-RT output, shown in Table 3, contains various context fields, such as stopsequence, startTime, startDate, and TripID. This differs somewhat from US feeds, which contain alternative reference fields such as prediction, which predicts when a bus will arrive at the next stop.

4. The Application of Real-Time Travel Data

4.1. Comparative Analysis of Four Transit Data Sources

Static GTFS has been widely used for conveying transit schedules and for route planning. GTFS-RT extends this resource by offering real-time updates on vehicle position, service delays, and trip modifications. Meanwhile, SIRI is an XML-based standard specifically designed for real-time data exchange in European transit systems. It includes multiple modules, with SIRI-VM focusing upon vehicle monitoring and SIRI-SX handling the details of any service disruptions. Table 4 presents a comparative analysis of the four data standards: GTFS, GTFS-RT, SIRI-VM, and SIRI-SX. From studying this table, it can be surmised that each product serves a distinct function in public transport data management, with the scheduled GTFS offering the baseline role of a static representation of planned services. GTFS-RT extends GTFS by adding real-time updates. Meanwhile, SIRI-VM and SIRI-SX form a part of the European SIRI standard and focus on vehicle monitoring and service disruptions, respectively.
Table 4 highlights some of the relative strengths and limitations of each format. It reports that both GTFS formats are widely used in North America due to their integration with major trip-planning applications, whereas SIRI is much more prevalent in European transport systems. The best choice between these data standards will depend on researcher’s specific operational needs: GTFS-RT is ideal when integrating real-time updates into trip-planning applications, but SIRI-VM allows for highly granular vehicle monitoring, making it particularly valuable for fleet management. Similarly, SIRI-SX excels in disruption management, offering a structured approach to reporting service interruptions. Ultimately, the selection of a particular data standard is likely to be context-dependent, and it will be strongly influenced by regional adoption, technical infrastructure, and the intended use case.

4.2. GTFS-RT Entities and Data Variation

While GTFS-RT provides a structured approach to real-time transit data, its implementation varies amongst data providers. The following section examines different GTFS-RT entities and how data availability might influence its effectiveness when adopted for use in accessibility analyses. As specified by General Transit Feed Specification [51] GTFS-RT has four feed entities, each providing different information. The first, trip updates, provide real-time adjustments to the scheduled trips, including any delays, revised arrival and departure times, skipped stops, and trip cancellations. This is essential for keeping passengers informed about changes from planned schedules, allowing for better trip planning and improved service reliability. Transit agencies use trip updates to adjust their predicted arrival times dynamically and to help riders receive accurate transit information.
The second is vehicle positions, which gives information on real-time vehicle locations and some information on trips and departure times. This feed allows passengers to see a live location of their bus or train, which helps to improve estimated arrival predictions and also assists transit operators in their fleet management. This entity is the only one available in the BODS (Bus Open Data Service) for the UK. Thus, data provided via the UK government is somewhat more limited in nature than that supplied by some other institutions, and this may hamper its value in certain analyses. For example, since BODS only contains the departure time, trip ID, and vehicle location information, it essentially lacks any estimated travel predictions. Despite the absence of this information within the feed, it is possible for UK users to generate equivalent information themselves by directly comparing departure times between the live and timetabled resources.
The third entity in GTFS-RT are the service alerts that communicate any major disruptions impacting upon services, such as detours, stop closures, or cancellations. These alerts provide details on the severity, duration, and affected routes or stops, thus helping passengers to make better informed travel decisions. Transit agencies can use this item to quickly inform riders of any unexpected changes and to offer alternative routes. Trip modifications represent proactive changes to scheduled trips before they commence. Unlike trip updates, which adjust active trips, these trip modifications handle planned alterations such as added, rescheduled, or re-routed trips. It is crucial for integrating last-minute changes into transit systems and for helping passengers to receive accurate pre-trip information.
The UK’s BODS GTFS-RT excludes estimated travel times and predicted schedule deviations. This limitation affects it potential for real-time accessibility analysis, as key insights, such as expected delays, must be inferred by comparing the live data with the static schedules. In contrast, other GTFS-RT implementations, such as those examined in previous research [24,52], incorporate additional entities such as schedule deviation metrics. Such differences illustrate how the analytical value of GTFS-RT data can vary markedly between regions and across transit agencies. Overall, the effectiveness of GTFS-RT as a real-time data standard will depend upon the completeness of its implementation by individual transit agencies. While some providers offer detailed feeds that incorporate all four entities, others, for example, BODS, only provide a more limited dataset. This variation underscores the importance of evaluating regional data availability when considering the use of GTFS-RT for accessibility analysis and transport planning.

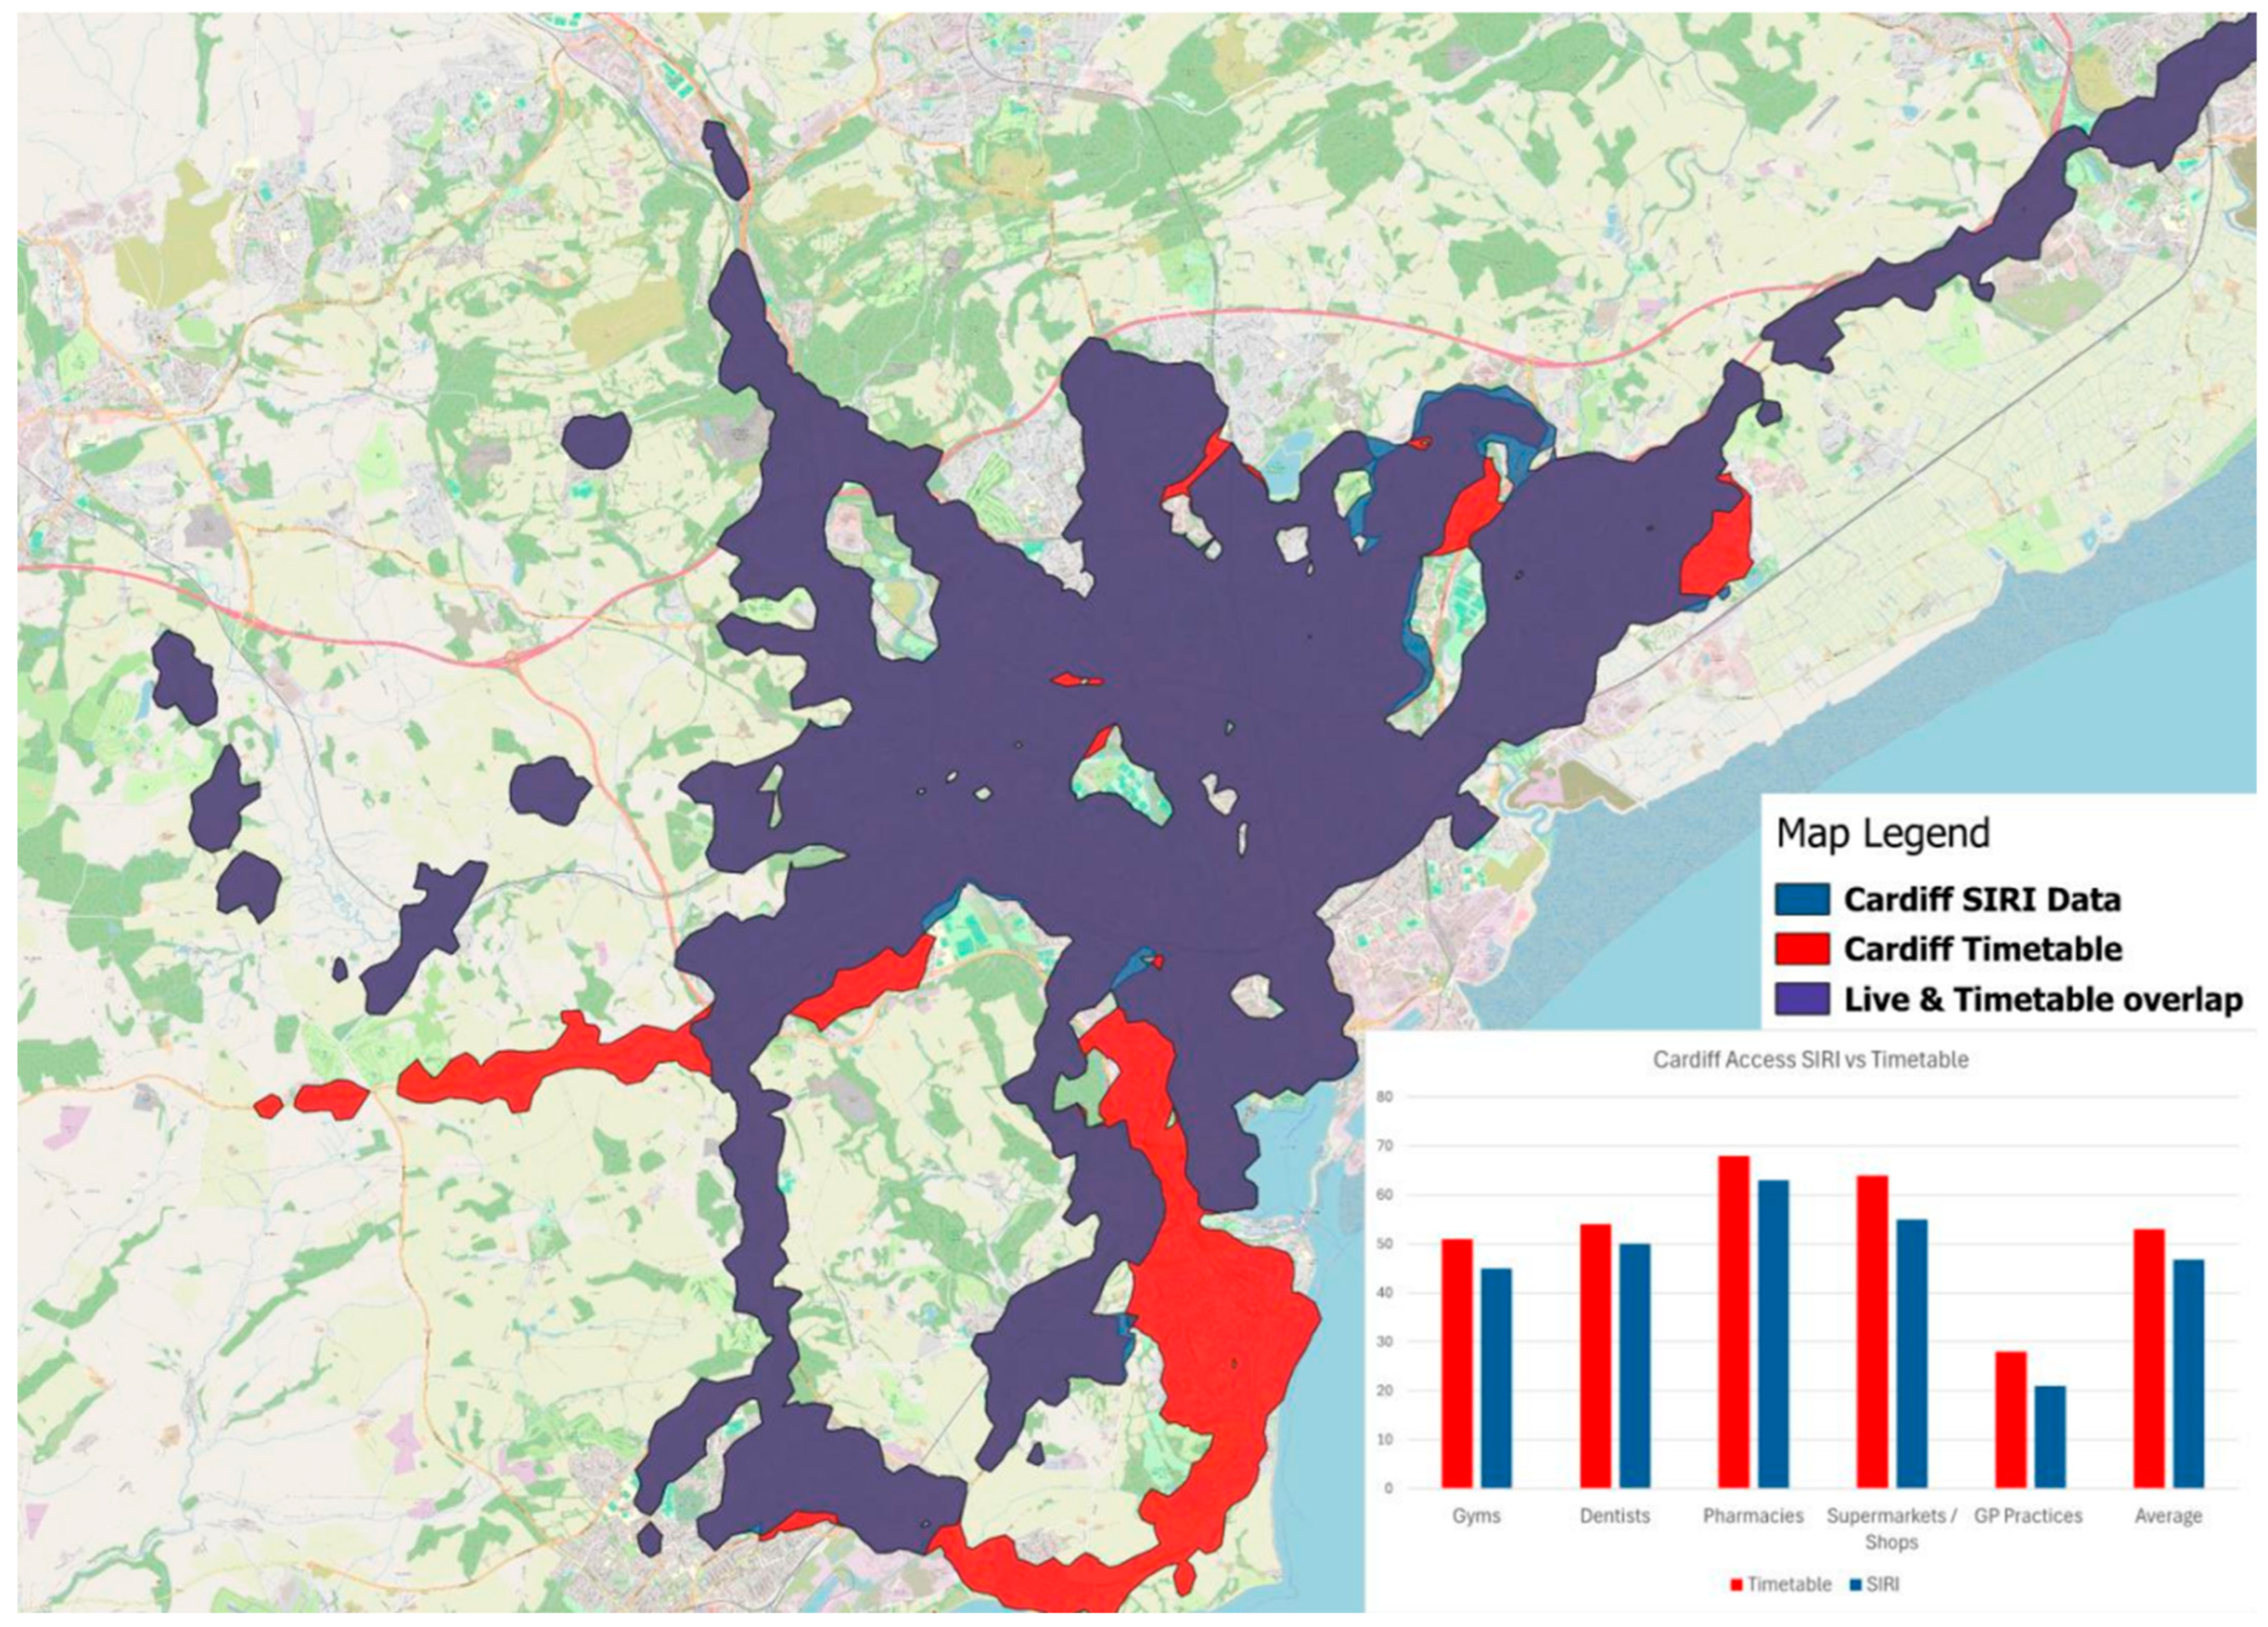
4.3. Real-Time vs. Timetable-Based Accessibility in Cardiff

To demonstrate the impact of service cancellations on public transport accessibility, we compare accessibility scores and isochrone extents derived from both real-time vehicle location data (SIRI-VM) and static timetable data (BODS timetables). This serves to highlight how discrepancies can arise when relying solely on scheduled service data, offering insights into the limitations of conventional timetable-based modelling.
Figure 5 illustrates differences detected for Cardiff, the capital city of Wales, when adopting a 60 min travel time from a central transport hub at 08:30 on a weekday. The areas shown in red are accessible according to the timetable but, in reality, they are not because scheduled services did not operate as planned. Areas of overlap or agreement between live and scheduled data are shown in purple, while areas that are identified as being accessible only from the real-time data are marked in dark blue.
One striking example is observed in the southern part of the city, where scheduled access to key destinations such as gyms and health facilities did not materialize in the live data. The accompanying bar chart quantifies this: the timetable suggests that 55 gyms are reachable within the catchment, but real-time data reveals access to only 50. Similar disparities arise across other destination types, revealing service gaps that would not be captured through a static schedule-based analysis.
These findings underscore the risk of overestimating accessibility when relying solely on planned schedules. The integration of real-time data provides a more accurate picture of transport performance and has implications for realized access to services. This approach offers a more robust foundation for both equity assessment and operational planning.

4.4. Summary of Data Processing Methods and Sources

The comparative evaluation of static and real-time transit data above highlights the relative strengths and limitations of GTFS, GTFS-RT, SIRI-VM, and SIRI-SX in different transit applications. GTFS provides a standardized framework for schedule-based accessibility analysis. GTFS-RT enhances this by incorporating live operational updates, thus making it a valuable tool for real-time trip planning and delay monitoring. Similarly, SIRI-VM enables detailed vehicle tracking, and so it supports those applications that require high-frequency positional updates, while SIRI-SX is an essential resource for disruption management by providing structured incident reports. Variations in data availability and completeness, such as the limited implementation of GTFS-RT in BODS, can impact the accuracy of accessibility assessments and travel time predictions. Such disparities underscore the need for further research into the integration of real-time transit data into accessibility modelling, which is itself important for ensuring that transit planning and policy decisions can reflect the operational realities of public transport networks.

5. Discussion and Conclusions

This paper addresses the need for more research regarding the integration of actual travel reliability and service delivery into accessibility measurements [14]. It has been stated that “There is a need to understand the extent to which delays can alter the representation of accessibility by public transport that would have been produced using timetable data” [44] (p. 1). The availability of online open data sources of real-time traffic data now enable such comparisons to be made and points to the potential advantages of adopting GTFS-Realtime and SIRI over static schedules. By drawing attention to the potential uses of live bus data in transport studies while analysing the limitations and strengths of the datasets to ensure their effectiveness, this study adds to a growing body of research that is investigating the use of accessibility measures to examine the implications of disruptions in road networks. Bergantino et al. [53], for example, have used such indicators to estimate impacts resulting from traffic disruptions on travel times and on the distribution of jobs in a region of southern Italy. This approach, they suggest, has the potential to aid transport planners and others in daily emergency situations such as traffic collisions or climate-induced events such as flooding, landslides, or fallen trees, with wider implications for infrastructure planning. Such research also has the potential to examine the social equity implications of changes in network conditions at a range of spatial and temporal scales and thus to provide a “more nuanced understanding of urban accessibility” [42] (p. 1).

5.1. Advantages of Using Real-Time Data in Accessibility Modelling

The adoption of real-time data sources such as GTFS-RT and SIRI offers several important advantages for accessibility modelling. First, this data allows for the consideration of actual service performance rather than relying upon an idealized schedule and thus provides a more realistic representation of public transport availability and reliability. This is particularly valuable in assessing spatial equity, as it can capture fluctuations in service provision that may disproportionately affect certain areas or populations. Second, real-time feeds can be integrated into open-source routing engines and GIS workflows to enable dynamic and high-resolution modelling of transport scenarios. Third, these data sources can improve responsiveness in planning contexts, supporting applications such as disruption monitoring and emergency response modelling by reflecting the system’s current state. Lastly, the increasing availability of open-access real-time data across many international regions enhances the reproducibility and scalability of such analyses, contributing to transparent, data-driven decision-making.

5.2. Limitations and Challenges

Notwithstanding their advantages, real-time transit data sources also present several potential limitations. One major constraint is inconsistency in data availability and completeness across regions and providers. In the UK, for example, the GTFS-RT feed via the Bus Open Data Service (BODS) lacks some key entities, such as predicted arrival times, which are available in other international implementations. This limits the potential for real-time travel time prediction and reduces analytical flexibility. Furthermore, the processing of real-time data often requires substantial technical knowledge, including familiarity with APIs, data formats (e.g., Protobuf or XML), and record matching logic to align real-time and scheduled records. This poses a significant barrier to entry for non-technical users, although the future development of open-source toolkits could help to mitigate this. Finally, data accuracy and consistency depend heavily on the quality of onboard systems and on agency’s reporting practices, meaning that errors or inconsistencies in vehicle location or service updates can propagate through to the accessibility results.

5.3. International Relevance and Transferability

Although this study focuses on the UK context via the Bus Open Data Service (BODS), the methodology proposed is broadly transferable to other international settings that use GTFS-RT, SIRI, or similar real-time data standards. The analytical workflow for comparing scheduled and observed accessibility can be applied globally using open-source tools and publicly available datasets. One key example is the Mobility Database [54], which aggregates thousands of GTFS and GTFS-RT feeds from transit agencies across dozens of countries. This demonstrates the increasing international availability of real-time transit data and supports the global applicability of methods used in this study. While differences in institutional structures and data completeness exist, the core conclusion remains valid: timetable-only analyses risk overestimating accessibility. As more regions invest in open transport data, the approach outlined here provides a scalable and practical framework for improving the accuracy and equity of accessibility assessments worldwide.
Future work will draw on the various datasets available through platforms like the Mobility Database to conduct comparative analyses across cities and transport networks. This will enable a more systematic evaluation of how data quality, network design, and service reliability influence accessibility outcomes in varied global contexts.

5.4. Conclusion and Future Directions

In addressing this study’s primary aim to evaluate real-time transit data for accessibility analysis, our research has drawn attention to previous studies that demonstrate how live data sources can potentially provide more accurate representations of travel time reliability compared to scheduled information. The technical review of GTFS-RT and SIRI-VM presented here outlines their respective advantages and limitations, particularly in the UK context, where the Bus Open Data Service (BODS) has some unique constraints. Our findings support the argument that integrating real-time data into accessibility models can provide a more nuanced understanding of urban mobility, transit equity, and service reliability. In demonstrating the advantages and limitations of GTFS-RT and SIRI-VM, this study reinforces the need for more dynamic approaches to accessibility modelling.
However, while these findings highlight the potential of real-time data, some notable research gaps remain. For example, further research is required to explore the potential integration of live bus data into broader accessibility and public transport models by incorporating additional temporal dynamics such as travel demand fluctuations and facility opening times. This would allow for a more precise evaluation of real-world accessibility, particularly in areas where service reliability is seen to vary markedly throughout the day. More research is also needed to investigate the social equity implications of real-time transit data, examining whether spatial and temporal discrepancies between scheduled and actual services disproportionately impact specific demographic groups, particularly those most reliant upon public transport [55]. Expanding these analyses across multiple cities and transport networks and adopting a wider range of accessibility measures would help to assess the broader applicability of open-source data when evaluating the impact of transport changes [6]. Combining live bus data with predictive modelling techniques could also enhance service optimization, allowing agencies to better anticipate delays and adjust operations dynamically.
To conclude, this paper responds to calls for further research on the potential integration of travel time reliability into spatial and temporal assessments of accessibility that include the types of data described herein [14]. Such resources are increasingly used by transport agencies to measure various aspects of service reliability, but as researchers such as Nichols et al. [44] point out, there is also a need to better understand how delays and cancellations can impact upon accessibility measures that hitherto have relied solely on scheduled timetable data. The current study reinforces the need to incorporate information regarding delays, cancellations, and route changes into accessibility measurements, highlighting the potential of open, real-time data sources such as GTFS-Realtime and SIRI to provide a more accurate reflection of true service reliability and operation.
While real-time public transport data is increasingly used in passenger-facing applications, such as journey planning and live arrival tracking, this study demonstrates a novel application of these data for retrospective network-wide accessibility modelling. By evaluating the completeness and structure of real-time feeds like GTFS-RT and SIRI-VM, and by linking them to GIS-based workflows, we highlight how discrepancies between scheduled and actual service delivery can significantly influence accessibility estimates. This approach provides actionable insights for planners and policymakers seeking to understand the reliability of transit services not just in real time but also in terms of their longer-term spatial and social impacts. As such, the study offers both methodological advancement and practical relevance for accessibility assessment using open transit data.
Perceptions regarding the reliability of such services may have a big part to play in explaining trends in commuting patterns and in making modal choices and could therefore impact on policies that are designed to encourage people to make greater use of public transport (especially when accessing potential job opportunities). These relatively new sources of data, when combined with open-source GIS approaches, provide an opportunity to model more realistically access to vital services and to further explore the social equity implications of transit interventions based on GTFS datasets. The live data sources described in this paper can provide insights that remind researchers of the potential drawbacks of relying on scheduled timetable data that fail to incorporate day-to-day cancellations or trip updates. By leveraging real-time transit data in the ways we discuss, future research can contribute to the development of more responsive, equitable, and data-driven public transport systems.

Author Contributions

All authors were responsible for conceptualization. Liam Webb was responsible for original draft preparation, downloading data from open data sources, and visualization. Gary Higgs, Mitchel Langford, and Robert Berry were responsible for further writing, review and editing, and project administration. All authors have read and agreed to the published version of the manuscript.

Funding

This research was funded by the Economic and Social Research Council (ESRC), Grant Number: ES/S012435/1.

Data Availability Statement

Data available in a publicly accessible repository.

Acknowledgments

This paper is based on research supported by the Wales Institute of Social and Economic Research and Data (WISERD), a collaborative venture between the Universities of Aberystwyth, Bangor, Cardiff, South Wales, and Swansea.

Conflicts of Interest

The authors declare no conflicts of interest.

References

  1. Acharya, S.; Garikapati, V.M.; Allen, M.; Lyu, M.; Hoehne, C.; Sharda, S.; Fitzgerald, R. Enriching OpenStreetMap network data for transportation applications: Insights into the impact of urban congestion on accessibility. J. Transp. Geogr. 2025, 123, 104096. [Google Scholar] [CrossRef]
  2. Forth, T. Transport Open Data in 2023. Available online: https://tomforth.co.uk/transportin2023/ (accessed on 17 April 2025).
  3. Liu, L.; Miller, H.J. Measuring risk of missing transfers in public transit systems using high-resolution schedule and real-time bus location data. Urban Stud. 2021, 58, 3140–3156. [Google Scholar] [CrossRef]
  4. Lovelace, R. Open-source tools for geographic analysis in transport planning. J. Geogr. Syst. 2021, 23, 547–578. [Google Scholar] [CrossRef]
  5. Urbano, V.M.; Arena, M.; Azzone, G. Big data for decision-making in public transport management: A comparison of different data sources. Res. Transp. Bus. Manag. 2025, 59, 101298. [Google Scholar] [CrossRef]
  6. Klar, B.; Lee, J.; Long, J.A.; Diab, E. The impacts of accessibility measure choice on public transit project evaluation: A comparative study of cumulative, gravity-based, and hybrid approaches. J. Transp. Geogr. 2023, 106, 103508. [Google Scholar] [CrossRef]
  7. Camus, R.; Longo, G.; Macorini, C. Estimation of transit reliability level-of-service based on automatic vehicle location data. Transp. Res. Rec. 2005, 1927, 277–286. [Google Scholar] [CrossRef]
  8. Dardas, A.; Hall, B.; Salter, J.; Hosseini, H. A geospatial workflow for the assessment of public transit system performance using near real-time data. Trans. GIS 2022, 26, 1642–1664. [Google Scholar] [CrossRef]
  9. de Almeida Correia, P.; Carpio-Pinedo, J.; Moya-Gómez, B.; Condeço-Mehorado, A. Modal Accessibility Gap in Curitiba (Brazil). Dynamic Analysis Considering Time and Spatial Variations. Appl. Spat. Anal. Policy 2025, 18, 34. [Google Scholar] [CrossRef]
  10. Kathuria, A.; Parida, M.; Chalumuri, R.S. Travel-time variability analysis of bus transit system using GPS data. J. Transp. Eng. Part A Syst. 2020, 146, 05020003. [Google Scholar] [CrossRef]
  11. Lee, D.; Qian, S. Using APC-AVL data to improve transit reliability and accessibility analysis. J. Transp. Eng. Part A Syst. 2024, 150, 04023127. [Google Scholar] [CrossRef]
  12. Ma, J.; Chan, J.; Risanoski, G.; Rajasegarar, S.; Leckie, C. Bus travel time prediction with real-time traffic information. Transp. Res. Part C 2019, 105, 536–549. [Google Scholar] [CrossRef]
  13. Ma, Z.-L.; Ferreira, L.; Mesbah, M.; Hojati, A.T. Modeling Bus Travel Time Reliability with Supply and Demand Data from Automatic Vehicle Location and Smart Card Systems. Transp. Res. Rec. J. Transp. Res. Board 2015, 2533, 17–27. [Google Scholar] [CrossRef]
  14. Bimpou, K.; Ferguson, N.S. Dynamic accessibility: Incorporating day-to-day travel time reliability into accessibility measurement. J. Transp. Geogr. 2020, 89, 102892. [Google Scholar] [CrossRef]
  15. Conway, M.W.; Byrd, A.; van der Linden, M. Evidence-based transit and land use sketch planning using interactive accessibility methods on combined schedule and headway-based networks. Transp. Res. Rec. 2017, 2653, 45–53. [Google Scholar] [CrossRef]
  16. Conway, M.W.; Byrd, A.; Van Eggermond, M. Accounting for uncertainty and variation in accessibility metrics for public transport sketch planning. J. Transp. Land Use 2018, 11, 541–558. [Google Scholar] [CrossRef]
  17. Wessel, N.; Farber, S. On the accuracy of schedule-based GTFS for measuring accessibility. J. Transp. Land Use 2019, 12, 475–500. [Google Scholar] [CrossRef]
  18. Bills, T.S.; Carrel, A.L. Transit accessibility measurement considering behavioural adaptations to reliability. Transp. Res. Rec 2021, 2675, 265–278. [Google Scholar] [CrossRef]
  19. Department for Transport. SIRI-VM Technical Guidance (Published 21st October 2020). Available online: https://www.gov.uk/government/publications/technical-guidance-publishing-location-data-using-the-bus-open-data-service-siri-vm/technical-guidance-siri-vm (accessed on 17 April 2025).
  20. Bok, J.; Kwon, Y. Comparable measures of accessibility to public transport using the General Transit Feed Specification. Sustainability 2016, 8, 224. [Google Scholar] [CrossRef]
  21. Prommaharaj, P.; Phithakkitnukoon, S.; Demissie, M.; Kattan, L.; Ratti, C. Visualizing public transit system operation with GTFS data: A case study of Calgary, Canada. Heliyon 2020, 6, e03729. [Google Scholar] [CrossRef]
  22. Viri, R.; Örmä, M. Using GTFS-data to calculate the roadwork caused delays on public transport network, World Conference on Transport Research—WCTR 2023 Montreal 17–21 July 2023. Transp. Res. Proc. 2025, 82, 1965–1973. [Google Scholar]
  23. Wessel, N.; Widener, M. Discovering the space-time dimensions of schedule padding and delay from GTFS and real-time transit data. J. Geogr. Syst. 2017, 19, 93–107. [Google Scholar] [CrossRef]
  24. Aemmer, Z.; Ranjbari, A.; MacKenzie, D. Measurement and classification of transit delays using GTFS-RT data. Public Transp. 2022, 14, 263–285. [Google Scholar] [CrossRef]
  25. Coghlan, C.; Dabiri, S.; Mayer, B.; Wagner, M.; Williamson, E.; Eichler, M.; Ramakrishnan, N. Assigning bus delay and predicting travel times using automated vehicle location data. Transp. Res. Rec. 2019, 2673, 624–636. [Google Scholar] [CrossRef]
  26. Currie, G.; Mesbah, M. Visualization of geographical information system and automatic vehicle location data to explore transit performance. Transp. Res. Rec. 2011, 2216, 59–66. [Google Scholar] [CrossRef]
  27. Jung, Y.-J.; Casello, J.M. Assessment of the transit ridership prediction errors using AVL/APC data. Transportation 2020, 47, 2731–2755. [Google Scholar] [CrossRef]
  28. Kumar, S.B.V.; Fedujwar, R.; Agarwal, A. Travel Time Variability of Bus Routes in Delhi using Real-Time GTFS Data. In Proceedings of the COMSNETS 2024: 16th International Conference on Communication Systems & Networks (COMSNETS), Bengaluru, India, 3–7 January 2024. [Google Scholar] [CrossRef]
  29. Li, T.; Meredith-Karam, P.; Kong, H.; Stewart, A.; Attanucci, J.P.; Zhao, J. Comparison of door-to-door transit travel time estimation using schedules, real-time vehicle arrivals, and Smartcard Inference Methods. Transp. Res. Rec. 2021, 2675, 1003–1014. [Google Scholar] [CrossRef]
  30. Lu, K.; Liu, J.; Zhou, X.; Han, B. A review of big data applications in urban transit systems. IEEE Trans. Intell. Transp. 2021, 22, 2535–2552. [Google Scholar] [CrossRef]
  31. Park, Y.; Mount, J.; Liu, L.; Xiao, N.; Miller, H.J. Assessing public transit performance using real-time data: Spatiotemporal patterns of bus operation delays in Columbus, Ohio, USA. Int. J. Geogr. Inf. Sci. 2020, 34, 367–392. [Google Scholar] [CrossRef]
  32. Pi, X.; Egge, M.; Whitmore, J.; Qian, Z.; Silbermann, A. Understanding Transit System Performance Using AVL-APC Data: An Analytics Platform with Case Studies for the Pittsburgh Region. J. Public Transp. 2018, 21, 19–40. [Google Scholar] [CrossRef]
  33. Liu, L.; Porr, A.; Miller, H.J. Measuring the impacts of disruptions on public transit accessibility and reliability. J. Transp. Geogr. 2024, 114, 103769. [Google Scholar] [CrossRef]
  34. Cui, M.; Levinson, D. Accessibility and the ring of unreliability. Transp. A Transp. Sci. 2018, 14, 4–21. [Google Scholar] [CrossRef]
  35. Lee, J.; Miller, H.J. Robust accessibility: Measuring accessibility based on travelers’ heterogeneous strategies for managing travel time uncertainty. J. Transp. Geogr. 2020, 86, 102747. [Google Scholar] [CrossRef]
  36. Liu, L.; Porr, A.; Miller, H.J. Realizable accessibility: Evaluating the reliability of public transit accessibility using high-resolution real-time data. J. Geogr. Syst. 2023, 25, 429–451. [Google Scholar] [CrossRef] [PubMed]
  37. Wessel, N.; Allen, J.; Farber, S. Constructing a routable retrospective transit timetable from a real-time vehicle location feed and GTFS. J. Transp. Geogr. 2017, 62, 92–97. [Google Scholar] [CrossRef]
  38. Steiner, D.; Hochmair, H.; Paulus, G. Quality assessment of open real time data for public transportation in The Netherlands. J. Geogr. Infor. Sci. 2015, 2015, 579–588. [Google Scholar]
  39. Van Oort, N.; Sparing, D.; Brands, T.; Goverde, R.M.P. Data driven improvements in public transport: The Dutch example. Public Transp. 2015, 7, 369–389. [Google Scholar] [CrossRef]
  40. Basso, F.; Frez, J.; Martinez, L.; Pezoa, R.; Varas, M. Accessibility to opportunities based on public transport gps-monitored data: The case of Santiago, Chile. Travel Behav. Soc. 2020, 21, 140–153. [Google Scholar] [CrossRef]
  41. Chen, B.Y.; Yuan, H.; Li, Q.; Wang, D.; Shaw, S.-L.; Chen, H.-P.; Lam, W.H.K. Measuring place-based accessibility under travel time uncertainty. Int. J. Geogr. Inf. Sci. 2017, 31, 783–804. [Google Scholar] [CrossRef]
  42. Nalin, A.; Fulman, N.; Wilke, E.C.; Ludwig, C.; Zipf, A.; Lantieri, C.; Vignali, V.; Simone, A. Evaluation of accessibility disparities in urban areas during disruptive events based on transit real data. Commun. Transp. Res. 2025, 5, 100160. [Google Scholar] [CrossRef]
  43. Braga, C.K.V.; Grangeiro, C.F.G.; Pereira, R.H.M. Evaluating the impact of public transport travel time inaccuracy and variability on socio-spatial inequalities in accessibility. J. Transp. Geogr. 2023, 109, 103590. [Google Scholar] [CrossRef]
  44. Nichols, A.; Ryan, J.; Palmqvist, C.-W. The importance of recurring public transport delays for accessibility and mode choice. J. Transp. Geogr. 2024, 115, 103796. [Google Scholar] [CrossRef]
  45. Lee, J.; Kim, J. Social equity analysis of public transit accessibility to healthcare might be erroneous when travel time uncertainty impacts are overlooked. Travel Behav. Soc. 2023, 32, 100588. [Google Scholar] [CrossRef]
  46. Department of Transport. Bus Open Data Service. Available online: https://www.bus-data.dft.gov.uk/ (accessed on 17 April 2025).
  47. Verduzco-Torres, J.R.; McArthur, D.P. Public transport accessibility indicators to urban and regional services in Great Britain. Sci. Data 2024, 11, 53. [Google Scholar] [CrossRef]
  48. Google Developers. GTFS Realtime Overview. Available online: https://developers.google.com/transit/gtfs-realtime (accessed on 17 April 2025).
  49. Google Developers. GTFS Static Overview. Available online: https://developers.google.com/transit/gtfs/ (accessed on 17 April 2025).
  50. Devunuri, S.; Lewis, L. A Survey of Errors in GTFS Static Feeds from the United States. Transp. Find. 2024. [Google Scholar] [CrossRef]
  51. General Transit Feed Specification. Available online: https://gtfs.org/documentation/realtime/feed-entities/overview/ (accessed on 17 April 2025).
  52. Newmark, G.L. Assessing GTFS Accuracy; San Jose University Project 2017; Mineta Transportation Institute: San Jose, CA, USA, 2024; Available online: https://transweb.sjsu.edu/sites/default/files/2017-Newmark-Public-Transit-Statistical-Analysis.pdf (accessed on 17 April 2025).
  53. Bergantino, A.S.; Troiani, G.; Bashir, T.; Pagliara, F. How vulnerable are road networks to shocks? An analysis through accessibility indicators. Sustain. Futures 2025, 9, 100471. [Google Scholar] [CrossRef]
  54. Mobility Database. Mobility Database Global Public Transit Data. Available online: https://mobilitydatabase.org/ (accessed on 3 June 2025).
  55. Tabascio, A.; Tiznado-Aitken, L.; Higgins, C.; Farber, S. Incorporating equity into transit performance measures: A disaggregated bus route level approach. Case Stud. Transp. Policy 2024, 17, 101256. [Google Scholar] [CrossRef]
Figure 1. Description of the GTFS provided via the Bus Open Data Service.
Ijgi 14 00243 g001
Figure 2. An example of SIRI-VM formatted data.
Ijgi 14 00243 g002
Figure 3. An example of SIRI-VM data.
Ijgi 14 00243 g003
Figure 4. An example of a GTFS-RT feed, after conversion from protobuf.
Ijgi 14 00243 g004
Figure 5. Comparisons in recorded access between TransXchange and SIRI-VM data within Cardiff (generated from city centre hub: Thursday 8.30 am).
Ijgi 14 00243 g005
Table 1. Description of the SIRI-VM data fields.
FieldDescriptionExample Value
ResponseTimestampTime when the SIRI-VM
response was generated
“2025-03-17T11:54:59.253+00:00”
ProducerRefIdentifies the entity providing the data, such as a transport
authority
“DepartmentForTransport”
RequestMessageRefA unique reference ID for the data request“eb8cd084-e479-439f-991d-9d3c7744414c”
ValidUntilIndicates how long the data is valid before being refreshed“2025-03-17T11:59:59.253+00:00”
ShortestPossibleCycleMinimum time interval for
updating the data
“PT5S” (5 s)
VehicleActivity.
RecordedAtTime
Timestamp when the vehicle’s position was recorded.“2025-03-17T11:54:22+00:00”
VehicleActivity.
ItemIdentifier
A unique identifier for the
vehicle activity event
“8eb3cb83-e692-4469-ba5e-de475a752e1c”
VehicleActivity.
ValidUntilTime
Indicates how long this vehicle activity data remains valid“2025-03-17T11:59:59.253+00:00”
MonitoredVehicleJourney.
LineRef
Transit route number or identifier“106”
MonitoredVehicleJourney.
DirectionRef
Specifies whether the vehicle is travelling inbound or outbound“outbound”
FramedVehicleJourneyRef.
DataFrameRef
Date when journey is scheduled“ 2025-03-17”
FramedVehicleJourneyRef.
DatedVehicleJourneyRef
Unique identifier for the
scheduled journey
“1130”
MonitoredVehicleJourney.
PublishedLineName
Human-readable route name“106”
MonitoredVehicleJourney.
OperatorRef
Reference code for the transit
operator
“A2BV”
MonitoredVehicleJourney.
OriginRef
Reference ID for the origin stop“2800S24007B”
MonitoredVehicleJourney.
OriginName
Name of the origin stop“Monk Road”
MonitoredVehicleJourney.
DestinationRef
Reference ID for destination stop“2800S24003E”
MonitoredVehicleJourney.
DestinationName
Name of the destination stop“Dominick House”
MonitoredVehicleJourney.
OriginAimedDepartureTime
Scheduled departure time from the origin stop“2025-03-17T11:30:00+00:00”
MonitoredVehicleJourney.
DestinationAimedArrivalTime
Scheduled arrival time at the destination“2025-03-17T12:12:00+00:00”
MonitoredVehicleJourney.
VehicleLocation.Latitude
Real-time latitude coordinate of the vehicle“53.436696”
MonitoredVehicleJourney.
VehicleLocation.Longitude
Real-time longitude coordinate of the vehicle“−3.056045”
MonitoredVehicleJourney.
Bearing
Compass direction the vehicle is travelling in“236”
MonitoredVehicleJourney.
BlockRef
A reference to a block of trips operated by the same vehicle“9”
MonitoredVehicleJourney.
VehicleRef
A unique identifier for the vehicle reporting the update“A2BV-RE24_TDZ”
Extensions.VehicleJourney.
Operational.
TicketMachineServiceCode
Service code from the ticket
machine
“106”
Extensions.VehicleJourney.
Operational.JourneyCode
Internal journey identifier used by the operator“1151”
Extensions.VehicleJourney.
VehicleUniqueId
A unique identifier for the vehicle across all services“021”
Table 2. Description of the SIRI-SX data fields.
FieldDescriptionExample Value
ResponseTimestampTime when the SIRI-VM
response was generated
“2025-03-17T11:54:59.253+00:00”
ProducerRefThe entity supplying the data (e.g., the transport authority)“DepartmentForTransport”
SituationNumberA unique identifier for the
disruption event
“27d24254-302b-462f-ba91-9b73aea59608”
CreationTimeThe time when the disruption event was first created“2023-12-18T11:52:24.450Z”
VersionA version number of the situation report. Updated if more details are added“5”
ProgressIndicates if the situation is
ongoing or resolved
“open”
ValidityPeriod.StartTimeStart time of the disruption“2023-12-18T11:50:00.000Z”
PublicationWindow.StartTimeTime at which the disruption
information was made publicly available
“2023-12-18T11:50:00.000Z”
MiscellaneousReasonCause of the disruption (e.g., roadworks, accidents, etc.)“roadworks”
PlannedSpecifies if the disruption was planned or unplanned“true” (for planned works)
SummaryA summary of the disruption“Halifax, Stainland Road/Salterhebble Junction (Calderdale)”
DescriptionDetailed explanation of
the disruption
“Salterhebble Junction bus stops will not be served until further notice due to roadworks.”
InfoLinks.UriWeb link with more details about the disruptionhttps://www.wymetro.com/plan-a-journey/travel-news/bus-travel-alerts/stainland-road-salterhebble-junction/” (18 June 2025)
SeveritySeverity of the disruption
(e.g., normal, slight, severe)
“slight”
AffectedNetwork.
VehicleMode
Mode of transport affected“bus”
AffectedLine.LineRefTransit line impacted“537”
AffectedOperator.
OperatorRef
Operator responsible for
the affected service
“FHUD”
AffectedStopPoint.
StopPointRef
Stop ID of affected locations“450022630”
AffectedStopPoint.
StopPointName
Name of affected stop“Salterhebble Junction”
AffectedStopPoint.LatitudeLatitude of affected stop“53.69771827952212”
AffectedStopPoint.LongitudeLongitude of affected stop“−1.85556356697551”
Advice.DetailsInformation for passengers on alternative routes or service changes“Services 537 and X1 are using next available stops on the route—Exley Bank 45022688 and Greetland Rd Bridge 45022690”
Table 3. Description of the GTFS-RT data fields.
FieldDescriptionExample Value
header.gtfsRealtimeVersionVersion of the GTFS-RT
specification used
“2.0”
header.incrementalityIndicates whether feed contains a complete dataset or
incremental updates
“FULL_DATASET”
header.timestampUnix timestamp indicating when feed was generated“1741617828”
entity.idA unique identifier for each
entity (i.e., vehicle update).
“17320025737829147199”
entity.vehicle.trip.tripIdA unique identifier for the trip, linking real-time update to the scheduled GTFS trip data“VJf0e21af477c8b1335584331b4fb683b205df4acb” or empty if not available
entity.vehicle.trip.routeIdIdentifier for the transit route associated with the trip“7428” or empty if not available
entity.vehicle.trip.startTimeScheduled start time of the trip (HH:MM:SS).“08:00:00”
entity.vehicle.trip.startDateScheduled start date of the trip (YYYYMMDD format).“20250310”
entity.vehicle.trip.scheduleRelationshipIndicates if the trip is running as scheduled, or if there is a deviation (e.g., added, cancelled)“SCHEDULED”
entity.vehicle.position.latitudeReal-time latitude of vehicle“51.79374694824219”
entity.vehicle.position.longitudeReal-time longitude of vehicle“−3.989114999771118”
entity.vehicle.currentStopSequenceSequence number of the stop the vehicle is currently
approaching or has reached
“54”
entity.vehicle.currentStatusCurrent operational status of the vehicle“STOPPED_AT”
“IN_TRANSIT_TO”
entity.vehicle.timestampUnix timestamp for when
vehicle update was recorded
“1741598993”
entity.vehicle.vehicle.idIdentifier for vehicle reporting the update“FCYM-MF23ZVH”
Table 4. Comparison of real-time bus travel data sources.
FeatureGTFSGTFS-RTSIRI-VMSIRI-SX
NatureStaticReal-timeReal-timeReal-time
FormatCSV-basedProtobufXMLXML
Primary UseRoute planning, schedule-based
analyses
Real-time vehicle tracking and
delays
Vehicle
monitoring
Disruption
management
AdoptionGlobal
Widely used
Widespread
adoption in North America
Some global usage
European
transport
systems
European
transport
systems
GranularityFixed schedule dataUpdated every
minute; no caching
High-resolution
vehicle locations, end-of-day caching
Detailed
disruption data
Ease of
Integration
HighModerateComplexComplex
LimitationsNo real-time updatesRequires agency compliance
for accuracy
Complexity
in parsing
Variable adoption
Dependent on agency data
accuracy
Disclaimer/Publisher’s Note: The statements, opinions and data contained in all publications are solely those of the individual author(s) and contributor(s) and not of MDPI and/or the editor(s). MDPI and/or the editor(s) disclaim responsibility for any injury to people or property resulting from any ideas, methods, instructions or products referred to in the content.

