Article

NPP-VIIRS Nighttime Lights Illustrate the Post-Earthquake Damage and Subsequent Economic Recovery in Hatay Province, Turkey

1
School of Environment and Disaster Management, Institute of Disaster Prevention, Sanhe 065201, China
2
Hebei Key Laboratory of Earthquake Disaster Prevention and Risk Assessment, Sanhe 065201, China
*
Author to whom correspondence should be addressed.
ISPRS Int. J. Geo-Inf. 2025, 14(4), 149; https://doi.org/10.3390/ijgi14040149
Submission received: 26 January 2025 / Revised: 23 March 2025 / Accepted: 27 March 2025 / Published: 30 March 2025

Abstract

:
The catastrophic twin earthquakes that struck southern Turkey and northern Syria on 6 February 2023 caused massive casualties and extensive damage to infrastructure, with Hatay Province of Turkey bearing the brunt of the impact. To swiftly and thoroughly assess the damage caused by the earthquakes and the subsequent reconstruction efforts, this study initially investigated the application of light change ratios between the pre-earthquake monthly nighttime lights (NTLs) and the post-earthquake daily NTL data to identify earthquake damage in Hatay Province. Next, the monthly NTL data were employed to calculate the time series average lighting index (ALI). Subsequently, random noise and seasonal fluctuation were eliminated through data smoothing and seasonal decomposition techniques. Pre- and post-earthquake regression models were then utilised to establish a comprehensive framework for assessing economic recovery following the earthquake. The findings indicated that (1) the seismic damage identification method based on NTL data achieved an overall accuracy exceeding 71.55% in detecting building damage after a disaster. This method provided a swift and effective solution for rapidly assessing disaster-related destruction. (2) The reduced NTLs exhibited a strong correlation with the area of severely and moderately damaged buildings while showing a weaker correlation with areas of slightly damaged buildings. (3) The developed pre- and post-earthquake regression models demonstrated a high degree of fit, making them valuable tools for assessing regional economic recovery after the earthquake. At the county scale, such districts as Erzin and Kumlu exhibited promising signs of recovery, while such severely impacted areas as Antakya faced misconceptions of progress, primarily due to the brightening of NTLs caused by reconstruction efforts. Additionally, such districts as Dortyol and Samandag grappled with substantial short-term recovery challenges. Although the province experienced gradual economic recovery, achieving complete restoration has remained complex and time-intensive. The study offers valuable insights into earthquake damage assessment and economic recovery monitoring while serving as a scientific reference for disaster mitigation and post-disaster reconstruction efforts.

1. Introduction

On 6 February 2023, at 01:17 Coordinated Universal Time (UTC), a catastrophic magnitude 7.8 earthquake (37.23° N, 37.01° E) struck southern and central Turkey, along with northern and western Syria. The epicentre of this earthquake was situated 32 km northwest of Gaziantep Province, Turkey, where the seismic intensity reached an astonishing magnitude of XI. Shortly after, at 10:24 UTC, a second powerful earthquake measuring magnitude 7.5 (38.01° N, 37.20° E) struck Kahramanmaras Province, Turkey, with its epicentre 96 km northeast of the first earthquake [1]. The rupture of the first event originated in the East Anatolian Fault Zone (EAFZ). The seismic rupture extended all the way to Antakya, Hatay Province, in the south and ended in the Puturge segment in the north. The rupture velocity of this earthquake was estimated to be 3.2–3.3 km/s, with a surface displacement of 3–7 m [2]. The second event occurred along the Çardak fault, resulting in the rupture of the northern branch of the EAFZ for approximately 150 km along the Savrun, Çardak, and Doganşehir faults [3]. The velocity at which the event ruptured was estimated to be 2.5–2.8 km/s, causing a surface displacement of around 2–8 m. The impacts of this seismic event were devastating. The United Nations Development Programme (UNDP) estimated that approximately 3.3 million people were displaced by the earthquake, with more than 53,537 confirmed deaths, 313,000 destroyed buildings, and 650,000 new housing units to be built to accommodate the affected populations [4]. Therefore, a statistical analysis of the damaged buildings and economic recovery in the earthquake-affected regions of Turkey is crucial for earthquake relief efforts, damage assessment, and post-disaster reconstruction.
Carrying out an on-site survey of the entire affected region immediately following a powerful earthquake poses considerable challenges and risks. Strong earthquakes can cause extensive damage to critical infrastructure, including power systems, communications networks, and transportation routes. Moreover, these earthquakes can trigger secondary disasters, greatly complicating the execution of on-site surveys. Remote sensing technology has been widely employed in the aftermath of major disasters, especially in the early stages of post-disaster response [5]. The advantages of this technology—namely, low cost, high efficiency, and extensive coverage—address the shortcomings and inefficiencies associated with on-site surveys, providing a more effective solution to disaster assessment. Although daytime imagery provides valuable disaster information, it does not directly reflect disaster-related losses associated with socioeconomic factors, such as human activities, gross domestic product (GDP), and power outages.
Nighttime light (NTL) remote sensing provides a unique perspective on the intensity and extent of human socioeconomic activities occurring on the Earth’s surface. This technology is advantageous due to its high-frequency acquisition cycle, cost effectiveness, and broad coverage, especially when compared to daytime remote sensing [6,7]. It is widely used in various fields, such as urban expansion [8], economic development [9], population distribution [10], conflict and war analysis [11], and monitoring of natural disasters [12]. Regions affected by significant human and natural disasters typically suffer from power outages. Following a catastrophic event, nighttime illumination in impacted regions frequently become even dimmer than before the disaster. Consequently, NTL images can detect sharp reductions in nighttime illumination, which may indicate disaster-related damage [13]. Levin [14] employed NTL change ratios to identify the regions impacted by the earthquake in Turkey. Yuan et al. [15] investigated the relationship between changes in NTLs triggered by the Turkey–Syria earthquake, considering various directions and distances and their impact on population and building density. Fan et al. [16] utilised the difference between pre- and post-earthquake NTL data to extract regions affected by seismic damage. They concluded that extraction accuracy improves with increasing seismic intensity.
Additionally, an increasing number of studies have sought to assess post-disaster socioeconomic recovery through the analysis of time series NTL data. Xiao et al. [17] analysed the damage and reconstruction following the Turkey–Syria earthquake using the concentric rings method based on NTL changes. Li et al. [18] conducted a time series analysis to investigate the distribution and intensity of variations in human activities following the Haiti earthquake. Wang et al. [19] used NTL changes to assess the indirect economic losses, the process of economic recovery, and the duration of recovery following the Wenchuan earthquake. Jia et al. [20] analysed the recovery ratios of post-hurricane power supply at various stages of recovery using corrected daily NTL time series data. Moreover, several straightforward economic recovery models have been developed to analyse the post-disaster recovery process, identify influencing factors, and predict the timeline for economic restoration. Li et al. [21] introduced a post-disaster logarithmic recovery model to predict the city’s economic recovery timeline following the Zhengzhou flood disaster in 2021. Gao et al. [22] introduced a piecewise linear model for analysing post-earthquake economic recovery using monthly NTL data. This innovative model effectively captures fluctuations in human activity following an earthquake and evaluates regional disparities in economic recovery. Liu et al. [23] and Chen et al. [24] developed comprehensive models for assessing earthquake resilience that utilise NTL resilience indicators to evaluate regional economic resilience and its influencing factors.
Prior studies investigating the application of NTL data for seismic hazard monitoring primarily focused on assessing the reduction in NTL intensity. However, the presence of noise in daily NTL data has constrained the exploration of the correlation between NTL intensity reduction and the severity of earthquake damage. Moreover, the features of post-disaster economic recovery vary significantly across districts, indicating that a single model cannot adequately encompass the complexities of economic recovery at different scales in diverse regions. This study aimed to investigate the extent of post-disaster damage after the 2023 earthquake in Hatay Province, Turkey, using NPP-VIIRS NTL data. Furthermore, this study attempted to assess the economic recovery of county-level municipalities in the province after the disaster. The findings of this study will significantly assist local government authorities in developing targeted emergency response and reconstruction efforts following seismic events.

2. Study Area and Data Sources

2.1. Study Area

Hatay Province (Figure 1), situated at the eastern extremity of the Mediterranean Sea, constitutes the southernmost province of Turkey. The province is bordered to the south and east by Syria, to the northwest by Adana Province, to the north by Osmaniye Province, and to the northeast by Gaziantep Province. The province is notable for its mountainous terrain, with mountains comprising 46% of its land area, plains accounting for 33%, and plateaus and hillsides making up the remaining 21%. The Nur Mountains, a north–south trending mountain range, are situated in the western part of the province. The highest peak is Migirtepe, which reaches an elevation of 2240 m. The province comprises 12 districts, covering a total area of 5524 km2, with a population of 1,686,043 in 2022. The capital city of Hatay Province is Antakya, and the second-largest city is the port city of Iskenderun [25]. The province is subject to a Mediterranean climate characterised by hot, dry summers and warm, rainy winters. The province receives varying precipitation levels, with an average annual rainfall ranging from 570 mm to 1160 mm. The coastal areas tend to receive less rainfall. One of the most notable characteristics of this climate is the prevalence of southwesterly winds.
The earthquake struck the seismically active zone known as the EAFZ, bordered by numerous cities in Hatay Province, as shown in Figure 1. Hatay Province endured the most devastating consequences of the 11 provinces in Turkey that were impacted by the earthquake. In Hatay Province, the casualty count tragically rose to 54,909, representing a staggering 34% of the total casualties across Turkey. Furthermore, the direct economic losses in this region reached approximately $12.448 billion, accounting for 36% of the overall direct economic losses experienced throughout the country [26,27].

2.2. Data Sources

NPP-VIIRS DNB data record daily images of visible and near-infrared (NIR) light emitted from the Earth’s surface at night and are provided by the Level-1 and Atmosphere Archive & Distribution System Distributed Active Archive Center (LAADS DAAC). With a 500 m spatial resolution and 16-bit radiometric resolution, NPP-VIIRS DNB captures a wide range of wavelengths, from 500 to 900 nm. This enhanced capability enables better detection of light originating from human activities and other anthropogenic phenomena [28]. The VNP46A1 data, a product of the NPP-VIIRS DNB data, record the daily measurement of surface radiation at the sensor (top of the atmosphere (TOA)). These data capture not only light intensity in urban areas, but also various background noises such as fires, gas flares, lightning flashes, volcanoes, and auroras [29]. Although the VNP46A2 data correct for the effects of moonlight and the atmosphere, the DNB BRDF-corrected NTL data lose some illumination information. Moreover, the gap-filled DNB BRDF-corrected NTL data are generated by interpolating multitemporal VNP46A1 data. As a result, the VNP46A2 data do not entirely represent the actual illumination conditions of the city following the disaster. VNP46A3 data provide monthly composites derived from daily atmospherically and lunar-BRDF-corrected NTL radiance, effectively eliminating external artifacts and biases to improve the accuracy of NTL data. The brightness of artificial lights in urban areas varies due to several factors, including atmospheric scattering, absorption, and variations in scanning angles. By averaging daily NTL measurements, the VNP46A3 data can minimise these fluctuations in daily NTL data, enabling the data to reflect the actual light levels accurately. Therefore, this dataset is particularly suitable for analysing the reconstruction of the regional economy following the earthquake. The Turkish economy underwent significant changes due to the COVID-19 pandemic from 2020 to 2022, leading to a unique pattern of economic development compared to the previous period. Given that the COVID-19 outbreak began in Turkey in March 2020, this study analysed the economic landscape from April 2020 to January 2023 as the pre-earthquake period and from February 2023 to November 2024 as the post-earthquake period.
The payload of the Landsat 8 satellite includes two advanced scientific instruments: the Operational Land Imager (OLI) and the Thermal Infrared Sensor (TIRS). The OLI sensor captures multispectral bands across visible, near-infrared, and short-wave infrared wavelengths with a spatial resolution of 30 m. This capability makes it exceptionally suited for generating high-quality normalised difference vegetation index (NDVI) data, which are readily available for downloading from EarthExplorer [30]. The reference map for building damage was derived from the building damage proxy map created for Hatay Province, Turkey, by the NASA Jet Propulsion Laboratory ARIA team and Dr. Sang-Ho Yun of the Earth Observatory of Singapore (EOS) [31]. These data categorise the building damage into four levels: no damage, slight damage, moderate damage, and severe damage. Due to the lack of reference data on earthquake damage in Yayladagi district of Hatay Province, it was excluded from the accuracy assessment of building damage. The reference map of earthquake-damaged buildings provided by Earth Engine Apps focuses exclusively on structures that have sustained damage [32]. Field photographs documenting the structural damage were provided by the Earthquake Engineering Research Institute (EERI) [33]. These images include details about the geographic locations where they were captured, the sources of the photographs, and descriptions of the observed structural damage. Provincial GDP statistics at current prices for 81 provinces in Turkey from 2012 to 2023 were sourced from the Turkish Statistical Institute (TURKSTAT) [34]. The administrative divisions for Hatay Province, Turkey, were sourced from the Global Administrative Areas (GADM) [35]. A detailed description of the data sources is shown in Table 1.

3. Methodology

3.1. Methods of Assessing Earthquake Damage

The processing steps for the post-earthquake VNP46A1 data under less cloudy conditions were as follows:
  • We extracted radiance, solar zenith angle, QF cloud mask, and moon illumination fraction from the VNP46A1 data for each pixel within the study area.
  • To minimise the impact of solar illumination, pixels with a solar zenith angle of less than 108 degrees were excluded. On 12 February 2023, most pixels affected by clouds were concentrated over the Nur Mountains and the Mediterranean Sea, where their impact on urban illumination was minimal. Consequently, we could effectively eliminate these cloud-contaminated pixels using the QF cloud mask.
  • To accurately identify cloud-contaminated pixels, we excluded all pixels with moon illumination levels exceeding 60% [36].
  • The image was processed using two-dimensional linear interpolation techniques to fill in the vacant pixels left by the masking manipulation.
  • Subsequently, the average value of the VNP46A1 image from the ocean, mountain, and desert regions was calculated to determine an NTL threshold. This threshold was used to eliminate background noise from the VNP46A1 image, as demonstrated in the following equation:
N T L d = 0                                                           f o r                       N T L T N T L                                               f o r                       N T L > T
where NTL and NTLd denote the raw NTLs and NTLs after removing the background noise and T denotes the NTL threshold.
A dramatic decline in nighttime light brightness following a powerful earthquake highlights the extensive destruction earthquakes can wreak on urban areas, particularly regarding widespread power outages. The NTL change ratio before and after the earthquake could be expressed by the following equation [37]:
N C R = N T L a f t e r d N T L b e f o r e d N T L b e f o r e d
where NCR denotes the NTL change ratio and N T L b e f o r e d and N T L a f t e r d denote the pre-earthquake NTLs and the post-earthquake NTLs, respectively.
The quantification of vegetation density was achieved by calculating the NDVI from Landsat 8 OLI multispectral imagery using the following equation for NDVI:
N D V I = N I R R N I R + R
where NIR and R denote the near-infrared and red bands of the image. A normalisation operation was applied to the NDVI, determining a threshold of 0.7 to identify areas characterised by dense vegetation.
A post-earthquake damage map was subsequently generated using the vegetation-masked NCR image. The Natural Breaks (Jenks) tool of the ArcGIS software was used to classify NCRs in the study area into five categories: severe damage, moderate damage, slight damage, invariant NTLs, and increased NTLs. The categories of severe, moderate, and slight damage suggest the potential presence of severely, moderately, and slightly damaged buildings. Increased NTLs imply enhanced illumination for everyday human activities, production, and rescue operations following the earthquake. The Reclassify tool of the ArcGIS software was employed to reclassify the category values for the three aforementioned damage categories.

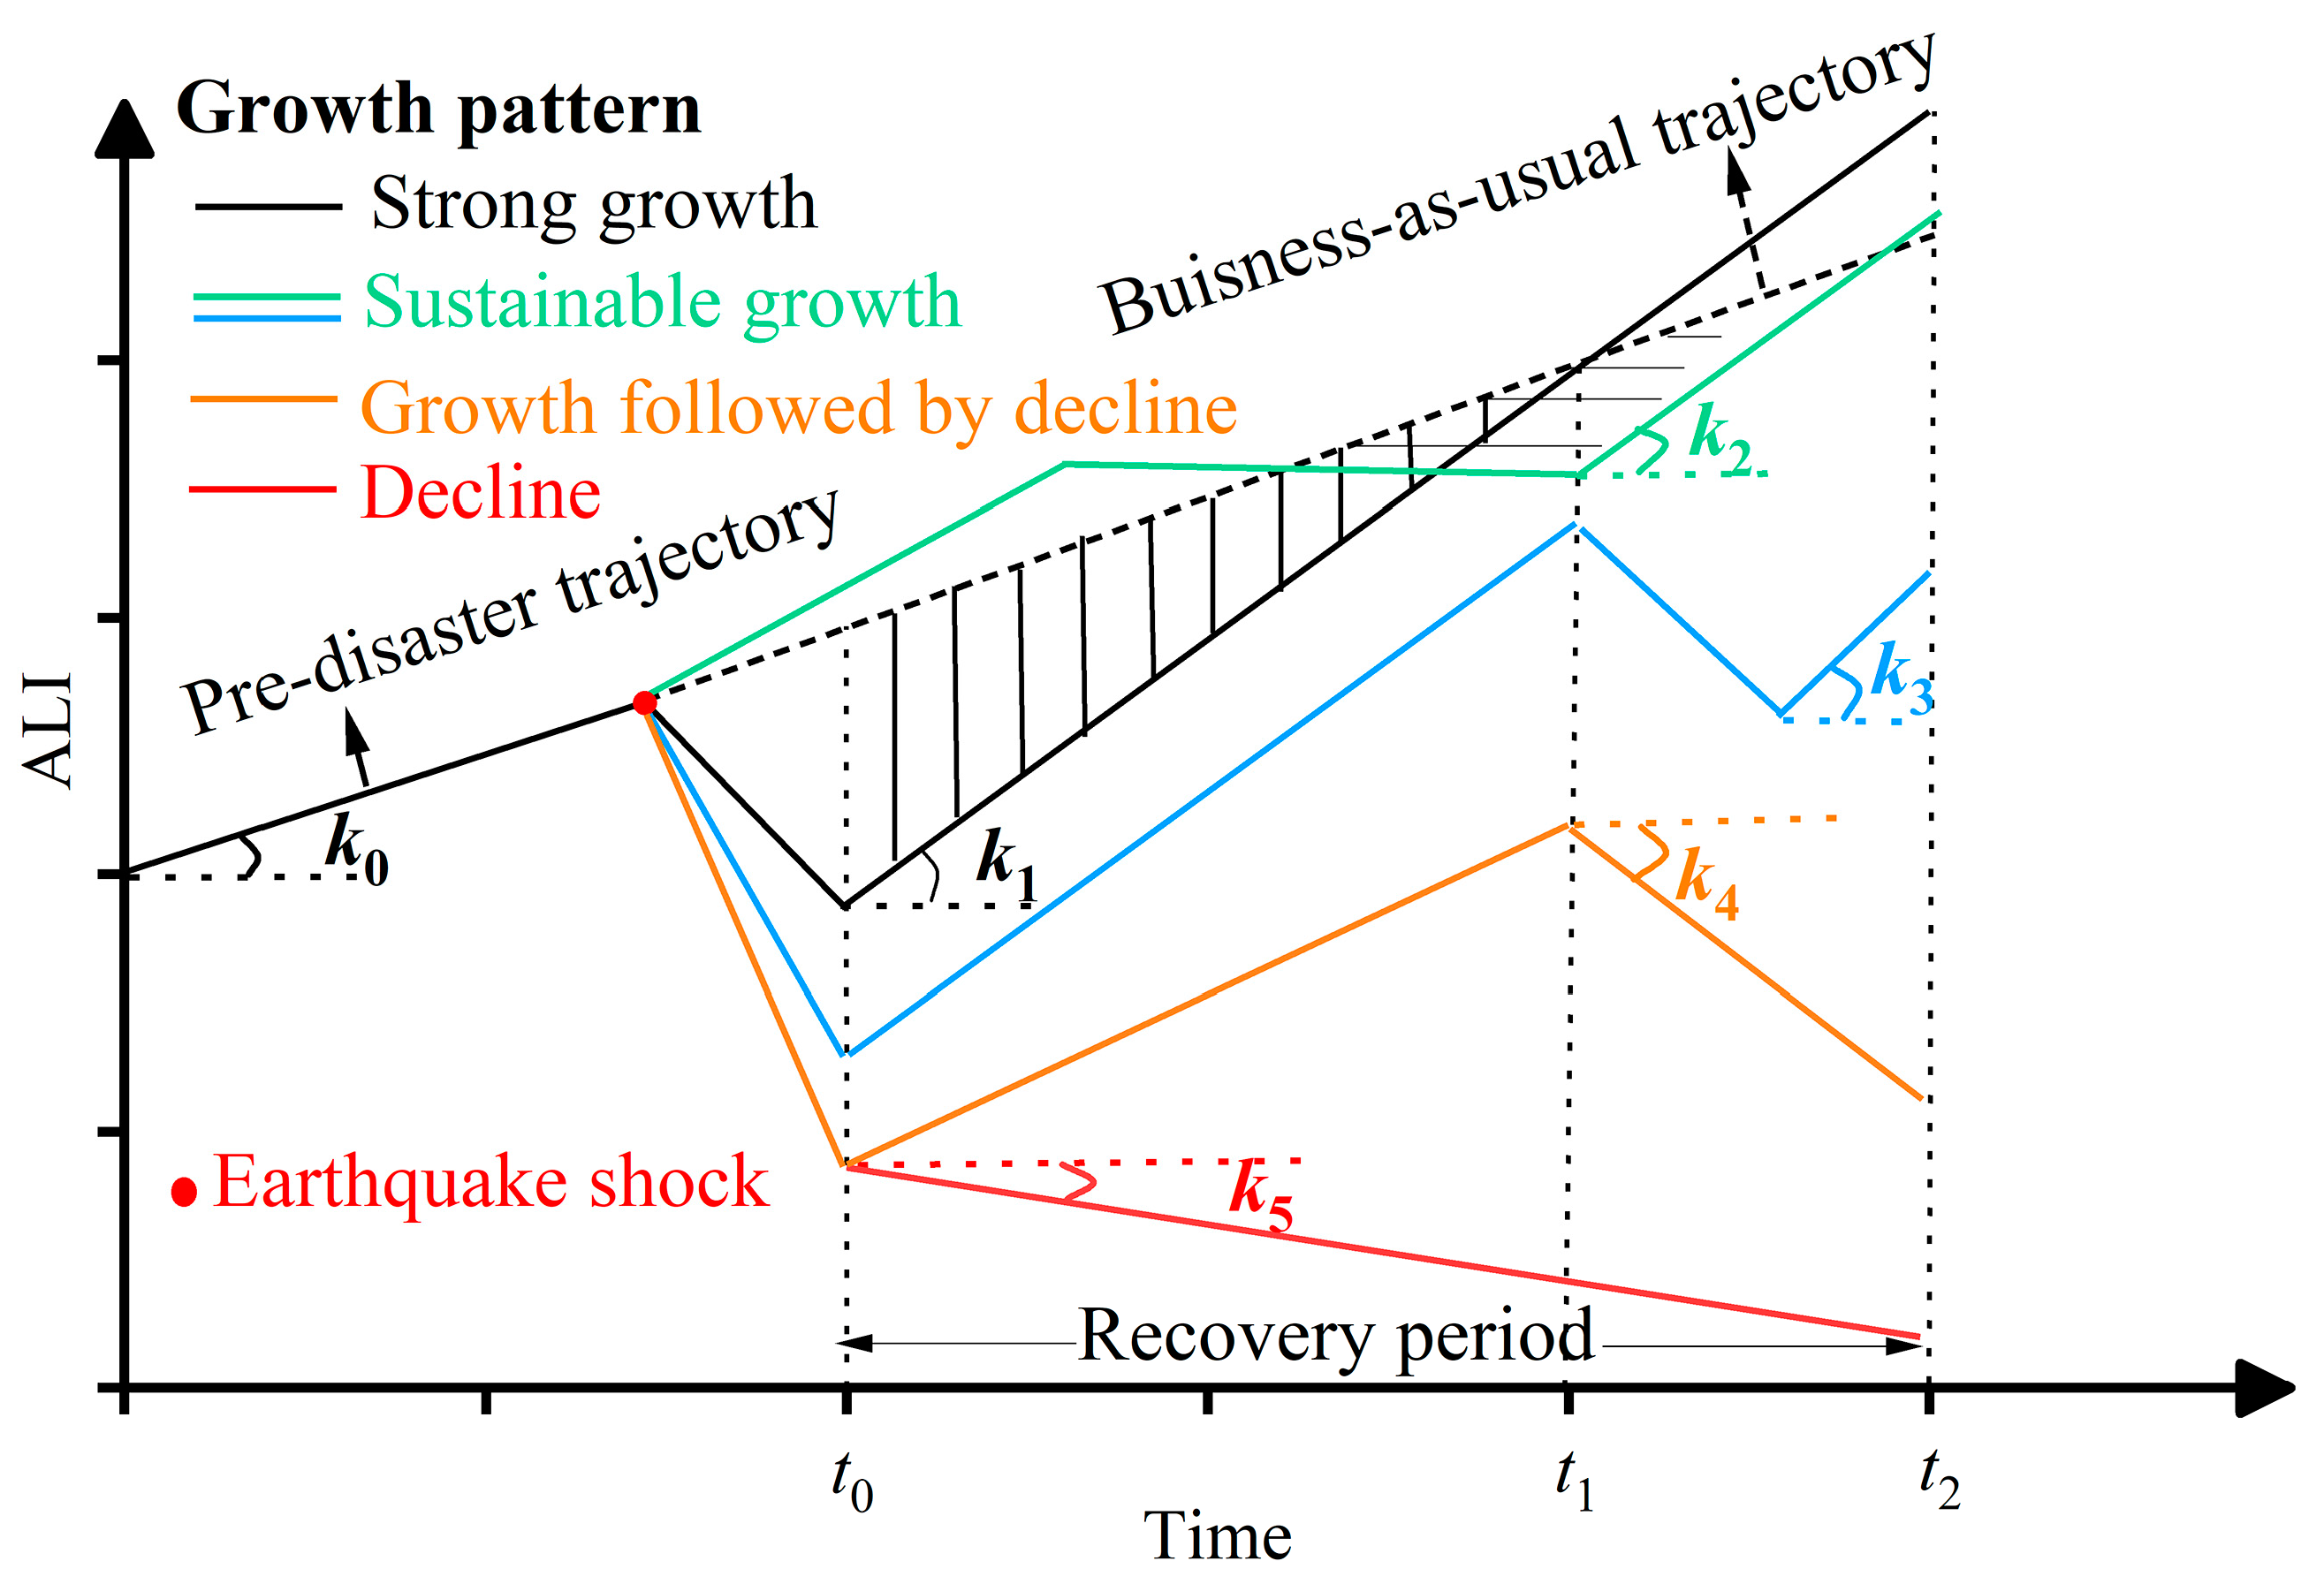
3.2. Method of Assessing Economic Recovery of Affected Regions

Recent research has revealed a positive correlation between NTL intensity and GDP as a crucial indicator of economic activity. This implies that the higher the NTL intensity, the greater the economic volume, indicating that the city is more economically prosperous [38,39,40]. To plot the regional economic resilience curve based on NTL data, it is first necessary to calculate the average light intensity (ALI) using the following equation [41], which represents the average brightness within the administrative district:
A L I = i = 1 n D N i n
where DNi represents the DN value of the NTL image for the ith pixel within the administrative district, while n signifies the total number of pixels in that district.
The monthly ALI values of the time series exhibit significant volatility due to seasonal and irregular factors. Seasonal factors include holidays, vegetation cover, surface irradiance, and snow cover, while irregular factors encompass natural disasters such as extreme weather events. This variability poses challenges in identifying clear trends in economic development from the data. The simple moving average (SMA) method was used to effectively smooth out the random fluctuations present in the time series data [42], as demonstrated by the following equation:
y ^ t + 1 = 1 k i = t k + 1 t y i
where yi represents the actual value of the time series at period i; t represents the current time period; k represents the number of time periods of the time series data used to generate the forecast; and y ^ t + 1 represents the predicted value of the time series for the period t + 1.
Minimising seasonal fluctuations in the ALI series is essential for providing a more accurate representation of economic trends, resulting in findings that are both meaningful and easy to interpret. To address this challenge, we employed the Seasonal–Trend decomposition using LOESS (STL) method to reduce noise effectively. The STL algorithm decomposes raw time series data into three distinct components: the trend component, which indicates the long-term direction of the data; the seasonal component, which identifies recurring short-term patterns; and the residual component, which captures random variations not accounted for by the trend or seasonal patterns [43]. The fundamental structure of STL decomposition is as follows:
y ^ t = T t + S t + R t               t = 1 , , N
where y ^ t denotes an observation series with N ALI data at period t and Tt, St, and Rt denote the smoothed trend-cycle (STC) component, the seasonal adjustment factor (SAF), and the residual component, respectively.
Economic recovery in earthquake-affected regions can be assessed by comparing the actual economic trajectories with the corresponding counterfactual trajectory. Various regression models, such as linear, quadratic polynomial, exponential, power function, and logarithmic models, were utilised to conduct comprehensive analyses and comparisons to determine the most suitable development model for the regional economy. Rigorous statistical tests, such as F-tests, p-values, and coefficients of determination (R2), were used to determine the most effective regression models that accurately represented the economic trajectory before and after the earthquake. The F-test serves as a statistical significance test for the entire regression equation. It is calculated by taking the ratio of explained variance to unexplained variance. An F-score exceeding 4.0 is typically regarded as statistically significant. The p-value indicates a relationship between two variables in a regression model and determines the statistical significance of regression analysis results. A p-value lower than 0.05 indicates that the null hypothesis can be confidently rejected, which implies that the regression model has significant explanatory power. The R2 quantifies the proportion of variance in the dependent variable that can be attributed to the independent variables within a regression model. A higher R2 value indicates a more effective model, as it explains more significant variability in the data [44].
The assessment framework for regional economic recovery from an earthquake is illustrated in Figure 2. The solid black line before time t0 represents the pre-earthquake ALI trajectory, while the dashed black line after time t0 represents the business-as-usual ALI trajectory, assuming no earthquake occurred. The solid black, green, blue, brown, and red lines after time t0 represent the post-earthquake potential ALI trajectories. These five trajectories represent four distinct economic recovery patterns: strong growth, sustainable growth, growth followed by decline, and decline. If the slope of the post-earthquake ALI trajectories (k1) is greater than that of the pre-earthquake ALI trajectory (k0), it is reasonable to assume that the regional economy will experience a rebound. If the post-earthquake ALI trajectory exhibits a distinctive pattern of three stages—initial growth, a subsequent decline, and then renewed growth—and the slope of the third stage (k2 and k3) surpasses k0, a promising short-term recovery for the regional economy can be expected. Conversely, if the slope of the third stage is less than or equal to k0, the regional economy will probably face significant challenges in achieving recovery in the near future. If the slope of the post-earthquake ALI trajectory (k4) is first greater than k0 and then less than or equal to k0, it can be concluded that the regional economy will not recover within a specified period. Similarly, if the slope of the post-earthquake ALI trajectory (k5) is less than 0, it can be inferred that the regional economy is in recession and is not expected to recover in the short term [45,46].

4. Results

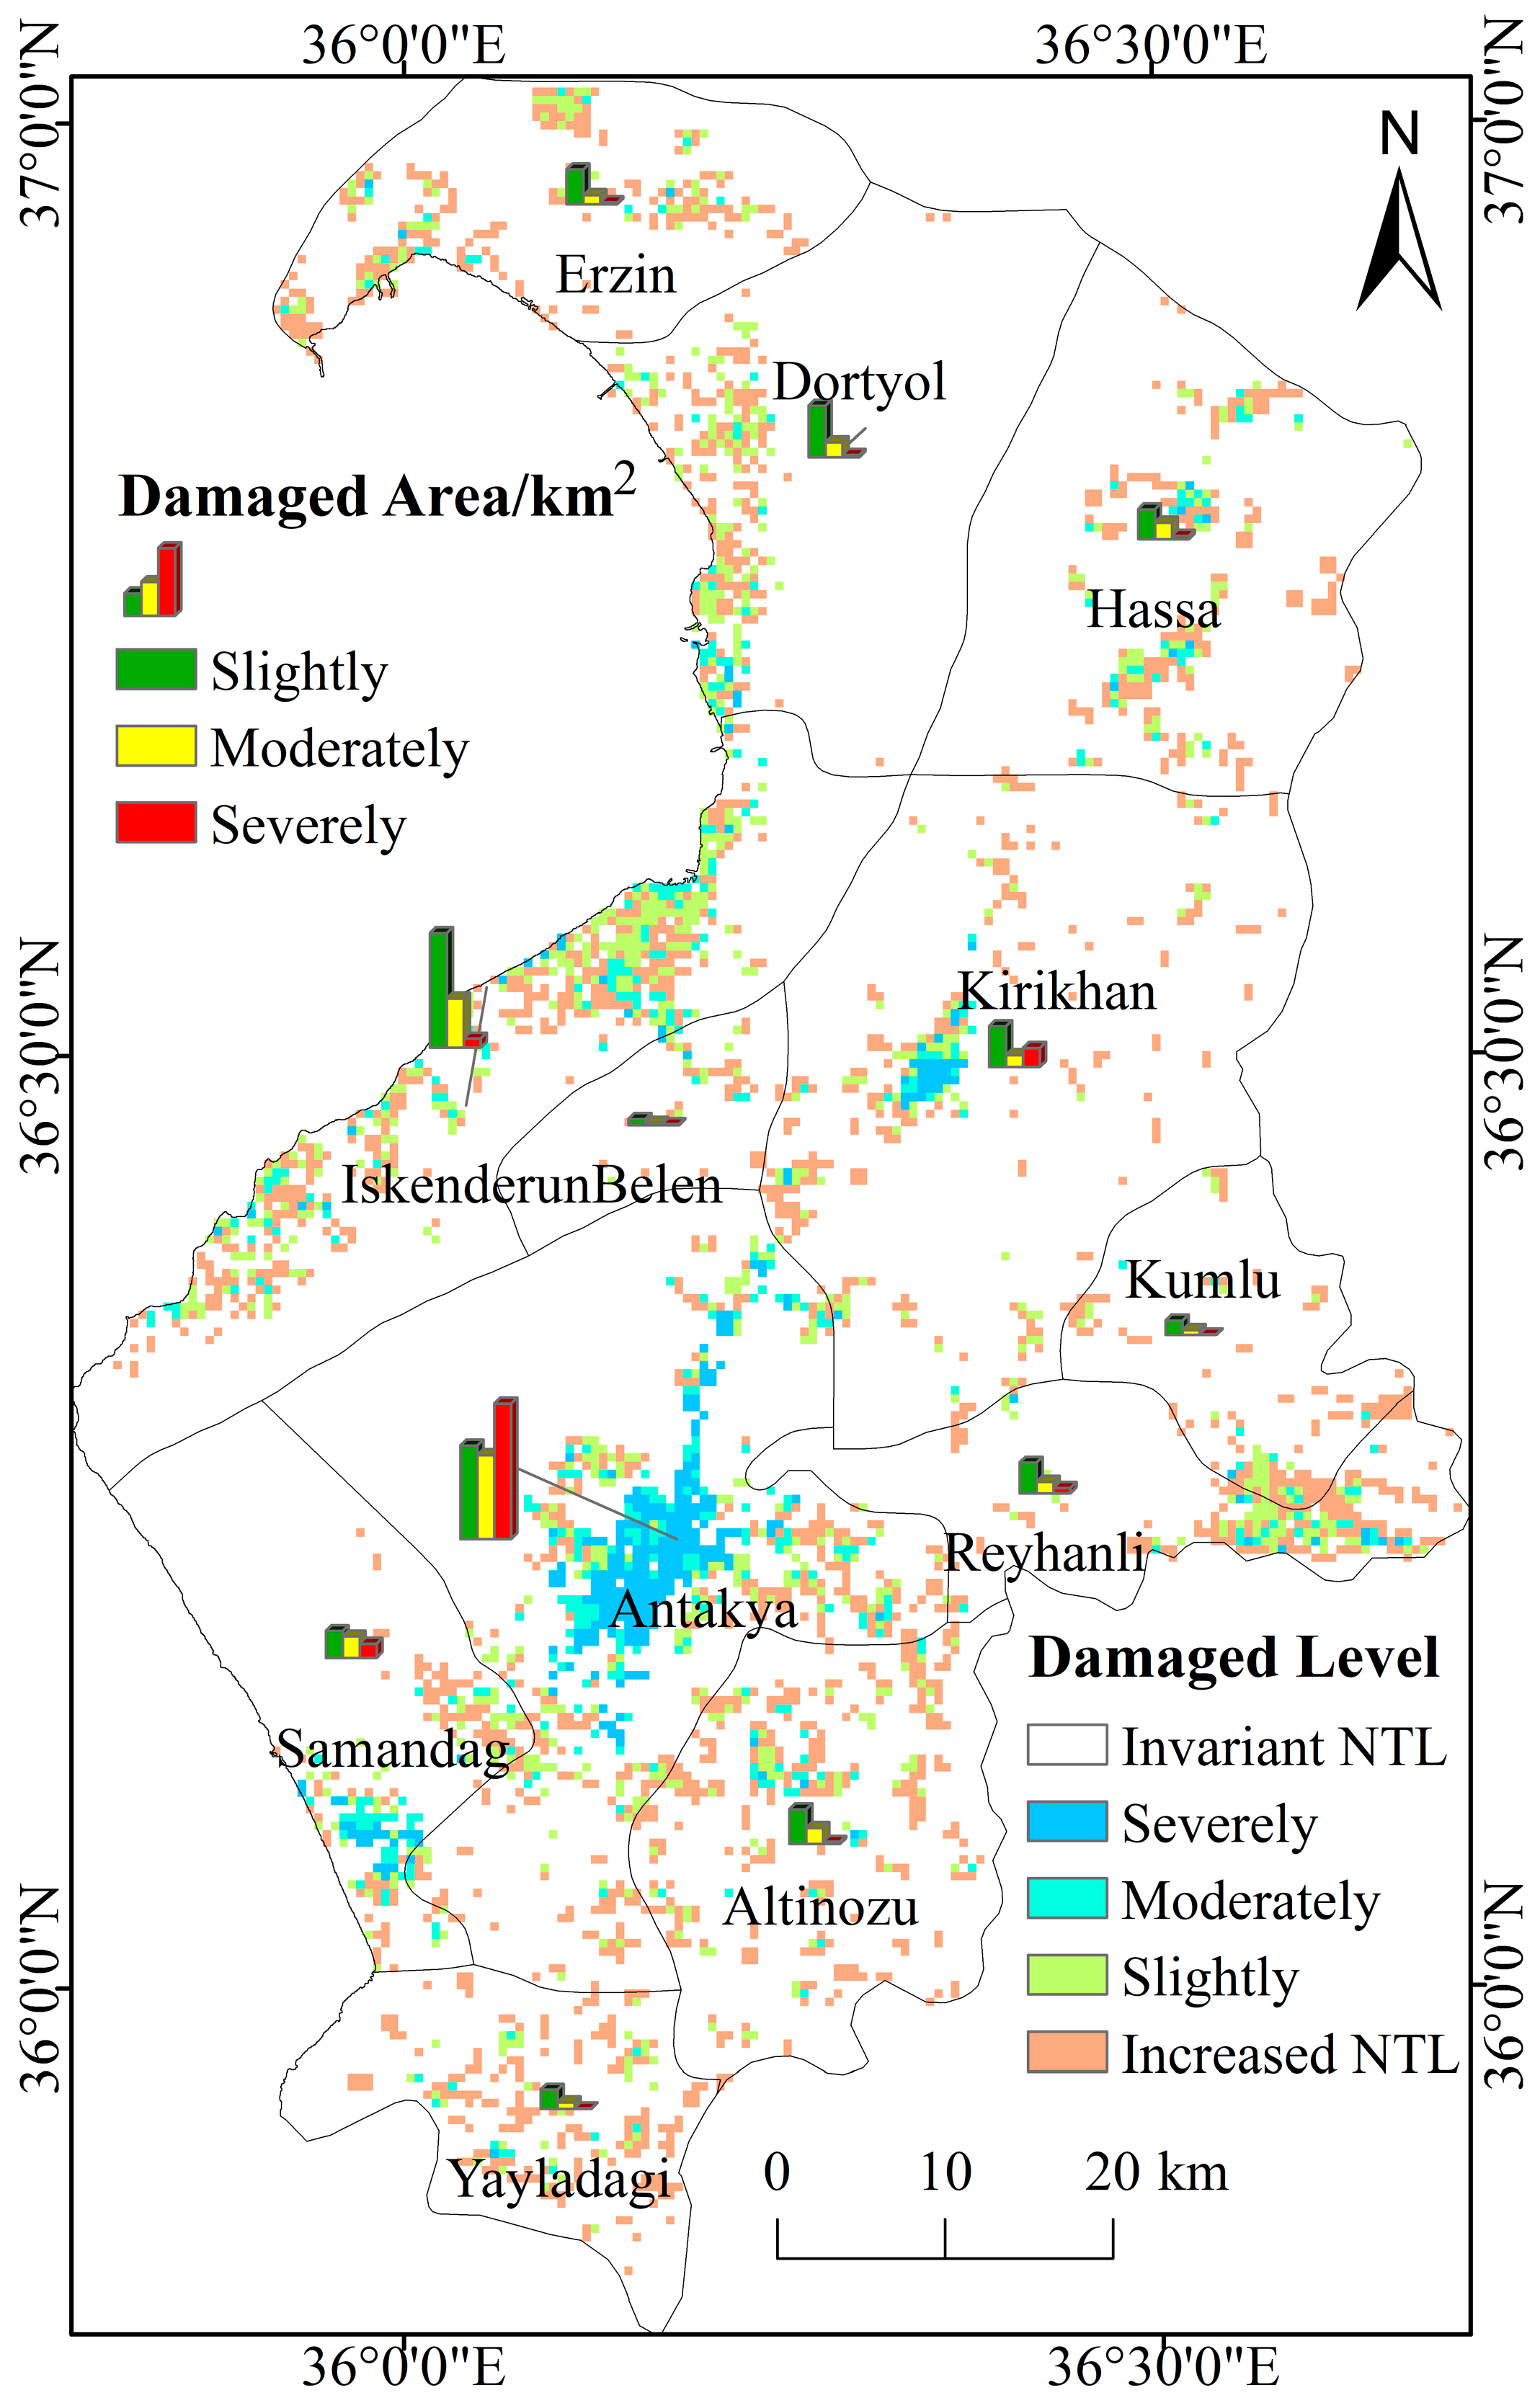
4.1. Earthquake Damage Map from NTLs

The confusion matrix, also known as the error matrix, is a critical metric used for evaluating classification performance in machine learning. It accomplishes this by accurately comparing the predicted values to the actual values within a given dataset. The performance metrics in the confusion matrix, including commission error (CE), omission error (OE), overall accuracy (OA), and Kappa coefficient (KC), are utilised to assess the accuracy of the earthquake damage results. The CE is the probability that a category in the image is incorrectly assigned to the actual category. In contrast, OE refers to the probability that a category in the reference image is misclassified into other categories. OA reflects the proportion of correctly classified results, while KC is the metric used to assess the consistency of classification results.
A total of 1430 sample points from the “damage” category and 1430 sample points from the “no damage” category were selected from the reference building damage map provided by the EOS to accurately evaluate the earthquake damage results from NTLs using a confusion matrix. The accuracy assessment of earthquake damage using reference data from the EOS is shown in Table 2. The most significant CEs in the “damage” category were concentrated in the southwestern region of Iskenderun District, possibly caused by the temporary power outages resulting from the earthquake in the area. Meanwhile, OEs in the “damage” category primarily occurred in small towns, such as Abalakli in Kirikhan District, where their size was insufficient to generate a single pixel in the NPP-VIIRS image. Similarly, a total of 1655 sample points from the “damage” category and 1655 sample points from the “no damage” category were selected from the reference building damage map provided by Earth Engine Apps to accurately evaluate the earthquake damage results from NTLs using a confusion matrix. As shown in Table 2, the “no damage” category exhibited the highest OE at 31.04%. This could be attributed to specific road sections marked by darkened NTLs being misclassified as areas of building damage following the earthquake. Consequently, these locations were mistakenly excluded from the “no damage” category. Moreover, the low spatial resolution of 500 m of NPP-VIIRS imagery often fails to capture smaller areas of building damage, leading to a large CE of 27.49% in the “no damage” category. Based on the evaluation results from these two reference sources, the overall accuracy of the NTL data exceeded 71.55%, with a Kappa coefficient greater than 0.43 in identifying the building damage. This fundamentally validates the reliability of the identification results.
Additionally, 59 field points, which included site photographs and assessments of building damage in Turkey’s Hatay Province, were utilised to further validate the findings of NTL data in detecting building damage. Table A1 in Appendix A.1 indicates that, regarding the correspondence of building damage, only two points were unmatched, resulting in an identification accuracy of 96.6%. In contrast, for the correspondence of building damage levels, 11 points were unmatched, yielding an identification accuracy of 81.36%. At Point 158, a bridge with minor damage, the pixel representing the structure was misclassified as severely damaged by NTL data due to its proximity to buildings that sustained significant destruction. At point 79, a collapsed residential building, the pixel representing the building was misclassified as slightly damaged by the NTL data due to its proximity to lightly damaged structures. Among the two locations where severe damage was incorrectly classified as “no damage”, point 135 is situated at the Bayezid-i Bistami Tomb. The NTL data classified the pixel representing this historic site as “no damage” due to its weak nighttime illumination and the minimal changes in the NTL values before and after the earthquake. Point 40, a collapsed residential building, was surrounded by structures that sustained light to moderate damage. As a result, the NTL data misclassified the pixel representing the building as “no damage”. Among the seven locations where severe damage was misclassified as moderate, points 34, 38, 87, 104, and 150 were buildings that sustained severe damage. Their proximity to structures exhibiting slight and moderate damage contributed to the misclassification of their image pixels as moderate in the NTL data. Point 33, a severely damaged building, was surrounded by slightly damaged structures and intact roads. Point 37, which was also severely damaged, was encircled by grassland and woodland. As a result, the pixels representing both buildings were misclassified as moderately damaged in the NTL data.
As illustrated in Figure 3, Antakya and Iskenderun experienced the most extensive earthquake damage, with affected areas measuring 130.50 km2 and 72.00 km2, respectively. Meanwhile, Kirikhan, Dortyol, Samandag, Altinozu, Hassa, Reyhanli, and Erzin faced moderate damage, with affected areas ranging from 19.00 km2 to 30.00 km2. In contrast, Yayladagi, Kumlu, and Belen sustained relatively minor damage, with affected areas measuring 11.00 km2, 8.25 km2, and 4.00 km2, respectively. In terms of severely damaged areas, Antakya experienced extensive destruction, affecting an area of 56.6 km2. In contrast, Kirikhan, Samandag, Iskenderun, and Reyhanli sustained damage ranging from 2.25 to 8.00 km2. Meanwhile, Hassa, Dortyol, Altinozu, Erzin, Belen, Yayladagi, and Kumlu encountered minor damage between 0.25 and 1.50 km2. In terms of moderately damaged areas, the affected areas of Antakya and Iskenderun exceeded 35.00 km2 and 20.50 km2, respectively. Samandag, Hassa, Altinozu, Dortyol, Kirikhan, Reyhanli, and Erzin experienced damage ranging from 3.75 km2 to 9.00 km2. Meanwhile, Yayladagi, Kumlu, and Belen sustained significantly less damage, with affected areas measuring 2.75 km2, 2.00 km2, and 1.00 km2, respectively. Regarding slightly damaged areas, Iskenderun, Antakya, and Dortyol experienced damage across 47.75 km2, 39.00 km2, and 21.50 km2, respectively. Meanwhile, Kirikhan, Altinozu, Erzin, Reyhanli, Hassa, and Samandag reported damage ranging from 11.25 km2 to 17.00 km2. Additionally, Yayladagi, Kumlu, and Belen suffered damage of 8.00 km2, 6.00 km2, and 2.50 km2, respectively.

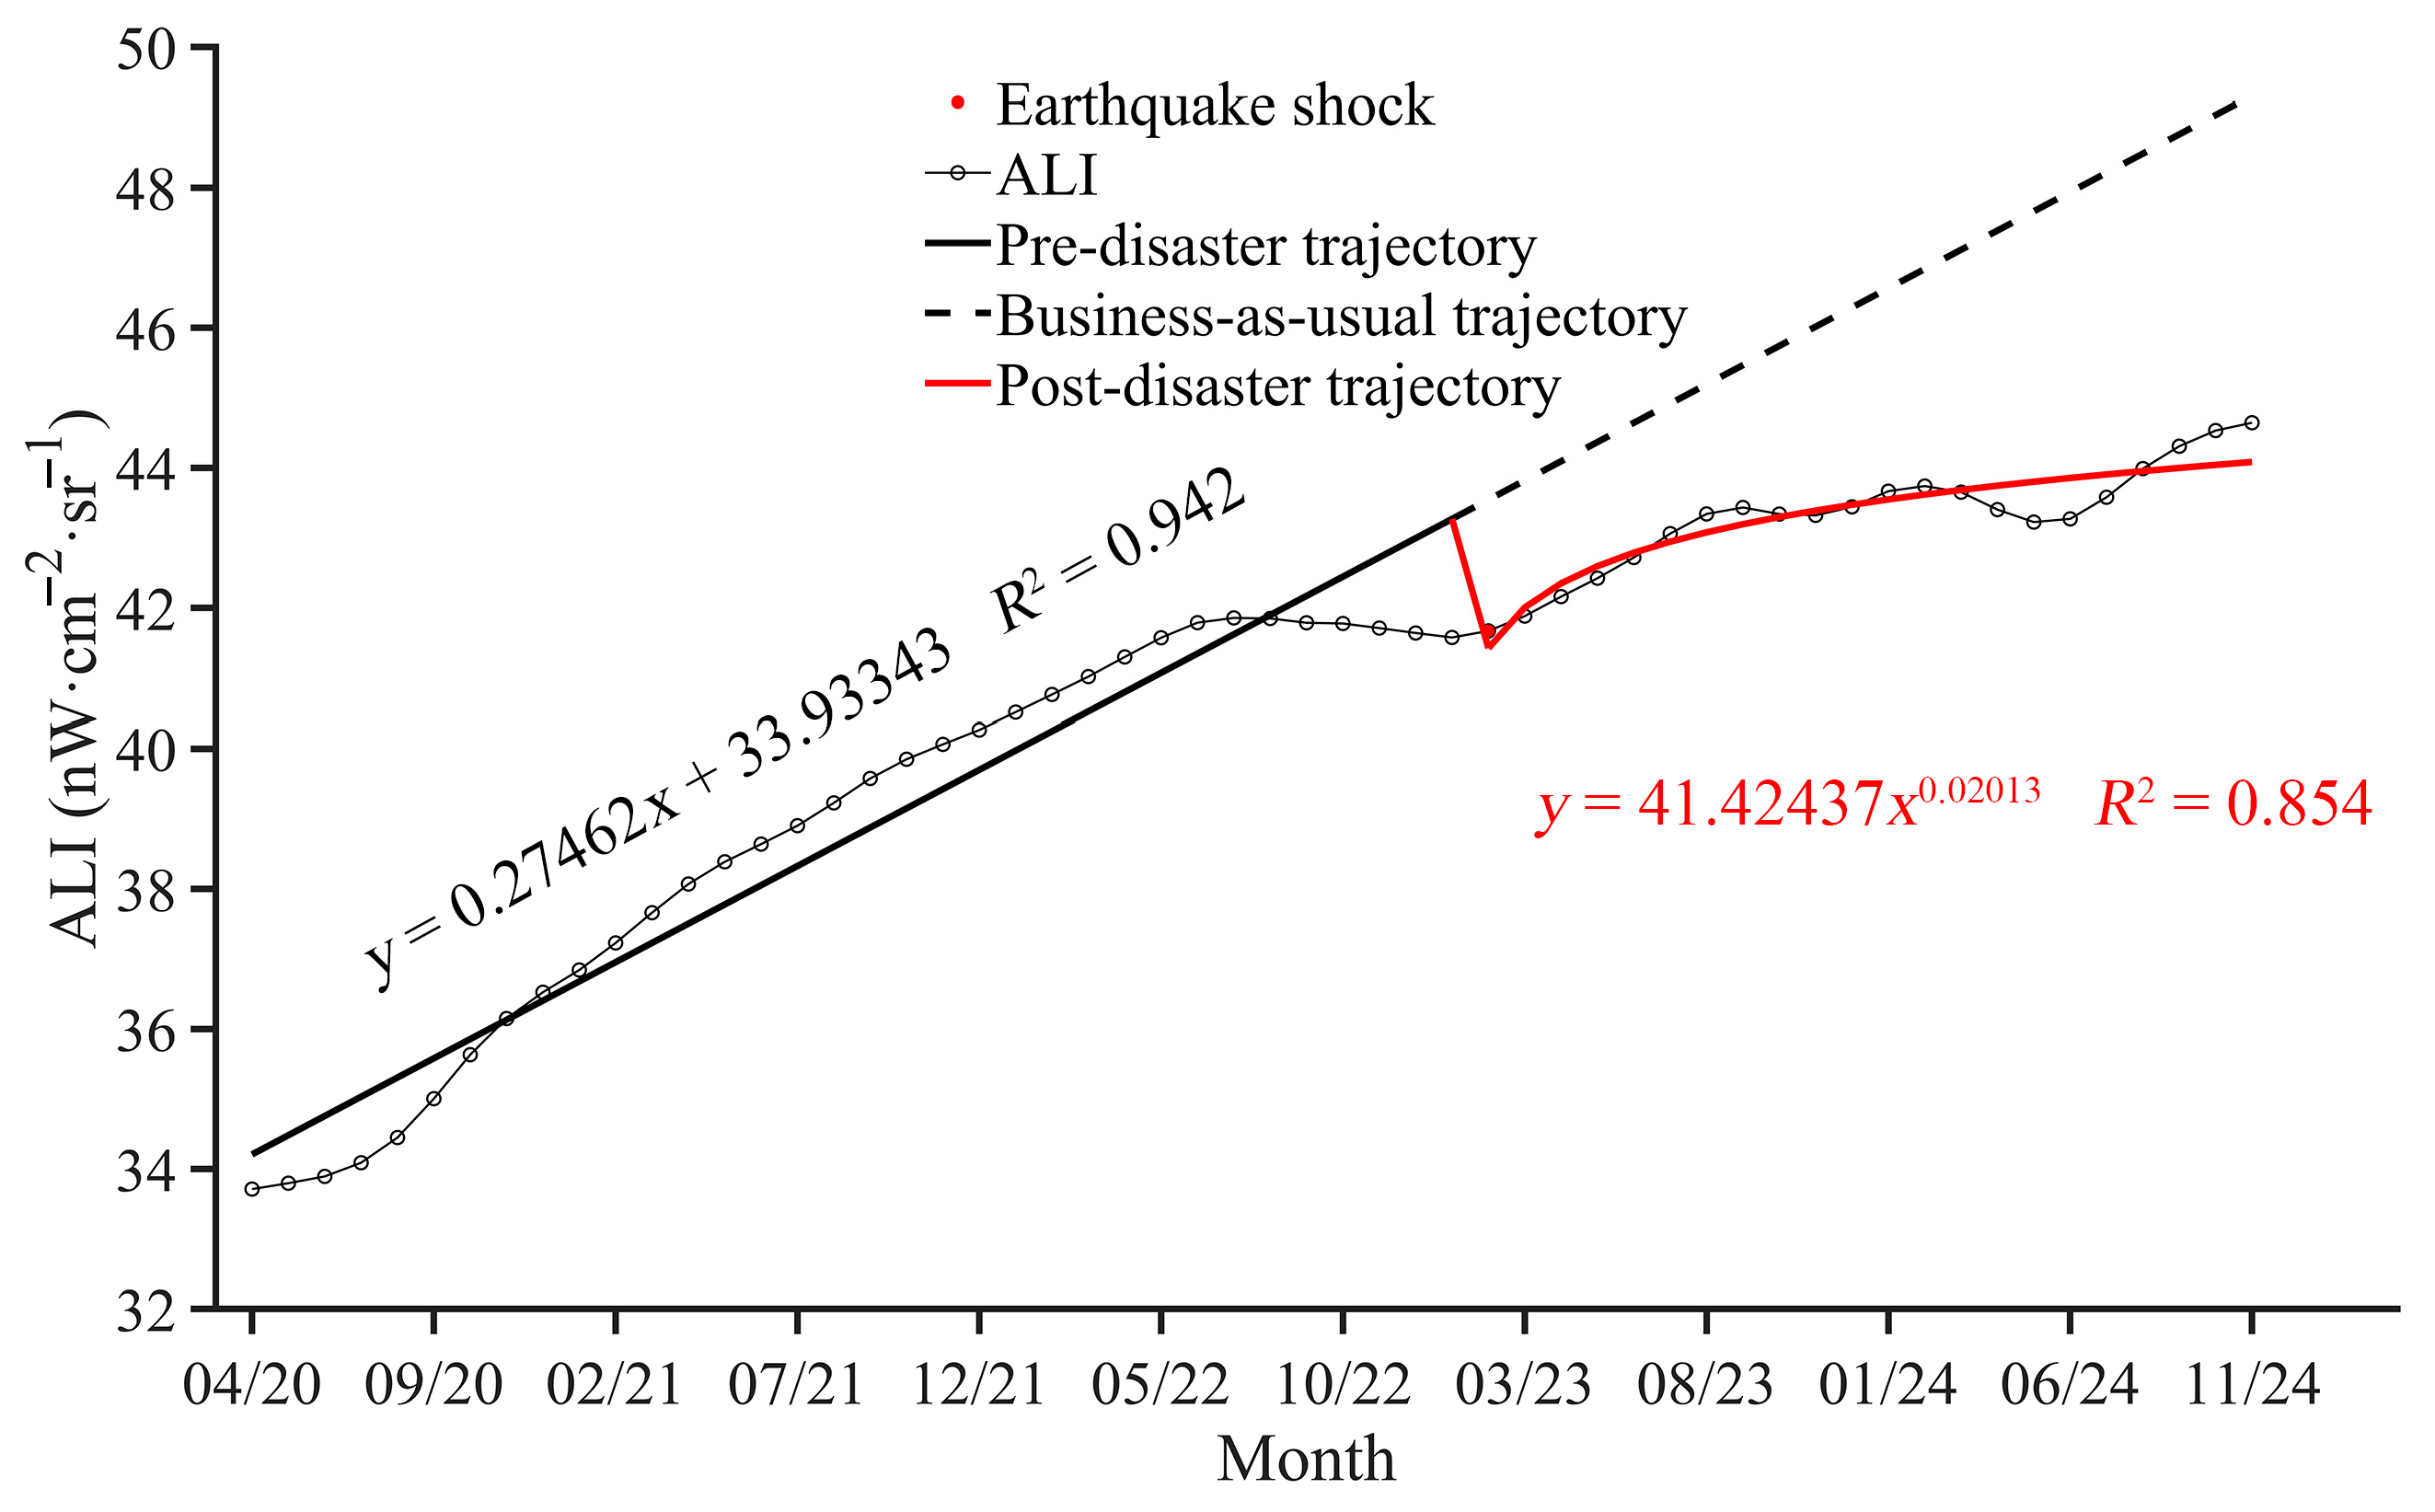
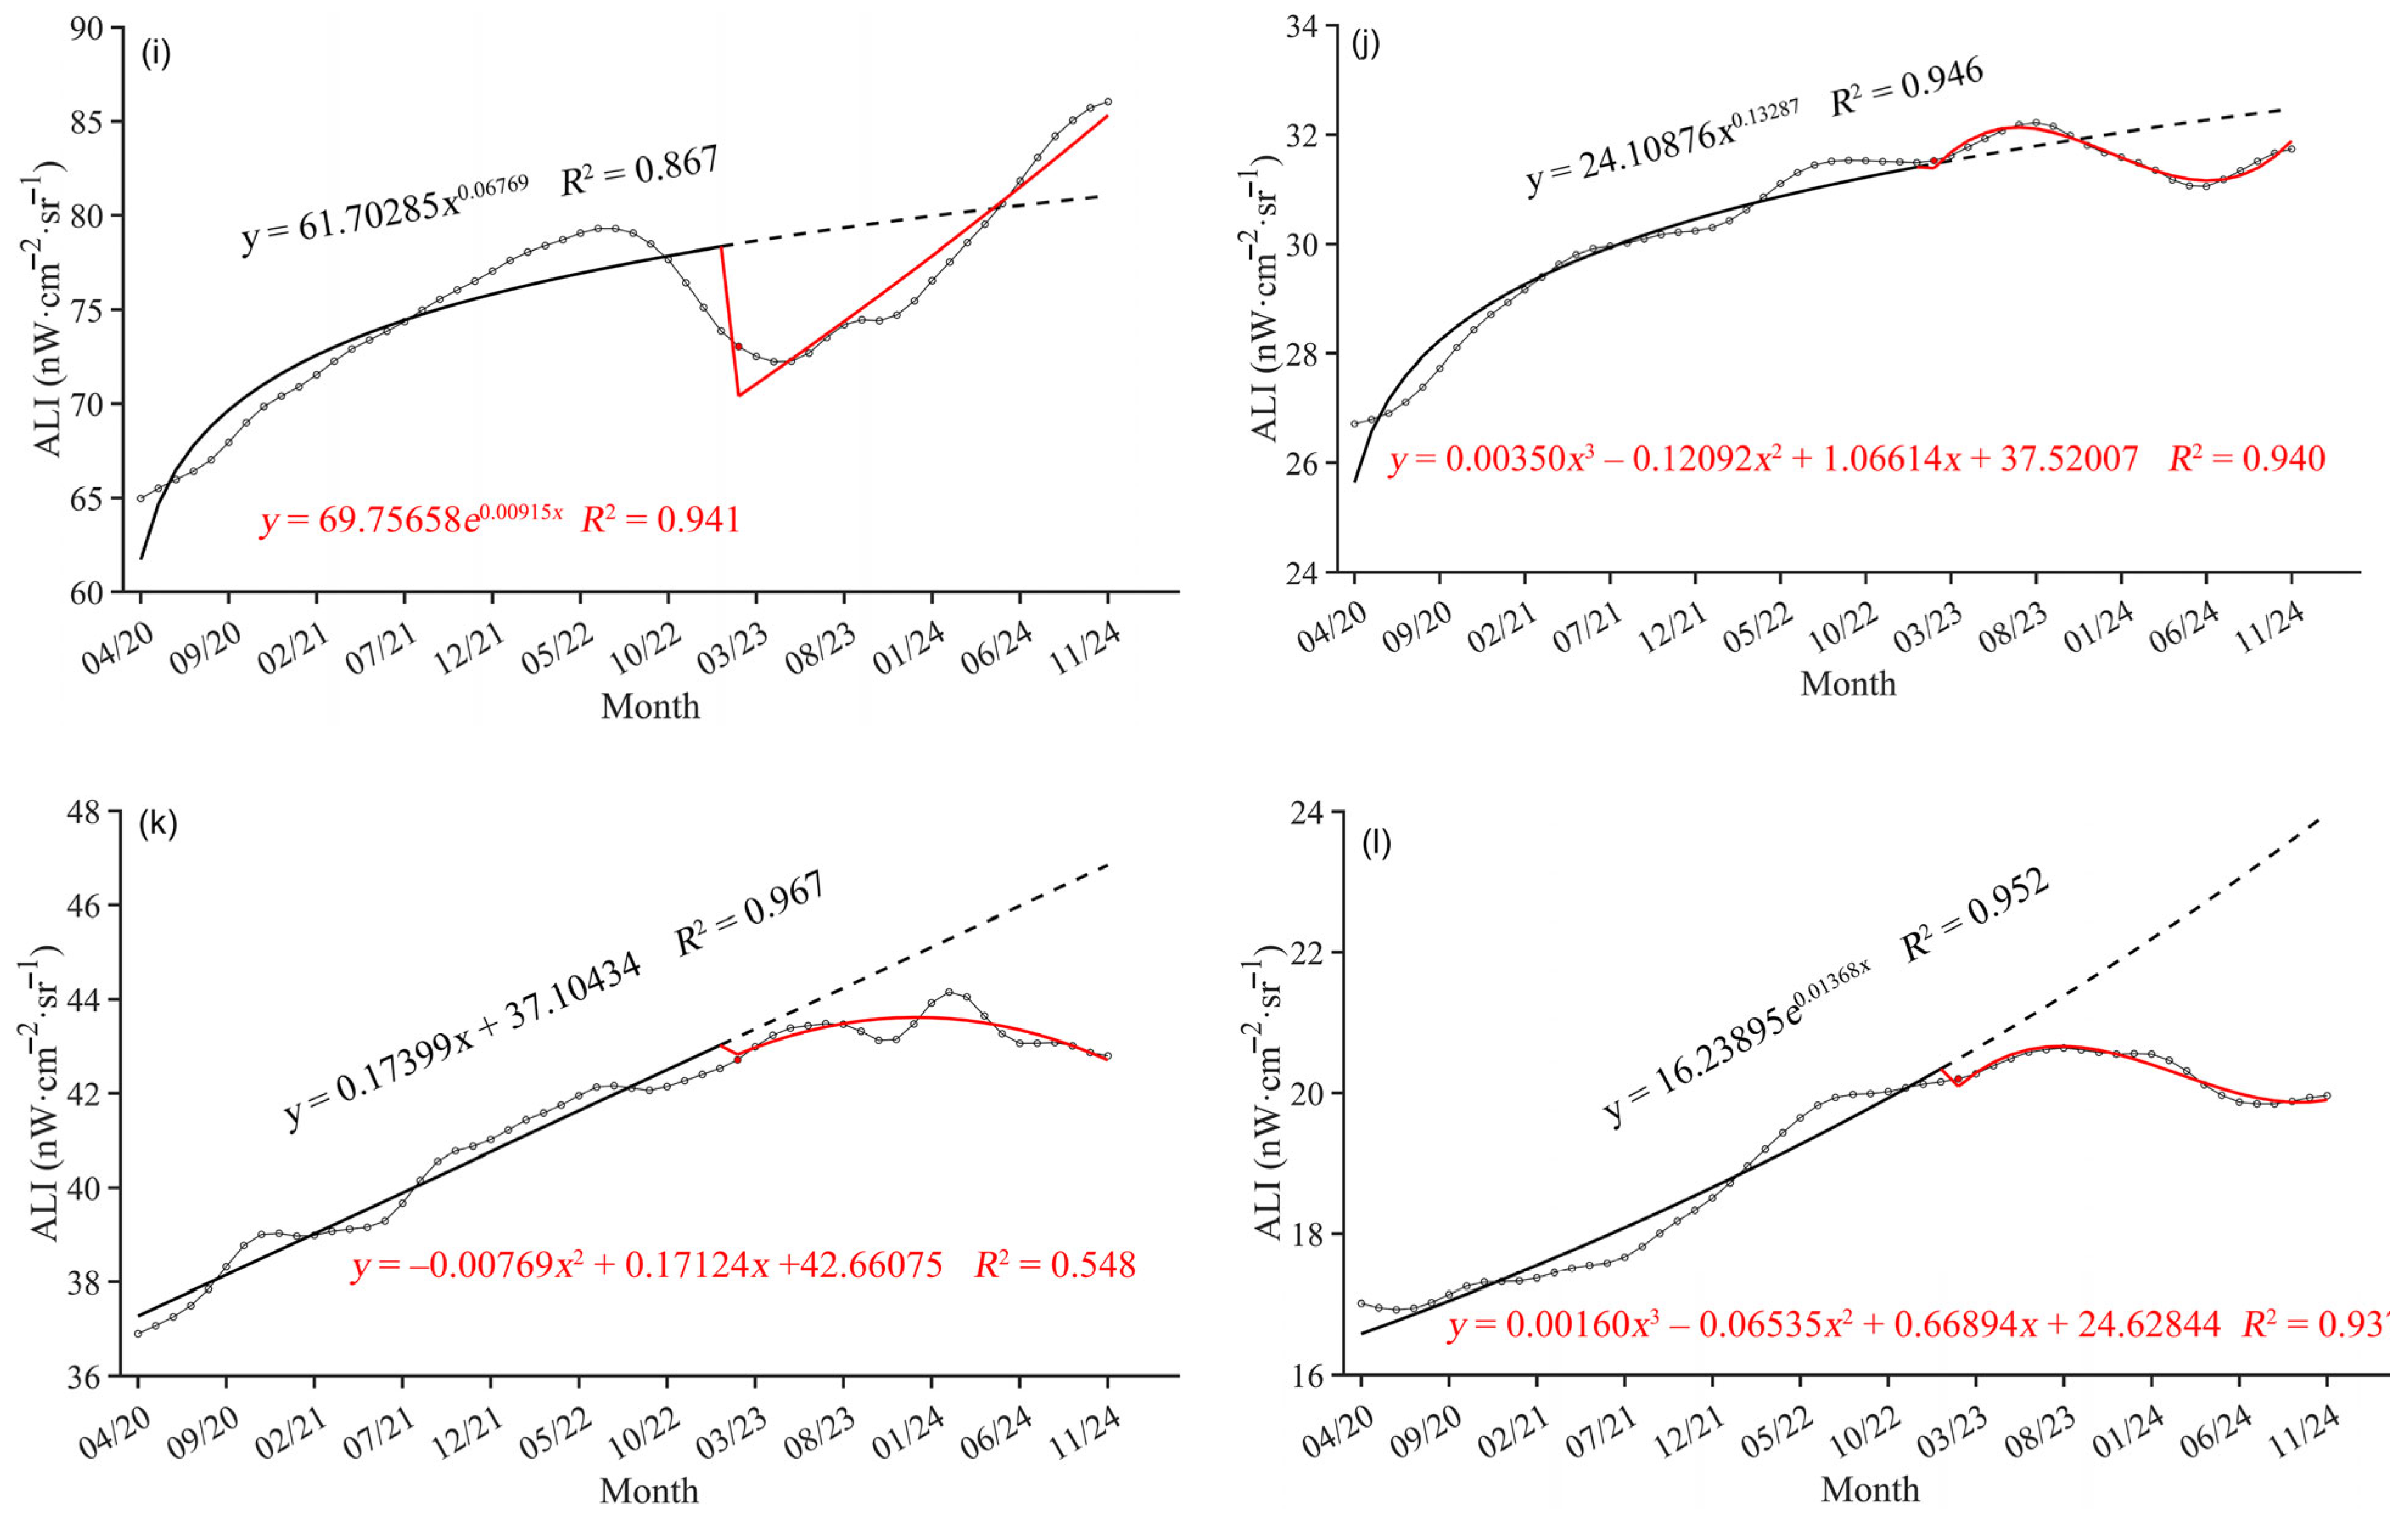
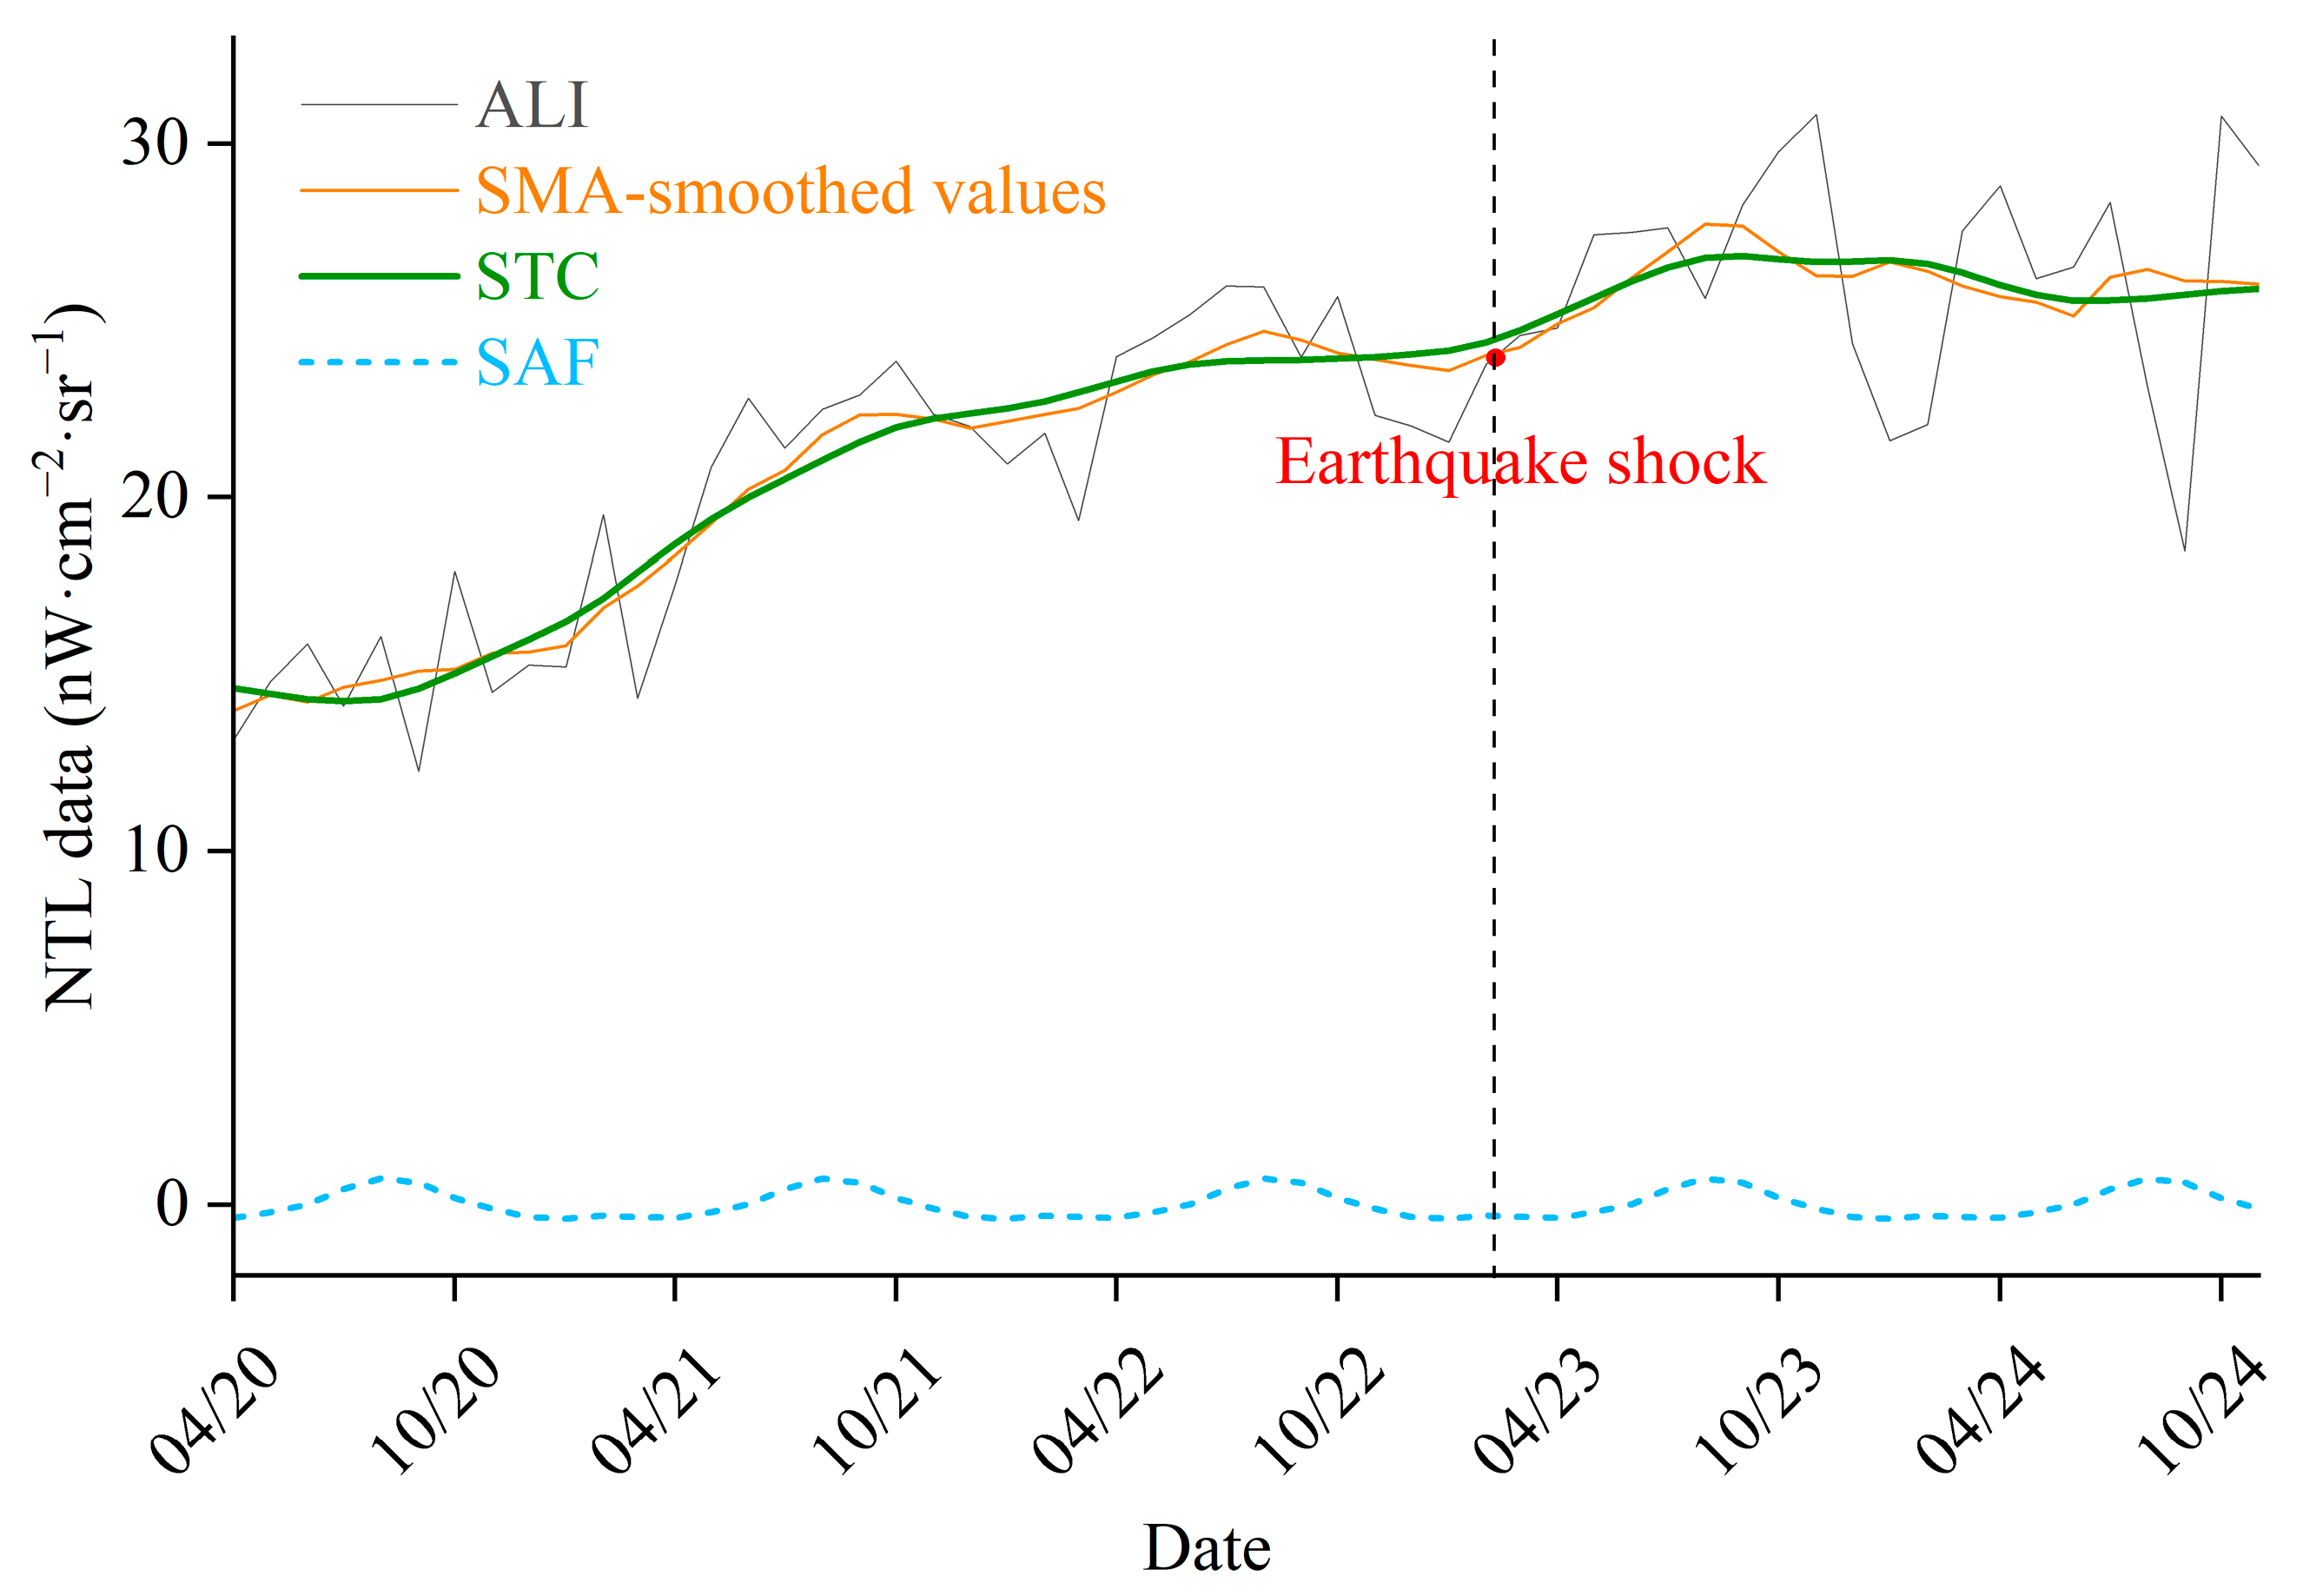
4.2. Assessment of the Post-Earthquake Economic Recovery

Figure 4 illustrates the economic recovery framework of Hatay Province prior to the earthquake, revealing a strong linear correlation and a trend of consistent growth. In contrast, the post-earthquake economic model exhibits a power function growth pattern, indicative of sustainable growth within the framework of economic recovery. Specifically, this model reveals a phase of rapid growth lasting seven months, followed by nine months of decline and a resurgence in growth. This pattern suggests that the economy of this province is gradually recovering from the earthquake it experienced. However, a comparative analysis of the pre- and post-earthquake economic development models shows that, as of November 2024, the economy of Hatay Province has not yet returned to its pre-earthquake level.
Figure 5 depicts the economic recovery framework for the 12 districts of Hatay Province. The economic development models of these districts prior to the earthquake reveal distinct patterns: Altinozu, Belen, Dortyol, Hassa, Iskenderun, Kirikhan, and Samandag exhibit a linear growth model. In contrast, Erzin, Antakya, and Reyhanli follow a power function growth model, while Kumlu showcases a logarithmic growth model. Furthermore, Yayladagi demonstrates an exponential growth model. Overall, the pre-earthquake economies of these districts displayed diverse growth trajectories. The economic recovery models of these 12 districts following the earthquake exhibit distinct patterns: Altinozu, Belen, Erzin, Hassa, Iskenderun, Kirikhan, Kumlu, Reyhanli, and Yayladagi demonstrate a “sustainable growth” pattern. Antakya reflects a “strong growth” pattern, while Dortyol exhibits a “growth followed by decline” pattern. Finally, Samandag showcases a “decline” pattern in its economic trajectory.
Additionally, while the less-affected Belen demonstrated resilience with sustained growth for four months following the earthquake, Antakya, the hardest-hit district, continued to experience economic expansion. The other ten districts, including Hatay Province, experienced seven to eight months of growth before facing economic downturns. This economic development pattern can be attributed to the rising uncertainty in the Turkish economy and escalating construction costs, which gradually led to a decrease in government financial support for post-disaster recovery efforts eight months after the disaster [47].
Antakya endured the most extensive damage from the earthquake, garnering the most substantial assistance in emergency relief and post-disaster reconstruction. Remarkably, this district’s economic recovery has entered a robust growth phase. As illustrated in Figure 5i, as of April 2024, the economy of Antakya has successfully rebounded. In contrast, as detailed in Section 4.1, Kumlu and Erzin faced comparatively minor damage, with their economies recovering in October and November 2024, respectively. While the economies of Altinozu, Belen, Hassa, Iskenderun, Kirikhan, Reyhanli, and Yayladagi—classified under the sustainable growth pattern—did not show recovery during the study period, projections indicate that they are likely to rebound in November 2025, March 2025, February 2025, December 2025, January 2025, December 2024, and March 2026, respectively. The economies of Dortyol and Samandag are experiencing a pronounced decline, making it difficult to forecast when they might recover from the impacts of the recent earthquake in the near future.

5. Discussion

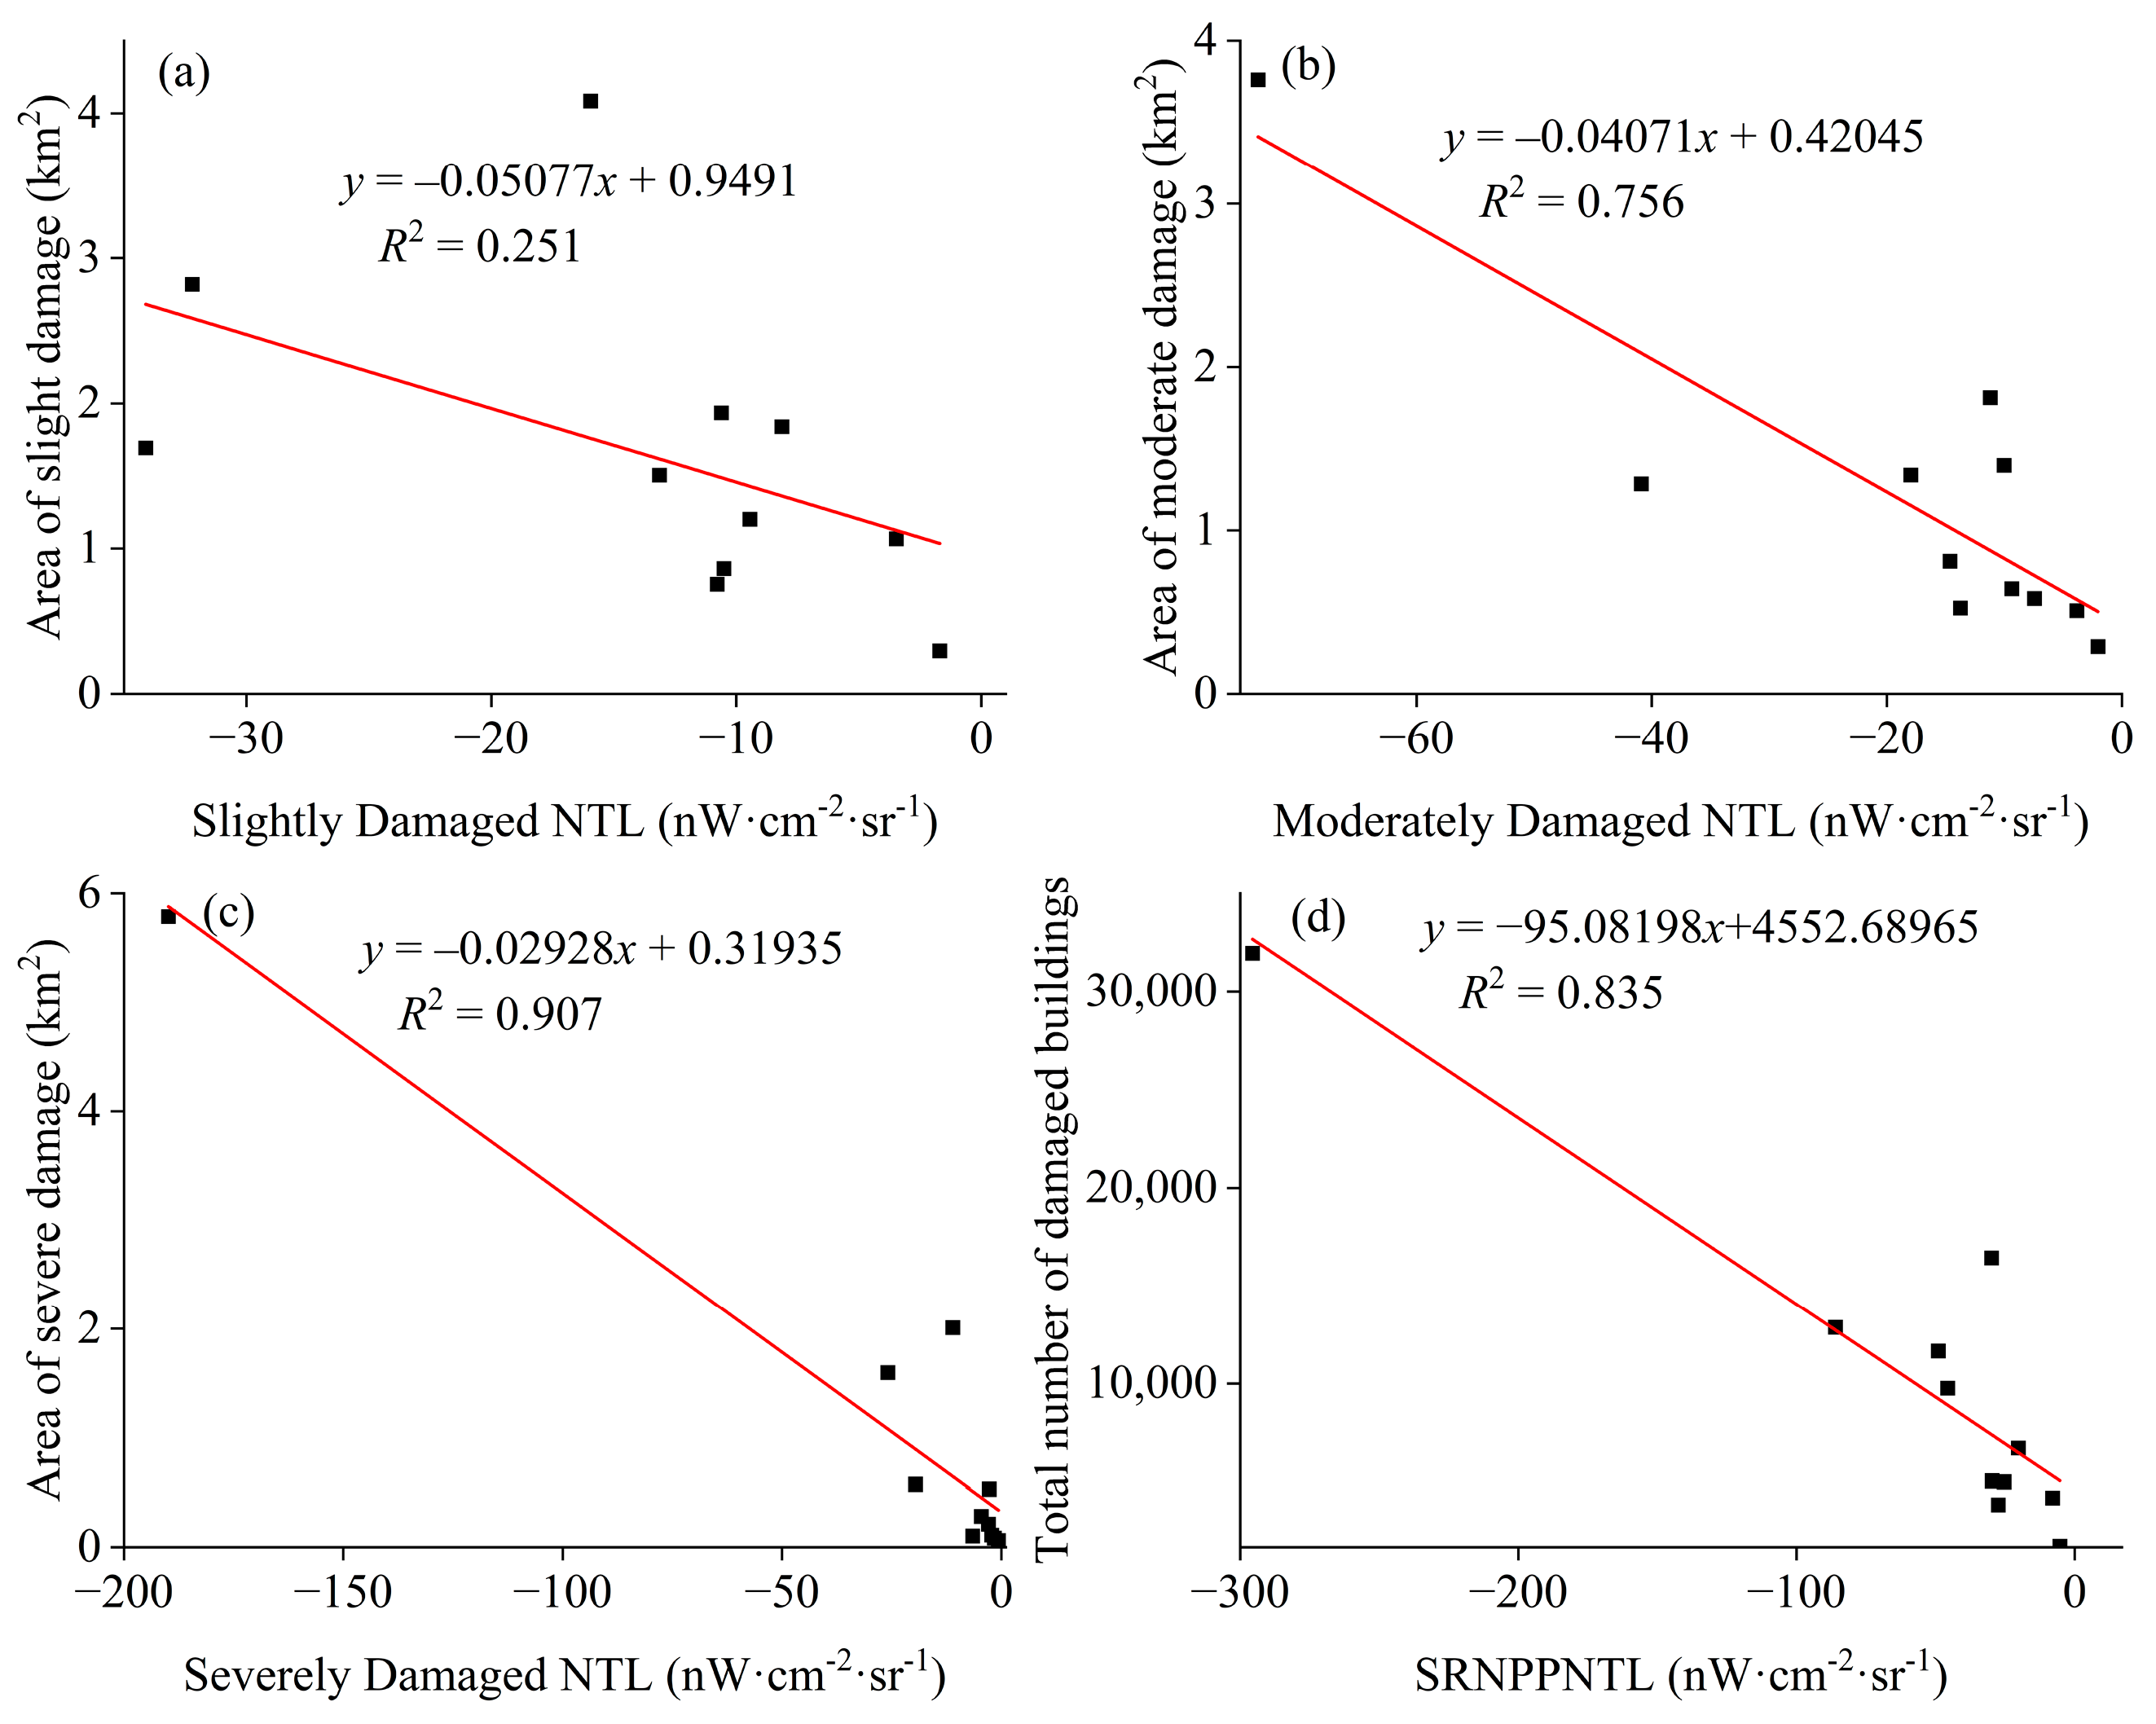
5.1. Relationships Between Reduced NTLs and Damaged Buildings

The reference building damage map for Hatay Province revealed incomplete data for the damaged buildings in Yayladagi District. Therefore, the sum of the reduced NPP-VIIRS NTLs (SRNPPNTLs) (Figure 6) in the remaining 11 districts of Hatay Province was used to establish linear relationships with the area of slightly damaged buildings, the area of moderately damaged buildings, the area of severely damaged buildings, and the total number of damaged buildings, respectively. Figure 6 demonstrates strong linear correlations between the SRNPPNTLs and the aforementioned three indicators of building damage, except for the area of slightly damaged buildings. The correlation between SRNPPNTLs and the area of slightly damaged buildings is only 0.251. This low correlation is due to the fact that slightly damaged structures can still receive electricity and remain habitable after an earthquake, resulting in minimal impact on nighttime illumination levels. Consequently, SRNPPNTLs can serve as a dependable indicator for identifying severely and moderately damaged buildings following an earthquake; however, they are inappropriate for assessing slightly damaged buildings.

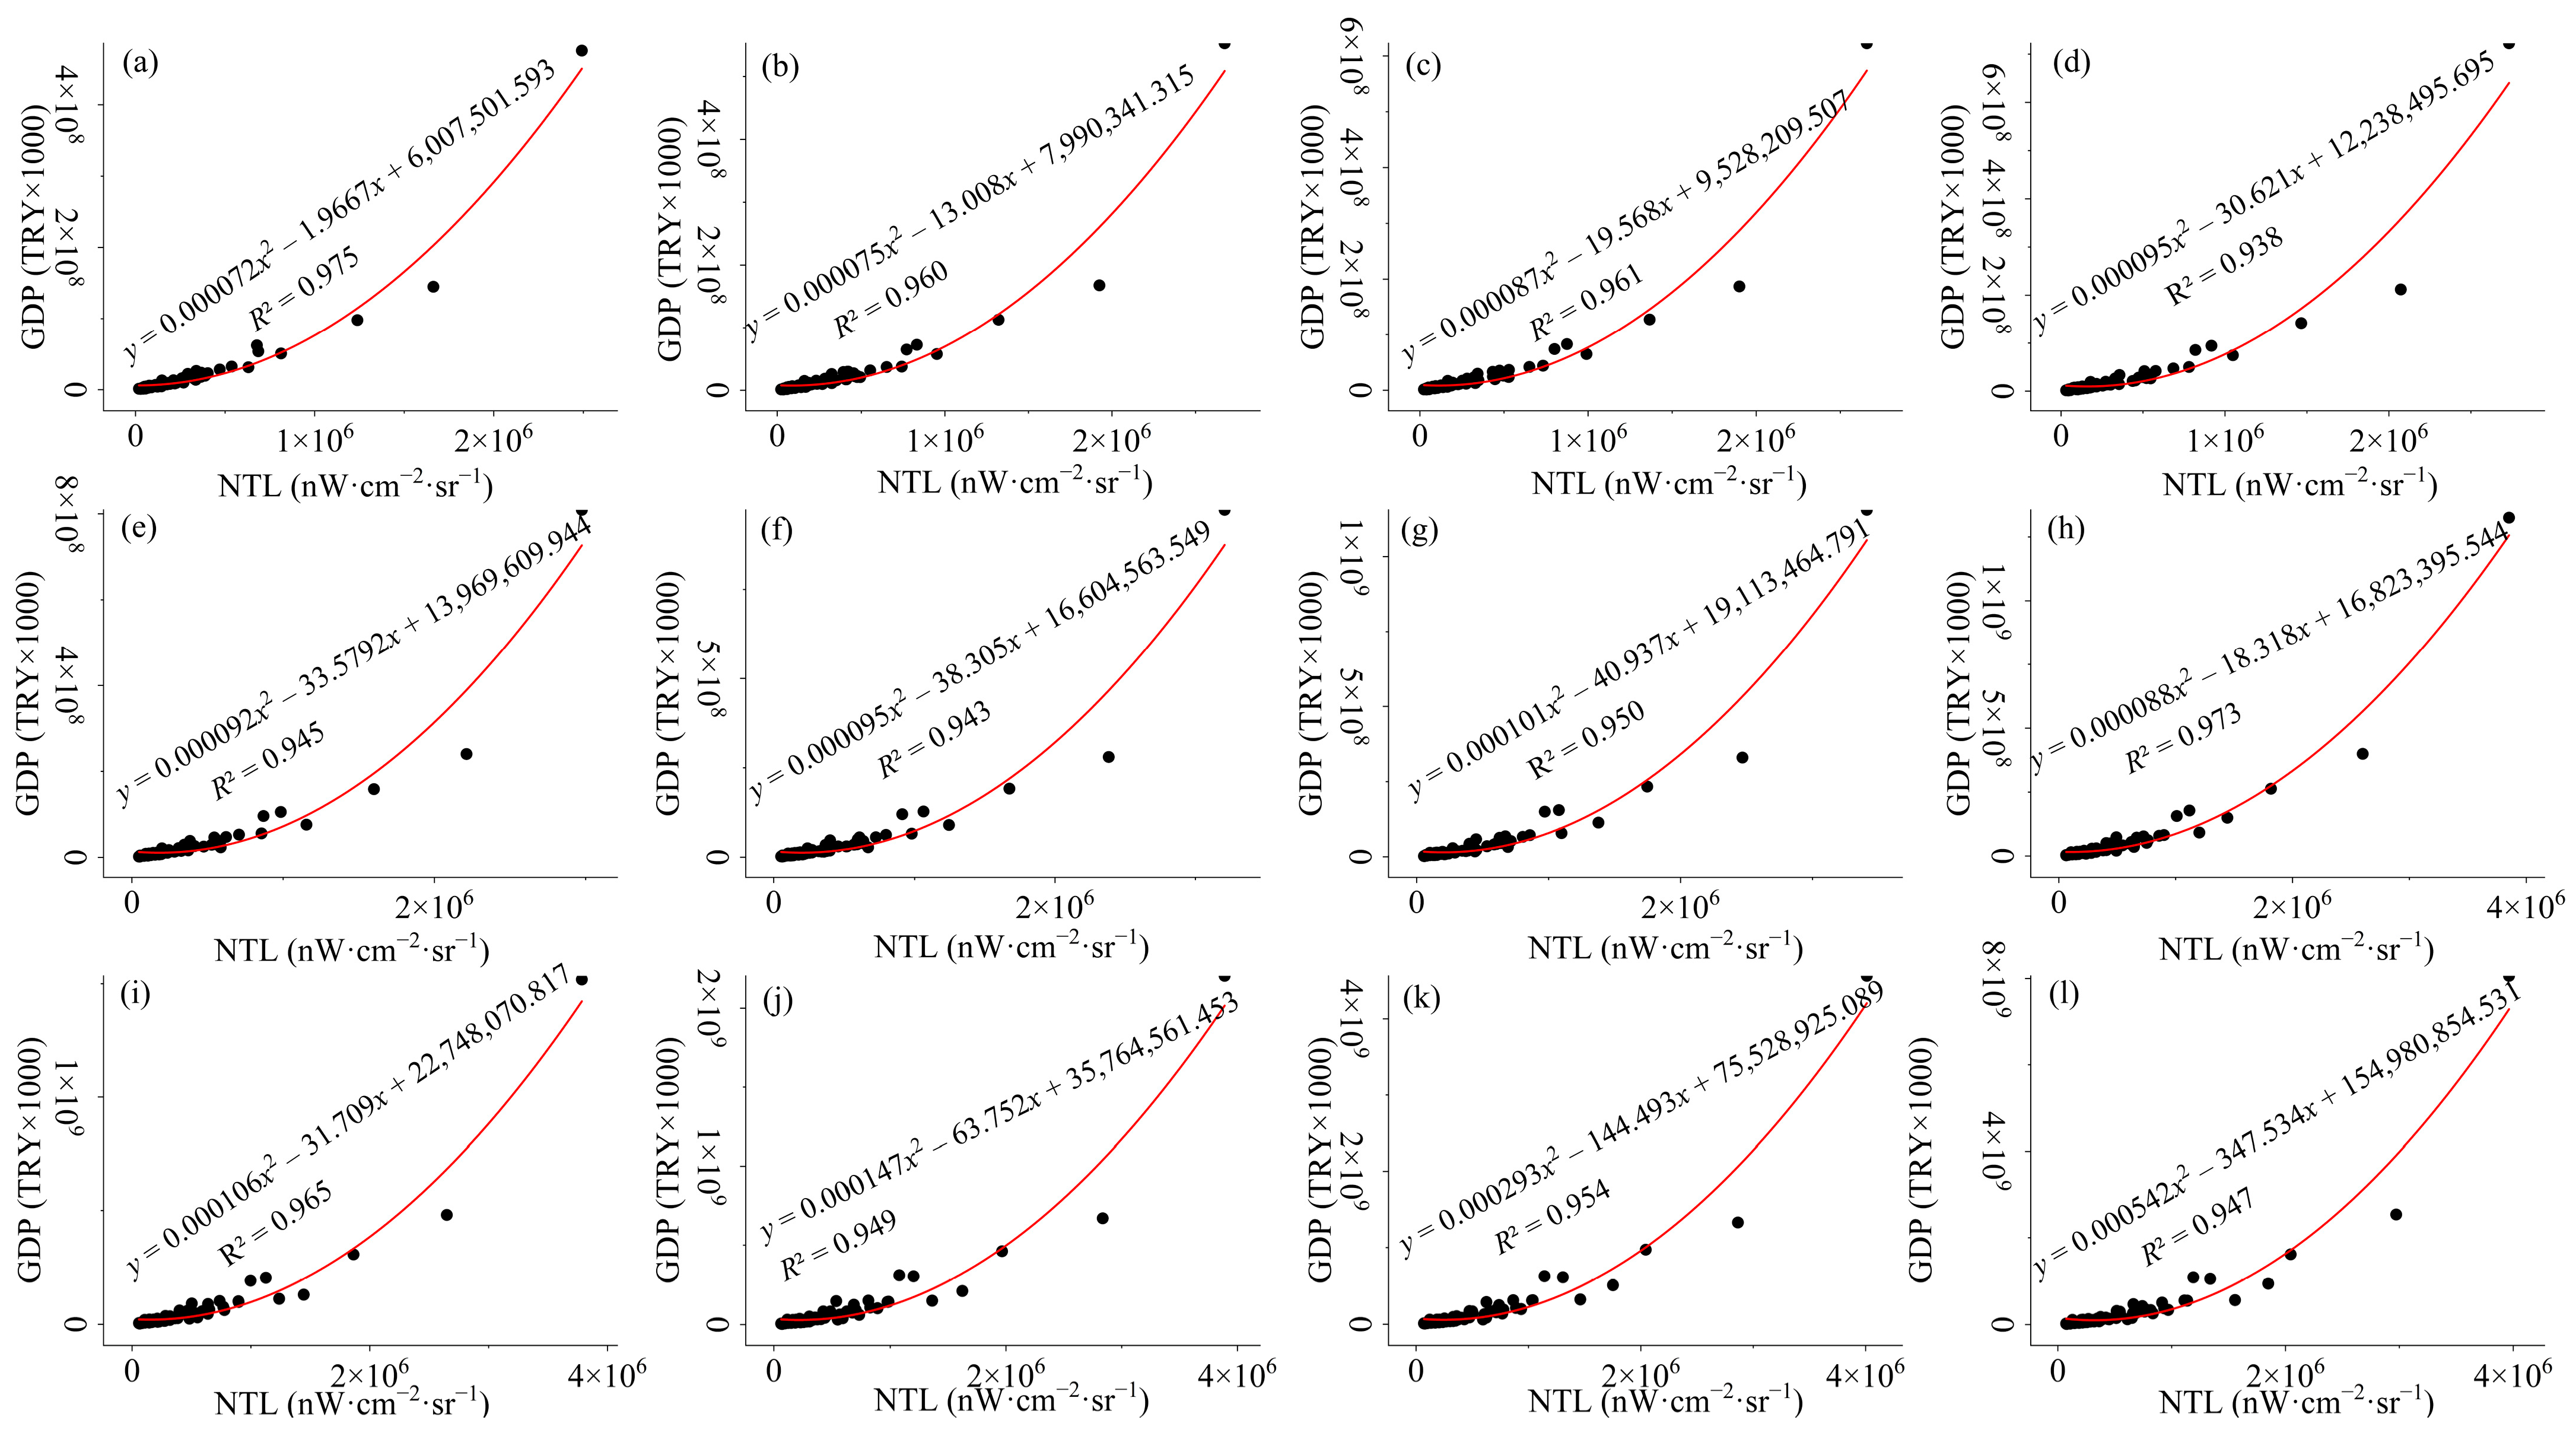
5.2. Reliability Analysis of NTL Data Reflecting the Level of Regional Economic Development

As illustrated in Figure 7, twelve quadratic polynomial models were developed using 81 provincial GDP data points alongside annual provincial NTL data from 2012 to 2023 in Turkey. These models exhibit an impressive R2 range of 0.938 to 0.975, with an average value of 0.955. This indicates the ability of quadratic polynomial models to explain 95.5% of the variation in GDP, significantly surpassing that of traditional linear models. This finding suggests that the nonlinear relationship between NTLs and GDP is statistically significant. The high R2 values demonstrate that NTL data effectively capture the essential aspects of economic development across provinces in Turkey, particularly during the phases of industrialisation and urbanisation, where the intensity of NTLs closely correlates with levels of economic activity.

5.3. Validation of the Effectiveness of the Post-Earthquake Economic Recovery

5.3.1. Validation of the Effectiveness of the Post-Earthquake Economic Recovery Framework

The approach to developing the economic recovery framework for time series ALI was consistent across all districts. To assess the validity of the time series ALI process data, we analysed and compared them using Altinozu as a case study. Figure 8 presents the time series data of ALI, SMA-smoothed values, STC, and SAF from April 2020 to November 2024 for Altinozu. Time series ALI data are often plagued by random noise and seasonal fluctuations, making it challenging to effectively identify trends in regional economic development. This random noise can be smoothed out by applying the SMA algorithm, which can reveal the long-term trends in regional economic development. Following this, the seasonal decomposition method eliminates seasonal effects, i.e., SAF, resulting in a more refined and precise representation of the economic development trends.
To evaluate the validity of the regression models, the p-values, F-scores, and R2 of the regression models for each district of Hatay Province during the pre- and post-earthquake periods are shown in Table 3. The pre-earthquake and post-earthquake regression models have a p-value of 0.00, significantly lower than the 0.01 significance level. This compelling evidence rejects the null hypothesis, confirming that all regression models are statistically significant. The F-scores for the regression models in Hatay Province during the pre- and post-earthquake periods were 522.86 and 117.34, respectively, highlighting the strong significance of both models. Their R2 values of 0.94 and 0.85 demonstrate a remarkable fit, indicating that these two regression models accurately explain the ALI data.
The F-scores of the regression models for the 12 districts of Hatay Province before the earthquake vary significantly, ranging from 91.19 to 1923.83, with an average of 698.37. The R2 values range from 0.74 to 0.98, with an average of 0.92. These metrics demonstrate that all 12 regression models are highly significant and provide an excellent fit for the data. Notably, Erzin has the weakest fit, while Kirikhan demonstrates the strongest performance among the models. The F-scores of the regression models for the 12 districts in Hatay Province after the earthquake vary significantly, ranging from 11.50 to 318.92, with an average of 81.08. Meanwhile, the R2 values range from 0.55 to 0.96, with an average of 0.85. Samandag exhibits the poorest regression fit, marked by an R2 value of just 0.55, which is attributed to large data fluctuations, causing the regression model to only partially reflect the data trend. In contrast, the regression models for the other 11 districts demonstrate strong significance and high fit. Overall, these regression models effectively illustrate the trends in economic development following the earthquake for all 12 districts. Additionally, the statistical tests indicate that the pre-earthquake regression models demonstrate a significantly superior fit compared to post-earthquake models. This can be attributed to more sample data available during the 34 months preceding the earthquake, in contrast to the 22 months available afterward. Therefore, as more monthly NTL data from the post-earthquake period become available, the fit of the post-earthquake regression model is expected to improve.

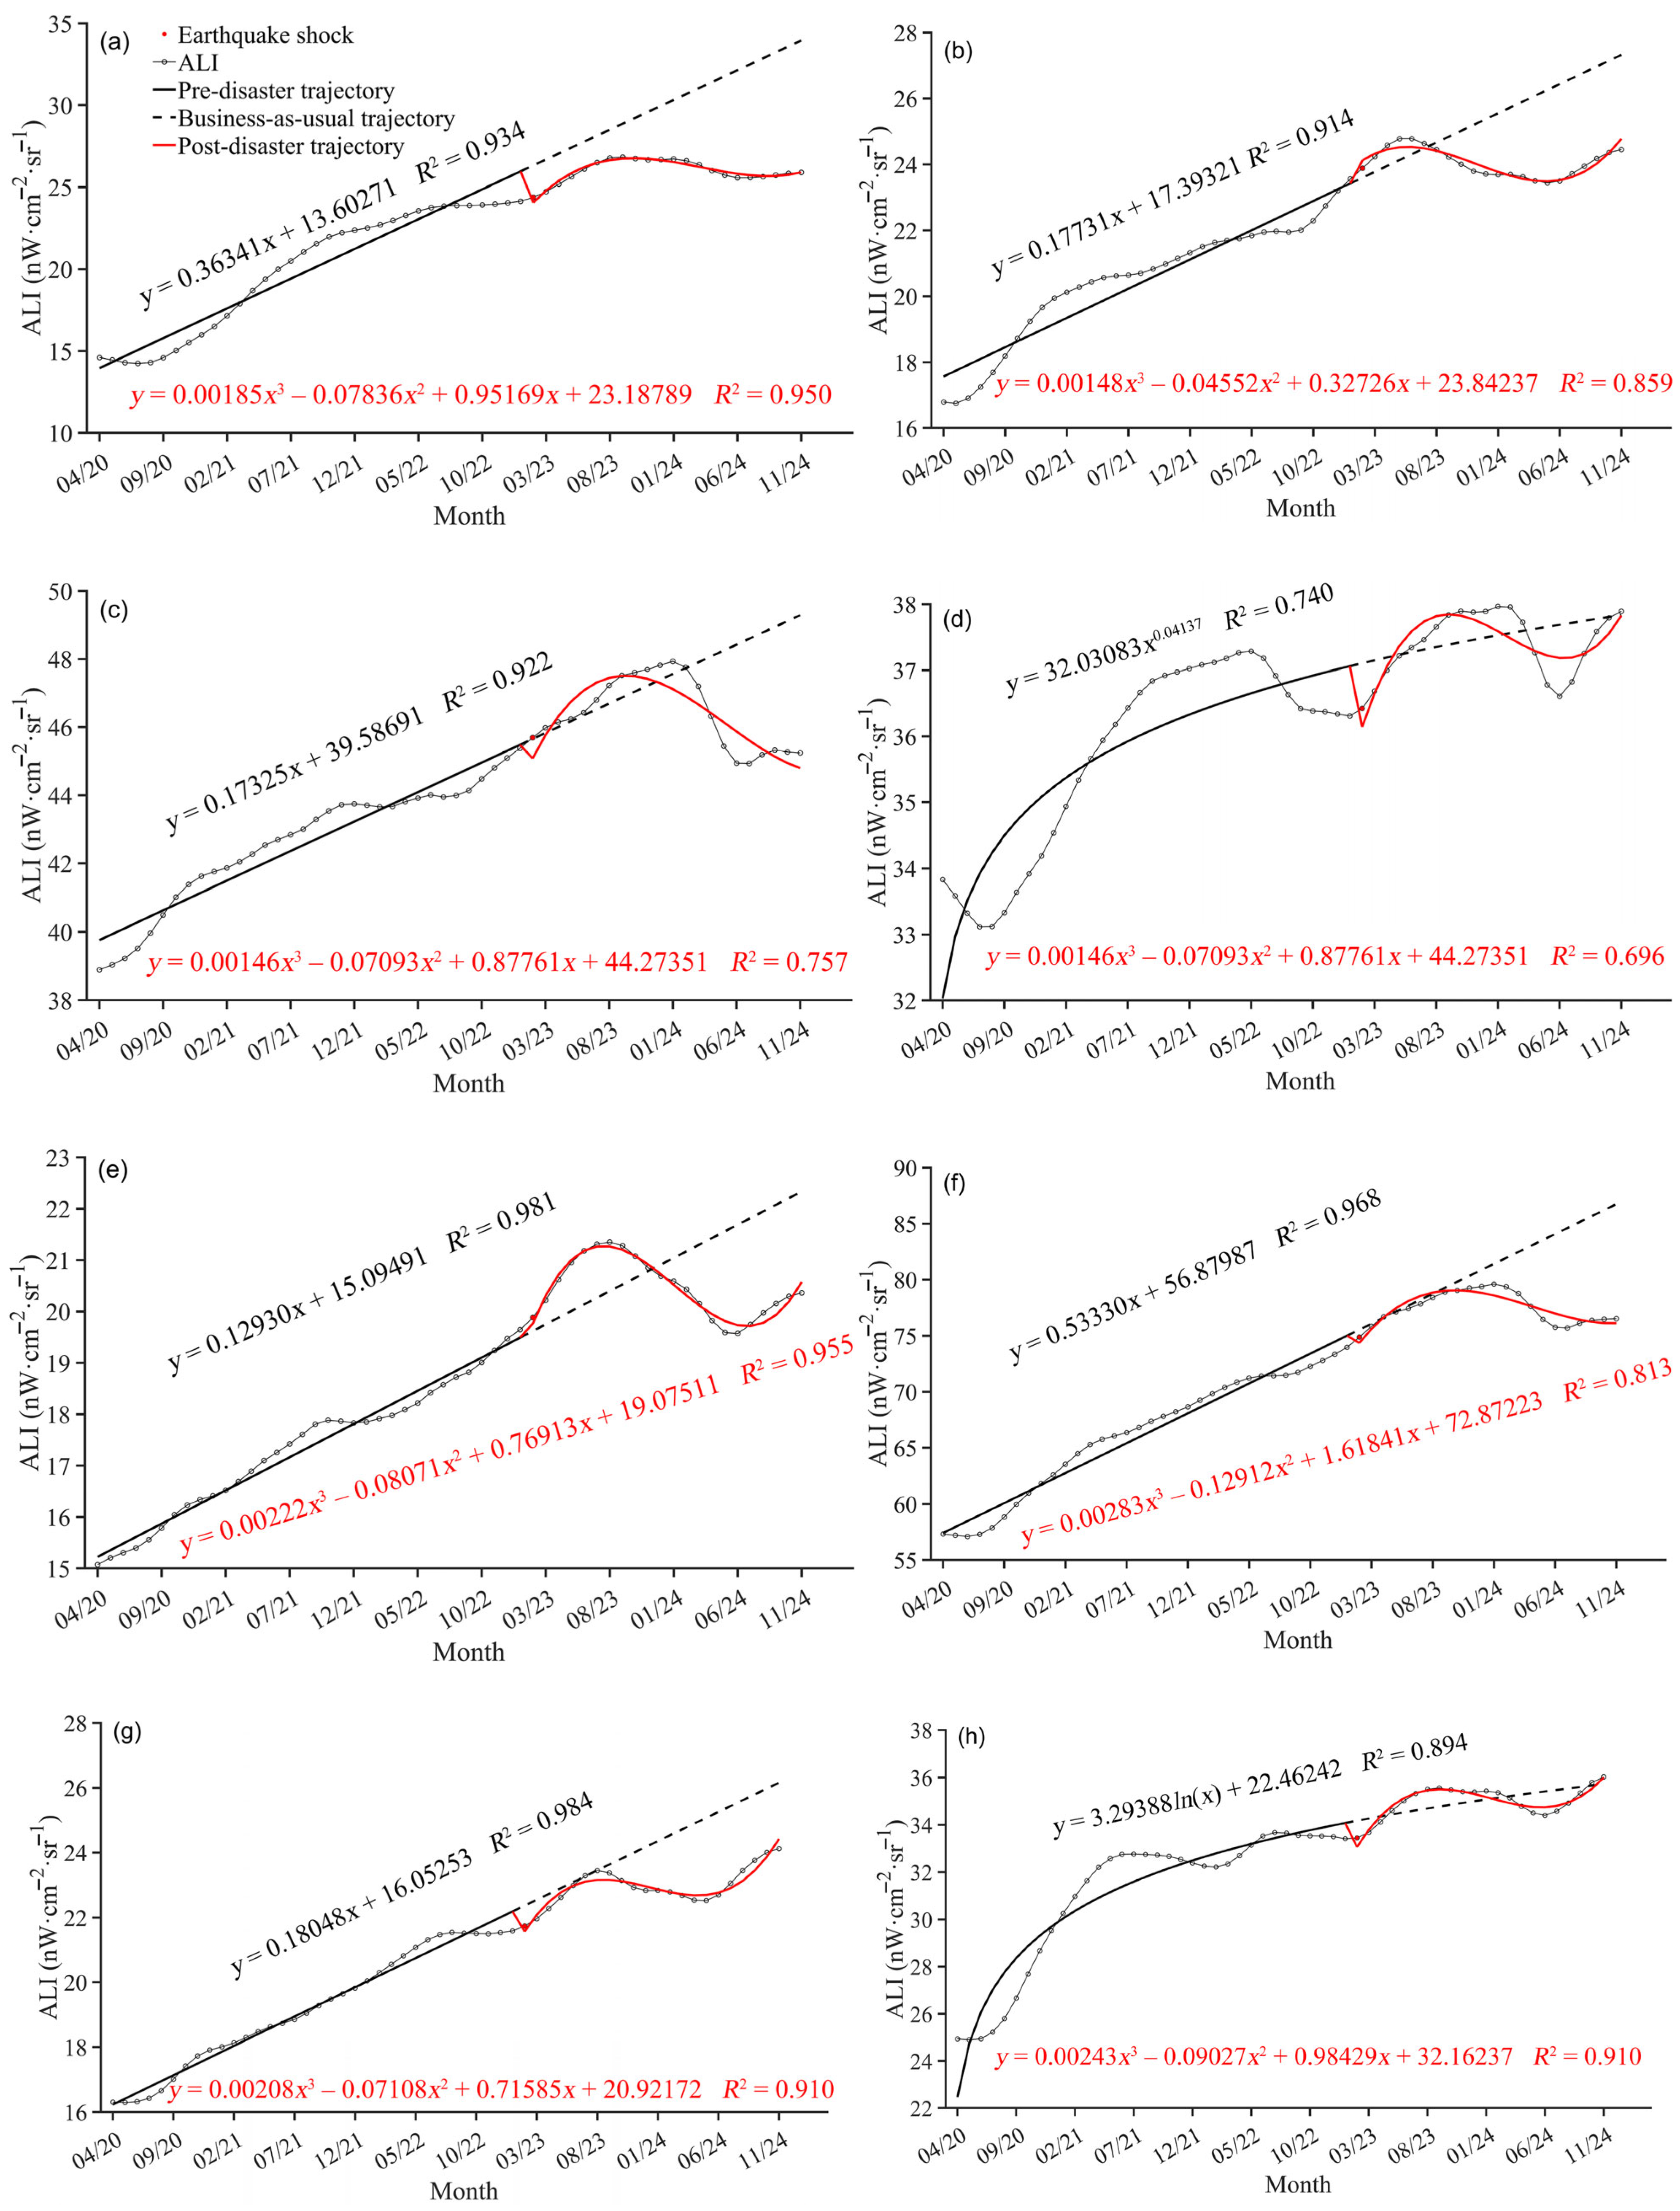
5.3.2. Verification of Economic Recovery Across Various Districts Post-Earthquake

Antakya emerged as the city most devastated by the earthquake, with a staggering 90% of its buildings destroyed. According to the Hatay Planning Centre, over half of the reconstruction investments—51.3%—were allocated to Antakya in the aftermath of the disaster [48]. By 2024, the built-up area of the city had increased by 21.1% compared to 2023. Figure 5i illustrates that while the ALI data have risen significantly since the disaster, many residents continue to live in precarious container housing. This stark reality indicates that, despite ongoing reconstruction efforts, the district’s complete economic recovery could still be years away [49].
Erzin and Kumlu experienced minimal impact from the earthquake, and the government did not initiate large-scale post-disaster construction investment projects in these areas. Following the earthquake, Erzin witnessed an influx of new residents [50]. According to the ALI data presented in Figure 5d, the city’s economy was highly active and significantly recovered during the study period. In contrast, Kumlu’s economy, as indicated by the ALI data in Figure 5h, remained relatively stable, continuing its steady growth trajectory similar to pre-earthquake levels. This finding aligns well with the results obtained by Xiao et al. [17].
Compared to the southern districts of Hatay Province, the Dortyol area was less affected by the earthquake. However, in the aftermath, farmers struggled to find workers to harvest and sell their crops, which caused significant damage to the district’s agricultural economy [51]. According to the ALI data in Figure 5c, the area’s economy experienced approximately one year of positive growth before showing a substantial decline, with the timeline for recovery remaining uncertain. The finding aligns well with the results of Xiao et al. [17].
The earthquake heavily damaged Samandag, destroying many factories and commercial centres. As of February 2024, the demolition of ruined buildings was still ongoing, and many victims were still residing in tents, containers, and prefabricated houses [51]. According to the ALI data in Figure 5k, the district’s economy is in decline, making the timeline for economic recovery uncertain.
Iskenderun’s city centre faced a significant wave of building demolitions in the aftermath of the earthquake, and debris removal efforts are still ongoing. The disaster also triggered a massive fire at the main port, causing damage to one-third of the containers [52]. Furthermore, post-quake flooding along the coastal strip severely hindered the district’s economic growth. Nevertheless, with the support of government reconstruction funding, steel mills, and automobile manufacturing facilities have fully resumed operations [51]. According to the ALI data in Figure 5f, the city’s economy is anticipated to recover steadily in the coming years.
The urban centre of Belen suffered significant building damage from the earthquake. However, the roads and industrial facilities remained intact, and the overall economic impact was less severe than in other areas [51]. According to the ALI data in Figure 5b, the city retains strong potential for a swift economic recovery.
Kirikhan suffered significant impacts from the earthquake, with numerous farmers facing damage to their machinery and warehouses. In urban areas, active efforts are underway to demolish or dismantle damaged structures. Despite these challenges, commercial activities in Kirikhan remain robust [51]. Government investment projects account for 10.3% of the total, while large-scale industrial investments are poised to drive economic growth in the district further. According to the ALI data in Figure 5g, a swift economic recovery is anticipated in the near future.
Hassa, situated near the EAFZ, endured extensive damage, leading to the demolition and removal of numerous compromised mid- and high-rise buildings. Nearly seven months into the post-earthquake reconstruction efforts, the pace of urban renewal began to wane. As depicted in Figure 5e, the ALI data reached its lowest point in June 2024. However, with the support of international humanitarian organisations and the Turkish government for small businesses and agricultural ventures, Hassa is steadily rebuilding its economic foundations, with projections indicating a robust recovery in the years ahead [53,54].
The earthquake caused relatively minor damage in Reyhanli, leaving most buildings intact, with none demolished or dismantled. Commercial, healthcare, educational, and agricultural activities have continued to operate fully [51]. As depicted by the ALI data in Figure 5j, Reyhanli’s economy appears well-positioned for a swift recovery. This finding aligns well with the results obtained by Xiao et al. [17].
Altinozu sustained minimal damage during the earthquake, with its population growing by over 6000 in the aftermath. The city’s commercial activities have remained stable, continuing without disruption following the earthquake [51]. Analysing the shifts in the ALI data depicted in Figure 5a, it is clear that the city’s economy is well-positioned for recovery in the years ahead.
The earthquake caused significant damage in the rural areas of Yayladagi, where temporary settlements were less prevalent than in other districts. Nevertheless, the city’s commercial activities remained largely unaffected and continued to operate as usual. In the aftermath, the Hatay provincial government initiated investments to establish two industrial parks in Yayladagi and Senkoy [51]. As depicted by the ALI data in Figure 5l, the city’s economy is anticipated to recover steadily in the coming years.
Overall, Hatay Province experienced catastrophic damage during a powerful earthquake, with 80% of its buildings destroyed and a 9% reduction in population [55]. Both the industrial and service sectors were severely affected. To expedite post-disaster reconstruction, the Turkish government implemented a comprehensive aid program, which included the establishment of a $1.41 million relief fund for small and medium-sized enterprises, the allocation of $3.74 million in agricultural subsidies, and the distribution of $2.9 million in emergency assistance to 24,400 affected households [56]. By 2024, the province showed strong signs of economic recovery, with foreign trade exports increasing by 35% year-on-year to $3.48 billion [57]. However, significant challenges remained: as of October 2024, over 420,000 residents still lived in temporary container housing and urgently needed permanent accommodation solutions. Additionally, the earthquake-induced price hikes placed further pressure on low-income groups. The restoration of Hatay Province’s infrastructure and the rebuilding of its social safety net continue to require sustained investment. According to the ALI data in Figure 4, the province is struggling to recover from the trauma of the earthquake.

5.4. Strengths, Weaknesses, and Prospects of the Study

This study evaluates earthquake damage and the subsequent economic recovery in Hatay Province, Turkey, utilising both daily and monthly NPP-VIIRS NTL data. The NTL data demonstrate significant advantages over traditional high-resolution optical and synthetic aperture radar (SAR) imagery, including speed, efficiency, extensive coverage, and relative accuracy. While high-resolution NTL sources such as Jilin-1 and SDGSAT-1 are available, their high costs, accessibility challenges, and quality concerns constrain their usefulness for timely assessments of seismic hazards. Despite the valuable insights provided by the NPP-VIIRS NTL data, their low resolution presents several challenges in accurately evaluating earthquake damage and tracking economic recovery:
  • The 500 m resolution of the data presents challenges in identifying earthquake damage within residential areas smaller than 0.25 km2. The mixed-pixel nature of the data generates composite signals that encompass various land covers, including structures with differing levels of damage. This blending diminishes the accuracy of assessing the specific damage status of individual structures. Moreover, illumination from interfering light sources—such as highway landscape lights, emergency rescue lights, and temporary warming fires—further compromises the accuracy of damage assessments. Notably, variations in NTL illumination exhibit a strong linear relationship (R2 > 0.7) with moderate to severe structural damage, yet only a weak linear correlation (R2 < 0.3) with slight structural damage. This disparity highlights the dual nature of NPP-VIIRS NTL data in seismic evaluations: while it excels in macro-level monitoring of significant building damage across large areas after major seismic events, its ability to detect minor damage—such as cracks or localised collapses—is limited by its low spatial resolution and the mixed-pixel effect, reducing its effectiveness in identifying low-intensity seismic damage scenarios.
  • NTL data serve as a crucial proxy for gauging the intensity of human socioeconomic activities. However, its application in assessing economic recovery after an earthquake faces significant challenges due to its multidimensional complexity. Certain post-disaster economic behaviours can heavily interfere with NTL signals. For instance, the increased brightness from temporary settlement relief facilities and nighttime construction efforts can easily be misinterpreted as indications of short-term economic recovery. On the other hand, factors such as population migration and workforce loss can suppress NTL signals, reflecting a more profound decline in economic activity in the affected regions. Informal economic activities that emerge after disasters—such as unlit temporary markets and mobile vendors—are often excluded from NTL data analysis, potentially leading to a systemic underestimation of the resilience and recovery capacity of the post-disaster economy. Furthermore, data collected over the 22 months following the earthquake may primarily represent trends from the initial stages of economic recovery, thereby limiting the reliability of the findings.
Due to the limitations of the NPP-VIIRS NTL data, future studies should pursue multi-source collaborative technological optimisation strategies. Firstly, such methods as random forest area-to-point kriging interpolation (RFATPK) or deep learning-based super-resolution models could be utilised to enhance the original 500 m resolution to a 100 m scale, thereby significantly improving the detection of damage features in small-scale building clusters [58]. Secondly, integrating convolutional neural networks (CNNs) with SAR coherence change maps and NTL data could establish multimodal feature fusion models, improving the precision of building damage assessments. Simultaneously, by applying daily temporal sequence analysis, interference signals could be filtered out, enhancing data reliability within the critical two-week post-disaster period. Thirdly, merging population distribution data, points of interest (POI), social media, and mobile signaling trajectory data could enable the development of a “human activity intensity–light variation” correlation model. This model would help rectify biases in NTL signals introduced by non-economic factors and facilitate the dynamic calibration of economic recovery. Fourthly, to tackle the issue of limited data duration, future studies should leverage longer time spans or dynamically track various stages of economic recovery, integrating post-disaster field survey data with economic statistics to enhance the reliability of findings. Finally, leveraging socioeconomic indicators such as employment rates, county-level GDP, electricity consumption, and retail sales of consumer goods would allow for a comprehensive evaluation of the effectiveness of NTL-based economic recovery prediction models.
Natural disasters drastically disrupt human activities and infrastructure, directly affecting the distribution and intensity of NTLs in urban areas with stable power supplies. Such events as earthquakes, floods, and hurricanes often lead to significant alterations in NTL data, making them a valuable indicator for tracking disaster progression and assessing subsequent economic recovery, especially when these disasters profoundly impact human society. However, due to the weak NTL signals in rural or remote areas, NTLs need to be integrated with other data sources, such as optical remote sensing and population distribution data, to conduct disaster damage assessments. To ensure accurate and comprehensive disaster analysis, integrating NTL data with diverse data sources is essential. For example, combining water level monitoring with rainfall data for flood assessments or layering wind speed and trajectory information for hurricane analyses can provide a more nuanced understanding of disaster impacts. Additionally, the data smoothing and seasonal decomposition techniques utilised in this study successfully mitigate noise and seasonal fluctuations, enhancing the stability of economic prediction models. These methods also show potential applicability for evaluating other disasters.

6. Conclusions

This study introduced a comprehensive methodology for creating earthquake damage maps for Hatay Province of Turkey, utilising the pre- and post-earthquake NPP-VIIRS data. Additionally, it assessed the economic recovery across 12 districts of the province following the earthquake. Finally, this research drew the following conclusions:
(1) Earthquake damage maps were created by analysing monthly NTL data before the earthquake and daily NTL data following the event. This analysis achieved an overall accuracy exceeding 71.55%, as validated by two reference datasets. The primary sources of error in the damage classification stemmed from misidentification of slightly damaged buildings and darkened road segments outside urban areas. Furthermore, omission errors primarily resulted from the low 500 m resolution of the NPP-VIIRS image.
(2) The areas of severely and moderately damaged buildings, as well as the total number of damaged buildings, strongly correlated with reduced NPP-VIIRS NTLs. In contrast, the relationship between the reduced NPP-VIIRS NTLs and slightly damaged buildings was less pronounced. This relationship suggests that slightly damaged buildings do not significantly contribute to the decrease in urban nighttime illumination.
(3) Economic recovery frameworks for the 12 districts of Hatay Province after the earthquake were developed through the smoothing and seasonal decomposition of time series ALI data. The results of statistical tests revealed that the regression models created pre- and post- earthquake were statistically significant, demonstrating robust overall significance. These frameworks are now poised to analyse post-earthquake economic trends effectively.
(4) The economic recovery framework established after the earthquake reveals distinct regional disparities throughout Hatay Province’s recovery process. Erzin, Kumlu, and Antakya show encouraging signs of economic revival; however, insights from recent surveys indicate that Antakya, which was heavily impacted by the disaster, was misinterpreted. The lights illuminating reconstruction efforts at night were mistakenly perceived as indicators of economic resurgence, while the reality is that the city’s economy continues to face significant challenges. Dortyol and Samandag are confronting considerable short-term obstacles to economic recovery, primarily due to extensive damage to their agricultural and industrial sectors. In contrast, the economies of the remaining seven districts, less affected by the earthquake, are on track for economic recovery by March 2026. Overall, while the economy of Hatay Province is gradually rebounding, achieving full recovery will require a significant amount of time, and the outlook for future economic growth remains unpredictable.

Author Contributions

Feng Li and Shunbao Liao designed this experiment and arranged the structure of this manuscript; Xingjian Fu and Tianxuan Liu processed the NPP-VIIRS NTL data, generated the earthquake damage map, and validated the results; Shunbao Liao and Feng Li analysed and assessed the economic recovery of Hatay Province, Turkey; Feng Li wrote this manuscript based on these findings. All authors have read and agreed to the published version of the manuscript.

Funding

This research was funded by the Hebei Key Laboratory of Earthquake Disaster Prevention and Risk Assessment, grant number FZ247105, and the National Key Research and Development Program of China, grant number 2017YFD0300403.

Data Availability Statement

The data that support the findings of this study are openly available in “TurkeyEarthquakeDamagePaperData” at https://pan.baidu.com/s/1VFU2uBom3wr6GpSMA-Uwhg?pwd=a31j, (accessed on 3 July 2024). Monitoring Report on the First Year in Hatay Province is available at https://drive.google.com/file/d/1ddD-KfLqaTmSjZrokHou7Nf_l_xUKKU-/view?usp=sharing, (accessed on 3 July 2024). Turkey Earthquakes Operation Update #7—Emergency Appeal No. MDRTR004 is available at https://reliefweb.int/report/turkiye/turkiye-earthquakes-operation-update-7-emergency-appeal-no-mdrtr004-06122024, (accessed on 3 July 2024).

Acknowledgments

We would like to thank the editor and anonymous reviewers for their valuable comments and suggestions on this manuscript.

Conflicts of Interest

The authors declare no conflicts of interest.

Appendix A

Appendix A.1

Table A1. Comparison of the field data and NTL assessment of damaged buildings.
PointLatitudeLongitudeCityStructureField AssessmentNTL Assessment
3336.22913536.165190AntakyaResidential buildingsSeverely damagedModerately damaged
3436.23105836.165816AntakyaResidential buildingsSeverely damagedModerately damaged
3536.23031136.169230AntakyaResidential buildingsSeverely damagedSeverely damaged
3636.22971836.168989AntakyaResidential buildingsSeverely damagedSeverely damaged
3736.22997136.167919AntakyaResidential buildingsSeverely damagedSeverely damaged
3836.22991736.164761AntakyaResidential buildingsSeverely damagedModerately damaged
3936.23103036.166230AntakyaResidential buildingsSeverely damagedModerately damaged
4036.22702936.163210AntakyaResidential buildingsSeverely damagedNo damage
4136.23876936.175664AntakyaResidential buildingsSeverely damagedSeverely damaged
4436.23926436.175192AntakyaResidential buildingsSeverely damagedSeverely damaged
4536.23958736.174556AntakyaResidential buildingsSeverely damagedSeverely damaged
4636.23984236.174091AntakyaResidential buildingsSeverely damagedSeverely damaged
4736.24040536.173694AntakyaResidential buildingsSeverely damagedSeverely damaged
4836.24046336.173423AntakyaResidential buildingsSeverely damagedSeverely damaged
4936.24068836.173581AntakyaResidential buildingsSeverely damagedSeverely damaged
5036.24083936.173702AntakyaResidential buildingsSeverely damagedSeverely damaged
5136.23999736.173350AntakyaResidential buildingsSeverely damagedSeverely damaged
5236.24011236.173131AntakyaResidential buildingsSeverely damagedSeverely damaged
5336.24027436.173241AntakyaResidential buildingsSeverely damagedSeverely damaged
5436.24042936.172994AntakyaResidential buildingsSeverely damagedSeverely damaged
5536.24026736.172886AntakyaResidential buildingsSeverely damagedSeverely damaged
5636.24055036.172784AntakyaResidential buildingsSeverely damagedSeverely damaged
5736.24041636.172655AntakyaResidential buildingsSeverely damagedSeverely damaged
5836.24074536.172505AntakyaResidential buildingsSeverely damagedSeverely damaged
5936.24103936.172805AntakyaResidential buildingsSeverely damagedSeverely damaged
6036.24111036.172623AntakyaResidential buildingsSeverely damagedSeverely damaged
6136.24021536.172083AntakyaResidential buildingsSeverely damagedSeverely damaged
6236.24004236.172413AntakyaResidential buildingsSeverely damagedSeverely damaged
6336.23985136.172581AntakyaResidential buildingsSeverely damagedSeverely damaged
6436.23973536.172734AntakyaResidential buildingsSeverely damagedSeverely damaged
6536.24141836.172778AntakyaResidential buildingsSeverely damagedSeverely damaged
6636.24135436.172972AntakyaResidential buildingsSeverely damagedSeverely damaged
8336.24164836.173339AntakyaResidential buildingsSeverely damagedSeverely damaged
7736.58278236.169085IskenderunResidential buildingsSeverely damagedSeverely damaged
7836.20669536.152426AntakyaResidential buildingsSeverely damagedSeverely damaged
7936.23052836.150281AntakyaResidential buildingsSeverely damagedSlightly damaged
8036.24131636.174080AntakyaResidential buildingsSeverely damagedSeverely damaged
8136.24137536.174252AntakyaResidential buildingsSeverely damagedSeverely damaged
8236.24099036.173876AntakyaResidential buildingsSeverely damagedSeverely damaged
6736.24164836.173339AntakyaResidential buildingsSeverely damagedSeverely damaged
8436.24112736.175161AntakyaResidential buildingsSeverely damagedSeverely damaged
8536.23920336.174925AntakyaResidential buildingsSeverely damagedSeverely damaged
8636.23991636.177123AntakyaResidential buildingsSeverely damagedSeverely damaged
11136.18511136.121000AntakyaSchool buildingsSeverely damagedSeverely damaged
036.56903136.166170IskenderunMedical buildingsSeverely damagedSeverely damaged
11636.27030936.223331AntakyaMedical buildingsSlightly damagedSlightly damaged
12436.24046936.174834AntakyaCritical buildingsSeverely damagedSeverely damaged
13036.59110036.168200IskenderunReligious buildingsSeverely damagedSeverely damaged
14836.36158736.286585AntakyaAirportsSeverely damagedSeverely damaged
15036.23120836.166476AntakyaRoads and bridgesSeverely damagedModerately damaged
2636.19593336.158567AntakyaResidential buildingsSeverely damagedSeverely damaged
8736.58940036.178200IskenderunResidential buildingsSeverely damagedModerately damaged
10436.24540036.569900ReyhanliResidential buildingsSeverely damagedModerately damaged
11936.23540036.169500AntakyaMedical buildingsSeverely damagedSeverely damaged
12636.20150036.165500AntakyaReligious buildingsSeverely damagedSeverely damaged
13336.20150036.165500AntakyaHistoric buildingsSeverely damagedSeverely damaged
13536.53163736.364843KirikhanHistoric buildingsSeverely damagedNo damage
13636.20190036.162100AntakyaHistoric buildingsSeverely damagedSeverely damaged
15836.20000036.159000AntakyaRoads and bridgesSlightly damagedSeverely damaged

References

  1. The M7.8 and M7.5 Kahramanmaraş Earthquake Sequence Struck Near Nurdagi, Turkey on 6 February 2023. Available online: https://www.usgs.gov/news/featured-story/m78-and-m75-kahramanmaras-earthquake-sequence-near-nurdagi-turkey-turkiye (accessed on 3 July 2024).
  2. Taftsoglou, M.; Valkaniotis, S.; Papathanassiou, G.; Karantanellis, E. Satellite Imagery for Rapid Detection of Liquefaction Surface Manifestations: The Case Study of Turkey–Syria 2023 Earthquakes. Remote Sens. 2023, 15, 4190. [Google Scholar]
  3. Ezgi Guvercin, S. 2023 Earthquake Doublet in Turkey Reveals the Complexities of the East Anatolian Fault Zone: Insights from Aftershock Patterns and Moment Tensor Solutions. Seismol. Res. Lett. 2024, 95, 664–679. [Google Scholar] [CrossRef]
  4. One Year After Turkey’s Earthquakes, Recovery Takes Many Forms. Available online: https://www.undp.org/eurasia/stories/one-year-after-turkiyes-earthquakes-recovery-takes-many-forms (accessed on 3 July 2024).
  5. Gu, J.; Xie, Z.; Zhang, J.; He, X. Advances in Rapid Damage Identification Methods for Post-Disaster Regional Buildings Based on Remote Sensing Images: A Survey. Buildings 2024, 14, 898. [Google Scholar] [CrossRef]
  6. Zheng, Q.; Seto, K.C.; Zhou, Y.; You, S.; Weng, Q. Nighttime Light Remote Sensing for Urban Applications: Progress, Challenges, and Prospects. ISPRS J. Photogramm. 2023, 202, 125–141. [Google Scholar] [CrossRef]
  7. Liu, C.; Tang, Q.; Xu, Y.; Wang, C.; Wang, S.; Wang, H.; Li, W.; Cui, H.; Zhang, Q.; Li, Q. High-Spatial-Resolution Nighttime Light Dataset Acquisition Based on Volunteered Passenger Aircraft Remote Sensing. IEEE Trans. Geosci. Remote Sens. 2022, 60, 1001817. [Google Scholar]
  8. Li, F.; Liu, X.; Liao, S.; Jia, P. The Modified Normalized Urban Area Composite Index: A Satelliate-Derived High-Resolution Index for Extracting Urban Areas. Remote Sens. 2021, 13, 2350. [Google Scholar] [CrossRef]
  9. Zhang, H.; Yu, Q.; Liu, Y.; Jiang, J.; Chen, J.; Liu, R. The Spatio-Temporal Patterns of Regional Development in Shandong Province of China from 2012 to 2021 Based on Nighttime Light Remote Sensing. Sensors 2023, 23, 8728. [Google Scholar] [CrossRef]
  10. Chen, L.; Yu, L.; Yin, J.; Xi, M. Impact of Population Density on Spatial Differences in the Economic Growth of Urban Agglomerations: The Case of Guanzhong Plain Urban Agglomeration, China. Sustainability 2023, 15, 14601. [Google Scholar] [CrossRef]
  11. Li, L.-L.; Liang, P.; Jiang, S.; Chen, Z.-Q. Multi-Scale Dynamic Analysis of the Russian–Ukrainian Conflict from the Perspective of Night-Time Lights. Appl. Sci. 2022, 12, 12998. [Google Scholar] [CrossRef]
  12. Wang, L.; Li, Z.; Han, J.; Fan, K.; Chen, Y.; Wang, J.; Fu, J. A Cost-Effective Earthquake Disaster Assessment Model for Power Systems Based on Nighttime Light Information. Appl. Sci. 2024, 14, 2325. [Google Scholar] [CrossRef]
  13. Sarkar, S. Rapid Assessment of Cyclone Damage Using NPP-VIIRS DNB and Ancillary Data. Nat. Hazards 2021, 106, 579–593. [Google Scholar] [CrossRef] [PubMed]
  14. Levin, N. Using Night Lights from Space to Assess Areas Impacted by the 2023 Turkey Earthquake. Remote Sens. 2023, 15, 2120. [Google Scholar] [CrossRef]
  15. Yuan, Y.; Wang, C.; Liu, S.; Chen, Z.; Ma, X.; Li, W.; Zhang, L.; Yu, B. The Changes in Nighttime Lights Caused by the Turkey–Syria Earthquake Using NOAA-20 VIIRS Day/Night Band Data. Remote Sens. 2023, 15, 3438. [Google Scholar] [CrossRef]
  16. Fan, X.; Nie, G.; Deng, Y.; An, J.; Zhou, J.; Li, H. Rapid Detection of Earthquake Damage Areas Using VIIRS Nearly Constant Contrast Night-Time Light Data. Int. J. Remote Sens. 2018, 40, 2386–2409. [Google Scholar] [CrossRef]
  17. Xiao, Z.; Pan, Y.; Jiang, L.; Wang, Z.; Shi, K. Remote Sensing Nighttime Lights Reveal the Post-Earthquake Losses and Reconstruction Situations in Turkey–Syria Earthquake Areas. IEEE Geosci. Remote Sens. Lett. 2024, 21, 3002405. [Google Scholar] [CrossRef]
  18. Li, X.; Liu, Z.; Chen, X.; Meng, Q. Assessment of the Impact of the 2010 Haiti Earthquake on Human Activity Based on DMSP/OLS Time Series Nighttime Light Data. J. Appl. Remote Sens. 2019, 13, 044515. [Google Scholar] [CrossRef]
  19. Wang, J.; Zhang, J.; Gong, L.; Li, Q.; Zhou, D. Indirect Seismic Economic Loss Assessment and Recovery Evaluation Using Nighttime Light Images—Application for Wenchuan Earthquake. Nat. Hazards Earth Syst. Sci. 2018, 18, 3253–3266. [Google Scholar] [CrossRef]
  20. Jia, M.; Li, X.; Gong, Y.; Belabbes, S.; Dell’Oro, L. Estimating Natural Disaster Loss Using Improved Daily Night-Time Light Data. Int. J. Appl. Earth Obs. Geoinf. 2023, 120, 103359. [Google Scholar] [CrossRef]
  21. Li, F.; Wang, Q.; Hu, W.; Liu, J.; Zhang, X. Rapid Assessment of Disaster Damage and Economic Resilience in Relation to the Flooding in Zhengzhou, China in 2021. Remote Sens. Lett. 2022, 13, 651–662. [Google Scholar] [CrossRef]
  22. Gao, S.; Chen, Y.; Liang, L.; Gong, A. Post-Earthquake Night-Time Light Piecewise (PNLP) Pattern Based on NPP/VIIRS Night-Time Light Data: A Case Study of the 2015 Nepal Earthquake. Remote Sens. 2020, 12, 2009. [Google Scholar] [CrossRef]
  23. Liu, Z.; Zhang, J.; Li, X.; Chen, X. Long-Term Resilience Curve Analysis of Wenchuan Earthquake-Affected Counties Using DMSP-OLS Nighttime Light Images. IEEE J. Sel. Top. Appl. Earth Obs. Remote Sens. 2021, 14, 10854–10874. [Google Scholar] [CrossRef]
  24. Chen, X.; Li, X.; Liu, Z. Evaluation of Earthquake Disaster Recovery Patterns and Influencing Factors: A Case Study of the 2008 Wenchuan Earthquake. All Earth 2023, 35, 132–148. [Google Scholar]
  25. Hatay Province. Available online: https://en.wikipedia.org/wiki/Hatay_Province#Geography (accessed on 20 May 2024).
  26. 2023 Turkey–Syria Earthquakes. Available online: https://en.wikipedia.org/wiki/2023_Turkey%E2%80%93Syria_earthquakes#cite_note-TRToll9FEB-104 (accessed on 3 July 2024).
  27. Global Rapid Post-Disaster Damage Estimation (GRADE) Report. Available online: https://documents1.worldbank.org/curated/en/099022723021250141/pdf/P1788430aeb62f08009b2302bd4074030fb.pdf (accessed on 3 July 2024).
  28. Alahmadi, M.; Mansour, S.; Dasgupta, N.; Abulibdeh, A.; Atkinson, P.M.; Martin, D.J. Using Daily Nighttime Lights to Monitor Spatiotemporal Patterns of Human Lifestyle under COVID-19: The Case of Saudi Arabia. Remote Sens. 2021, 13, 4633. [Google Scholar] [CrossRef]
  29. Level-1 and Atmosphere Archive & Distribution System Distributed Active Archive Center. Available online: https://ladsweb.modaps.eosdis.nasa.gov/search/ (accessed on 3 July 2024).
  30. EarthExplorer. Available online: https://earthexplorer.usgs.gov/ (accessed on 3 January 2025).
  31. M7.8 2023 Turkey EQ Building Damage (Last Updated 9 March 2023). Available online: https://www.arcgis.com/home/item.html?id=86941dbff14e450bbe3f89897373c59a (accessed on 3 July 2024).
  32. Turkey Damage Assessment. Available online: https://ollielballinger.users.earthengine.app/view/turkey-earthquake (accessed on 15 March 2025).
  33. StEER-6 February 2023, Kahramanmaras, Turkey, Mw 7.8 Earthquake. Available online: https://www.designsafe-ci.org/data/browser/public/designsafe.storage.published/PRJ-3824 (accessed on 3 January 2025).
  34. Data Portal for Statistics. Available online: https://data.tuik.gov.tr/Search/Search?text=gdp%20by%20province&dil=2 (accessed on 3 January 2025).
  35. Download GADM Data (Version 4.1). Available online: https://gadm.org/download_country.html (accessed on 4 June 2024).
  36. Zheng, Z.; Wu, Z.; Chen, Y.; Guo, G.; Yang, Z.; Marinello, F. A Simple Method for Near-Real-Time Monthly Nighttime Light Image Production. IEEE Geosci. Remote Sens. Lett. 2022, 19, 8008405. [Google Scholar]
  37. Zhang, D.; Huang, H.; Roy, N.; Roozbahani, M.M.; Frost, J.D. Black Marble Nighttime Light Data for Disaster Damage Assessment. Remote Sens. 2023, 15, 4257. [Google Scholar] [CrossRef]
  38. Duerler, R.; Cao, C.; Xie, B.; Huang, Z.; Chen, Y.; Wang, K.; Xu, M.; Lu, Y. Cross Reference of GDP Decrease with Nighttime Light Data via Remote Sensing Diagnosis. Sustainability 2023, 15, 6900. [Google Scholar] [CrossRef]
  39. Liu, H.; Luo, N.; Hu, C. Detection of County Economic Development Using LJ1-01 Nighttime Light Imagery: A Comparison with NPP-VIIRS Data. Sensors 2020, 20, 6633. [Google Scholar] [CrossRef]
  40. Li, F.; Liu, J.; Zhang, M.; Liao, S.; Hu, W. Assessment of Economic Recovery in Hebei Province, China, Under the COVID-19 Pandemic Using Nighttime Light Data. Remote Sens. 2023, 15, 22. [Google Scholar] [CrossRef]
  41. Zheng, Y.; Shao, G.; Tang, L.; He, Y.; Wang, X.; Wang, Y.; Wang, H. Rapid Assessment of a Typhoon Disaster Based on NPP-VIIRS DNB Daily Data: The Case of an Urban Agglomeration Along Western Taiwan Straits, China. Remote Sens. 2019, 11, 1709. [Google Scholar] [CrossRef]
  42. Zheng, X.; Li, L. Trading Cloud Computing Stocks Using SMA. Information 2024, 15, 506. [Google Scholar] [CrossRef]
  43. Choi, S.; An, J. Multisensor Feature Selection for Maritime Target Estimation. Electronics 2024, 13, 4497. [Google Scholar] [CrossRef]
  44. Herianto, H.; Sofroniou, A.; Fitrah, M.; Rosana, D.; Setiawan, C.; Rosnawati, R.; Widihastuti, W.; Jusmiana, A.; Marinding, Y. Quantifying the Relationship Between Self-Efficacy and Mathematical Creativity: A Meta-Analysis. Educ. Sci. 2024, 14, 1251. [Google Scholar] [CrossRef]
  45. Li, F.; Liao, S.; Liu, W. Assessment of Post-Pandemic Economic Recovery in Beijing, China, Using Night-Time Light Data. Remote Sen. Lett. 2024, 15, 603–613. [Google Scholar] [CrossRef]
  46. Qiang, Y.; Huang, Q.; Xu, J. Observing Community Resilience from Space: Using Nighttime Lights to Model Economic Disturbance and Recovery Pattern in Natural Disaster. Sustain. Cities Soc. 2020, 57, 102115. [Google Scholar] [CrossRef]
  47. Turkey Earthquake: Why Reconstruction Could Miss Erdogan’s Goal. Available online: https://www.reuters.com/world/middle-east/turkey-earthquake-why-reconstruction-could-miss-erdogans-goal-2023-10-13 (accessed on 24 January 2025).
  48. Current Projects and Investments. Available online: https://hatayplanlamamerkezi.com/tr-TR/projects/proje-yatirim (accessed on 18 March 2025).
  49. 2 Years on, New City Emerges from Turkey’s Quake-Hit Ruins. Available online: https://www.dailysabah.com/turkiye/2-years-on-new-city-emerges-from-turkiyes-quake-hit-ruins/news (accessed on 18 March 2025).
  50. Hatay After Earthquakes: Changing Priorities and Problems. Available online: https://bianet.org/haber/hatay-after-earthquakes-changing-priorities-and-problems-304510 (accessed on 18 March 2025).
  51. Monitoring Report on the First Year in Hatay Province. Available online: https://drive.google.com/file/d/1ddD-KfLqaTmSjZrokHou7Nf_l_xUKKU-/view?usp=sharing (accessed on 18 March 2025).
  52. Turkey’s Iskenderun Port to Restart in Three Months. Available online: https://mykn.kuehne-nagel.com/news/article/trkiyes-iskenderun-port-to-restart-in-three-m-21-Feb-2023 (accessed on 19 March 2025).
  53. Post-Earthquake Small Business Recovery in Hatay, Turkey. Available online: https://www.livelihoodscentre.org/-/post-earthquake-small-business-recovery-in-hatay-turkey#:~:text=The%20economic%20cost%20of%20the%20earthquake%20was,effects%20on%20the%20labor%20market%20and%20businesses.&text=This%20learning%20brief%20focuses%20on%20lessons%20of,includes%20recommendations%20for%20scaling%20in%20this%20context (accessed on 19 March 2025).
  54. CORE Worked with Our Local Partners to Provide Emergency Relief and Recovery to Communities Impacted by Devastating Earthquakes that Struck Southern Turkey. Available online: https://www.coreresponse.org/turkey-syria-earthquake/#:~:text=In%20the%20Hassa%20district%20of,affecting%20more%20than%20350%20people (accessed on 19 March 2025).
  55. 2023 Kahramanmaraş, Turkey Earthquake Sequence: Observations of Recovery 20 Months After. Available online: https://learningfromearthquakes.org/resources/eeri-sseer-resilience-reconnaissance-team-report-2023-kahramanmaras-turkiye-earthquake-sequence/ (accessed on 19 March 2025).
  56. Turkey Earthquakes Operation Update #7—Emergency Appeal No. MDRTR004. Available online: https://reliefweb.int/report/turkiye/turkiye-earthquakes-operation-update-7-emergency-appeal-no-mdrtr004-06122024 (accessed on 19 March 2025).
  57. 2 Years on, Quake-Hit Turkish Provinces Regain Economic Pace. Available online: https://www.dailysabah.com/business/economy/2-years-on-quake-hit-turkish-provinces-regain-economic-pace (accessed on 19 March 2025).
  58. Tziokas, N.; Zhang, C.; Drolias, G.C.; Atkinson, P.M. Downscaling Satellite Night-Time Lights Imagery to Support Within-City Applications Using a Spatially Non-Stationary Model. Int. J. Appl. Earth Obs. Geoinf. 2023, 122, 103395. [Google Scholar] [CrossRef]
Figure 1. Elevation map of Hatay Province featuring major cities highlighted in cyan, with the centre of each city marked by a black dot. Inset: location map of Hatay Province in Turkey.
Ijgi 14 00149 g001
Figure 2. A potential framework for economic recovery following a seismic event.
Ijgi 14 00149 g002
Figure 3. Maps of the level of damage and damaged areas after the earthquake using NPP-VIIRS NTLs.
Ijgi 14 00149 g003
Figure 4. Post-earthquake economic recovery framework in Hatay Province.
Ijgi 14 00149 g004
Figure 5. Post-earthquake economic recovery framework in (a) Altinozu, (b) Belen, (c) Dortyol, (d) Erzin, (e) Hassa, (f) Iskenderun, (g) Kirikhan, (h) Kumlu, (i) Antakya, (j) Reyhanli, (k) Samandag, and (l) Yayladagi.
Ijgi 14 00149 g005aIjgi 14 00149 g005b
Figure 6. Linear correlations between the SRNPPNTLs and (a) the area of slightly damaged buildings, (b) the area of moderately damaged buildings, (c) the area of severely damaged buildings, and (d) the total number of damaged buildings.
Ijgi 14 00149 g006
Figure 7. Twelve quadratic polynomial models developed using provincial GDP and annual provincial NTL data across Turkey for the years (a) 2012, (b) 2013, (c) 2014, (d) 2015, (e) 2016, (f) 2017, (g) 2018, (h) 2019, (i) 2020, (j) 2021, (k) 2022, and (l) 2023.
Ijgi 14 00149 g007
Figure 8. Time series data for ALI, SMA-smoothed values, STC, and SAF in Altinozu District, covering the period from April 2020 to November 2024.
Ijgi 14 00149 g008
Table 1. Introduction of the data sources.
Data TypeData DescriptionTime RangeSourcePurpose
NPP-VIIRS
VNP46A1 DNB NTLs
Post-earthquake daily NTLs under less cloudy conditions12 February 2023LAADS DAACAssessment of potential damage from the earthquake disaster
NPP-VIIRS
VNP46A3 monthly NTLs
Pre-earthquake monthly NTLsJanuary 2023LAADS DAACAssessment of potential damage from the earthquake disaster
Time series monthly NTLsApril 2020–November 2024LAADS DAACAssessment of the post-earthquake economic recovery
Landsat 8 OLI imagePost-earthquake multispectral image16 July 2023EarthExplorerExtraction of vegetation extent
Earthquake damage reference dataReference map of building damageLast updated on 9 May 2023EOSValidation of NTL-identified building damage
Reference map of earthquake-damaged buildingsFebruary 2023Earth Engine AppsValidation of NTL-identified building damage
Field photographs of structural damage3 April 2023EERIValidation of NTL-identified building damage
Provincial GDP statisticsProvincial GDP statistics in Turkey2012–2023TURKSTATAnalysis of the regression relationship between NTLs and economic activity in Turkey
Administrative divisionsAdministrative boundaries for 12 districts in Hatay Province, Turkey2022GADMAssessment of the post-earthquake economic recovery across the districts
Table 2. Accuracy assessment of building damage identified through NTLs using two reference sources.
Reference SourceCategoryCEOEOAKC
EOSDamage26.66%18.43%77.28%0.55
No damage18.35%26.56%
Earth Engine AppsDamage29.30%25.88%71.55%0.43
No damage27.49%31.04%
Table 3. Statistical test of the regression models before and after the earthquake.
DistrictPre-EarthquakeDistrictPost-Earthquake
R2FpR2Fp
Hatay0.94522.860.00Hatay0.85117.340.00
Altinozu0.93455.050.00Altinozu0.95114.410.00
Belen0.91341.400.00Belen0.8636.560.00
Dortyol0.92375.680.00Dortyol0.7618.730.00
Erzin0.7491.190.00Erzin0.7013.720.00
Hassa0.981633.230.00Hassa0.96128.720.00
Iskenderun0.97957.900.00Iskenderun0.8126.170.00
Kirikhan0.981923.830.00Kirikhan0.9160.620.00
Kumlu0.89271.010.00Kumlu0.9160.380.00
Antakya0.87209.030.00Antakya0.94318.920.00
Reyhanli0.95559.580.00Reyhanli0.9494.060.00
Samandag0.97930.720.00Samandag0.5511.500.00
Yayladagi0.95631.810.00Yayladagi0.9489.170.00
Disclaimer/Publisher’s Note: The statements, opinions and data contained in all publications are solely those of the individual author(s) and contributor(s) and not of MDPI and/or the editor(s). MDPI and/or the editor(s) disclaim responsibility for any injury to people or property resulting from any ideas, methods, instructions or products referred to in the content.

