Article

Research on the Evaluation and Optimization of Street Quality in Cultural Attractions Based on Spatial Data

1
School of Arts and Culture, Chugye University for the Arts, Seoul 03762, Republic of Korea
2
School of Journalism and Communication, Tsinghua University, Beijing 100084, China
*
Author to whom correspondence should be addressed.
ISPRS Int. J. Geo-Inf. 2025, 14(3), 130; https://doi.org/10.3390/ijgi14030130
Submission received: 11 January 2025 / Revised: 5 March 2025 / Accepted: 18 March 2025 / Published: 19 March 2025

Abstract

:
Historic and cultural scenic spots are concentrated spaces that hold historic and cultural value for a city, and their streets form the foundation of their scenery. Therefore, the street quality of historic and cultural scenic spots plays an important role in promoting the cultural and economic development of a city. We evaluate the development potential of road quality in historic and cultural scenic spots by using spatial data and the analytic hierarchy process (AHP) method. First, three-dimensional evaluation indices are constructed based on the functions of streets, including the perception of the natural environment, the perception of human emotions, and the accessibility of spatial facilities. Then, the weights of the indicators are calculated using the AHP method, and the evaluation scores of historical and cultural scenic spots are calculated based on spatial data. Finally, a ranking of historical and cultural scenic spots is obtained by combining the weights of the indicators and the performance of the scenic spots to determine the high-quality potential historical and cultural scenic spots of a road. The method proposed in this study is applied to Yanta District, Xi’an City, China, and high-potential scenic spots are analyzed in depth based on the ranking results to provide suggestions for the construction of historical and cultural scenic spots. By comprehensively applying spatial data and AHP methods, we can effectively identify cultural scenic spots with high street quality potential and provide targeted suggestions for the construction and development of cultural scenic spots.

1. Introduction

In recent years, with the recovery from the COVID-19 pandemic and the development of the consumer economy, the tourism industry has gradually recovered globally and has emerged as a new trend [1]. In China, for example, from 2016 to 2023, domestic tourist arrivals and economic expenditure for tourism showed a favorable trend—first increasing, then decreasing, and then gradually recovering. With the post-pandemic recovery, China’s tourism industry is expected to demonstrate a positive and favorable trend once again. In 2023, domestic trips totaled 4.891 billion, an increase of 2.361 billion compared to the previous year, representing a year-on-year growth of 93.3%. Among the many forms of tourism, cultural attractions are popular with consumers. Data released by the Ministry of Culture and Tourism showed that historical and cultural tourism in China grew significantly during the 2024 holiday period, with passenger traffic at popular historical and cultural scenic spots increasing by more than 50 percent year on year [2].
The main reasons why historical and cultural scenic spots are popular among tourists are as follows [3]. First, historical and cultural scenic spots contain cultural resources and unique attractions precipitated in different periods, which can provide a concentrated space for tourists to perceive the history and culture of a city [4]. Second, the cultural districts of scenic spots have diversified businesses that cover all elements of tourism and are a concentrated place to display and experience the traditional way of life of a city, which is very suitable for tourists to experience local life. Finally, the streets of cultural scenic spots have the geographical advantage of convenient access, convenient traffic, and strong accessibility, and they have historically been prosperous places where urban people gather for culture, tourism, and trade. Many scholars have conducted research on historical and cultural scenic spots from different perspectives, including Lin et al. [5], who combined machine learning models and hotspot analysis methods to analyze the spatial suitability of landscapes in Quanzhou City and their impact on natural historical sites and proposed optimization strategies. Xu et al. [6] proposed a new evaluation system and optimization strategies for the spatial quality of historic urban areas, taking the ancient city of Suzhou as an example. Li et al. [7] proposed a new evaluation system and optimization strategies for the spatial quality of historical urban areas, taking the ancient city of Suzhou as an example, combining big data and machine learning to perform multidimensional evaluation. Therefore, this is of great significance for research on quality improvement and the sustainable development of historic and cultural scenic spots.
However, existing studies indicate that the development of some historic and cultural scenic spots still suffers from the problems of homogenization, excessive commercialization, and the hollowing out of residents [8]. With the acceleration of urbanization and the pace of industrial transformation and upgrading, the protection and development of historical and cultural scenic spots have been seriously affected. This has led to an uneven quality of roads where cultural scenic spots are located, whether in terms of the perception of the natural environment or spatial accessibility; there are many differences, resulting in a poor experience for tourists [9]. Therefore, it is important for the sustainable development and management of historical and cultural attractions to explore and identify successful experiences that can be learned from the spatial construction and design processes of such attractions in other cities and regions.
In delving into the evaluation and optimization strategies of the quality of streets in cultural scenic spots, this paper incorporates the theory of urban intention proposed by Kevin Lynch. The theory emphasizes the key role of urban physical form and spatial structure in shaping urban imagery. According to Lynch, specific elements in the city interact with people’s daily experience and cultural background to construct unique urban imagery, which not only shape people’s cognitive and emotional experience of the city but also profoundly affect the functional layout and social structure of the city. In view of this, this paper introduces the theory when exploring the quality of streets in cultural scenic spots.
This study aims to explore the development potential of street quality in cultural attractions through the combination of spatial data and hierarchical analysis (AHP). Specifically, we ask the following two research questions (RQs):
RQ1: How to construct a comprehensive and effective evaluation index system to assess the street quality of cultural scenic spots?
RQ2: Based on the constructed evaluation index system, which cultural scenic spots have high development potential of street quality?
The structure of this article is as follows: Section 2 introduces the evaluation framework for the streetscape quality of historical and cultural scenic spots. Section 3 describes a ranking study conducted using Yanta District in Xi’an, China, as an example. The fourth section provides further analysis of high- and low-potential scenic spots. The last section summarizes the whole study.

2. Literature Review
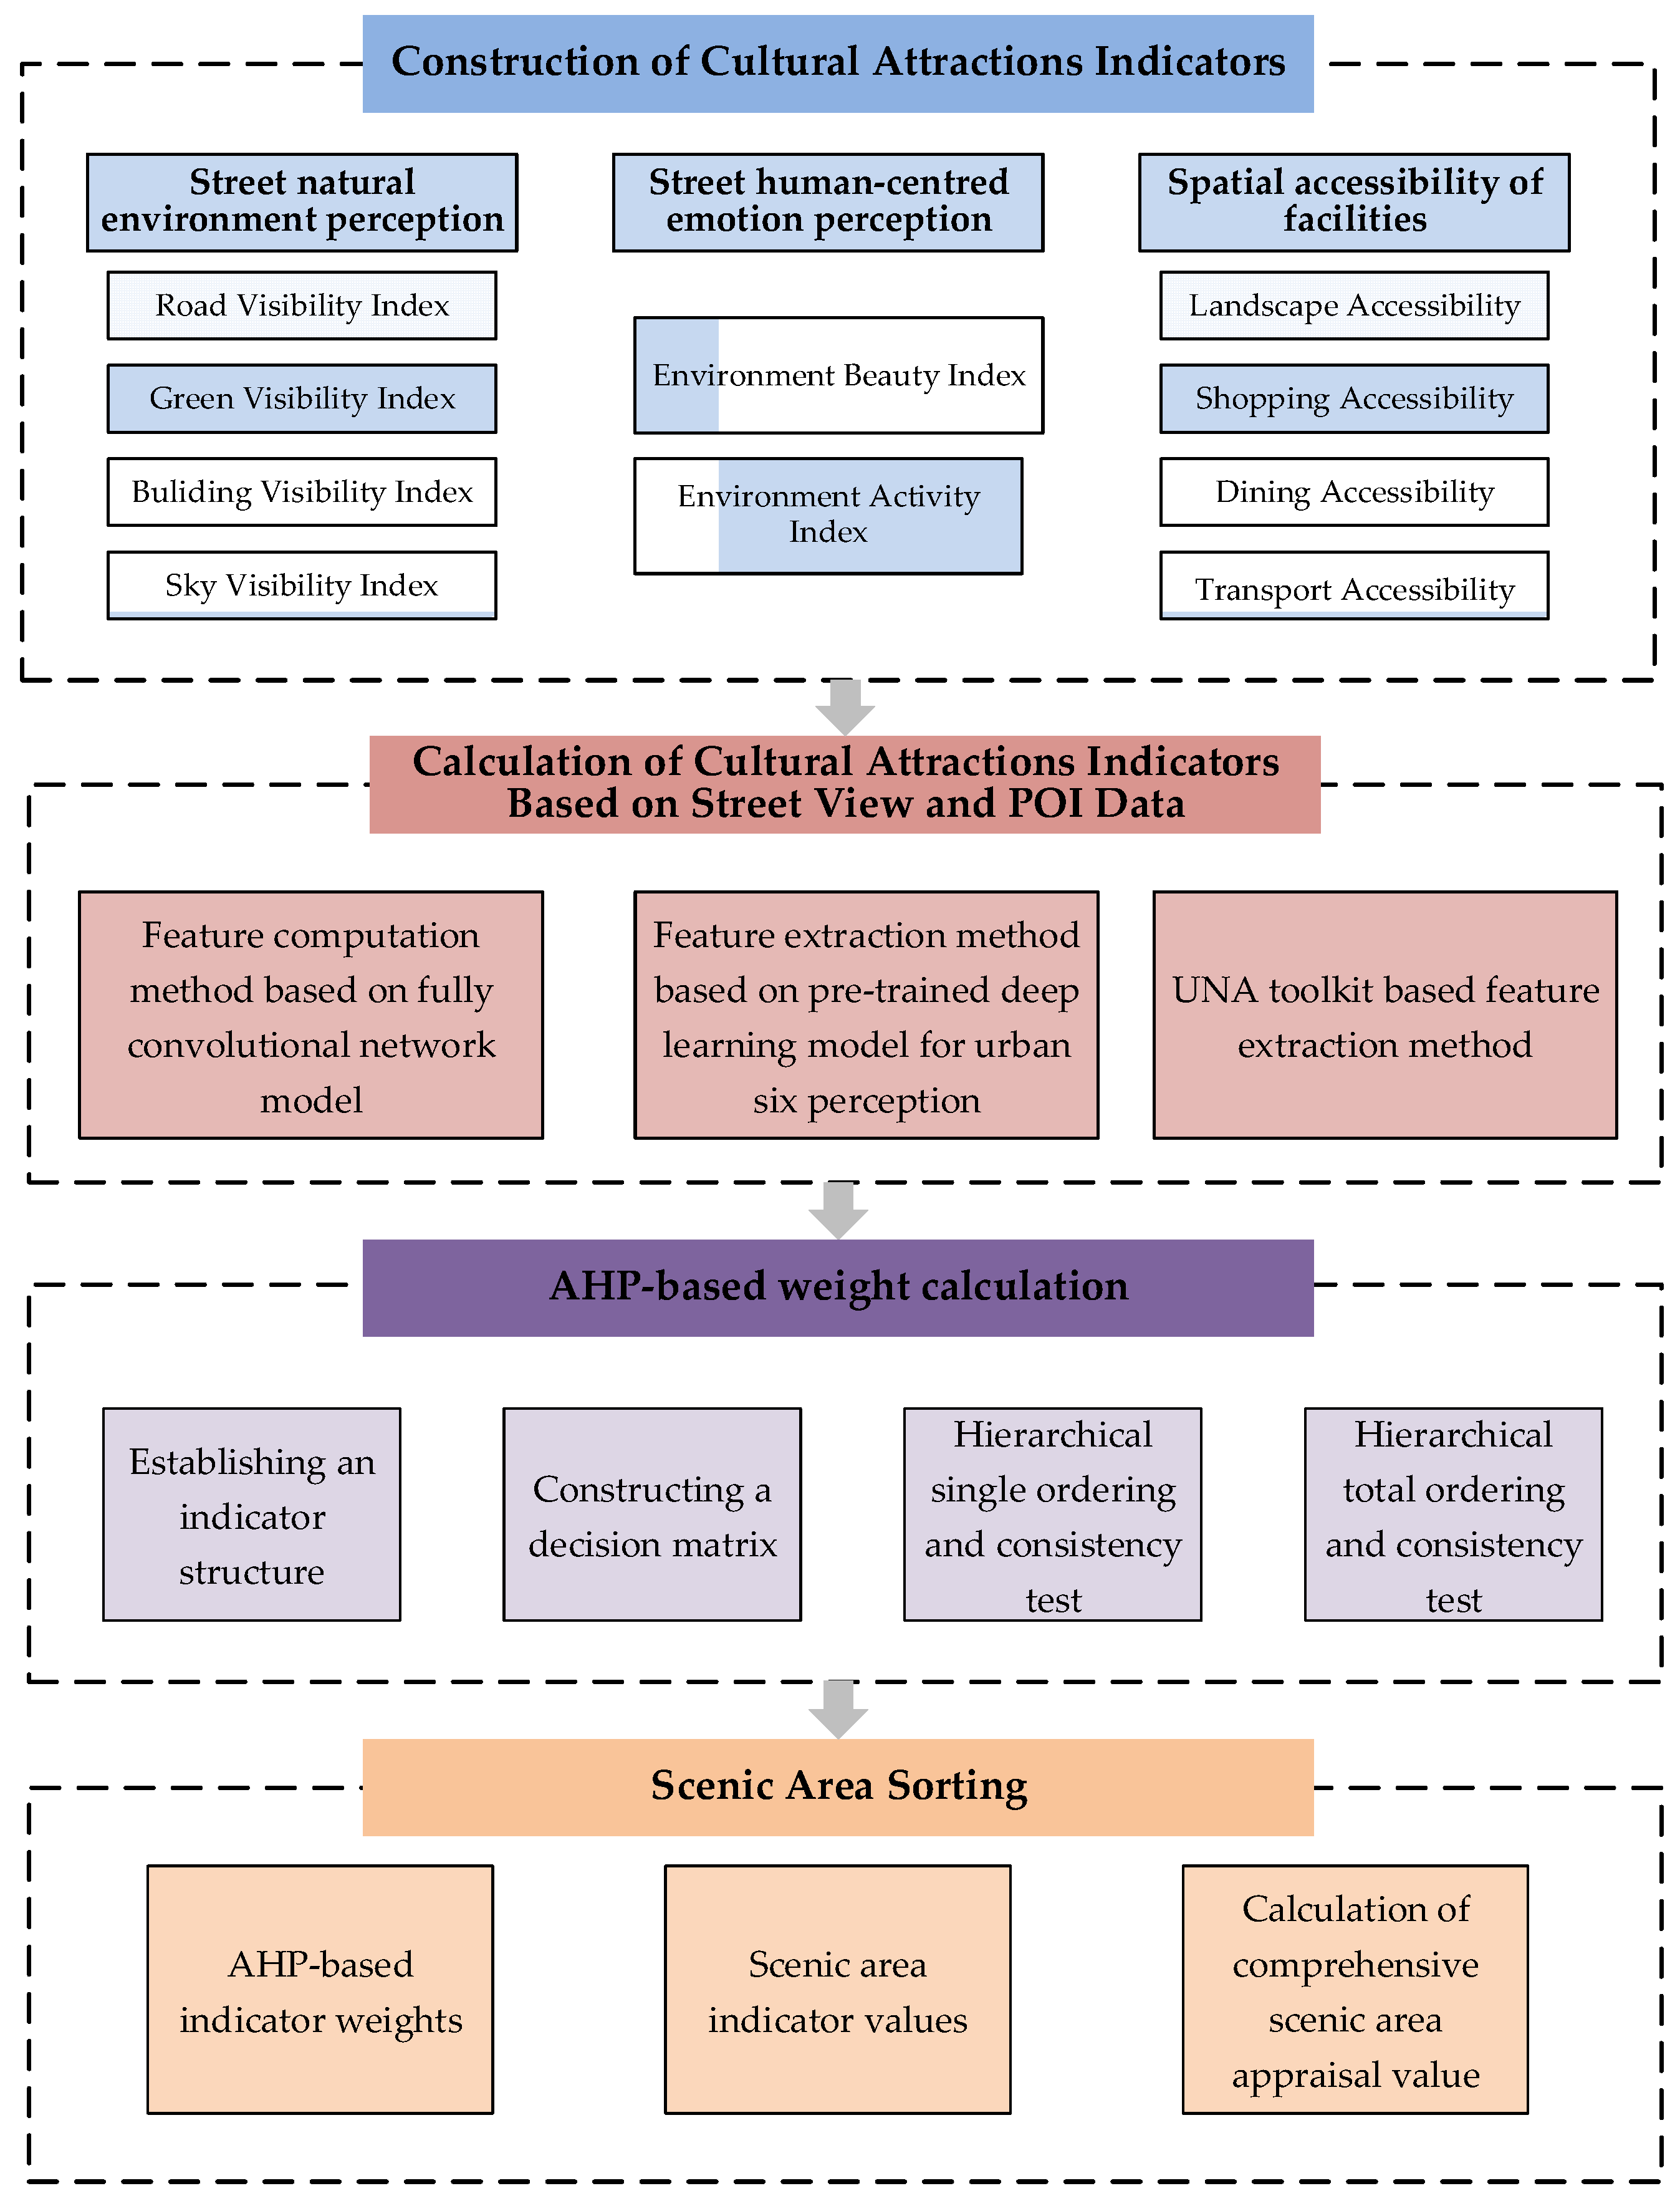
Existing scholars have conducted various types of studies to address the above issues. Zhang et al. [10] constructed a cultural heritage evaluation system; established an evaluation system through the analytic hierarchy process (AHP), the Delphi method, and fuzzy mathematics; and planned cultural and tourism routes in combination with a questionnaire survey. Hao et al. [11] assessed tourists’ perception of spatial elements of three historic districts in Beijing through questionnaires and semantic analysis, used factor analysis and IPA methods to explore the influence of spatial elements on tourists’ perception of the overall environment, and made suggestions for optimization. By combining the AHP and FCEM methods and testing them in the Changbaishan Biosphere Reserve, this method was found to be more reliable and comprehensive than existing methods, and a theoretical contribution to the development of tools specific to nature tourism destinations was made [12]. Bire et al. [13] used the fuzzy hierarchical analysis process method to create a decision support system for tourist attraction selection (in the case of Gubang City); the system recommends tourist attractions after the user inputs the priority levels of nine demand attributes. Jinghuan and Zhen [1] proposed a functional design optimization method for scenic public products based on hierarchical analysis to deeply analyze tourists’ needs and preferences. However, most of the existing studies are based on questionnaire surveys or interviews, the results are highly influenced by the subjective awareness of the interviewees, and the proposed recommendations are not highly operable.
The construction and development of cultural attractions can be supported by spatial planning and design [14]. Through careful planning and design, streets in cultural attractions can create distinctive spatial atmospheres and experiences that attract the attention of tourists and social media [8,15]. In Gil et al. [16], POI data was collected in three urban centers in Seoul using major Korean portals containing search engines to explore the relationship between POIs and urban elements. Liu and Neisch [17] measure the impact of street renewal design on visitor experience through visual preference surveys, deep learning techniques, and eye tracking.
To this end, we innovatively propose a framework for evaluating the street quality of historical and cultural scenic spots based on streetscape and POI data and conducted an evaluation and ranking study of 21 historical and cultural scenic spots in Yanta District, Xi’an City, China.

3. Methodology

In the evaluation of the road quality of historical and cultural scenic spots based on streetscape and POI data, we first construct the evaluation indices of cultural scenic spots then calculate the values of the indices using streetscape and POI data, calculate the weights of the indices with the AHP method, and finally conduct a ranking study by taking 21 historical and cultural scenic spots in Yanta District, Xi’an City, China, as an example. The process is shown in Figure 1.
To measure the quality of streets in historical and cultural scenic spots, this study constructs a set of multidimensional and comprehensive indicator systems and determines them from three dimensions, as shown in Figure 2. On scenic streets, there are three important street space functions: instrumental, expressive, and convenience [18]. The instrumental dimension ensures the smooth passage of vehicles and tourists, the expressive dimension reflects tourists’ perception of the scenic space, and the convenience dimension serves to meet tourists’ daily needs in the scenic area, such as shopping and eating. [19].
To comprehensively capture and quantify these functional characteristics, they are further refined into three main dimensions: extrinsic representation, subjective perception, and spatial accessibility. The extrinsic representations, such as the Road Visibility Index, Green Visibility Index, Building Visibility Index, and Sky Visibility Index [20,21], demonstrate the visual attractiveness and spatial quality of the scenic area. Subjective perception includes an index of Environment Beauty Index and Environment Activity Index, capturing tourists’ subjective evaluation of the aesthetic feeling of the scenic spot and the community atmosphere [22]. Spatial accessibility covers a comprehensive range from Landscape to various service facilities, ensuring that tourists can easily reach every corner of the scenic area [23,24].

3.1. Weighting

The AHP is used to assign weights to the evaluation indicators selected for this study from a subjective point of view, and the specific process consists of the following five steps: (1) establishing a hierarchical structure system model; (2) establishing the structure of the evaluation matrix; (3) conducting a single-level ranking and consistency test; (4) conducting an overall hierarchical ranking and consistency test; (5) statistically counting the results of the final weights [25,26,27].
(1)
Establishment of a hierarchical structure system model: The hierarchical structure used in this study includes 3 target layers and 10 index-layer elements, as shown in Table 1.
(2)
Constructing a rating matrix
If a given level consists of n elements, the weight of each element can be determined by comparing it two by two to determine the relative importance of its elements that are dissimilar to the previous level, as shown in Table 2.
The Saaty scale is usually used to represent the importance scale. Following the Saaty scale, a judgment matrix is constructed by comparing the importance of each layer of indicators separately and assigning the corresponding values.
(3)
Hierarchical single ordering and consistency test
The hierarchical single ranking is calculated by using the eigenvectors and eigen roots of the judgment matrix to calculate the relative weights of the factors in each hierarchy, which is calculated using Equation (1).
A W = λ m a x W
Here, A m a x   is the largest eigenvalue of the judgment matrix A , and W denotes the eigenvector of λ m a x .
After normalization, the values obtained represent the order of importance of a factor in the same hierarchy with respect to the previous hierarchy, i.e., the relative weights of the factors. This process is known as hierarchical single ranking. Currently, commonly used methods include the sum and product (i.e., arithmetic mean) method for calculating the maximum eigenvalue and eigenvector of the rating matrix, as well as the square root and power methods.
Taking the sum-product method as an example, the specific steps of hierarchical simple sorting are as follows.
In the first step, the judgment matrices at the same level are first calculated by normalizing them one by one, as shown in (2).
a i j ¯ = a i j k = 1 j a k j i , j = 1,2 , . . . , n
In the second step, the sum of the normalized values on each row is calculated to obtain the eigenvector W i ¯ , as shown in (3).
W i ¯ = j = 1 n a i j ¯ i = 1,2 , . . . , n
The summed vectors are normalized to obtain the normalization, as shown in (4).
W i = W i ¯ j = 1 n W ¯
In the fourth step, the maximum eigenvalue of the judgment matrix is calculated to determine its maximum value, as shown in (5).
λ m a x = i = 1 n A W i n W i
After obtaining the maximum eigenvalue λ m a x and the eigenvector W , a consistency test is also required. The formula for the consistency index C I is given by (6).
C I = ( λ m a x n ) ( n 1 )  
If C I tends to zero, the consistency of the judgment matrix will be affected, and an increase in the value of C I will lead to a decrease in consistency. After determining the relative weights of the elements, the stochastic consistency ratio ( C R ) should also be considered, and this is calculated using (7).
C R = C I / R I
Table 3 shows the value of the average stochastic consistency index R I .
If the random consistency ratio ( C R ) is less than 0.10, the hierarchical single sorting passes the consistency test. If C R is greater than or equal to 0.10, this means that it does not pass the consistency test, and the judgment matrix must be reconstructed until it passes the test.
(4)
Hierarchical Total Ranking and Consistency Test
Hierarchical total ranking refers to the importance ranking weight value of a hierarchical factor relative to the total objective in the whole hierarchical structural model. Taking the structural model as an example, if criterion level B contains b 1 , b 2 , …, b n for a total of n factors, their hierarchical order of the overall objective A is b 1 , b 2 , …, b n . Indicator level C contains c 1 , c 2 , … and c m for a total of m factors, and the hierarchical individual order relative to B i is c 1 j , c 2 j , … and c m j ( j = 1, 2, …, and m ). The formula for the total hierarchical order is given in (8).
C i = j = 1 m c i j b j
In addition, a consistency test must be performed on the hierarchical total ranking to ensure its accuracy. In this study, several existing methods are described in detail, and improvements are proposed. The consistency index C I is calculated, as shown in (9).
C I = j = 1 m b j C I j
Here, C I j is a consistency test metric relative to the metric layer C of b j .
The stochastic consistency ratio ( C R ) is calculated in the same way as (10), while the average stochastic consistency indicator R I for the whole hierarchical order is calculated as follows.
R I = j = 1 m b j R I j
C I j is a stochastic consistency indicator relative to the indicator layer C of b j .
In hierarchical total ordering, the method of judging C R is the same as in hierarchical single ordering. If the stochastic consistency ratio ( C R ) is less than 0.10, the hierarchical total ordering passes the consistency test. If C R is greater than or equal to 0.10, the consistency test fails, and the judgment matrix must be reconstructed [28].

3.2. Numerical Calculation of Indicators

3.2.1. Street Natural Environment Perception

We use a fully convolutional network and open-source dataset to identify various elements in the street space of historical and cultural scenic spots in Xi’an by using semantic segmentation at the pixel level. This is achieved by quantifying the proportion of the area of sky, plants, buildings, and street elements in an image to obtain the four types of indicator eigenvalues, namely, the Road Visibility Index, Green Visibility Index, Building Visibility Index, and Sky Visibility Index [29].
(1)
Road Visibility Index
Road Visibility Index is related to the percentage of road area in an open space. Usually, an increase in road area leads to an increase in road space efficiency, and if the road space efficiency is too low, it will cause negative effects such as congestion and inconvenience in the road space [30,31]. We use a fully convolutional network to extract the road occupancy ratio in a streetscape image to measure the road spatial efficiency, and the calculation of the road spatial efficiency is shown in (11).
S O S V I r o a d = C o u n t r o a d C o u n t S V I
Here, C o u n t r o a d is the number of road area pixels in the streetscape image, and C o u n t s v i is the total number of pixels in the streetscape image.
(2)
Green Visibility Index
The Green Visibility Index indicator focuses on the quantitative description of green vegetation in 3D space from the perspective of crowd perception. To automate and batch the calculation of the green visual coverage of streets, the color components of street images are deeply analyzed using the fully convolutional network method to integrate the point-based green visual coverage at the street level to achieve a more comprehensive effect [16,20,32]. The green visual coverage is calculated according to Equation (12).
S O S V I g r e e n = C o u n t g r e e n C o u n t S V I
Here, C o u n t g r e e n is the number of vegetation pixels in the streetscape image, and C o u n t s v i is the total number of pixels in the streetscape image.
(3)
Building Visibility Index
The Building Visibility Index focuses on the quantitative description of buildings in 3D space from the perspective of crowd perception. In order to automate and batch the calculation of the street building clustering degree, we use the fully convolutional network method to deeply analyze the color components of street images and integrate the point-based building clustering degree at the street level to achieve a more comprehensive effect [33]. The building clustering degree is calculated using Equation (13).
S O S V I b u l i d i n g = C o u n t b u i l d i n g C o u n t S V I
Here, C o u n t b u i l d i n g is the number of building pixels in the streetscape image, and C o u n t s v i is the total number of pixels in the streetscape image.
(4)
Sky Visibility Index
Sky Visibility Index is related to the degree of enclosure of architectural interfaces in outdoor spaces. Usually, an increase in building enclosure leads to a decrease in visual openness, and when the visual openness is too low, negative emotions such as oppression and urgency are generated in the street space [34,35]. We use the fully convolutional network method to extract the percentage of buildings in the streetscape image to measure the enclosure of building entities, and the visual openness is calculated using (14).
S O S V I s k y = C o u n t s k y C o u n t S V I
Here, C o u n t s k y  is the number of building pixels in the streetscape image, and C o u n t s v i is the total number of pixels in the streetscape image.

3.2.2. Street Human-Centered Emotion Perception

A pre-trained deep learning model for urban perception is an advanced model based on a human–computer adversarial model for pre-training, and it extracts the values of six urban perceptual features by parsing street view images [36,37].
(1)
Environment Beauty Index
The pre-trained deep learning model for urban perception uses the Shapley Additive explanation’s (SHAP) method to evaluate the contributions of different urban features to psychological perception [5], and it assigns corresponding SHAP values to these features.
g z = ϕ 0 + i = 1 M ϕ i z i
Here, z i 0,1 indicates whether the i th feature is involved in the model prediction. M is the number of environmental aesthetic index features in the perceptual model. ϕ i  is the degree of influence produced by the i th feature.
In this study, based on the analysis and comparison of these indices, we give an evaluation criterion for the street image classification system based on fuzzy logic theory. The following is a detailed description of the formula for calculating the SHAP value in the environmental aesthetic index.
ϕ i = S F { i } S ! F S 1 ! F ! [ f S i x S i f S x S ]
Here, ϕ i is the SHAP value reflecting the characteristics of the ith feature; S is the individual feature involved in the prediction; F is the set containing all of the features; and   f is the perceptual pattern of the environmental aesthetic index.
(2)
Environment Activity Index
The pre-trained deep learning model for urban perception uses the SHAP method to assess the contributions of different urban features to psychological perception [8] and assigns corresponding SHAP values to these features.
g z = ϕ 0 + i = 1 M ϕ i z i
Here, z i 0,1 indicates whether the ith characteristic of the feature is involved in the model prediction; M is the number of community vitality index features in the perceptual model; and ϕ i  is the degree of influence produced by the i th feature.
Based on the analysis and comparison of these indicators, we provide an evaluation criterion for the street image classification system based on fuzzy logic theory. The following is a detailed description of the formula for calculating the SHAP value in the community vitality index:
ϕ i = S F { i } S ! F S 1 ! F ! [ f S i x S i f S x S ]
where ϕ i is the SHAP value reflecting the characteristics of the ith feature; S is the single feature involved in the prediction; F is the set of all features; and f is the community vitality index perception model.

3.2.3. Spatial Accessibility of Facilities

The accessibility analysis uses Point of Interest (POI) data crawled from Gaode map to assess the accessibility of these POI points to within 400 m of the surrounding roads using the Urban Network Analysis (UNA 2012) tool in Spatial Syntax Software (v1.02). The UNA toolkit proposes a set of methods for modeling and simulating transport networks in complex environments and validates the models with real cases [38,39]. In this study, the toolkit is used to quantify the accessibility indicators of shopping services, landscapes and scenic attractions [40], transport and amenities, and catering services. We use the toolkit to quantify the indicators of Landscape Accessibility, Shopping Accessibility [40], Dining Accessibility, and Transport Accessibility, with the following relevant calculations.
(1)
Dining Accessibility
The reach function describes the number of destinations or corresponding weights that can be reached from the starting point within a given shortest-path distance, which is calculated using (19):
R e a c h [ i 1 ] r = j G i 1 , d i 1 , j 1 r W [ j 1 ]
where I 1 is the center of each road; J 1 is the catering facility; d   i 1 , j 1 is the shortest distance between the starting point i 1 and the destination j 1 in the study area; and W j 1 is the weight of the end j .
(2)
Shopping Accessibility
The reach function describes the number of destinations or the corresponding weights that can be reached from the starting point within the given shortest-path distance, which is calculated using (20):
R e a c h [ i 2 ] r = j G i 2 , d i 2 , j 2 r W [ j 2 ]
where I 2 is the center of each road; J 2 is the shopping service facility; d   i 2 , j 2 is the shortest-path distance between origin i 2 and destination j 2 in the study area;   W j 2 is the weight of the end j .
(3)
Transport Accessibility
The reach function describes the number of destinations or the corresponding weights that can be reached from the origin within a given shortest-path distance [41], which is calculated using (21):
R e a c h [ i 3 ] r = j G i 3 , d i 3 , j 3 r W [ j 3 ]
where I 3 is the center of each road; J 3 is the public transport facility; d   i 3 , j 3 is the shortest-path distance between origin i 3 and destination j 3 in the study area; and W j 3 is the weight of the end j .
(4)
Landscape Accessibility
The reach function describes the number of destinations that can be reached from a starting point within a given shortest-path distance or the corresponding weight, and it is calculated using (22):
R e a c h [ i 4 ] r = j G i 4 , d i 4 , j 4 r W [ j 4 ]
where I 4 is the center of each road; J 4 is the scenic attraction; d   i 4 , j 4 is the shortest distance between the starting point i 4 and the destination j 4 in the study area; and W j 4 is the weight of the end j .

3.3. Sorting of Scenic Areas

In constructing a comprehensive evaluation system for scenic spots, the AHP method is effectively used to determine the weights of each indicator [42]. The weights solved using the AHP are W i j i = 1 , , m ; j = 1 , , n , where i is the corresponding first-level indicator number, m is the number of first-level indicators, j is the number of second-level indicators under the first-level indicators, and n is the number of second-level indicators [43].
We solve for the indicator value of each object, which reflects the performance of the scenic spot under different indicators. The value is K i j c i = 1 , , m ; j = 1 , , n ; c = 1 , , p , where i is the corresponding first-level indicator number, m is the number of first-level indicators, j is the number of second-level indicators under the first-level indicators, n is the number of second-level indicators, and c is the number of the evaluation object.
The comprehensive evaluation value of the scenic spot is calculated as follows.
T c = i = 1 m j = 1 n W i j × K i j c
Here, W i j is the weight of the AHP solution, and K ij c is the indicator value of the evaluation object.
The formula calculates the sum of the scores of all second-level indicators weighted under each first-level indicator, and then these sums are aggregated according to the weights of the first-level indicators [25,42], which results in an evaluation value that can comprehensively reflect the comprehensive quality of scenic roads.

4. Case Study

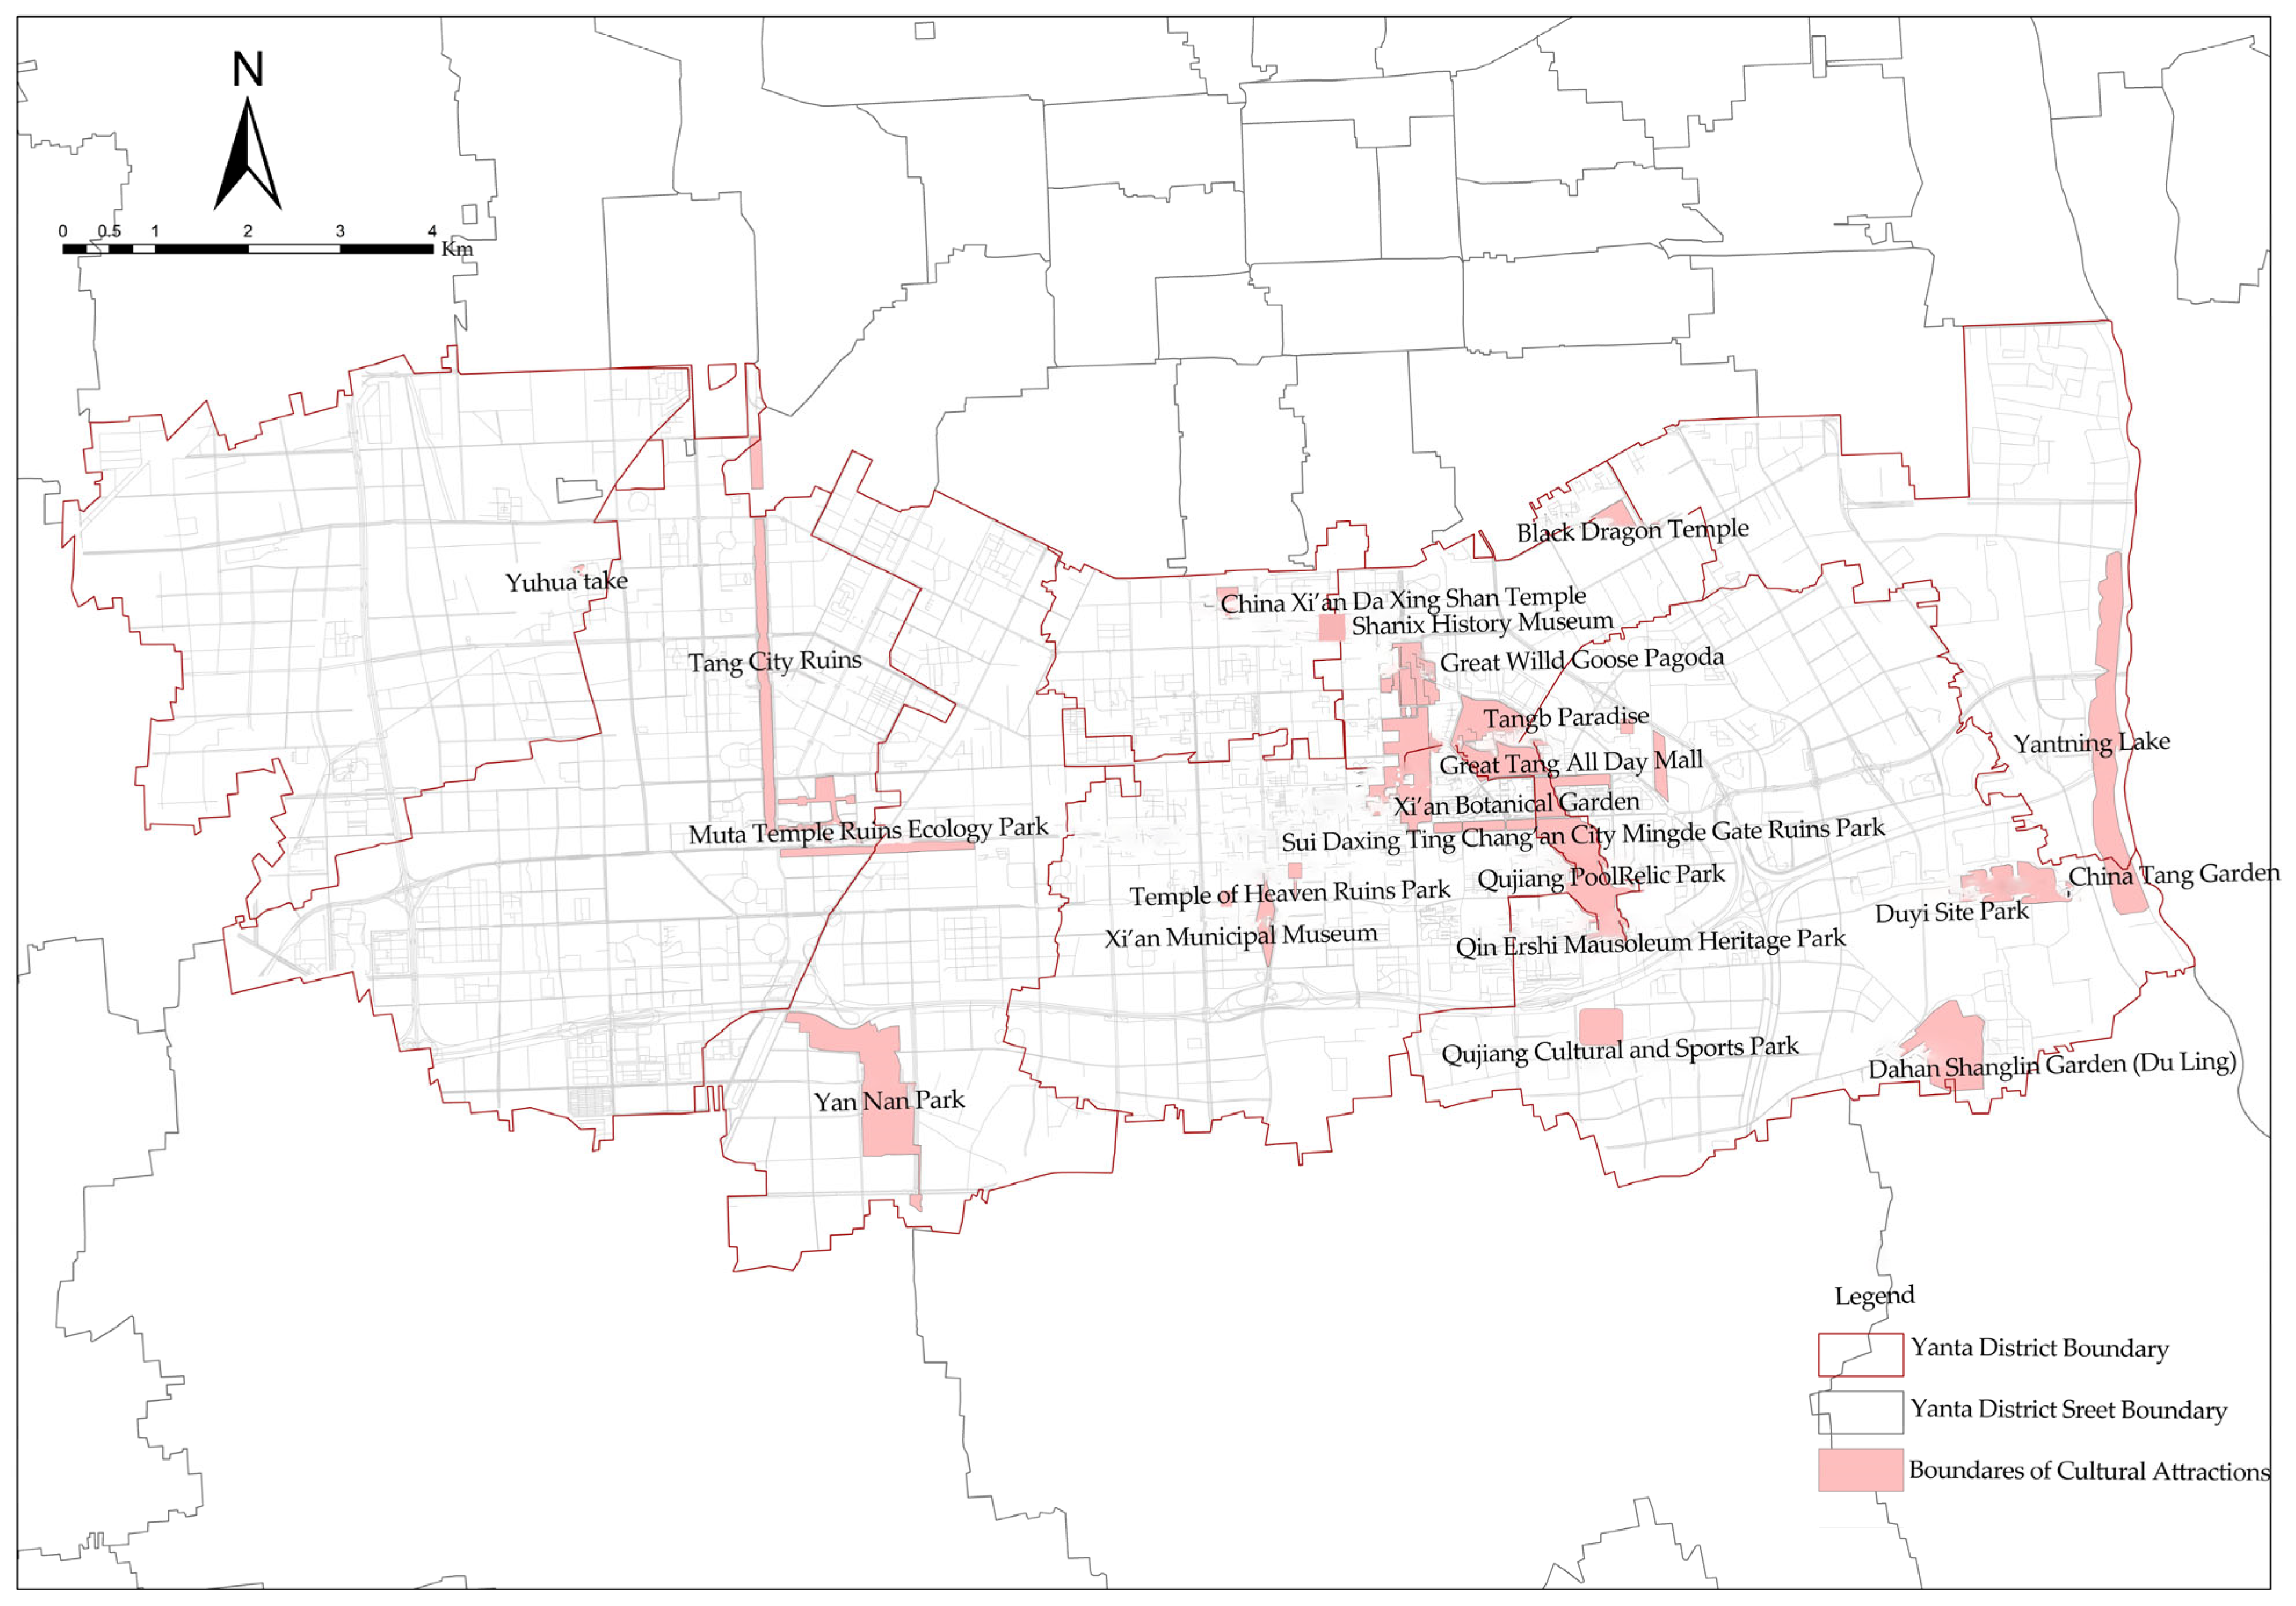
4.1. Selection of Cultural Scenic Spots

We take Yanta District of Xi’an, China, as the source of cultural scenic spot selection. Yanta District is in the southern part of Xi’an City, Shaanxi Province, and wild geese serve as a cultural symbol of Xi’an. As the cultural heart of Xi’an, Yanta District is home to many famous historical and cultural landmarks, including the Big Wild Goose Pagoda and the ruins of Qujiang Pond, and it is ideal for cultural attractions because of its urban landscape that combines historical and modern elements. We combined the ranking and popularity of the scenic spots and ultimately selected the top 21 destinations. The details are shown in Table 4.

4.2. Calculation of Indicator Weights

The AHP was chosen as the method for determining the weights of the indicators. As the construction of the scoring matrix is, to some extent, subjective, 10 experts were invited to rate the weights of the indicators to construct the scoring matrix, and the arithmetic mean was calculated to determine the final weights of the indicators, as shown in Table 5.

4.3. Numerical Calculation of Indicators

In assessing the construction quality of cultural scenic areas in Yanta District, Xi’an, this study identifies the boundaries of a few scenic areas in detail, including important historical and cultural sites and modern parks, and 1 km buffer zones are constructed around these scenic areas. These buffer zones are designed to assess the impact of scenic areas on the attractiveness and accessibility of adjacent roads.
The boundaries of each scenic area were technically processed using GIS (10.2 version) software to construct 1 km buffers, which were used to analyze the potential impact of the scenic area on the surrounding road network. The specific steps of the buffer zone analysis included the following.
Step 1. Layer input: Select the defined scenic boundary as the input layer.
Step 2. Buffer distance: Set the buffer radius to 1 km, which is considered enough to cover the direct socioeconomic impacts of the scenic area on the surrounding area.
Step 3. Buffer shape adjustment: Adjust the shape of the buffer zone according to the local topography and urban layout to ensure that key transport nodes and residential areas are included.
Step 4. Output layer generation: Use the generated buffer zone layer for subsequent spatial analysis to assess the relationship between the scenic spots and the potential value of the road network.
Through the above steps, we define the influence area of cultural scenic spots within Yanta District, as shown in Figure 3.
According to the methodology described in Section 3.2, the following data were collected to calculate the indicators.
(1)
Geographical information data sources: This study used road network data applicable to Yanta District, Xi’an, from OpenStreetMap (OSM). To ensure that the data accurately reflected the current road conditions in Yanta District, the original OSM data were corrected, which mainly involved merging the multi-lane road network into single-lane roads to avoid duplication and redundancy in the flow and accessibility analysis.
(2)
Natural environmental characteristics: The analysis of natural environmental features was based on data from Baidu Street View, focusing on the roads in Yanta District. Semantic segmentation was performed using a fully convolutional network (FCN) to extract natural elements such as green areas and water bodies from the street view images and calculate their percentage in the visual scene to quantify the green visual coverage of the streets in Yanta District and other natural environmental indicators.
(3)
Human-oriented perception data: The acquisition of human perception data was based on images from Baidu Street View combined with the City Six perception pre-processing model, which uses questionnaire scoring, convolutional neural networks (CNNs), and human–computer adversarial models to calculate the environmental aesthetic index and community vitality index of the streets of Yanta District. This method integrates subjective and objective analysis and aims to comprehensively evaluate the humanistic emotional characteristics of the streets in Yanta District.

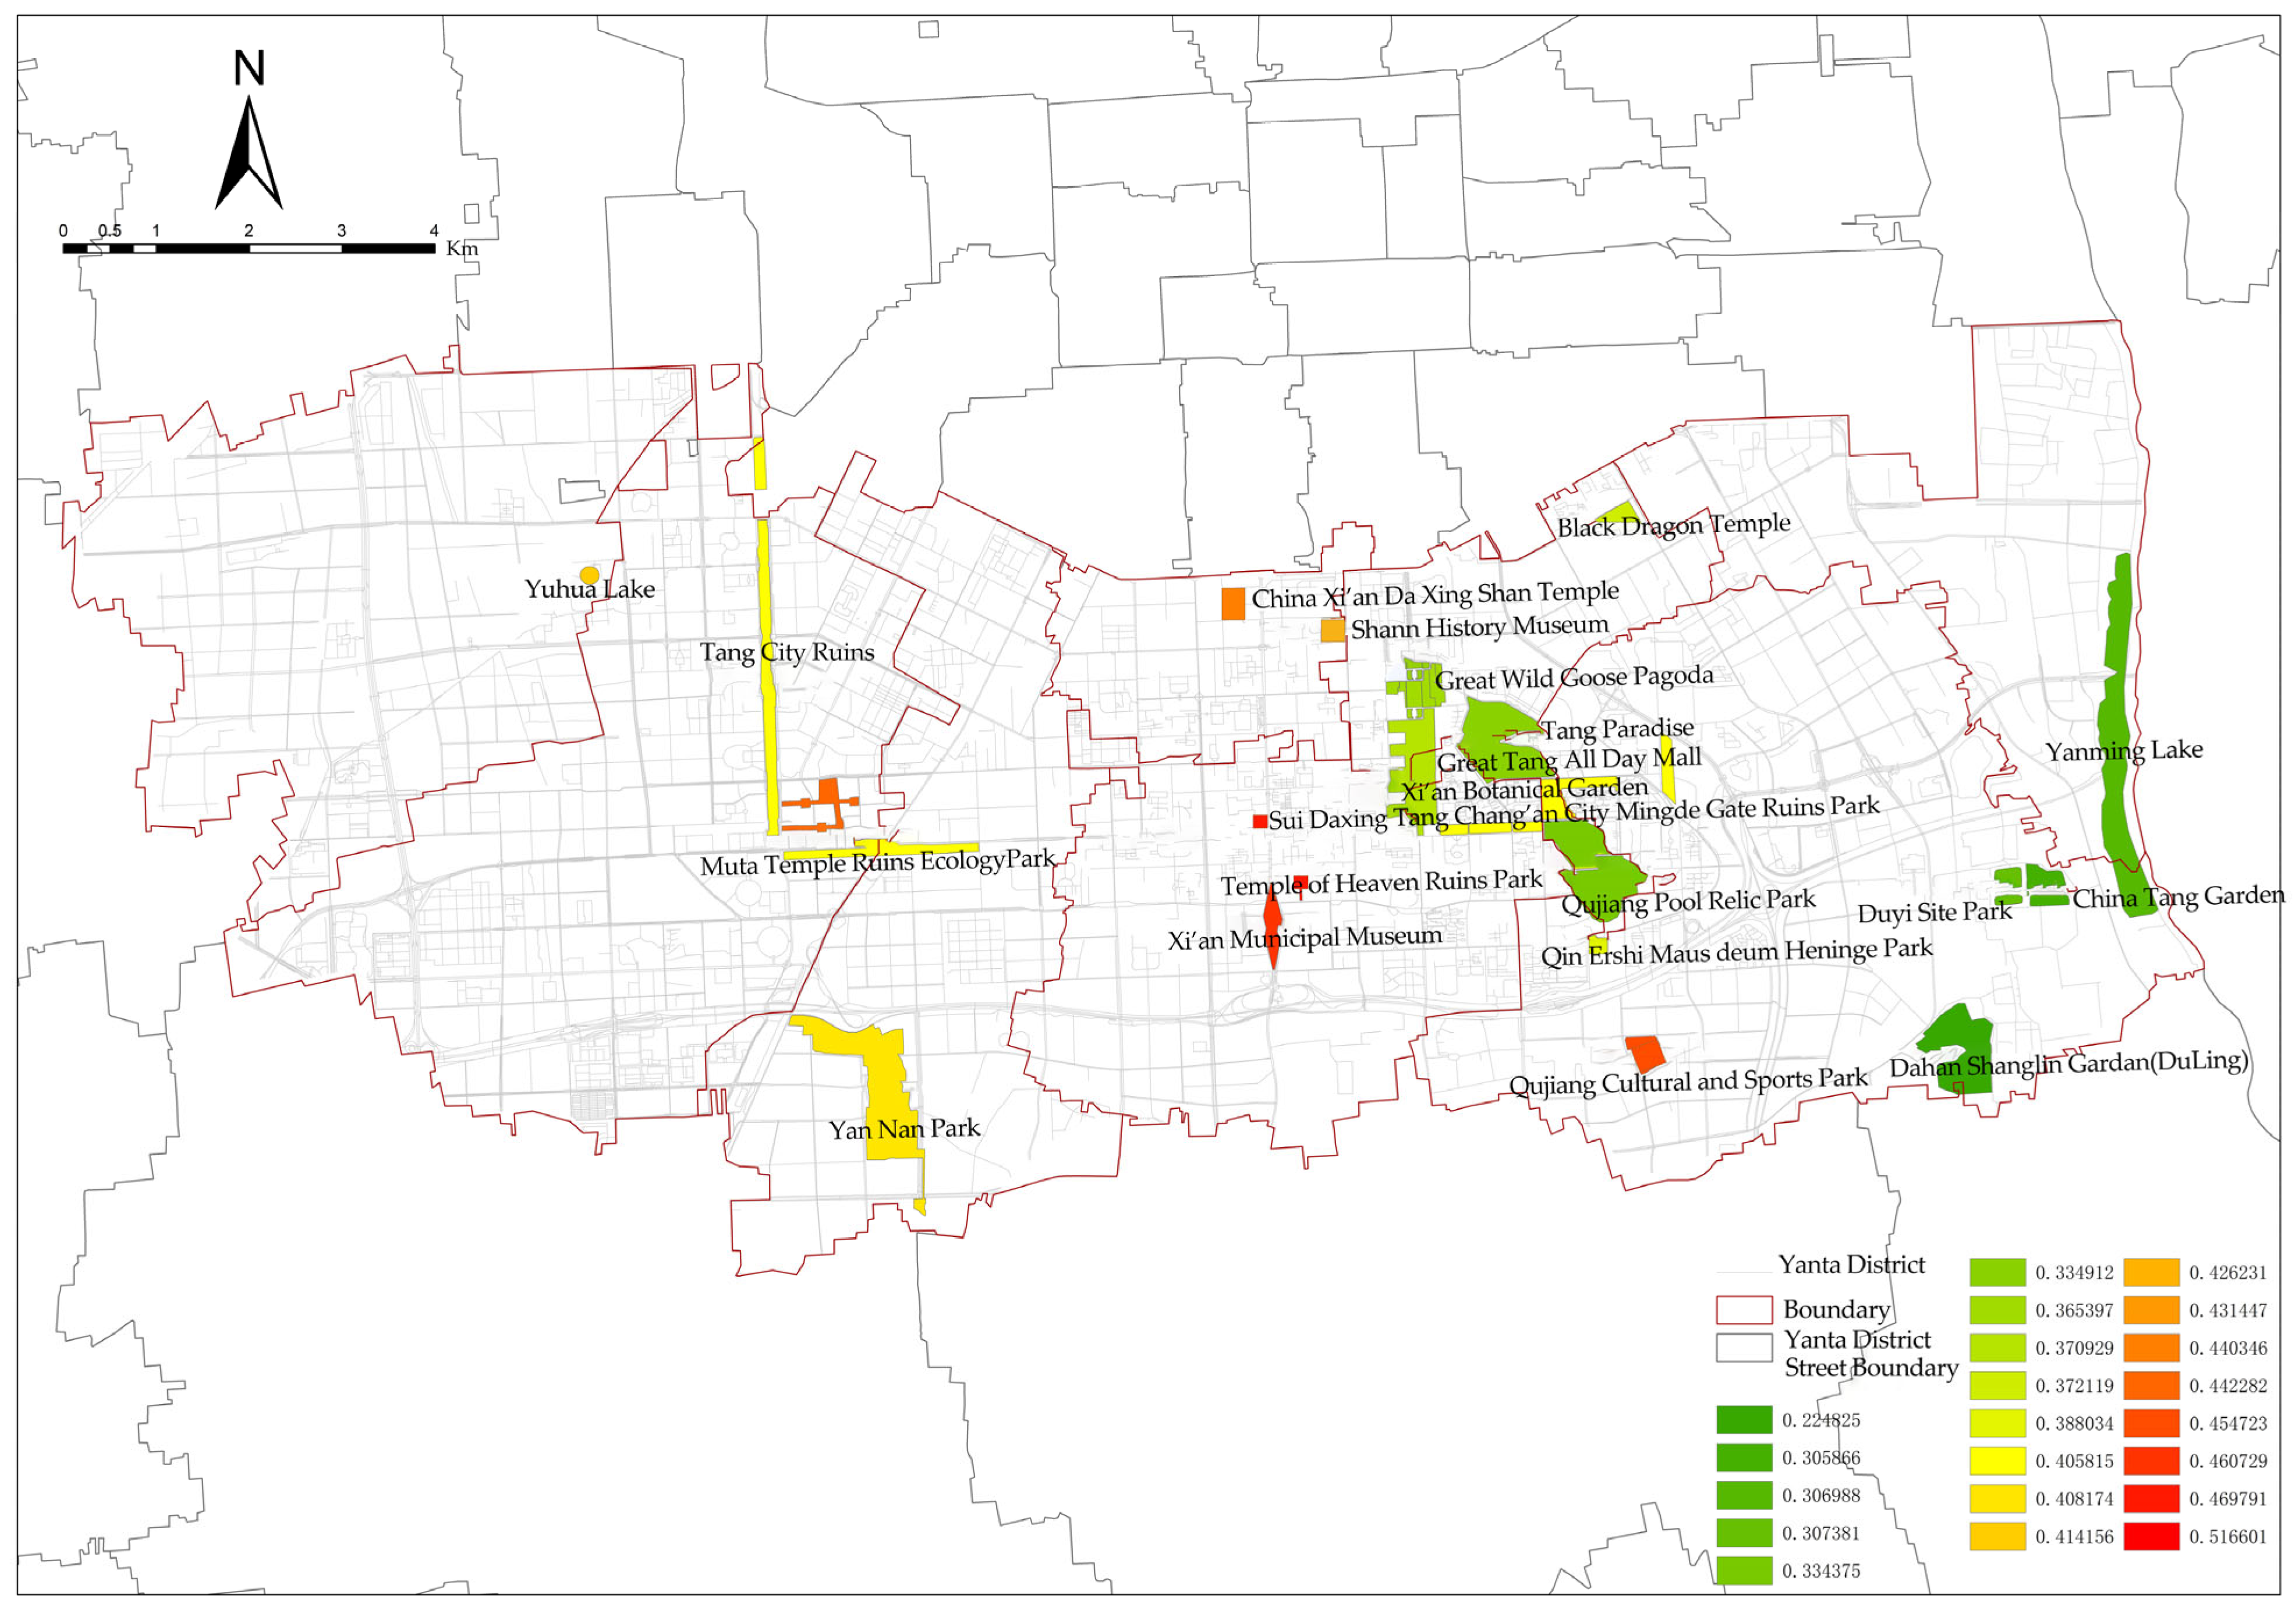
4.4. Ranking of Scenic Areas

According to the calculation results, the specific ranking is as shown in Table 6 and Figure 4.
In this paper, we classify the assessed scenic spots in terms of their potential, which is specifically divided into high potential scenic spots and low potential scenic spots. Specifically, this paper defines the scenic spots with the highest overall scores of the indicators as high potential scenic spots. These scenic spots have excellent overall performance and a higher development foundation, showing better performance in various indicators such as road natural environment perception, road humanistic emotion perception, and accessibility of spatial facilities. Based on this solid foundation, these scenic spots have a higher potential for further development. On the contrary, low potential scenic spots refer to scenic spots that are relatively low in the ranking of various indicators, and their development foundation is relatively weak.

5. Analysis of High-Potential Scenic Areas

If the scenic spot has a good road performance, it means that it has a higher development potential. As the infrastructure of a scenic spot, the road is an important cornerstone to support its development, and due to the long-term and stable nature of road construction, it is difficult to achieve significant changes or reconstruction in the short term. We analyzed the ranking results of the top three high-potential historical and cultural scenic spots to make scientific recommendations. The scoring results show significant differences in the potential values of the roads surrounding the scenic spots, with Sui Daxing Tang Chang’an City Mingdemen Ruins Park, Temple of Heaven Ruins Park, and Xi’an Municipal Museum being at the high end of the potential values.

5.1. Sui Daxing Tang Chang’an City Mingde Gate Ruins Park

At the top of the list is Sui Daxing Tang Chang’an City Mingdemen Ruins Park, as shown in Figure 5. As the core of ancient Chang’an City, it has a deep historical background and cultural value. The green visual coverage of the scenic roads in Mingdemen Ruins Park scored 0.138, a value attributed to the large amount of green planting on both sides of the road and in the middle of the isolation zone. Specifically, Ginkgo biloba and Prunus serrulata were planted on both sides of the road, while evergreen shrubs such as Rhododendron and Pinus mugo were planted in the central isolation zone. These tree species not only enhance the overall aesthetics but also improve the air quality and provide a pleasant environment for recreation.
The Building Visibility Index score is 0.488, reflecting the density and stylistic coherence of the buildings on both sides of the road. In the process of repair and new construction, the buildings around the park focus on stylistic consistency with the historic sites, adopting architectural elements and decorative styles from the Sui and Tang Dynasties. For example, the facades of the buildings use ancient bricks and tiles, flying eaves and arches, and beautifully carved wooden windows. These elements not only preserve the historic and cultural landscape but also create a unified and harmonious visual effect that enhances the visitor’s sense of immersion.
The Sky Visibility Index score is 0.179, indicating that the scenic spot’s design focuses on open views and a sense of space. Planning the height and spacing of the buildings appropriately ensures that visitors have an open view and good shooting angles on the road. For example, the height of the buildings on either side of the road is controlled within three stories, and spacious green belts and sitting areas are provided in the center to avoid the oppressive feeling of tall buildings. This design not only improves the efficiency of the street but also enhances the visual experience for visitors.
The Road Visibility Index score of 0.284, which ensures that visitors have enough space for photography and activities. The park ensures that the needs of all types of visitors are met through the rational planning of footpaths, cycle paths, and roads. For example, the footpath is over 3 m wide, the cycle path is on one side of the road, and the carriageway is over 6 m wide to ensure safe passage for vehicles and pedestrians. Meanwhile, a series of plazas and seating areas have been created on both sides of the road, with benches, flower beds, and public art, providing visitors with plenty of space for activities.
The infrastructure around Mingdemen Ruins Park is well developed, and convenient public transport and walking opportunities ensure easy access for visitors. The convenience score is 0.042 for shopping services, 0.038 for access to food and beverage services, and 0.052 for the 400 m accessibility of transport facilities. The high accessibility of scenic attractions indicates that the services around the park are very well developed and can meet the various needs of visitors.

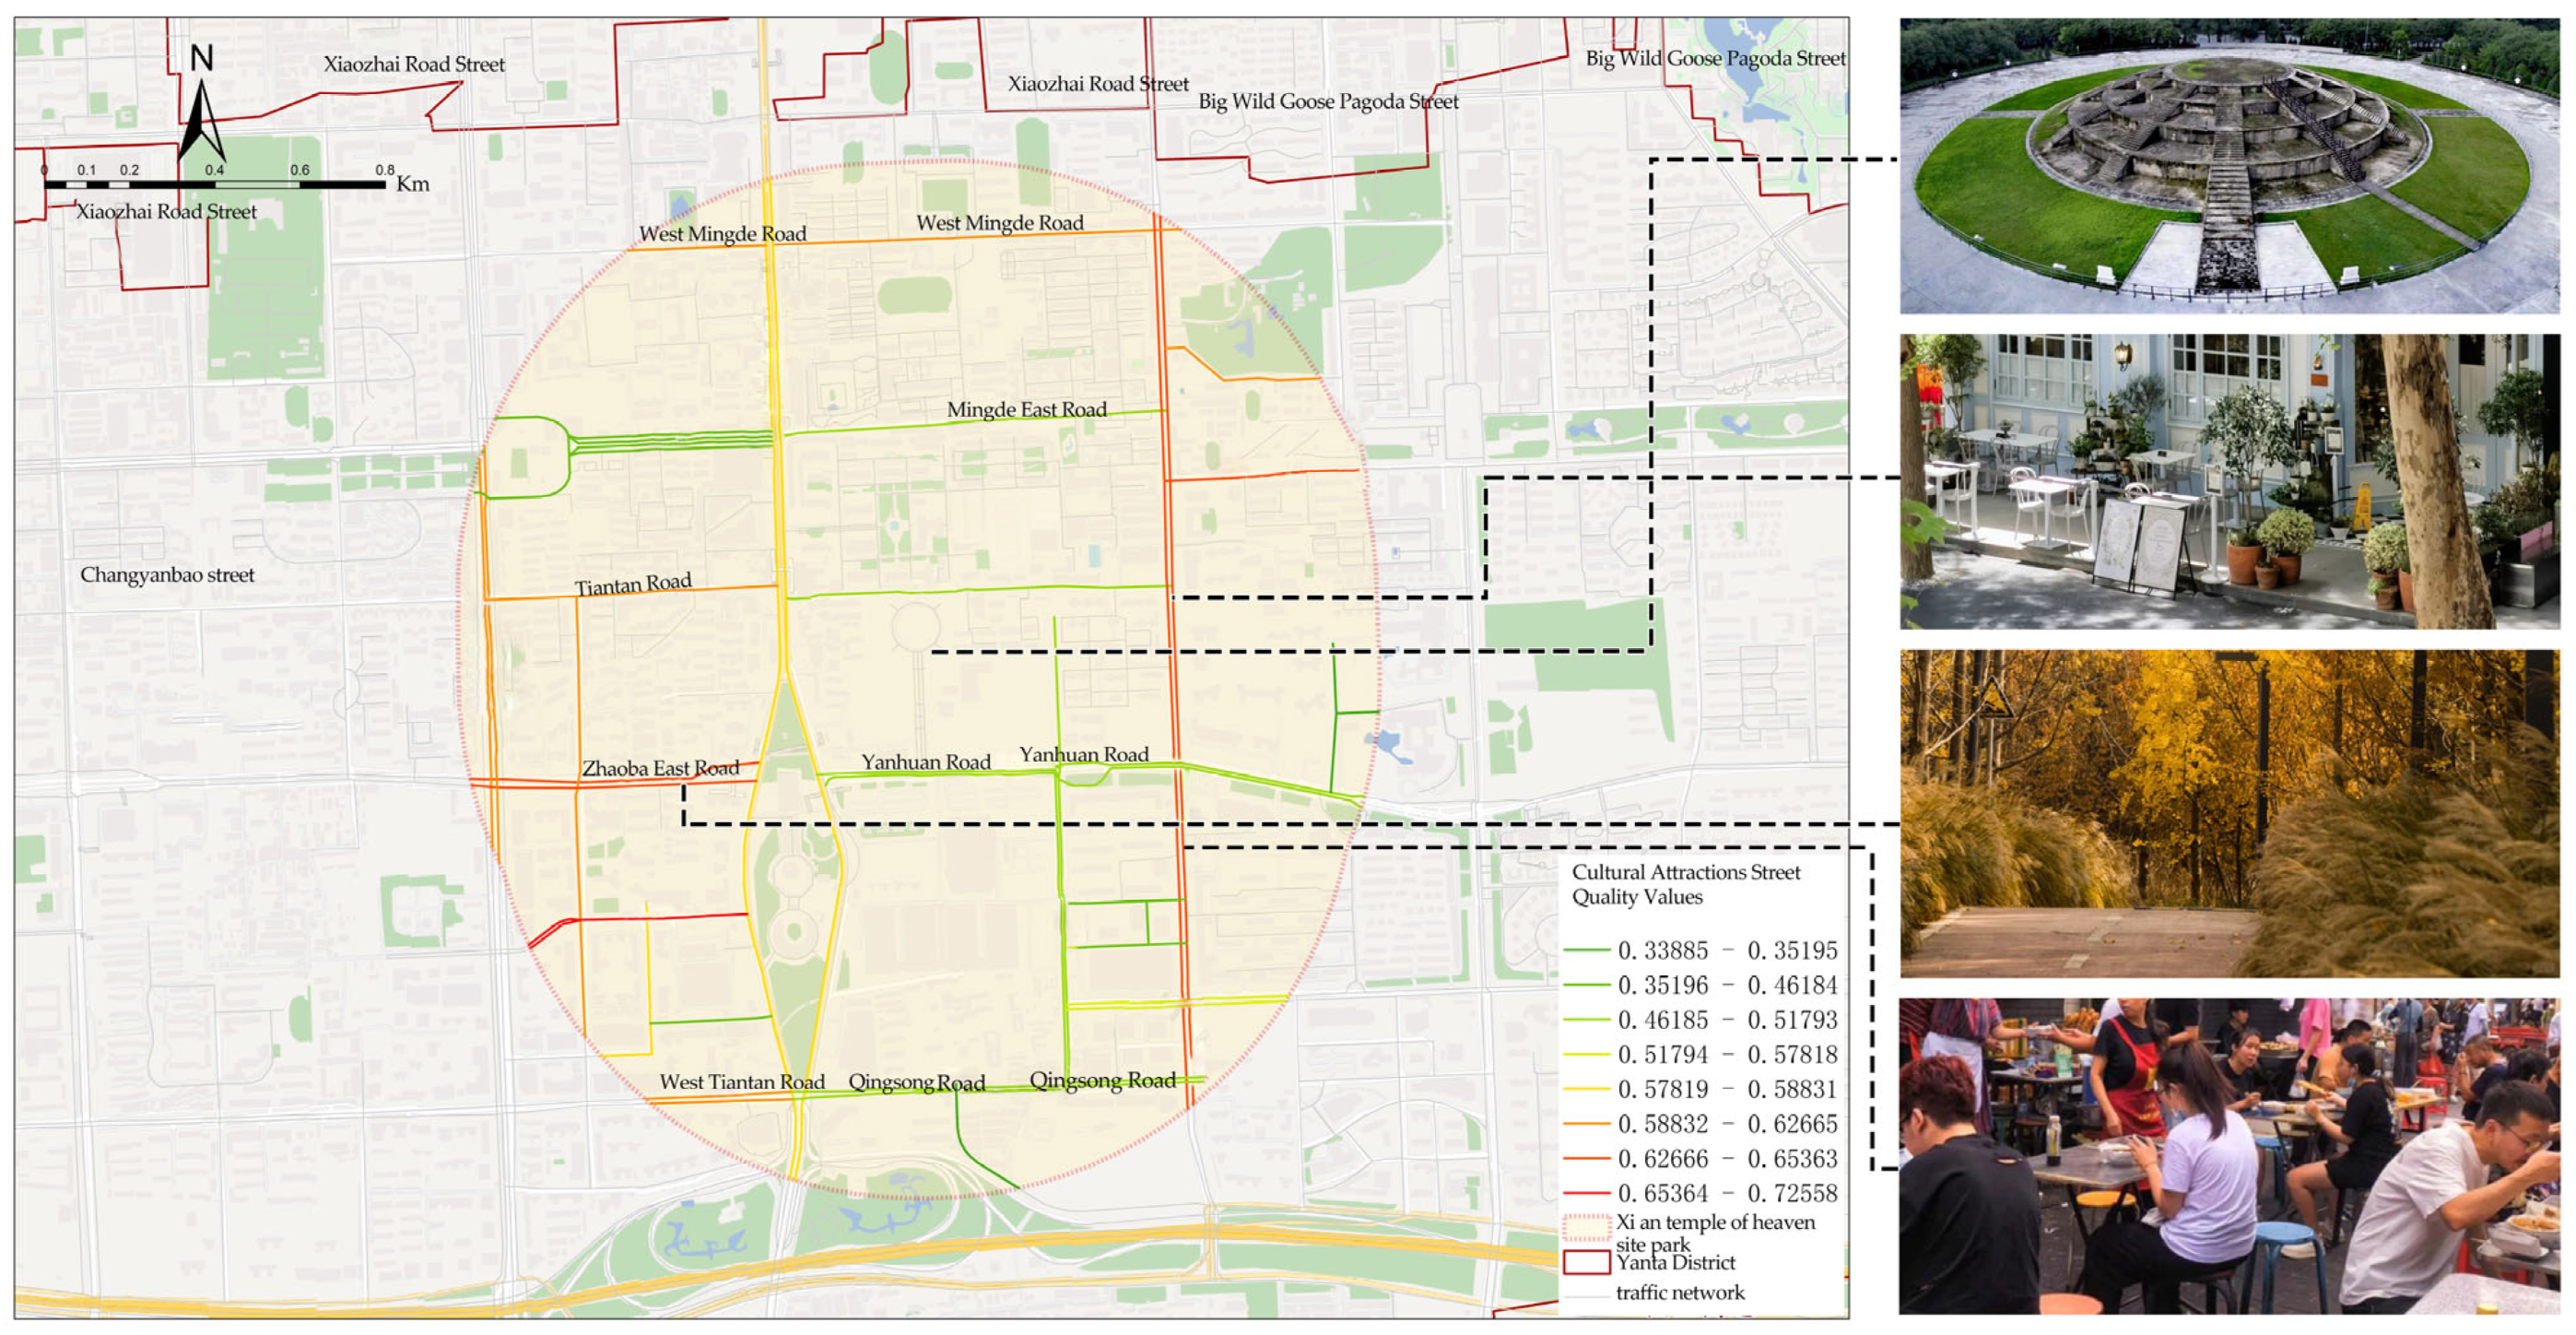
5.2. Temple of Heaven Ruins Park

The Temple of Heaven Ruins Park is an important cultural and religious landmark within the Yanta District of Xi’an, as shown in Figure 6. The surrounding area of the park is well served by infrastructure, including convenient public transport and various service facilities. With Road Visibility Index of 0.149 and Building Visibility Index of 0.669, the park is surrounded by a rational road design, including spacious footpaths and bicycle lanes, to ensure that tourists and pedestrians have enough space to move around. In addition, there are several public rest areas on both sides of the road, equipped with seats and litter bins, which are convenient for tourists to rest and keep the environment tidy.
Through analysis, we can find the distribution pattern of the park in terms of the accessibility of scenic spots, shopping facilities, catering, and transportation facilities. (1) Landscape Accessibility: There are many scenic spots in the vicinity, and they are easy to reach, which increases the tourism value and attractiveness of the area. (2) Shopping Accessibility: The high accessibility of shopping facilities means that tourists can easily find a shopping place to satisfy their shopping needs, which improves the overall experience. (3) Dining Accessibility: The high accessibility of food and beverage facilities means that tourists can easily find a shopping place to satisfy their shopping needs, which improves the overall experience. The high accessibility of food and beverage facilities allows visitors to easily find food and beverage services during their visit, which increases the comfort and satisfaction of their visit. (4) Transport Accessibility: Convenient connections to transport facilities ensure that tourists can easily arrive and depart from the area, which enhances the overall accessibility of the area.

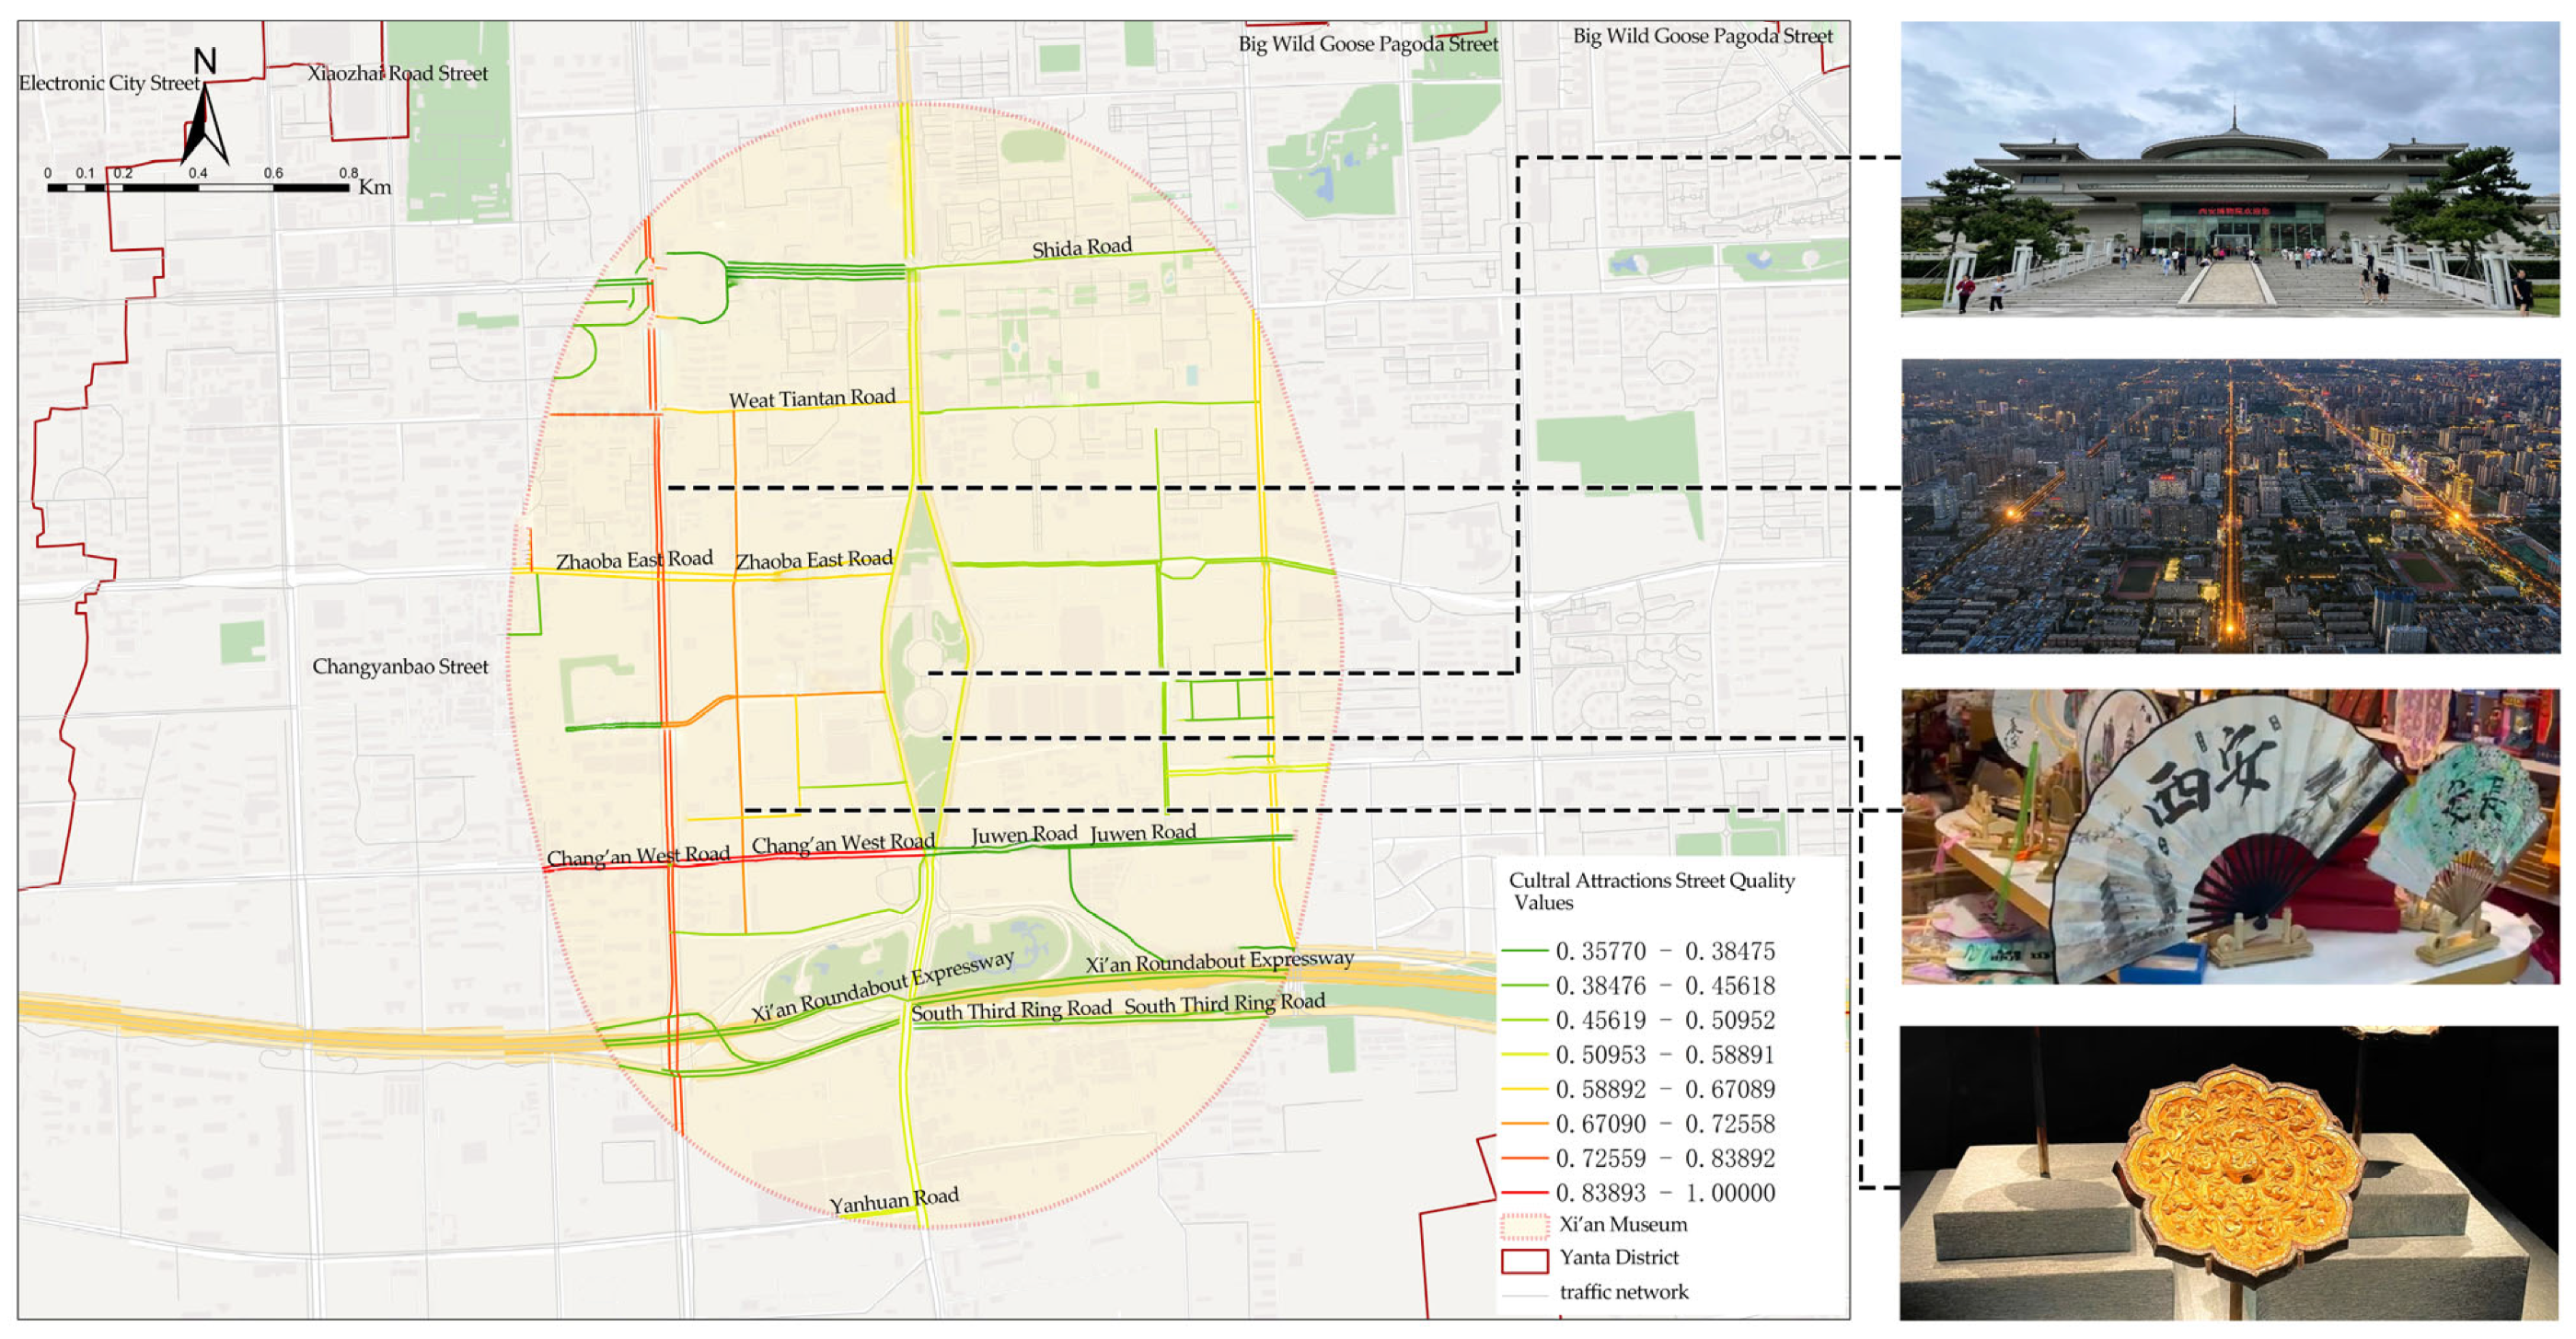
5.3. Xi’an Municipal Museum

The streets around the museum are well laid out to ensure a good circulation of visitors, as shown in Figure 7. Wide streets and open vistas not only make the area easily accessible to visitors but also provide space for street art performances and temporary exhibitions, further enriching the visitor experience. The museum building itself and the artifacts on display provide visual aesthetics, while a variety of educational activities and cultural performances enliven the area. For example, the Environment Beauty Index is 0.643, and the community vitality index is 0.550. Regular special exhibitions and cultural lectures attract many cultural enthusiasts and family visitors, making the area a place for intellectual and cultural exchange.
The presence of the Xi’an Museum not only enhances the value of cultural assets but also provides a significant boost to the local economy. Tourists’ spending habits directly increase the income of the local catering and souvenir industries, and the increase in these commercial activities, in turn, provides more employment opportunities and stimulates the economic cycle. At the same time, the museum, as a cultural focal point, increases the global awareness of Xi’an as a historical and cultural tourist destination through the influence of social media and the dissemination of content creation. This dual effect of cultural and economic growth demonstrates the important role of cultural landmarks in modern cities not only as places for preserving history and disseminating knowledge but also as key drivers of local economies and community vitality.
The above analyses provide us with some key directions for improvement.
(1)
Increase green visual cover. In Sui Daxing Tang Chang’an City Mingde Gate Ruins Park and Temple of Heaven Ruins Park, which already boast a high green visual coverage, further selection of tree species such as ginkgo trees and cherry trees can enhance their visual effect and environmental benefits. For Xi’an Municipal Museum, which may have areas with lower green visual coverage, the green areas on both sides of the roads and within the park should be increased to ensure visual coherence and comfort.
(2)
Optimize sky views. In the design and planning of any new facilities, building heights and layouts should be strictly controlled to avoid blocking important historical vistas. In Temple of Heaven Ruins Park and Xi’an Municipal Museum, the openness of views should be enhanced by removing or redesigning structures that obstruct views.
(3)
Increase road space efficiency. In Temple of Heaven Ruins Park, where road space efficiency is high, roads should continue to be rationally designed and maintained to ensure tourists have ample space for activities and photography. For Sui Daxing Tang Chang’an City, Mingde Gate Ruins Park, and Xi’an Municipal Museum, where road space might be less efficient, improvements can be made by widening roads, providing spacious sidewalks and bicycle paths, and increasing the number of public rest areas.
(4)
Moderate architectural concentration. For Sui Daxing Tang Chang’an City Mingde Gate Ruins Park and Temple of Heaven Ruins Park, building density and style can be adjusted to optimize architectural concentration. Moderate building concentration can provide rich visual elements and enhance the overall aesthetics of these scenic spots.

6. Discussion and Conclusions

This paper assesses the quality of cultural scenic spots from the perspective of street space and comprehensively applies POI data, road network data, and streetscape data to assess cultural scenic spots in terms of natural environment perception, humanistic emotion perception, and spatial facility accessibility of streets, and at the same time, it combines these data with AHP to rank the scenic spots. The method of this paper is applied to Yanta District in Xi’an City, China, where 21 selected cultural scenic spots are evaluated and ranked, and the high-potential scenic spots are determined and analyzed in detail. First, the optimization of the scenic area’s natural environment not only enhances the visual recognition of the scenic area but also provides a more comfortable and beautiful experience for tourists, which, in turn, strengthens the external image of the brand. Secondly, the improvement of humanistic emotional perception enhances the tourists’ emotional sense of belonging to the scenic spot and promotes the deep recognition of the brand image. The improvement of spatial accessibility further enhances the convenience and service level of the scenic spot, makes the overall experience of tourists smoother, and injects more functional value into the brand image. For RQ1, we successfully constructed a set of comprehensive and effective evaluation index system, which realizes the quantitative assessment of the street quality of cultural scenic spots and provides a powerful tool for related research and practice activities. For RQ2, based on the constructed evaluation index system, we evaluated and ranked 21 cultural scenic spots in Yanta District, Xi’an City, China. Through the methodology and analysis of this paper, targeted recommendations are made on how to build high-quality cultural attractions and how to enhance the street quality potential of existing attractions. First of all, when planning and designing cultural scenic spots, the importance of street quality should be fully considered and incorporated into the overall design framework. A comprehensive evaluation index system should be applied to pre-assess the design scheme to ensure that street quality is optimized at the design stage. For policy makers, they should encourage and support cultural attractions to improve the quality of streets, such as by providing financial subsidies, tax incentives, and other incentives. They should also strengthen supervision and evaluation to ensure that the street quality of cultural attractions meets the relevant standards and requirements.
Although this study has achieved some results in the construction and application of an evaluation paradigm for the construction of scenic spots, there are still some limitations and directions for future research. Future research can be conducted in the following directions.
(1)
This study focuses mainly on evaluation from the perspective of the street, ignoring important dimensions such as cultural attributes, energy level, and the size of the scenic spots. To assess the development potential of cultural sites more comprehensively, future studies will seek to incorporate these factors into the evaluation system.
(2)
When setting buffer zones, to more accurately reflect the actual influence and attractiveness of different scenic spots, a more flexible and dynamic buffer zone setting method will be considered in future studies. For example, different buffer zone radii can be set for each scenic spot based on factors such as its popularity, number of tourists, and historical value to assess its spatial influence and development potential more comprehensively.
(3)
Analysis of climatic factors, especially bioclimatic characteristics, could be included in future studies, such as quantitative assessment of microclimate characteristics under different combinations of street widths and building heights, as well as the moderating effect of different ground materials on the microclimate of streets and how they affect the urban microclimate of historic districts. Improving the microclimate of the streets will enhance the comfort of visitors while preserving the unique features and cultural values of the historic districts.
(4)
Subsequently, future studies can attempt to introduce more advanced technologies and data sources, such as drone images, IoT sensor data, etc., to improve the accuracy and real-time nature of the evaluation indices. In addition, the combination of virtual reality (VR) and augmented reality (AR) technologies can be considered to provide a more intuitive and immersive evaluation experience. Specifically, drone imaging technology has been used to rapidly extract key information such as vegetation cover and landscape features, enabling immediate updates and the dynamic monitoring of assessment indicators. IoT sensors are widely used to ensure the timeliness and accuracy of data.

Author Contributions

Conceptualization, Chao Chen; methodology, Chao Chen; formal analysis, Chao Chen; investigation, Chao Chen; data curation, Chao Chen; writing—original draft preparation, Chao Chen; writing—review and editing, Chao Chen and Suyoung Kim; visualization Suyoung Kim; supervision, Suyoung Kim. All authors have read and agreed to the published version of the manuscript.

Funding

This research received no external funding.

Informed Consent Statement

Informed consent was obtained from all subjects involved.

Data Availability Statement

The data presented in this study are available on request from the corresponding author. The data are not publicly available due to the need to maintain the confidentiality of study participants.

Conflicts of Interest

The authors declare no conflicts of interest. The funders had no role in the design of the study; in the collection, analyses, or interpretation of data; in the writing of the manuscript; or in the decision to publish the results.

References

  1. Jinghuan, N.; Zhen, W. Research on function optimization design of public products in Tourist Attractions Based on AHP. In Proceedings of the 2020 13th International Conference on Intelligent Computation Technology and Automation (ICICTA), Xi’an, China, 24–25 October 2020; pp. 173–177. [Google Scholar]
  2. Jiang, Y.; Huang, W.; Xiong, X.; Shu, B.; Yang, J.; Li, M.; Cui, X. Investigating spatial patterns and determinants of tourist attractions utilizing POI data: A case study of Hubei Province, China. Heliyon 2024, 10, e32370. [Google Scholar] [CrossRef] [PubMed]
  3. Park, J.; Jeong, E. Service quality in tourism: A systematic literature review and keyword network analysis. Sustainability 2019, 11, 3665. [Google Scholar] [CrossRef]
  4. Revida, E.; Siahaan, A.Y.; Purba, S. The Influence of Community Behaviour on the Quality of Tourism Services at Toba Lake North Sumatera. Int. J. Res. Bus. Soc. Sci. 2018, 7, 22–29. [Google Scholar] [CrossRef]
  5. Lin, Y.; Chen, Z.; Xie, J.; Ye, P.; Lan, Z.; Ding, Z. Mechanism of Tourist Landscape Suitability in Natural Historical Heritage Sites: An Empirical Analysis in Quanzhou, China Based on Multi-Source Data and Machine Learning. Available online: https://ssrn.com/abstract=4846037 (accessed on 28 May 2024).
  6. Xu, J.; Wang, J.; Zuo, X.; Han, X. Spatial quality optimization analysis of streets in historical urban areas based on street view perception and multisource data. J. Urban Plan Dev. 2024, 150, 05024036. [Google Scholar] [CrossRef]
  7. Li, Q.; Lv, S.; Cui, J.; Zhang, J.; Liu, Y. Environmental Perception about Pedestrian Environment on Cultural Visitation Roads. Sustainability 2024, 16, 7097. [Google Scholar] [CrossRef]
  8. Wu, Z.; Wang, Y.; Gan, W.; Zou, Y.; Dong, W.; Zhou, S.; Wang, M. A survey of the landscape visibility analysis tools and technical improvements. Int. J. Environ. Res. Public Health 2023, 20, 1788. [Google Scholar] [CrossRef]
  9. Hernawati, E.; Sari, S.K.; Wijaya, D.R. Combination of Analytic Hierarchy Process and Simple Additive Weighting for Tourist Attractions Recommendation System. Int. J. Appl. Inf. Technol. 2021, 5, 123–131. [Google Scholar]
  10. Zhang, S.; Lin, J.; Feng, Z.; Wu, Y.; Zhao, Q.; Liu, S.; Ren, Y.; Li, H. Construction of cultural heritage evaluation system and personalized cultural tourism path decision model: An international historical and cultural city. J. Urban Manag. 2023, 12, 96–111. [Google Scholar] [CrossRef]
  11. Hao, W.; Huaiyue, L.; Dan, L. Research on Spatial Optimization Level Strategy of Beijing Historical Blocks Based on Tourists’ Cognitive Evaluation. J. Landsc. Res. 2022, 14, 14–20. [Google Scholar]
  12. Gu, X.; Hunt, C.A.; Jia, X.; Niu, L. Evaluating nature-based tourism destination attractiveness with a Fuzzy-AHP approach. Sustainability 2022, 14, 7584. [Google Scholar] [CrossRef]
  13. Bire, C.; Kasse, D.; Bire, R. Decision support system for selecting tourist attractions using fuzzy analytic hierarchy process. Bull. Electr. Eng. Inform. 2021, 10, 1252–1261. [Google Scholar] [CrossRef]
  14. Liu, S.; Ge, J.; Bai, M.; Yao, M.; Zhu, Z. Uncovering the factors influencing the vitality of traditional villages using POI (point of interest) data: A study of 148 villages in Lishui, China. Herit. Sci. 2023, 11, 123. [Google Scholar] [CrossRef]
  15. Jamal Mahdi, A.; Esztergár-Kiss, D. Prioritizing Influential Factors on Tourist Decision-Making for Choosing Destinations Using Parsimonious Analytical Hierarchy Process (PAHP). Tour. Plan. Dev. 2024, 21, 330–353. [Google Scholar] [CrossRef]
  16. Gil, E.; Ahn, Y.; Kwon, Y. Tourist attraction and points of interest (POIs) using search engine data: Case of Seoul. Sustainability 2020, 12, 7060. [Google Scholar] [CrossRef]
  17. Liu, R.; Neisch, P. Measuring the effectiveness of street renewal design: Insights from visual preference surveys, deep-learning technology, and eye-tracking simulation software. Landsc. Urban Plan. 2025, 256, 105291. [Google Scholar] [CrossRef]
  18. Zhang, L.; Ye, Y.; Zeng, W.; Chiaradia, A. A systematic measurement of street quality through multi-sourced urban data: A human-oriented analysis. Int. J. Environ. Res. Public Health 2019, 16, 1782. [Google Scholar] [CrossRef]
  19. Hu, F.; Liu, W.; Lu, J.; Song, C.; Meng, Y.; Wang, J.; Xing, H. Urban function as a new perspective for adaptive street quality assessment. Sustainability 2020, 12, 1296. [Google Scholar] [CrossRef]
  20. Yang, L.; Jin, Q.; Fu, F. Research on Urban Street Network Structure Based on Spatial Syntax and POI Data. Sustainability 2024, 16, 1757. [Google Scholar] [CrossRef]
  21. Li, N.; Zhang, M. Distribution characteristics and influencing factors of tourist attractions in Tianjin based on POI big data. Environ. Dev. Sustain. 2024, 1–27. [Google Scholar] [CrossRef]
  22. Liang, W.; Ahmad, Y.; Mohidin, H.H.B. Spatial pattern and influencing factors of tourism based on POI data in Chengdu, China. Environ. Dev. Sustain. 2024, 26, 10127–10143. [Google Scholar] [CrossRef]
  23. Peng, R.; Gao, W. Spatial distribution pattern and driving mechanism of tourist attractions in Gansu Province based on POI data. PLoS ONE 2023, 18, e0292165. [Google Scholar] [CrossRef] [PubMed]
  24. Wang, R.; Huang, C.; Ye, Y. Measuring Street Quality: A Human-Centered Exploration Based on Multi-Sourced Data and Classical Urban Design Theories. Buildings 2024, 14, 3332. [Google Scholar] [CrossRef]
  25. Zhang, L.; Xu, X.; Guo, Y. Comprehensive Evaluation of the Implementation Effect of Commercial Street Quality Improvement Based on AHP-Entropy Weight Method—Taking Hefei Shuanggang Old Street as an Example. Land 2022, 11, 2091. [Google Scholar] [CrossRef]
  26. Moosivand, J.; Farahani, B.M. Analysing the relationship between urban infrastructure and attracting urban tourists by using TOPSIS and AHP models. Tour. Plan. Dev. 2013, 10, 467–479. [Google Scholar] [CrossRef]
  27. Bire, R.B.; Conterius, A.L.; Nasar, A. Tourist preference and destination competitiveness using the AHP–TOPSIS hybrid model. In Proceedings of the International Conference on Applied Science and Technology on Social Science (ICAST-SS 2020), Padang, Indonesia, 24–25 October 2020; pp. 43–48. [Google Scholar]
  28. Wang, Z. Spatial Optimisation and Vitality Enhancement Strategies for Urban Villages with the Intervention of Digital Analytics. Ph.D. Thesis, Politecnico di Torino, Torino, Italy, 2023. [Google Scholar]
  29. Psyllidis, A.; Gao, S.; Hu, Y.; Kim, E.-K.; McKenzie, G.; Purves, R.; Yuan, M.; Andris, C. Points of Interest (POI): A commentary on the state of the art, challenges, and prospects for the future. Comput. Urban Sci. 2022, 2, 20. [Google Scholar] [CrossRef]
  30. He, X.; Kozlowski, M.; Ujang, N.B.; Ma, Y. Defining Inner-City Transitional Street Typology Using Point of Interest (PoI) Data in Hillside Cities of China. Sustainability 2024, 16, 4690. [Google Scholar] [CrossRef]
  31. Wang, Y.; Zhang, H.; Liu, L. Does city construction improve life quality?—Evidence from POI data of China. Int. Rev. Econ. Financ. 2022, 80, 643–653. [Google Scholar] [CrossRef]
  32. Yue, Y.; Zhuang, Y.; Yeh, A.G.; Xie, J.-Y.; Ma, C.-L.; Li, Q.-Q. Measurements of POI-based mixed use and their relationships with neighbourhood vibrancy. Int. J. Geogr. Inf. Sci. 2017, 31, 658–675. [Google Scholar] [CrossRef]
  33. Du, Y.; Huang, W. Evaluation of street space quality using streetscape data: Perspective from recreational physical activity of the elderly. ISPRS Int. J. Geo-Inf. 2022, 11, 241. [Google Scholar] [CrossRef]
  34. Xuan, W.; Zhao, L. Research on correlation between spatial quality of urban streets and pedestrian walking characteristics in china based on street view big data. J. Urban Plan. Dev. 2022, 148, 05022035. [Google Scholar] [CrossRef]
  35. Wang, M.; He, Y.; Meng, H.; Zhang, Y.; Zhu, B.; Mango, J.; Li, X. Assessing street space quality using street view imagery and function-driven method: The case of Xiamen, China. ISPRS Int. J. Geo-Inf. 2022, 11, 282. [Google Scholar] [CrossRef]
  36. Li, J.; Li, B.; Shen, Y.; Tang, K. Study on the steady state of the propagation model of consumers’ perceived service quality in the community group-buying. J. Retail. Consum. Serv. 2022, 65, 102882. [Google Scholar] [CrossRef]
  37. Duan, J.; Liao, J.; Liu, J.; Gao, X.; Shang, A.; Huang, Z. Evaluating the spatial quality of urban living streets: A case study of Hengyang City in Central South China. Sustainability 2023, 15, 10623. [Google Scholar] [CrossRef]
  38. Li, M.; Pan, J. Assessment of Influence Mechanisms of Built Environment on Street Vitality Using Multisource Spatial Data: A Case Study in Qingdao, China. Sustainability 2023, 15, 1518. [Google Scholar] [CrossRef]
  39. Wan, T.; Lu, W.; Sun, P. Constructing the quality measurement model of street space and its application in the old town in Wuhan. Front. Public Health 2022, 10, 816317. [Google Scholar] [CrossRef]
  40. Min, J. A Study on the Spatial Distribution of Tourist Attractions above 3A Level in Hangzhou Based on POI Extraction. In Proceedings of the 2023 International Conference on Blockchain Technology and Applications (ICBTA), Beijing, China, 25–27 August 2023; pp. 60–63. [Google Scholar]
  41. Wu, J.; Qian, M.; Cao, Y. Research on the influence mechanism and optimisation of urban greenway network use pattern based on multi-source data—A case study of Guangzhou, China. In Proceedings of the Fábos Conference on Landscape and Greenway Planning, Budapest, Hungary, 30 June–3 July 2022. [Google Scholar]
  42. Yu, B.; Sun, W.; Wu, J. Analysis of Spatiotemporal Characteristics and Recreational Attraction for POS in Urban Communities: A Case Study of Shanghai. Sustainability 2022, 14, 1460. [Google Scholar] [CrossRef]
  43. Mahdi, A.; Esztergár-Kiss, D. Modelling the Accommodation Preferences of Tourists by Combining Fuzzy-AHP and GIS Methods. J. Adv. Transp. 2021, 2021, 9913513. [Google Scholar] [CrossRef]
Figure 1. Framework for the construction of an index system for evaluating the street quality of historical and cultural scenic spots based on streetscape and POI data.
Ijgi 14 00130 g001
Figure 2. Correspondence between street functions and representations in cultural areas.
Ijgi 14 00130 g002
Figure 3. Buffer zone boundary of each scenic spot in Yanta County.
Ijgi 14 00130 g003
Figure 4. Potential value of network construction in the Yanta District scenic area.
Ijgi 14 00130 g004
Figure 5. Potential value of the construction of Mingde Gate Ruins Park, Tang Chang’an City, Sui Daxing, China.
Ijgi 14 00130 g005
Figure 6. Potential value of street network construction in Tiantan Ruins Park.
Ijgi 14 00130 g006
Figure 7. Potential value of museum street network construction in Xi’an City.
Ijgi 14 00130 g007
Table 1. Structure of indicators.
Target-Layer ElementsDisplay-Layer Elements
Natural Environment PerceptionRoad Visibility Index
Green Visibility Index
Building Visibility Index
Sky Visibility Index
Humanistic Emotional PerceptionEnvironment Beauty Index
Environment Activity Index
Spatial accessibilityLandscape Accessibility
Shopping Accessibility
Dining Accessibility
Transport Accessibility
Table 2. Saaty importance scales and meanings.
B i j Meaning
1 B i  and B j  are equally important
1/3 B i  is slightly more important than  B j
1/5 B i  is significantly more important than B j
1/7 B i  is far more important than B j
1/9 B i  is far more important than B j
1/2, 1/4, 1/6, 1/8Values between two adjacent judgments
Table 3. Mean random consistency index ( R I ) values.
Matrix Order12345678910
R I value0.000.000.580.91.121.241.321.411.451.49
Table 4. The 21 objects for evaluation.
Num.Cultural LandscapeDescription
1The Ruins Park of Mingde Gate, located in Daxing City from the Sui Dynasty and Chang’an City from the Tang DynastyAncient city gate site of great historical and cultural value.
2Temple of Heaven Ruins ParkImportant historical site for religious ceremonies.
3Xi’an Municipal MuseumAn important site for the display of local history and culture.
4Qujiang Cultural and Sports ParkAn extensive park combining cultural display and sports activities.
5Muta Temple Ruins Ecology ParkCombination of an ancient temple site and modern ecological landscape.
6China Xi’an Da Xing Shan TempleA famous Buddhist temple with a long history.
7Xi’an Botanical GardenA place for leisure experience by displaying a variety of historical plant species.
8Shaanxi History MuseumRich collection of historical artifacts, a window to the history of Shaanxi.
9Yuhua LakeBeautiful lakes with natural historical scenery and an elegant environment.
10Yan Nan ParkOne of the most important places for public recreation.
11Tang City RuinsA park with the remains of the Tang Dynasty city wall.
12Qin Ershi Mausoleum Heritage ParkA Qin Dynasty historical site of archaeological value.
13Black Dragon TempleHistorically famous Buddhist temple ruins.
14Great Tang All Day MallA popular area for trade, entertainment, and cultural shows.
15Big Wild Goose PagodaA famous historical and cultural landmark that attracts many tourists.
16Tang ParadiseA cultural theme park that recreates the royal gardens of the Tang Dynasty.
17Qujiang Pool Relic ParkA park that combines nature and history, surrounded by rich cultural resources.
18Duyi Site ParkThe ruins of the ancient Doeup Castle are of great historical value.
19Yanming LakeA natural park with recreational facilities.
20China Tang GardenA theme park showcasing the culture and art of the Tang Dynasty.
21Dahan Shanglin Garden (Du Ling)Ancient royal gardens with deep historical and cultural heritage.
Table 5. Indicator weights.
Target-Layer ElementsIndicator WeightsDisplay-Layer ElementsIndicator Weights
Natural Environment Perception0.3074Road Visibility Index0.0639
Green Visibility Index0.081
Building Visibility Index0.0487
Sky Visibility Index0.1136
Humanistic Emotional Perception0.1732Environment Beauty Index0.0747
Environment Activity Index0.0985
Spatial accessibility0.5195Landscape Accessibility0.1461
Shopping Accessibility0.1353
Dining Accessibility0.1310
Transport Accessibility0.1071
Table 6. Ranking of the construction potential of cultural scenic spots.
Scenic AreaCultural Attractions’ Construction Potential Index
Sui Daxing Tang Chang’an City Mingde Gate Ruins Park0.516601
Temple of Heaven Ruins Park0.469791
Xi’an Municipal Museum0.460729
Qujiang Cultural and Sports Park0.454723
Muta Temple Ruins Ecology Park0.442282
China Xi’an Da Xing Shan Temple0.440346
Xi’an Botanical Garden0.431447
Shaanxi History Museum0.426231
Yuhua Lake0.414156
Yan Nan Park0.408174
Tang City Ruins0.405815
Qin Ershi Mausoleum Heritage Park0.388034
Black Dragon Temple0.372119
Great Tang All Day Mall0.370929
Great Wild Goose Pagoda0.365397
Tang Paradise0.334912
Qujiang Pool Relic Park0.334375
Duyi Site Park0.307381
Yanming Lake0.306988
China Tang Garden0.305866
Dahan Shanglin Garden (Du Ling)0.224825
Disclaimer/Publisher’s Note: The statements, opinions and data contained in all publications are solely those of the individual author(s) and contributor(s) and not of MDPI and/or the editor(s). MDPI and/or the editor(s) disclaim responsibility for any injury to people or property resulting from any ideas, methods, instructions or products referred to in the content.

