Abstract
Intercity railways are key transportation infrastructures in the interconnection of urban agglomerations. Their stations are usually distributed based on densely populated and economically active areas, and they also play roles as regional network nodes, intra-city nodes, and functional areas. However, the academic research on the spatial development of station areas is still very limited. In particular, there is no sufficient in-depth discussion about the coordinated development mechanism of the “regional node-place” and “urban node-place” of intercity railways. Based on the case study of Guangdong–Hong Kong–Macao Greater Bay Area in China (GBA), this paper provides an in-depth analysis of the regional node development level, urban node development level, station area development level, comprehensive station area development level, and coordinated development of “regional node-place” and “urban node-place” in the GBA in 2012, 2016, 2020, and 2023 by constructing a node-place model, development index of regional nodes, development level index, and coupling coordination degree model. Findings: (1) From 2012 to 2023, the development of regional nodes, urban nodes, and places of the GBA intercity railway saw a significant improvement, with the proportion of high-value stations increasing by 13.3%, 7%, and 8.8%, respectively. Despite some improvement on the whole, the three still exhibited an unbalanced spatial distribution of “high in the middle-low in the periphery”; (2) The relative gap in development levels between “regional node-place” and “urban node-place” of intercity railways decreased by 0.159 and 0.168, respectively, showing an overall upward trend, but still showing an unbalanced spatial distribution of “high in the middle-low in the periphery”; (3) The development level of regional nodes and urban nodes is lower than that of areas and is dominated by the unbalance place and dependence types, while the unbalance node and balance types account for less; (4) The coordination of the “regional node-place” and “urban node-place” of intercity railways is gradually improved, and the stations with high coordination and high coordination levels accounts for an increased proportion from 4% to 7% and 8%, respectively. However, the coordination remains at a low level on the whole, with most sites still in the low-level coupling and lower-level coupling stages. Some stations in Guangzhou, Shenzhen, Foshan, and Dongguan have witnessed a level leap and are showing a transition towards a medium to high level of coordinated development, with the surrounding areas moving away from low-level coupling and coordination.
1. Introduction
1.1. Background
As an important component of railway transportation and a crucial bridge connecting urban agglomerations, intercity railways are an important transportation infrastructure that support the coordinated development of urban agglomerations. With the accelerated process of regional integration, the global intercity railway has grown rapidly. It not only effectively enhances economic ties and personnel flow within and between urban agglomerations, but also becomes an important tool to connect cities, promote economic exchanges, and shorten the time and space distance [1,2]. Therefore, urban agglomerations around the world generally drive urban social and economic development by railway construction [3]. For example, the rail transit system in the Tokyo metropolitan area consists of JR and private railways, with a total length of 2,368 km, accounting for 76% of the total rail mileage in the metropolitan area, covering Tokyo and its surrounding areas [4,5]. The Greater Bay Area (GBA) has a total length of 575 km of intercity railway lines in operation, and it is expected that the railway network in operation and under construction will reach 5700 km by 2035, covering 100% of cities at or above the county level [6]. The sound intercity railway network has significantly improved regional accessibility and effectively guided the spatial layout of the city’s population and economy [7]. Therefore, intercity railway stations, as key nodes connecting cities and regions and enhancing the comprehensive benefits of cities, are catalysts for promoting the agglomeration and improvement of urban functions [8]. As a result, the development of intercity railway station areas has attracted more attention.
The development of intercity railway station areas plays a crucial role in promoting the integration of urban agglomerations and coordinated regional development. However, it still faces many difficulties and challenges in the actual construction. First of all, despite the continuous process of the construction of intercity railway stations, the connection with the metro, bus, and other urban transportation systems is still not in place, which is characterized by inconvenient transfer and poor traffic flow. The backward state affects the travel experience of passengers and restricts the overall benefit of railway stations [1]. Secondly, some stations are located in areas with a small population and economic scale, resulting in insufficient station vitality and less passenger flow, which affects the overall benefit and development potential of intercity railway stations [9]. In addition, although the intercity railway stations in some areas have attracted a certain passenger flow volume, its actual development has not reached the desired result as planned due to the lack of complete facilities and the unbalanced development of nodes and places [10]. Given the different location environments of intercity railway stations, there are significant differences in their impacts on the development of station areas. Therefore, it is of great significance to scientifically evaluate the coordination relationship between intercity railway station area nodes and place development to guide the planning and construction of intercity railway station area.
1.2. Literature Review
1.2.1. The Impact of Railway Construction on the Development of Station Areas
The distribution of railway stations largely caters to the real needs of urban spatial expansion and facilitates the concentration of station development factors. Railway stations, as important catalysts for urban development, help increase their economic potential and location value [11,12]. The academic community mainly focuses on the following three points regarding the impact of railway on the development of station areas. The first is the impact of railway construction on the spatial reconstruction of station area functions. As important catalysts of urban spatial development strategy, stations attract all elements to gather around them, promoting the multifunctional mixing of station areas and thus having a significant impact on the functional spatial reconstruction of the station area [13]. With the agglomeration of elements, the railway station area has gradually developed into a multi-functional agglomeration area integrating business offices, commercial services, leisure, and entertainment, thus giving rise to a new city center or sub-center [14,15,16]. Therefore, the station area is expected to evolve into a new core node for urban spatial development under the influence of railway construction [17,18]. The second is the impact of railway construction on land use in station areas. Transportation construction and land development are in dynamic interaction. The development and utilization of railway station areas is of great significance for the intensive and economical development of urban space and efficient land use [19]. Against the background of the rapid development of railway, scholars at home and abroad have conducted studies on land use efficiency around railway stations, the impact of railway on land use structure, land development along railway lines, and the effects of the railway and land development [20,21,22]. It is widely recognized in the academic community that the railway has a profound impact on the nature of land use, the intensity of land development, and the spatial pattern of land use in station areas, and accelerates the high-density development of land [23,24]. It is the result of influencing the allocation of production factors and the state of land use [25]. The third is the impact of railway construction on the development of nodes and places in station areas. Most of the studies available focus on the impact of railway construction on the development of nodes and places in railway station location, construction scale, passenger flow, accessibility, and industrial composition. Cummings and Su studied the connection between the location of intercity stations and the development of the station area, finding that a better station location has a positive impact on the quality of a areas [26,27]. Wang et al. found that the industry volume in the station area showed a decreasing trend with increasing distance, and the station with a poor location advantage had a worse industrial structure in the station area [15]. Amparo et al., based on the study on the potential of Spanish high-speed rail network configurations, found that the service level of nodes and places in station areas varied greatly with different network nodes [28]. David introduced the dimension of urban design from the perspective of transportation integration to evaluate the spatial development of Lisbon Station [29]. Cummings took into account station accessibility, station location, and location, and analyzed their impact on the ridership of Amtrak Station [26].
1.2.2. Evaluation Indicators for Node-Place
Foreign scholars started to study the evaluation of station area node-place development earlier, and most of the studies were based on the node-place model (NP) and transit-oriented development (TOD) proposed by Bertolini in 1999 to construct the index system for coordinated evaluation of station area nodes and places [30,31]. Two dimensions are involved in the study: one is the evaluation of node and place development and coordination in station areas, with focus on the transportation value of the nodes and the functional value of the places, mainly focusing on how station areas achieve a balance between the two [3,32]; the second is the evaluation of the performance and quality of the comprehensive spatial development in station areas. For the first dimension, most of the existing studies focus on the two attributes of transportation and function and construct the indicator system from the functional dimensions of transportation stations and urban places. The evaluation was initially based on the 3D principles of “Density”, “Diversity”, and “Design” [33]. Later, “Distance to Transit” and “Destination Accessibility” were added to form the 5D evaluation principle from the perspectives of transportation connectivity and pedestrian travel [34,35]. With the accelerated urbanization process, considerations of transportation modes, environmental quality, and socio-economic factors have been added to the evaluation system. Particular attention is attached to land use, transportation patterns, environmental quality, economic benefits, and social sustainability in the station area [36], with the evaluation dimensions covering station, station area, and region. At the station level, the evaluation indicators involve train departure frequency, number of accessible stations, transportation connectivity, station accessibility, and location for the comprehensive measurement of the infrastructure services at a station [14,37]. Indicators at the station level focus on functional composition, such as population size, industry distribution, activity intensity, land use diversity, and functional share, designed to evaluate the comprehensive development potential and vitality of the station area [38,39]. At the regional level, a variety of perspectives are considered for evaluation indicators such as site network accessibility, urban development level, service level, and network centrality to fully capture the status and influence of the station on a larger regional scale [7,9,40]. For the second dimension, the space in the station area is taken as a whole, and a comprehensive evaluation is conducted from the perspectives of built environment, population characteristics, and spatial performance. For example, Lyu and other scholars conducted a comprehensive evaluation of the built environment of the station area from 94 indicators in the three dimensions of “Transit”, “Development”, and “Oriented” [41]. Sung, Higgins, and other scholars revealed the influence of the correlation between indicators of transit supply services, land use, street network, and urban design on the quality of passenger services in the built environment of station areas [42,43]. Studies on the spatio-temporal behavior, population flow, and built environment of the site have been carried out based on POI data [44], mobile phone signaling and GPS track data [45], and social media check-in data [37,46] with the popularization of big data and new technologies, providing a new perspective and method for the evaluation of the development of the station area.
1.2.3. Quantification of Characteristics of Node-Place
The node-place model is a widely recognized method for evaluating and classifying the potential of transportation hubs and has been applied by scholars to evaluate the development of transportation hubs and their surrounding areas. For example, scholars both at home and abroad have conducted studies based on the node-place model to assess the node value and the place value of station areas [47,48], to evaluate the integration of station transportation and land use [19], and to measure the development potential of railway stations [49]. Some scholars have gradually realized its limitations with the increasing application of the node-location model [50,51]. Therefore, third dimension evaluation elements were introduced to the node-place model, such as node-function-place [27], node-function-design [29], node-function-industry [16], and node-function-accessibility [26], leading to a more complete evaluation system for node and place development in station areas. Influenced by the trend of integrated development, scholars have included TOD in the node-place model, integrating the indicators of different dimensions into a comprehensive value for evaluation. Under the influence of the concept of integrated development, scholars have integrated multiple dimensions of indicators into a comprehensive index based on the characteristics of TOD on the basis of the node-place model so as to evaluate the development potential, development quality, and coordinated development level of the station area [16,36,52]. For example, Singh constructed eight calculation criteria of the TOD index and evaluated the development performance of nodes and places in Dutch cities [53]. Sara constructed a TOD status index and potential index to evaluate and identify the development level of Egypt’s TOD region and potential region and determined the priority of TOD construction [54]. Sun summarized the global station development evaluation methods and stated that TOD index station area development factors can be taken into full account for comprehensive evaluation and classification of the development level and development quality in station areas [55]. Scholars have been exploring new assessment tools in recent years based on related research methods such as node-place model and TOD. Gu and Song evaluated the spatial evolution and development performance of node and place functions by cluster analysis, regression analysis, and accessibility analysis [56,57]. Kim constructed centrality and complexity networks to analyze the value of station development at Korean railway stations [58]. Di Matteo explored the heterogeneity of the impact of high-speed rail on the station economy in Northern Italy by means of the Propensity Score Matching Difference (PSM-DID) method [59]. A small number of scholars also conducted research using big data analytics tools. For example, Guo evaluated the efficiency of Japanese station areas based on data envelopment analysis (DEA) [60]. Ma constructed a genetic algorithm to evaluate the station area planning in Beijing for the five dimensions of rail transit ridership, compactness, accessibility, conflict level, and environmental impact [61]. Xu et al. conducted a simulation analysis of urban rail transit station areas in China using cellular automata to evaluate the impact of station areas on land development and the potential for station area implementation [62]. These studies have enriched the evaluation methods and also provided new ideas for the evaluation of station development.
The existing studies mainly focus on the in-depth discussion of industrial layouts, land use, integration of station and city, and coordinated development of nodes and places, which provide valuable data and theoretical support for the sustainable development of station area. However, they are mostly about high-speed railways and urban rail transit, especially the impact of railway construction on urban and station land use, population and economy, as well as the coordinated development of station regional nodes and places. In contrast, the innovation of this article mainly lies in the following three areas: (1) most of the existing literatures focus on the development of high-speed rail and subway station areas, with insufficient attention paid to the development of intercity railway station areas, especially the lack of in-depth exploration of the coordinated development relationship between intercity railway nodes and places; (2) this paper introduces the regional node attributes of intercity railway stations based on the node-place model and systematically explores the coordinated development relationship between “regional node-place” and “urban node-place” from the dual perspectives of regional nodes and city nodes, providing a new theoretical perspective for analyzing the impact of intercity railway construction on the spatial development of station areas; (3) this paper constructs a three-dimensional analysis framework of the “regional node-urban node-place” using the development level of intercity railway regional nodes as the third dimension of the node-place model for in-depth analysis of the coordinated development relationship between “regional node-place”, “urban node-place”, and “regional node-urban node-place” and puts forward relevant policy recommendations.
1.3. Concept Definition
This study systematically analyzes the development of intercity railway stations from the three dimensions of development level, development characteristics, and coordination level using the node-place model, development index of regional nodes, development level index, and coupling coordination degree model. The focus of the study includes evaluating the development level of regional nodes, urban nodes, and places, as well as analyzing the development characteristics and coordination level between “regional node-place” and “urban node-place”. Specifically, the development level of regional nodes mainly represents the status and development potential of intercity railway stations in the regional transportation network, showing their radiating ability and resource agglomeration effect as regional transportation hubs. The development level of urban nodes focuses on the evaluation of the functional positioning of the station in the urban internal traffic system and its connection efficiency with the city. The development level of places mainly measures the intensity of land development and utilization and the composite degree of functions in the intercity railway station area and reflects the comprehensive development and construction level of the station area. The definitions of related concepts are detailed in Table 1.

Table 1.
Concept and Definitions.
1.4. Aim and Question
Based on the above research bases and shortcomings, this paper takes the Guangdong–Hong–Kong–Macao Greater Bay Area in China as a case study and focuses on the intercity railway stations that have been opened as of 2024. It attempts to present the spatio-temporal characteristics of station area development by constructing an accessibility model, development level index, and coupling coordination model. Therefore, this paper mainly addresses the following questions: (1) What are the changes in regional node level and urban node level of intercity railway in the GBA? (2) What is the development level of station areas in the GBA? (3) What are the development characteristics and types of “regional node-place” and “urban node-place” of intercity railway? (4) What are the changes in coordination characteristics of nodes and places in station areas? This paper aims to provide a theoretical basis and practical reference for the spatial coordinated development of station areas in the GBA and other urban agglomerations.
2. Materials and Methods
2.1. Research Area and Data Collection
2.1.1. Research Area
The GBA, located in the south of mainland China, is one of the most open, economically dynamic and rapidly urbanizing regions in the country (Figure 1a). The GBA is composed of nine cities of Guangzhou, Shenzhen, Zhuhai, Foshan, Dongguan, Huizhou, Zhongshan, Jiangmen, and Zhaoqing and two special administrative regions of Hong Kong and Macao, covering a total area of 56,000 km2 (Figure 1b). Since the beginning of the 21st century, the Guangzhou–Shenzhen Intercity Railway, the first intercity railway in the GBA, has been put into operation, undertaking the transportation between Guangzhou, Dongguan, and Shenzhen. In 2012, the Guangzhou–Zhuhai Intercity railway connecting Guangzhou, Foshan, Zhongshan, and Zhuhai (Jiangmen) was put into operation, constructing a human-shaped spatial structure connecting the east and west coasts of the GBA. The intercity railway in the GBA has been built into a spatial network structure covering 9 cities by 2024 (Figure 1c). Despite the fact that the GBA enjoys greater advantages in economic output and population size than the San Francisco and Tokyo Bay Areas, the intercity railway network is still in its early stages with low density and per capita mileage, making it an urgent need to further enhance the scale of construction.
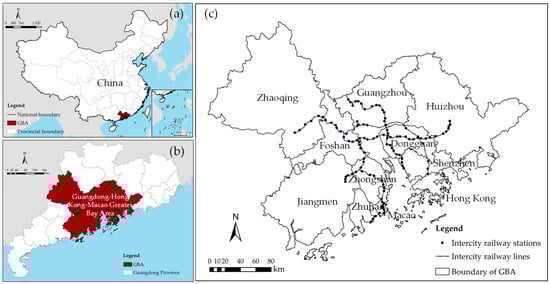
Figure 1.
Study area. (a) Study area in China; (b) study area in Guangdong; and (c) study area in the GBA. All the maps are depicted by Arcgis 10.2, which is developed by Esri China (Hong Kong) Ltd., Hong Kong, China, the same below.
2.1.2. Data Collection
The key data involved in this paper mainly include the following three types. The first is reachability calculation data. It includes data on intercity railway lines, stations, population, and economic scale, sourced from OSM, resource and environmental science data platforms, geographical information monitoring cloud platforms, and statistical yearbooks. Notably, this paper takes the 113 intercity stations that have been opened and will be opened in 2024 for study and selects 2012, 2016, 2020, and 2023 as the time nodes, given the availability of data. The second is station area data. In this paper, the station areas of the intercity railway are mainly delineated according to two points. First, railway station areas are usually arranged in a circle, with a core area within a radius of 2 or 3 km [15,65,66,67]. Some scholars found that the accessibility effect attenuates sharply within the 5 km threshold in the study of 5 km radius around the station [68,69]. Second, according to the requirements of 15~20 km station spacing stipulated in the Code for Design of Intercity Railway (TB10623-2014), and the requirements of not less than 5 km station spacing outside the central urban area stipulated in the Intercity Railway Design Rules (DB44/T 2360-2022), the coverage radius of an intercity railway station can be in the range of 2.5~10 km. Therefore, in this paper, the service radius of the intercity railway station is set to 5 km according to the characteristics of the region, and the overlapping service area is divided by the Thiessen polygon without double counting. The third is the evaluation data for the coordinated development of node places in station areas. It includes data on bus stops, subway stops, train schedules, POI, and land use, sourced from the OSM, 12306, Amap, resource and environmental science data platforms, geographical information monitoring cloud platforms, and related open source websites (Table 2).
Table 2.
Data type, feature, usage, and source.
2.2. Research Steps
This paper explores the characteristics of the coordinated spatial development of station nodes and places from three dimensions: regional nodes, urban nodes, and places (Figure 2). The study is mainly conducted in four main steps (Figure 2). Step 1 is to raise research questions, that is, to identify the deficiencies in the research field of coordinated development of station nodes and places of intercity railway through in-depth background analysis and a literature review and point out the key issues that need to be explored. Step 2 is to build index and data, which involves collecting transportation network, population, and economic data from 113 stations in the GBA and constructing a node-place evaluation index system. Step 3 is to implement research methods, which involves using a node-place model, development index of regional nodes, development level index and coupling coordination degree model, Excel 2021, Arcgis 10.2, and Origin2022 to calculate regional node level, urban node level, place level, node-place comprehensive development level, and node-place coordination degree of intercity railway. Step 4 is to conduct result analysis and discussion, i.e., to discuss the level of coordinated development of “regional node-place” and “urban node-place” by analyzing the development characteristics of regional nodes, urban nodes, and places of intercity railways and putting forward relevant policy recommendations (Figure 2).
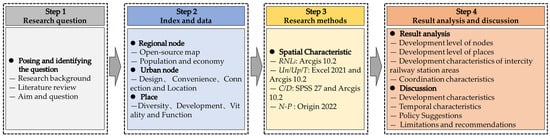
Figure 2.
Research step.
2.3. Research Methods
2.3.1. Node-Place
- (1)
- Node-Place Model (NP)
The node-place model, proposed by Bertolini, is used to measure the development level of nodes and places in the station area, and to evaluate the comprehensive development level and coordination degree of the two. Station areas are categorized into five development types of dependence, unbalance node, unbalance place, balance and stress based on the node-location model (Figure 3) [48]. Dependence indicates “dependence” stations, which are vulnerable to changes in the external environment and have a low level of node and place development. Unbalance place indicates “place-oriented” stations with a higher development level compared to nodes. On the contrary, unbalance nodes indicate “node-dominated” stations with a higher development level compared to places. Balance indicates “balance” stations, where the development of node transportation is matched with the development of place functions, presenting good coordination. Stress indicates “stress” stations, and the nodes and places of such station areas have a high level of development, but further development may cause problems in the station areas [19,31].
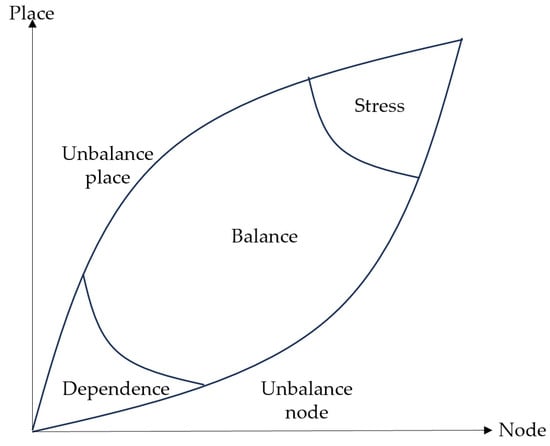
Figure 3.
The architecture of the node-place model.
- (2)
- Node-place indicators
Intercity railway stations, as the key transportation hubs connecting intercity and urban networks, play an important role in traffic connection and transfer [70]. Previous studies have shown that intercity railway stations, as nodes of the traffic network, are designed to ensure rapid passenger gathering and distribution as its core objective, which is closely related to station location, railway transportation, design scale, and transfer facility configuration [61,71]. Therefore, the connection between the intercity railway and the city must be considered in the study. The station area, as a catalyst for urban development, is closely related to land use, functional composition, and industrial distribution [15,66]. Therefore, this paper focuses on the elements of accessibility, convenience, external connectivity, location, land use, land development, place vitality, and functional vitality so as to comprehensively analyze the coordinated development of nodes and places in station areas (Table 3).
The regional node development indicates the station’s position and development potential in the network and directly relates to the operational efficiency and service quality of the whole network [72]. Since densely populated and economically active areas are usually important considerations for the establishment of intercity railway stations [63,73], this paper calculates the network accessibility of intercity railway nodes from the perspective of time and socio-economic development scale to present the development level of intercity railway regional nodes.
For the urban node development level, a well-functioning urban node should be characterized by convenient transfer and good location [67], with convenient access and seamless transfer as general reflections of its function [31,74]. Therefore, this paper constructs a node function indicator system from four dimensions of design, convenience, connection, and location. The line size is an important indicator for measuring the service capability of a station, and its assignment is based on the existing study results [16,39]. Convenience refers to how easy it is for a station to connect to other forms of transportation, and connectivity is used to measure how easy it is for a station to connect to other cities.
In terms of place development level, the influence of railway stations on station areas is not only shown in the diversity and mix of land use [30] but is also closely related to population density [75] and socio-economic activities [74]. Therefore, this paper measures the development level of station areas and places from four dimensions of land use diversity, land development, place vitality, and functional vitality of station areas to present the intensity of station functions, the uniformity of land function distribution and the land use differences, the economic intensity in the periphery, and the attractiveness of station areas to the population.
Table 3.
Evaluation indicators, formula, and description of node-place.
Table 3.
Evaluation indicators, formula, and description of node-place.
| First-Level Indicators | Second-Level Indicators | Third-Level Indicators | Formula and Description |
|---|---|---|---|
| Regional Node | Connecting Value | Regional node level (RNL) | Formula (1) and Formula (2) |
| Urban Node | Design | Station design scale (SDC) | SDC = assign values based on station track |
| Convenience | Supporting rate of subway facilities (SRSF) | SRSF = number of subway stations within 800 meters of the station (using GIS for zonal statistics as table) | |
| Supporting rate of public transportation facilities (SRPTF) | SRPTF = number of bus stops within 500 meters of the station GIS (using GIS for zonal statistics as table) | ||
| Convenience of subway connection(CSC) | CSC = subway service directions-one line service direction is assigned a value of 2 (using GIS for routes extraction and assignment) | ||
| Coordination of public transportation | The number of public transportation types connected to the station (bus, subway, taxi, ride hailing, etc.) | ||
| Connection | Train frequency | Total number of daily departures or stops of trains | |
| Location | Location index(LI) | LI = distance from the station to the city center (using GIS for location analysis) | |
| Place | Diversity | Proportion of industrial land (PIL) | PIL = Industrial land area/station area |
| Proportion of commercial land (PCL) | PCL = Commercial land area/station area | ||
| Proportion of service land (PSL) | PSL = Service land area/station area | ||
| Proportion of residential land (PRL) | PRL = Residential land area/station area | ||
| Proportion of leisure land (PLL) | PLL = Leisure land area/station area | ||
| Development | Development intensity (DI) | DI = Area of the Station area has been developed(using GIS for zonal statistics as table) | |
| Development progress (DP) | DP = Area of the Station area has been developed/station area | ||
| Vitality | Economic vitality (EV) | EV = POI density of the company and enterprise (using GIS for kernel density analysis) | |
| Population vitality (PV) | PV = POI density of residential buildings (using GIS for kernel density analysis) | ||
| Function | Functional density (FD) | FD = POI density (using GIS for kernel density analysis) | |
| Environmental Quality | Ecological quality index (EQI) | Abio-Normalization coefficient of ecological environment quality index (reference value is 494.8122); SF-Forest land index; SG-Grassland index; SW-Water and Wetland Index; SC -Cultivated land index; SB-Construction land index; SU-Unutilized land index; LA-regional land area [76] | |
| Social Equity | Fairness of public transportation station services (FPTSS) | Ti and Pi are the number of transportation stations and population scales in the station area; T and P are the number of stations and population scales of the city |
2.3.2. Development Index of Regional Nodes
Intercity railways are the main transportation carrier for commuting within urban agglomerations, and the location of their stations is usually based on population and economic dense areas [73]. Therefore, the impact of the scale of urban development on the level of regional nodes of intercity railway should not be ignored, and the level of nodes with the difference in urban scale shows obvious spatial differentiation characteristics [77,78]. Therefore, this paper takes into account the time cost and the scale of urban development and constructs the development index of regional nodes of intercity railway to better reflect their development level. The calculation is as follows:
where is the travel time from station i to station j along the intercity railway; n is the total number of intercity railway stations; with i, j = 1, 2, …, n; represents the attractiveness of station i to station j in the intercity rail network; represents the level of development of the regional node at station i; Pi represents the population size of station i; Gj represents the economic scale of station j; and ƍ is a coefficient, which is 1 in this study. A larger value of indicates a higher development level of the regional nodes of the station and vice versa.
2.3.3. Development Level Index
This paper standardizes the indicators using the range method to eliminate the impact of dimension and relies on the entropy weight method (EWM) to calculate the weight of indicators in the above table. The EWM is an objective weighting method widely used in research involving multi-criteria evaluation [79]. The development level of urban nodes and places is calculated based on standardized values and indicator weights.
where represents the standardized data of each indicator; represents the weight of each indicator in the indicator system; and represents the development level of node i of the intercity railway station or the development level of the place. A larger value of indicates a higher development level and vice versa.
2.3.4. Coupling Coordination Degree Model
Coupling means that two or more systems affect each other through interactions to achieve coordinated development. This coordination shows dynamic correlation between subsystems in a positive interaction [64]. The theory of coupling coordination is developed from coupling degree, mainly used to show the overall and synergistic effects between systems [80]. Coupling coordination degree model has been widely used in the research of railway related fields. For example, Luo, Zhuang, Zhou, Yang, Diao, and Jia studied the impact of the railway on the tourism economy, regional economic development, urban development, and spatial equity based on the coupling coordination degree model [10,81,82,83,84,85]. However, existing studies have mainly focused on the impact of HSR on regional development and the coordinated development of nodes and places in HSR and MRT station areas. Therefore, this paper constructs a comprehensive research framework from the three dimensions of the intercity railway network, stations, and functions, and tries to deeply analyze the coordinated development relationship between “regional node-place”, “urban node-place”, and “regional node-urban node-place” through the coupling coordination degree model. The calculation is as follows:
where , respectively represent the node development level and place development level of the intercity railway station area, calculated by Equation (4). represents the coupling degree, and its value is in the range of [0, 1]. A value closer to 1 indicates a higher coupling degree between the two and vice versa. represents the comprehensive development index of node and place; α and β are coefficients to be determined. This study holds that node development and place development are equally important, so it lets α = β = 0.5; represents the degree of coordination of the two systems, and its value is in the range of [0, 1]. A higher value of indicates a higher degree of coordination between the two systems. To further analyze the degree of coordination of the development of the node places, this paper, based on the studies available [86], classifies the coordination of the nodes and places into 5 types: (1) extremely high: when 0.8 < ≤ 1, the degree of coordination between the two is extremely high, i.e., it is in the ideal coordinated development; (2) high: when 0.6 < ≤ 0.8, the two have a high degree of coordination; (3) moderate: when 0.4 < ≤ 0.6, it indicates a moderate degree of coordination between the two; (4) low: when 0.2 < ≤ 0.4, it indicates a low degree of coordination between the two; (5) extremely low: when 0 ≤ ≤ 0.2, it indicates an extremely low degree of coordination between the two [87].
3. Results
3.1. Development Level of Nodes
3.1.1. Development Level of Regional Nodes
We calculated the regional node development level of intercity railways in the GBA for each year according to Equations (1) and (2) (Figure 4) using the railway, population and economic data of the GBA for the four time nodes of 2012, 2016, 2020, and 2023. In general, the regional node level of intercity railway in the GBA has enjoyed great improvement, showing a spatial change in “high in the center and low in the periphery”. It indicates that the level of intercity railway development in the central region is better than that in the surrounding areas on the whole, and the development gap between cities is narrowing and unbalanced. The regional node levels of intercity railways in the GBA in 2012 and 2016 were overall at a low level, with high value areas mainly in Guangzhou and Shenzhen. Compared to 2012, the regional node level of the Guangzhou–Foshan intercity railway changed more significantly in 2016, while other peripheral regions showed no significant changes. The regional node level of intercity railway in the core region of the GBA was further enhanced after 2016, and the surrounding areas also showed an upward trend in general, with significant increase mainly found in Guangzhou, Shenzhen, Dongguan, Foshan, Zhongshan, and Zhuhai. The year 2023 saw an unchanged and further enhanced development pattern of intercity railway regional nodes in the GBA, with the central region as the core and decreasing outward. However, the nodes in the surrounding peripheral areas are still at a relatively low level, indicating that these regions still need to receive more attention in the future development of the population and economy of the station area.
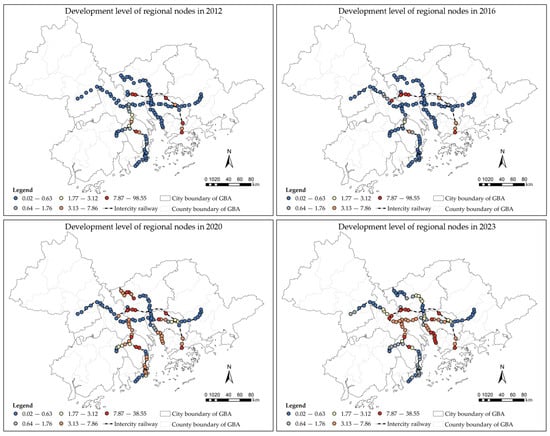
Figure 4.
Development level of regional nodes from 2012 to 2023.
3.1.2. Development Level of Urban Nodes
We used the ArcGIS 10.2 platform to calculate and visualize the development level of urban nodes in the GBA intercity railway and obtained spatial distribution maps of urban nodes for 2012, 2016, 2020, and 2023 (Figure 5). The development level of urban nodes of intercity railways in the GBA generally shows a steady rise, with significant changes found in Guangzhou–Foshan and Shenzhen–Dongguan regions, except for a prominent development imbalance between cities. According to the spatio-temporal analysis, urban nodes of intercity railways in the GBA in 2012 were at a low development level, with high-value zones mainly distributed in Guangzhou and Shenzhen, while low-value zones appeared widely in different regions. In 2016 and 2020, Guangzhou and Shenzhen saw a continued increase in the number of high-value stations, and the nodes in the surrounding areas also showed improvement in the development level, but at a low speed. The development level of urban nodes of intercity railways showed more significant changes after 2020, especially in Guangzhou, Foshan, Shenzhen, and Dongguan, characterized by the continuous increase in high-value areas and the decrease in low-value stations around. However, the peripheral regions showed smaller changes compared to the central region. It shows that the development level and facility configuration quality of intercity railway stations in the central region of the GBA are generally higher than those in the surrounding and peripheral areas, further highlighting the imbalance of regional development.
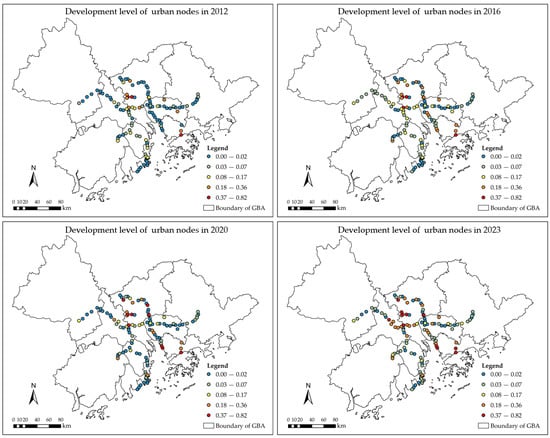
Figure 5.
Development level of urban nodes from 2012 to 2023.
3.2. Development Level of Places
By calculating the development level of station areas in the GBA, we obtained the spatial development pattern distribution map of station areas for 2012–2023 (Figure 6). From 2012 to 2023, the development level of intercity railway stations in the GBA continued to rise, and the relative gap of the development level of the places decreased from 0.488 in 2012 to 0.406 in 2023, showing a spatial distribution characteristic of “high in the middle and low in the periphery”. Despite the gradual narrowing of the relative gap in place development level within the region, there is still a significant difference between the center and the periphery, leaving enormous room for improvement. The high-value areas of place development in 2012 were mainly distributed in Guangzhou, Foshan, Shenzhen, and Zhuhai, while other regions had a low level of development. In contrast, the development level of places in station areas in 2016 showed no significant changes in general. However, after 2016, the GBA was in a stage of rapid development, with the construction of station areas accelerated significantly. The period saw an increase in the number of high values and a decrease in the number of low values in the level of development of station areas and a significant increase in the overall level of development. The relative gap in the development level of station areas in the GBA was further narrowed in 2023, with high-value stations mainly clustered in the Guangzhou–Foshan–Zhongshan–Zhuhai and Guangzhou–Dongguan–Shenzhen regions on the east and west coasts of the GBA, while low-value stations in Huizhou, Zhaoqing, and Jiangmen. The distributional feature also reveals the spatial imbalance in the development level of the intercity railway stations.
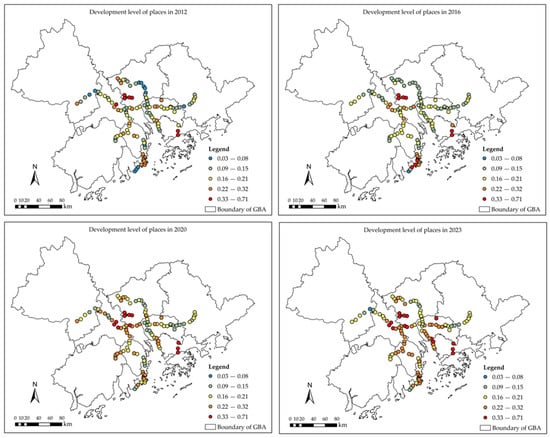
Figure 6.
Comprehensive development level of places in station areas from 2012 to 2023.
3.3. Development Characteristics of Intercity Railway Station Areas
3.3.1. Comprehensive Development Level of Intercity Railway Station Areas
This paper further discusses the development characteristics of “regional node-place” and “urban node-place” after an in-depth analysis of the development level of the regional nodes, urban nodes, and locations of the intercity railways in the GBA (Figure 7 and Figure 8). From 2012 to 2023, “regional node-place” and “urban node-place” shared similar development characteristics, with a relative development gap reduced by 0.159 and 0.168, respectively, showing an overall upward trend and forming a development pattern with Guangzhou and Shenzhen as the core to drive the surrounding areas. Specifically, in 2012, high-value areas were concentrated in Guangzhou and Shenzhen, followed by Foshan, Dongguan, Zhongshan, and Zhuhai, while Zhaoqing, Jiangmen, and Huizhou were dominated by low-value areas. The years 2016 and 2020 experienced a slight increase in the number of high-value stations in the core region of the GBA and a decrease in the number of low-value stations in the periphery in an overall pattern similar to that of 2012, with no significant change. The spatial pattern of the comprehensive development level of intercity railway station areas in 2023 showed significant changes, with high-value station areas mainly in Guangzhou, Shenzhen, Foshan, and Dongguan. In addition, the comprehensive development level of the surrounding station areas also presented an upward trend. The change implies that the enhancement of the comprehensive development level of the station areas in the GBA is not limited to the core area, but that the areas in the periphery are also gradually releasing their potentials along with the improvement of the intercity railway network, jointly pushing forward the overall development level of the region.
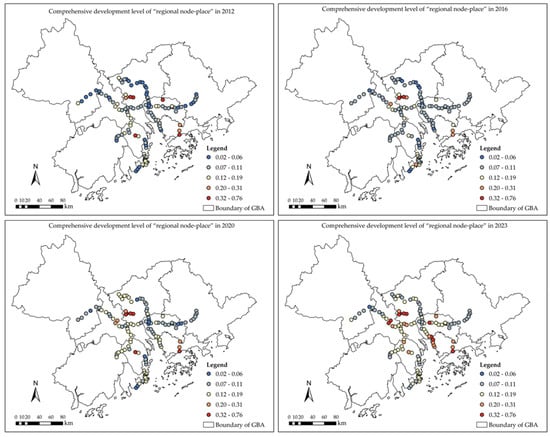
Figure 7.
Comprehensive development level of “regional node-place” from 2012 to 2023.
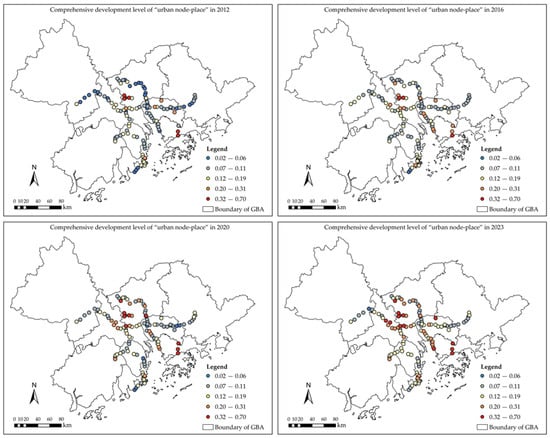
Figure 8.
Comprehensive development level of “urban node-place” from 2012 to 2023.
3.3.2. Characteristics of Development Types of Intercity Railway Station Areas
This paper further summarizes the node-place development characteristics of the station areas in the GBA in 2012, 2016, 2020, and 2023 into five types of dependence, unbalance node, unbalance place, balance and stress, according to the analysis idea of node-place model [48]. However, only four station types of dependence, unbalance node, unbalance place, and balance are available in the current intercity railway in the GBA. Figure 9 and Figure 10 presents the development relationship between intercity railway “regional node-place” and “urban node-place”. In general, from 2012 to 2023, the development level of regional nodes and urban nodes is generally lower than that of places in the GBA, mainly shown as unbalance place and dependence types, with a small proportion of unbalance node and balance types. Notably, the proportion of balance type stations has shown a steady upward trend. The development of intercity railway “regional node-place” gradually shifted from unbalance place type to dependence and balance types from 2012 to 2023, with an increase in the number of stations of balance type. In contrast, the development of intercity railway “urban node-place” showed a shift from unbalance place and dependence types to balance type, with a decrease in the number of stations of dependence type and an increase in the number of stations of the balance type.
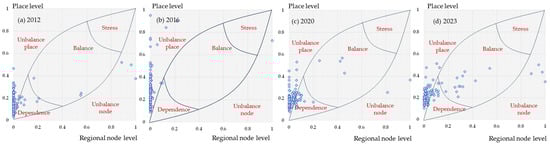
Figure 9.
Development characteristics of “regional node-place”.
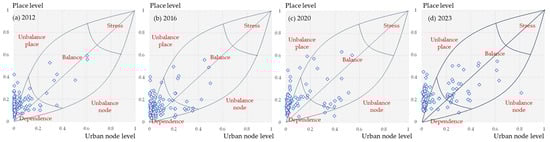
Figure 10.
Development characteristics of “urban node-place”.
3.4. The Coupling and Coordination Characteristics of Node-Place
To further analyze the spatial relationship in the coordination stage of nodes and places in intercity railway station areas, we performed a spatial visualization of the coordination degree of intercity railway “regional node-place” and “urban node-place” (Figure 11 and Figure 12). The coordination degree between “regional node-place” and “urban node-place” in the GBA showed a clear spatial differentiation pattern during the study period. The coordination level of “regional node-place” and “urban node-place” of the intercity railway in the GBA in 2023 showed a better development trend compared to 2012. Extremely low-coordination and low-coordination stations decreased by 14% and 20%, while high-coordination and extremely high-coordination sites increased by 3% and 4%, respectively. However, there were still significant differences in coordinated development between regions. The regions with a high coordination level were concentrated in Guangzhou and Shenzhen, followed by Foshan and Dongguan, with a low level of coordination in the neighboring regions. It presented a development trend with Guangzhou and Shenzhen as the core growth poles to drive Foshan and Dongguan, while constantly spreading to the surrounding areas. From the perspective of spatial changes in the coordination stage, there is little change in the coordination stage of the surrounding regions of the GBA compared with 2012, with the low-level coupling and lower-level coupling stages dominating. However, some stations in Guangzhou, Shenzhen, Foshan, and Dongguan enjoyed a level leap, mainly involving three types of changes: from low-level coupling to lower-level coupling, from lower-level coupling to general-level coupling, and from general-level coupling to higher-level coupling. The finding shows that the core region of the GBA is being characterized by a shift to a medium-high level of coordination, while the peripheral regions are gradually moving away from the low level of coordination.
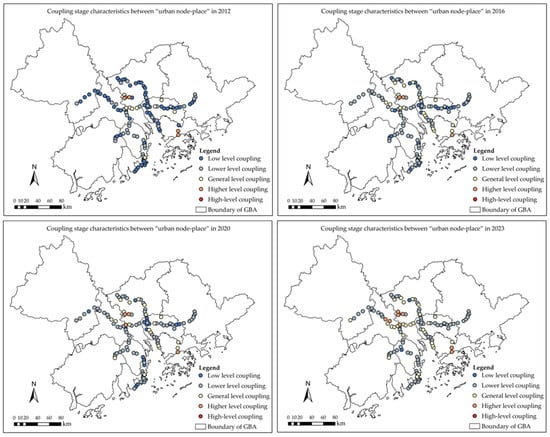
Figure 11.
The coupling and coordination characteristics of “urban node-place” from 2012 to 2023.
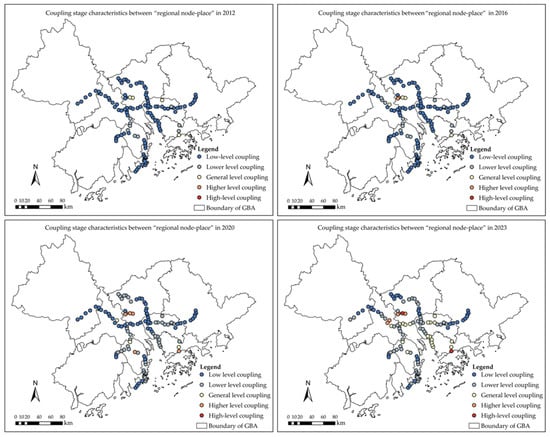
Figure 12.
The coupling and coordination characteristics of “regional node-place” from 2012 to 2023.
4. Discussion
4.1. Development Characteristics of Node-Place
In this paper, we find that the overall comprehensive spatial development level of intercity railway stations in the GBA is on the rise, but there is a prominent development imbalance with large differences between regions. The imbalance of railway station development has been found in many studies around the world. For example, Yang found in his study on the station area of the Tokyo metropolitan area that the overall development level of the stations was gradually improved, but there was a certain degree of imbalance between regions [88]. Zou constructed a node-location-industry model and found that the opening of railway improved the sustainable development potential of station areas, but most of the stations were still in unbalanced development [16]. Gui stated in the evaluation of station spatial planning that station development was related to urban scale and functional level, and the station development level exhibited regional differentiation and imbalance due to the different scale and functional level of the city [56]. Cao studied the relationship between intercity railways and the social economy in China’s Pearl River Delta and found that the improvement of the intercity railway system will help improve regional accessibility, but it may also bring more unbalanced development problems [9]. Caset argued in his study on the rapid railway network in Brussels that large-scale cross-regional rapid railway planning needs close coordination among multiple parties to gradually narrow the development imbalance between regions [72]. Ortega found in his study on train planning in Spain that factors such as accessibility and station construction types also contribute to regional differentiation and imbalance [89]. Zheng and Wang stated that the railway has made a positive contribution to development, but it has also caused certain imbalances and differentiated development characteristics [11,90]. The findings of this paper are largely in agreement with the conclusions of the above scholars, further confirming the imbalance in the spatial development of station areas.
It is found in this paper that the development of intercity railway station nodes and places in the GBA shows a good trend of steady growth, with most of the highly coordinated stations dominated by areas with good socio-economic development, while most of those with a poor development level were still at a lower level of coordination. Baghestani argued that railway stations with low comprehensive development indices are mostly in suburban New York, while those with higher indices are in central areas with better socio-economic conditions [24]. Yang stated that due to the differences in station types and development potential, the development of station areas with poor development is generally at a low level [91]. Zheng found in his study that the development of station areas is related to differences in economic development and city size, and that urban stations at a lower administrative level has a lower development level of the station area [90]. The reason is that socio-economically developed areas have better infrastructure, which is a strong guarantee for the coordinated operation of the station. In addition, better socio-economically developed areas usually have more abundant resources, including capital, technology, and talents. These resources support the efficient operation and coordinated development of the station, thus ensuring a high level of coordinated operation. For regions undeveloped, the stations face more difficulties and challenges due to lack of resources, backward infrastructure and insufficient policy support, resulting in a low level of coordination. The imbalance in regional development needs to be addressed through a variety of efforts such as preferential policies, optimization of resource allocation, and infrastructure construction.
4.2. Temporal Characteristics of Coordination Degree
From 2012 to 2023, the coordination degree between nodes and places in station areas in the GBA showed a positive development trend of steady growth. However, it was still at a low level overall, with most stations still in low-level coordination and lower-level coordination (Figure 13 and Figure 14). It indicates that the GBA still faces many challenges in the coordinated development of transportation and high-quality urban development and is far from achieving the ideal state. From the perspective of time series, the development level of nodes and places in the station areas showed a steady growth during 2012–2023, but the stations with higher-level coordination and high-level coordination accounted for less than 20%, and the coordinated development level of “regional node-place” was lower than that of “urban node-place”. In 2012, the development of the “regional node-place” and “urban node-place” of intercity railways in the GBA was dominated by a low level of coordination. It is associated with the constraints of a small urban population size, a small economic scale, and backward transportation infrastructure, and there is no favorable interaction between the intercity railways and the development of station areas [9]. In 2016, the proportion of generally coordinated and highly coordinated stations increased, but the coordinated development level of “regional node-place” was still dominated by an extremely low level, and the low development level of the “urban node-place” began to replace the extremely low development level. In 2020 and 2023, the overall development was dominated by lower-level coordination, with the number of stations with low-level coordination continuously decreasing, while the stations with general coordination, high coordination, and extremely high coordination accounted for a larger share. The intercity railway system has begun to show its network effect after its completion, not only connecting major cities but also driving the development of surrounding areas. It gradually accelerates the concentration of resources, industrial development, and functional improvement, benefiting areas that were originally lagging behind in development [7,38], thus presenting a steady growth.

Figure 13.
Temporal characteristics of coordination degree of “regional node-place”.
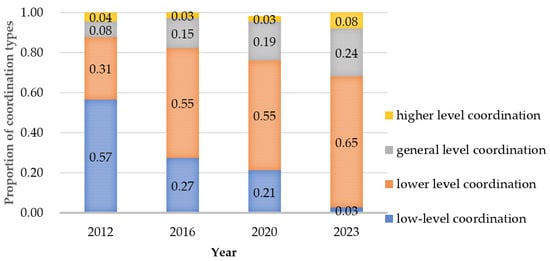
Figure 14.
Temporal characteristics of coordination degree “urban node-place”.
4.3. Policy Suggestions of Sustainable Development
On the basis of studying the coordinated development of “regional node-place” and “urban node-place”, this paper further expands the node-place model and constructs the analytical framework of “regional node-urban nodes-place” (Figure 15). In the study, we find that most of the stations are in the “low regional node level-low urban nodes level-high place level” (unbalance place) development state, with some in the dependence and unbalance node development state, and only a small number in the dependence development state. For stations of the balance type, their “regional node-place” and “urban node-place” show balanced developments. It is therefore recommended that the status quo be maintained without excessive policy intervention to avoid an unnecessary waste of resources and disruption of the existing positive development dynamics. Stations of dependence, unbalance node, and unbalance place types require intervention of some regulatory policies. For stations of dependent type, due to their low development level in regional nodes, urban nodes, and places, optimizing transportation and developing diversified functions should be the focus of policy support in the future, with introduction of new development factors to enhance the overall development level. For unbalance node stations, their development is at a low level despite good development of their nodes. Therefore, the rational development of station areas should be the focus of policy optimization to attract the concentration of development factors by promoting spatial integration, thus further stimulating the development potential of station areas.
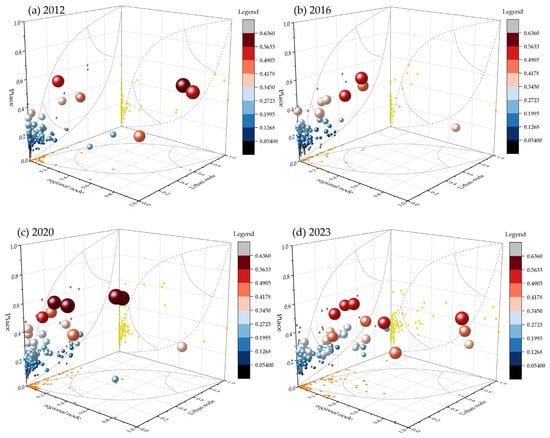
Figure 15.
Analysis diagram of “regional node-city node-place” from 2012 to 2023.
4.4. Limitations and Recommendations
This paper explores the synergistic development of regional nodes, urban nodes, and places of intercity railway to verify different characteristics of coordinated development at different times and stages of “regional node-place” and “urban node-place”, providing new support and policy basis for the coordinated and sustainable development of the intercity railway. However, this paper still has shortcomings to be further overcome. First, only a limited number of intercity railways are currently operating in the GBA, and it is necessary to include more intercity lines for analysis in the future to ensure broad applicability of the findings. Second, based on the time span of 2012–2023, this paper lacks a comparative study of station area development before the opening of the intercity railway to explore the trend of changes in the degree of coordination between “regional node-place” and “urban node-place” before and after the opening of the intercity railway. More empirical evidence needs to be added in the future. Finally, due to the limitation of data and technical means, this paper fails to take into account all indicators that can reflect the development of nodes and sites in the station area, such as building height, built environment, safety, experiencability, and population structure. To address these shortcomings, future research efforts should be made to deepen the study with the aim of providing a more comprehensive and in-depth analysis.
5. Conclusions
Intercity railways play an important supporting role in enhancing the development level of station areas and promoting the social and economic integration of urban agglomerations. In this context, this paper constructs a regional accessibility model of intercity railway stations, a development level model and a node-place coordinated development evaluation system with consideration of the time cost and the scale of urban socio-economic development based on a case study of the GBA, to analyze the regional node-development level of intercity railway in the GBA, the development level of urban nodes, the development level of stations areas, and the coordinated development of “regional node-place” and “urban node-place” from 2012 to 2023. The main findings are as follows:
(1) The development level of regional nodes, urban nodes, and places of intercity railways in the GBA shows an obvious spatial imbalance of “high in the center-low in the periphery”. From 2012 to 2023, the proportion of low-value stations decreased by 53.1%, 19.5% and 12.4%, while the proportion of high-value stations increased by 13.3%, 7% and 8.8%, respectively. They all showed an overall strengthening trend, but high value stations were still underrepresented.
(2) From 2012 to 2023, the combined development characteristics of “regional node-place” and “urban node-place” of intercity railways in the GBA showed a high degree of similarity with the relative development gap significantly decreased by 0.159 and 0.168, respectively.
(3) From 2012 to 2023, the development level of regional nodes and urban nodes of intercity railways in the GBA lagged behind that of places on the whole, mainly manifested in two development types of unbalance place and dependence. The stations of unbalanced node and balanced development types accounted for less than 20%, a low proportion.
(4) From 2012 to 2023, the stations with a high coordination level of “regional node-place” and “urban node-place” in intercity railways in the GBA were mainly in Guangzhou, Shenzhen, Foshan, and Dongguan, while the stations with a low coordination levels were concentrated in Zhaoqing, Jiangmen, Huizhou, Zhongshan, Zhuhai, and other peripheral areas. During the study period, the proportion of extremely low coordination and low coordination level stations decreased from 93% and 88% to 79% and 68%, while the proportion of high coordination and high coordination level stations increased from 4% to 7% and 8%, respectively. While the level of coordination steadily improved overall, it remained low.
(5) By expanding the analytical idea of “regional node- urban node -place” of the node-place model, this paper divides the development of 113 stations into different policy zonings and puts forward corresponding development proposals, with the aim of providing theoretical support and policy references for the coordinated and sustainable development of the intercity railway stations in the GBA.
Author Contributions
Conceptualization, Shuaibing Zhang; methodology, Shuaibing Zhang, Kaixu Zhao and Zhengdong Huang; software, Zhengdong Huang and Shuaibing Zhang; validation, Shuaibing Zhang and Zhengdong Huang; formal analysis, Shuaibing Zhang and Kaixu Zhao; investigation, Shuaibing Zhang and Kaixu Zhao; resources, Shuaibing Zhang and Zhengdong Huang; data curation, Shuaibing Zhang; writing—original draft preparation, Shuaibing Zhang and Zhengdong Huang; writing—review and editing, Shuaibing Zhang and Kaixu Zhao; visualization, Shuaibing Zhang and Zhengdong Huang; supervision, Shuaibing Zhang and Kaixu Zhao; project administration, Shuaibing Zhang; funding, Shuaibing Zhang. All authors have read and agreed to the published version of the manuscript.
Funding
This paper is funded by the Major Program of the National Social Science Foundation of China (No. 21&ZD107).
Data Availability Statement
Most of this paper’s data are acquired from OSM, Railway 12306 official website, Gaode Map’s official website and related open-source websites, readers can access them through the website of https://download.geofabrik.de/asia.html; https://data.cnki.net/yearBook/single?id=N2021010034; https://www.12306.cn/index/; https://ditu.amap.com/ (accessed on 1 September 2024); The transportation network data mainly comes from OSM and related open-source websites (https://download.geofabrik.de/asia.html) (accessed on 1 September 2024).
Conflicts of Interest
The authors declare no conflicts of interest.
References
- Jin, F.; Wang, C.; Cao, Y.; Cao, X.; Wang, J.; Dai, T.; Jiao, J. Progress of research on transportation geography in China. J. Geogr. Sci. 2016, 26, 1067–1080. [Google Scholar] [CrossRef]
- Huang, Z.D.; Michael, B.; Ye, J.A.; Chen, J.; Shi, W.Z.; Guo, R.Z. Synergy of Mega-City Clusters: Progress and Pathway. Geomat. World 2021, 28, 5–14. [Google Scholar] [CrossRef]
- Xu, Y.F.; Wang, D.G. Research progress and prospects of high-speed rail effects on urban spatial structure in China. Prog. Geogr. 2018, 37, 60–74. [Google Scholar] [CrossRef]
- Gao, Y.; Cui, X.; Sun, X. Land Use Characteristics of Commuter Rail Station Areas and Their Impact on Station Ridership: A Case Study of Japan Railways in the Tokyo Metropolitan Area. Land 2024, 13, 2045. [Google Scholar] [CrossRef]
- Hua, Z.; Li, C. The Enlightenment of the Development of Rail Transit in Tokyo Metropolitan Area to Shanghai Metropolitan Area. Shanghai Urban Manag. 2018, 27, 63–68. [Google Scholar] [CrossRef]
- National Development and Reform Commission. Reply on the Construction Plan of Intercity Railway in Guangdong-Hong Kong-Macao Greater Bay Area; National Development and Reform Commission: Beijing, China, 2020.
- Wei, S.; Wang, L. Classifying High-Speed Rail Stations in the Yangtze River Delta, China: The Node-Place Modelling Approach. Appl. Spat. Anal. Policy 2022, 16, 625–646. [Google Scholar] [CrossRef]
- Hou, X.; Zhang, W.X.; Lv, G.W.; Hu, Z.D. Study on the Influence of Regional Development around Station of HST-Taking Beijing South Station as an Example. Urban Dev. Stud. 2012, 19, 41–46. [Google Scholar] [CrossRef]
- Cao, X.S.; Li, L.N.; Wei, H. Investigating Intercity Rail Transit Scope with Social Economy Accessibility: Case Study of the Pearl River Delta Region in China. Urban Rail Transit 2017, 3, 61–71. [Google Scholar] [CrossRef]
- Diao, M.; Zhu, Y.; Zhu, J. Intra-city access to inter-city transport nodes: The implications of high-speed-rail station locations for the urban development of Chinese cities. Urban Stud. 2016, 54, 2249–2267. [Google Scholar] [CrossRef]
- Wang, F.; Liu, Z.; Xue, P.; Dang, A. High-speed railway development and its impact on urban economy and population: A case study of nine provinces along the Yellow River, China. Sustain. Cities Soc. 2022, 87, 104172. [Google Scholar] [CrossRef]
- Guo, N.N.; Yu, T. Research Pmgress and Reflection on the Spatal Effect of High-speed Raiway New Town. Mod. Urban Res. 2018, 8, 115–122. [Google Scholar] [CrossRef]
- Wang, J.X.; Lin, C.H. High-speed Rail and Its Impacts on the Urban Spatial Dynamics in China: The Background and Analytical Framework. Urban Plan. Int. 2011, 26, 16–23. [Google Scholar]
- Loo, B.P.Y.; Huang, Z. Location matters: High-speed railway (HSR) stations in city evolution. Cities 2023, 139, 104380. [Google Scholar] [CrossRef]
- Wang, S.J.; Mo, H.M.; Lv, H.N.; Xu, P.Y.; Yin, H.Q. Industrial structure of high-speed railway station areas under the influence of location: Empirical evidences from POI data. Acta Geogr. Sin. 2021, 76, 2016–2031. [Google Scholar] [CrossRef]
- Zou, Z.; Tang, Y. Evaluation of Sustainable Development Potential of High-Speed Railway Station Areas Based on “Node-Place-Industry” Model. ISPRS Int. J. Geo-Inf. 2023, 12, 349. [Google Scholar] [CrossRef]
- Yin, M.; Tang, J.; Duan, J. The Synergy of High-speed Railway Station Areas and Urban Space Development. Urban Plan. Int. 2013, 28, 70–77. [Google Scholar]
- Chen, C.L.; Hall, P. The wider spatial-economic impacts of high-speed trains: A comparative case study of Manchester and Lille sub-regions. J. Transp. Geogr. 2012, 24, 89–110. [Google Scholar] [CrossRef]
- Vale, D.S.; Viana, C.M.; Pereira, M. The extended node-place model at the local scale: Evaluating the integration of land use and transport for Lisbon’s subway network. J. Transp. Geogr. 2018, 69, 282–293. [Google Scholar] [CrossRef]
- Liu, B.K.; Feng, C.C. Research of Impact of Urban Railway Transportation on Land Use Structure Based on GIS and Information Entropy. Urban Dev. Stud. 2016, 16, 149–155. [Google Scholar] [CrossRef]
- Zhang, Y.; Cao, K.; He, Y.W.; Zhou, W. Discussion on spatial match between land use and rail transit:A case study of Shenzhern subway line 2. City Plan. Rev. 2017, 14, 107–115. [Google Scholar]
- Tan, Z.Y.; Li, S.Y.; Li, X.; Liu, X.P.; Chen, Y.M.; Li, W.X. Spatio-temporal effects of urban rail transit on complex land-use change. Acta Geogr. Sin. 2017, 72, 850–862. [Google Scholar] [CrossRef]
- Lin, X.Y. High Speed Railway and New Structure of Social-Economic Development; Social Sciences Academic Press: Beijing, China, 2017. [Google Scholar]
- Baghestani, A.; Najafabadi, S.; Salem, A.; Jiang, Z.; Tayarani, M.; Gao, O. An Application of the Node–Place Model to Explore the Land Use–Transport Development Dynamics of the I-287 Corridor. Urban Sci. 2023, 7, 21. [Google Scholar] [CrossRef]
- Yang, Y.L.; Han, S.S. Functional Integration and Strategic Planning: A Review of Studies on High-speed Rail Station and Urban Development. Urban Plan. Int. 2019, 35, 102–108. [Google Scholar] [CrossRef]
- Cummings, C.; Mahmassani, H. Does intercity rail station placement matter? Expansion of the node-place model to identify station location impacts on Amtrak ridership. J. Transp. Geogr. 2022, 99, 103278. [Google Scholar] [CrossRef]
- Su, S.L.; Zhang, H.; Wang, M.; Weng, M.; Kang, M.J. Transit-oriented development (TOD) typologies around metro station areas in urban China: A comparative analysis of five typical megacities for planning implications. J. Transp. Geogr. 2021, 90, 102939. [Google Scholar] [CrossRef]
- Moyano, A.; Martínez, H.S.; Coronado, J.M. From network to services: A comparative accessibility analysis of the Spanish high-speed rail system. Transp. Policy 2018, 63, 51–60. [Google Scholar] [CrossRef]
- Vale, D.S. Transit-oriented development, integration of land use and transport, and pedestrian accessibility: Combining node-place model with pedestrian shed ratio to evaluate and classify station areas in Lisbon. J. Transp. Geogr. 2015, 45, 70–80. [Google Scholar] [CrossRef]
- Jia, X.; Wang, J.; Yan, B. Evaluation of existing underground public space supply based on the Node-Place-Experience model. Tunn. Undergr. Space Technol. 2024, 144, 105517. [Google Scholar] [CrossRef]
- Lu, L.; Deng, H.B. Progress and Prospect of the Node-Place Model and Its Application. Sci. Geogr. Sin. 2019, 39, 12–21. [Google Scholar] [CrossRef]
- Yin, M.; Bertolini, L.; Duan, J. The effects of the high-speed railway on urban development: International experience and potential implications for China. Prog. Plan. 2015, 98, 1–52. [Google Scholar] [CrossRef]
- Liu, X.; Chen, X.H.; Pan, H.X. From “Station-City Integration” to “Corridor Integration”: TOD Framework and Model Optimization from the Perspective of Space of Flows. Urban Plan. Forum. 2024, 4, 34–40. [Google Scholar] [CrossRef]
- Deng, Y.Y.; Chang, J.; Zhuo, X. A Summary on TOD Research at Home and Abroad DuringRecent Two Decades——An Analysis Based on the Visual Analysis into CitespaceSoftware. Mod. Urban Res. 2019, 2, 41–46. [Google Scholar] [CrossRef]
- Xia, Z.W.; Zhang, Y. From “5D” to “5D+N”: Research Published in English on the Factors Influencing TOD Performance. Urban Plan. Int. 2019, 34, 109–116. [Google Scholar] [CrossRef]
- Huang, J.Z.; Cao, J.Z.; Wan, K. Development of the TOD Theory and Future Research Prospects in the New Technological Environment. Urban Plan. Forum 2023, 2, 40–46. [Google Scholar] [CrossRef]
- Groenendijk, L.; Rezaei, J.; Correia, G. Incorporating the travellers’ experience value in assessing the quality of transit nodes: A Rotterdam case study. Case Stud. Transp. Policy 2018, 6, 564–576. [Google Scholar] [CrossRef]
- Du, J.; Druta, O.; Van Wesemael, P. Place quality in high-speed rail station areas: Concept definition. J. Transp. Land Use 2021, 14, 1165–1186. [Google Scholar] [CrossRef]
- Li, P.Y.; Ge, Y.S. Evaluating Sustainable Development of High-Speed Railway Station Areas via Node-Place Model: A Case Study of Beijing-Shanghai High-Speed Railway Stations. Urban Transp. China 2022, 20, 59–66+82. [Google Scholar] [CrossRef]
- Ortuño-Padilla, A.; Espinosa-Flor, A.; Cerdán-Aznar, L. Development strategies at station areas in southwestern China: The case of Mianyang city. Land Use Policy 2017, 68, 660–670. [Google Scholar] [CrossRef]
- Lyu, G.; Bertolini, L.; Pfeffer, K. Developing a TOD typology for Beijing metro station areas. J. Transp. Geogr. 2016, 55, 40–50. [Google Scholar] [CrossRef]
- Sung, H.; Oh, J.T. Transit-oriented development in a high-density city: Identifying its association with transit ridership in Seoul, Korea. Cities 2011, 28, 70–82. [Google Scholar] [CrossRef]
- Higgins, C.D.; Kanaroglou, P.S. A latent class method for classifying and evaluating the performance of station area transit-oriented development in the Toronto region. J. Transp. Geogr. 2016, 52, 61–72. [Google Scholar] [CrossRef]
- Hu, S.; He, Z.; Wu, L.; Yin, L.; Xu, Y.; Cui, H. A framework for extracting urban functional regions based on multiprototype word embeddings using points-of-interest data. Comput. Environ. Urban Syst. 2020, 80, 101442. [Google Scholar] [CrossRef]
- Shaw, S.L.; Tsou, M.H.; Ye, X.Y. Editorial: Human dynamics in the mobile and big data era. Int. J. Geogr. Inf. Sci. 2016, 30, 1687–1693. [Google Scholar] [CrossRef]
- Shan, Z.R.; An, Y.H.; Yuan, M.; Huang, Y.P. Study on Spatial and Temporal Distribution Characteristics and Influencing Factors of Urban Residents’ Sentiment Based on Weibo Data: A Case Study of the Main Urban Area of Wuhan. Urban Dev. Stud. 2022, 29, 69–76+62. [Google Scholar] [CrossRef]
- Pezeshknejad, P.; Monajem, S.; Mozafari, H. Evaluating sustainability and land use integration of BRT stations via extended node place model, an application on BRT stations of Tehran. J. Transp. Geogr. 2020, 82, 102626. [Google Scholar] [CrossRef]
- Bertolini, L. Nodes and Places: Complexities of railway station redevelopment. Eur. Plan. Stud. 1996, 4, 331–345. [Google Scholar] [CrossRef]
- Zou, Z.J.; He, Z.; Chen, H.H. Evaluating the development potential of areas surrounding high-speed railway stations: An empirical analysis for Wuhan—Guangzhou passenger corridor line. J. Railw. Sci. Eng. 2016, 13, 2125–2132. [Google Scholar] [CrossRef]
- Phani Kumar, P.; Ravi Sekhar, C.; Parida, M. Identification of neighborhood typology for potential transit-oriented development. Transp. Res. Part D Transp. Environ. 2020, 78, 102186. [Google Scholar] [CrossRef]
- Ibraeva, A.; Correia, G.H.D.A.; Silva, C.; Antunes, A.P. Transit-oriented development: A review of research achievements and challenges. Transp. Res. Part A Policy Pract. 2020, 132, 110–130. [Google Scholar] [CrossRef]
- Zhang, Y.; Song, R.; Van Nes, R.; He, S.; Yin, W. Identifying Urban Structure Based on Transit-Oriented Development. Sustainability 2019, 11, 7241. [Google Scholar] [CrossRef]
- Singh, Y.J.; Lukman, A.; Flacke, J.; Zuidgeest, M.; Van Maarseveen, M.F.A.M. Measuring TOD around transit nodes—Towards TOD policy. Transp. Policy 2017, 56, 96–111. [Google Scholar] [CrossRef]
- Ibrahim, S.M.; Ayad, H.M.; Turki, E.A.; Saadallah, D.M. Measuring Transit-Oriented Development (TOD) levels: Prioritize potential areas for TOD in Alexandria, Egypt using GIS-Spatial Multi-Criteria based model. Alex. Eng. J. 2023, 67, 241–255. [Google Scholar] [CrossRef]
- Sun, Y.; Han, B.; Lu, F. An Overview of TOD Level Assessment Around Rail Transit Stations. Urban Rail Transit 2024, 10, 1–12. [Google Scholar] [CrossRef]
- Gui, W.Z.; Zhang, X.; Wang, A. Research on spatial planning evaluation of Beijing Shanghai high speed railway station based on node-place model. J. Intell. Fuzzy Syst. 2021, 40, 733–743. [Google Scholar] [CrossRef]
- Song, W.J.; Shi, Y.J.; Zhu, J.; Zhang, W.X.; Ding, J.X. Evaluation on Planning of High-Speed Rail Station Area Based on Node-Place Model in Yangtze River Delta Area. Econ. Geogr. 2016, 36, 18–25+38. [Google Scholar] [CrossRef]
- Kim, J.S.; Shin, N. Planning for Railway Station Network Sustainability Based on Node–Place Analysis of Local Stations. Sustainability 2021, 13, 4778. [Google Scholar] [CrossRef]
- Di Matteo, D.; Mariotti, I.; Rossi, F. Transport infrastructure and economic performance: An evaluation of the Milan-Bologna high-speed rail corridor. Socio-Econ. Plan. Sci. 2023, 85, 101304. [Google Scholar] [CrossRef]
- Guo, J.; Nakamura, F.; Li, Q.; Zhou, Y. Efficiency Assessment of Transit-Oriented Development by Data Envelopment Analysis: Case Study on the Den-en Toshi Line in Japan. J. Adv. Transp. 2018, 2018, 6701484. [Google Scholar] [CrossRef]
- Ma, X.; Chen, X.; Li, X.; Ding, C.; Wang, Y. Sustainable station-level planning: An integrated transport and land use design model for transit-oriented development. J. Clean. Prod. 2018, 170, 1052–1063. [Google Scholar] [CrossRef]
- Xu, W.A.; Guthrie, A.; Fan, Y.; Li, Y. Transit-oriented development: Literature review and evaluation of TOD potential across 50 Chinese cities. J. Transp. Land Use 2017, 10, 743–762. [Google Scholar] [CrossRef]
- Deng, L.K.; Shi, Y.L.; Zhang, H.; Wang, Y.F. Research on spatial network of intercity railway station in urban agglomeration. Urban Dev. Stud. 2017, 24, 74–70+99. [Google Scholar]
- Guo, X.Y.; Mu, X.Q.; Ding, Z.S.; Ming, Q.Z. The coordination pattern of tourism efficiency and high-speed transportation: A case study of 41 cities in the Yangtze River Delta. Geogr. Res. 2021, 40, 1042–1063. [Google Scholar] [CrossRef]
- Cao, Y.; Yu, L.; Li, S.T. Spatial evolution of high-speed railway station areas and planning response. City Plan. Rev. 2020, 44, 88–96. [Google Scholar]
- Wang, L.; Cao, Y.H.; Liu, K.W.; Wang, C. Spatial Distribution and Clusters of Industry Nearby High-speed Rail Station: The case of Nanjing Station, Shanghai-Nanjing Motor Train. Sci. Geogr. Sin. 2012, 32, 301–307. [Google Scholar] [CrossRef]
- Zhou, W.Z.; Yang, J.Q. Space development mechanism of transit-oriented inter-city railway station area. City Plan. Rev. 2010, 34, 88–92. [Google Scholar]
- Wang, X.; Liu, J.; Zhang, W. How Does the Spatial Structure of High-Speed Rail Station Areas Evolve? A Case Study of Zhengzhou East Railway Station, China. Appl. Sci. 2021, 11, 11132. [Google Scholar] [CrossRef]
- Pan, H.Z.; Cong, C.; Zhang, X.L.; Zhang, Y.N. How do high-speed rail projects affect the agglomeration in cities and regions? Transp. Res. Part D Transp. Environ. 2020, 88, 102561. [Google Scholar] [CrossRef]
- Wang, J.; Lu, H.P.; Zeng, J. Integrated transfer system of hign-speed rail hub based on sustainable transfer. City Plan. Rev. 2014, 38, 71–77. [Google Scholar] [CrossRef]
- Duan, J.; Yin, M. Study on the relationship between planning layout of high-speed railway stations and transfer space convenient level: An empirical study of Yangtze River Delta Region. City Plan. Rev. 2014, 38, 44–50. [Google Scholar] [CrossRef]
- Caset, F.; Vale, D.S.; Viana, C.M. Measuring the Accessibility of Railway Stations in the Brussels Regional Express Network: A Node-Place Modeling Approach. Netw. Spat. Econ. 2018, 18, 495–530. [Google Scholar] [CrossRef]
- Li, Q.; Xu, Z. Guidance and reaction of inter-city railway on spatial development in urban agglomerations: A study on the regional transportation support in Ningbo Urban Development Strategy 2030. City Plan. Rev. 2012, 36, 92–96. [Google Scholar]
- Monajem, S.; Ekram Nosratian, F. The evaluation of the spatial integration of station areas via the node place model; an application to subway station areas in Tehran. Transp. Res. Part D Transp. Environ. 2015, 40, 14–27. [Google Scholar] [CrossRef]
- Zemp, S.; Stauffacher, M.; Lang, D.J.; Scholz, R.W. Classifying railway stations for strategic transport and land use planning: Context matters! J. Transp. Geogr. 2011, 19, 670–679. [Google Scholar] [CrossRef]
- Ministry of Ecology and Environment of the People’s Republic of China. Regional Ecological Quality Evaluation Method; Ministry of Ecology and Environment of the People’s Republic of China: Beijing, China, 2021.
- Gutiérrez, J.; Condeço-Melhorado, A.; Martín, J.C. Using accessibility indicators and GIS to assess spatial spillovers of transport infrastructure investment. J. Transp. Geogr. 2010, 18, 141–152. [Google Scholar] [CrossRef]
- He, X.Z.; Guo, X.C.; Zhang, X.H. High-speed Rail Passenger Distributing Patterns and Development Strategies. Urban Transp. China 2014, 12, 41–47. [Google Scholar] [CrossRef]
- Liu, Y.Y.; Wang, S.Q.; Wang, X.B. Flood risk assessment in Bangladesh, India and Myanmar based on the AHP weight method and entropy weight methodel. Geogr. Res. 2020, 39, 1892–1906. [Google Scholar] [CrossRef]
- Wang, D.G.; Sun, F. Geographic Patterns and Coupling-coordination Between Urbanization and Land Transportation Accessibility in the Yangtze River Economic Zone. Sci. Geogr. Sin. 2018, 38, 1089–1097. [Google Scholar] [CrossRef]
- Luo, Z.; Xu, A.; Gao, S. Research on the Coupling Coordination Relationship Between Tourism Carrying Capacity and the High-Speed Railway Network: A Case Study in China. IEEE Access 2023, 11, 20426–20444. [Google Scholar] [CrossRef]
- Zhuang, S.; Xia, N.; Gao, X.; Zhao, X.; Liang, J.; Wang, Z.; Li, M. Coupling coordination analysis between railway transport accessibility and tourism economic connection during 2010–2019: A case study of the Yangtze River Delta. Res. Transp. Bus. Manag. 2024, 55, 101134. [Google Scholar] [CrossRef]
- Zou, M.; Li, C.; Xiong, Y. Analysis of Coupling Coordination Relationship between the Accessibility and Economic Linkage of a High-Speed Railway Network Case Study in Hunan, China. Sustainability 2022, 14, 7550. [Google Scholar] [CrossRef]
- Yang, J.; Guo, A.; Li, X.; Huang, T. Study of the Impact of a High-Speed Railway Opening on China’s Accessibility Pattern and Spatial Equality. Sustainability 2018, 10, 2943. [Google Scholar] [CrossRef]
- Jia, S.; Zhou, C.; Qin, C. No difference in effect of high-speed rail on regional economic growth based on match effect perspective? Transp. Res. Part A Policy Pract. 2017, 106, 144–157. [Google Scholar] [CrossRef]
- Liu, H.; Zhang, Y.; Zheng, S.W. Evaluation on spatio temporal development and interaction of intensive urban land use and urbanization:Case studies of the cities in the Bohai Rim Region. Geogr. Res. 2011, 30, 1805–1817. [Google Scholar] [CrossRef]
- Teng, L.; Zhong, C.J.; Cai, D. Study on the Spatial Type Differentiation of Guangzhou Metro TOD Zones: Based on “Node-Place-Linkage” Coupling Model. Econ. Geogr. 2022, 42, 103–111. [Google Scholar] [CrossRef]
- Yang, W.; Yan, W.; Chen, L.; Li, H. From city center to suburbs: Developing a timeline-based TOD assessment model to explore the dynamic changes in station areas of Tokyo metropolitan area. Environ. Plan. B: Urban Anal. City Sci. 2024, 52, 214–230. [Google Scholar] [CrossRef]
- Ortega, E.; López, E.; Monzón, A. Territorial cohesion impacts of high-speed rail at different planning levels. J. Transp. Geogr. 2012, 24, 130–141. [Google Scholar] [CrossRef]
- Zheng, W.; Wei, S. A ‘node-place-network-city’ framework to examine HSR station area development dynamics: Station typologies and development strategies. J. Transp. Geogr. 2024, 120, 103993. [Google Scholar] [CrossRef]
- Yang, Y.; Zhong, C.; Gao, Q.L. An extended node-place model for comparative studies of transit-oriented development. Transp. Res. Part D Transp. Environ. 2022, 113, 103514. [Google Scholar] [CrossRef]
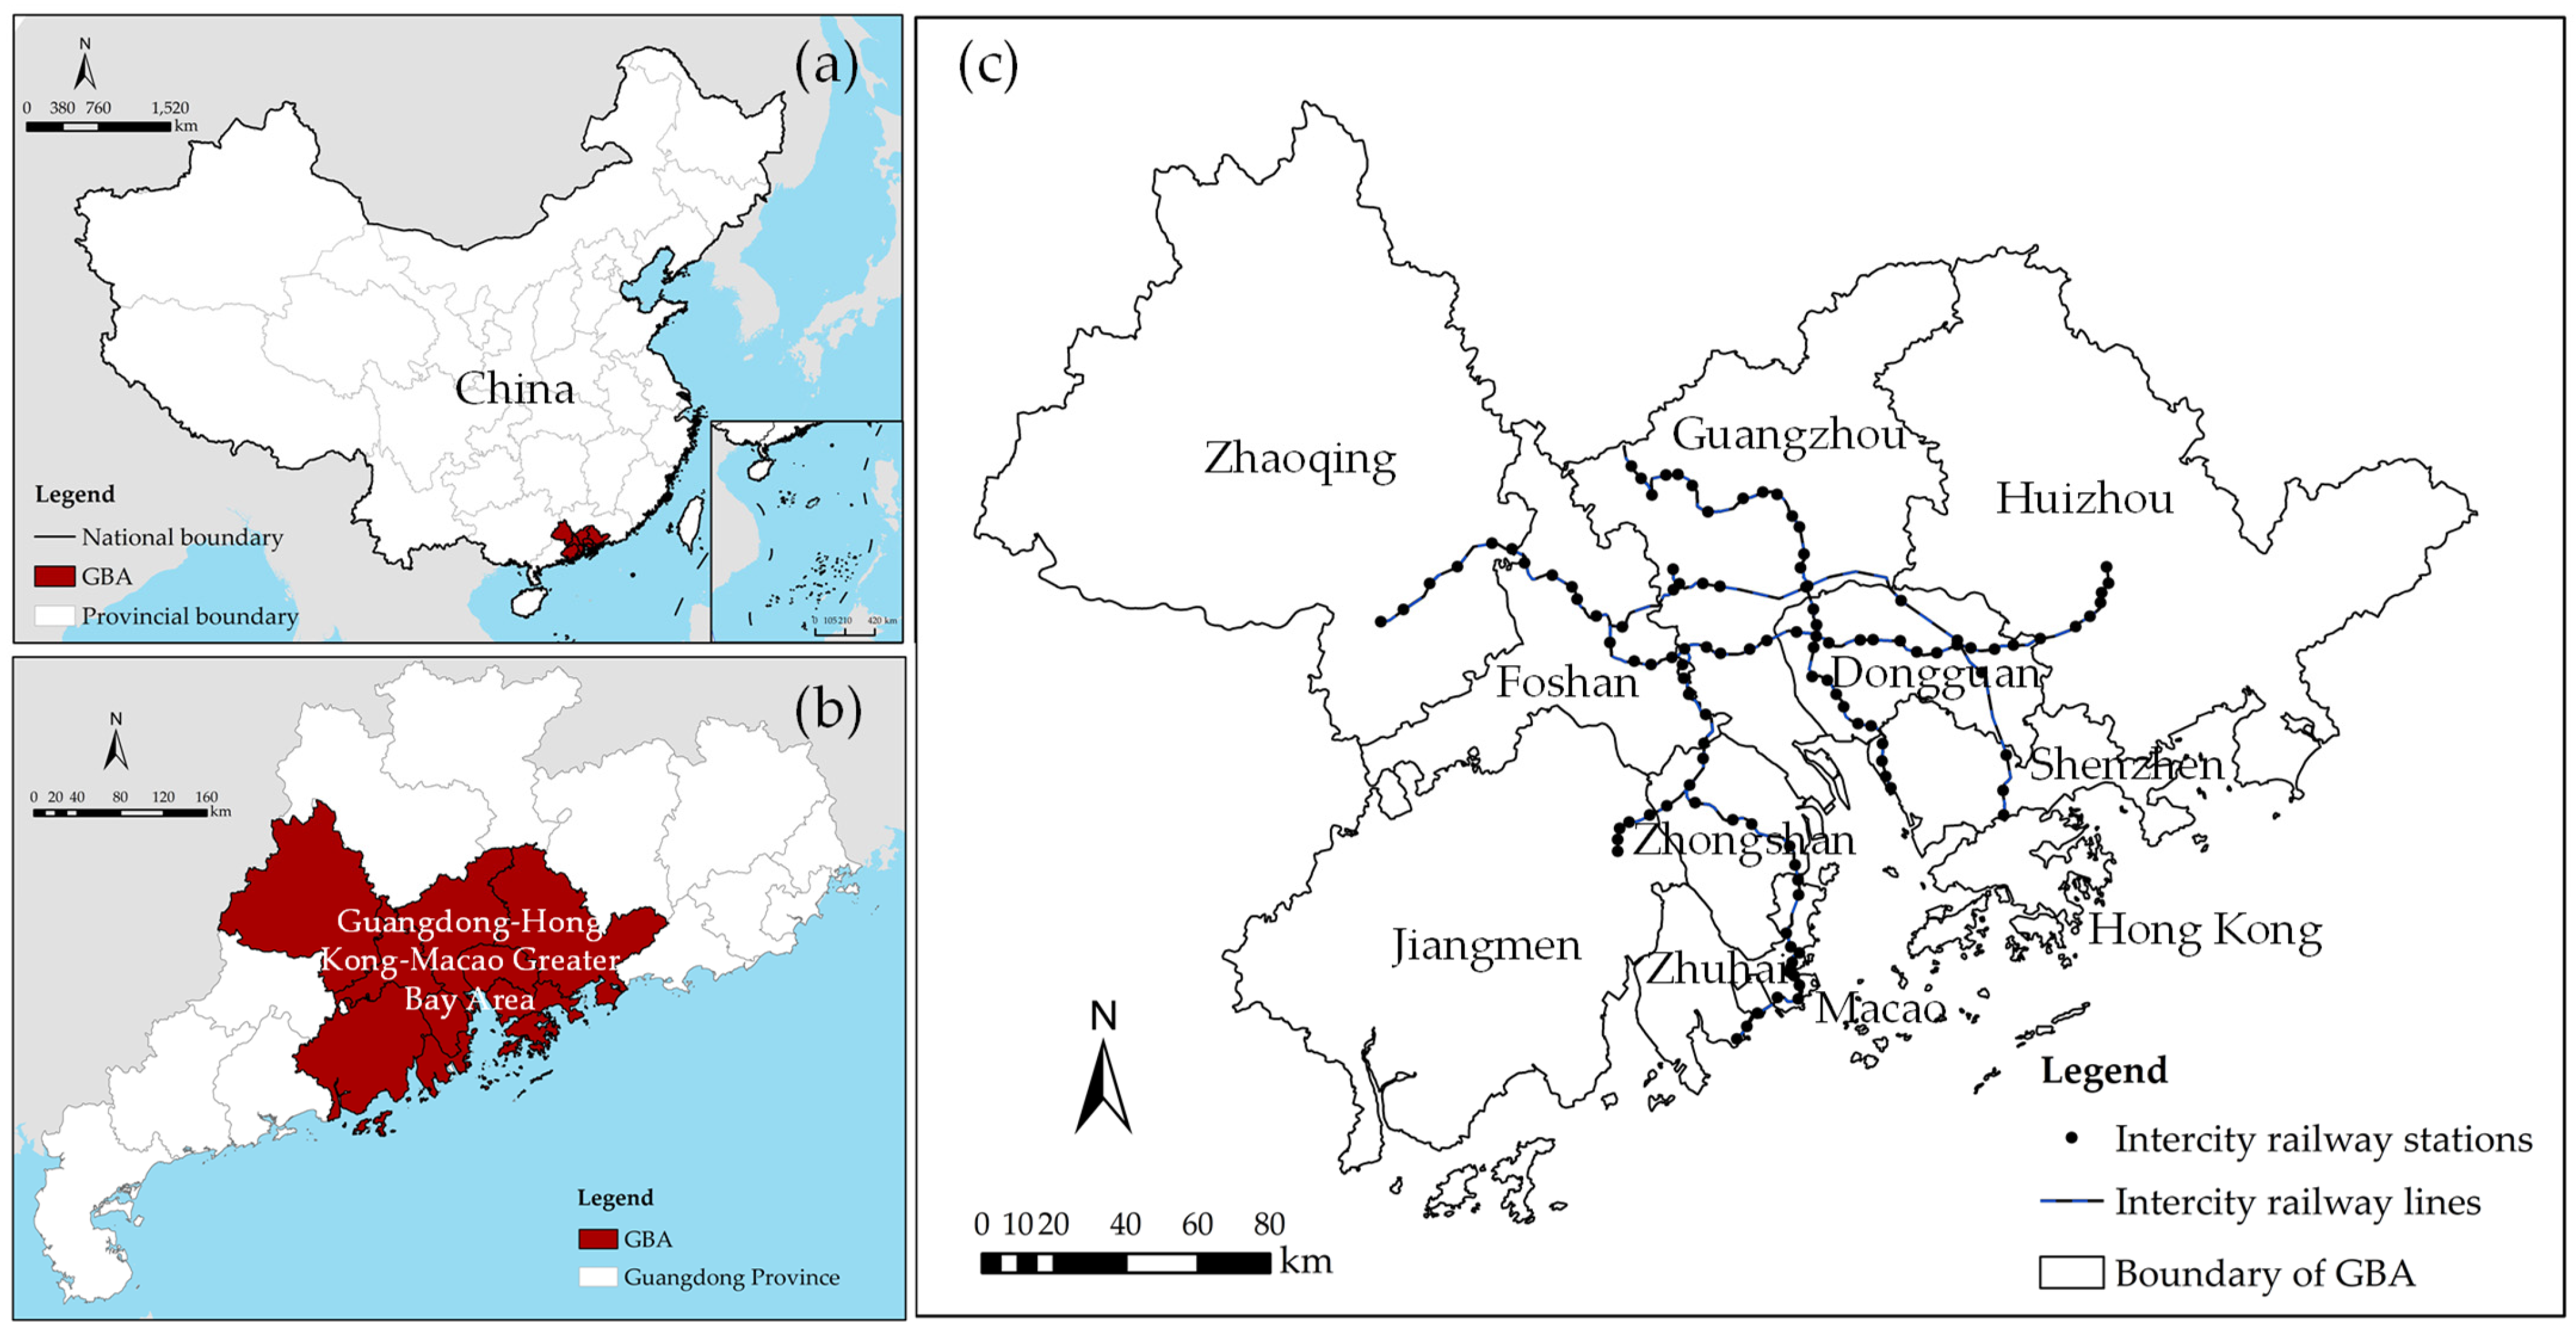
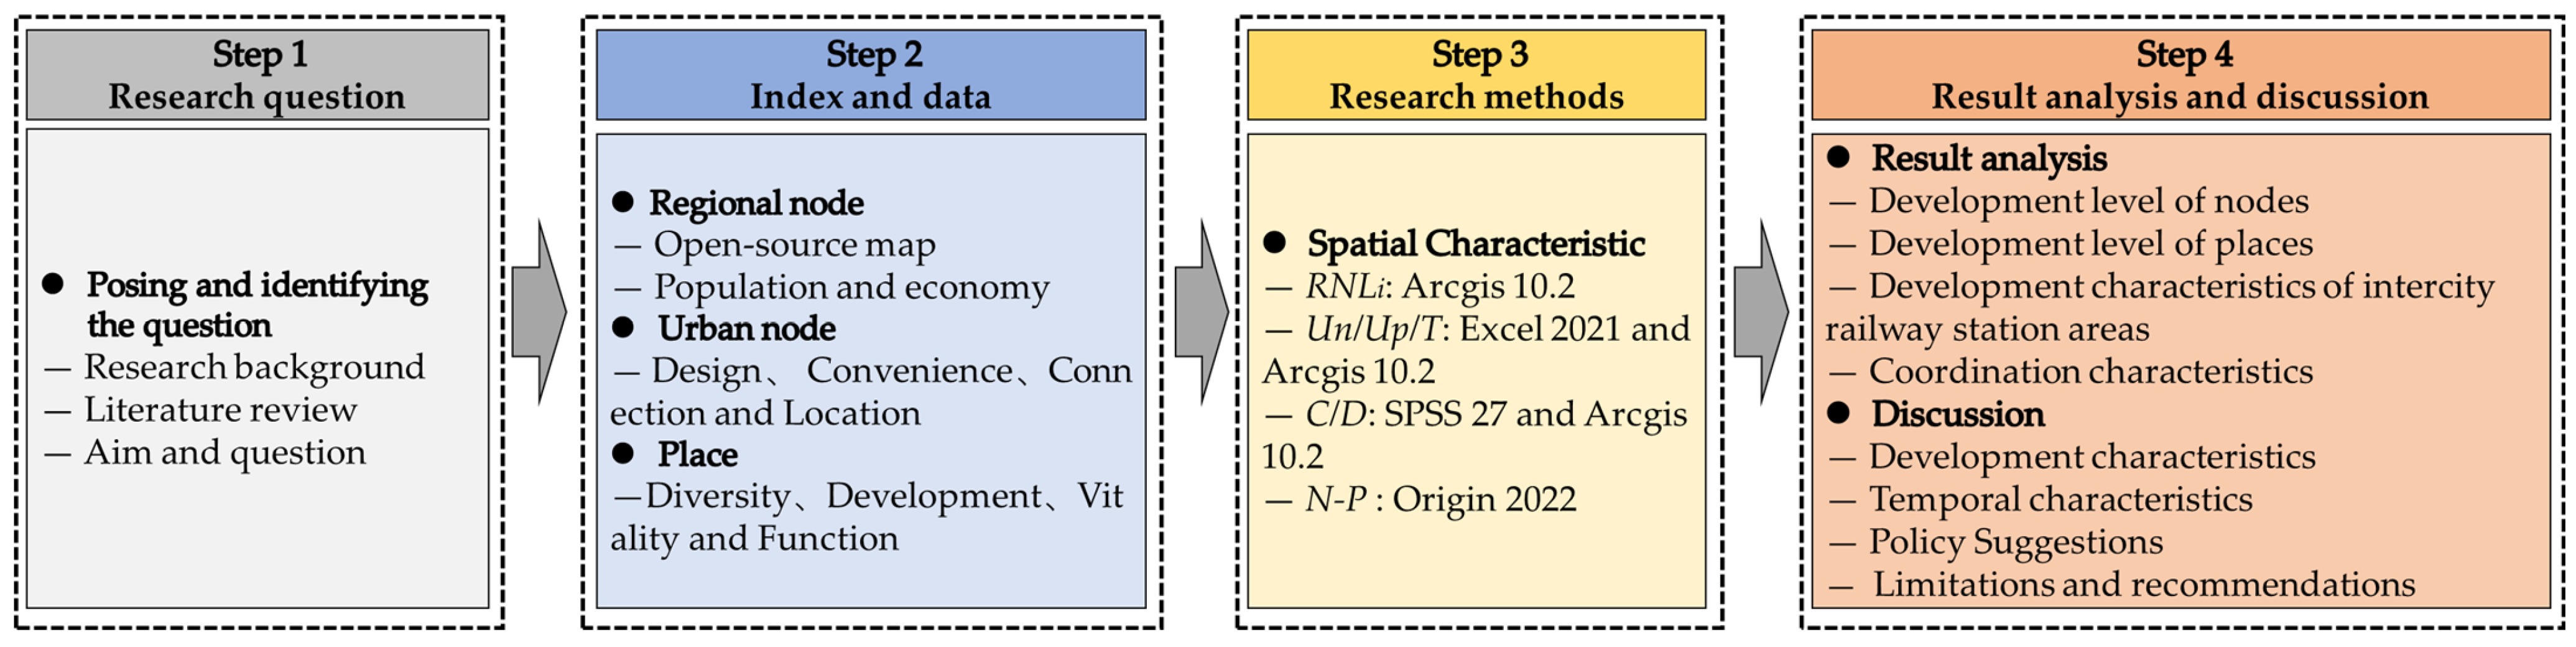
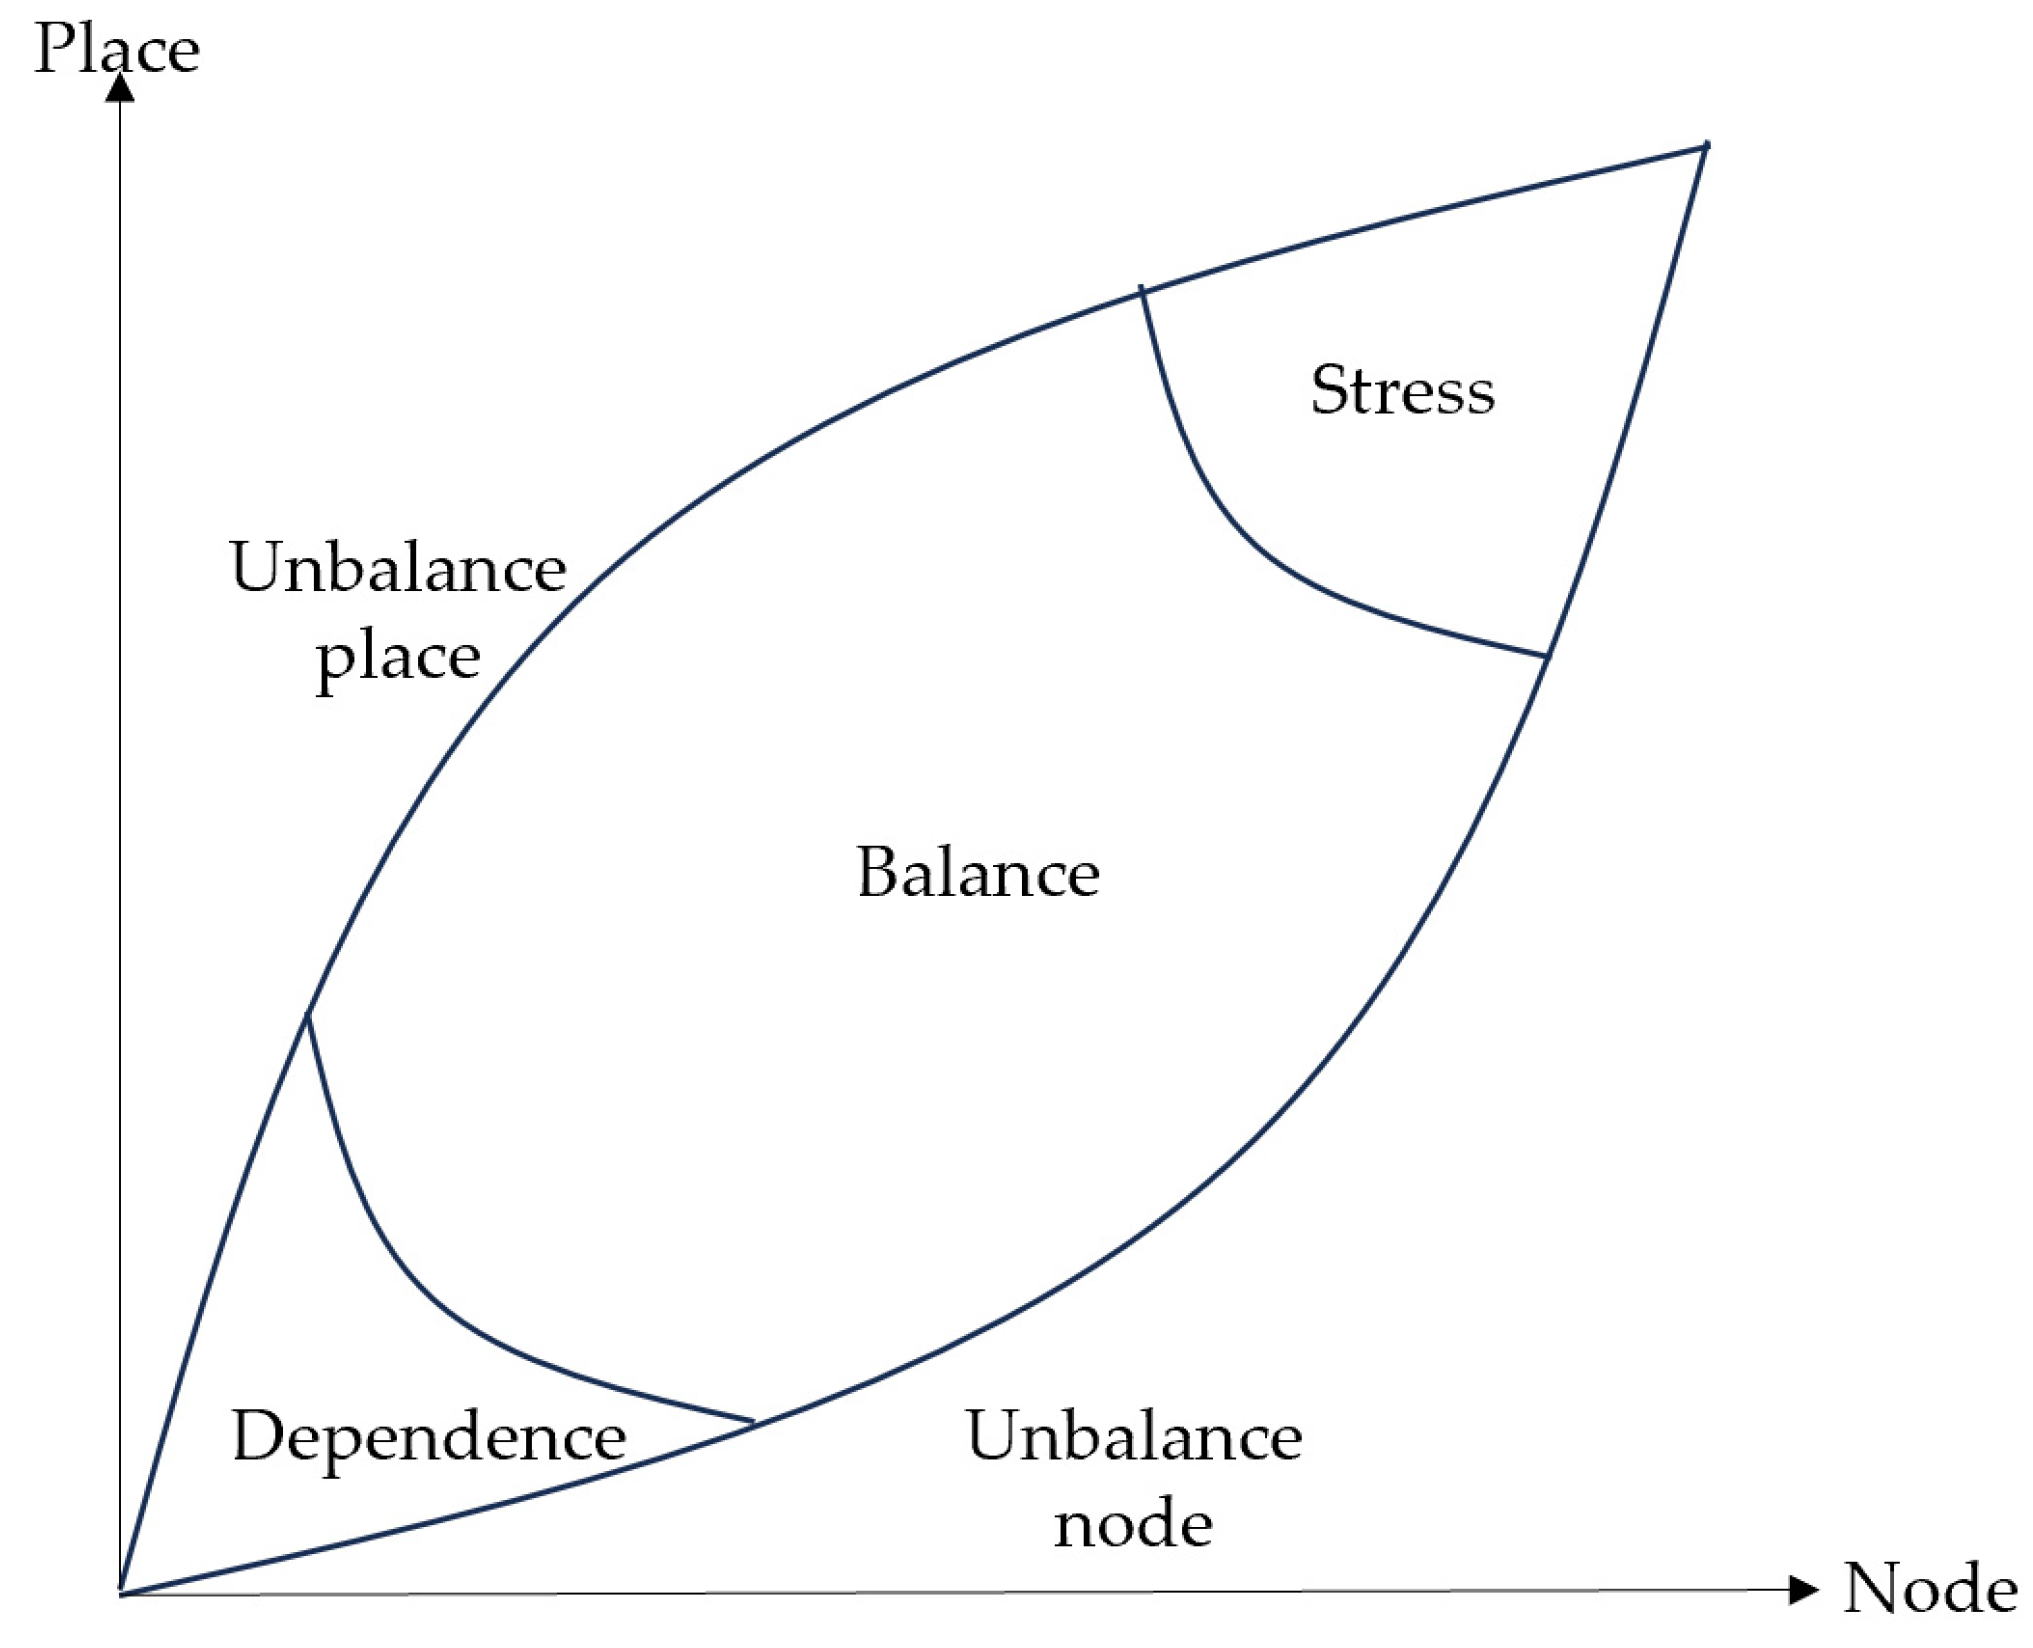
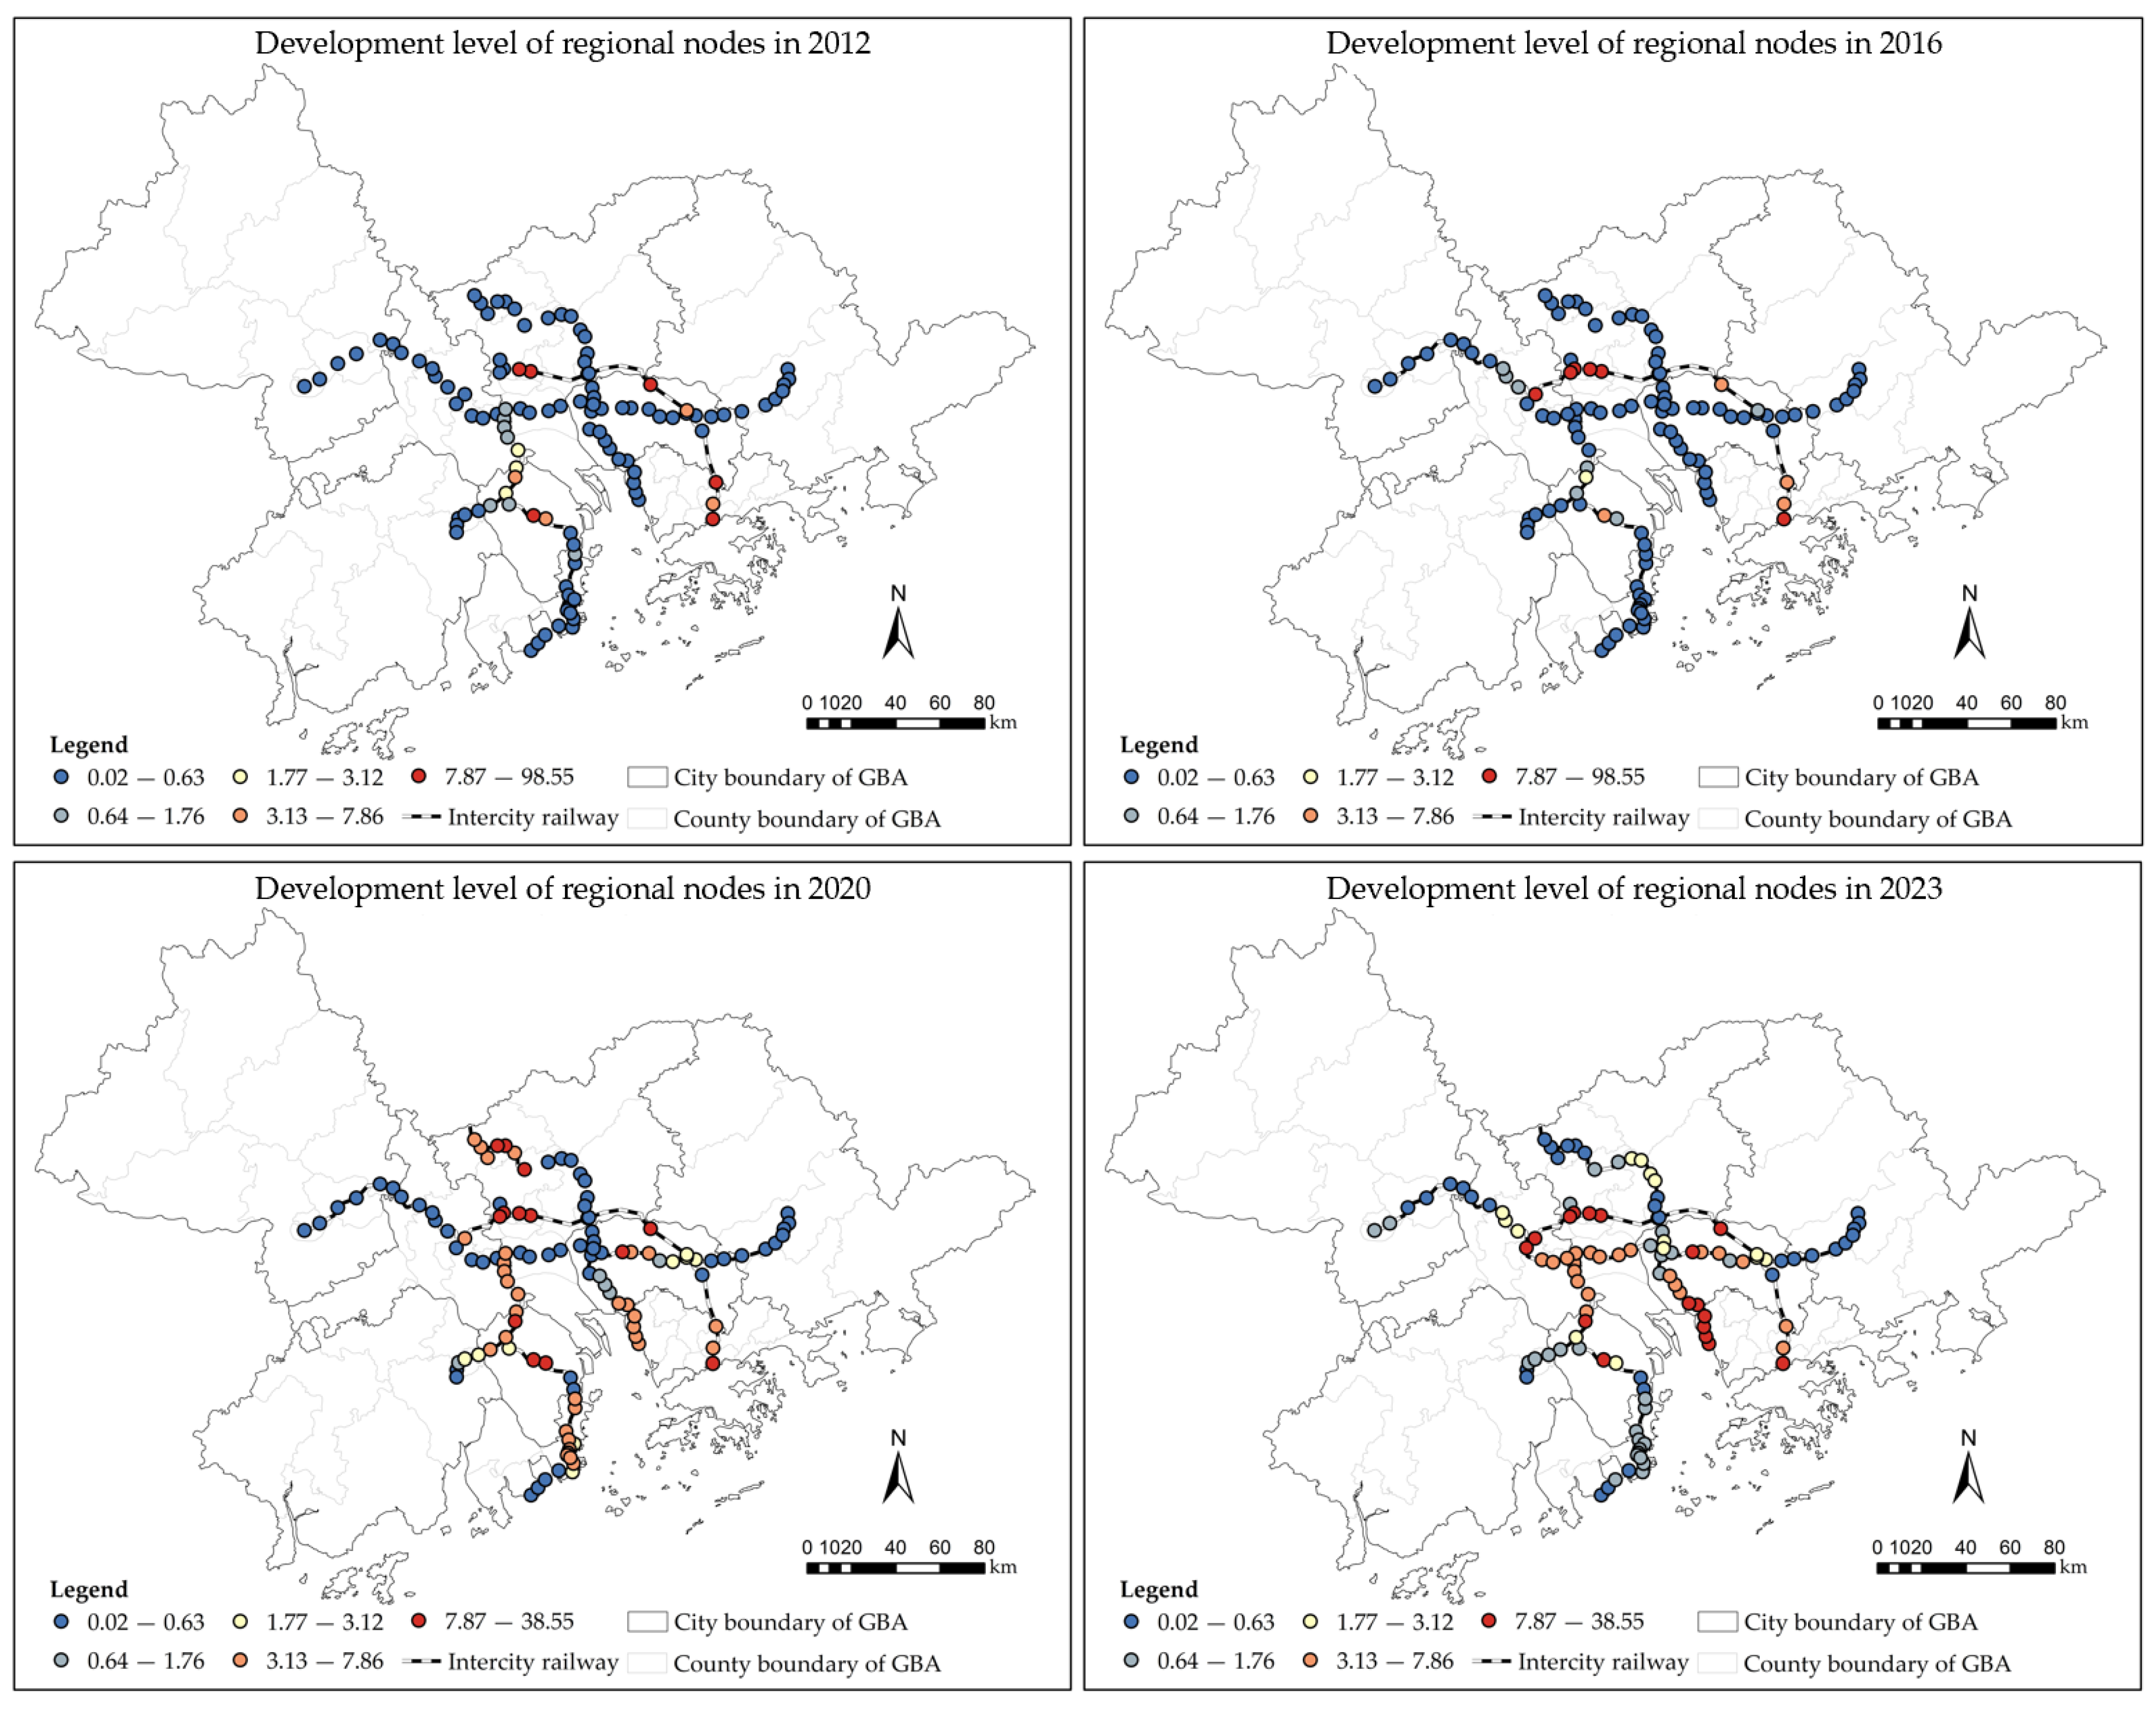
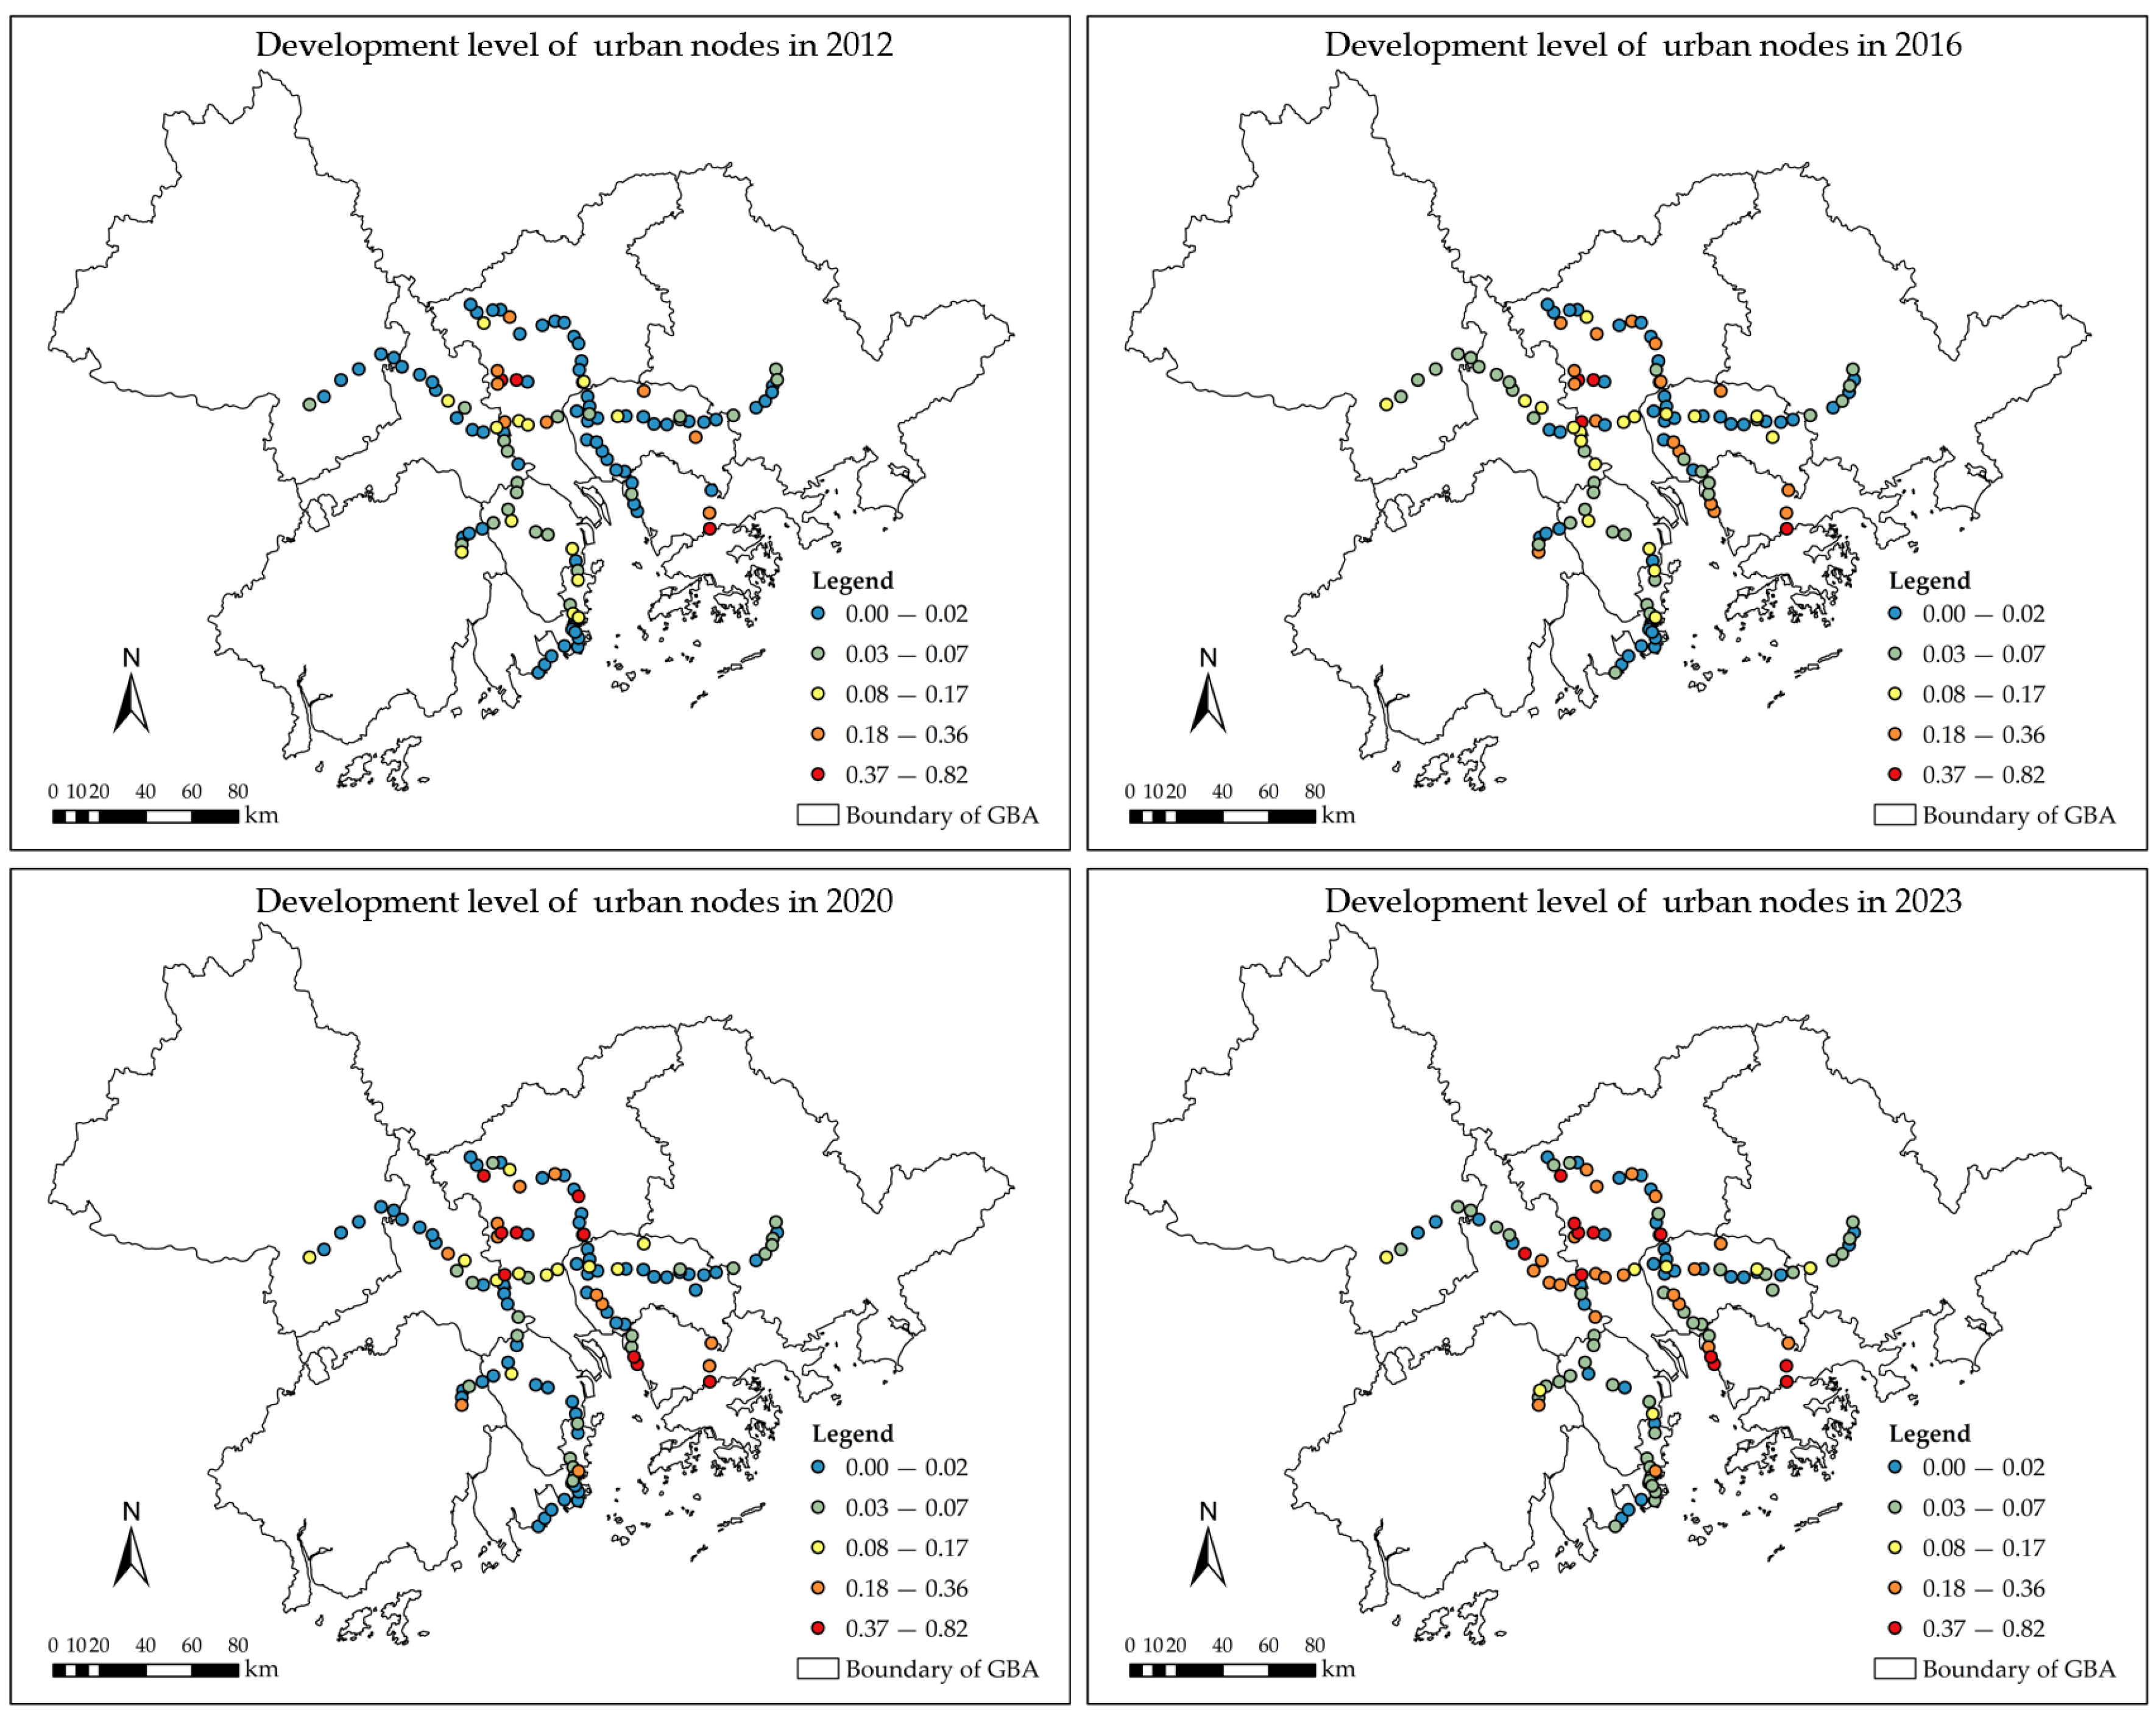
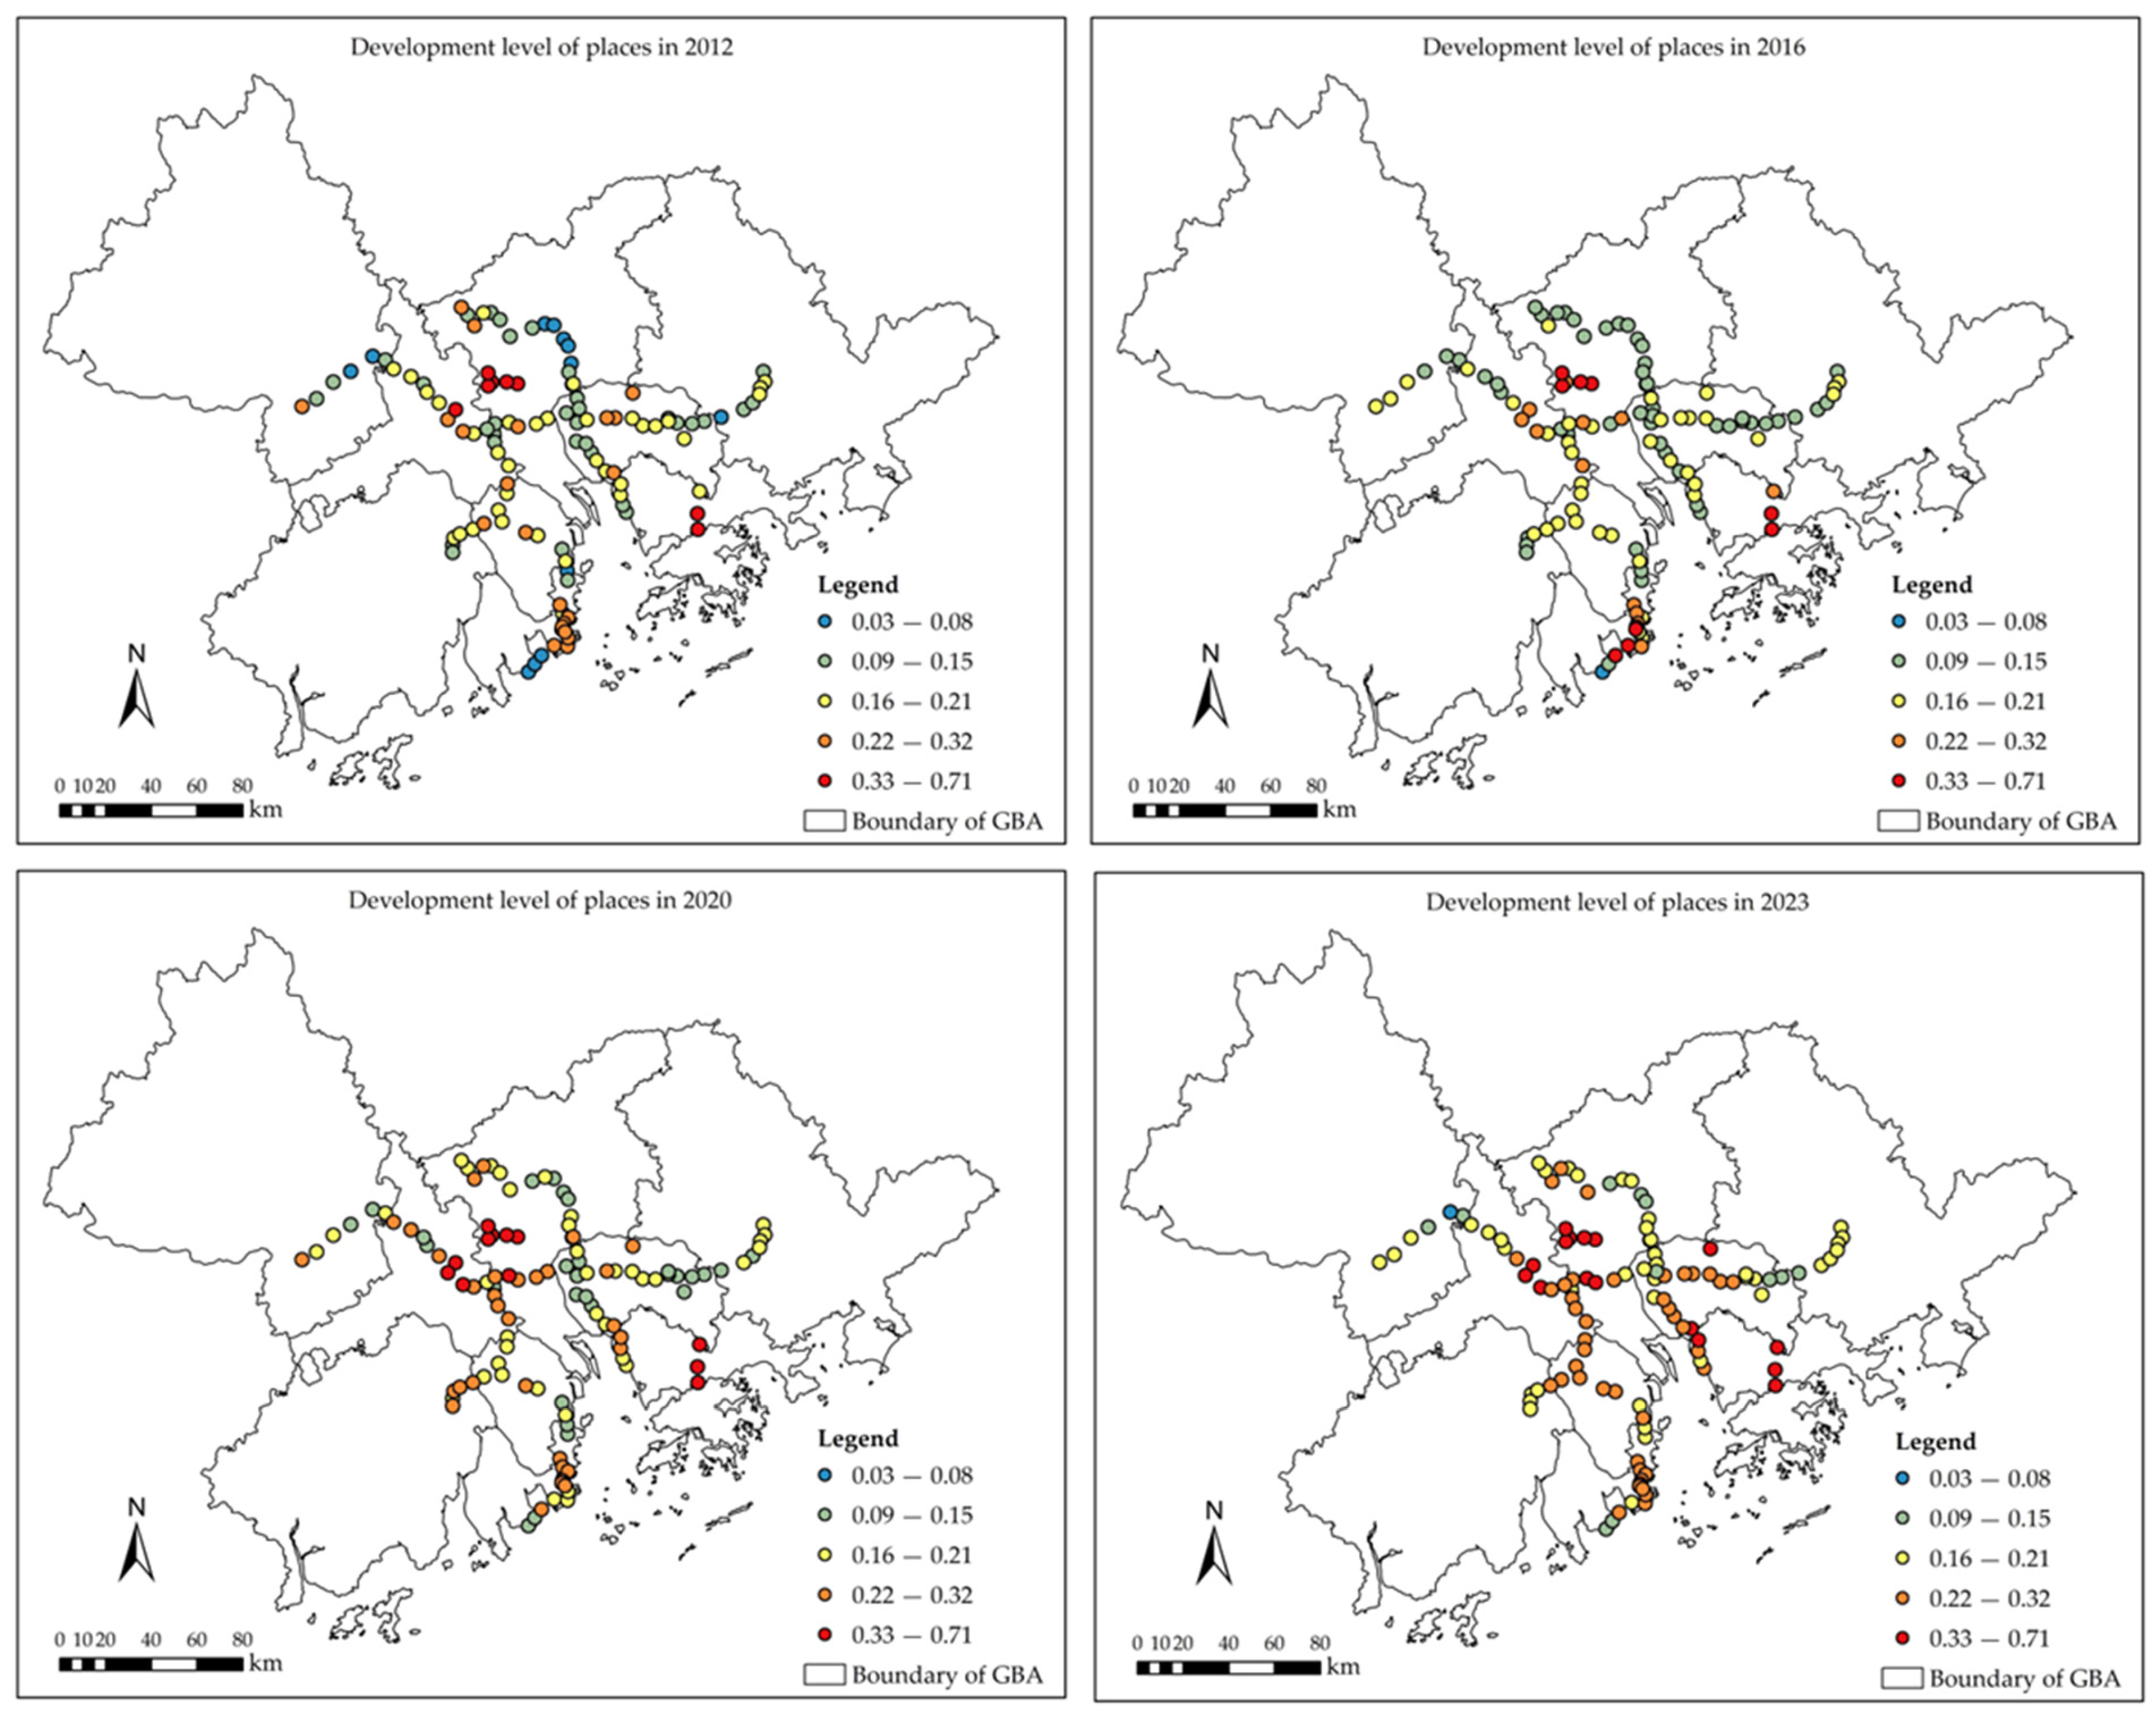
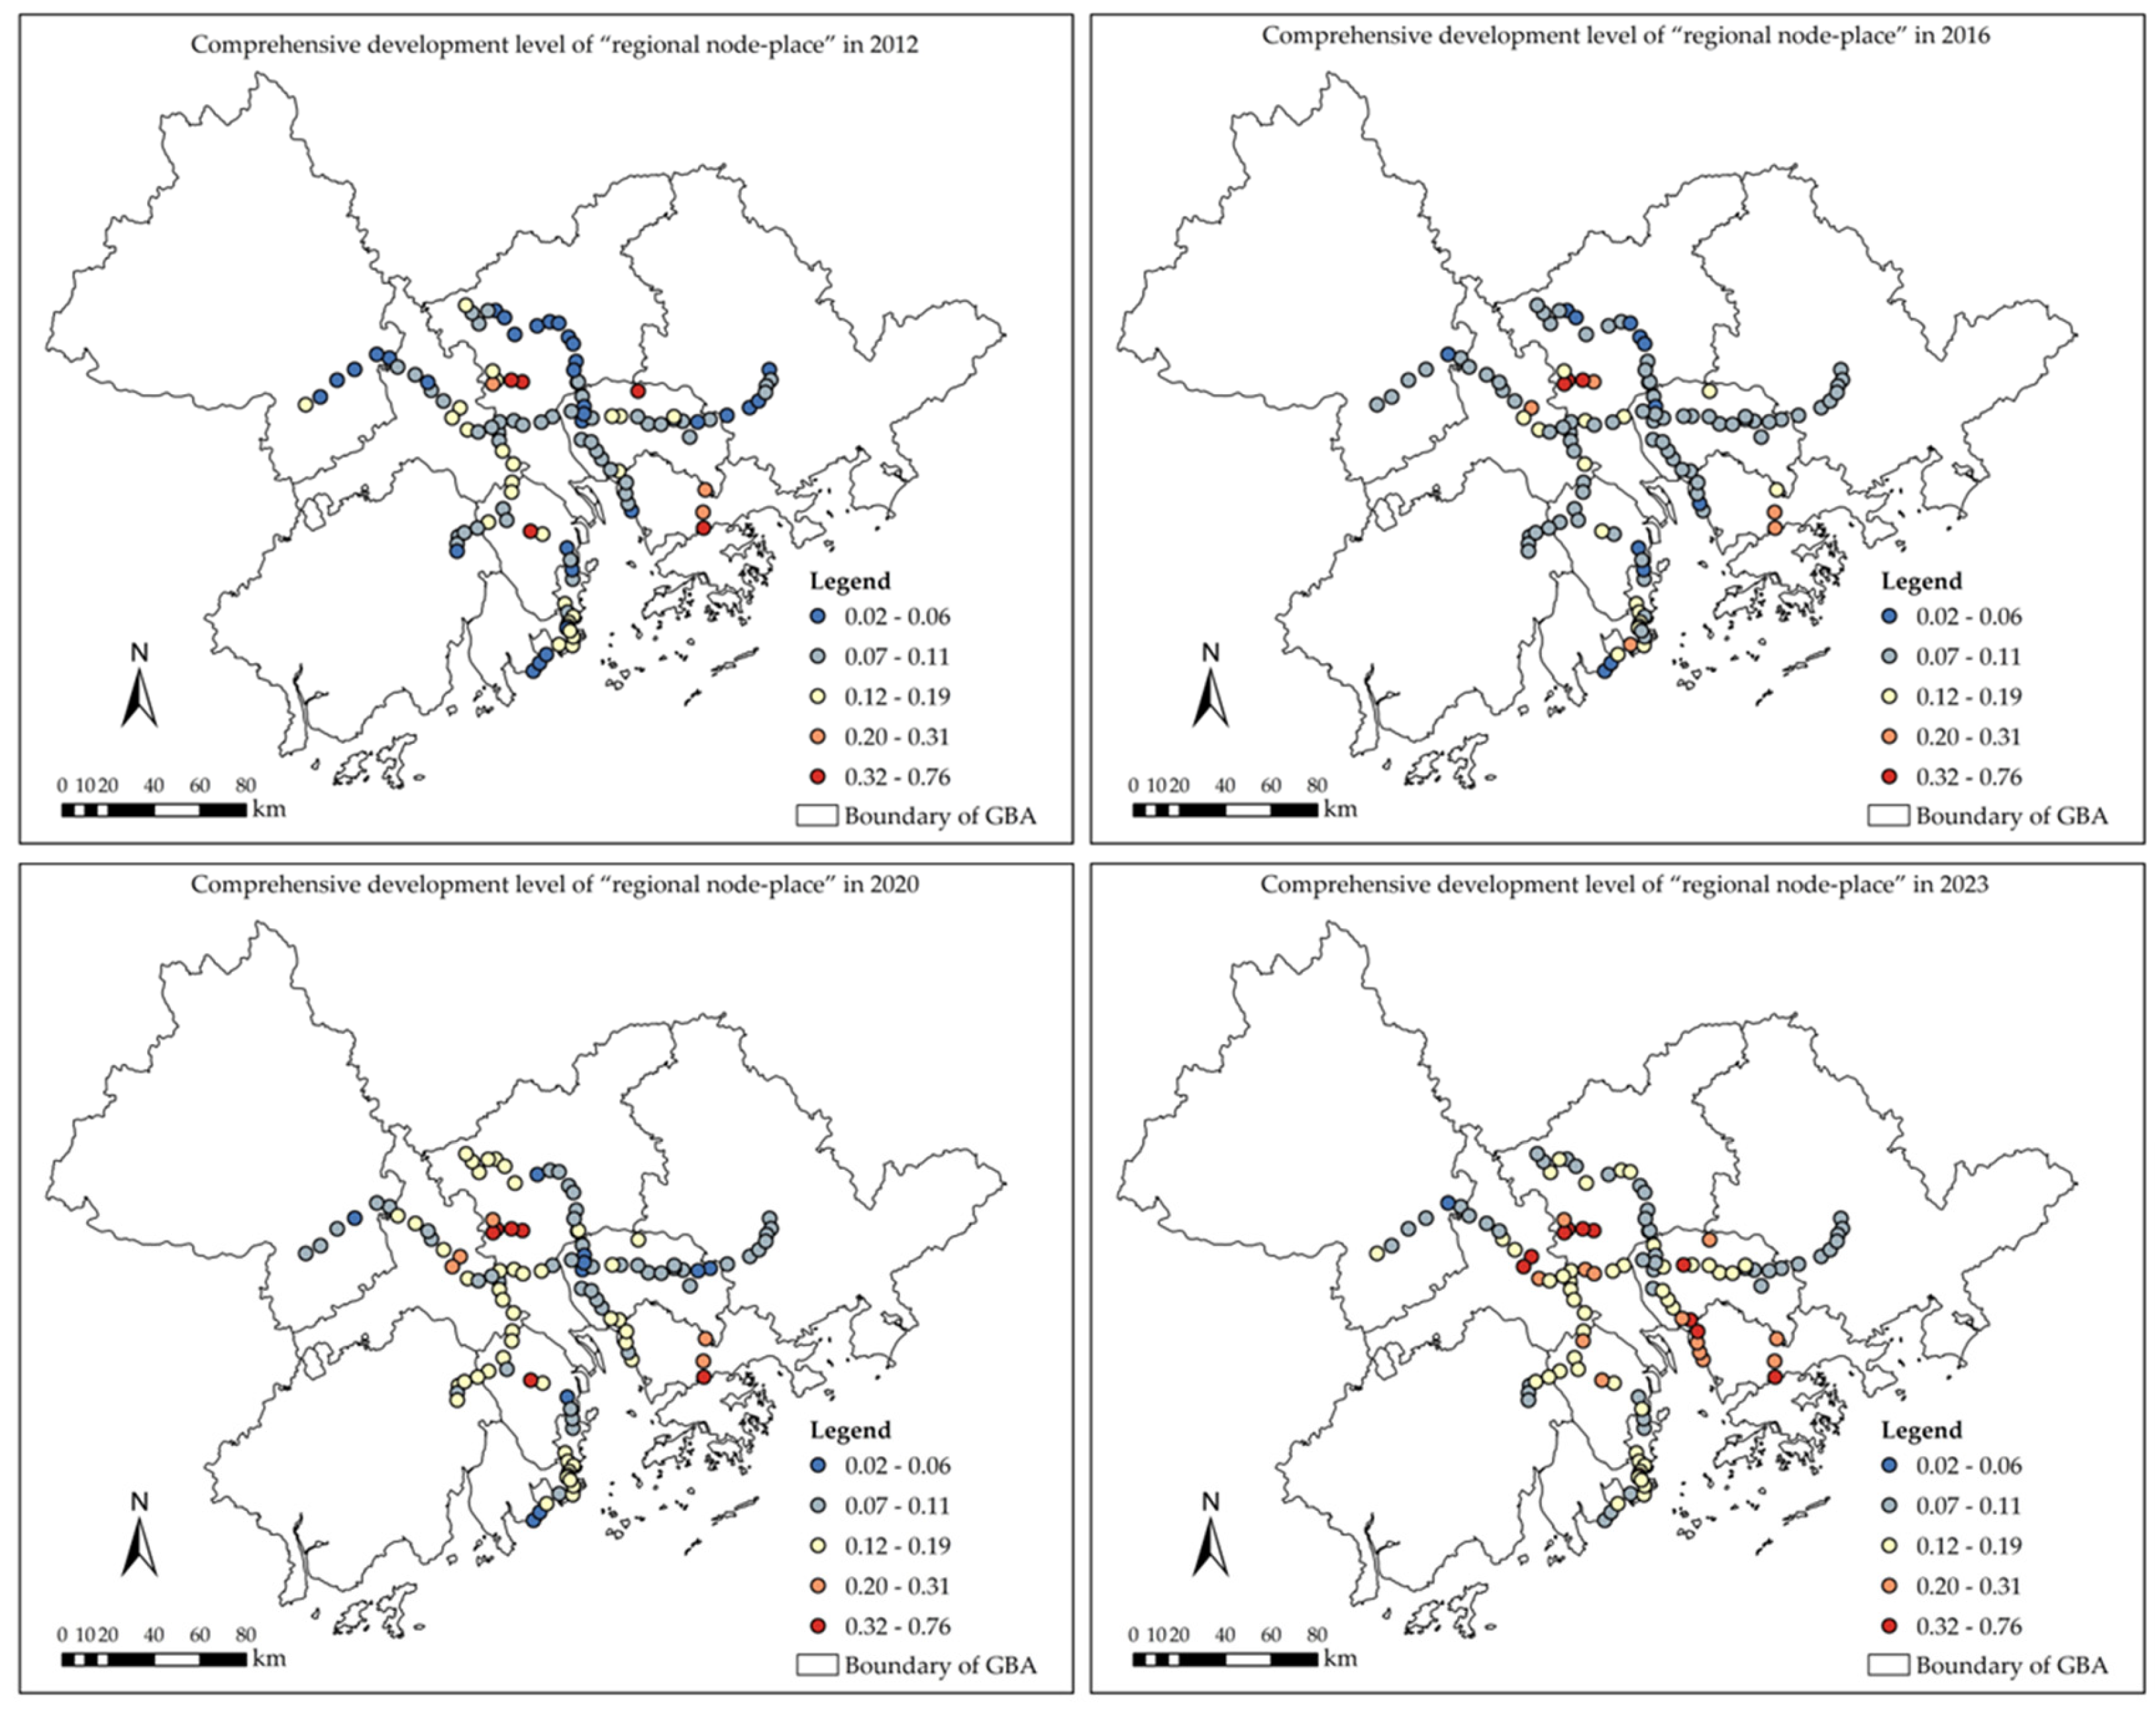
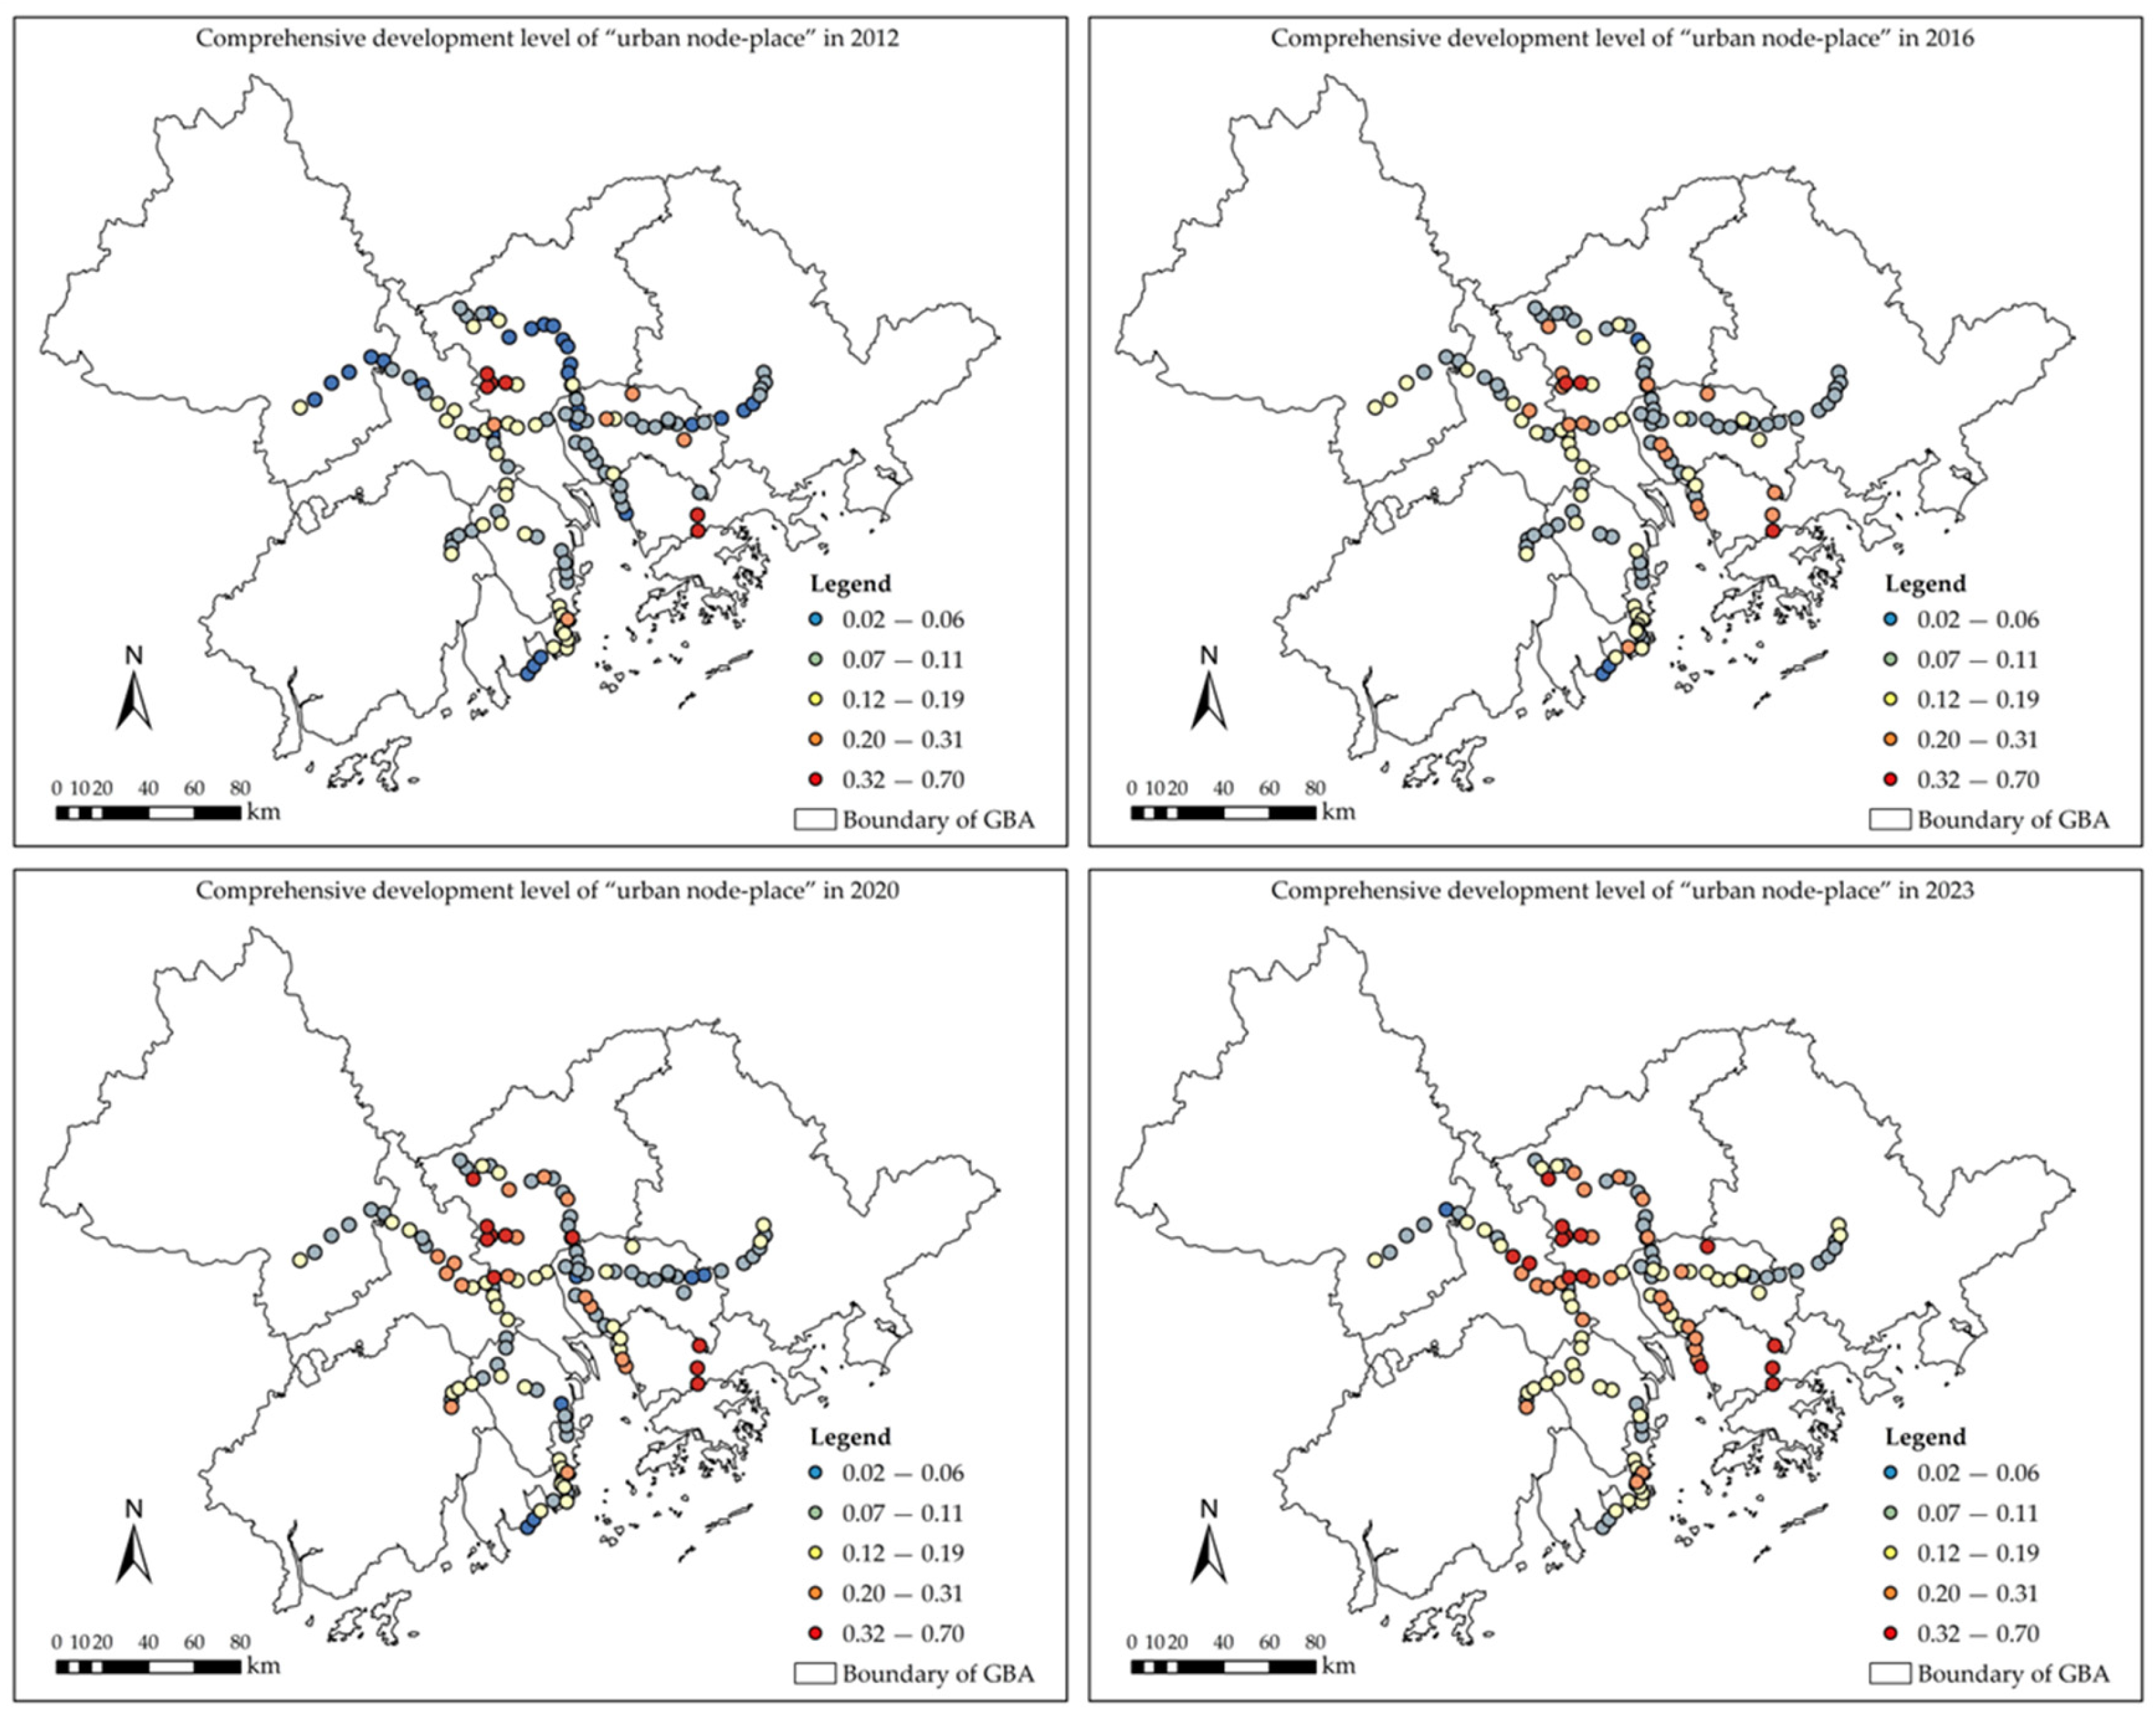
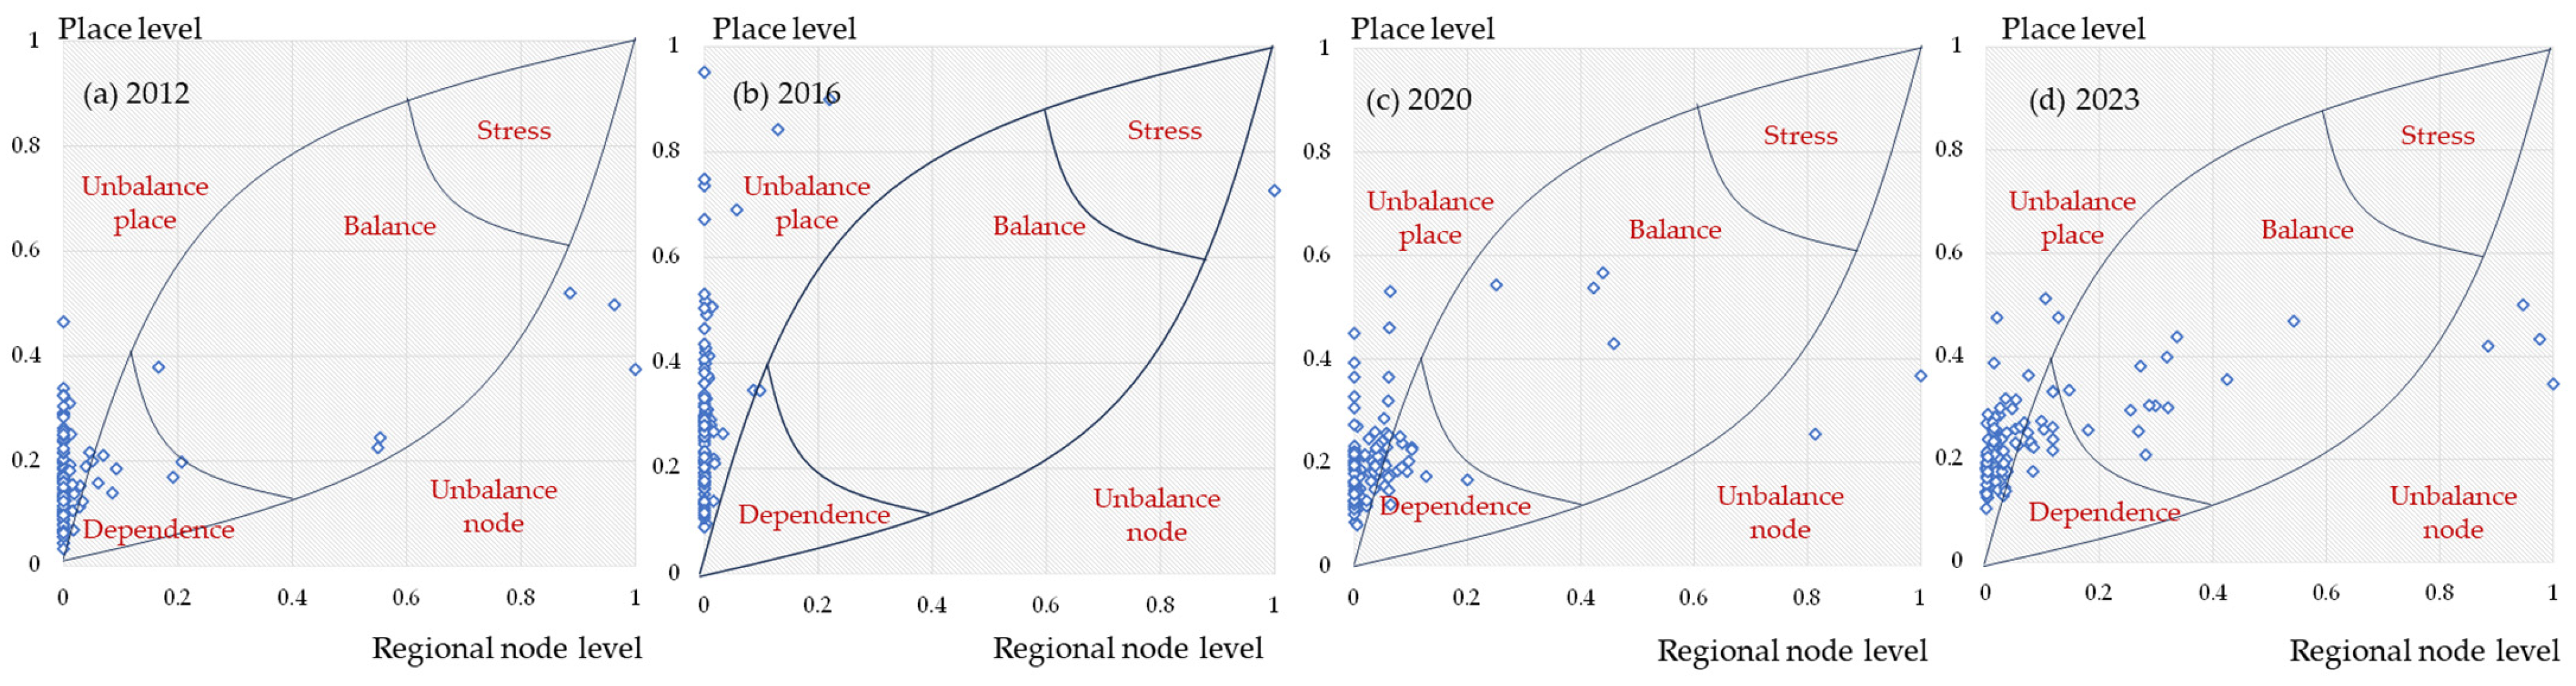
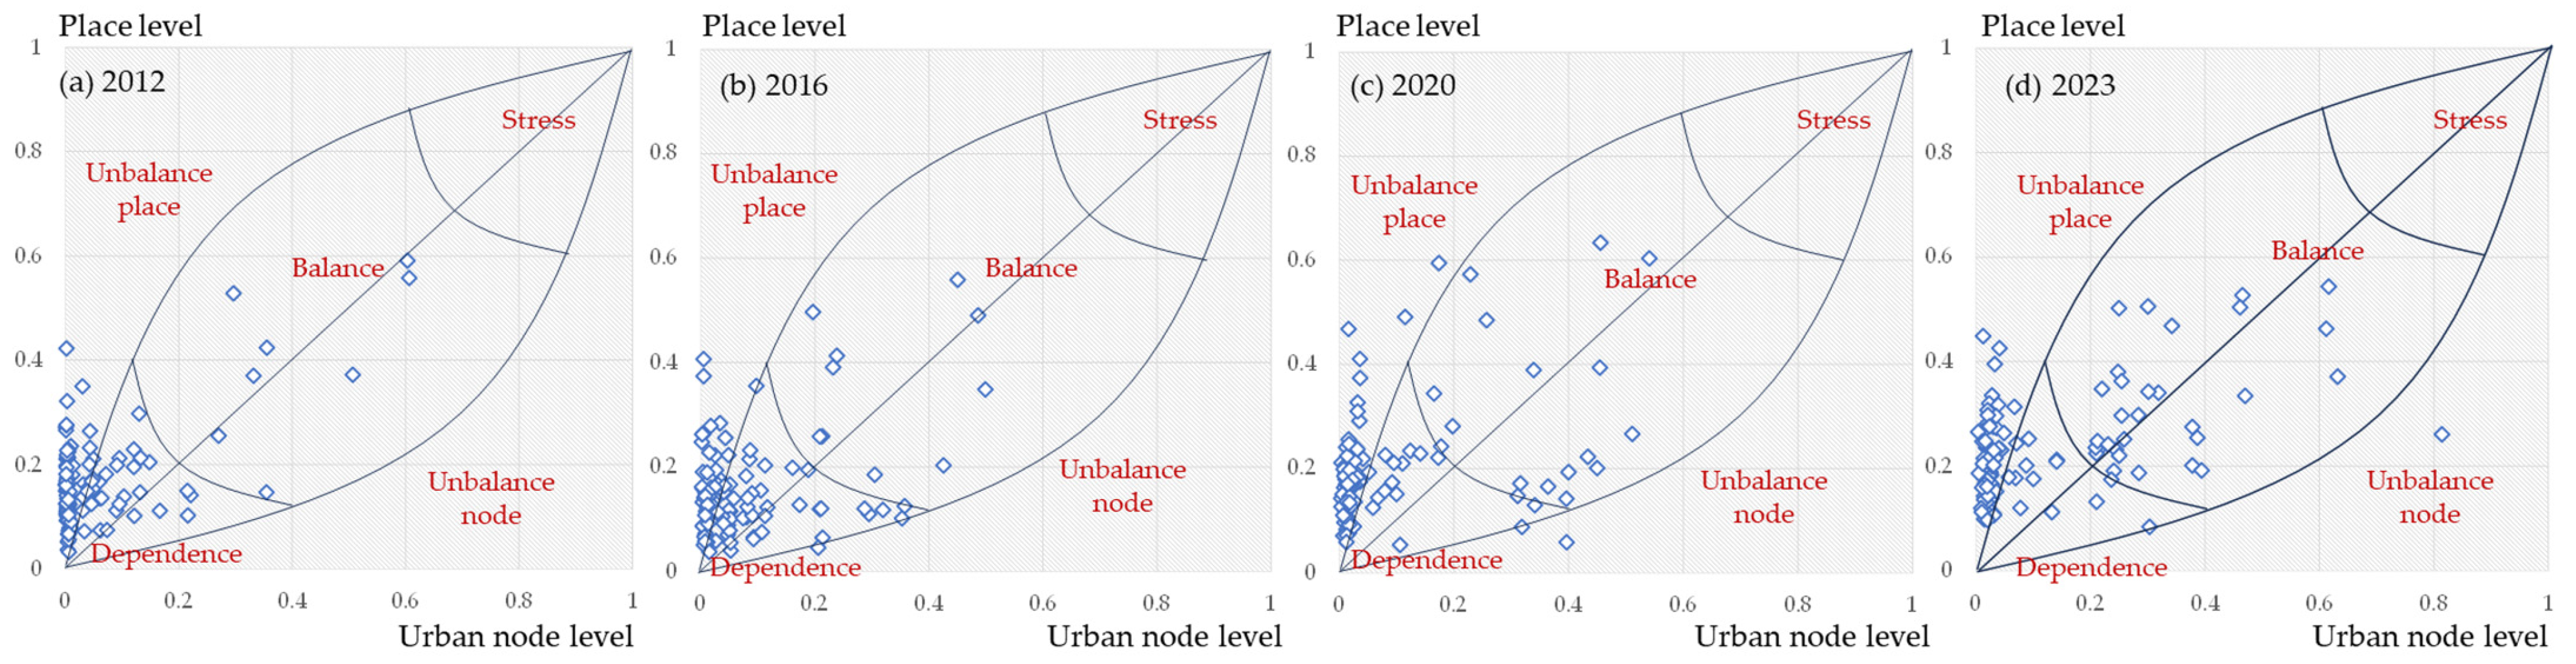
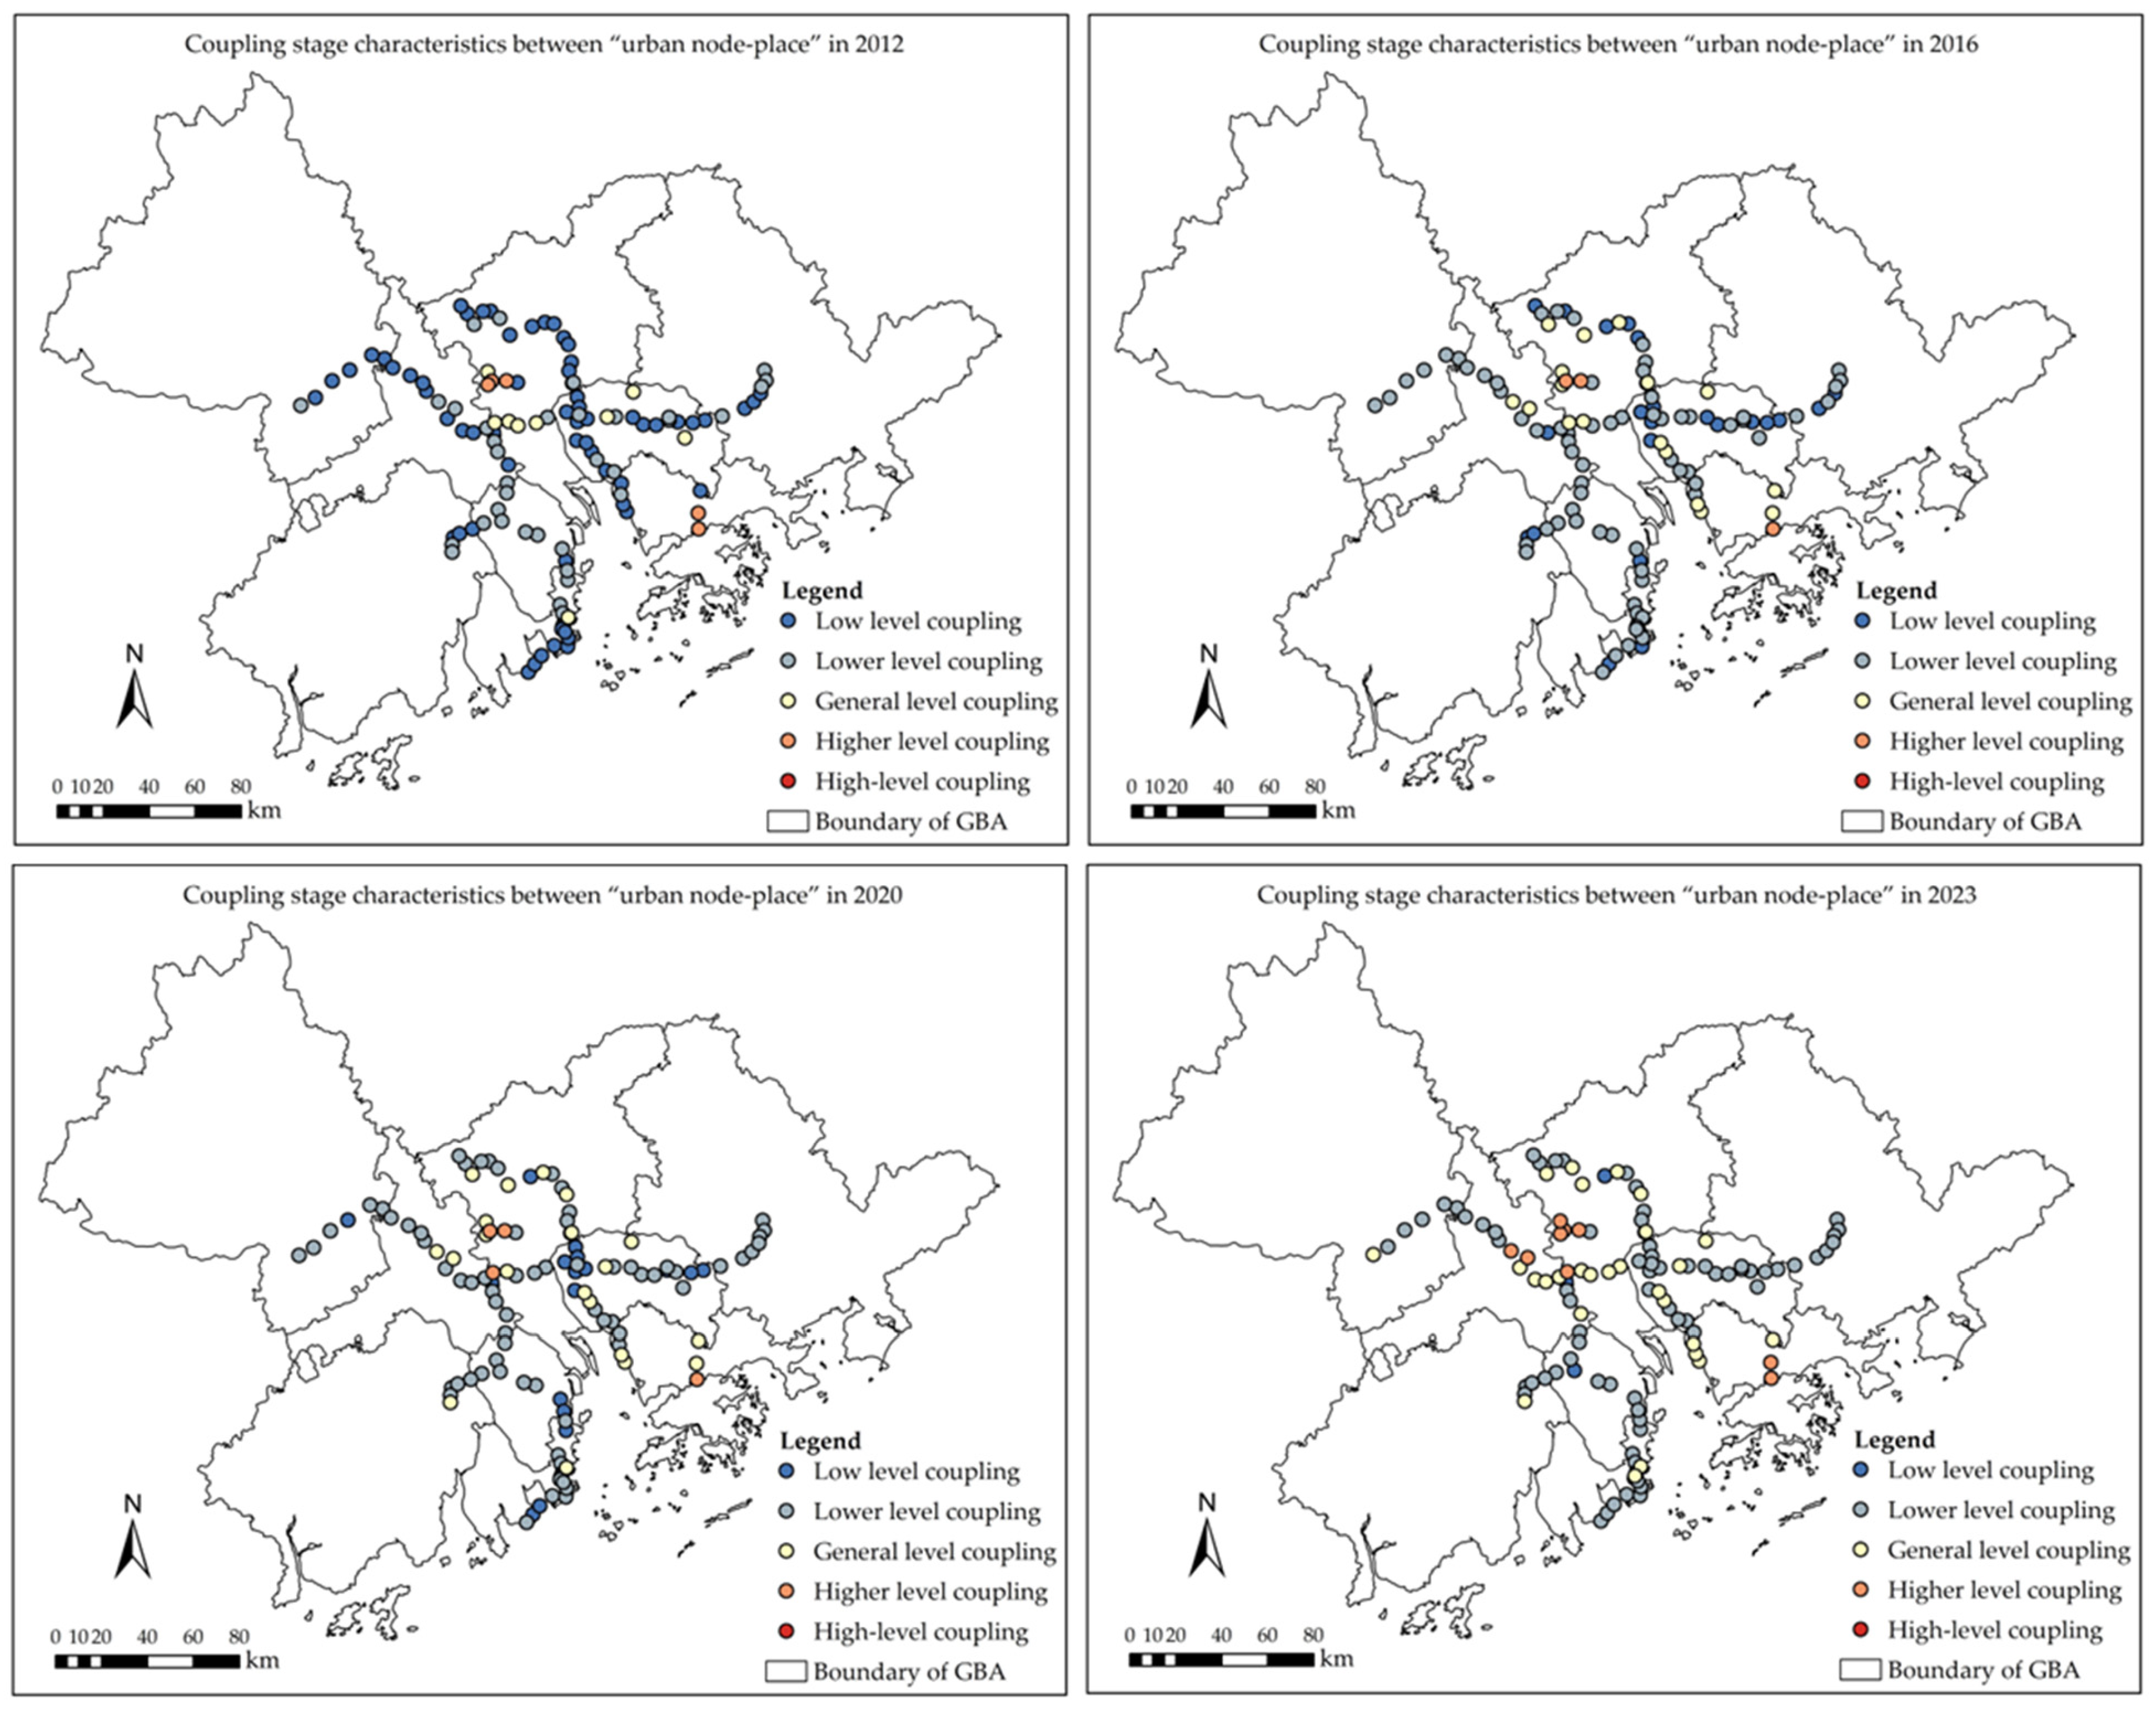
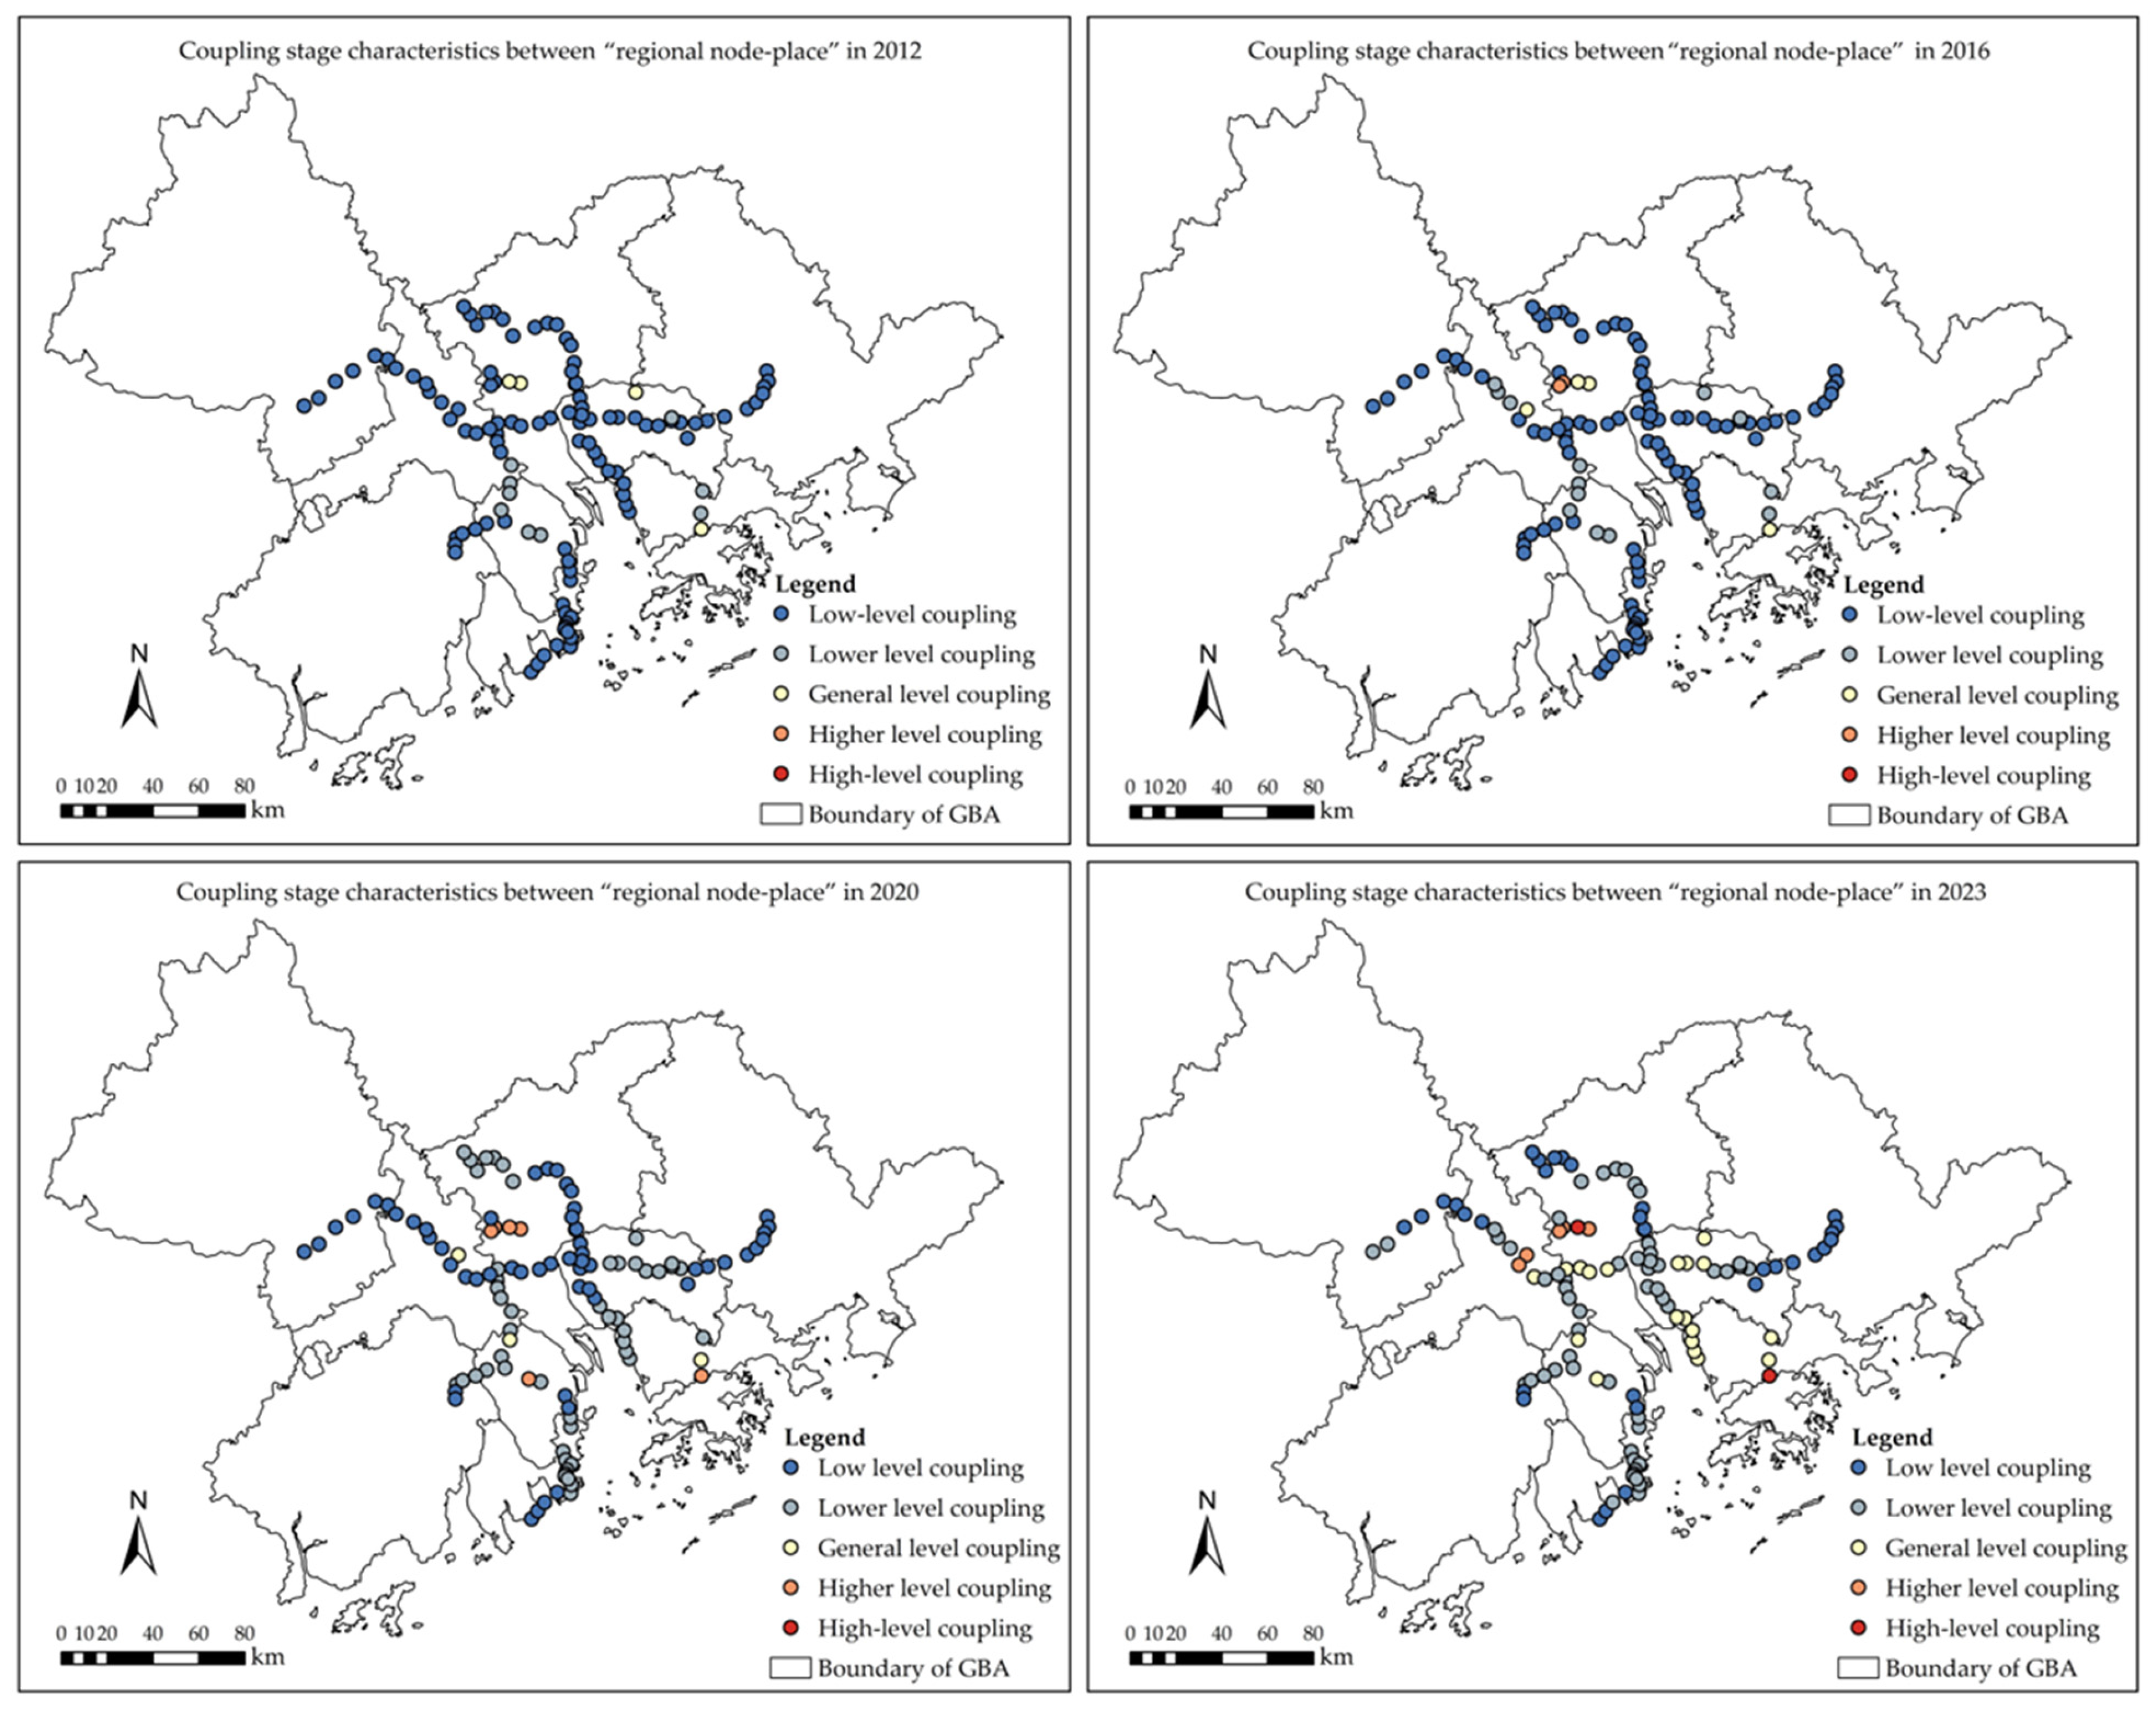
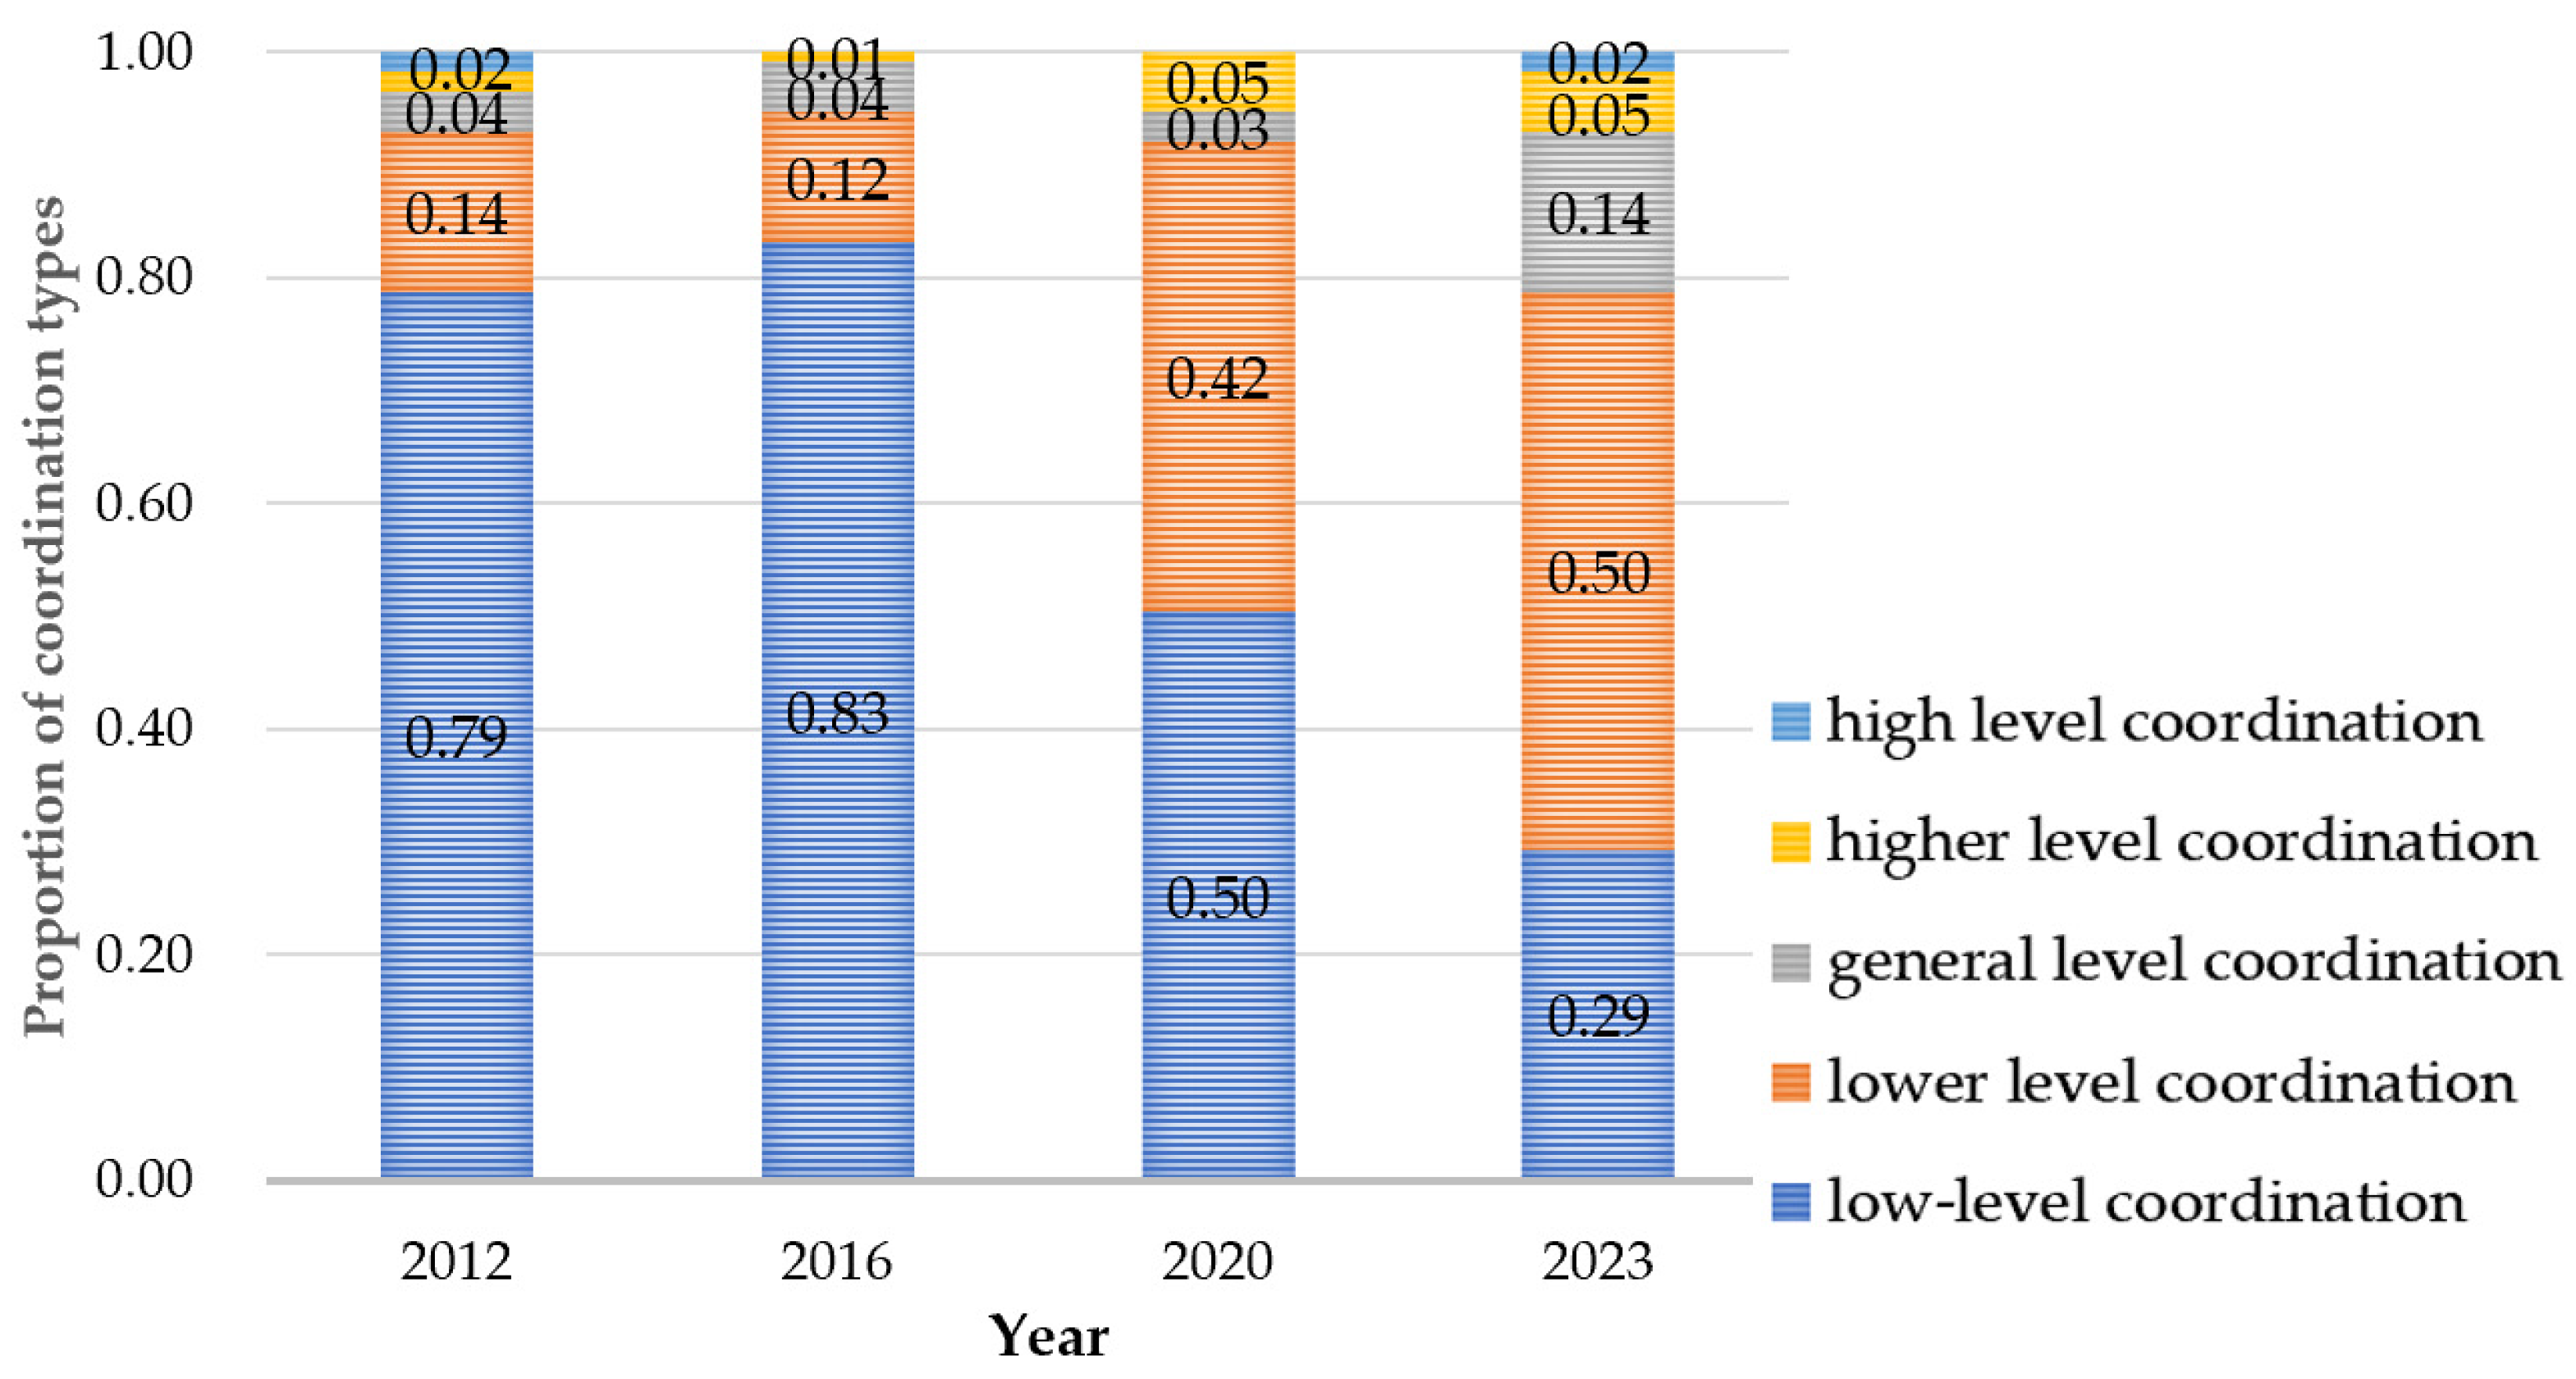

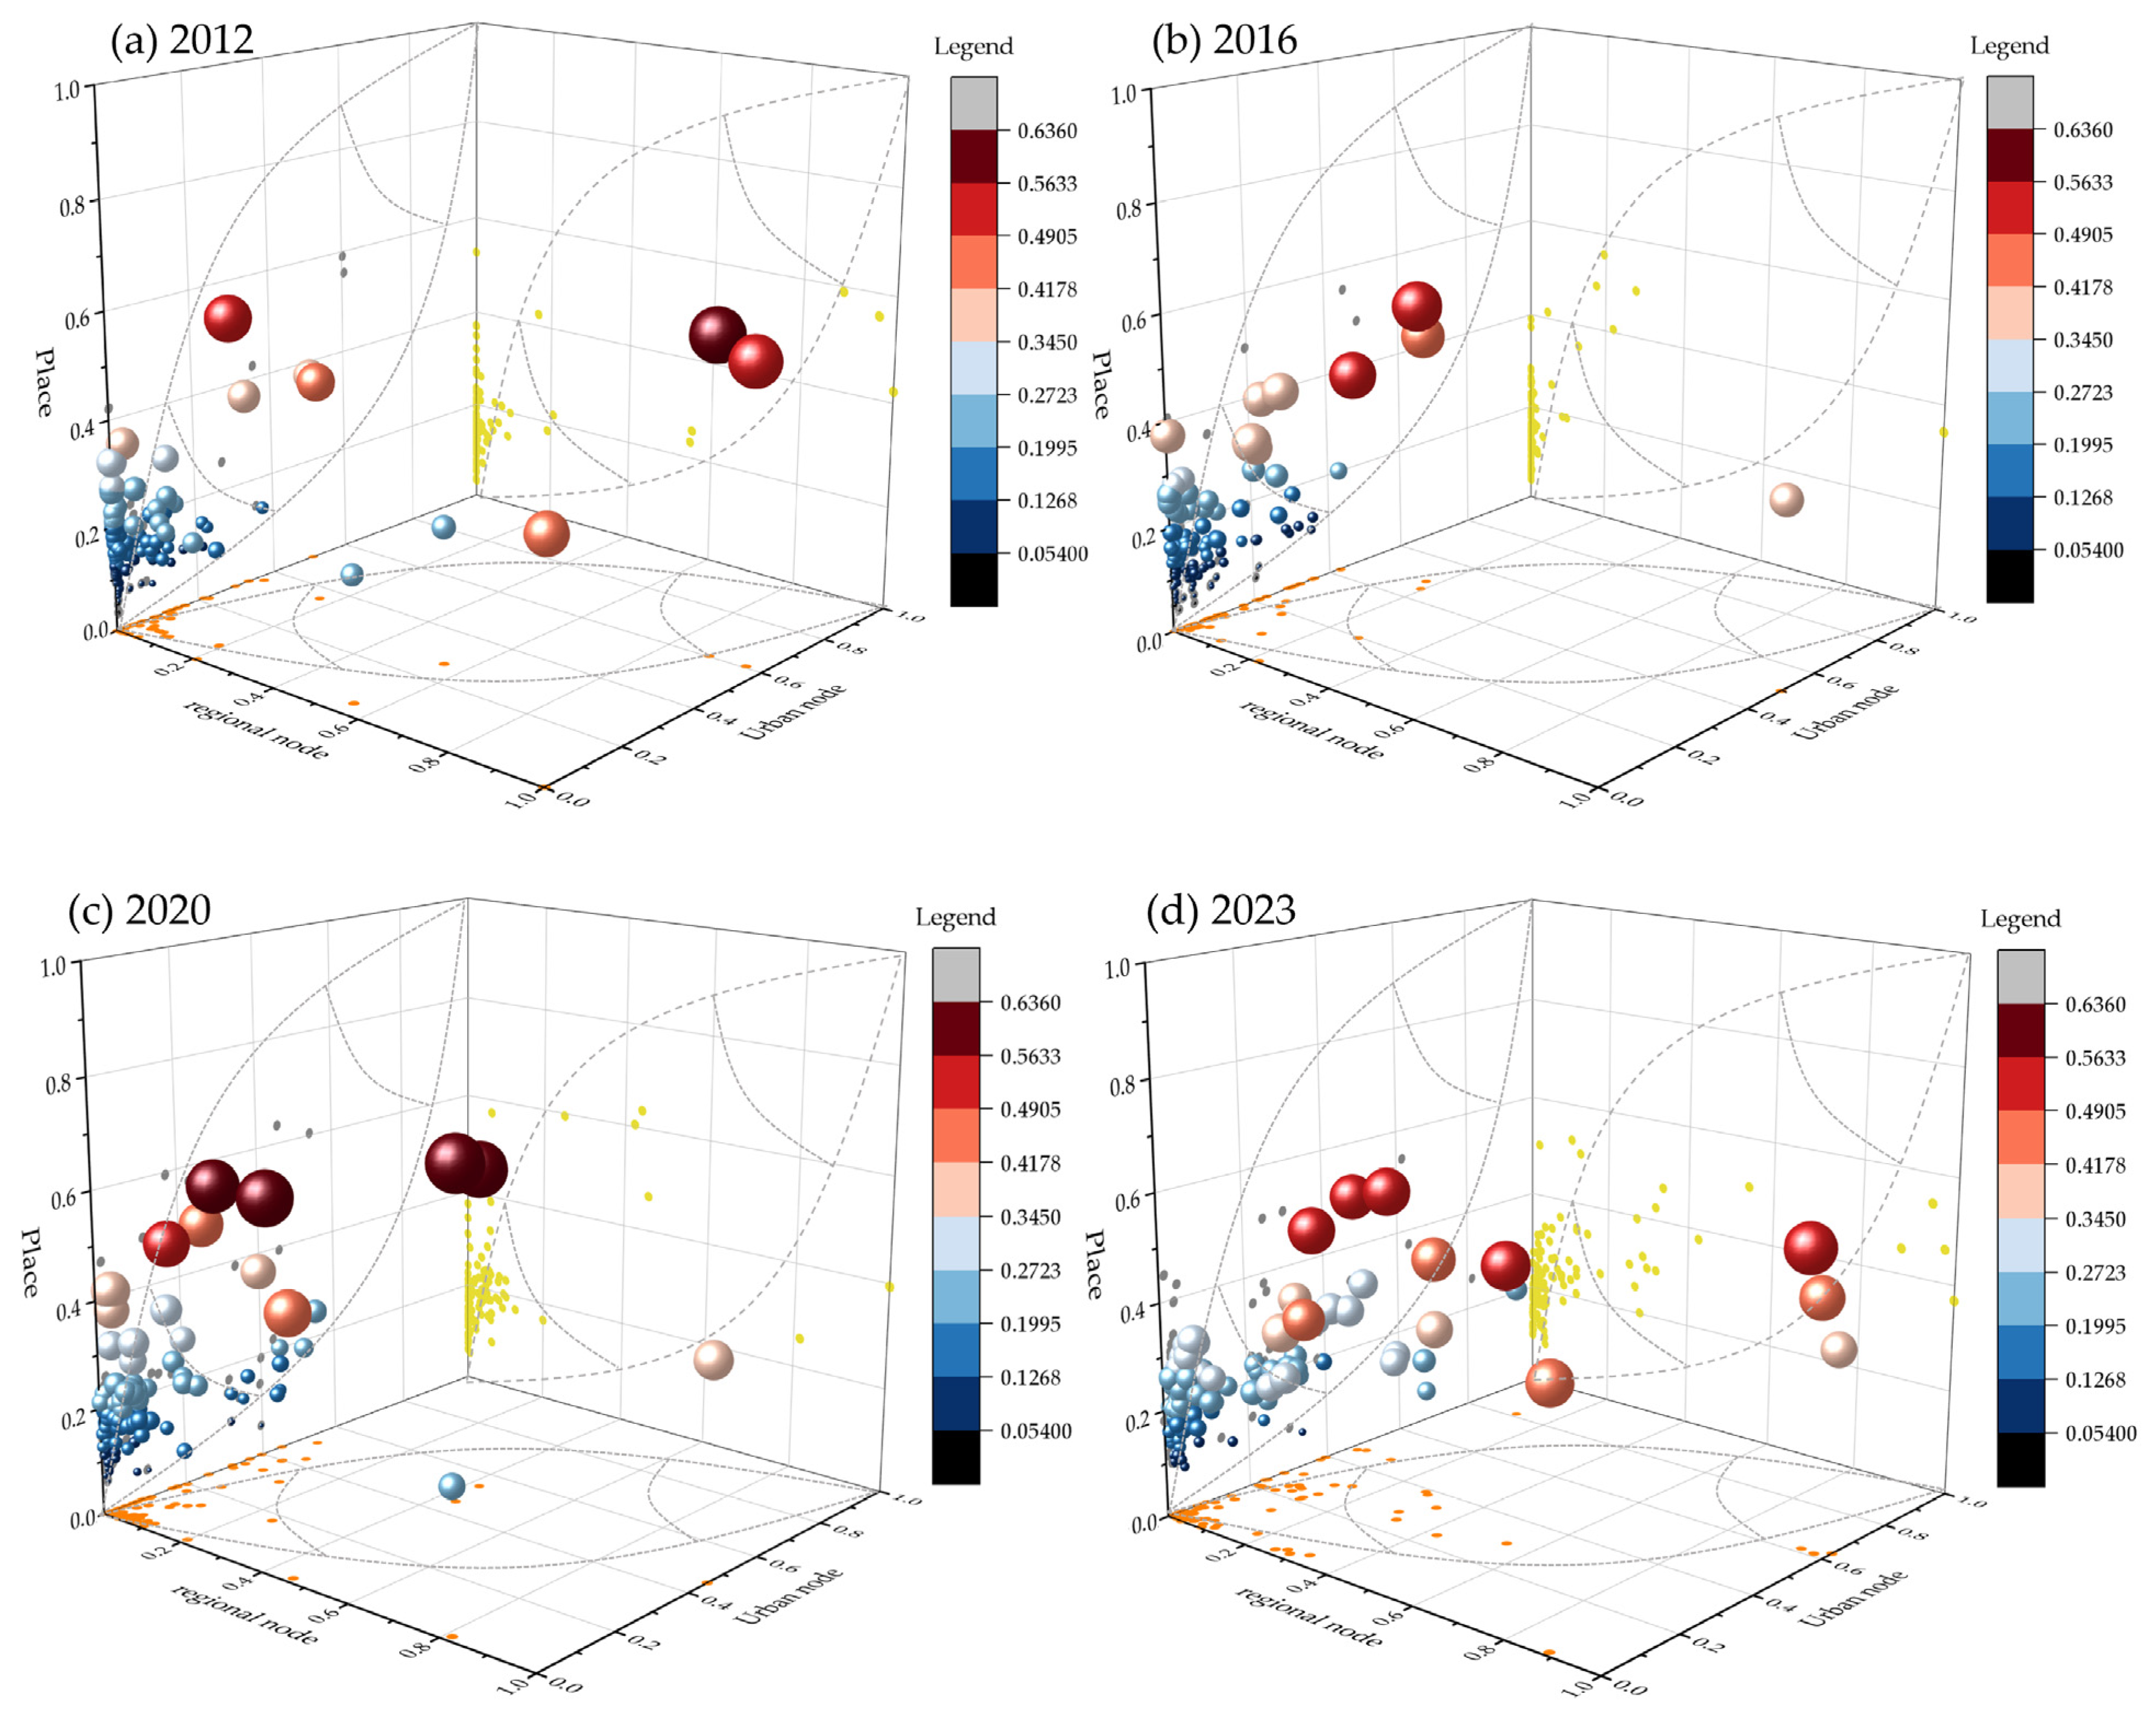
Disclaimer/Publisher’s Note: The statements, opinions and data contained in all publications are solely those of the individual author(s) and contributor(s) and not of MDPI and/or the editor(s). MDPI and/or the editor(s) disclaim responsibility for any injury to people or property resulting from any ideas, methods, instructions or products referred to in the content. |
© 2025 by the authors. Published by MDPI on behalf of the International Society for Photogrammetry and Remote Sensing. Licensee MDPI, Basel, Switzerland. This article is an open access article distributed under the terms and conditions of the Creative Commons Attribution (CC BY) license (https://creativecommons.org/licenses/by/4.0/).