

Deep-Learning-Based Evaluation of Rooftop Photovoltaic Deployment in Tianjin, China


Abstract
1. Introduction
2. Data and Methods
2.1. Study Area
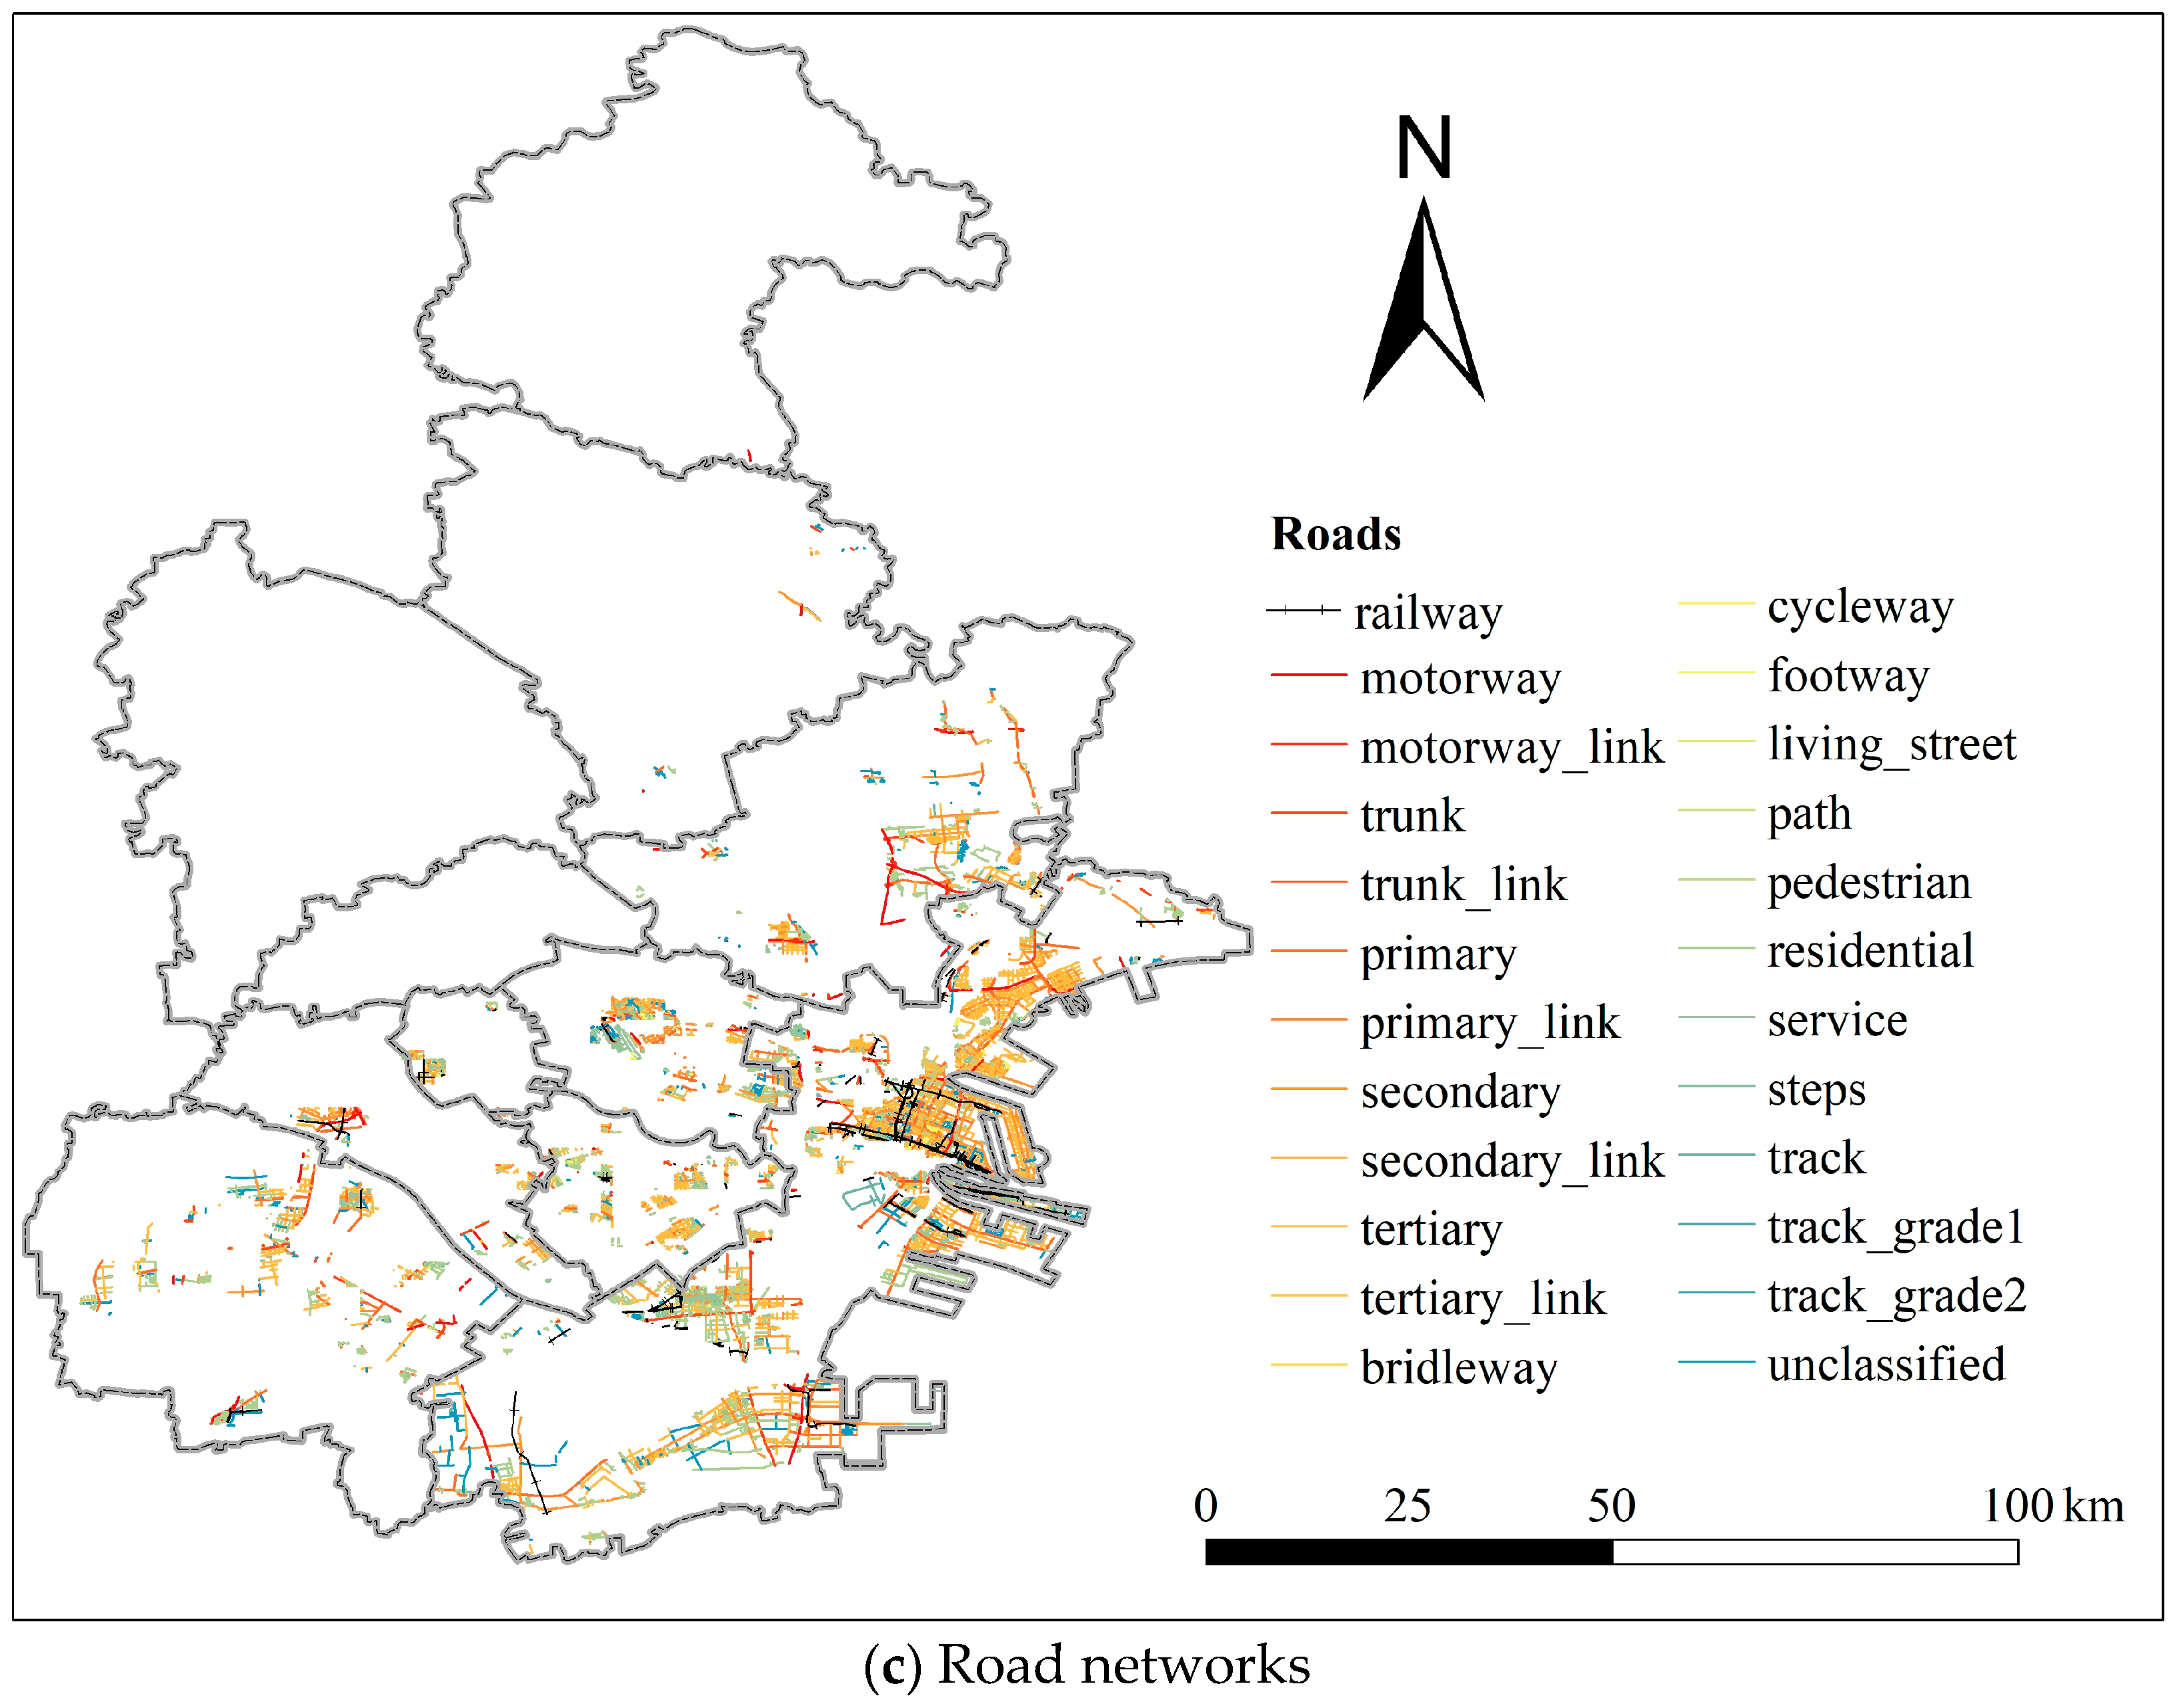
2.2. Data Source
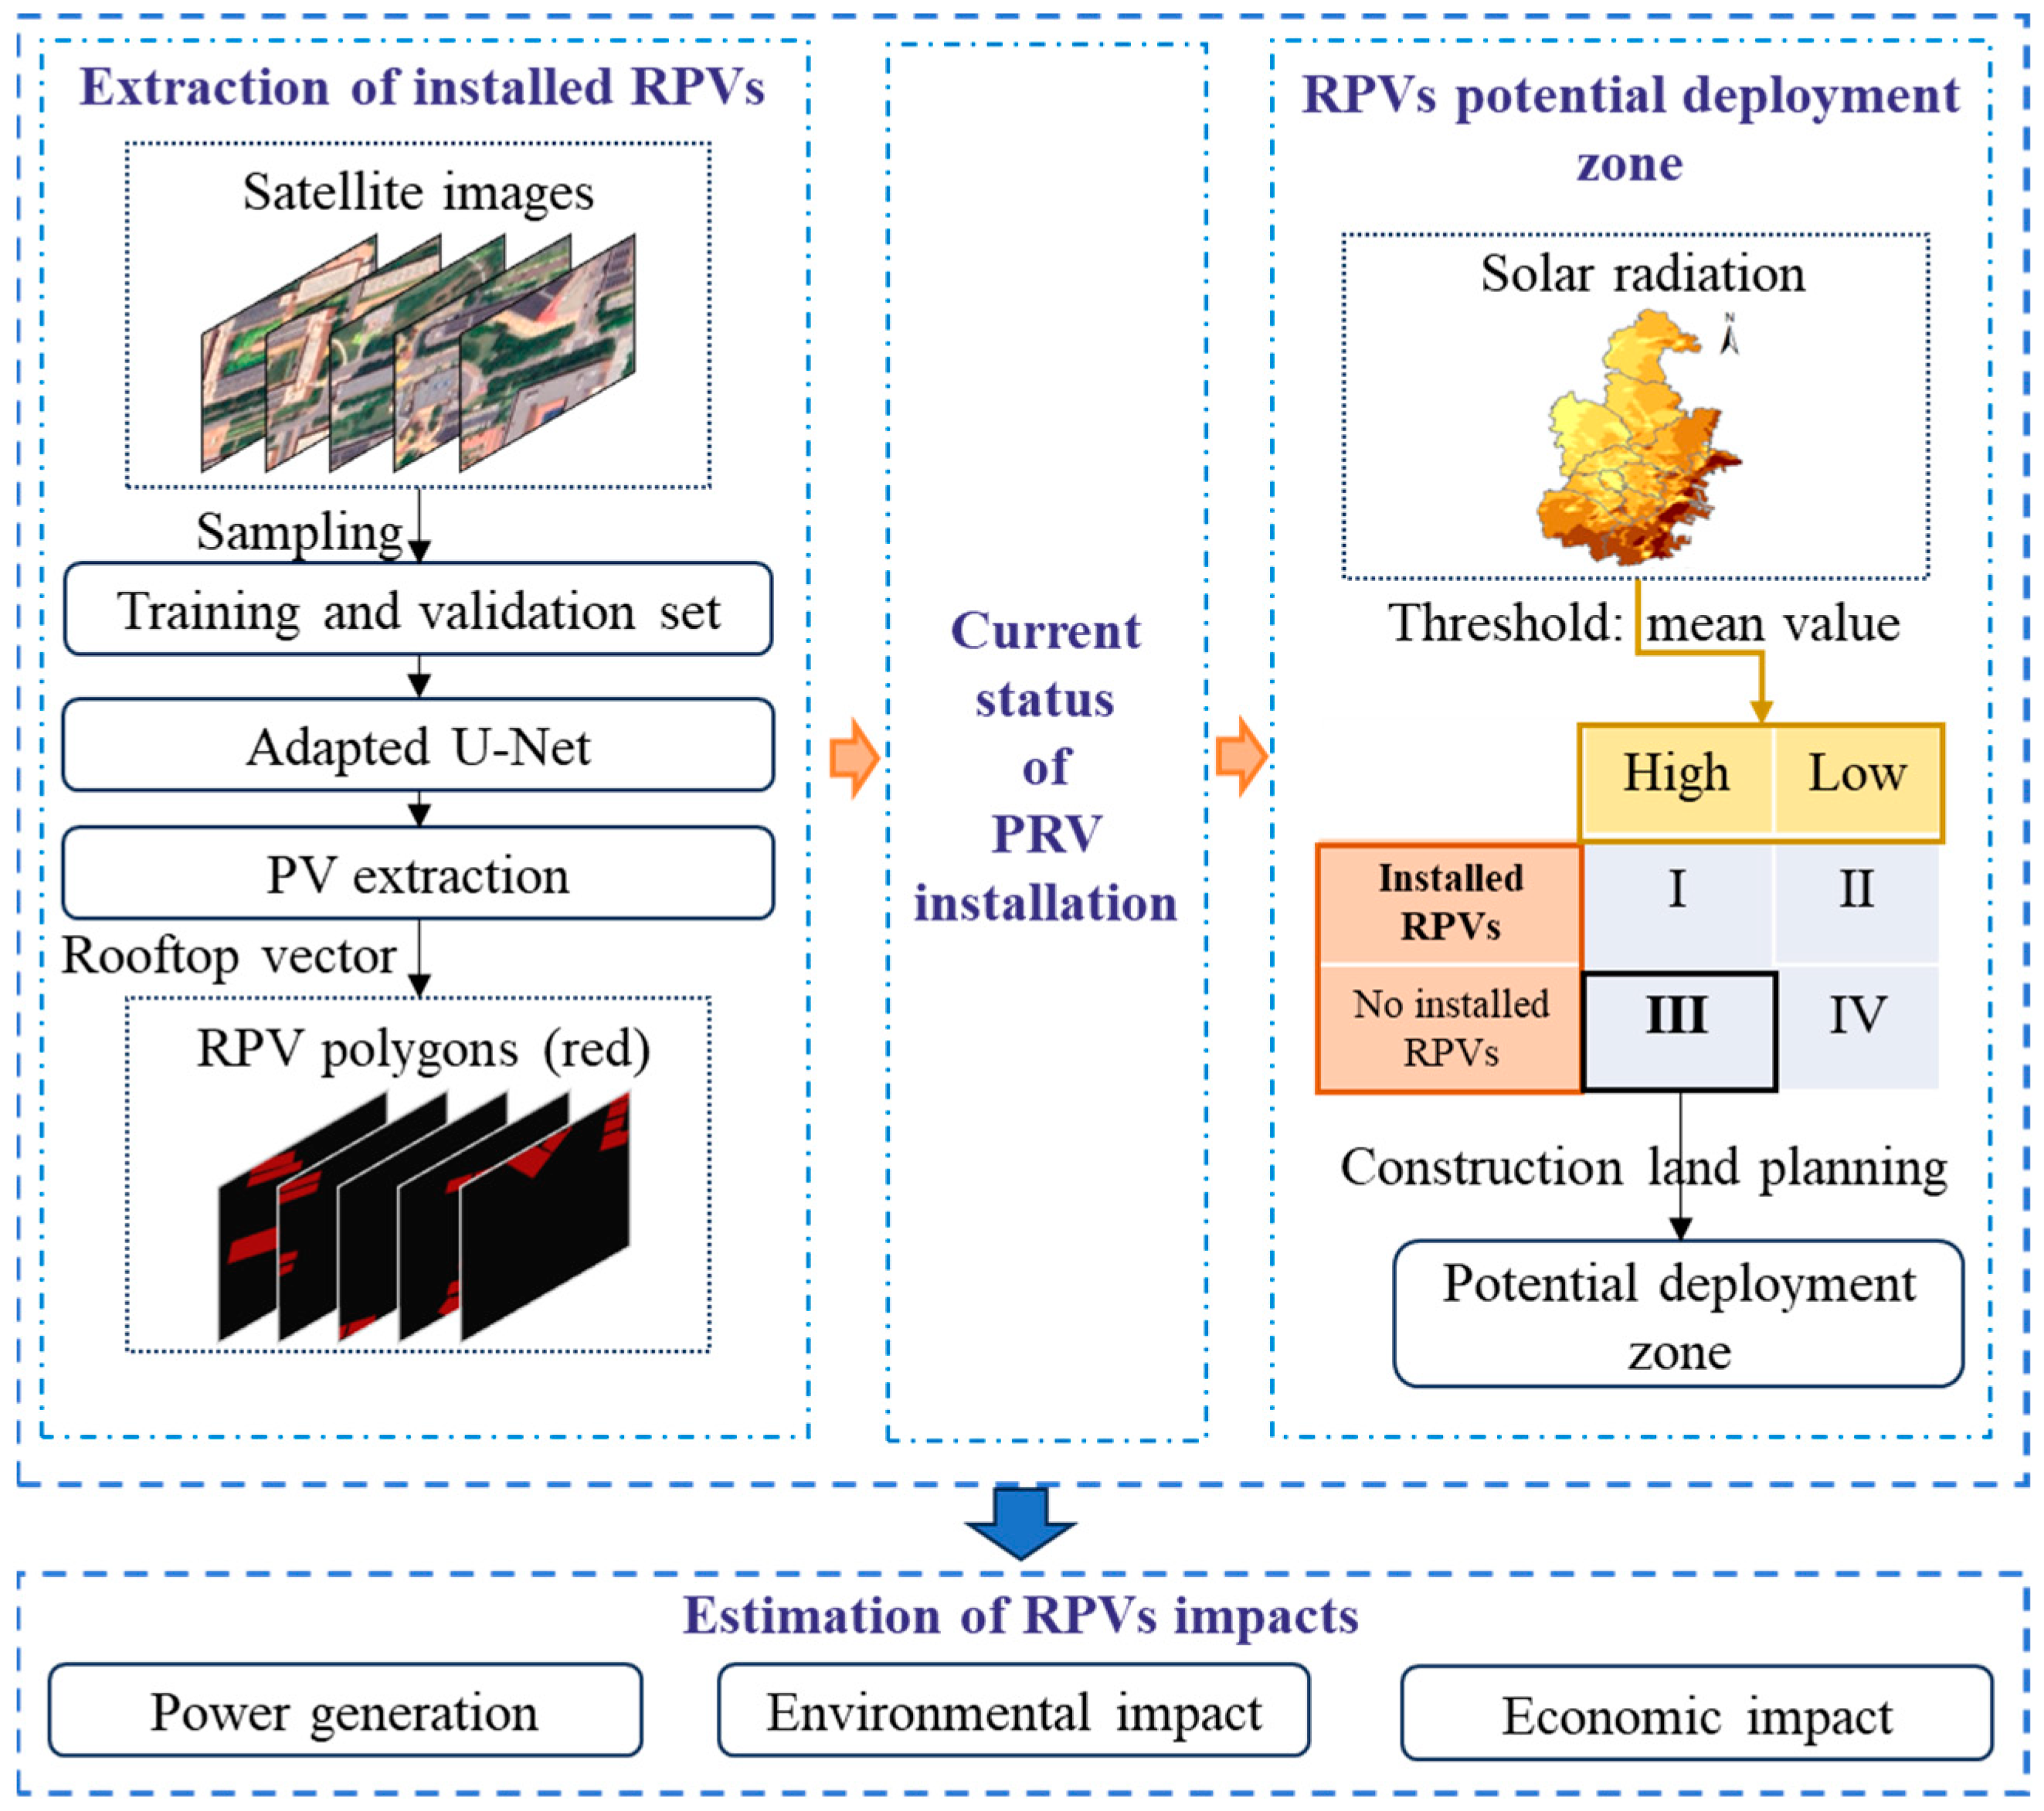
2.3. Methodology
2.3.1. Extraction of Installed RPVs
- (1)
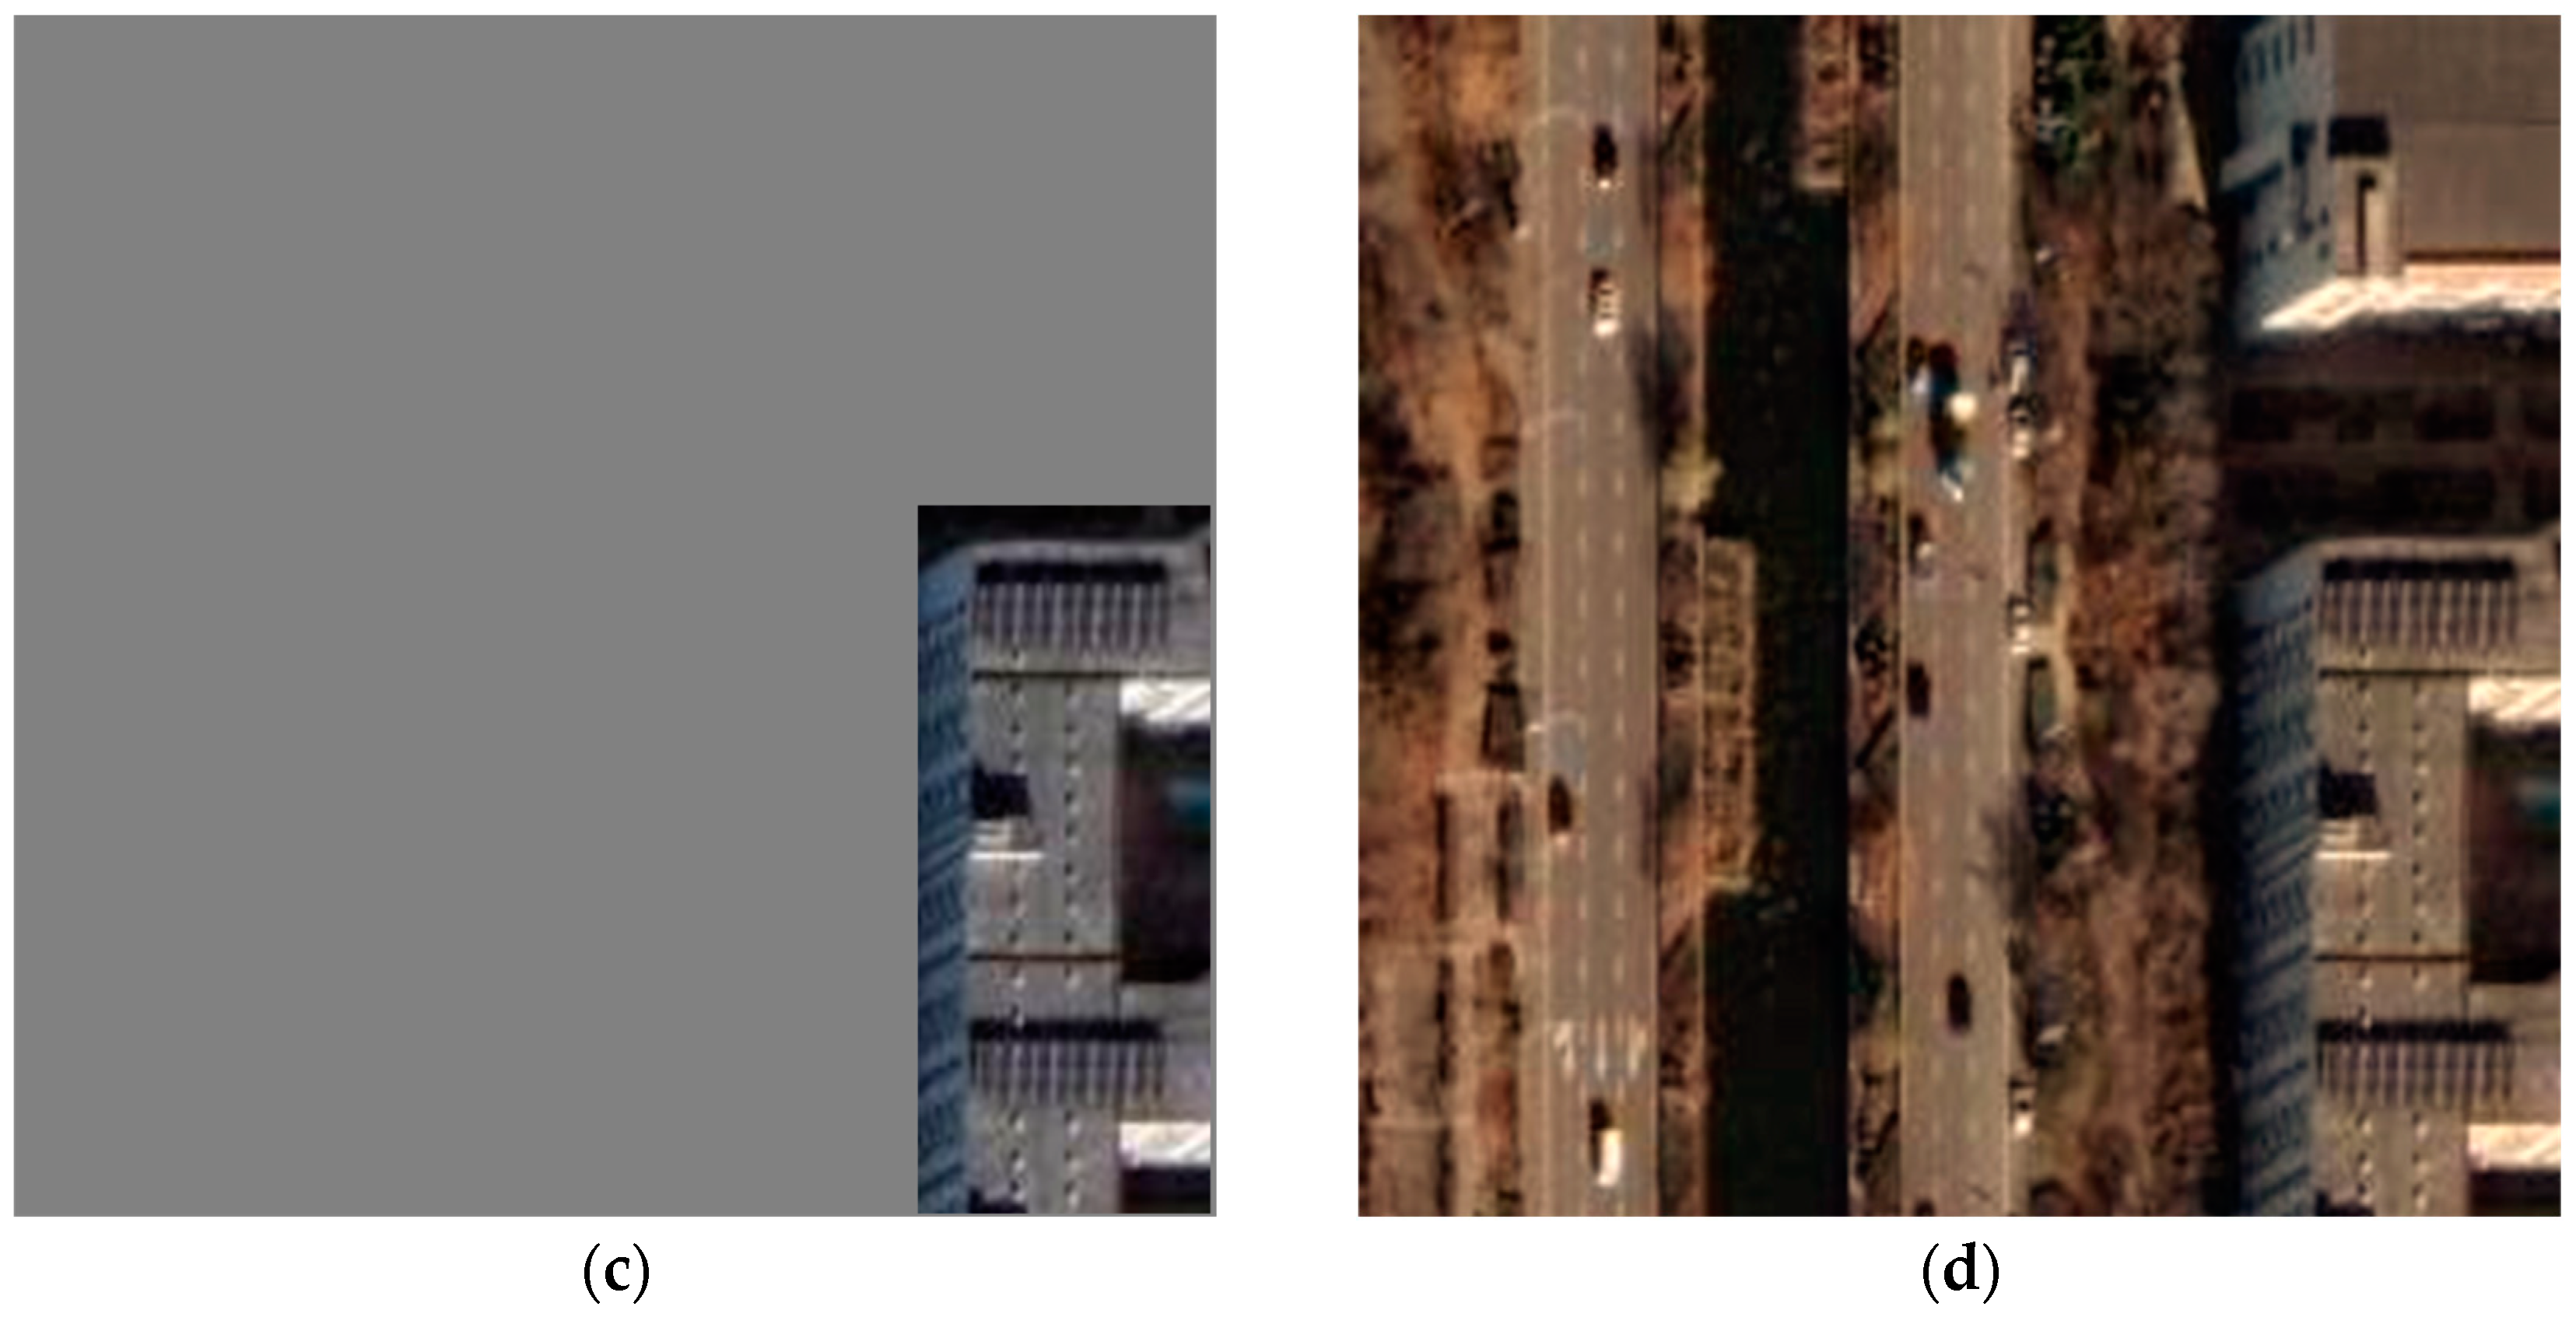
- Data preparation and pre-processing
- (2)
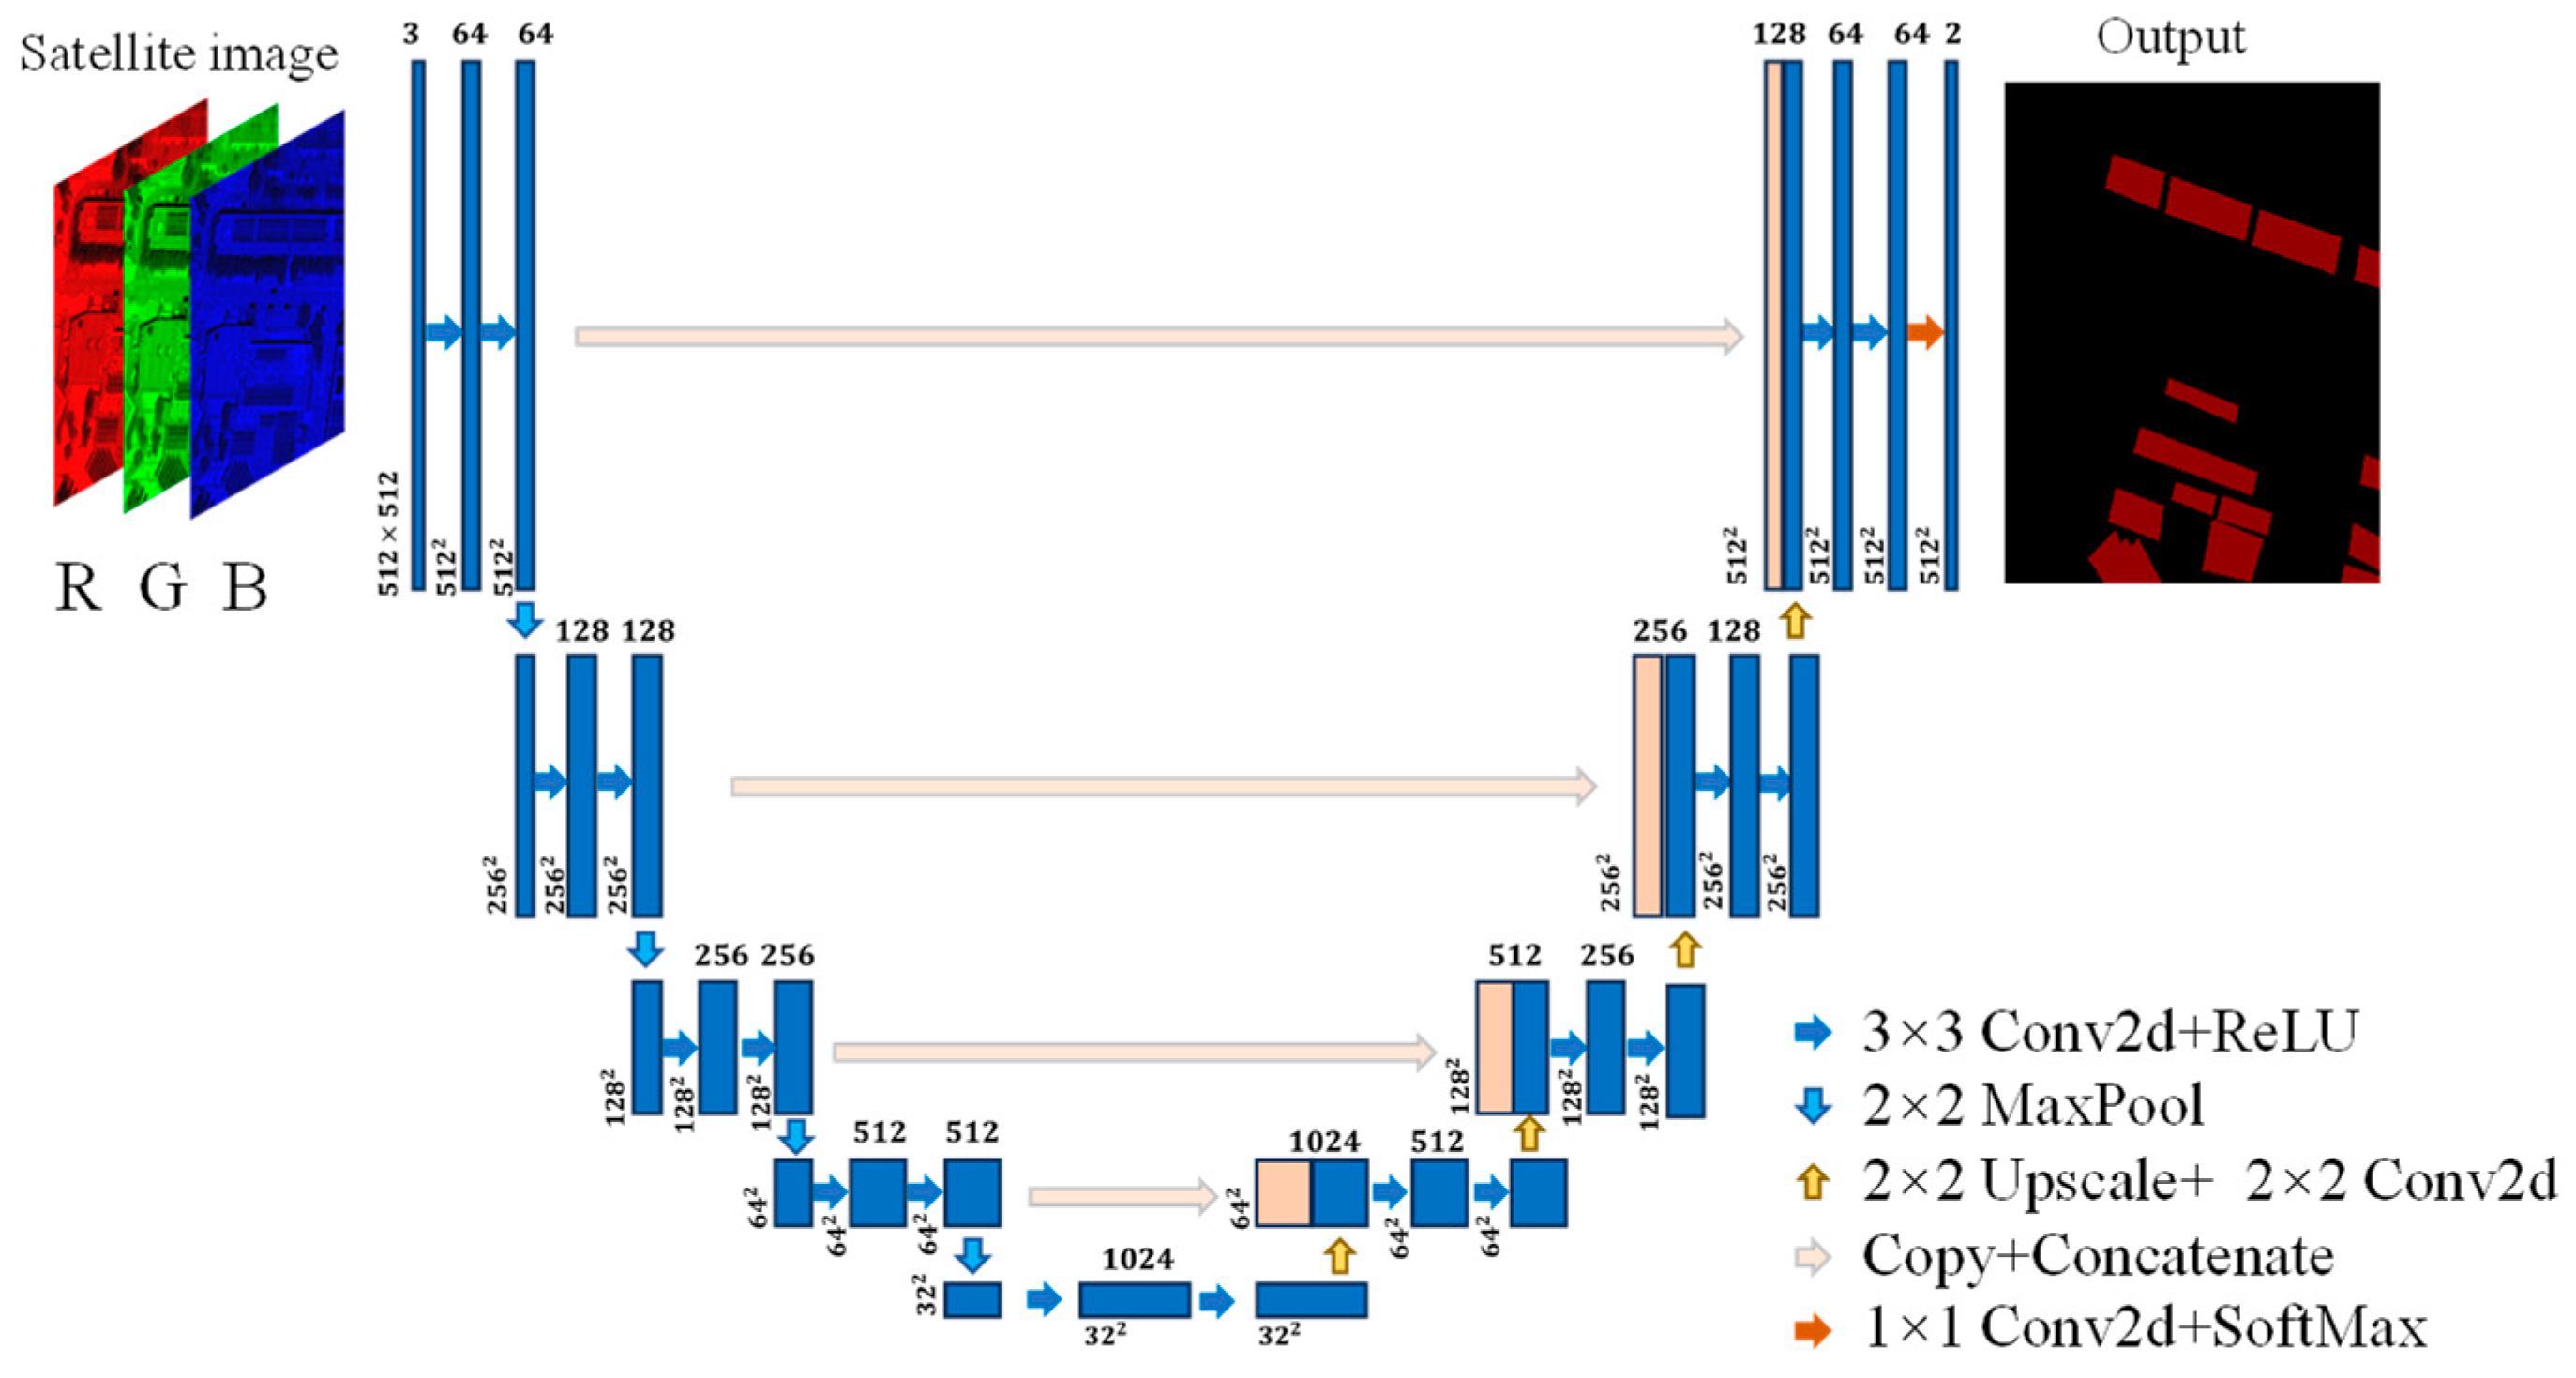
- Adapted U-Net model
- (3)
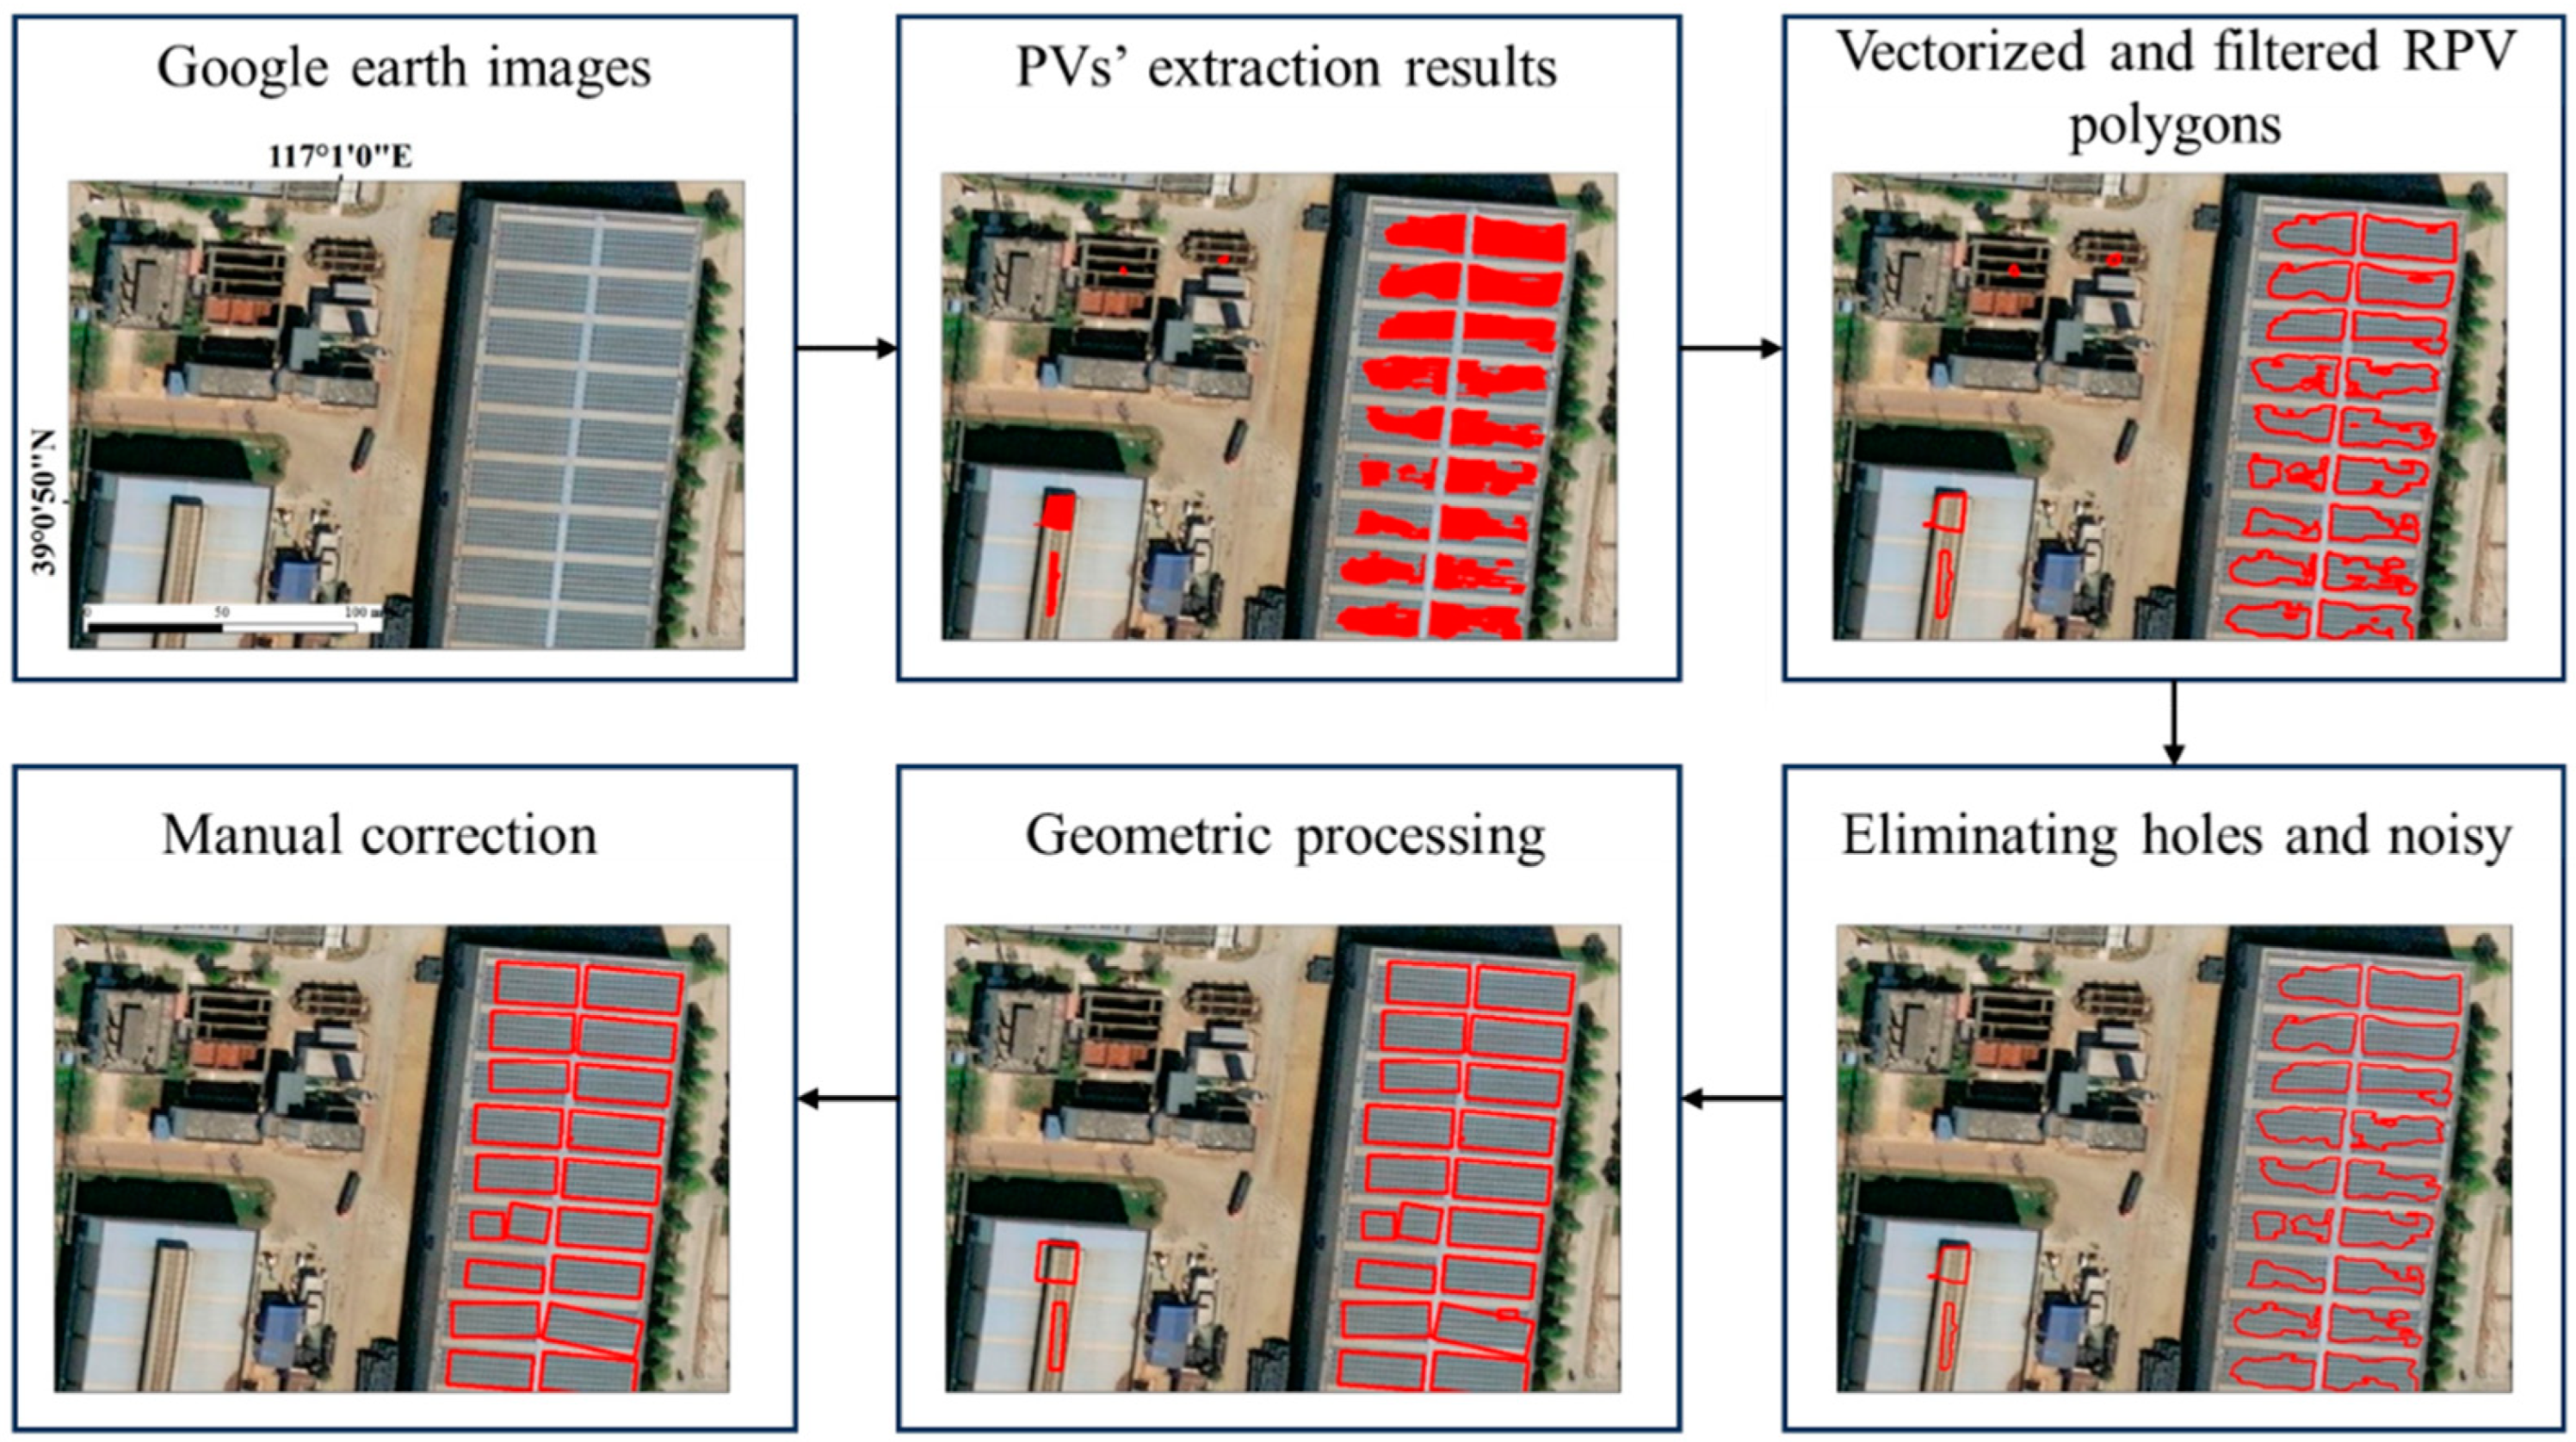
- Postprocessing
- (4)
- Model validation and accuracy assessment
2.3.2. Estimation of RPVs’ Impact
- (1)
- Power generation impact of RPVs
- (2)
- Environmental impact of RPVs
- (3)
- Economic impact of RPVs
3. Results
3.1. Accuracy Evaluation of Adapted U-Net Model
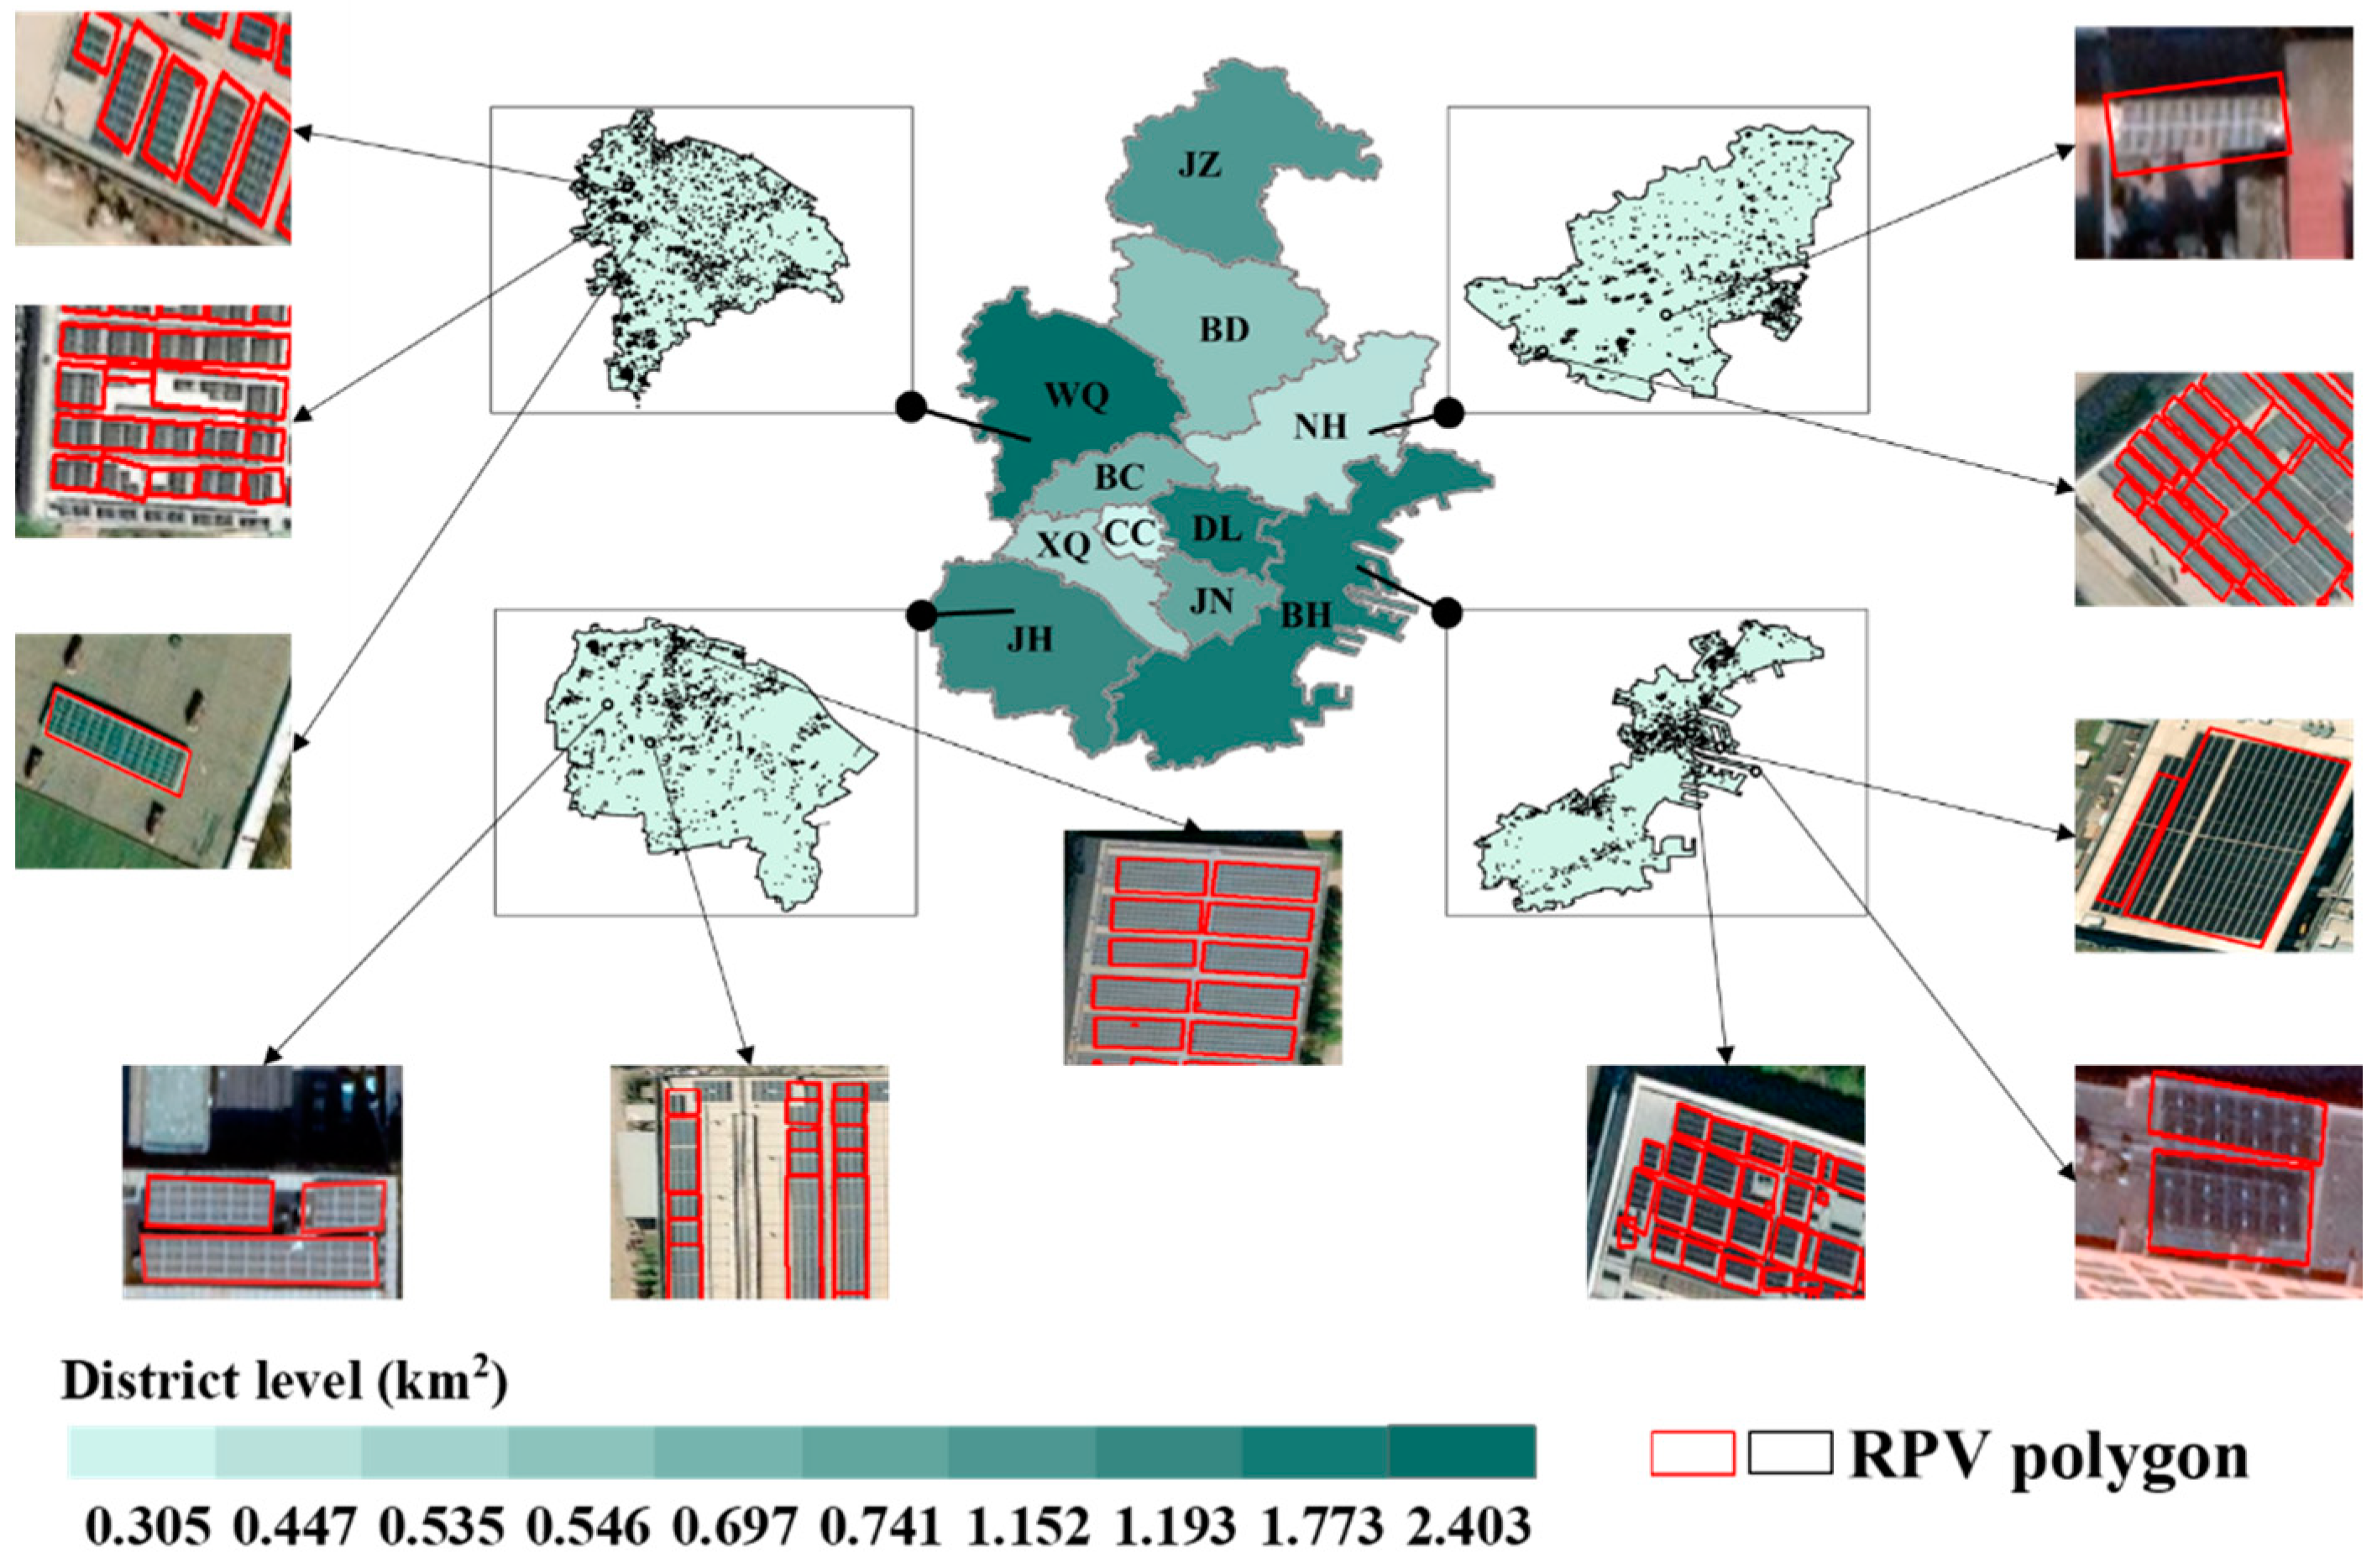
3.2. Extraction of Currently Installed RPVs
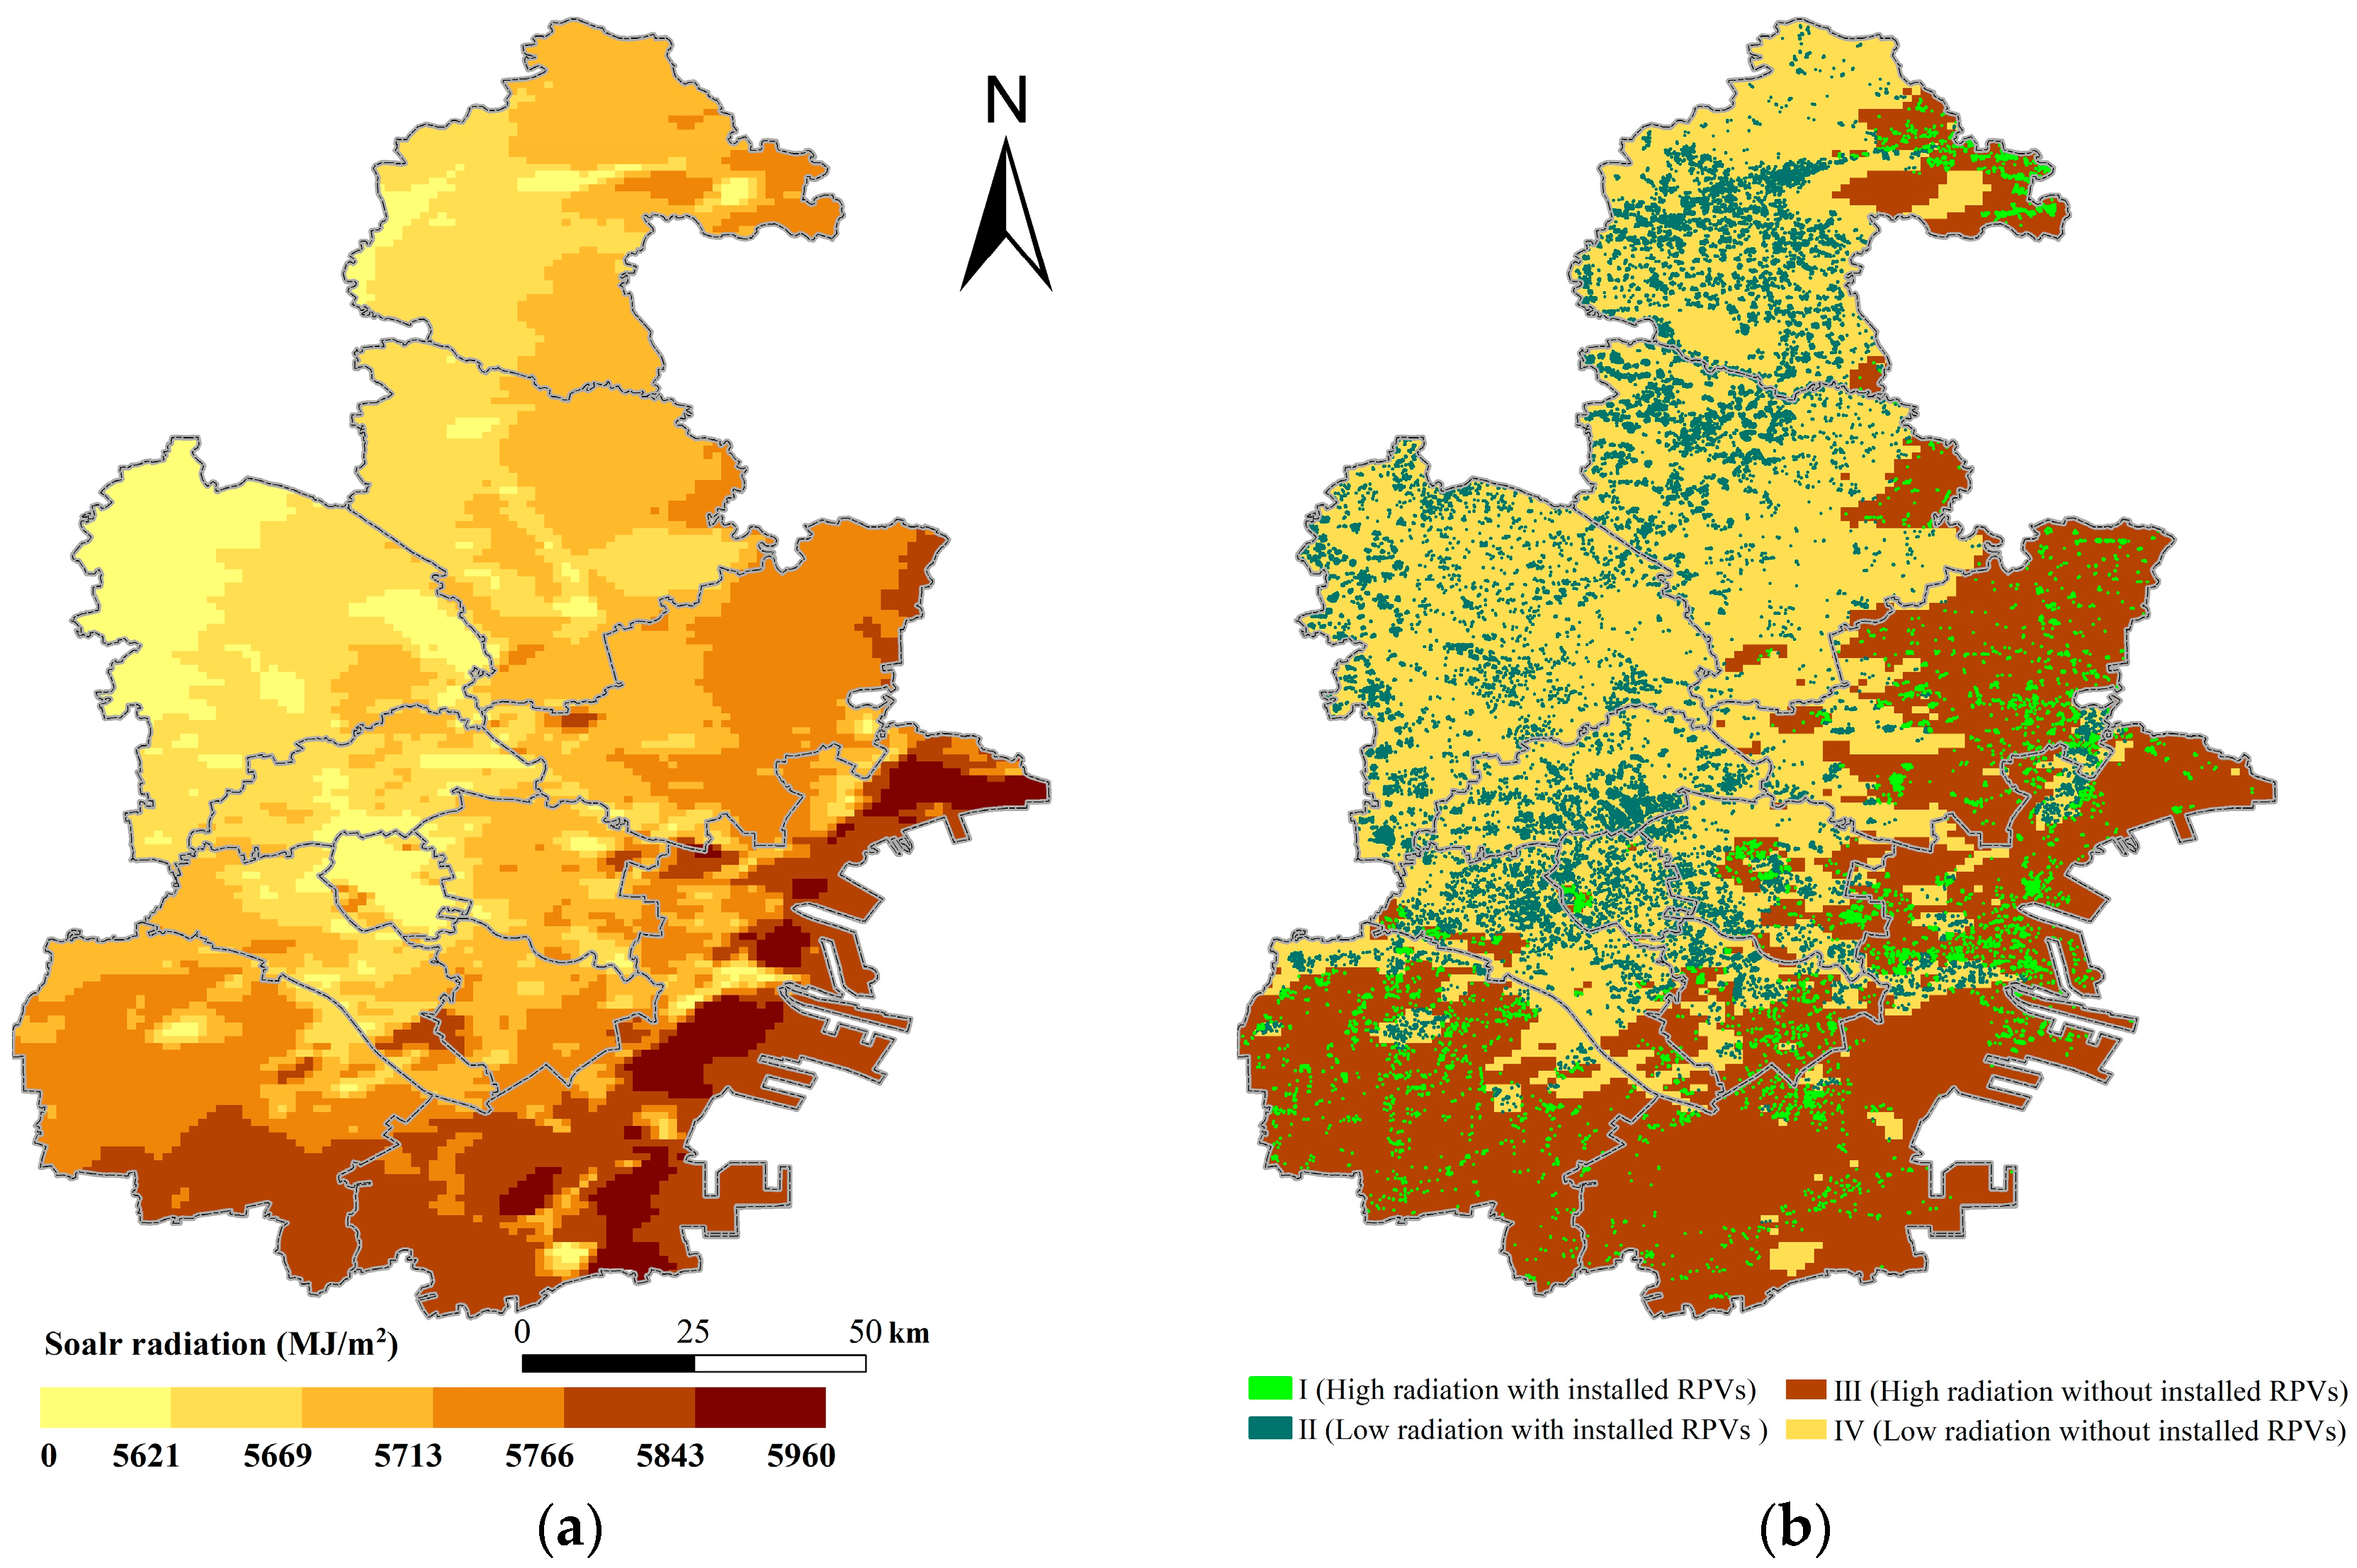
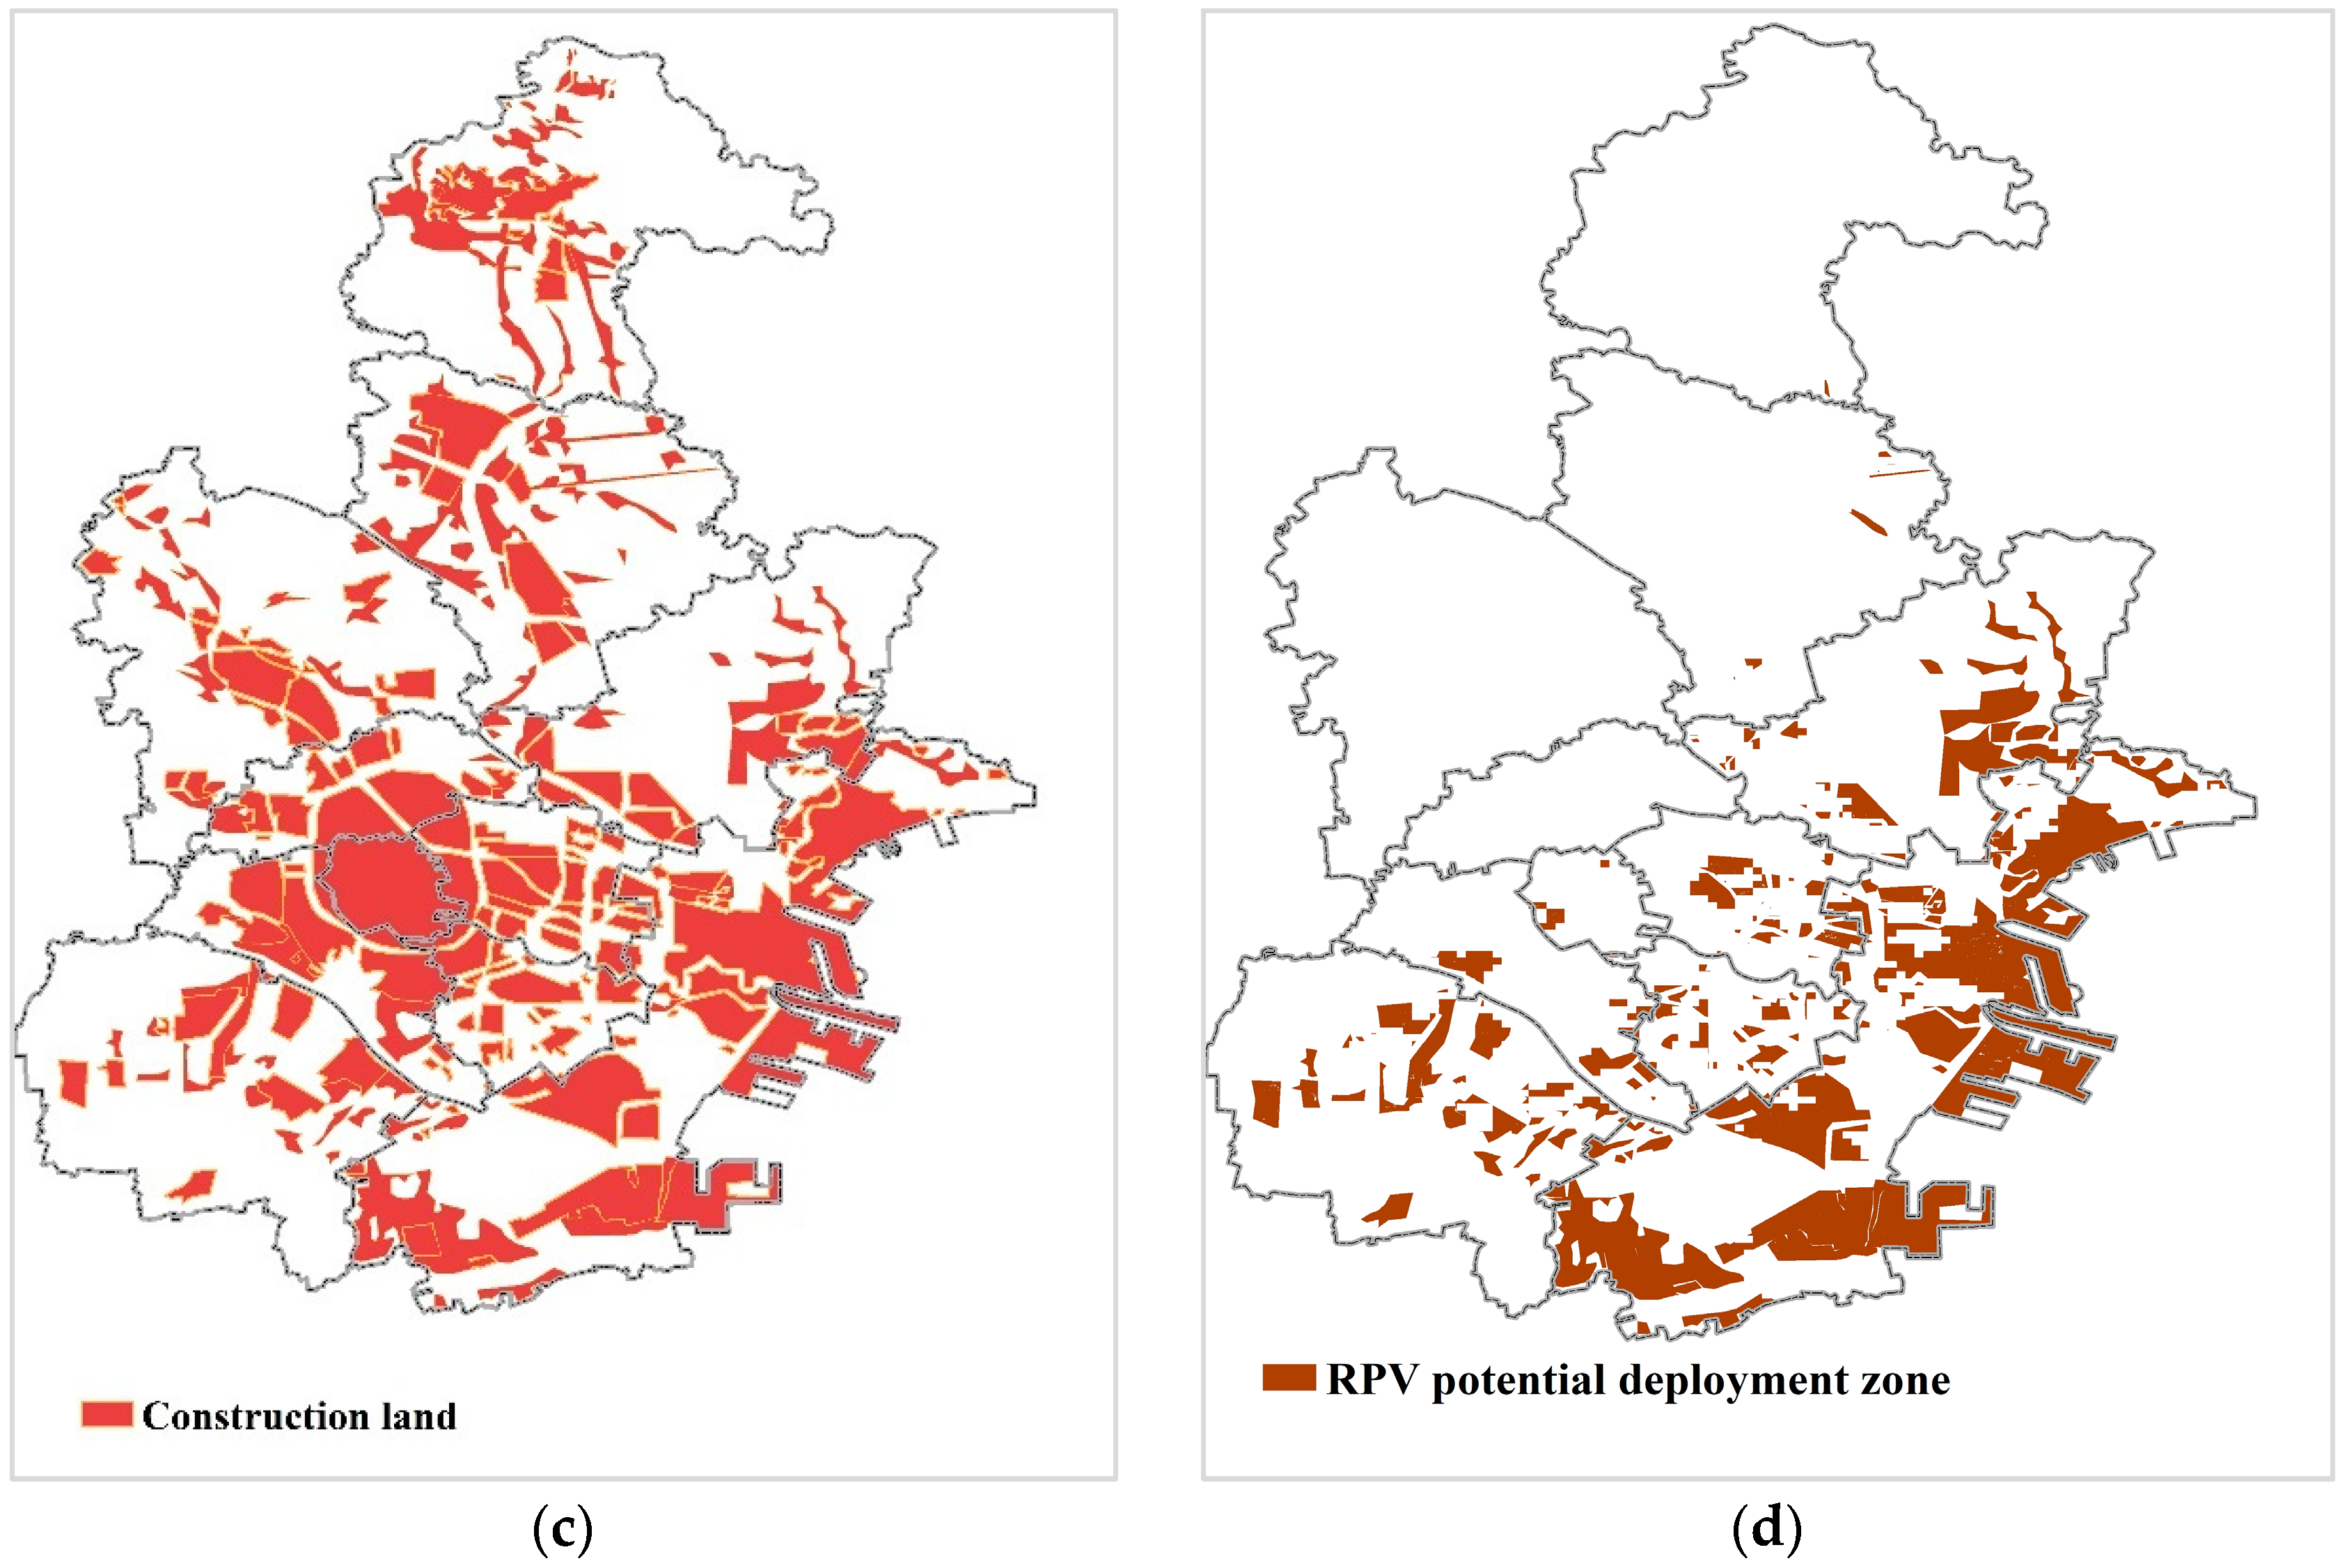
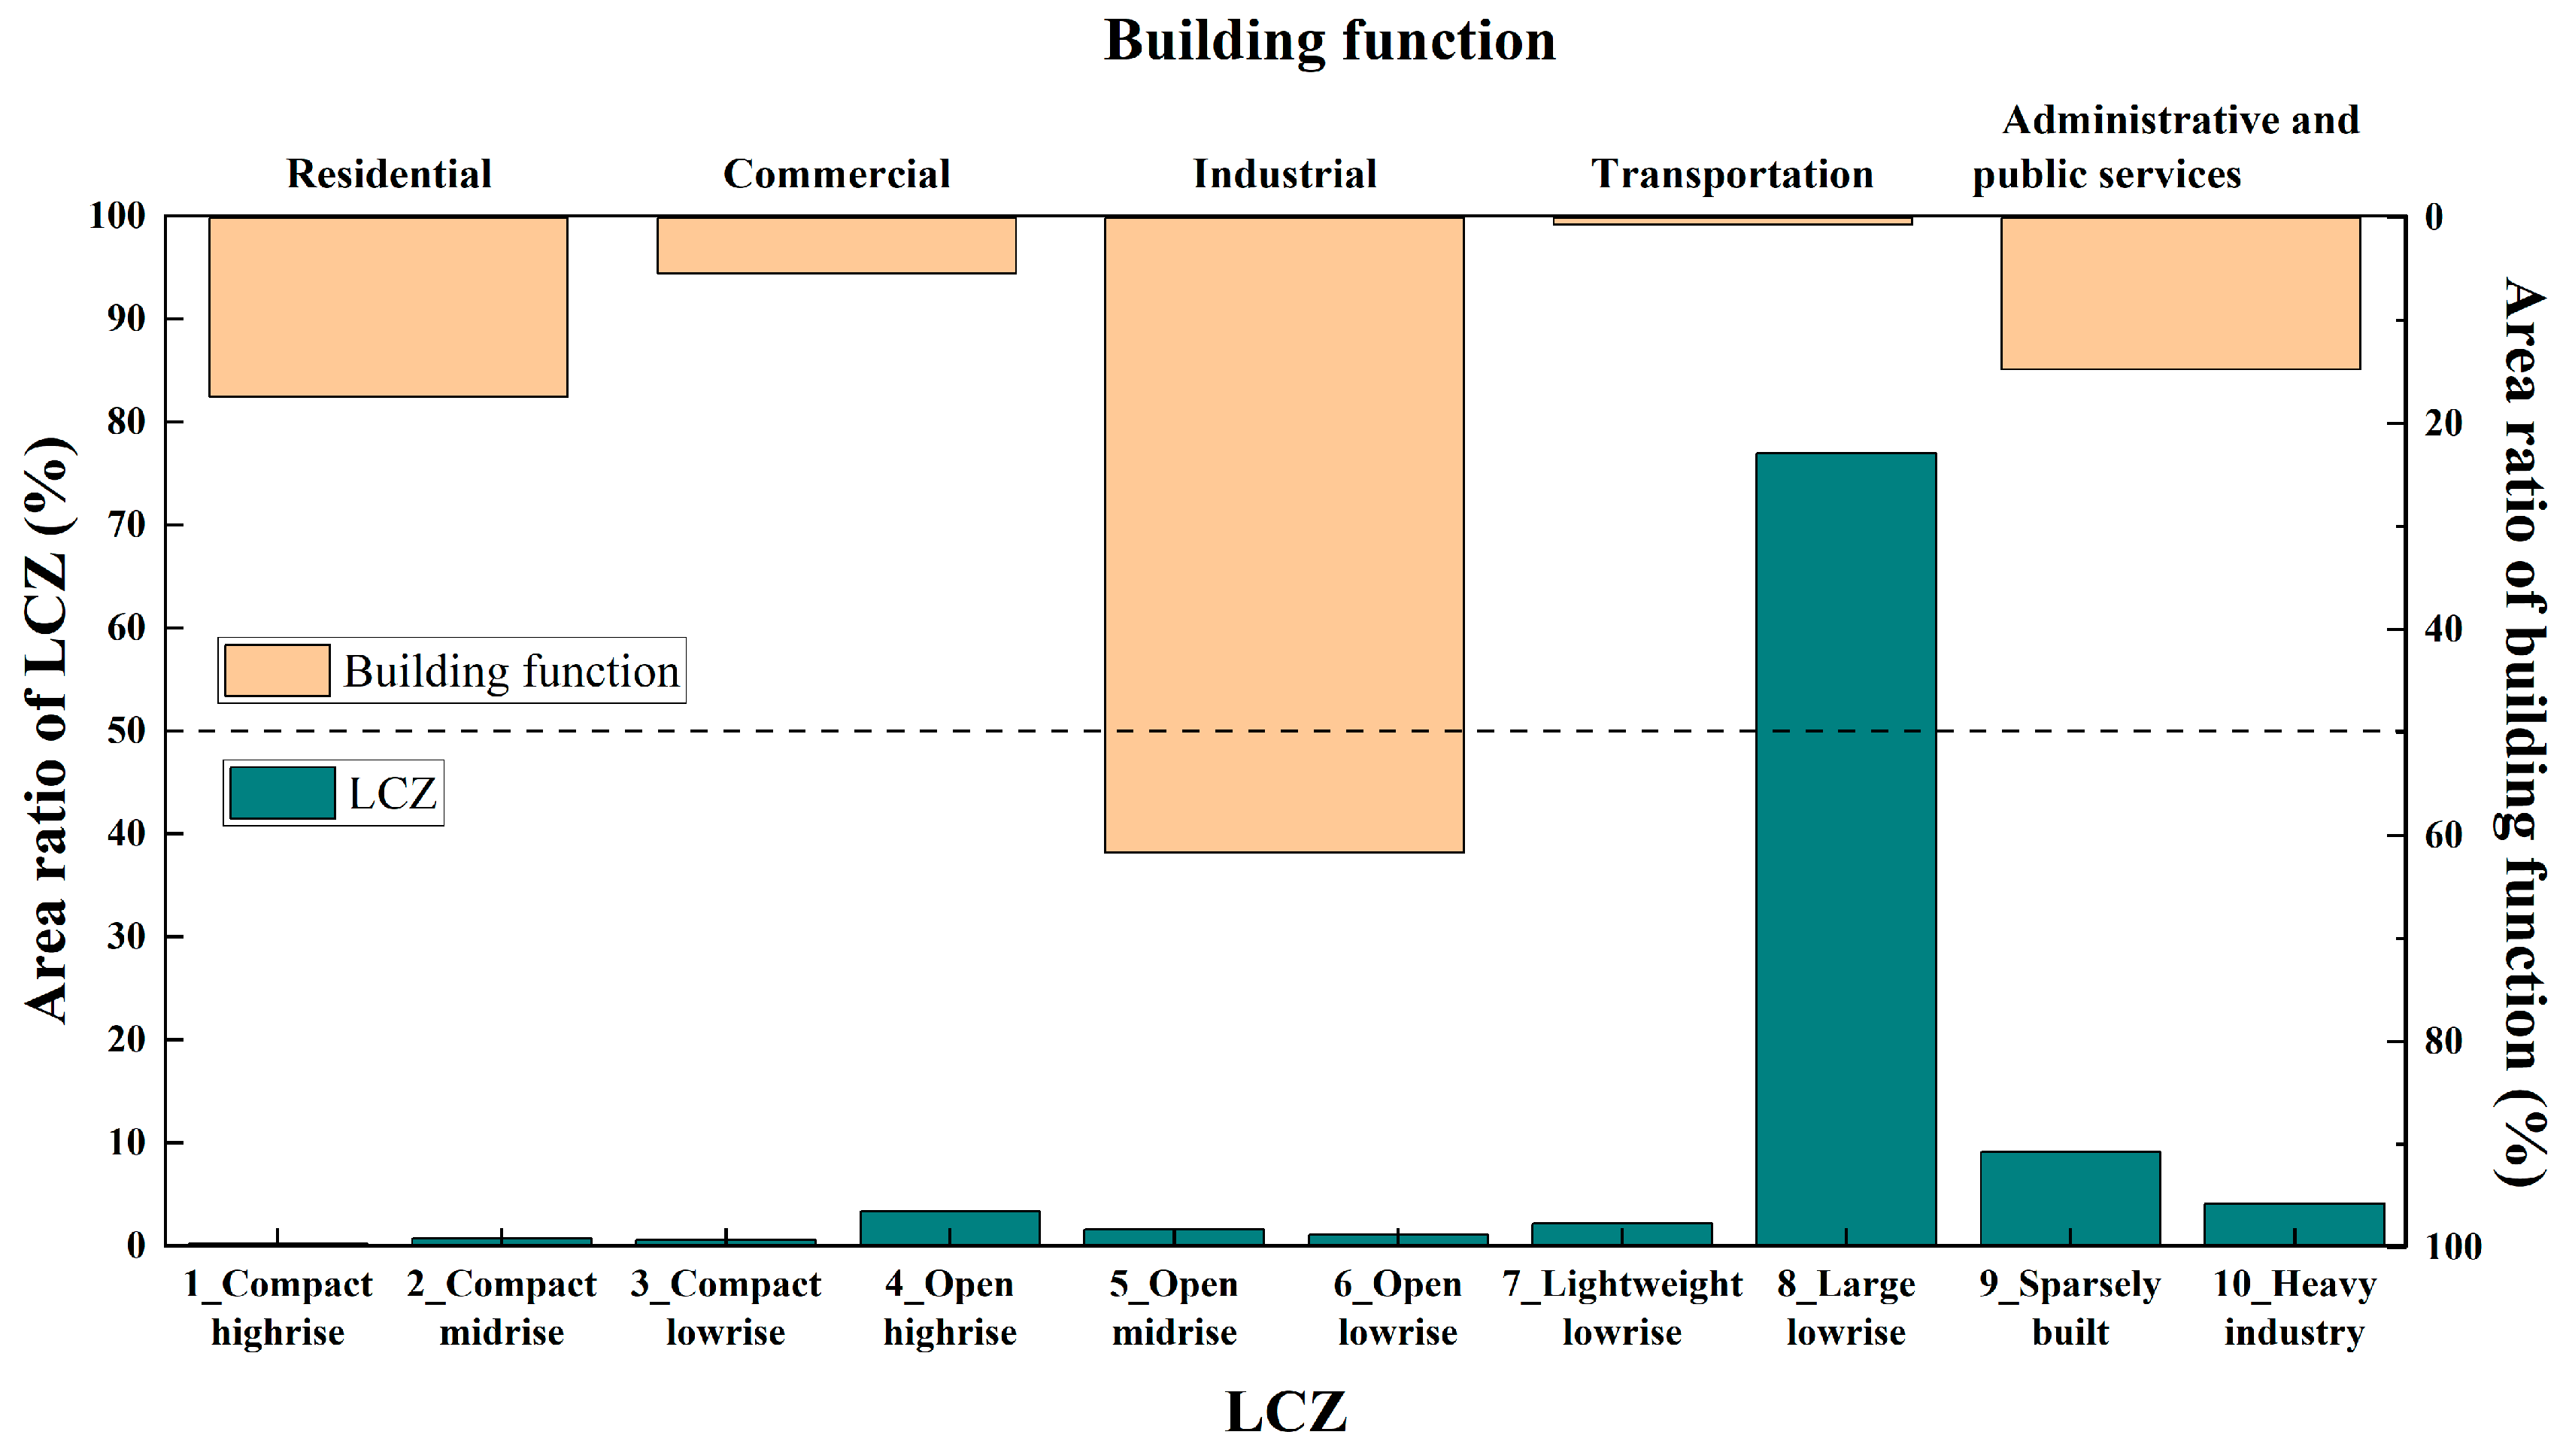
3.3. Determination of RPV Potential Deployment Zone
4. Discussion
5. Conclusions
Author Contributions
Funding
Data Availability Statement
Acknowledgments
Conflicts of Interest
Abbreviations
| PV | Photovoltaic |
| RPV | Rooftop photovoltaic |
| B | Blue band of images |
| G | Green band of images |
| TP | True positive |
| FP | False positive |
| TN | Ture negative |
| FN | False negative |
| Power generation of installed RPV | |
| Area of installed RPVs | |
| GTI | Tilted radiation at optimum angle |
| CE | Conversion efficiency of the PV panels |
| OE | Overall efficiency for the PV system |
| Capacity of current installed RPVs | |
| Rated power of PV panels | |
| RPV power generation in the potential deployment zone | |
| Area of potential deployment zone | |
| Conversion factors adjusting the to the suitable rooftop area of PV | |
| Potential installed capacity in the potential deployment zone | |
| Environmental impact based on RPVs’ current status and future potential zone | |
| EF | Thermoelectric emission factor |
| NPV | Net present value |
| Initial investment cost of RPV system | |
| Operation and maintenance cost of RPV system | |
| Proportion of self-consumed electricity power | |
| Customer-side electricity price | |
| On-grid tariff | |
| r | Social discount rate |
| LCZ | Local climate zone |
| IoU | Intersection over Union |
Appendix A


| Sources | Study Areas | PV Type | Models | Precision Evaluation |
|---|---|---|---|---|
| [41] | Swiss | Rooftop PV | U-Net | IoU: 64%, accuracy: 94%; F1-Score: 80% |
| [15] | Oldenburg, Germany | Rooftop PV | (1) U-Net (ResNet18); (2) U-Net (ResNet34); (3) U-Net (ResNet50); (4) U-Net (ResNet101) | (1) IoU = 65%, Precision = 83%, Recall = 76%, F1-Score = 79%; (2) IoU = 68%, Precision = 84%, Recall = 77%, F1-Score = 80%; (3) IoU = 69%, Precision = 84%, Recall = 79%, F1-Score = 81%; (4) IoU = 68%, Precision = 86%, Recall = 76%; F1-Score = 81% |
| [55] | Fresno, Oxnard, Stockton | small-scale residential solar panels | (1) U-Net with trasfer learning; (2) U-Net without trasfer learning; (3) CrossNets (a cross-learning driven U-Net method); (4) Adaptive CrossNets | (1) mIoU: 72.792%, Variance: 1.286 × 10⁻⁴; (2) mIoU: 40.017%, Variance: 1.191 × 10⁻²; (3) mIoU: 74.268%, Variance: 2.481 × 10⁻⁵; (4) mIoU: 74.279%, Variance: 1.458 × 10⁻⁵ |
| [16] | Fresno, Stockton, Modesto | Rooftop PV | (1) SegNet (Eff-b1); (2) LinkNet; (3) U-Net; (4) FPN; (5) U-Net + GFM + EDN | (1) IoU: 66.97%, Precision: 83.48%, Recall: 77.20%, F1-Score: 80.22%; (2) IoU: 69.23%, Precision: 83.60%, Recall: 80.11%, F1-Score: 81.82%; (3) IoU: 70.28%, Precision: 83.83, Recall: 81.30%, F1-Score: 82.54%; (4) IoU: 71.11%, Precision: 84.79%, Recall: 81.50%, F1-Score: 83.11%; (5) IoU: 73.60%, Precision: 86.17%, Recall: 83.45%, F1-Score: 84.79% |
| [43] | Hai’an county, China | Rooftop PV | (1) U-Net; (2) RefineNet; (3) DeepLab v3+ | (1) IoU: 78.7%, Precision: 78.7%, Recall:90.0%, F1-Score: 86.4%; (2) IoU: 85.9%, Precision: 90.9%, Recall 89.7%, F1-Score: 90.3%; (3) IoU: 86.8%, Precision: 92.8%, Recall 89.4%, F1-Score: 91.1% |
| [56] | 17 cities around the world | Rooftop PV | U-Net: The coding layer of U-Net is replaced with a pre-trained Resnet50. (ResNet50) | Count Recall: 91.90%; Area Recall: 96.25% |
| [42] | Rwanda | solar home systems (<100 W) | U-Net (ResNet50) | For object: the maximum value of F1-Score is 79%. When the Recall is 89%, the Precision is 41%. |
| Recall (%) | Precision (%) | F1-Score (%) | IoU (%) | |
|---|---|---|---|---|
| Combination 1 | 91 | 93 | 92 | 85 |
| Combination 2 | 80 | 78 | 79 | 76 |
| Parameter | Low (%) | High (%) | Source | |
|---|---|---|---|---|
| CF | Conversion factor of suitable rooftop | 25 | 59 | [5,8,57] |
| CE | Conversion efficiency of the PV panels | 15 | 20 | [8,58,59] |
| OE | Overall efficiency of the PV system | 75 | 85 | [8,59] |
| TP (%) | TN (%) | FN (%) | FP (%) | |
|---|---|---|---|---|
| Value | 19.15 | 77.57 | 1.90 | 1.37 |
| RPV | Wind | Biomass (Agricultural Straw) | ||
|---|---|---|---|---|
| Lower Calorific Value = 15 MJ/kg | Lower Calorific Value = 18 MJ/kg | |||
| Power generation potential (GWh/km2) | 19.51 | 1.58 | 0.12 | 0.14 |
| Carbon reduction (MT/km2) | 1.62 × 10⁻² | 1.31 × 10⁻³ | 9.98 × 10⁻⁵ | 1.20 × 10⁻⁴ |
| SO2 reduction (KT/km2) | 3.12 × 10⁻³ | 2.53 × 10⁻⁴ | 1.92 × 10⁻⁵ | 2.30 × 10⁻⁵ |
| NOx reduction (KT/km2) | 3.49 × 10⁻³ | 2.83 × 10⁻⁴ | 2.15 × 10⁻⁵ | 2.58 × 10⁻⁵ |
| City | Main Building Function | Climate Conditions | Energy Consumption Patterns | |
|---|---|---|---|---|
| Climate | Sunshine Hours | |||
| Tianjin | Residential and industrial Buildings | Temperate Monsoon | 2500–2900 | Energy consumption is mainly coal-based, accounting for 45% of total energy consumption. Different industrial energy consumption: industry is the main energy-consuming sector, accounting for 77% of total consumption. |
| Nanjing | Residential, industrial and historical preservation buildings | Subtropical Monsoon | 2132 | Different industrial energy consumption: industry is the main energy-consuming sector, accounting for 61% of total consumption. |
| Guangzhou | Residential and commercial buildings | Subtropical Monsoon | 1880 | Different industrial energy consumption: the service industry is the main energy-consuming sector, accounting for 51% of total consumption. |
| Tianjin | Nanjing | Guangzhou | ||||
|---|---|---|---|---|---|---|
| Low | High | Low | High | Low | High | |
| Carbon reduction (MT/km2) | 0.016 | 0.058 | 1.778 | 2.074 | 0.094 | 0.153 |
| SO2 reduction (KT/km2) | 0.003 | 0.011 | 0.433 | 0.490 | 0.018 | 0.029 |
| NOx reduction (KT/km2) | 0.003 | 0.012 | 0.410 | 0.465 | 0.020 | 0.033 |
| Sources | This study | [59] | [65] | |||
References
- Cheng, L.; Zhang, F.; Li, S.; Mao, J.; Xu, H.; Ju, W.; Liu, X.; Wu, J.; Min, K.; Zhang, X.; et al. Solar energy potential of urban buildings in 10 cities of China. Energy 2020, 196, 117038. [Google Scholar] [CrossRef]
- Solar Energy. Available online: https://www.irena.org/Energy-Transition/Technology/Solar-energy (accessed on 10 October 2024).
- Global Market Outlook for Solar Power 2023–2027. Available online: https://www.solarpowereurope.org/insights/outlooks/global-market-outlook-for-solar-power-2023-2027 (accessed on 9 October 2024).
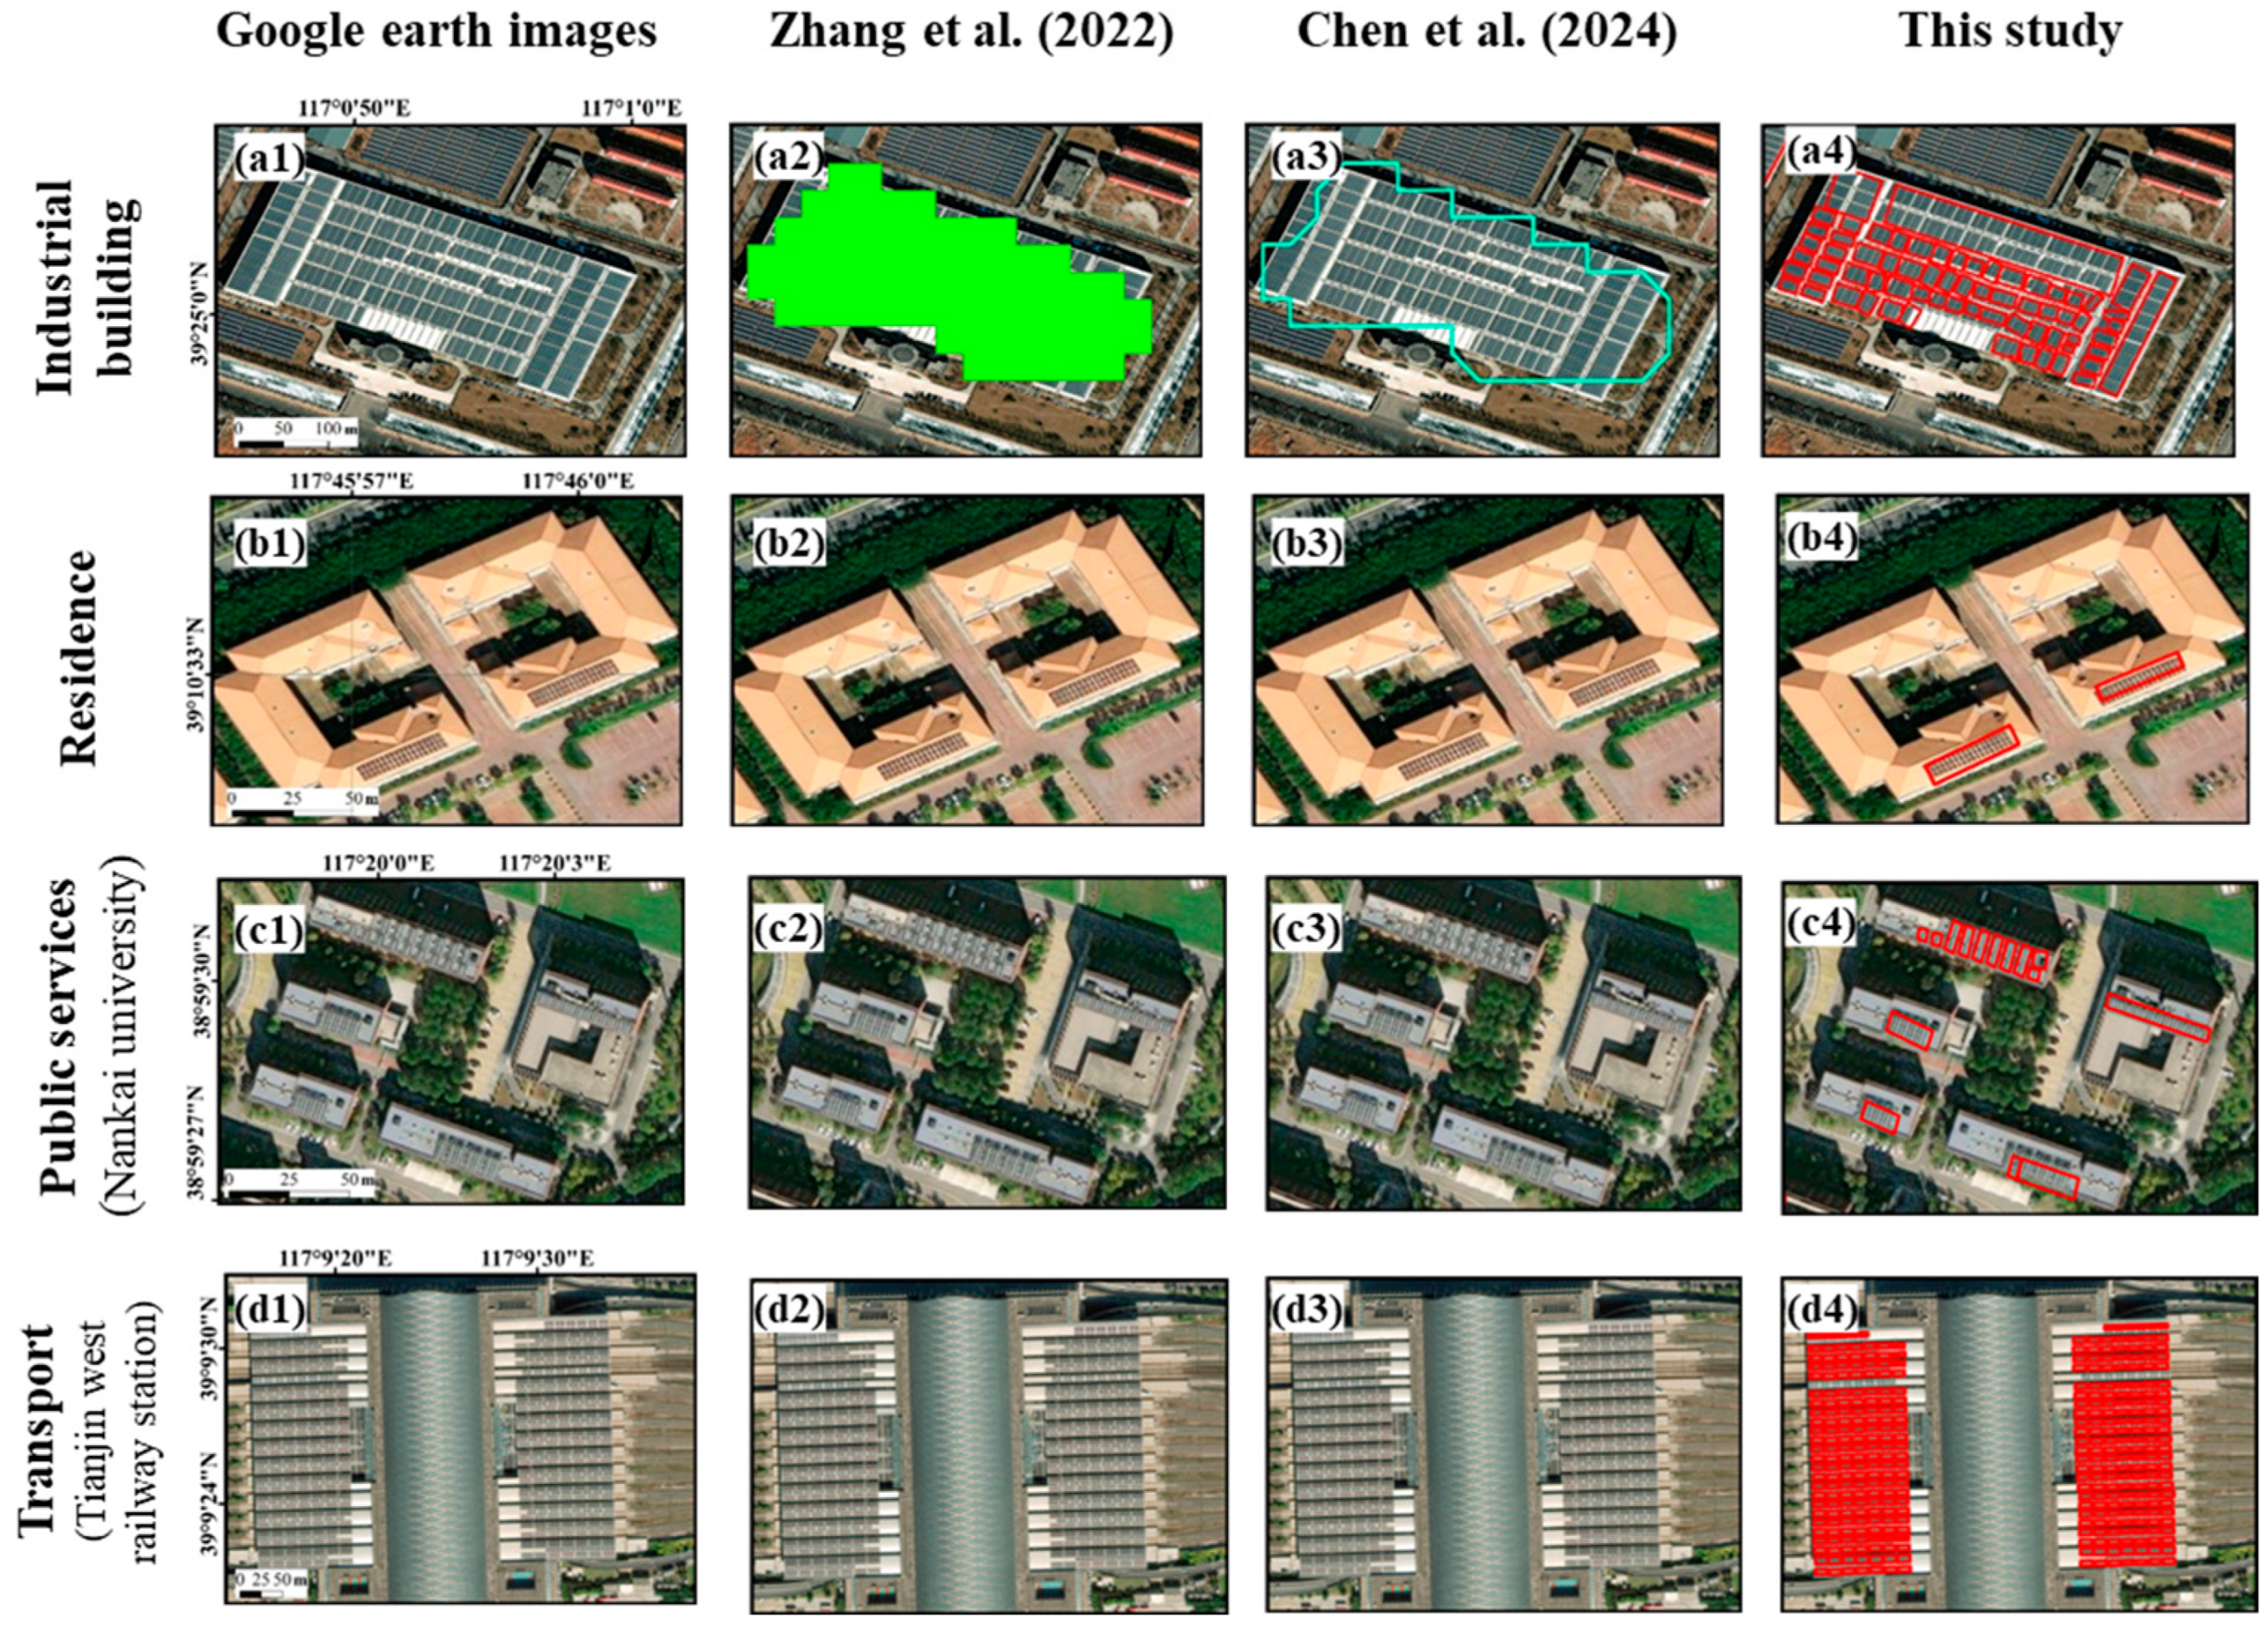
- Zhang, Z.; Pu, Y.; Sun, Z.; Qian, Z.; Chen, M. Assessment of rooftop photovoltaic potential considering building functions. Remote Sens. 2024, 16, 2993. [Google Scholar] [CrossRef]
- Jiang, H.; Yao, L.; Lu, N.; Qin, J.; Zhang, X.; Liu, T.; Zhang, X.; Zhou, C. Exploring the optimization of rooftop photovoltaic scale and spatial layout under curtailment constraints. Energy 2024, 293, 130721. [Google Scholar] [CrossRef]
- Wang, L.; Xu, S.; Gong, Y.; Ning, J.; Zhang, X.; Zhao, Y. High resolution photovoltaic power generation potential assessments of rooftop in China. Energy Rep. 2022, 8, 14545–14553. [Google Scholar] [CrossRef]
- Joshi, S.; Mittal, S.; Holloway, P.; Shukla, P.R.; Ó Gallachóir, B.; Glynn, J. High resolution global spatiotemporal assessment of rooftop solar photovoltaics potential for renewable electricity generation. Nat. Commun. 2021, 12, 5738. [Google Scholar] [CrossRef]
- Zhang, Z.; Chen, M.; Zhong, T.; Zhu, R.; Qian, Z.; Zhang, F.; Yang, Y.; Zhang, K.; Santi, P.; Wang, K.; et al. Carbon mitigation potential afforded by rooftop photovoltaic in China. Nat. Commun. 2023, 14, 2347. [Google Scholar] [CrossRef]
- Gernaat, D.E.H.J.; de Boer, H.; Dammeier, L.C.; van Vuuren, D.P. The role of residential rooftop photovoltaic in long-term energy and climate scenarios. Appl. Energy 2020, 279, 115705. [Google Scholar] [CrossRef]
- Ni, H.; Wang, D.; Zhao, W.; Jiang, W.; Mingze, E.; Huang, C.; Yao, J. Enhancing rooftop solar energy potential evaluation in high-density cities: A Deep Learning and GIS based approach. Energy Build. 2024, 309, 113743. [Google Scholar] [CrossRef]
- Qi, Q.; Zhao, J.; Tan, Z.; Tao, K.; Zhang, X.; Tian, Y. Development assessment of regional rooftop photovoltaics based on remote sensing and deep learning. Appl. Energy 2024, 375, 124172. [Google Scholar] [CrossRef]
- Samhat, A.; Shi, Y.; Zhu, X.; Faour, G.; Ghandour, A. Lebanon solar rooftop potential assessment using buildings segmentation from aerial images. IEEE J. Sel. Top. Appl. Earth Obs. Remote Sens. 2022, 15, 4909–4918. [Google Scholar]
- The Construction of Photovoltaic Power Generation in 2016. Available online: https://www.nea.gov.cn/ (accessed on 9 September 2024).
- The Construction of Photovoltaic Power Generation in 2023. Available online: https://www.nea.gov.cn/2024-02/28/c_1310765696.htm (accessed on 9 September 2024).
- Zech, M.; Ranalli, J. Predicting PV areas in aerial images with deep learning. In Proceedings of the 2020 47th IEEE Photovoltaic Specialists Conference (PVSC), Calgary, AB, Canada, 15 June–21 August 2020. [Google Scholar] [CrossRef]
- Jie, Y.; Yue, A.; Liu, S.; Huang, Q.; Chen, J.; Meng, Y.; Deng, Y.; Yu, Z. Photovoltaic power station identification using refined encoder–decoder network with channel attention and chained residual dilated convolutions. J. Appl. Remote Sens. 2020, 14, 1. [Google Scholar] [CrossRef]
- Outline of the 14th Five-Year Plan for Tianjin’s National Economic and Social Development and the Long-Term Goal for 2035. Available online: https://www.tj.gov.cn/zwgk/szfwj/tjsrmzf/202102/t20210208_5353467.html (accessed on 9 September 2024).
- Pilot List for County Distributed Photovoltaic Development Projects. Available online: https://www.gov.cn/zhengce/zhengceku/2021-09/15/content_5637323.htm (accessed on 9 September 2024).
- Tianjin Urban and Rural Construction Field Carbon Peak Implementation Plan. Available online: https://zfcxjs.tj.gov.cn/xxgk_70/tzgg/202308/t20230817_6379811.html (accessed on 9 September 2024).
- Mao, H.; Chen, X.; Luo, Y.; Deng, J.; Tian, Z.; Yu, J.; Xiao, Y.; Fan, J. Advances and prospects on estimating solar photovoltaic installation capacity and potential based on satellite and aerial images. Renew. Sustain. Energy Rev. 2023, 179, 113276. [Google Scholar] [CrossRef]
- Historical Climate Data. Available online: https://worldclim.org/data/worldclim21.html (accessed on 9 September 2024).
- General Planning of Land Space of Tianjin (2021–2035). Available online: https://ghhzrzy.tj.gov.cn/zmhd_143/jcyjzj/202109/t20210923_5608995.html (accessed on 9 September 2024).
- Shi, Q.; Zhu, J.; Liu, Z.; Guo, H.; Gao, S.; Liu, M.; Liu, Z.; Liu, X. The last puzzle of global building footprints—Mapping 280 million buildings in East Asia based on VHR images. J. Remote Sens. 2024, 4, 0138. [Google Scholar] [CrossRef]
- Demuzere, M.; Kittner, J.; Martilli, A.; Mills, G.; Moede, C.; Stewart, I.D.; Van Vliet, J.; Bechtel, B. A global map of local climate zones to support earth system modelling and urban-scale environmental science. Earth Syst. Sci. Data 2022, 14, 3835–3873. [Google Scholar] [CrossRef]
- Gong, P.; Chen, B.; Li, X.; Liu, H.; Wang, J.; Bai, Y.; Chen, J.; Chen, X.; Fang, L.; Feng, S.; et al. Mapping essential urban land use categories in China (EULUC-China): Preliminary results for 2018. Sci. Bull. 2020, 65, 182–187. [Google Scholar] [CrossRef] [PubMed]
- Malof, J.M.; Bradbury, K.; Collins, L.M.; Newell, R.G. Automatic detection of solar photovoltaic arrays in high resolution aerial imagery. Appl. Energy 2016, 183, 229–240. [Google Scholar] [CrossRef]
- Malof, J.M.; Hou, R.; Collins, L.M.; Bradbury, K.; Newell, R. Automatic solar photovoltaic panel detection in satellite imagery. In Proceedings of the 2015 International Conference on Renewable Energy Research and Applications (ICRERA), Palermo, Italy, 22–25 November 2015; pp. 1428–1431. [Google Scholar]
- Kruitwagen, L.; Story, K.T.; Friedrich, J.; Byers, L.; Skillman, S.; Hepburn, C. A global inventory of photovoltaic solar energy generating units. Nature 2021, 598, 604–610. [Google Scholar] [CrossRef] [PubMed]
- Chen, Y.; Zhou, J.; Ge, Y.; Dong, J. Uncovering the rapid expansion of photovoltaic power plants in China from 2010 to 2022 using satellite data and deep learning. Remote Sens. Environ. 2024, 305, 114100. [Google Scholar] [CrossRef]
- Ronneberger, O.; Fischer, P.; Brox, T. U-Net: Convolutional networks for biomedical image segmentation. In Proceedings of the Medical Image Computing and Computer-Assisted Intervention–MICCAI 2015: 18th International Conference, Munich, Germany, 5–9 October 2015; proceedings, part III. Springer: Berlin/Heidelberg, Germany, 2015; Volume 9351, pp. 234–241. [Google Scholar] [CrossRef]
- Muhammed, E.; El-Shazly, A.; Morsy, S. Building rooftop extraction using machine learning algorithms for solar photovoltaic potential estimation. Sustainability 2023, 15, 11004. [Google Scholar] [CrossRef]
- Joshi, B.; Baluyan, H.; Hinai, A.A.; Woon, W.L. Automatic rooftop detection using a two-stage classification. In Proceedings of the 2014 UKSim-AMSS 16th International Conference on Computer Modelling and Simulation, Cambridge, UK, 26–28 March 2014; pp. 286–291. [Google Scholar]
- Sun, T.; Shan, M.; Rong, X.; Yang, X. Estimating the spatial distribution of solar photovoltaic power generation potential on different types of rural rooftops using a deep learning network applied to satellite images. Appl. Energy 2022, 315, 119025. [Google Scholar] [CrossRef]
- Chen, G.; Li, X.; Liu, X.; Chen, Y.; Liang, X.; Leng, J.; Xu, X.; Liao, W.; Qiu, Y.; Wu, Q.; et al. Global projections of future urban land expansion under shared socioeconomic pathways. Nat. Commun. 2020, 11, 537. [Google Scholar] [CrossRef]
- Solar Photovoltaic Panel Size Guide. Available online: https://www.abpv360.com/a/9599 (accessed on 9 September 2024).
- Cebecauer, T.; Suri, M. Solar Performance Maps [Dataset]. Solargis. 2020. Available online: https://apps.solargis.com (accessed on 9 September 2024).
- Annual Report on China’s Electric Power Industry 2020. Available online: https://cec.org.cn/ (accessed on 9 September 2024).
- Bai, B.; Wang, Y.; Fang, C.; Xiong, S.; Ma, X. Efficient deployment of solar photovoltaic stations in China: An economic and environmental perspective. Energy 2021, 221, 119834. [Google Scholar] [CrossRef]
- China PV Industry Development Roadmap. Available online: https://www.chinapv.org.cn/Industry/resource_1380.html (accessed on 9 September 2024).
- Notice on Matters Related to the On-Grid Tariff Policy of PV Power Generation in 2020. Available online: https://www.ndrc.gov.cn/xxgk/zcfb/tz/202004/t20200402_1225031.html (accessed on 9 September 2024).
- Castello, R.; Roquette, S.; Esguerra, M.; Guerra, A.; Scartezzini, J. Deep learning in the built environment: Automatic detection of rooftop solar panels using convolutional neural networks. J. Phys. Conf. Ser. 2019, 1343, 12034. [Google Scholar] [CrossRef]
- Ren, S.; Malof, J.; Fetter, R.; Beach, R.; Rineer, J.; Bradbury, K. Utilizing geospatial data for assessing energy security: Mapping small solar home systems using unmanned aerial vehicles and deep learning. Isprs Int. J. Geo-Inf. 2022, 11, 222. [Google Scholar] [CrossRef]
- Jiang, H.; Yao, L.; Lu, N.; Qin, J.; Liu, T.; Liu, Y.; Zhou, C. Multi-resolution dataset for photovoltaic panel segmentation from satellite and aerial imagery. Earth Syst. Sci. Data 2021, 13, 5389–5401. [Google Scholar] [CrossRef]
- Zhang, X.; Xu, M.; Wang, S.; Huang, Y.; Xie, Z. Mapping photovoltaic power plants in China using Landsat, random forest, and Google Earth Engine. Earth Syst. Sci. Data 2022, 14, 3743–3755. [Google Scholar] [CrossRef]
- Lan, H.; Gou, Z.; Lu, Y. Machine learning approach to understand regional disparity of residential solar adoption in Australia. Renew. Sust. Energ. Rev. 2021, 136, 110458. [Google Scholar] [CrossRef]
- Chen, Y.; Liu, Y.; Slootweg, M.; Hu, M.; Tukker, A.; Chen, W. Unlocking rooftop potential for sustainable cities: A systematic review. Front. Eng. Manag. 2024. [Google Scholar] [CrossRef]
- Balta-Ozkan, N.; Yildirim, J.; Connor, P.M. Regional distribution of photovoltaic deployment in the UK and its determinants: A spatial econometric approach. Energy Econ. 2015, 51, 417–429. [Google Scholar] [CrossRef]
- Tianjin Statistical Yearbook 2024. Available online: https://stats.tj.gov.cn/nianjian/2024nj/zk/indexch.htm (accessed on 7 February 2025).
- He, G.; Kammen, D.M. Where, when and how much solar is available? A provincial-scale solar resource assessment for China. Renew. Energy 2016, 85, 74–82. [Google Scholar] [CrossRef]
- Tianjin Renewable Energy Development “14th Five-Year Plan”. Available online: https://fzgg.tj.gov.cn/zwgk_47325/zcfg_47338/zcwjx/fgwj/202201/t20220127_5791174.html (accessed on 7 February 2025).
- Tianjin South 1000 kV Substation Will Be Built Within the Year. Available online: https://news.bjx.com.cn/html/20140422/505715.shtml (accessed on 7 February 2025).
- 2023 Annual Report of State Grid Tianjin Electric Power Company Information Disclosure. Available online: http://www.tj.sgcc.com.cn/html/main/col2792/2024-03/26/20240326143137466720379_1.html (accessed on 6 February 2025).
- ORNL LandScan Viewer-Oak Ridge National Laboratory. Available online: https://landscan.ornl.gov/ (accessed on 8 February 2025).
- OpenStreetMap. Available online: https://download.geofabrik.de/ (accessed on 8 February 2025).
- Zhuang, L.; Zhang, Z.; Wang, L. The automatic segmentation of residential solar panels based on satellite images: A cross learning driven U-Net method. Appl. Soft Comput. 2020, 92, 106283. [Google Scholar] [CrossRef]
- Wu, A.N.; Biljecki, F. Roofpedia: Automatic mapping of green and solar roofs for an open roofscape registry and evaluation of urban sustainability. Landsc. Urban Plan. 2021, 214, 104167. [Google Scholar] [CrossRef]
- Jacobson, M.Z.; Delucchi, M.A.; Bauer, Z.A.F.; Goodman, S.C.; Chapman, W.E.; Cameron, M.A.; Bozonnat, C.; Chobadi, L.; Clonts, H.A.; Enevoldsen, P.; et al. 100% Clean and renewable wind, water, and sunlight all-sector energy roadmaps for 139 countries of the world. Joule 2017, 1, 108–121. [Google Scholar] [CrossRef]
- Li, J.; Wang, C.; Guo, J.; Xin, Y.; Zhang, N.; Liu, X.; Feng, K. Promoting sustainable development goals by optimizing city-level solar photovoltaic deployment in China. Environ. Sci. Technol. 2024. [Google Scholar] [CrossRef] [PubMed]
- Wang, P.; Yu, P.; Huang, L.; Zhang, Y. An integrated technical, economic, and environmental framework for evaluating the rooftop photovoltaic potential of old residential buildings. J. Environ. Manag. 2022, 317, 115296. [Google Scholar] [CrossRef]
- Zhang, J. Assessment of Renewable Energy Potentials Based on GIS and RS; Technische Universität Dortmund: Dortmund, Germany, 2015. [Google Scholar]
- Zhu, K.; Liu, Z.; Ou, X.; He, L.; Lin, J. Evaluation of energy-oriented utilization potential of main Chinese crop residues based on soil protection functions. Chin. J. Eco-Agric. 2017, 25, 276–286. [Google Scholar] [CrossRef]
- Introduction of Common Biomass Solid Pellet Fuel Parameters Calorvalue. Available online: http://www.china-nengyuan.com/tech/china-nengyuan_tech_45032.pdf (accessed on 7 February 2025).
- Biomass Power Generation Technology Summary and Comparative Analysis of Economic Benefits. Available online: https://news.bjx.com.cn/html/20181102/938930.shtml (accessed on 7 February 2025).
- China County Seat Construction Statistical Yearbook. Available online: https://navi.cnki.net/knavi/detail?p=QRNotohAzjyri1RqHZJaTsF1SQug-eBwO4N_E5_L9nwRVv6AsuhsScJF6v2GXep1m0s1_Cz0ldXfyLtpzI-imXv3gNPIcGzIne0Oq45X_O0=&uniplatform=NZKPT (accessed on 7 February 2025).
- Pan, D.; Bai, Y.; Chang, M.; Wang, X.; Wang, W. The technical and economic potential of urban rooftop photovoltaic systems for power generation in Guangzhou, China. Energy Build. 2022, 277, 112591. [Google Scholar] [CrossRef]


| Model | Recall (%) | Precision (%) | F1-Score (%) | IoU (%) | Source |
|---|---|---|---|---|---|
| U-Net (ResNet18) | 76 | 83 | 79 | 65 | [15] |
| U-Net (ResNet101) | 76 | 86 | 81 | 68 | |
| U-Net (ResNet34) | 77 | 84 | 80 | 68 | |
| U-Net (ResNet50) | 79 | 84 | 81 | 69 | |
| U-Net | / | / | 80 | 64 | [41] |
| U-Net | 81 | 84 | 83 | 70 | [16] |
| U-Net + GFM + EDN | 83 | 86 | 85 | 74 | |
| U-Net (ResNet50) | 89 | 41 | 79 | [42] | |
| U-Net | 90 | 79 | 86 | 79 | [43] |
| U-Net + ResNet50/RNN | 90 | 99 | / | 90 | [28] |
| U-Net | 86 | 94 | 90 | 81 | [29] |
| U-Net (ResNet50) + Transformer | 95 | 97 | 96 | 92 | |
| Adapted U-Net | 91 | 93 | 92 | 85 | This study |
Disclaimer/Publisher’s Note: The statements, opinions and data contained in all publications are solely those of the individual author(s) and contributor(s) and not of MDPI and/or the editor(s). MDPI and/or the editor(s) disclaim responsibility for any injury to people or property resulting from any ideas, methods, instructions or products referred to in the content. |
© 2025 by the authors. Published by MDPI on behalf of the International Society for Photogrammetry and Remote Sensing. Licensee MDPI, Basel, Switzerland. This article is an open access article distributed under the terms and conditions of the Creative Commons Attribution (CC BY) license (https://creativecommons.org/licenses/by/4.0/).
Share and Cite
Shan, M.; Xu, Y.; Sun, Y.; Wang, Y.; Li, L.; Qiao, Z.; Zuo, J. Deep-Learning-Based Evaluation of Rooftop Photovoltaic Deployment in Tianjin, China. ISPRS Int. J. Geo-Inf. 2025, 14, 101. https://doi.org/10.3390/ijgi14030101
Shan M, Xu Y, Sun Y, Wang Y, Li L, Qiao Z, Zuo J. Deep-Learning-Based Evaluation of Rooftop Photovoltaic Deployment in Tianjin, China. ISPRS International Journal of Geo-Information. 2025; 14(3):101. https://doi.org/10.3390/ijgi14030101
Chicago/Turabian StyleShan, Mei, Yue Xu, Yun Sun, Yuan Wang, Lei Li, Zhi Qiao, and Jian Zuo. 2025. "Deep-Learning-Based Evaluation of Rooftop Photovoltaic Deployment in Tianjin, China" ISPRS International Journal of Geo-Information 14, no. 3: 101. https://doi.org/10.3390/ijgi14030101
APA StyleShan, M., Xu, Y., Sun, Y., Wang, Y., Li, L., Qiao, Z., & Zuo, J. (2025). Deep-Learning-Based Evaluation of Rooftop Photovoltaic Deployment in Tianjin, China. ISPRS International Journal of Geo-Information, 14(3), 101. https://doi.org/10.3390/ijgi14030101