1. Introduction
With the rapid growth of global tourism, tourist cities are captivating visitors from around the world with their unique natural landscapes and rich cultural resources [
1]. However, traditional tourist maps, while functional, often lack artistic charm and cultural expression, rendering them insufficient to meet the evolving desires of tourists for leisure and cultural immersion [
2,
3]. In recent years, the incorporation of icon design has revitalized hand-drawn tourist maps [
4,
5]. By blending iconic landmarks, natural scenery, and local customs, these icons not only enhance the artistic appeal of maps, but also enrich tourists’ cultural experiences, transforming tourist maps into a meaningful emotional connection between travelers and destinations.
Despite their increasing popularity, the design and production of symbols for tourist maps remain challenging [
6]. High-quality symbol design demands a combination of strong artistic skills and creative vision from designers. However, creating a large collection of unique symbols from scratch is both time-consuming and labor-intensive, significantly impacting efficiency and raising costs. Fortunately, the abundance of tourist map resources available online provides an invaluable reference for symbol design. By extracting symbols from existing maps, it becomes possible to expand the symbol database and improve mapping efficiency. Therefore, leveraging computer technology to automate the extraction of map symbols presents a promising and innovative solution.
Map symbol extraction has undergone a significant evolution with technological advancement [
7]. Before the widespread application of deep learning, researchers primarily relied on traditional computer vision methods for map information extraction [
8,
9]. Chang Ahn [
10] developed a topographic map road extraction method based on conditional dilation operations in mathematical morphology; Chiang [
11,
12] achieved road recognition in raster maps through road intersection template extraction and subsequently improved road recognition accuracy in historical maps through line segment tracking. However, these traditional methods exhibited notable limitations when processing artistic symbols unique to hand-drawn tourist maps: insufficient symbol feature generalization, low segmentation accuracy, sensitivity to symbol deformation and style variations, and frequent requirements for extensive manual parameter adjustments.
The rapid development of deep learning technologies has brought breakthrough progress in symbol extraction [
13]. Researchers have developed various innovative approaches: Hao He [
14] pioneered use of the Structural Similarity Index (SSIM) as a loss function for road extraction, improving the F1 score by 2.6% compared to standard U-net methods; Husnul Hidayat [
15] employed Mask R-CNN to extract building contours from drone imagery; O’Hara Rob [
16] utilized convolutional neural networks to extract wetland symbols from historical maps; Arnau Garcia-Molsosa [
17] applied deep learning segmentation techniques to extract archaeological monument information from historical maps; Guo MingQiang [
18] addressed geological symbol detection using deep learning-based object detection technology. With the deepening integration of interdisciplinary concepts, the application scope of symbol extraction has expanded to engineering, music, and sketch symbols. Kaiyrbekov Kurmanbek [
19] proposed a neural network model for segmenting sketch symbols into stroke-level components; Eyad Elyan [
20] achieved the precise extraction of 25 common engineering symbols with 94% accuracy; and Paul Ashis [
21] realized accurate extraction of handwritten music symbols based on transfer learning. These studies demonstrate the significant advantages of deep learning in processing complex spatial objects, yet existing research has primarily focused on extracting regular geographical features and standardized symbols, lacking effective methods for processing artistic symbols in tourist maps characterized by diverse styles, complex boundaries, and significant variations in representation.
This study innovatively decomposes the map symbol extraction task into two core components: symbol detection and symbol segmentation. In the detection phase, we adopted the YOLO model as the object detection framework. This model not only significantly improves processing efficiency through its single-stage detection strategy, but also effectively reduces false detection rates through its global information-based prediction mechanism, enabling a more comprehensive understanding of symbol contextual relationships. In the segmentation phase, we introduce the cutting-edge SAM model to address the complex morphology of artistic symbols. SAM brings three major advantages to our method [
22]: its prompt-driven architecture precisely localizes target symbols in complex map backgrounds; its zero-shot learning capability adapts to diverse symbol styles without requiring additional training data; and its excellent boundary detail preservation ensures the artistic integrity of extracted symbols.
Based on this technical framework, we propose an automatic tourist map symbol extraction method combining YOLO and SAM. To address the current absence of specialized datasets for tourism maps, we developed a comprehensive tourism map dataset. This novel dataset encompasses five distinct categories of symbols: human landscapes, natural sceneries, humans, animals, and cultural elements. The dataset was meticulously curated by integrating both traditional paper maps and digital cartographic resources. Based on this dataset, we trained the YOLOv8x model to achieve high-precision symbol detection and introduced an interactive review mechanism to optimize detection results. These refined detection outputs subsequently serve as prompts for SAM, enabling precise symbol segmentation and extraction, ultimately achieving full automation of the symbol extraction and storage process. By integrating YOLO’s efficient detection capabilities with SAM’s precise segmentation performance, our method overcomes the limitations of traditional deep learning methods in processing tourist map symbols characterized by high artistic quality and style diversity. Moreover, this model collaboration approach enables us to incorporate detection effect review steps in the symbol extraction process, facilitating an in-depth analysis of extraction results at various stages and contributing to the continuous optimization of extraction accuracy and efficiency. Experimental results demonstrate that this method not only meets the requirements for automatic map symbol extraction and classification, but also provides map designers with a valuable symbol library, offering an effective solution for intelligent cartography and the digital management of tourist maps.
2. Materials and Methods
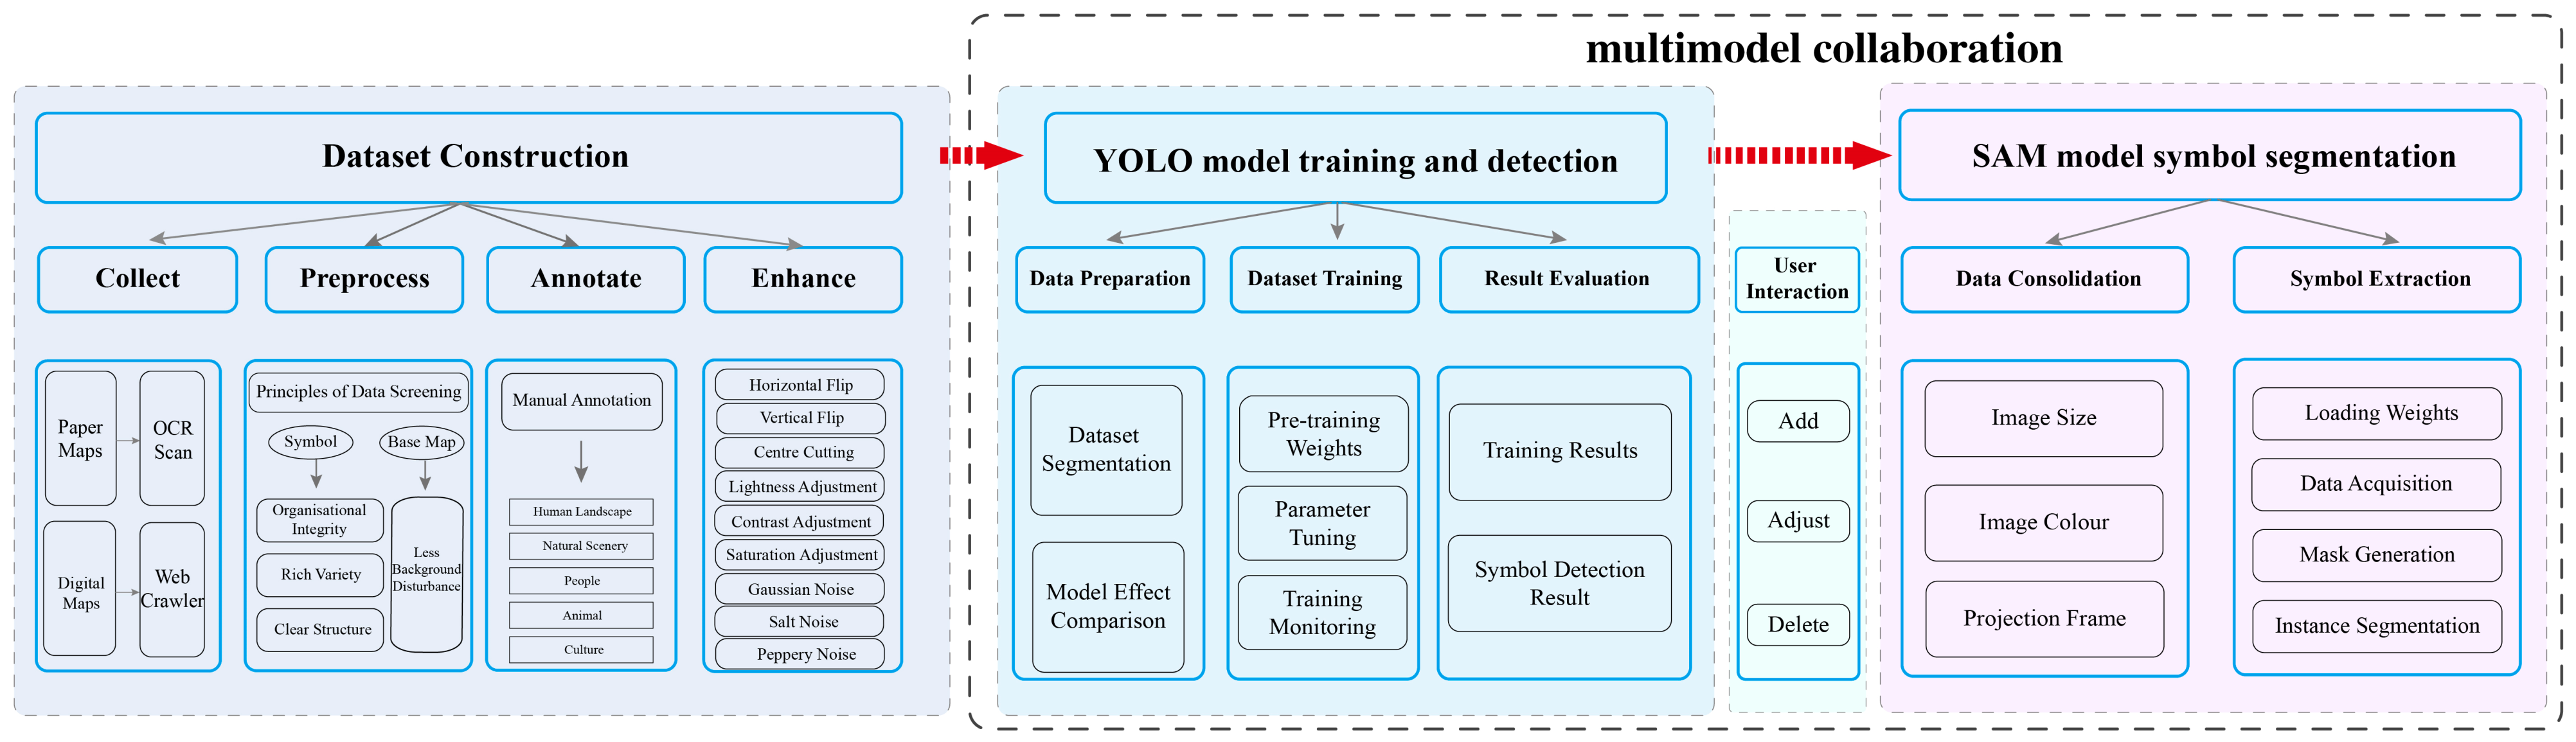
To fully leverage the strengths of different models, this article adopts a collaborative approach integrating YOLO and SAM for automated symbol extraction. Initially, the YOLO model was employed to swiftly identify the locations of symbols on tourist maps, delineating approximate rectangular regions where these symbols are situated. To mitigate the risk of missed detections by the YOLO model, we introduced a user interaction mechanism that enables users to manually review and amend the detection results. To ensure the precise retention of symbol details, the reviewed detection results were fed into the SAM for fine segmentation and category annotation. By combining the strengths of YOLO and SAM, YOLO efficiently detected symbol locations and provided rough region information, while SAM refined the boundaries within those regions to achieve high-precision symbol extraction. This multi-model collaboration strategy not only compensates for the segmentation limitations of single models, but also significantly improves the stability and practicality of symbol extraction. As shown in
Figure 1, we detail the proposed method in this section. First, we collected tourist map information from books and online sources, and constructed a tourist map dataset containing various icons through manual annotation and data augmentation. This ensures that the model can be generalized effectively in complex scenarios. Second, based on this dataset, we trained various YOLO model variants and selected the YOLOv8x model, which demonstrated the highest accuracy to detect symbols on maps and achieve high-precision detection results. Third, to further enhance detection accuracy, we implemented an improved a user interaction mechanism that allows users to manually adjust prediction boxes when detection results are unsatisfactory, thereby bolstering the accuracy and practicality of symbol extraction. Once symbol detection and manual adjustments are completed, the pre-trained SAM was applied to the detected symbol regions for fine segmentation, enabling high-precision symbol extraction.
The following sections describe the complete implementation steps of this method.
2.1. Dataset Construction
2.1.1. Data Collection and Preprocessing
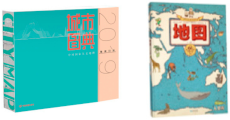
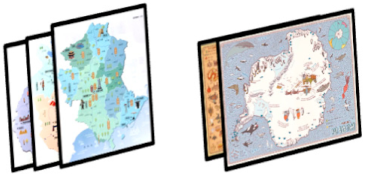
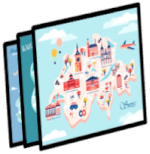
The construction of a tourism map dataset serves as the foundational task for symbol recognition using the YOLO model and significantly impacts the model’s ability to effectively identify symbols. Given the absence of directly usable tourism map datasets in the current research, we developed the dataset by leveraging OCR scanning on mobile devices and employing web scraping techniques to extract data from physical map collections and online sources (
Table 1). This approach ensures the dataset’s diversity and scientific rigor, accommodating various regional characteristics, symbol categories, and map styles.
By integrating OCR technology for scanning paper maps with web scraping techniques for retrieving digital maps, we collected a total of 1239 diverse tourist maps. To further ensure the scientific rigor of the dataset, we applied four selection criteria: the completeness of symbol organization, the richness of symbol categories, the clarity of symbol details, and the minimal background interference (
Table 2).
Following an initial quality assessment of the collected map images, we excluded those that were low-resolution, severely damaged, or failed to meet the selection criteria. This refinement process yielded a final initial dataset comprising 772 high-quality tourist map images.
2.1.2. Data Annotation
Manual annotation is a crucial step in constructing high-quality training datasets, as it directly influences the model’s detection accuracy and generalization performance. In this article, we employed the LabelImg tool to annotate the collected tourist map images, ensuring both the accuracy and consistency of the annotations. LabelImg is an open-source image annotation tool that supports various annotation formats, including XML and YOLO formats, which makes it highly compatible with YOLO models. Additionally, it provides a user-friendly graphical interface and an efficient annotation workflow.
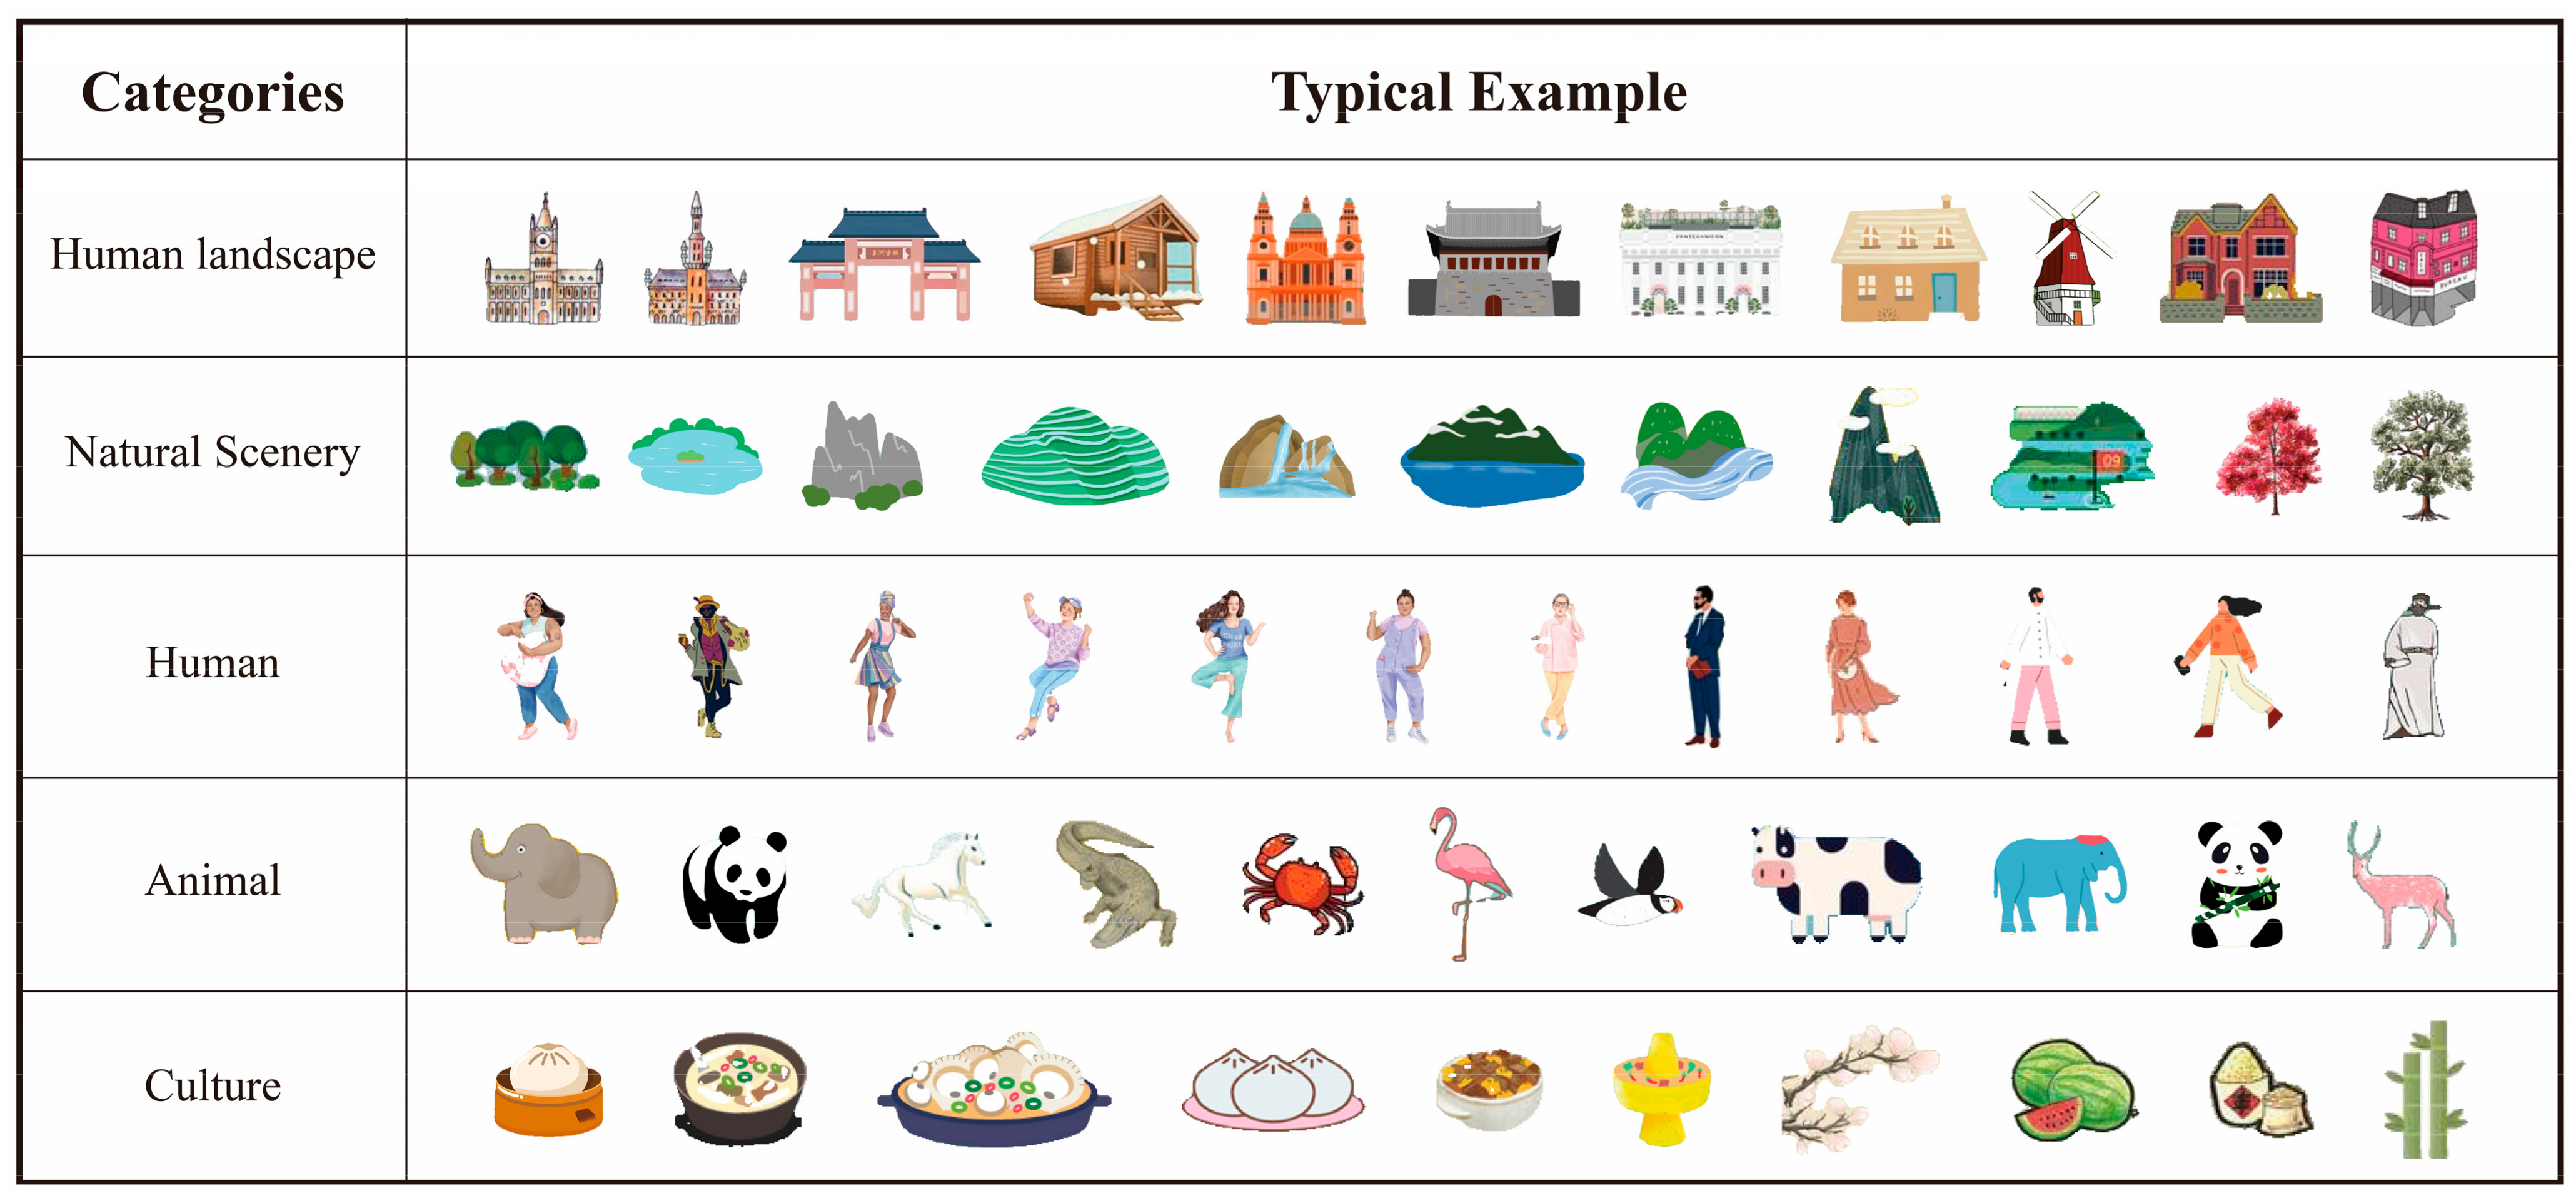
The selection of symbol categories was guided by their operational significance, relevance to tourist cartography, and a comprehensive analysis of symbol utilization patterns observed across 772 collected tourist maps. The objective was to systematically identify and categorize elements that enhance user comprehension and interaction in tourist map design. Based on this analysis, five distinct symbol categories were established for manual annotation, which are described and exemplified in
Table 3.
To enhance the quality and reliability of the annotated data, a double-review mechanism was implemented. Each image was independently annotated and reviewed by at least two annotators to minimize human errors and subjective biases. This approach effectively reduces potential inaccuracies in the annotation process, thereby ensuring a higher level of data consistency and reliability.
2.1.3. Data Augmentation
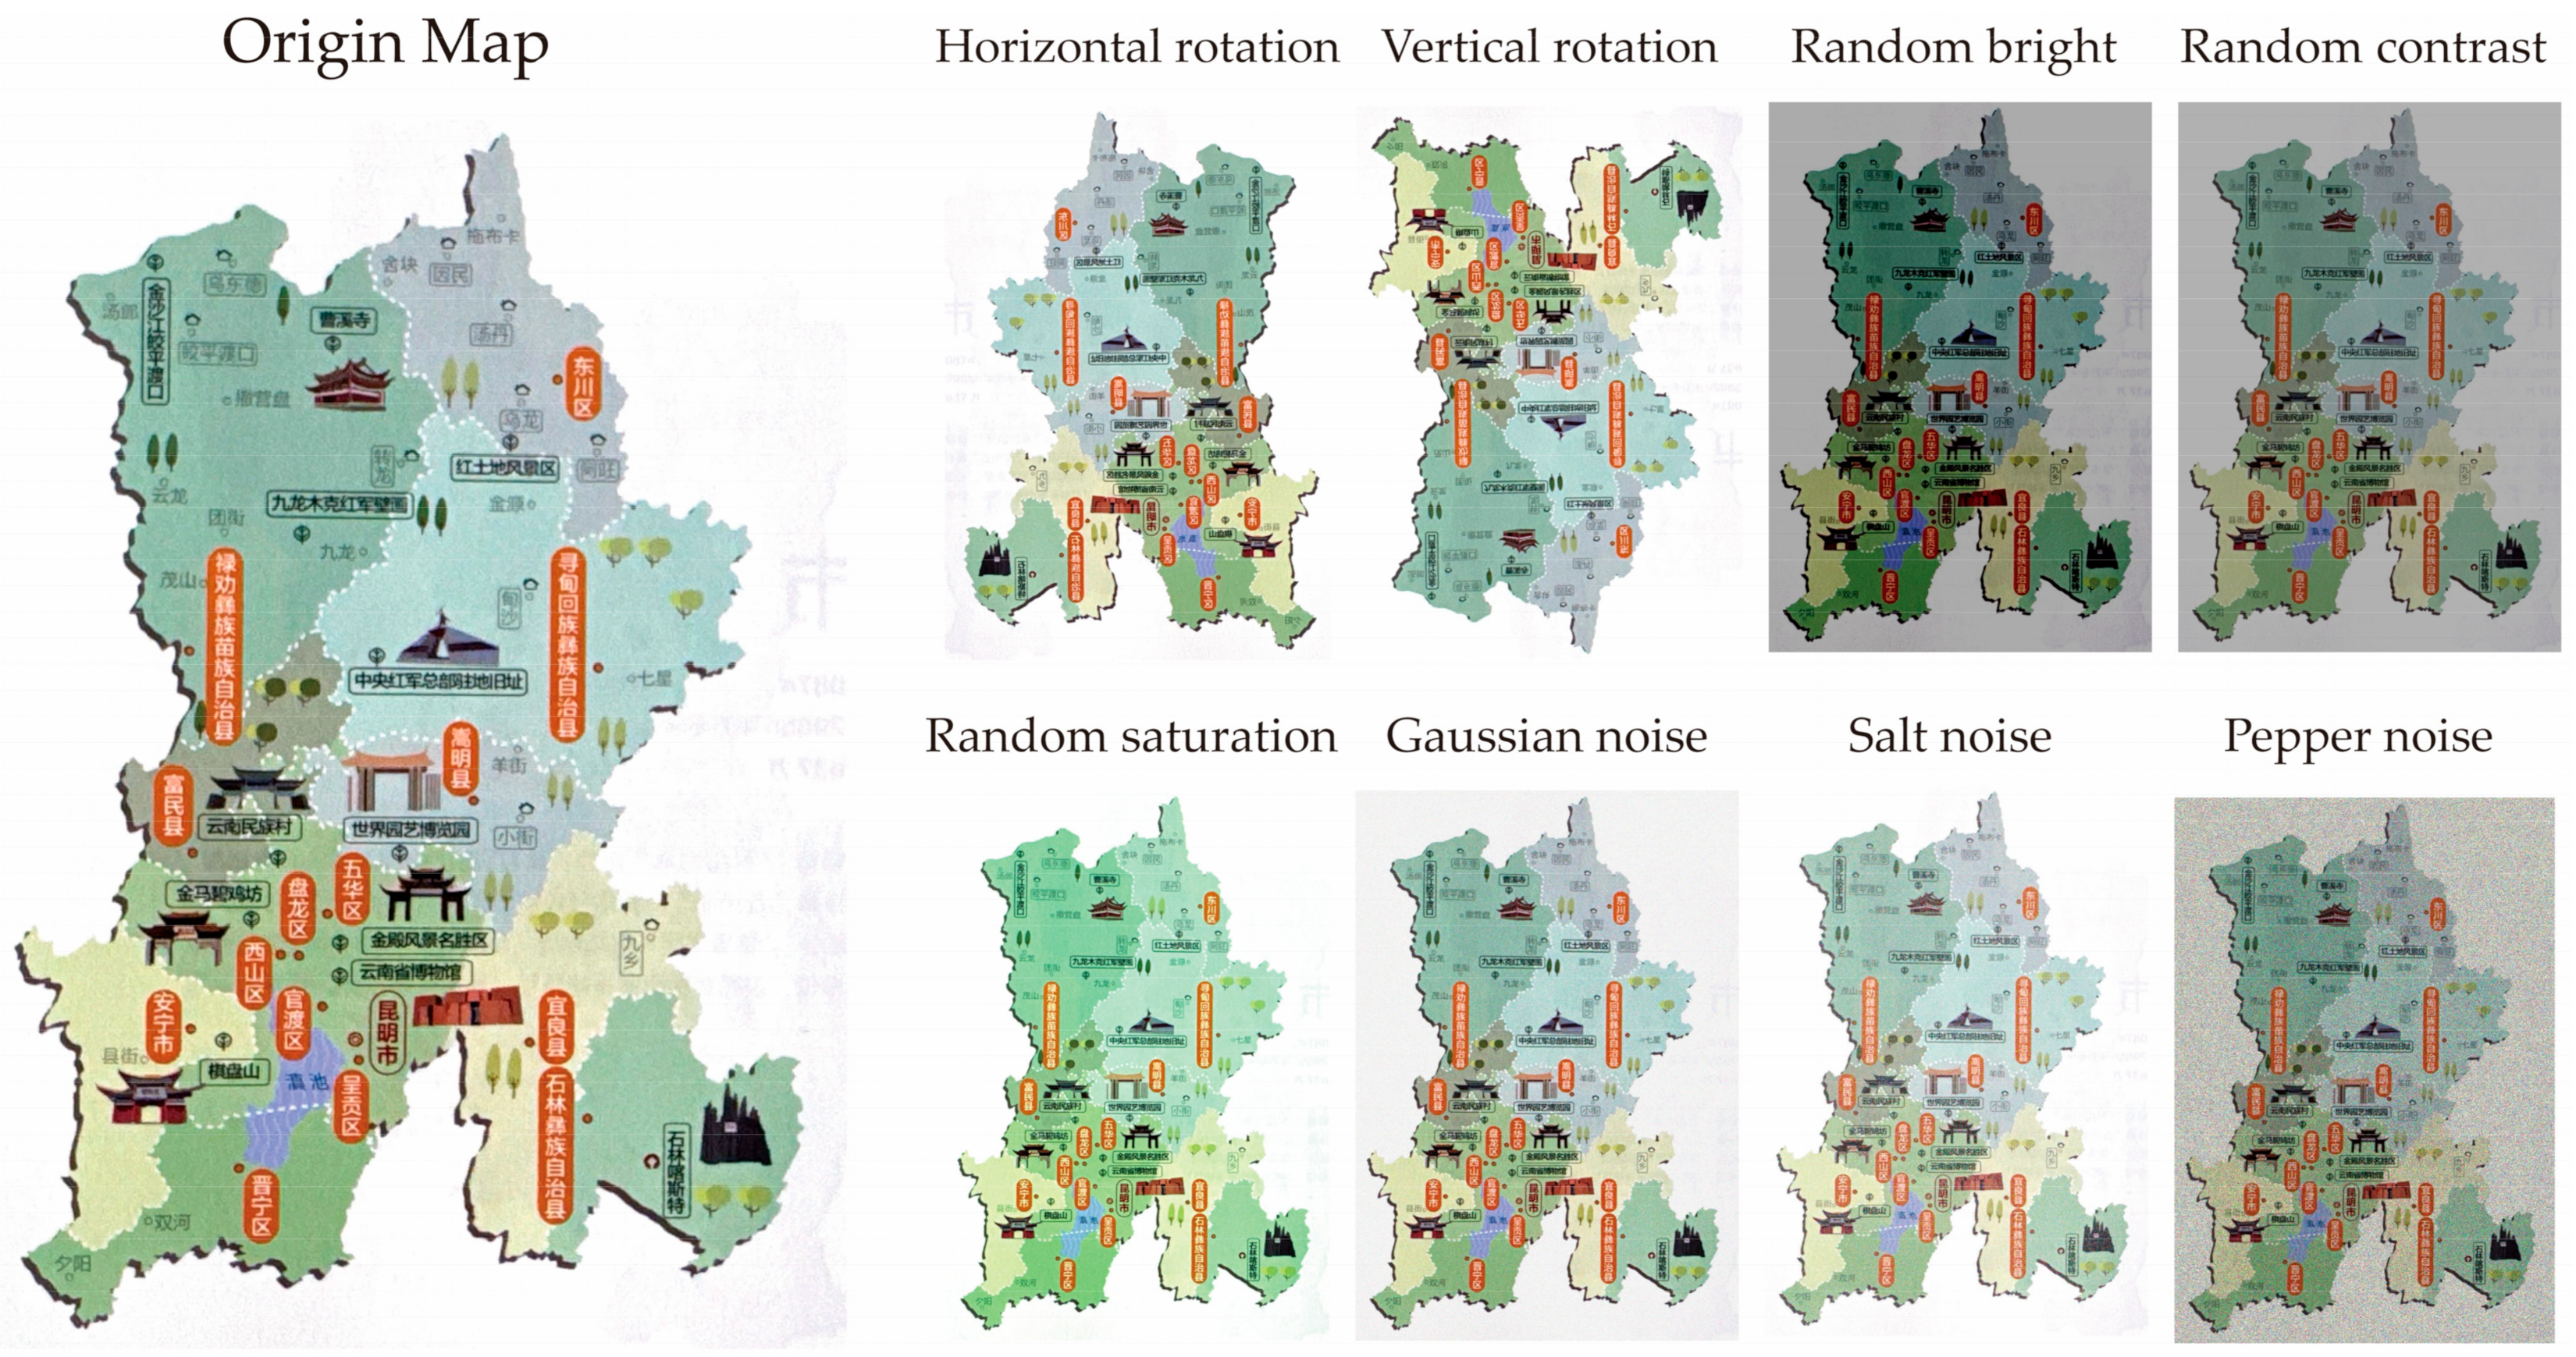
Data augmentation applies a series of transformations and processing techniques to the original data to generate additional samples. This process not only increases the size of the training set, but also mitigates the risk of overfitting and enhances the model’s generalization ability. In this article, various image augmentation techniques were employed to expand the original dataset. The specific methods utilized and their application ranges are detailed in
Table 4 and illustrated in
Figure 2.
Using the nine data augmentation techniques outlined above, we expanded the original dataset from 772 images to 4709 images. This substantial increase in dataset size not only significantly augmented the number of training samples, but also improved the model’s adaptability and robustness to various transformation conditions by introducing a diverse range of image variations. Furthermore, to ensure the accuracy of label information during data augmentation, the bounding box labels were adjusted and updated in tandem with the image transformations.
2.2. Collaborative Model Method for Symbol Extraction
2.2.1. YOLOv8
YOLOv8 [
23], developed by Ultralytics, is one of the most recent object detection models in the YOLO series and is widely utilized for object detection tasks [
24]. The network architecture of YOLOv8, as illustrated in
Figure 3, consists of three primary modules: backbone—responsible for extracting features from the input image; neck—integrates features from the backbone to enhance the model’s ability to detect objects at different scales; and head—outputs predictions, including object classes and bounding box locations.
Compared to earlier versions, YOLOv8 offers significant improvements in detection accuracy, processing speed, and sensitivity to small objects [
25,
26]. These enhancements make it particularly effective in environments with complex tasks and diverse symbol types. Leveraging these strengths, YOLOv8 excels at accurately locating target symbols and providing approximate boundaries, even amidst complex backgrounds. As a result, it is an ideal choice for initial symbol localization and target region marking.
Although YOLOv8 performs exceptionally well in object detection, its bounding box output is limited to providing rectangular box information, which poses certain limitations for detecting symbols with complex and irregular boundaries. This limitation is particularly evident in the detection of symbols on tourist maps, where landmarks and scenic elements often feature intricate and irregular edges. The rectangular boxes produced by YOLOv8 cannot accurately capture the actual contours of these symbols. Studies have indicated that such bounding boxes are primarily suitable for rough target detection, lacking the detailed contour precision required for tasks that demand highly refined extractions.
To address this limitation, this article proposes integrating YOLOv8 with the SAM, which specializes in fine-grained segmentation, to enhance YOLOv8’s boundary segmentation capabilities. In this collaborative framework, YOLOv8’s initial detection results serve as precise bounding box prompts for the segmentation model. This integration enables the segmentation model to concentrate on target regions and perform accurate boundary extraction, significantly improving the precision of symbol detection and segmentation.
2.2.2. SAM
SAM is an advanced image segmentation model with flexible capabilities for accurately segmenting target regions, even in complex backgrounds. The model primarily takes two inputs: an image and prompt information. Using the provided prompts, SAM generates segmentation masks to achieve precise cutting. Furthermore, SAM supports zero-shot segmentation tasks using its pre-trained model, significantly reducing many of the challenges associated with training.
SAM [
27] is built on the Vision Transformer (ViT), a cutting-edge algorithm in computer vision, as its backbone pre-trained model. ViT has three variants (
Table 5): ViT_h, ViT_l, and ViT_b, each offering varying levels of segmentation accuracy and efficiency [
28]. Generally, models with larger parameter sizes provide finer segmentation results but at the cost of reduced efficiency. Since our task focuses on symbol extraction from static maps, where segmentation accuracy is prioritized over efficiency, we selected ViT_h, the largest model variant, as the pre-trained model.
SAM provides three interaction modes (
Figure 4): Click, Box, and Everything. The Click and Box modes require human–machine interaction, while the Everything mode enables automatic image segmentation across the entire detection area.
2.2.3. Model Collaboration and User Interaction
In the task of symbol extraction, the collaborative mechanism between YOLOv8 and SAM leverages their respective strengths to achieve efficient and precise symbol detection and segmentation. This mechanism is implemented in two steps: YOLOv8 performs the initial detection of symbols, and SAM refines the segmentation of the detected regions. In our previous research, the YOLOv8x model was employed to detect symbols on tourist maps, generating preliminary bounding boxes and label information. To balance the relationship between false positives and false negatives in detection results, detections with confidence scores greater than 0.5 and IoU thresholds greater than 0.5 were retained for subsequent symbol extraction work.
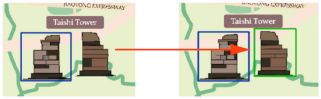
While the YOLOv8x symbol detection model, trained on the aforementioned tourist map datasets, demonstrates high-precision performance in symbol detection, and we have integrated additional visualization capabilities using the OpenCV library along with optional interactive functionality to address dataset limitations and accommodate the dynamic evolution of tourist map typologies. The system enables users to monitor detection results in real time during the symbol detection phase and evaluate whether the outcomes align with their intended objectives. If the results meet expectations, users can directly input the detection results into the SAM model for symbol extraction. Conversely, users can optimize detection results according to their specific requirements, thereby facilitating a user-centric automated symbol extraction process.
This interactive mechanism encompasses three modes: Add, Adjust, and Delete (
Table 6). Users can manually intervene in the bounding boxes generated by the YOLO model to improve the accuracy and completeness of the predictions. Specifically, the Add mode allows users to introduce missing bounding boxes for undetected symbols; the Adjust mode enables users to modify the position and size of existing bounding boxes; and the Delete mode permits users to remove incorrect bounding boxes. This user intervention significantly improves the accuracy and reliability of symbol detection by complementing the automated detection process.
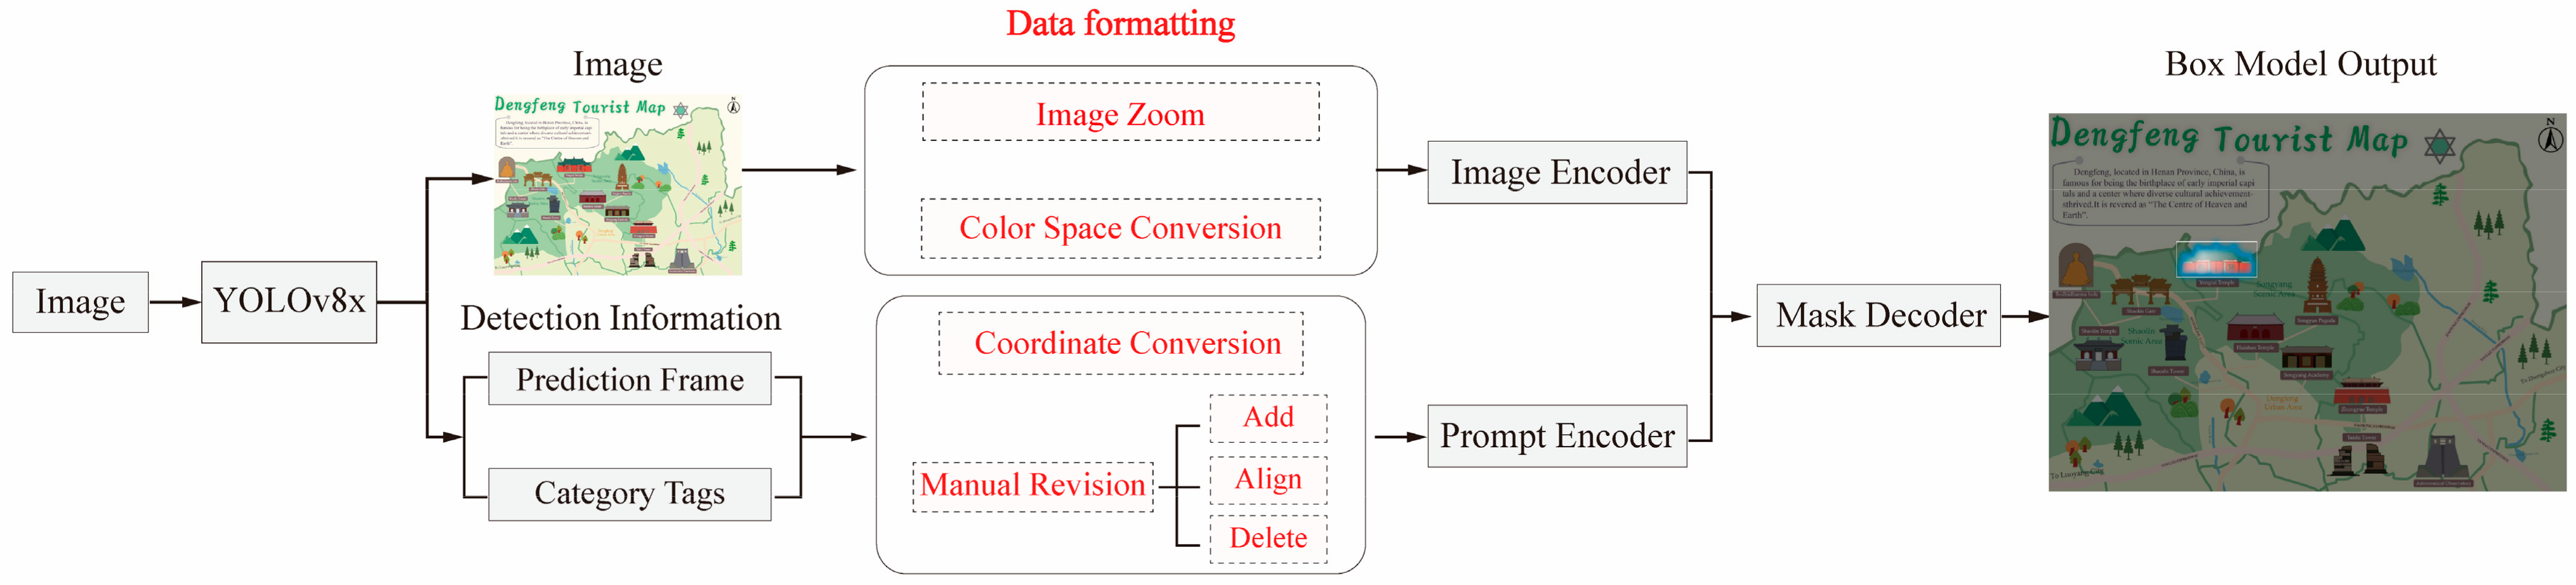
After the detection phase, refined bounding boxes are processed by SAM for precise segmentation. Since SAM is a pre-trained model based on “prompt” technology, it only requires ensuring that YOLO detection results and user interaction results can be successfully read by SAM. This involves the following steps: (1) to ensure compatibility with SAM’s input requirements, we preprocessed the detected images, including resizing them to uniform resolution and converting color spaces uniformly to RGB; (2) iterating through all prediction boxes and converting them to numpy array format; and (3) passing prediction boxes as prompts to SAM, which performs the fine-grained segmentation of symbols in box mode and generates binary segmentation masks. Subsequently, post-processing is performed on the segmentation results, including removing small area noise and smoothing symbol edges to ensure clear and accurate final symbol regions. The segmented symbols are then saved as independent image files with transparent backgrounds to facilitate further symbol classification and provide convenience for the intelligent management applications of tourist maps. The complete workflow for this step is illustrated in
Figure 5.
This collaborative process addresses the limitations of YOLOv8 in precise boundary extraction by incorporating SAM for refined segmentation. As a result, the extracted symbols feature consistent boundaries and high fidelity, making this approach particularly well-suited for symbols on tourist maps that have complex shapes and irregular contours. The key advantage of this collaborative mechanism lies in combining YOLOv8’s speed and accuracy in detection with SAM’s ability to preserve fine boundary details. By integrating the strengths of both models, the overall extraction process achieves rapid initial detection while ensuring segmentation results are both detailed and consistent. This multi-model collaboration not only enhances the efficiency of automated symbol extraction, but also significantly improves the quality of symbol detail, providing robust technical support for symbol design and its practical applications.
3. Experiment Design
3.1. Experimental Environment
The hardware configuration for model training consists of an Intel® Core™ i5-12600KF CPU @ 4.90 GHz, 32 GB of RAM, and an NVIDIA GeForce RTX 4070 Super GPU with 12 GB of memory. The software environment is based on the Windows 11 (x64) operating system, using the Python programming language and the PyTorch deep learning framework. The detailed software specifications are as follows: Python 3.8.19, PyTorch 2.4.0+cu118, Torchvision 0.19.0+cu118, Torchaudio 2.4.0+cu118, CUDA 12.6.65, and cuDNN 8.9.2.
The specific training parameters are illustrated in
Table 7. The decision to train the model for 200 epochs is based on both empirical observations and experimental results, striking a balance to avoid underfitting and overfitting. The batch size is set to 16, making efficient use of the GPU’s parallel computing capabilities. The image dimensions are normalized to 640 × 640, ensuring that the model can be deployed on edge devices. The optimizer used was Stochastic Gradient Descent (SGD) with an initial learning rate of 0.01, as experiments with learning rates of 0.001, 0.01, and 0.1 showed that 0.01 balanced convergence speed and stability. Smaller learning rates resulted in slow convergence, while larger ones led to divergence. Additionally, the momentum was set to 0.937 based on tests with values between 0.9 and 0.99, where 0.937 accelerated convergence while maintaining stability. The weight decay coefficient was set to 0.005, as smaller values (0.001) caused slight overfitting and larger values (0.01) hindered convergence. A Cosine Annealing Scheduler was employed for learning rate adjustment, as it was experimentally validated to outperform fixed learning rates and step-based decays. This strategy allowed the learning rate to gradually decay following a cosine curve, improving convergence during later stages and enhancing generalization. The momentum, commonly set between 0.9 and 0.99, was adjusted to 0.937 based on experiments and validation to achieve optimal training performance. Additionally, the weight decay coefficient is set to 0.005 to constrain parameter updates and introduce regularization effects. The combination of these parameters resulted in a model that achieved strong performance on the validation set while minimizing overfitting. The final hyperparameter choices were therefore validated both experimentally and empirically.
3.2. Dataset
In this experiment, a custom-built tourist map dataset was utilized, comprising a total of 772 original images before augmentation, with varying resolutions. To ensure the reliability and scientific validity of the experimental results, the dataset was first divided into training, testing, and validation sets in an 8:1:1 ratio, resulting in 618 training images, 77 testing images, and 77 validation images. This initial split ensured that there was no overlap between the training, testing, and validation sets, avoiding data leakage and ensuring the independence of the evaluation process.
After the split, a series of data augmentation techniques were applied exclusively to the training set to increase its diversity and size. These augmentation techniques included random cropping, horizontal and vertical flipping, rotation, brightness and contrast adjustment, and scaling, resulting in a total of 3769 training images with a uniform resolution of 640 × 640 pixels. The testing and validation sets remained unchanged to maintain their integrity and ensure consistent evaluation.
As illustrated in
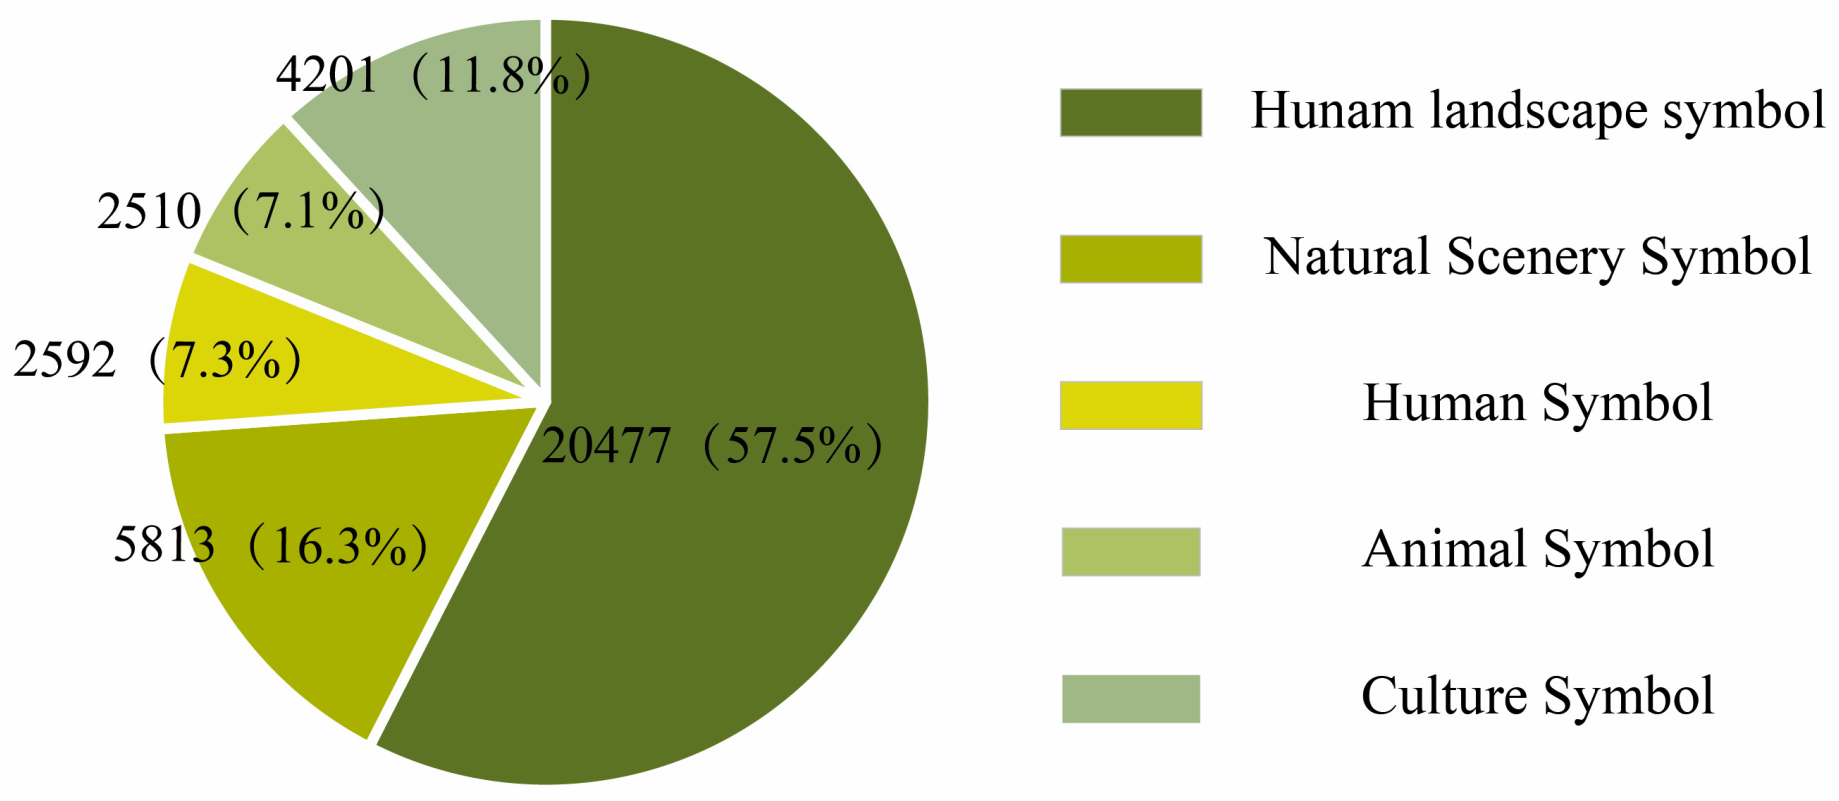
Figure 6, the dataset includes five label categories: human landscape, natural scenery, human, animal, and cultural elements, with a total of 35,593 annotations. The human landscape category accounts for the largest proportion of labels, while the cultural elements contain the fewest.
3.3. Selection of YOLO Variants
As a leading model for object detection, the YOLO framework has undergone continuous development, resulting in nearly a dozen variants since its inception [
24]. In this experiment, we compared the performance of several mainstream YOLO variants, including YOLOv5 [
29], YOLOv7 [
30], YOLOv8 [
23], YOLOv10 [
31], and YOLOv11 [
31]. The performance of each YOLO variant in symbol detection was evaluated based on five key metrics: precision, recall, F1-score, mean average precision (mAP), and intersection over union (IoU). The experimental results were used to select the most suitable YOLO variant according to these metrics. The formulas and descriptions of each evaluation metric are detailed in
Table 8.
Following model training, the training curves are presented in
Figure 7. In terms of mAP@0.5 and mAP@0.5:0.95, YOLOv8 achieved values of 0.951 and 0.874, respectively, demonstrating high detection accuracy. Notably, YOLOv8 excelled in mAP@0.5:0.95, significantly outperforming other models and highlighting its superior stability. While YOLOv7 achieved a slightly higher mAP@0.5 of 0.986, its mAP@0.5:0.95 was lower than YOLOv8. Additionally, YOLOv7’s training curves exhibited relatively larger fluctuations, indicating less consistency during training. In contrast, YOLOv8 displayed smoother and more stable accuracy curves, further validating its robustness across different IoU thresholds.
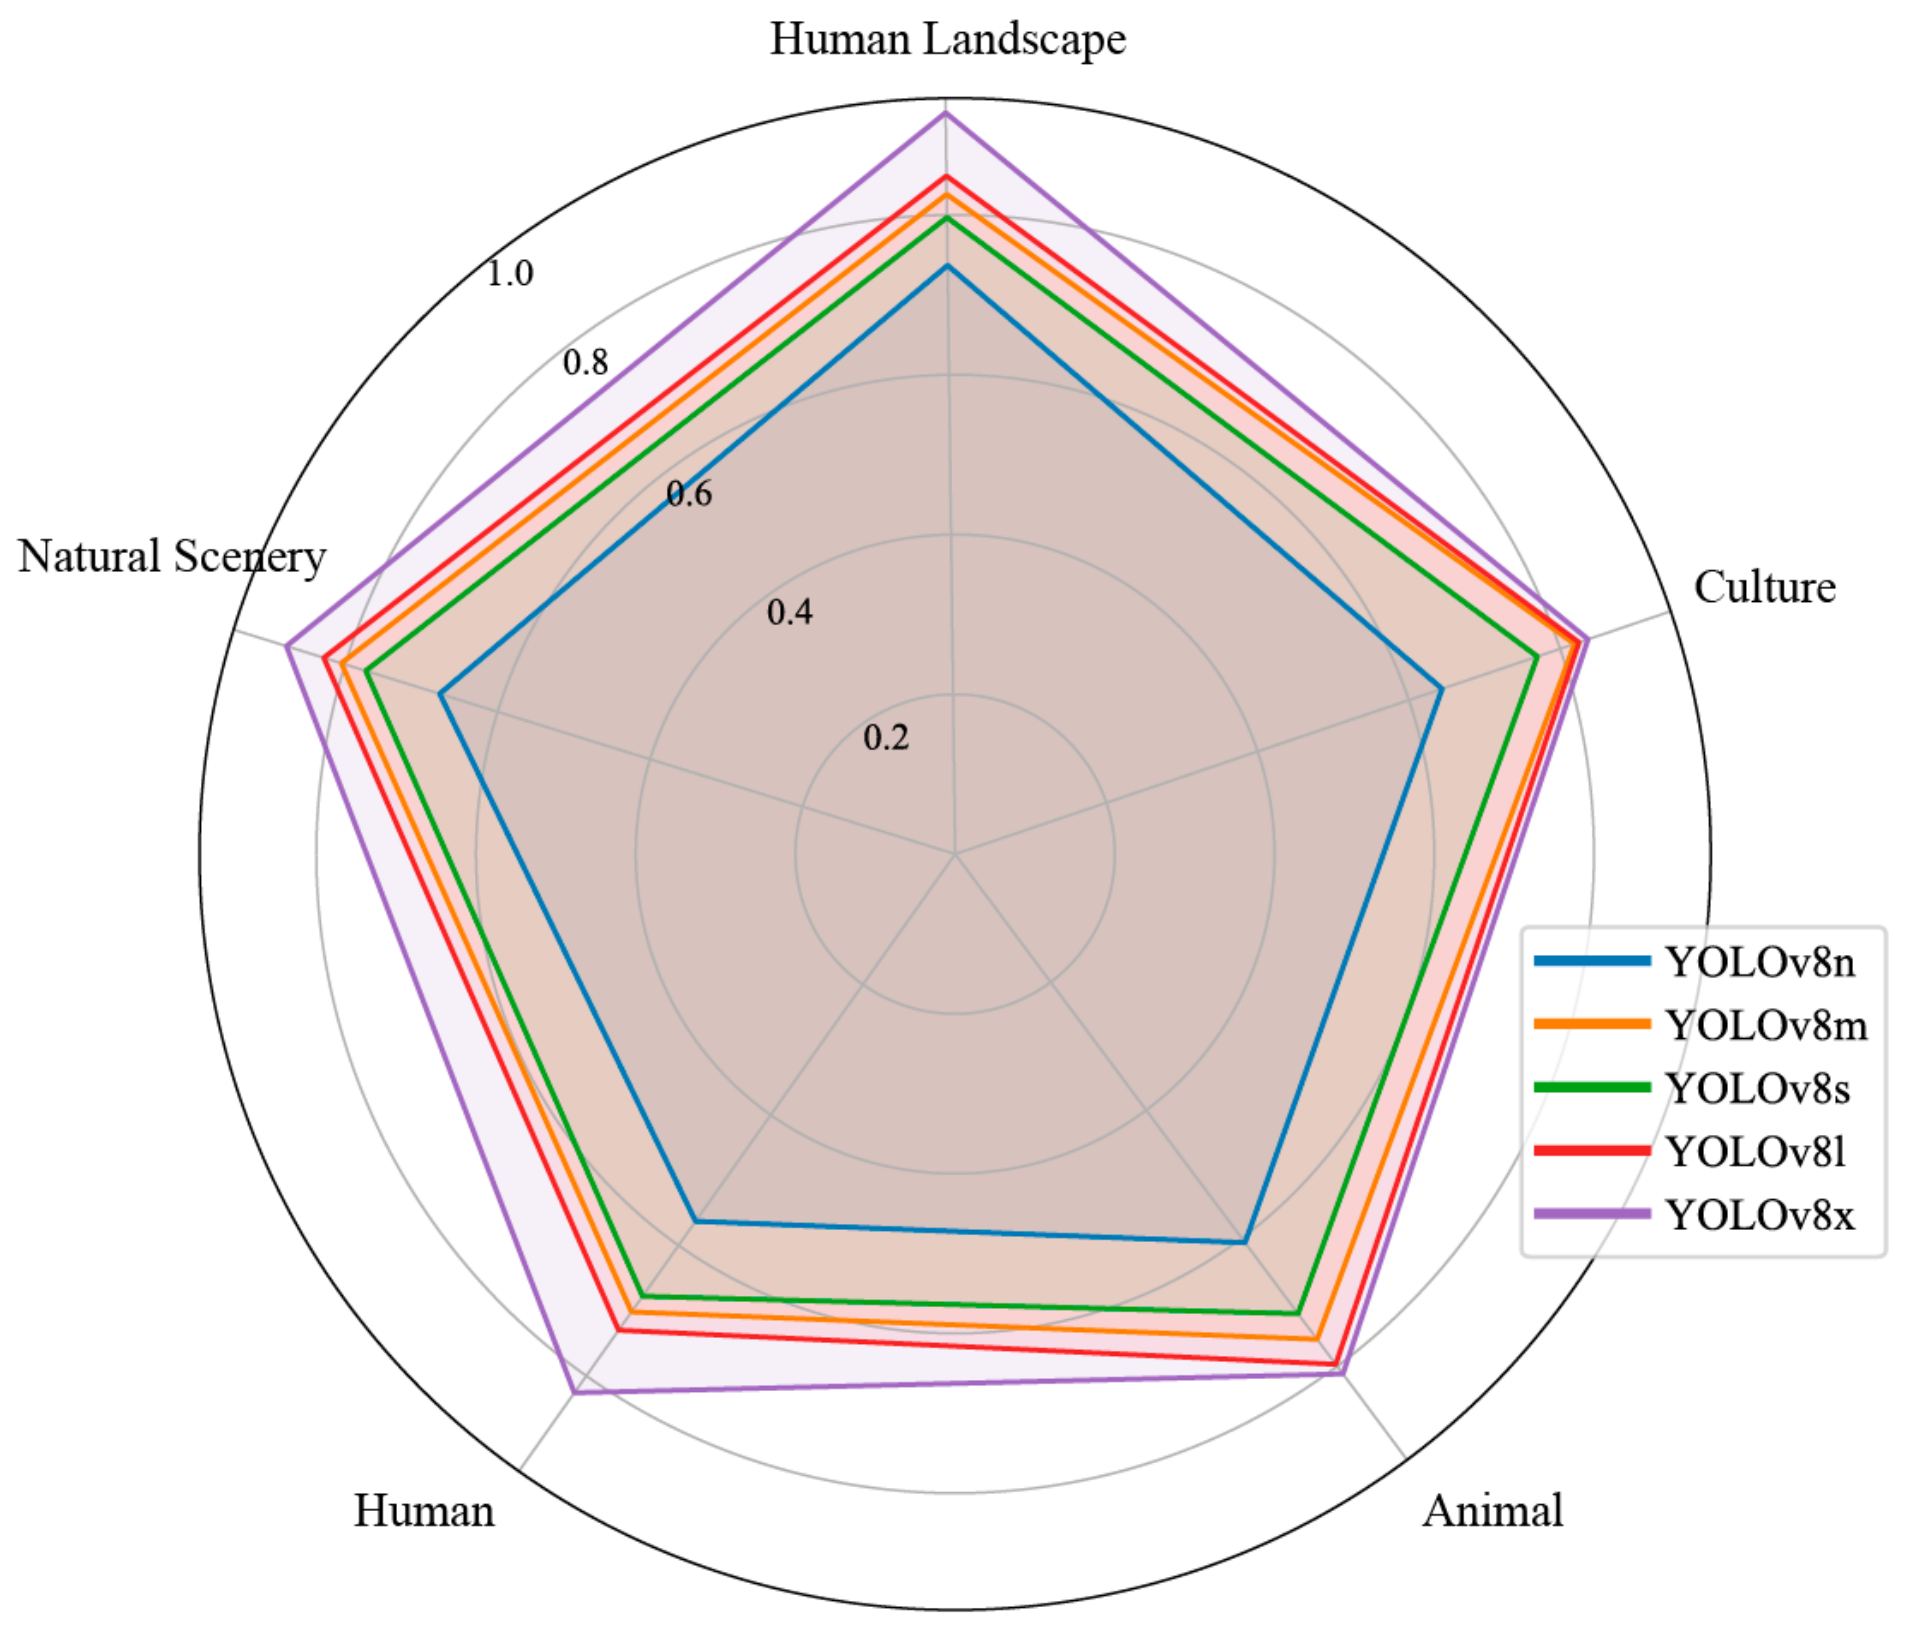
After confirming that the YOLOv8 model is the most suitable for the tourism map dataset, we proceeded to compare the performance of YOLOv8 models with different parameter sizes on this dataset. The recognition accuracy for each symbol category is illustrated in
Figure 8.
The recognition accuracy for each symbol category further validates the selection of YOLOv8x. This model demonstrated exceptional performance in the categories of “natural scenery”, “human landscape”, and “cultural symbols”, underscoring its consistent ability to achieve high-precision recognition across diverse symbol types. In contrast, smaller parameter models such as YOLOv8n exhibited lower recognition accuracy in these categories, indicating that increasing the parameter size significantly enhances the model’s detection performance across different symbol types.
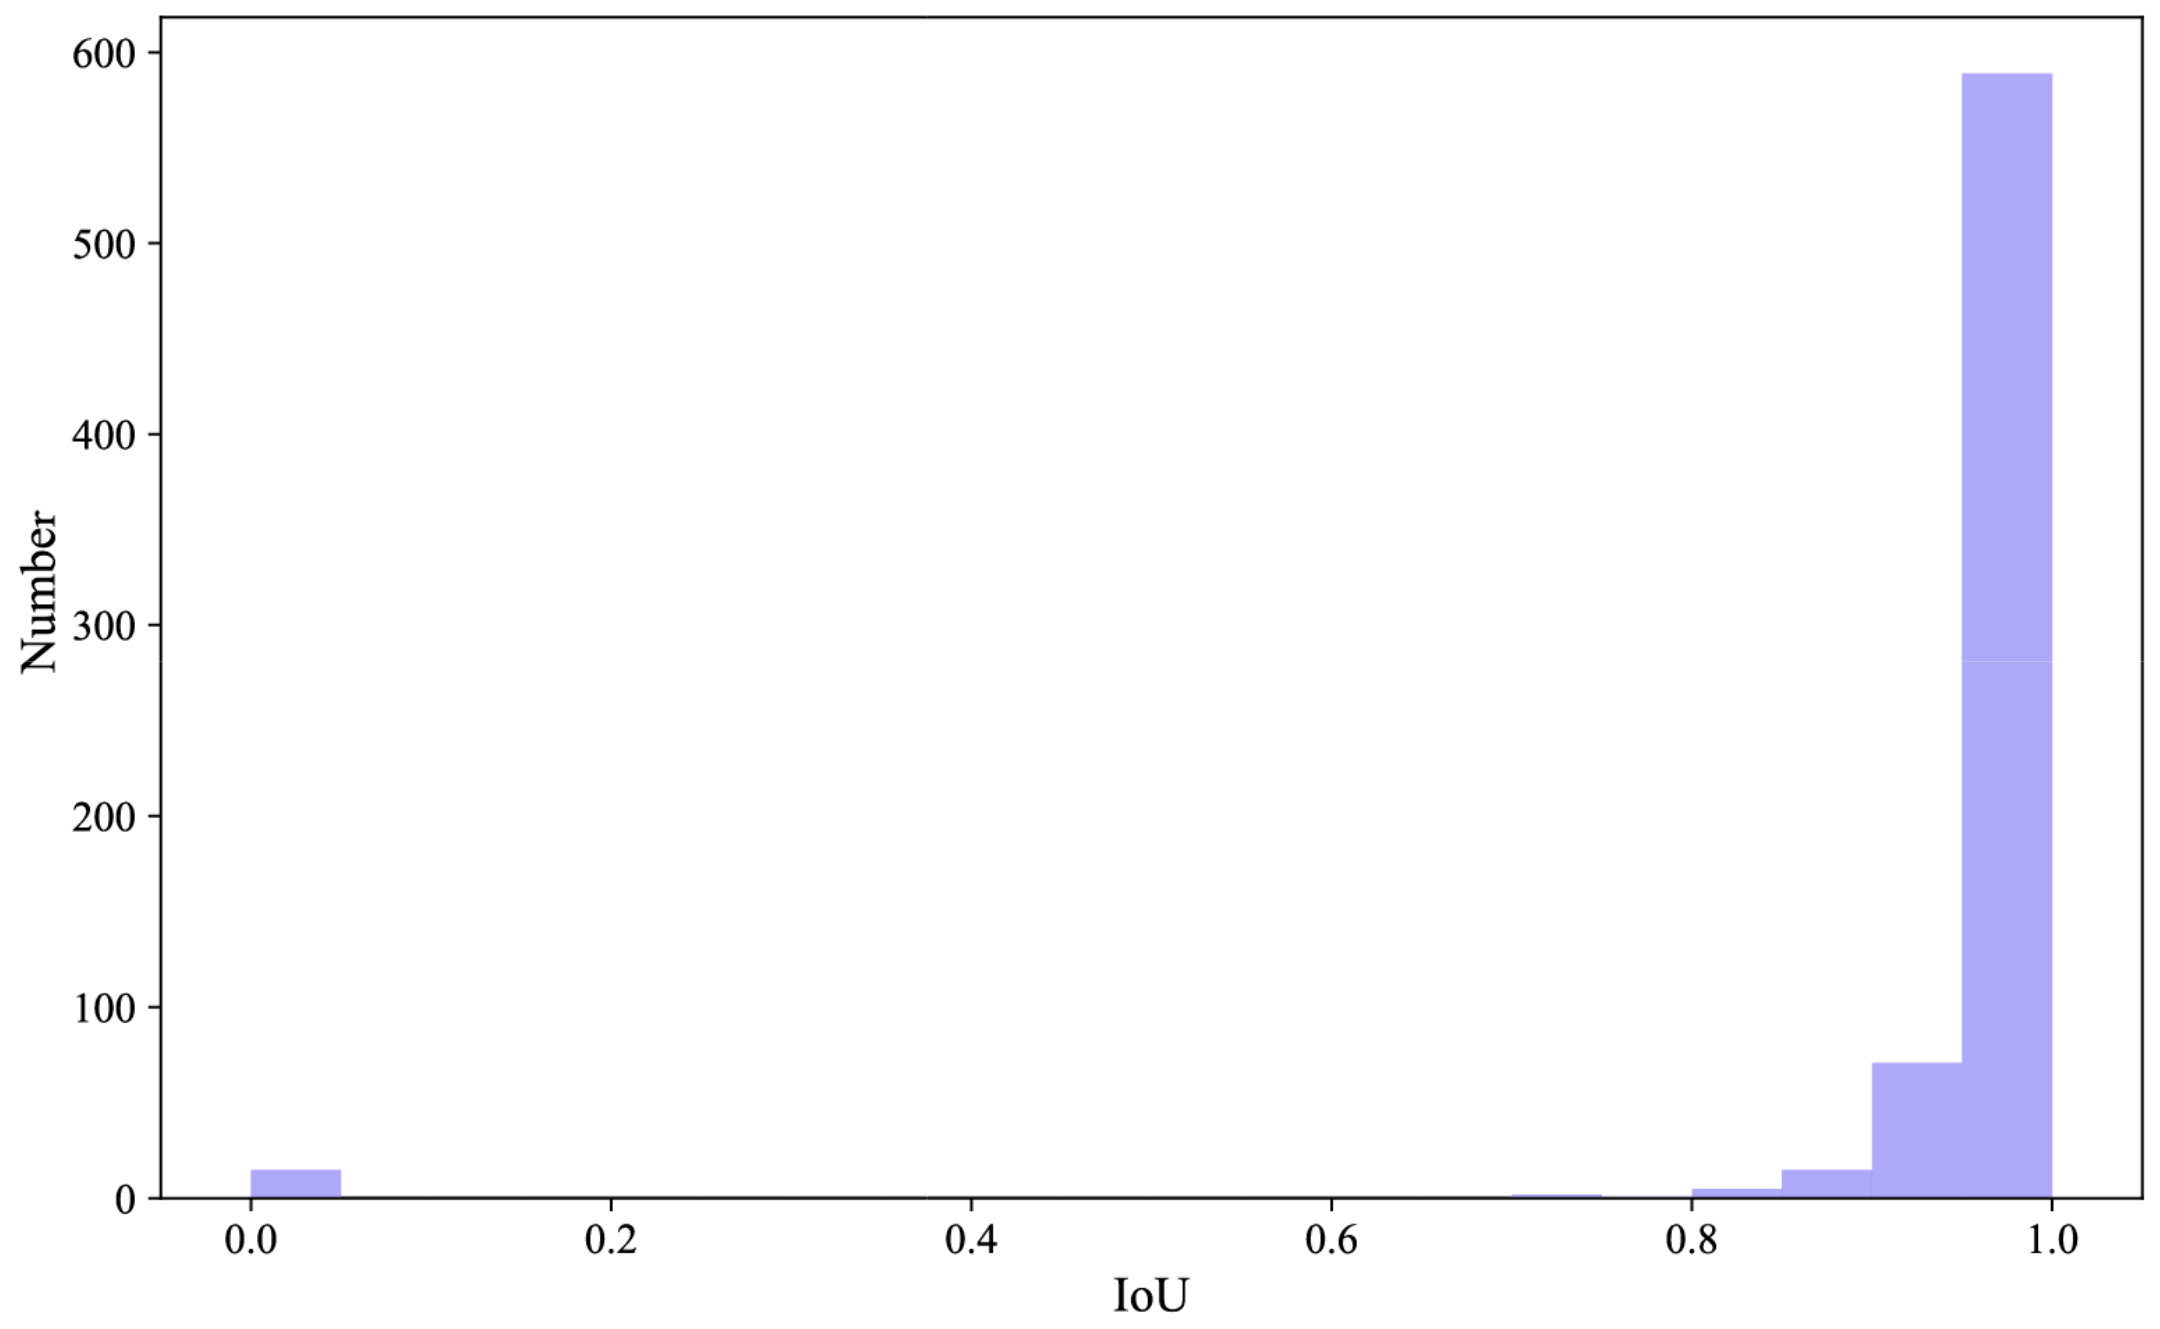
We further evaluated the IoU performance of the YOLOv8x model to provide a detailed analysis of its detection performance. The IoU distribution for all predicted objects is illustrated in
Figure 9, highlighting the overall detection performance of the model. A majority of IoU values were concentrated above 0.9, indicating a high degree of overlap between the predicted and ground truth bounding boxes, which reflects the model’s strong object recognition capabilities. A small proportion of predictions with IoU values of 0 were observed, which typically indicates that the model failed to correctly classify certain symbol categories or encountered issues such as class confusion or annotation errors.
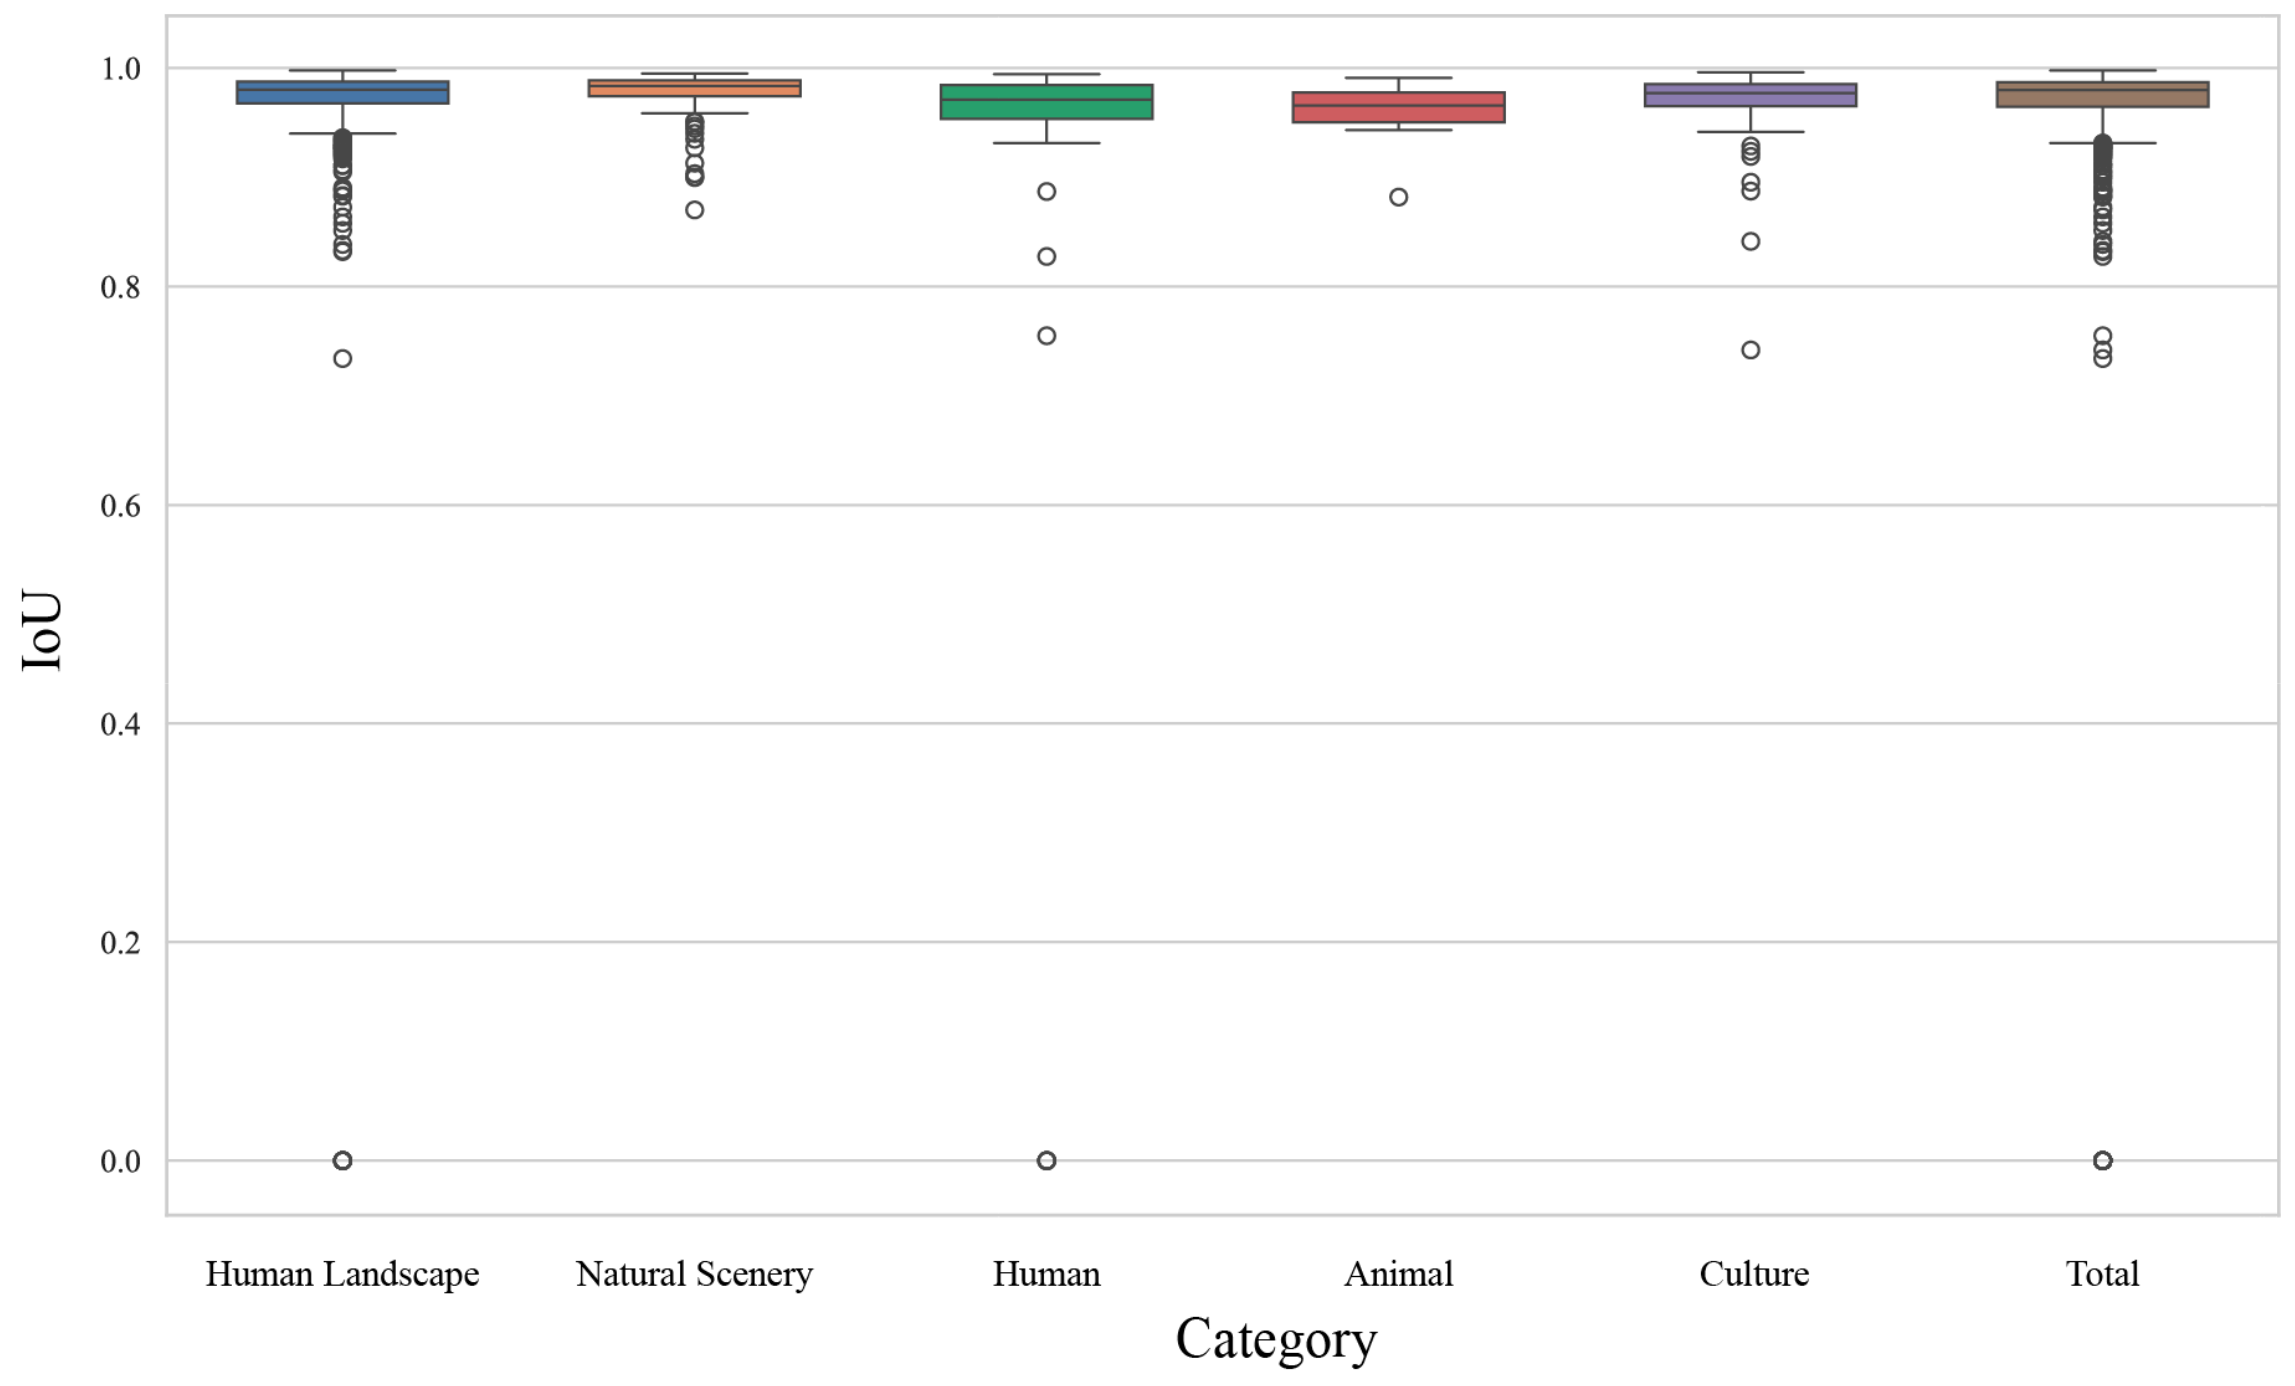
Figure 10 presents the IoU distribution across five specific symbol categories as well as the overall IoU distribution. The median IoU values for all categories consistently fell between 0.85 and 0.9, demonstrating balanced and stable performance across various symbol detection tasks. Notably, the “Human Landscape” and “Animal” categories exhibited smaller interquartile ranges, suggesting more consistent predictions, whereas the “Natural Scenery” and “Culture” categories displayed a higher number of low IoU outliers. These outliers may stem from challenges such as complex backgrounds, small object sizes, or indistinct category features. Despite these challenges, the majority of IoU values exceeded 0.8, indicating that the model maintained strong overall performance, particularly excelling in the detection of “Human Landscape” and “Animal” symbols.
In summary, the YOLOv8 series, and especially the YOLOv8x variant, stands out in terms of accuracy, stability, and adaptability to various symbol categories, meeting the high-precision demands of tourist map symbol detection tasks. Accordingly, this article identifies YOLOv8x as the optimal model for symbol detection.
4. Results
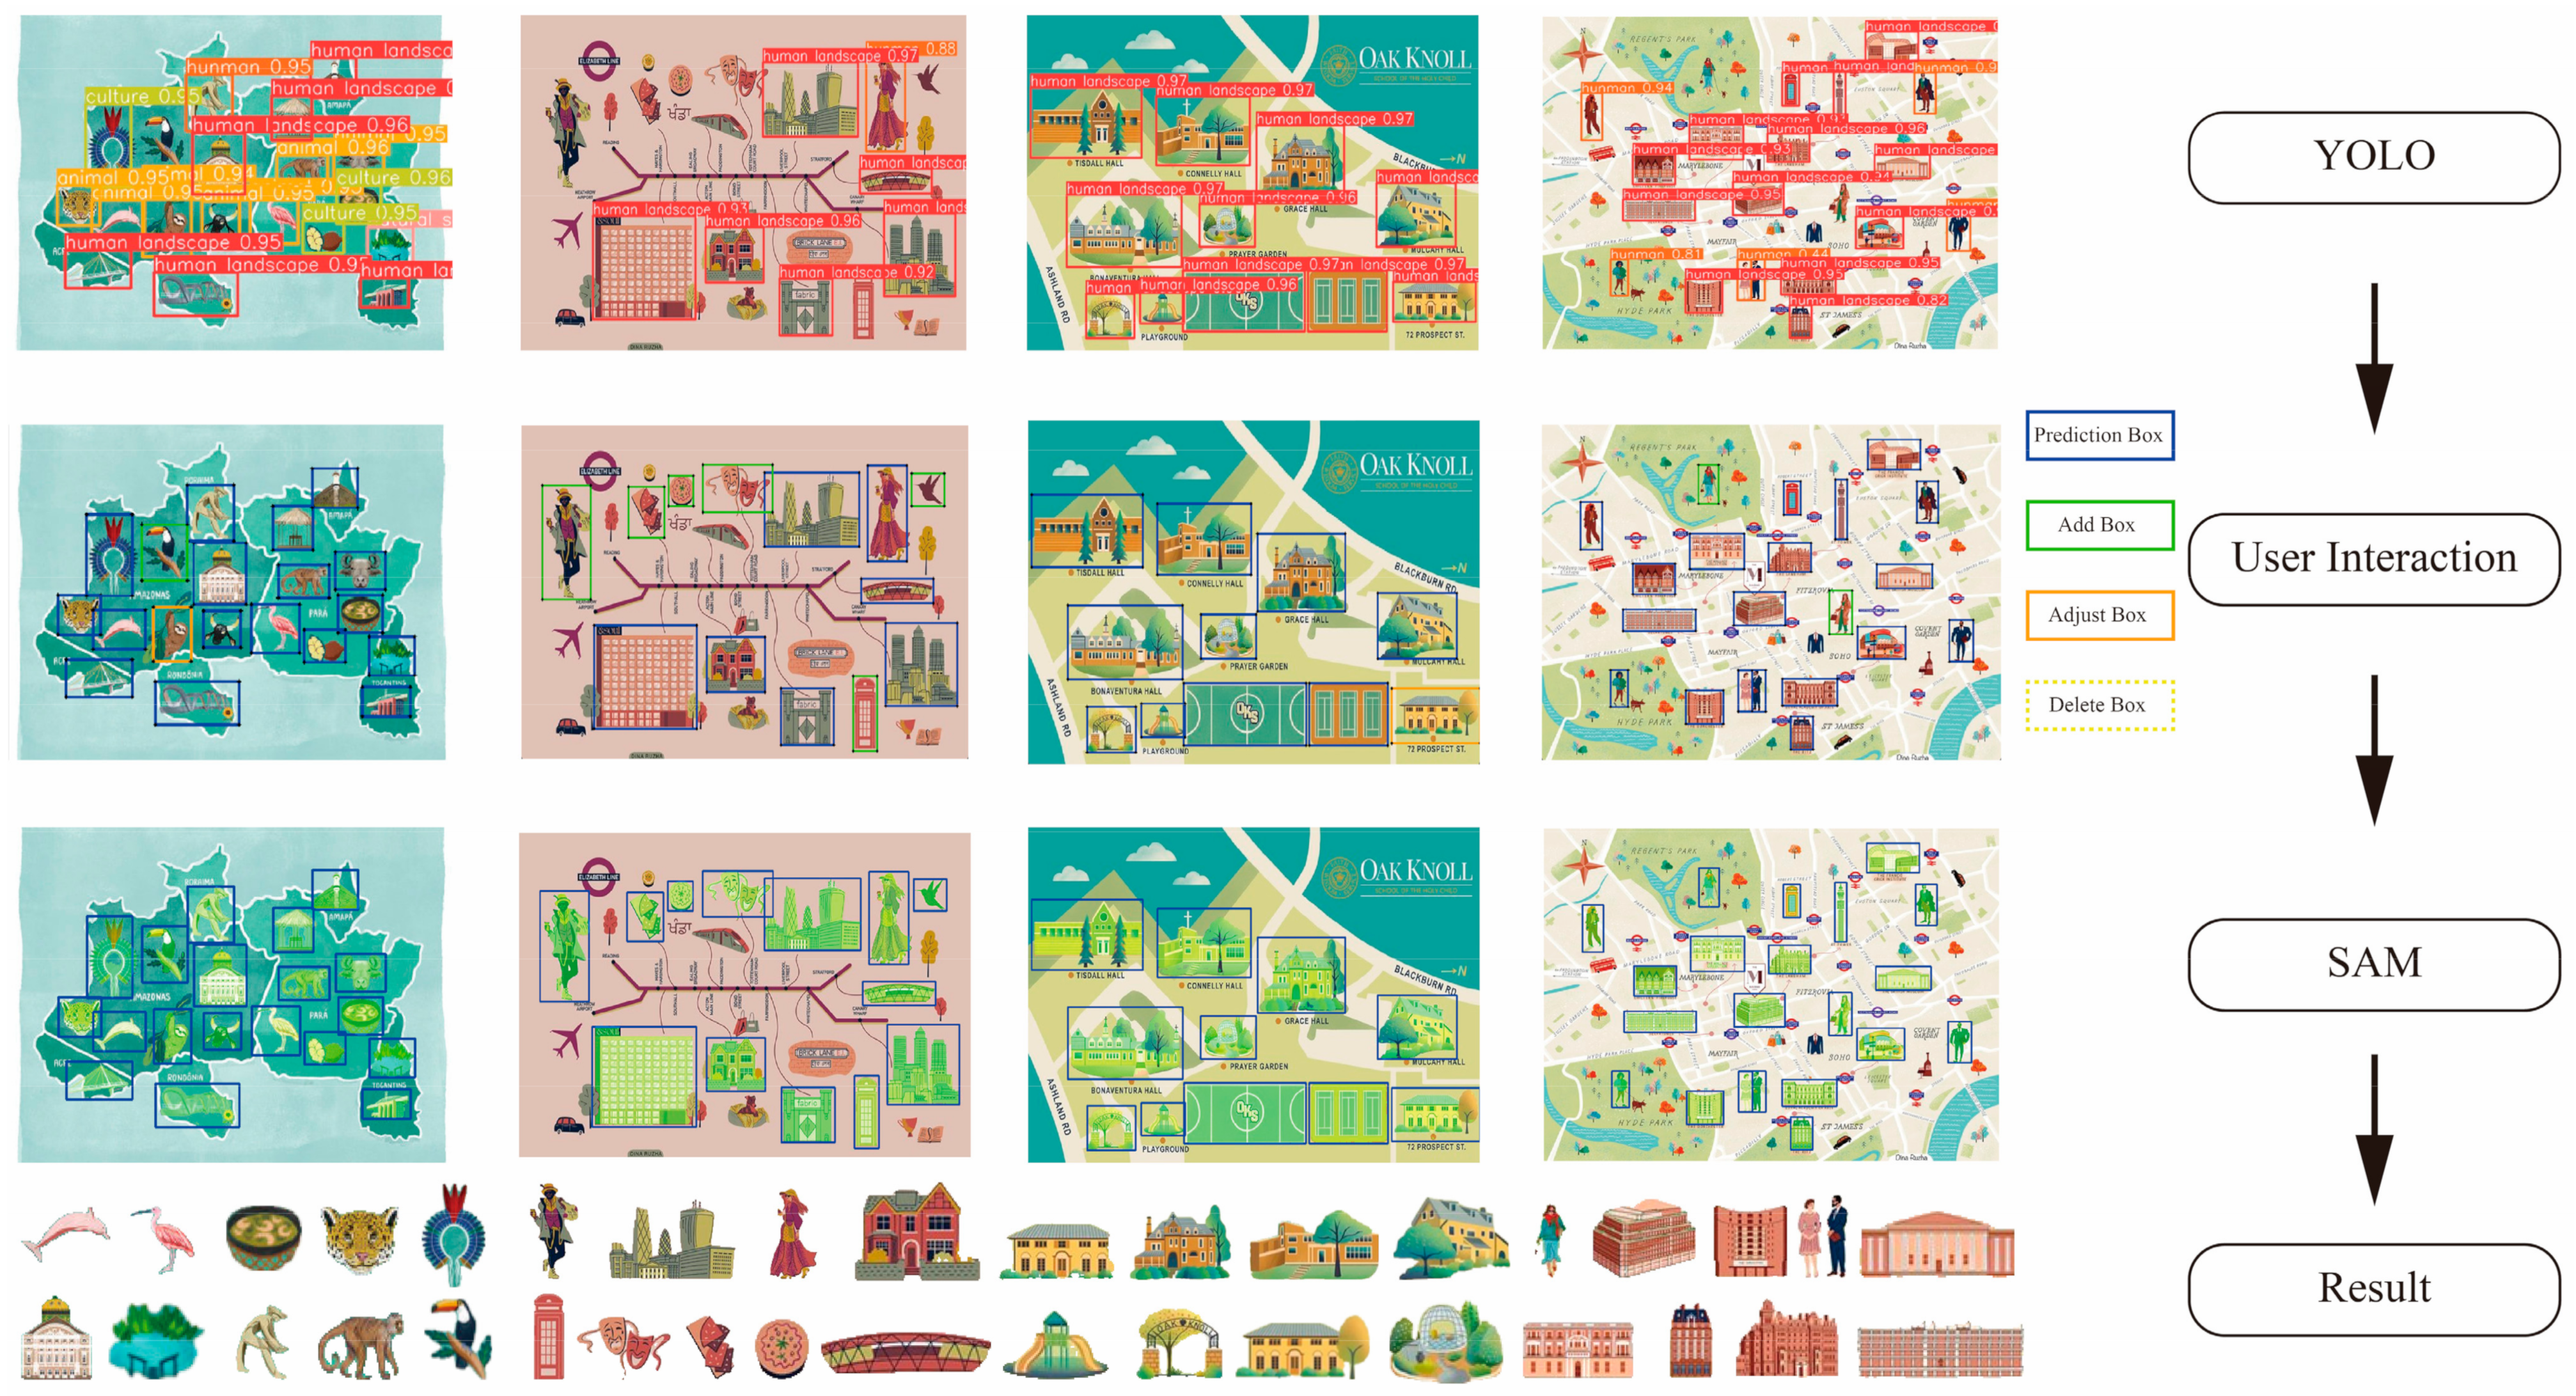
This study evaluated the proposed method using a diverse set of tourist maps, including route-based and hand-drawn maps with varying symbol complexity. As illustrated in
Figure 11, we selected four representative tourist maps encompassing all five symbol categories identified in this research. To assess the model’s generalization capability, we deliberately selected maps excluded from the training dataset for experimental validation.
The symbol extraction process comprised two primary stages. In the first stage, we employed a YOLOv8x model, trained on a tourist map dataset, for symbol detection, classification, and confidence scoring. The model exhibited moderate generalization capabilities, successfully detecting and classifying symbols across various map styles and artistic representations with consistently high confidence scores. For symbols with complex morphological variations or regional characteristics that might be missed during detection, our designed visualization and user interaction features effectively addressed potential detection omissions, ensuring accurate and reliable results. In the second stage, the validated detection results served as prompts for the SAM. The SAM utilized these inputs to generate precise segmentation masks, delineating symbol regions. These segmented symbols were then automatically extracted and systematically organized into separate files by category, effectively expanding our symbol library.
The extraction results demonstrate that our method not only preserves fundamental symbol characteristics, but also exhibits robust performance across diverse tourist map styles. To further validate the method’s versatility, we conducted extensive experiments across various maps.
Figure 12 showcases exemplar extracted symbols from all five categories, illustrating the method’s consistent performance and fine-grained extraction capabilities across different map styles and symbol complexities.
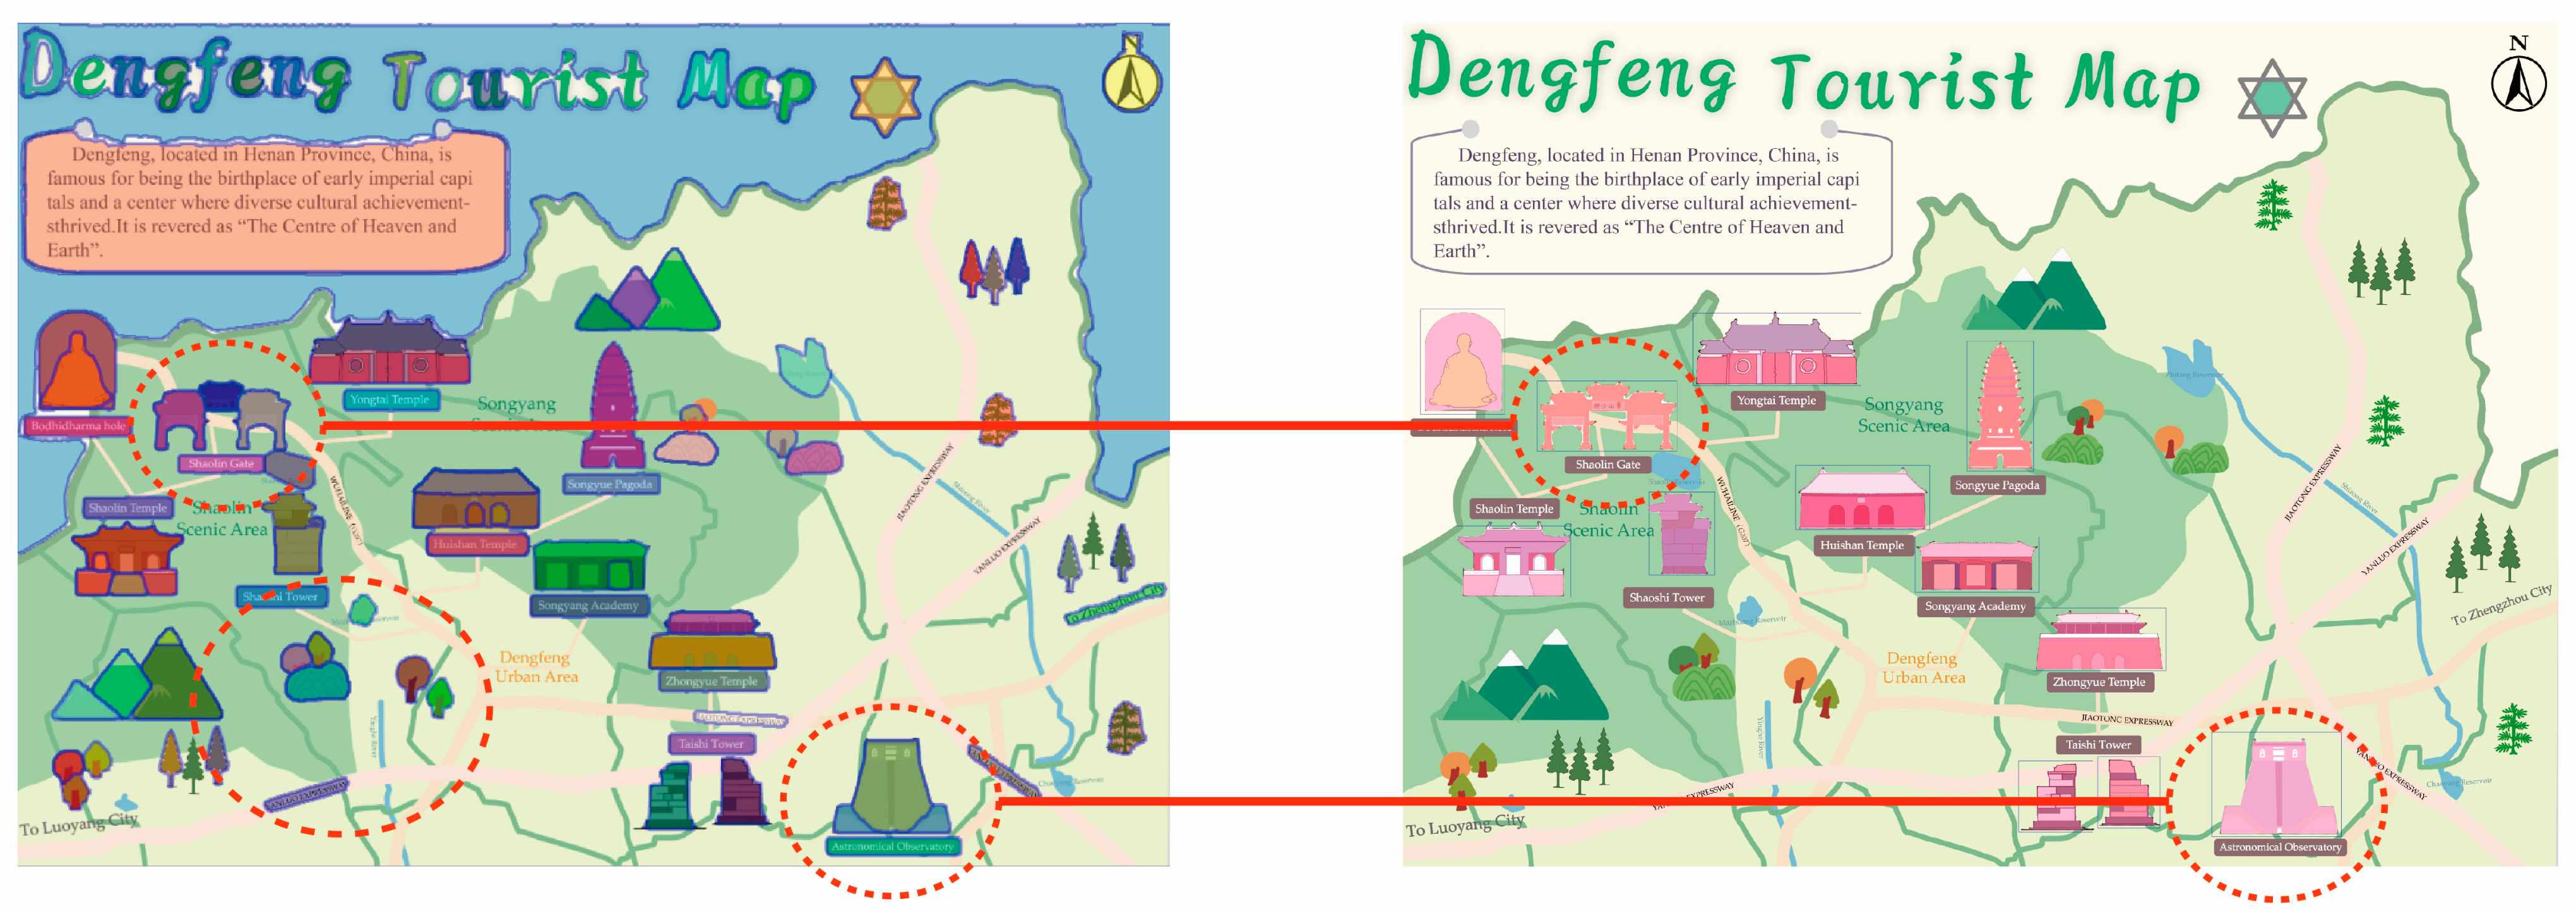
5. Discussion
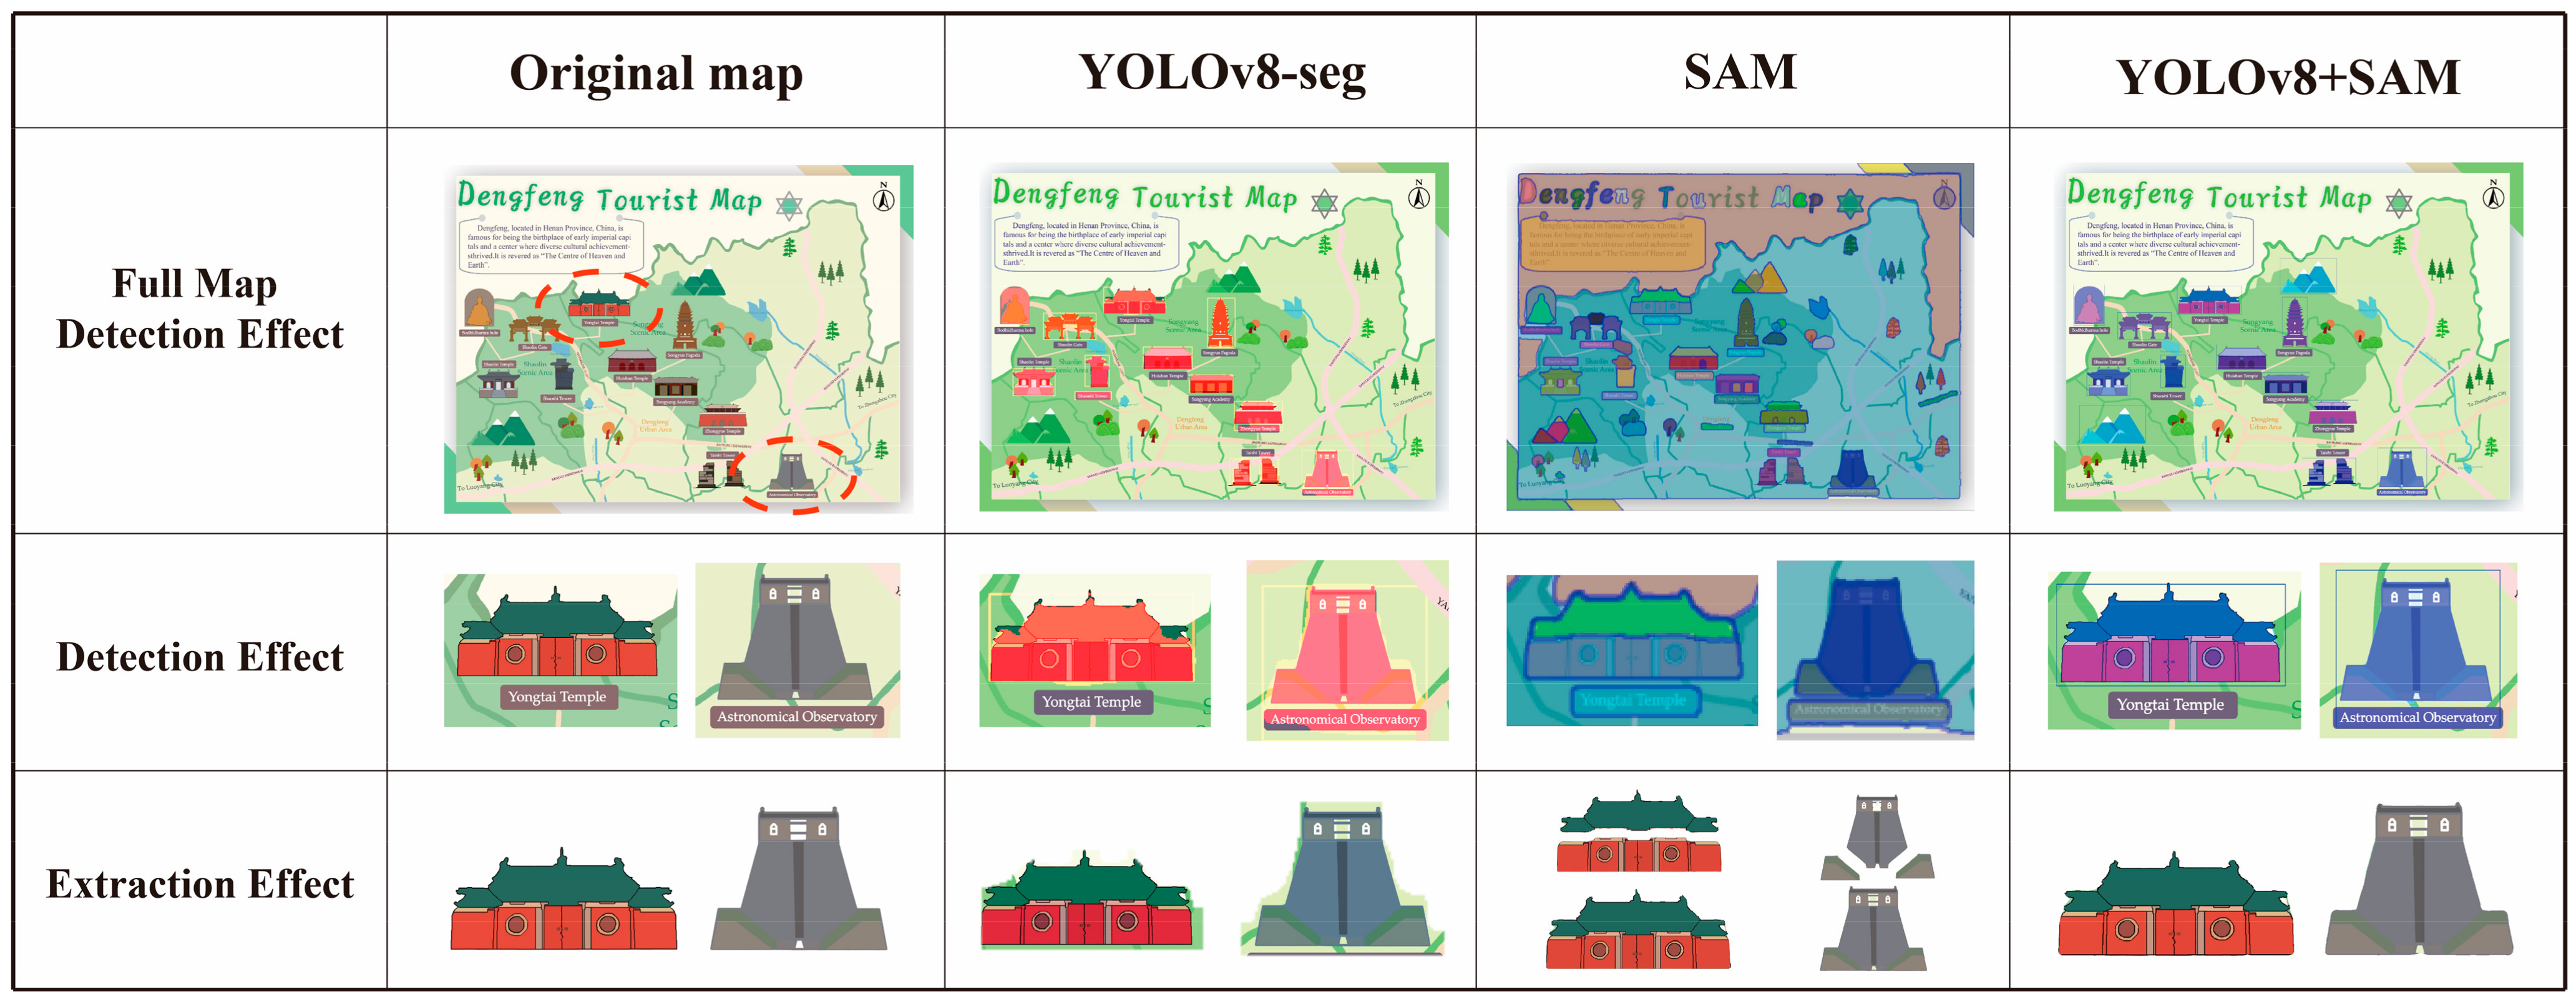
To effectively demonstrate the efficacy of the proposed collaborative model method for detecting and extracting map symbols, we independently designed a tourist map of Dengfeng City along with its associated geographic symbols. This map served as a benchmark image for comparing the symbol extraction performance of various models, with the results illustrated in
Figure 13. We compare the proposed method against the symbol extraction results obtained using only the YOLO model and only the SAM. The observations are as follows:
- 1.
The YOLO model, when used in isolation, can detect and label symbols; however, its segmentation accuracy is insufficient. The extracted symbols retain significant amounts of background color, rendering them unsuitable for direct application as map symbol elements.
- 2.
The SAM achieves precise segmentation of symbols; however, without prior symbol detection, it performs segmentation based on a global grid. This approach results in the extraction of numerous unnecessary map details and fails to classify or label symbols. Additionally, when applied to individual symbols, the SAM frequently decomposes them into smaller parts, leading to substantial data redundancy.
To evaluate model performance, we conducted comparative experiments using mainstream detection models on five symbol categories from a custom tourist map dataset. The experimental results were benchmarked against our proposed model (
Table 9). Quantitatively, the YOLOv8-X model surpassed other state-of-the-art architectures with notable performance gains: 16.27% higher AP than Faster R-CNN [
32], 15.98% higher than SSD [
33], and 9.21% higher than Retinanet [
34]. Additionally, YOLOv8-X exhibited a balanced trade-off between precision and recall, resulting in the F1 Score of 0.87, which outperformed Faster R-CNN by 22.29%, SSD by 37.93%, and Retinanet by 3.18%. The empirical evidence underscores the fact that our proposed methodology offers significant advantages in terms of robustness and accuracy for tourist map symbol detection tasks. This advancement highlights the potential of YOLOv8-X as a practical solution for geographic and cartographic applications requiring precise and efficient symbol recognition.
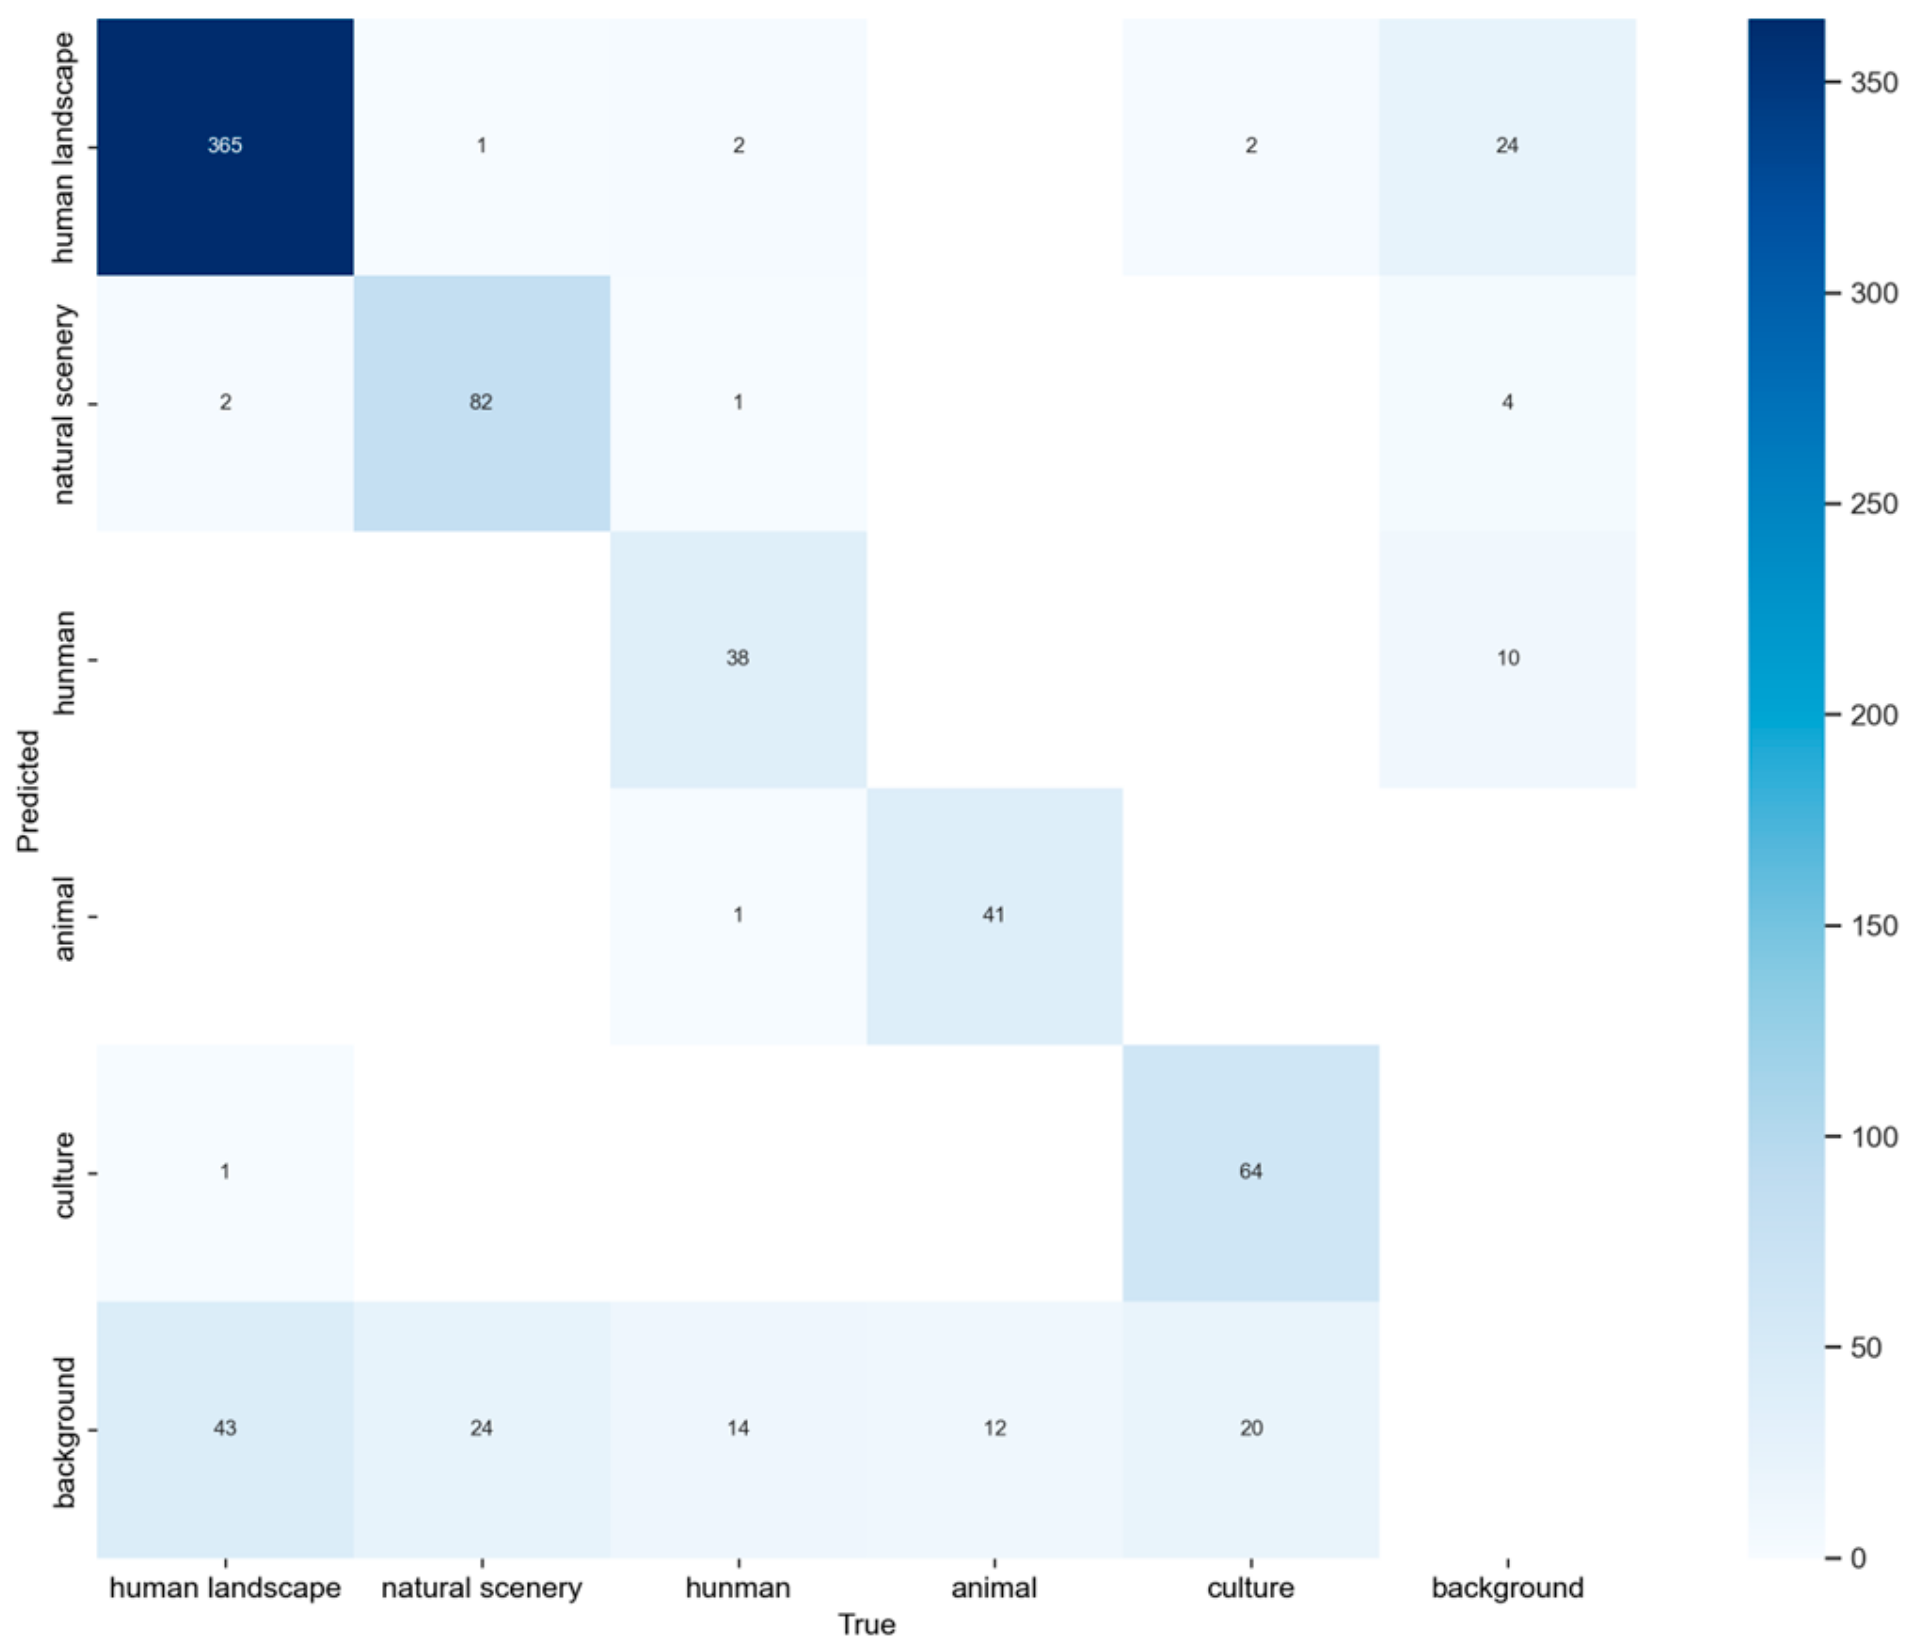
To validate the model’s generalization capability, we conducted symbol detection experiments on a test set of 77 images. The results are presented through confusion matrices (
Figure 14). The model demonstrated strong performance across different categories, with particularly robust results for human landscape detection. Natural scenery and animal categories both achieved 77% accuracy, while cultural elements were detected with 74% accuracy. The human category showed a moderate performance of 68% accuracy. From the confusion matrix, we can also observe that there are relatively few misclassifications between the five symbol categories, with the more common issue being symbols not being detected at all. These results indicate strong overall performance but highlight areas for improvement. Misclassifications with the background suggest the need for more diverse training data and enhanced feature extraction to improve separation. Lower performance for smaller categories, such as humans and animals, suggests addressing class imbalance. Enhancing fine-grained feature extraction can further reduce inter-category confusion. Overall, the model demonstrated good generalization with room for optimization in specific areas.
In contrast, the proposed collaborative method, which integrates YOLO and SAM, effectively detected map symbols and performed precise segmentation. This approach reduces computational overhead while outputting specific, complete map symbols that can be directly used as materials in a symbol library.
Compared to using YOLO or SAM independently, the collaborative method offers several advantages:
- 1.
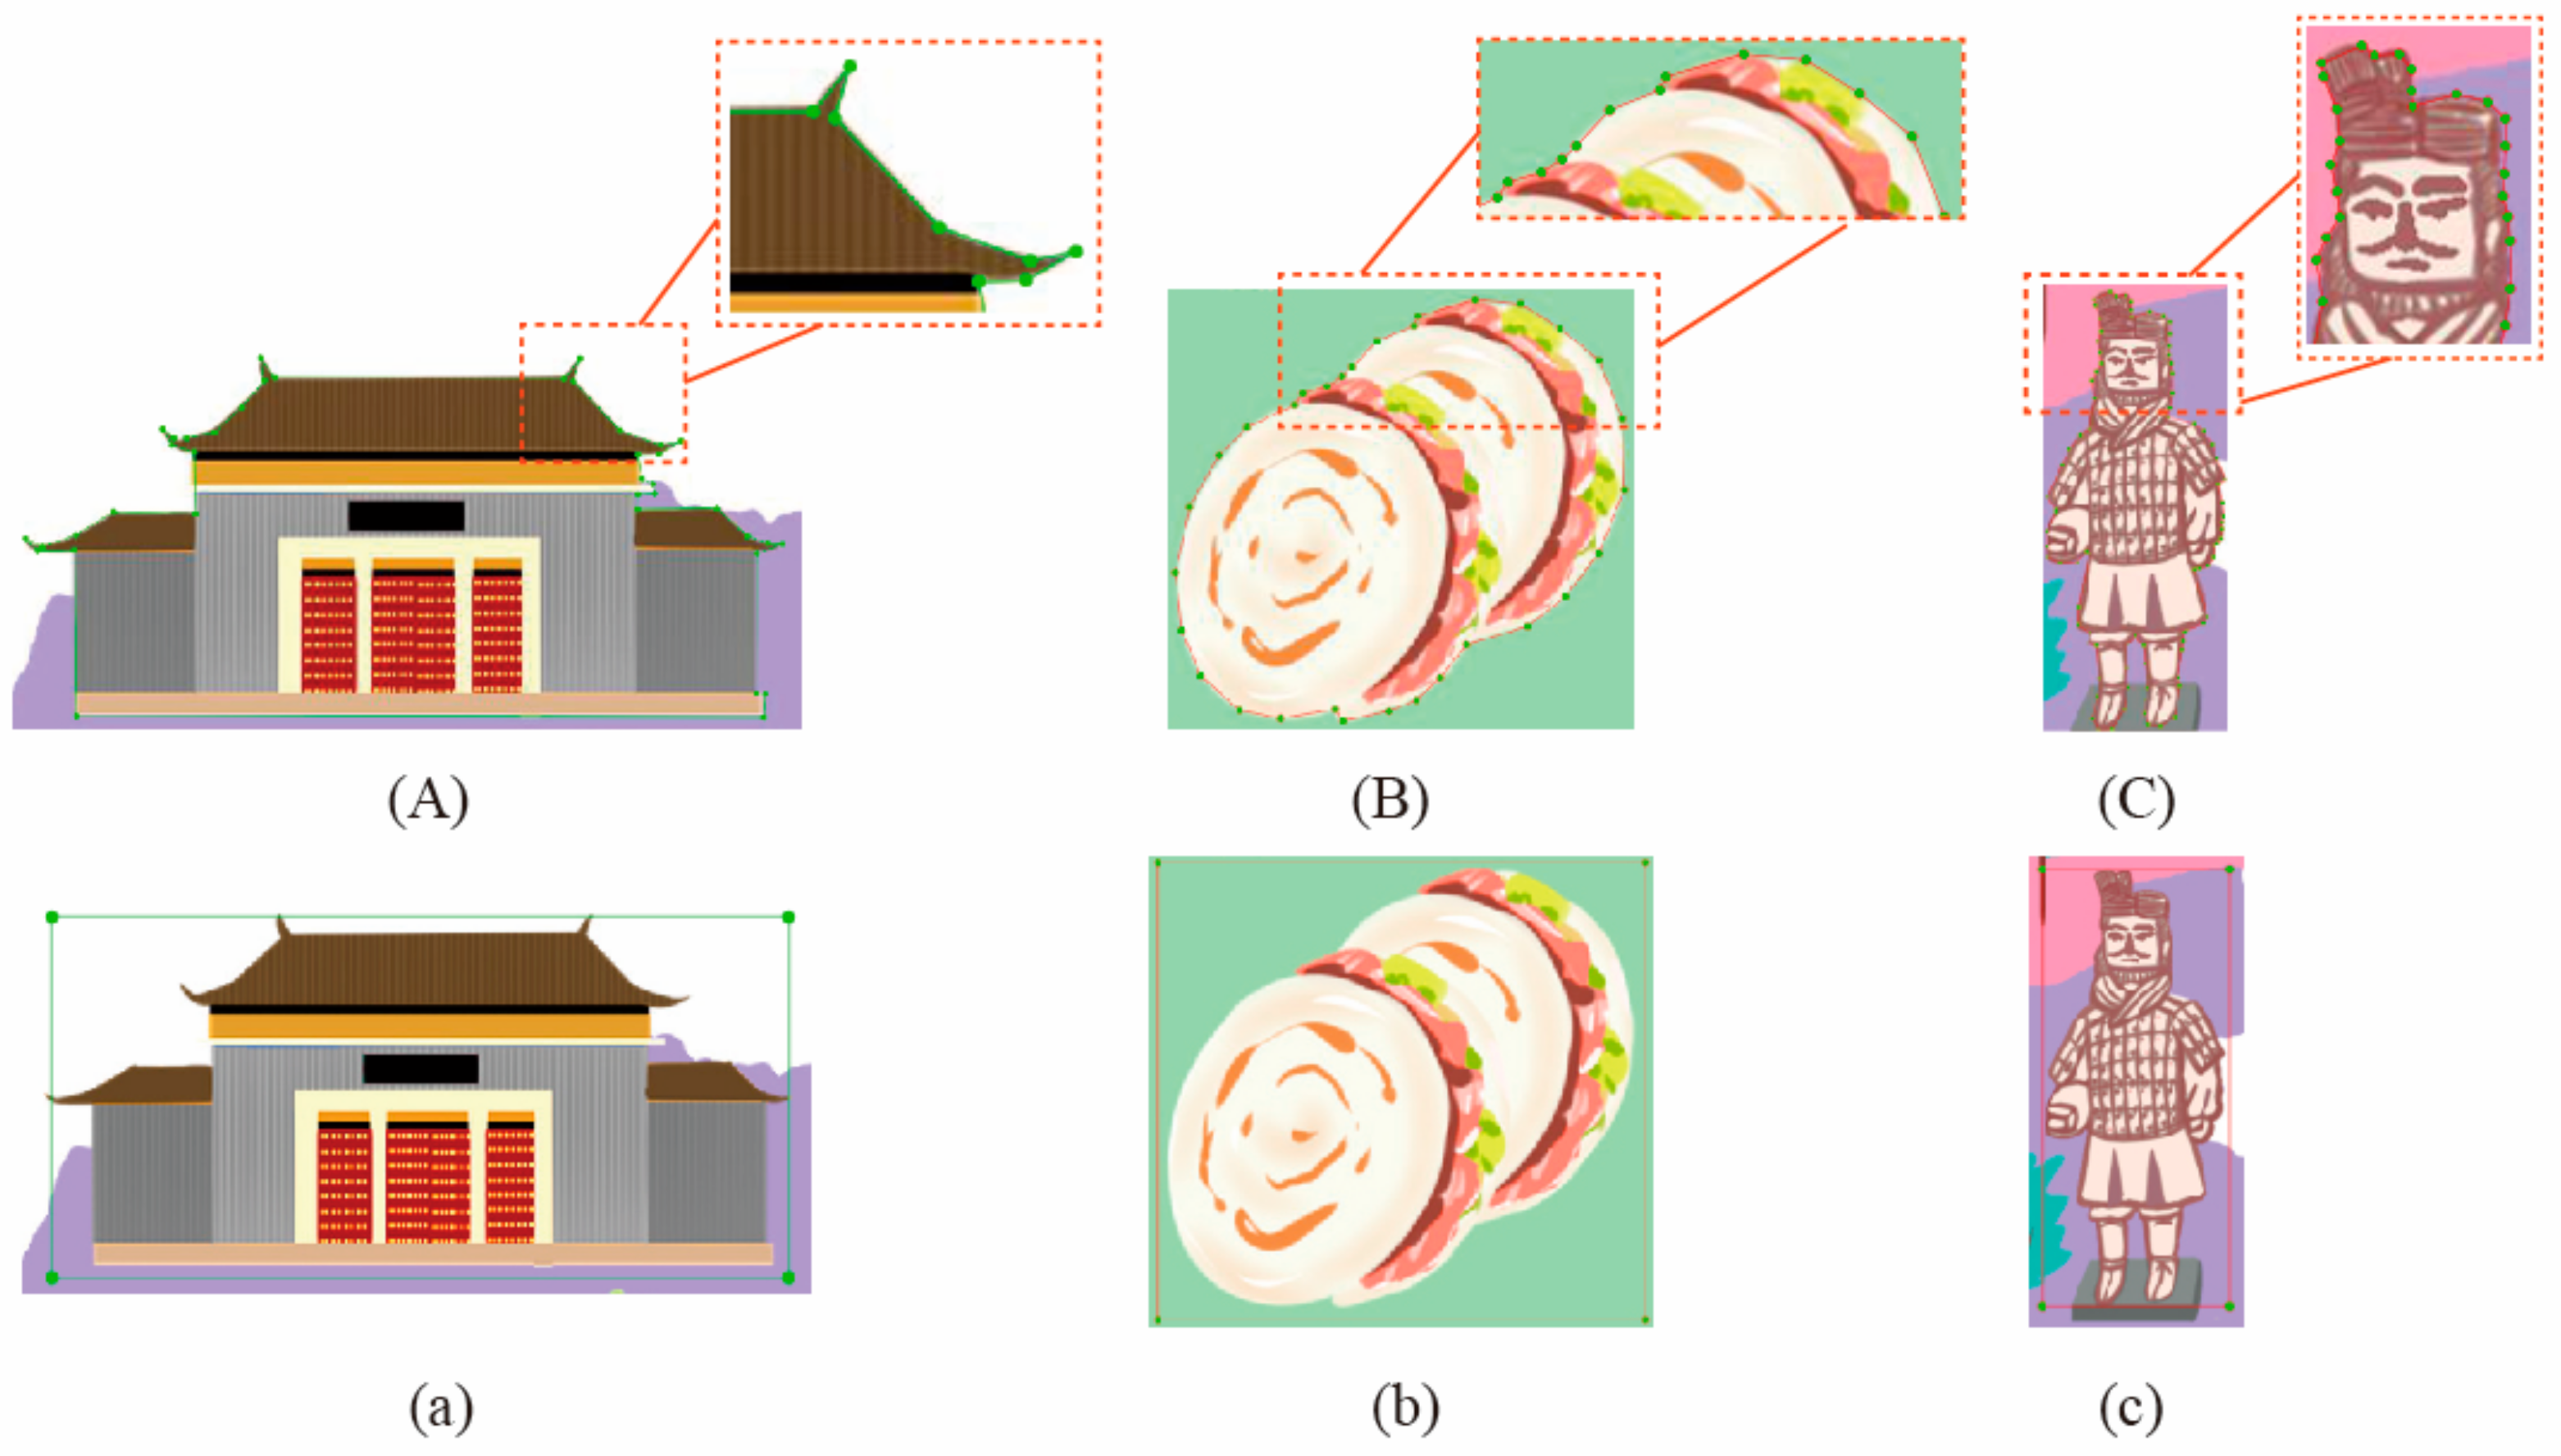
Efficiency in Annotation and Detection: Although the YOLOv8 model includes segmentation functionality, it requires highly detailed annotations, necessitating manual labeling of each target’s fine boundaries. For paper maps or small symbols with limited resolution, this manual annotation process is highly labor-intensive, as illustrated in
Figure 15. In this article, YOLO is employed solely as a detection model to locate symbols and generate bounding box annotations. This strategy minimizes the need for detailed annotations and significantly enhances the efficiency of dataset construction.
- 2.
Overcoming SAM’s Segmentation Limitations: While the SAM supports three segmentation modes—Click, Box, and Everything—the first two require manual input for segmenting specific geographic features. The Everything mode allows for automated segmentation but often produces overly fragmented results, such as disaggregating individual symbols into smaller components and including excessive background details (as shown in
Figure 16). If only symbol elements are needed, manual classification of the segmentation results remains necessary. To address this, we introduced the YOLO model as a preprocessing step, where its detection results serve as prompts for the SAM. This confines segmentation to the predicted bounding boxes, reducing irrelevant details and memory consumption. Since the bounding boxes already classify the symbols, the segmented outputs retain their category attributes, simplifying their subsequent management and use in symbol libraries.
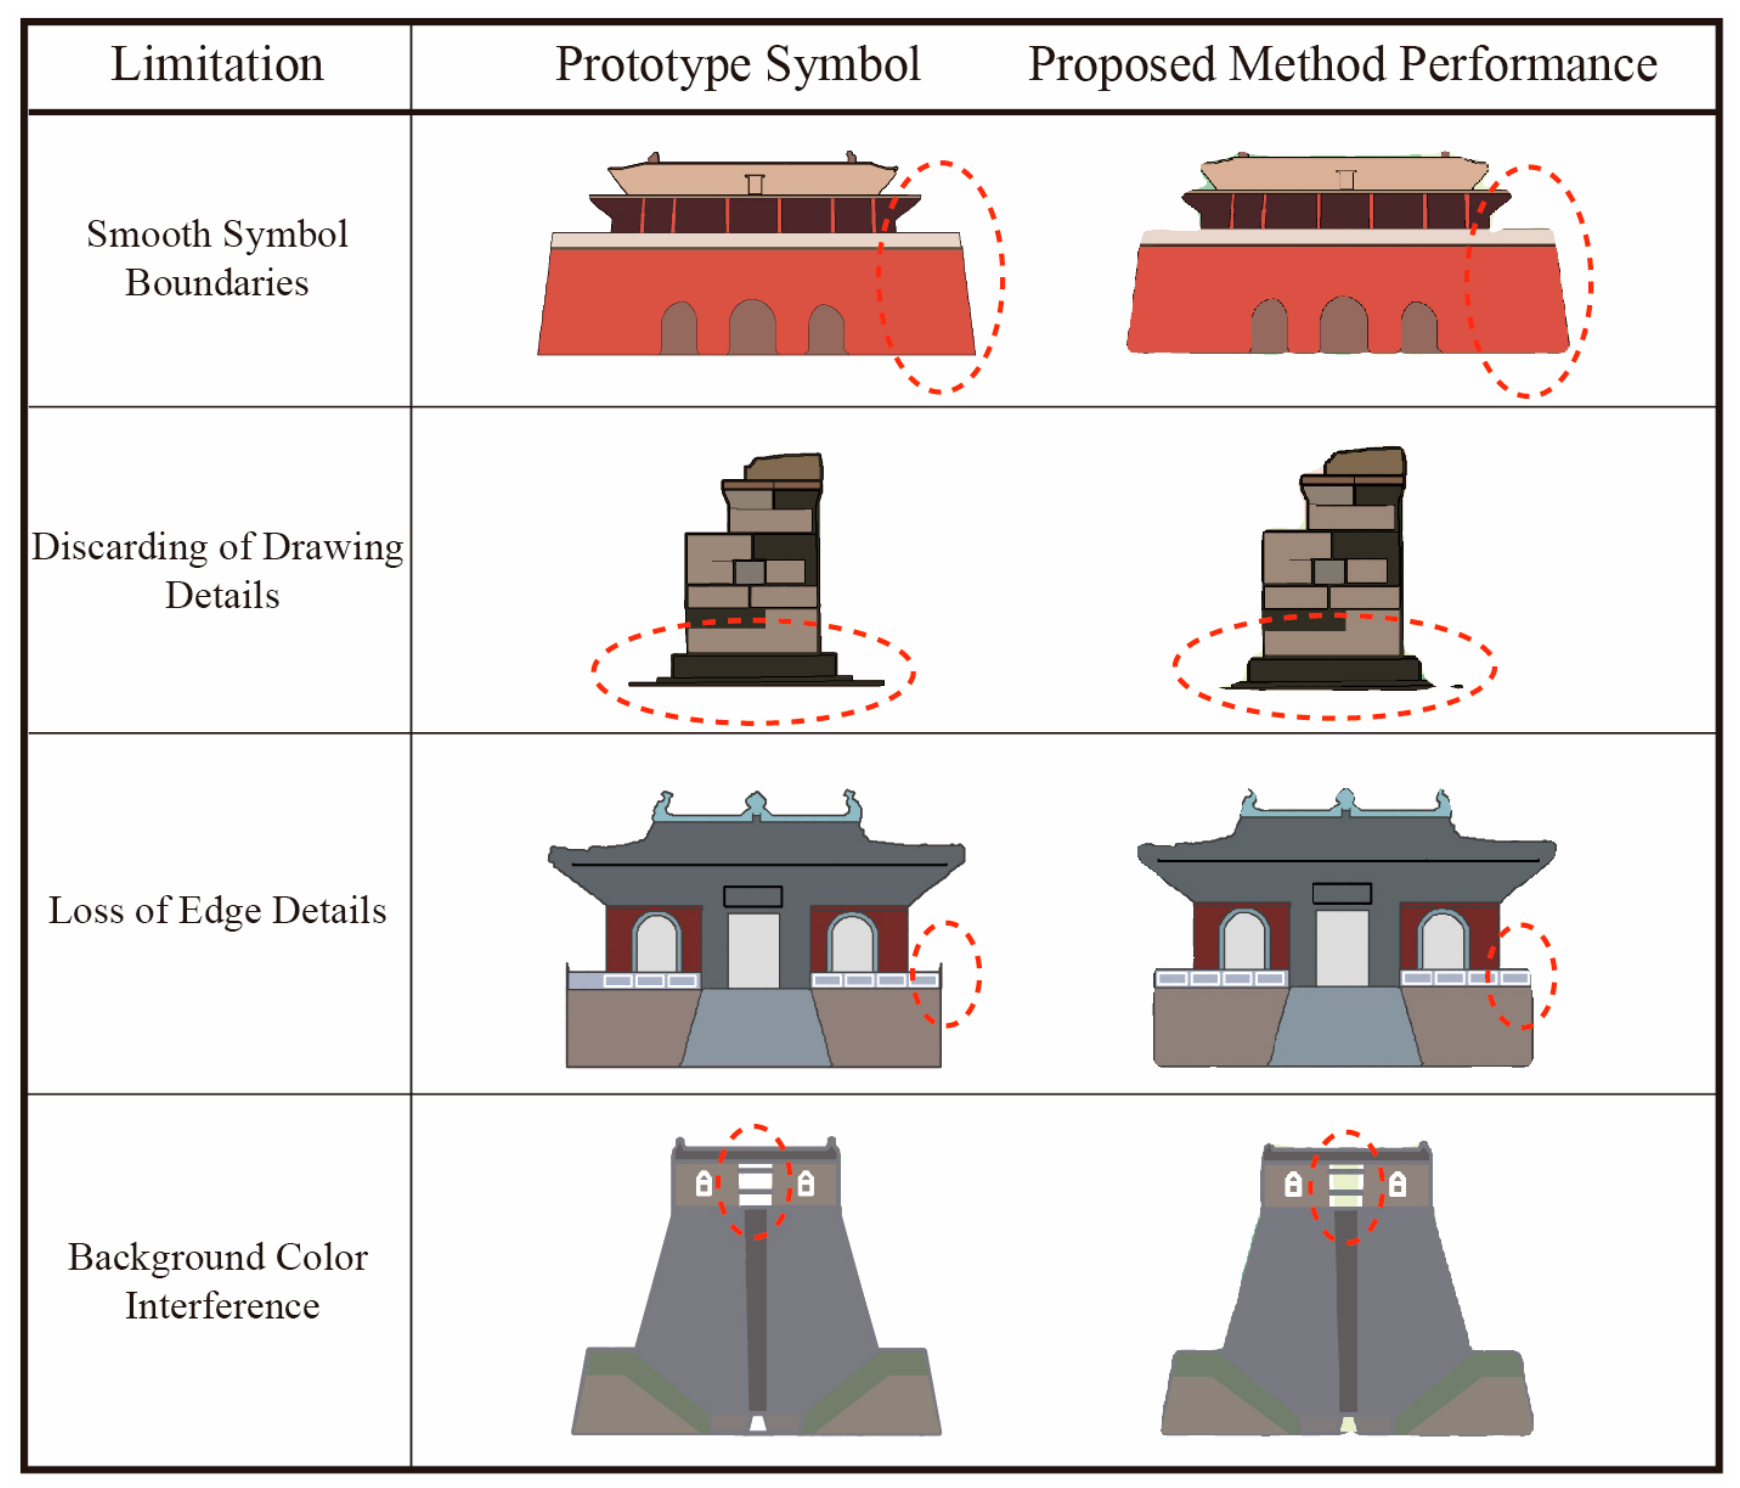
While the collaborative method effectively achieves specific symbol segmentation, it has limitations regarding segmentation accuracy. The SAM’s reliance on pre-training with large datasets complicates the quantitative evaluation of symbol extraction precision. Consequently, we applied this method to the designed map for comparative analysis. As shown in
Figure 17, the proposed automated symbol extraction method successfully extracts complete symbol information while preserving the core characteristics of the symbols. However, several issues persist:
- 1.
The extracted symbol boundaries are generally smoother than the originals;
- 2.
Some fine details along the symbol edges are lost;
- 3.
Hollow areas within symbols are occasionally affected by background colors.
To address these limitations, several potential solutions are being explored. We are investigating the integration of edge enhancement algorithms to improve boundary precision, which can better preserve the original contour characteristics during the extraction process. To tackle the challenge of hollow areas, we are exploring advanced color separation techniques and developing specialized post-processing methods to better distinguish between symbol features and background elements. Additionally, we are working on implementing an adaptive threshold mechanism that can dynamically adjust segmentation parameters based on local image characteristics, potentially leading to more accurate symbol extraction results.
In summary, this method achieves a fully automated workflow from map input to symbol extraction, effectively addressing the challenges of extracting complex structures in icons and simplifying the symbol design process for general cartographers. Nevertheless, certain limitations persist, such as the imprecise handling of symbol boundaries and the loss of fine edge details.
6. Conclusions
This article integrates data from books and digital maps to construct a tourist map dataset containing icons, providing a comprehensive foundation for training symbol detection and segmentation models. The methodology employs a two-stage framework that leverages both detection and segmentation capabilities. Based on an analysis of various YOLO model variants, the YOLOv8x model was selected for symbol detection. The detection results were then fed into the SAM, effectively enabling the extraction of icons. Through model collaboration, intermediate results can be observed between detection and segmentation stages, enhancing systematic understanding of the symbol extraction process and establishing a foundation for symbol extraction in complex environments.
The experimental results demonstrate that the combination of YOLOv8 and SAM for the automated extraction of icons in tourist maps successfully merges the strengths of detection and segmentation. This achieves a fully automated workflow from symbol detection to precise segmentation. Additionally, this article introduces an improved user interaction mechanism that allows users to manually adjust prediction boxes when detection results are imperfect, thereby enhancing the accuracy and practicality of symbol extraction. Testing shows that this method can accurately and efficiently extract various symbols from hand-drawn maps with different illustrative styles and demonstrates robust performance across different map types.
Building upon these technical achievements, the methodology demonstrates substantial practical value across multiple domains. In the field of tourism applications, the method enables the efficient digitization of traditional paper tourism maps and facilitates the creation of interactive digital tour guides and navigation systems. In GIS, automatic extraction of map symbols accelerates the process of map vectorization and updating, and improves the efficiency of spatial data management. In addition, the method can handle different illustration styles, making it applicable to standardized symbols from different map sources and supporting the development of consistent cartographic systems.
Despite these promising results, the study has certain limitations. The limited size of the dataset leads to variability in detection performance across different symbol categories, and symbol extraction is subject to specific constraints. Furthermore, segmentation accuracy is significantly influenced by resolution, particularly for low-resolution maps and those with complex backgrounds, where the extraction results require further improvement.
Future research will focus on the following three areas:
- 1.
Expanding the dataset: To enhance the model’s adaptability and generalization capabilities, future efforts will focus on collecting tourist maps from diverse cultural backgrounds and regional styles. This will enrich and refine the training dataset, ensuring the model can accommodate a broader range of application scenarios.
- 2.
Exploring advanced models: Emerging deep learning models, such as Transformers and Vision Permutators, will be evaluated and tested to improve the precision and accuracy of symbol extraction.
- 3.
Real-time extraction capabilities: The development of mobile applications for real-time interactive map analysis will be investigated, enabling users to analyze tourist maps on the go and providing a more interactive and personalized travel experience.
Author Contributions
Conceptualization, Lili Wu; methodology, Lili Wu; validation, Di Cao; formal analysis, Di Cao; investigation, Jingjing Li; data curation, Xinran Yan; writing—original draft preparation, Di Cao and Lili Wu; writing—review and editing, Di Cao and Lili Wu; visualization, Jiaoyao Li; supervision, Lili Wu; project administration, Lili Wu; funding acquisition, Lili Wu. All authors have read and agreed to the published version of the manuscript.
Funding
This research was funded by the State Key Laboratory of Geo-Information Engineering, grant number SKLGIE2024-M-4-2.
Data Availability Statement
The data presented in this article are available from the author upon reasonable request.
Acknowledgments
The authors would like to acknowledge all of reviewers and editors.
Conflicts of Interest
The authors declare no conflicts of interest.
References
- Gretzel, U.; Sigala, M.; Xiang, Z.; Koo, C. Smart tourism: Foundations and developments. Electron. Mark. 2015, 25, 179–188. [Google Scholar] [CrossRef]
- Lin, C.H.; Chen, J.Y.; Hsu, S.S.; Chung, Y.H. Automatic tourist attraction and representative icon determination for tourist map generation. Inf. Vis. 2014, 13, 18–28. [Google Scholar] [CrossRef]
- Liu, X.; Chen, Y. Frame Design for Point-shaped Map Symbol Based on Eye Movement Experiment. J. Geomat. Sci. Technol. 2016, 33, 644–649. [Google Scholar]
- Airikka, M.; Masoodian, M. Comparing the Effects of Illustration Styles on the Functionality of Tourist Maps. In Proceedings of the 19th International-Federation-for-Information-Processing-Technical-Committee-13 (IFIP TC13) International Conference on Human-Computer Interaction (INTERACT), University of York, York, UK, 28 August–1 September 2023; pp. 132–146. [Google Scholar]
- Airikka, M.; Masoodian, M. A Survey of the Visual Design of Cartographic and other Elements of Illustrated Tourist Maps. In Proceedings of the 23rd International Conference in Information Visualization (IV)/16th International Conference Computer Graphics, Imaging and Visualization (CGiV), Flinders University, Adelaide, Australia, 15–19 July 2019; pp. 7–13. [Google Scholar]
- Kovacevic, D.; Brozovic, M.; Mozina, K. Comprehension of City Map Pictograms Designed for Specific Tourists’ Needs. Isprs Int. J. Geo-Inf. 2024, 13, 137. [Google Scholar] [CrossRef]
- Robinson, A.C.; Çöltekin, A.; Griffin, A.L.; Ledermann, F. Cartography in GeoAI: Emerging themes and research challenges. In Proceedings of the 6th ACM SIGSPATIAL International Workshop on AI for Geographic Knowledge Discovery, Hamburg, Germany, 13 November 2023; pp. 1–2. [Google Scholar]
- Li, J.; Mouchere, H.; Viard-Gaudin, C. Symbol Knowledge Extraction from a Simple Graphical Language. In Proceedings of the 11th International Conference on Document Analysis and Recognition (ICDAR), Beijing, China, 18–21 September 2011; pp. 608–612. [Google Scholar]
- Chen, H.-B.; Wang, Q.; Xu, X.-R.; Zhang, C.-Y. Extraction of symbol line-features based on improved Hough transformation. Opt. Precis. Eng. 2003, 11, 632–636. [Google Scholar]
- Chang, A.; Kyu Sik, K.; Sang Burm, R.; Kye Young, L. A Road Extraction Method from Topographical Map Images. In Proceedings of the IEEE Pacific Rim Conference on Communications, Computers and Signal Processing, Victoria, BC, Canada, 20–22 August 1997; Volume 832, pp. 839–842. [Google Scholar]
- Chiang, Y.-Y.; Knoblock, C.A. A general approach for extracting road vector data from raster maps. Int. J. Doc. Anal. Recognit. (IJDAR) 2013, 16, 55–81. [Google Scholar] [CrossRef]
- Chiang, Y.Y.; Duan, W.; Leyk, S.; Uhl, J.H.; Knoblock, C.A. Using Historical Maps in Scientific Studies; Springer: Cham, Switzerland, 2020. [Google Scholar]
- Yu, Y.; Yan, H.; Li, J.; Wang, X.; Fu, X.; Wang, Z.; Hou, Y. Automatic Extraction Method of Point Symbols in Modern Hand-Drawn Maps for We-Map. J. Geo-Inf. Sci. 2024, 26, 1646–1658. [Google Scholar]
- He, H.; Yang, D.; Wang, S.; Wang, S.; Li, Y. Road Extraction by Using Atrous Spatial Pyramid Pooling Integrated Encoder-Decoder Network and Structural Similarity Loss. Remote Sens. 2019, 11, 1015. [Google Scholar] [CrossRef]
- Hidayat, H.; Irawan, R.D.; Azhali, F.M. Building Footprint Extraction from Fixed-Wing UAV Imagery using Mask R-CNN and Object-based Image Analysis Methods (Case Study: Banturejo Village, Malang Regency). IOP Conf. Ser. Earth Environ. Sci. 2024, 1418, 012046. [Google Scholar] [CrossRef]
- Rob, O.H.; Richa, M.; Jesko, Z.; Matthew, S.; Stuart, G. Unleashing the power of old maps: Extracting symbology from nineteenth century maps using convolutional neural networks to quantify modern land use on historic wetlands. Ecol. Indic. 2024, 158, 111363. [Google Scholar]
- Garcia-Molsosa,, A.; Orengo, H.A.; Lawrence, D.; Philip, G.; Hopper, K.; Petrie, C.A. Potential of deep learning segmentation for the extraction of archaeological features from historical map series. Archaeol. Prospect. 2021, 28, 187–199. [Google Scholar]
- Guo, M.; Bei, W.; Huang, Y.; Chen, Z.; Zhao, X. Deep learning framework for geological symbol detection on geological maps. Comput. Geosci. 2021, 157, 104943. [Google Scholar] [CrossRef]
- Kurmanbek, K.; Metin, S. Deep Stroke-Based Sketched Symbol Reconstruction and Segmentation. IEEE Comput. Graph. Appl. 2020, 40, 112–126. [Google Scholar]
- Elyan, E.; Jamieson, L.; Ali-Gombe, A. Deep learning for symbols detection and classification in engineering drawings. Neural Netw. 2020, 129, 91–102. [Google Scholar] [CrossRef]
- Paul, A.; Pramanik, R.; Malakar, S.; Sarkar, R. An ensemble of deep transfer learning models for handwritten music symbol recognition. Neural Comput. Appl. 2021, 34, 1–19. [Google Scholar] [CrossRef]
- Ao, W.; Zheng, S.; Meng, Y. SEMPNet: Enhancing few-shot remote sensing image semantic segmentation through the integration of the segment anything model. GIScience Remote Sens. 2024, 61, 2426589. [Google Scholar] [CrossRef]
- Jocher, G.; Ayush, C.; Qiu, J. YOLO; Ultralytics: Frederick, MD, USA, 2023. [Google Scholar]
- Zou, N.; Xu, Q.; Wu, Y.; Zhu, X.; Su, Y. An Automated Method for Generating Prefabs of AR Map Point Symbols Based on Object Detection Model. ISPRS Int. J. Geo-Inf. 2023, 12, 440. [Google Scholar] [CrossRef]
- Talaat, F.M.; ZainEldin, H. An improved fire detection approach based on YOLO-v8 for smart cities. Neural Comput. Appl. 2023, 35, 20939–20954. [Google Scholar] [CrossRef]
- Wang, G.; Chen, Y.; An, P.; Hong, H.; Hu, J.; Huang, T. UAV-YOLOv8: A small-object-detection model based on improved YOLOv8 for UAV aerial photography scenarios. Sensors 2023, 23, 7190. [Google Scholar] [CrossRef]
- Kirillov, A.; Mintun, E.; Ravi, N.; Mao, H.; Rolland, C.; Gustafson, L.; Xiao, T.; Whitehead, S.; Berg, A.C.; Lo, W.-Y.; et al. Segment Anything. arXiv 2023, arXiv:2304.02643. [Google Scholar]
- Ma, J.; He, Y.; Li, F.; Han, L.; You, C.; Wang, B. Segment anything in medical images. Nat. Commun. 2024, 15, 654. [Google Scholar] [CrossRef] [PubMed]
- Jocher, G.; Chaurasia, A.; Stoken, A.; Borovec, J.; Kwon, Y.; Michael, K.; Fang, J.; Yifu, Z.; Wong, C.; Montes, D. ultralytics/yolov5: v7. 0-yolov5 sota realtime instance segmentation. Zenodo 2022, 5281. [Google Scholar]
- Wang, C.-Y.; Bochkovskiy, A.; Liao, H.-Y.M. YOLOv7: Trainable bag-of-freebies sets new state-of-the-art for real-time object detectors. In Proceedings of the IEEE/CVF Conference on Computer Vision and Pattern Recognition, Vancouver, BC, Canada, 17–24 June 2023; pp. 7464–7475. [Google Scholar]
- Wang, A.; Chen, H.; Liu, L.; Chen, K.; Lin, Z.; Han, J.; Ding, G. Yolov10: Real-time end-to-end object detection. arXiv 2024, arXiv:2405.14458. [Google Scholar]
- Ren, S. Faster r-cnn: Towards real-time object detection with region proposal networks. arXiv 2015, arXiv:1506.01497. [Google Scholar] [CrossRef] [PubMed]
- Liu, W.; Anguelov, D.; Erhan, D.; Szegedy, C.; Reed, S.; Fu, C.-Y.; Berg, A.C. Ssd: Single shot multibox detector. In Proceedings of the Computer Vision–ECCV 2016: 14th European Conference, Amsterdam, The Netherlands, 11–14 October 2016; Proceedings, Part I 14; Springer: Cham, Switzerland, 2016; pp. 21–37. [Google Scholar]
- Tsung-Yi, L.; Priya, G.; Ross, G.; Kaiming, H.; Piotr, D. Focal Loss for Dense Object Detection. IEEE Trans. Pattern Anal. Mach. Intell. 2020, 42, 318–327. [Google Scholar]
Figure 1.
Workflow of the methodology.
Figure 1.
Workflow of the methodology.
Figure 2.
Examples of data augmentation.
Figure 2.
Examples of data augmentation.
Figure 3.
Yolov8 model architecture diagram [
23].
Figure 3.
Yolov8 model architecture diagram [
23].
Figure 4.
Examples of the three segmentation modes in the SAM model.
Figure 4.
Examples of the three segmentation modes in the SAM model.
Figure 5.
Symbol detection and extraction workflow.
Figure 5.
Symbol detection and extraction workflow.
Figure 6.
Percentage of the five label types.
Figure 6.
Percentage of the five label types.
Figure 7.
Variation of metrics during YOLO model training.
Figure 7.
Variation of metrics during YOLO model training.
Figure 8.
Symbol recognition accuracy by category.
Figure 8.
Symbol recognition accuracy by category.
Figure 9.
IoU distribution of all predicted objects.
Figure 9.
IoU distribution of all predicted objects.
Figure 10.
IoU boxplot across different categories.
Figure 10.
IoU boxplot across different categories.
Figure 11.
Symbol detection process.
Figure 11.
Symbol detection process.
Figure 12.
Examples of five symbol extracting categories.
Figure 12.
Examples of five symbol extracting categories.
Figure 13.
Visualization of comparison experiments.
Figure 13.
Visualization of comparison experiments.
Figure 14.
Confusion matrix.
Figure 14.
Confusion matrix.
Figure 15.
Annotation examples for the segmentation and detection models ((A–C) for segmentation models; (a–c) for detection models).
Figure 15.
Annotation examples for the segmentation and detection models ((A–C) for segmentation models; (a–c) for detection models).
Figure 16.
Comparison of the symbol extraction results (left: SAM model; right: synergistic approach).
Figure 16.
Comparison of the symbol extraction results (left: SAM model; right: synergistic approach).
Figure 17.
Comparison of the symbol prototype and extraction results.
Figure 17.
Comparison of the symbol prototype and extraction results.
Table 2.
Principles of data cleaning.
Table 2.
Principles of data cleaning.
| Principle | Description |
|---|
| Complete organization | Symbols must be complete to ensure the model captures full information for accurate recognition and extraction. |
| Diverse types | Include diverse types of tourist map symbols to improve the model’s learning ability and adaptability. |
| Clear structure | Symbols should feature clear boundaries and shapes to enhance recognition and extraction accuracy. |
| Minimal interference | Keep the background simple to reduce interference and ensure stable and precise detection. |
Table 3.
Examples of five symbol categories.
Table 3.
Examples of five symbol categories.
| Category | Description | Example |
|---|
| Human Landscape Symbol | These represent cultural and historical edifices, including monuments, architectural heritage sites, significant built environments, etc. | ![Ijgi 14 00055 i004]() |
| Natural Scenery Symbol | These denote natural topographic features, encompassing orographic elements, hydrological features, vegetative cover, etc. | ![Ijgi 14 00055 i005]() |
| Human Symbol | Represent tourism activities or travel status, hikers, group travelers, silhouettes of local residents’ lives, etc. | ![Ijgi 14 00055 i006]() |
| Animal Symbol | These represent indigenous wildlife populations and species distribution, including pandas, elephants, tigers, etc. | ![Ijgi 14 00055 i007]() |
| Cultural Symbol | These illustrate distinctive regional characteristics, incorporating traditional festivals, cultural practices, intangible heritage elements, etc. | ![Ijgi 14 00055 i008]() |
Table 4.
Data Augmentation Methods and Target Effects.
Table 4.
Data Augmentation Methods and Target Effects.
| Number | Method | Description | Target Effects |
|---|
| 1 | Horizontal Flip | Randomly flip the image horizontally and adjust
the bounding box labels. | Enhance the model’s adaptability to
horizontal directional changes. |
| 2 | Vertical Flip | Randomly flip the image vertically and adjust
the bounding box labels. | Enhance the model’s adaptability to
vertical directional changes. |
| 3 | Center Crop | Crop a fixed-size region from the center of the
image and adjust the bounding box labels. | Focus the model on core regions to
reduce edge interference. |
| 4 | Brightness
Adjustment | Randomly change the image brightness within
the range [−120/255, +120/255]. | Enhance the model’s stability under
varying brightness conditions. |
| 5 | Contrast
Adjustment | Randomly adjust the image contrast within the
range [0.5, 1.5]. | Enhance robustness to both high- and
low-contrast images. |
| 6 | Contrast
Adjustment | Randomly change the image saturation within
the range [0.5, 1.5]. | Enhance the model’s adaptability to
richly colored or monochromatic images. |
| 7 | Gaussian Noise
Addition | Add Gaussian noise with a mean of 0 and a
standard deviation of 0.1. | Enhance the model’s robustness against
noise interference. |
| 8 | Salt Noise
Addition | Randomly add high-brightness spots (pixel
values set to 1.0). | Enhance the model’s detection
performance in noisy environments. |
| 9 | Pepper Noise
Addition | Randomly add low-brightness spots (pixel
values set to 1.0). | Enhance the model’s detection
performance in noisy environments. |
Table 5.
Parameters of the ViT model series [
27].
Table 5.
Parameters of the ViT model series [
27].
| Model | Patch Embedding Dimension | Transformer Head Count | Transformer Block Layers |
|---|
| vit_h | 1280 | 16 | 32 |
| vit_l | 1024 | 16 | 24 |
| vit_b | 768 | 12 | 12 |
Table 6.
Three modes of user interaction.
Table 7.
Model training parameters.
Table 7.
Model training parameters.
| Parameter | Value |
|---|
| Epochs | 200 |
| Batch Size | 16 |
| Image Size | 640 × 640 |
| Initial Learning Rate | 0.01 |
| Learning Rate Momentum | 0.937 |
| Weight Decay Coefficient | 0.0005 |
| Optimizer | SDG |
| work | 8 |
Table 8.
Evaluation metrics for the YOLO model.
Table 8.
Evaluation metrics for the YOLO model.
| Metric | Formula | Description |
|---|
| Precision | | Measures the accuracy of the model in predicting positive samples. |
| Recall | | Evaluates the model’s ability to identify true positive samples. |
| F1-Score | -score | The harmonic mean of precision and recall is used to assess the model’s overall performance. |
| mAP | | Reflects the detection performance across different thresholds. |
| IoU | | Measures the overlap between predicted and ground truth bounding boxes in object detection. |
Table 9.
Comparison with the mainstream algorithms.
Table 9.
Comparison with the mainstream algorithms.
| Model | AP (%) | Recall (%) | Precision (%) | F1 Score |
|---|
| Faster R-CNN | 74.11 | 80.05 | 55.09 | 0.65 |
| Retinanet | 81.17 | 80.41 | 89.3 | 0.84 |
| SSD | 74.4 | 34.99 | 95.34 | 0.5 |
| YOLOv8-X | 90.38 | 81.23 | 94.4 | 0.87 |
| Disclaimer/Publisher’s Note: The statements, opinions and data contained in all publications are solely those of the individual author(s) and contributor(s) and not of MDPI and/or the editor(s). MDPI and/or the editor(s) disclaim responsibility for any injury to people or property resulting from any ideas, methods, instructions or products referred to in the content. |
© 2025 by the authors. Published by MDPI on behalf of the International Society for Photogrammetry and Remote Sensing. Licensee MDPI, Basel, Switzerland. This article is an open access article distributed under the terms and conditions of the Creative Commons Attribution (CC BY) license (https://creativecommons.org/licenses/by/4.0/).


