

Spatial Dynamics and Drivers of Urban Growth in Thua Thien Hue Province, Vietnam: Insights for Urban Sustainability in the Global South

 , , ,
, , ,  and
and
Abstract
1. Introduction
2. Methodology
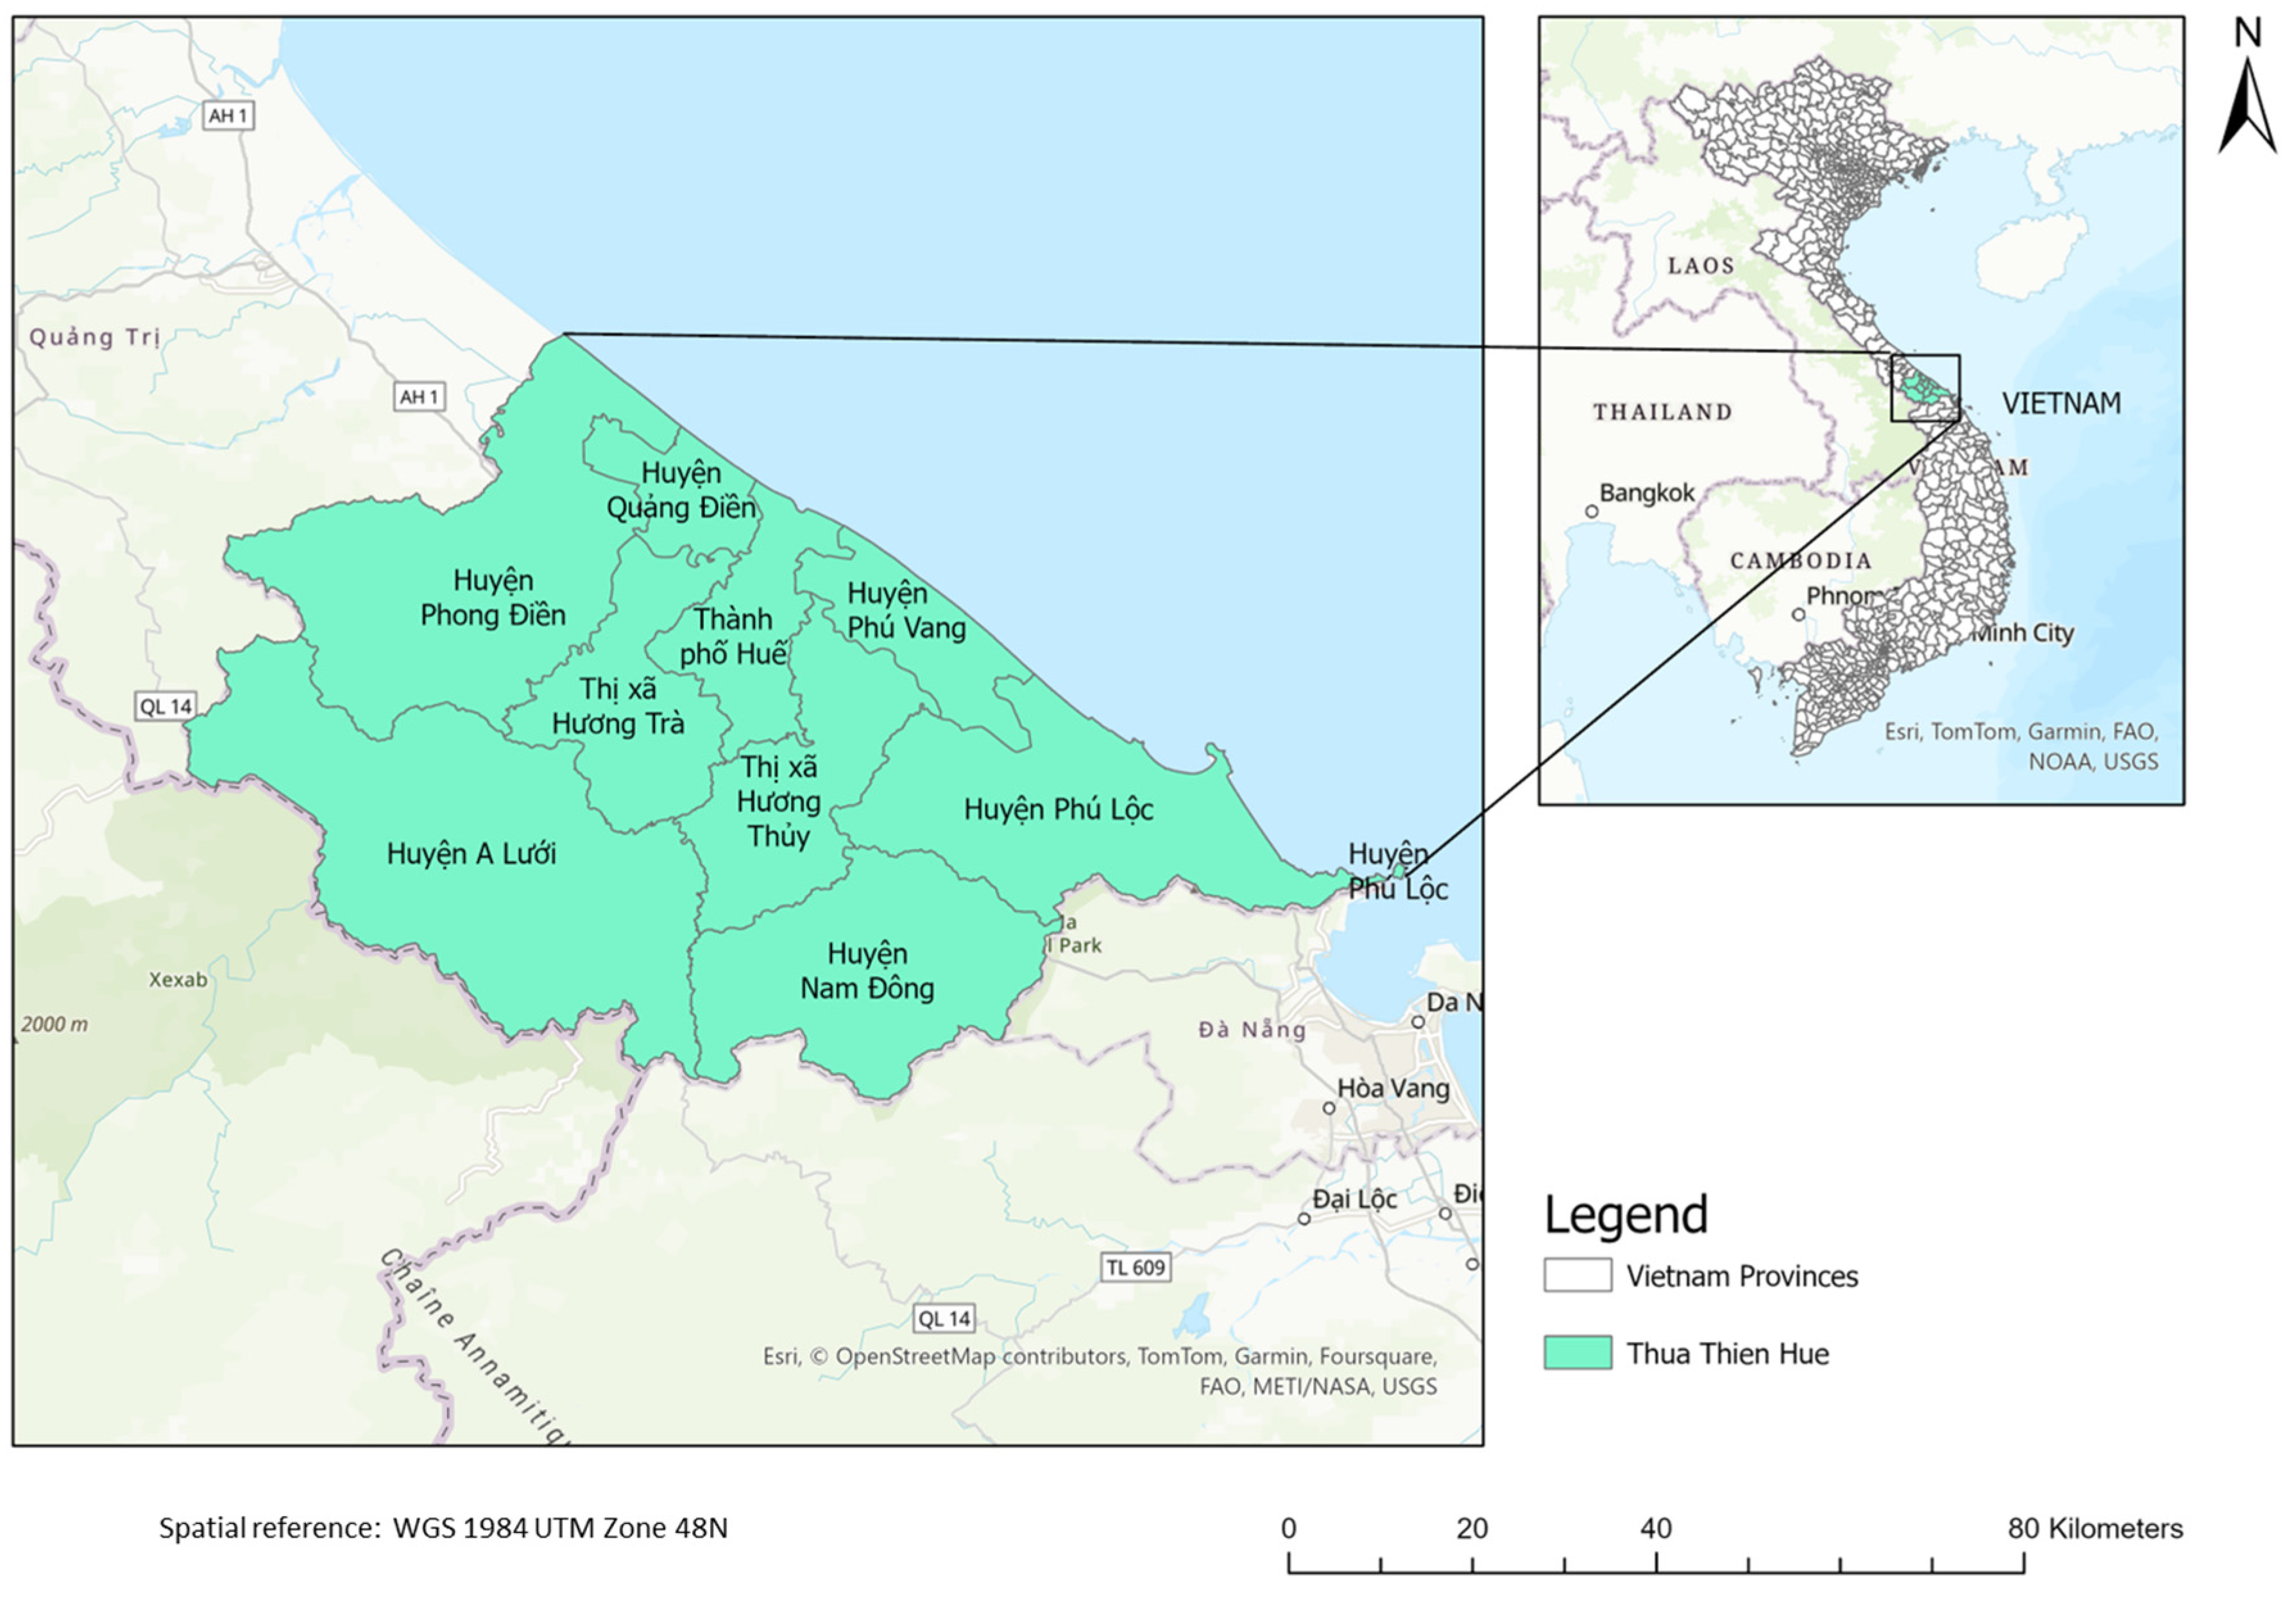
2.1. Study Area
2.2. Data Collection
2.3. Data Analysis
2.3.1. Change Detection of Urban Growth from 2000 to 2020
2.3.2. Potential Driving Factors of Urban Growth in Thua Thien Hue Province
2.3.3. Developing Raster Maps of Potential Drivers of Urban Growth
2.3.4. Random Forest Model
2.3.5. Validation of Random Forest Model
2.3.6. Analysis of Interviews
3. Results
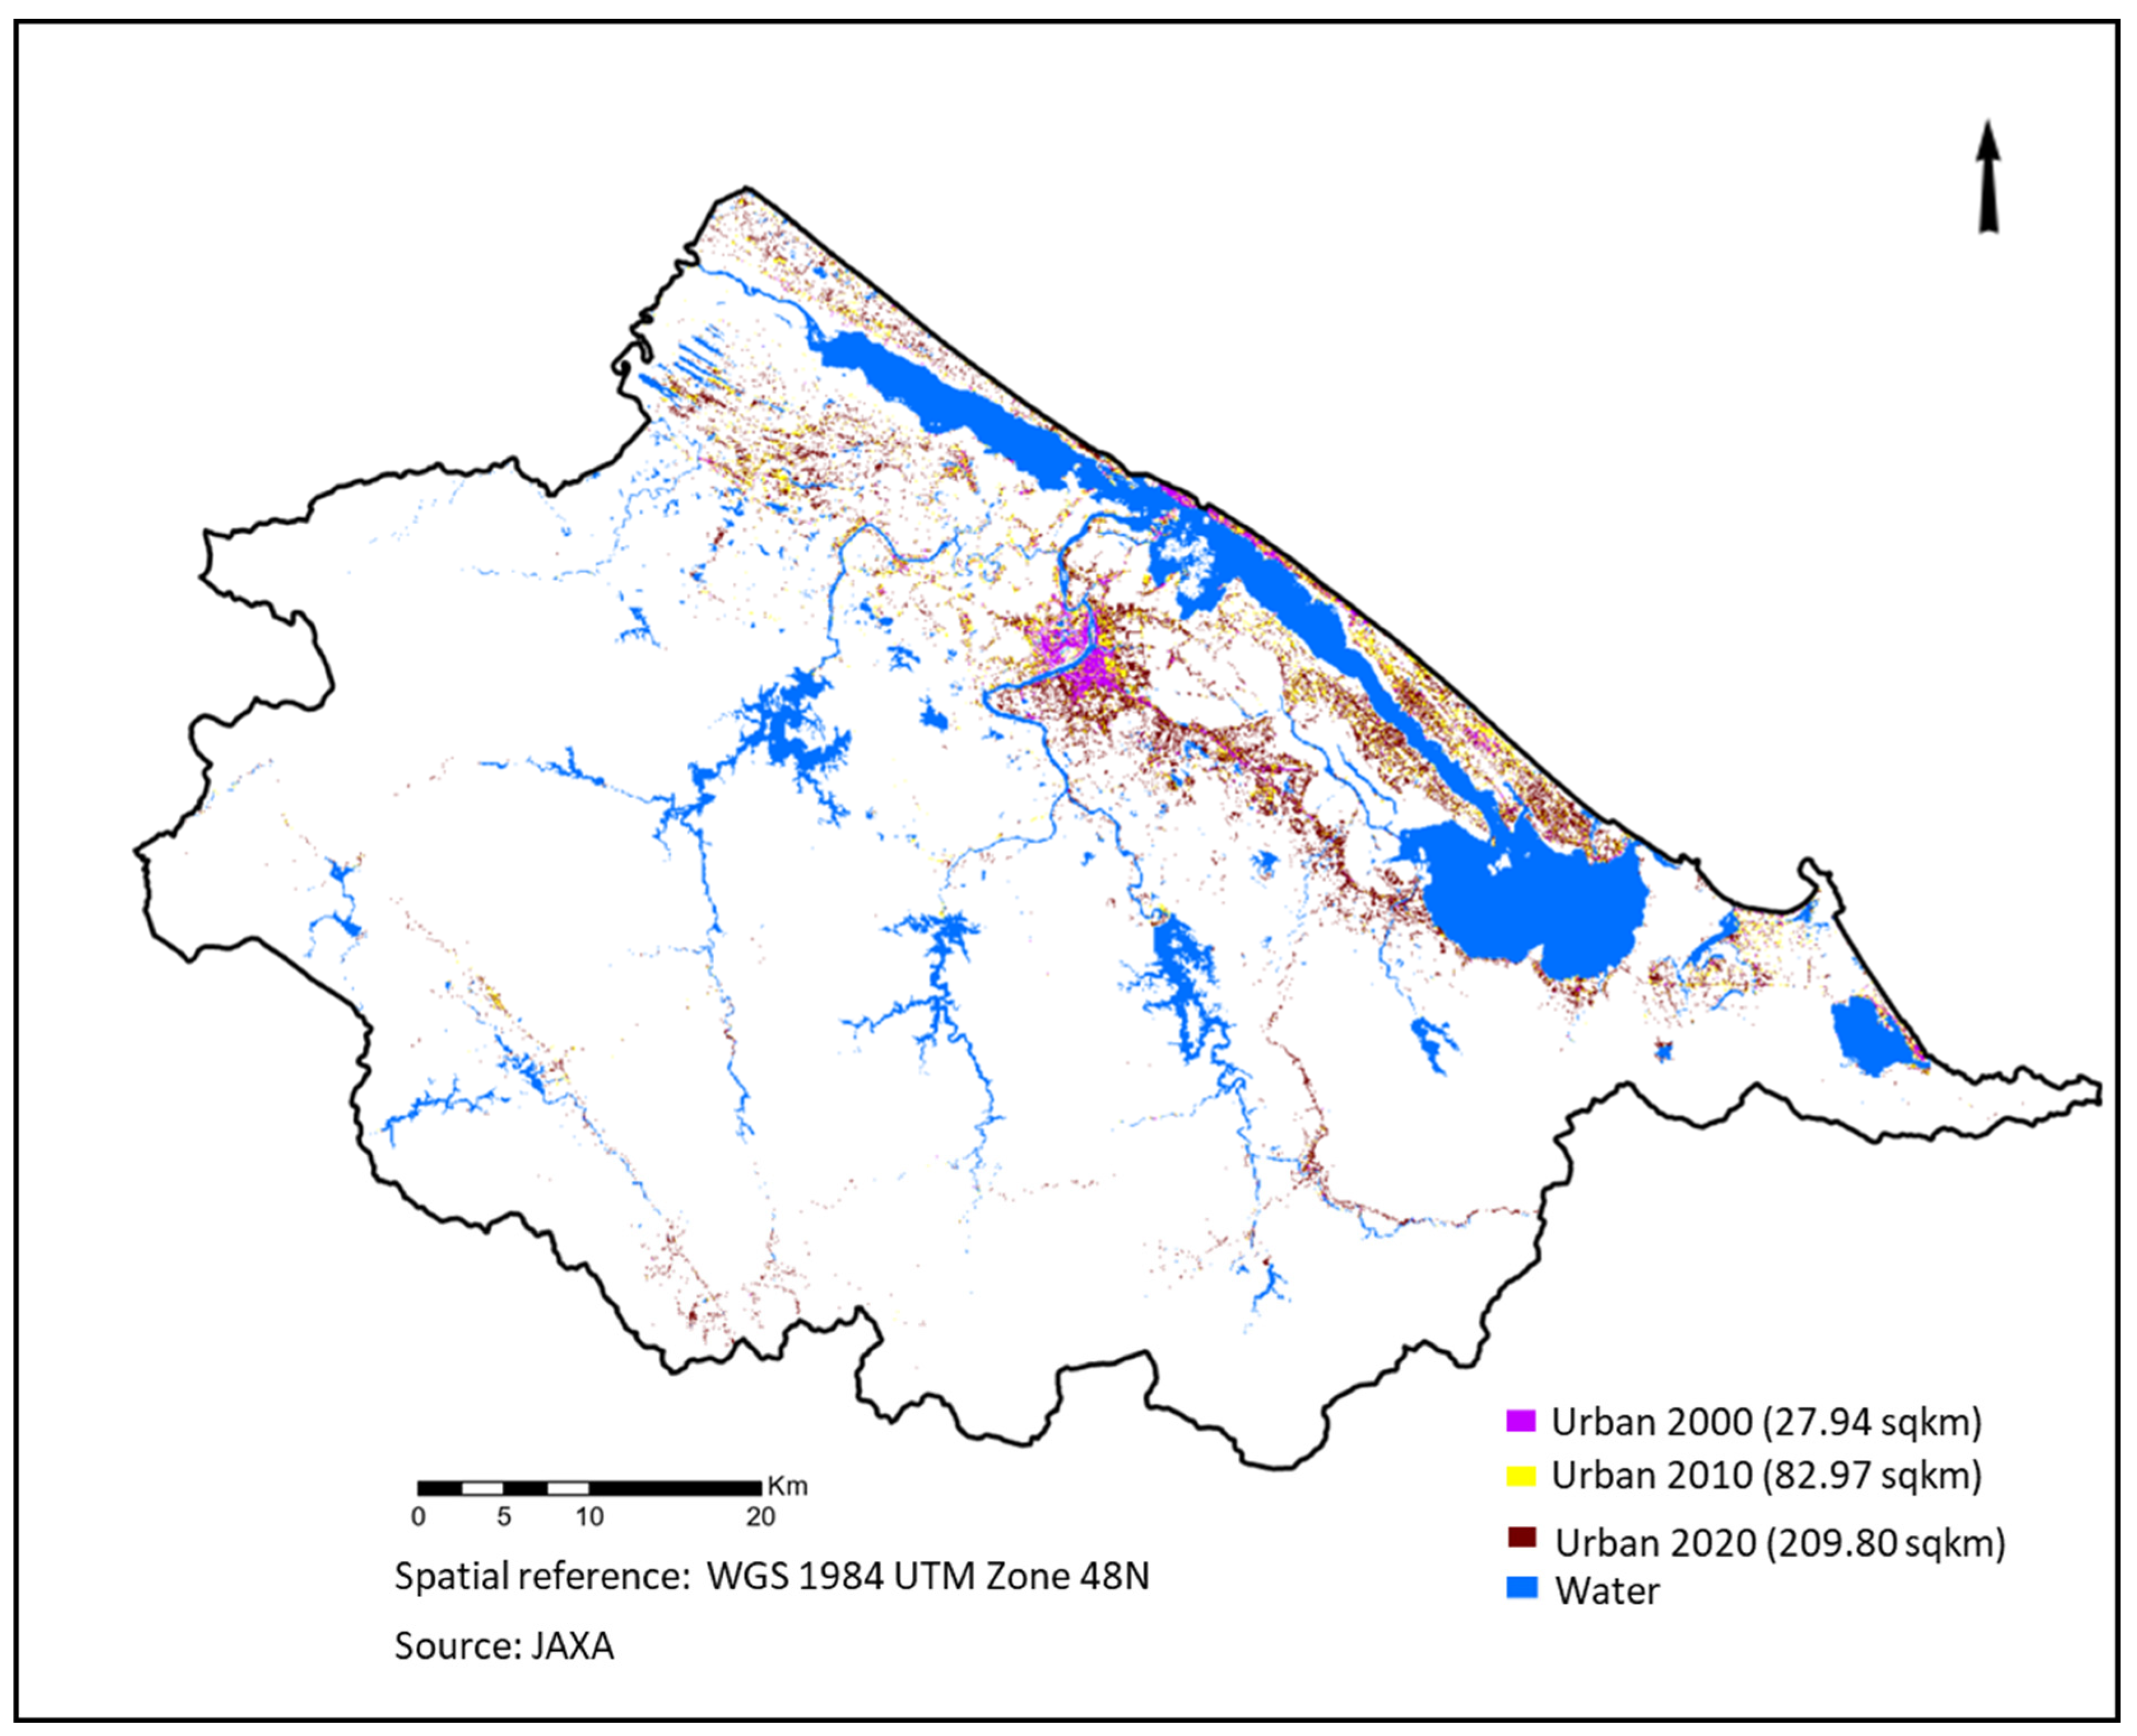
3.1. Historical Pattern of Urban Growth in TTH
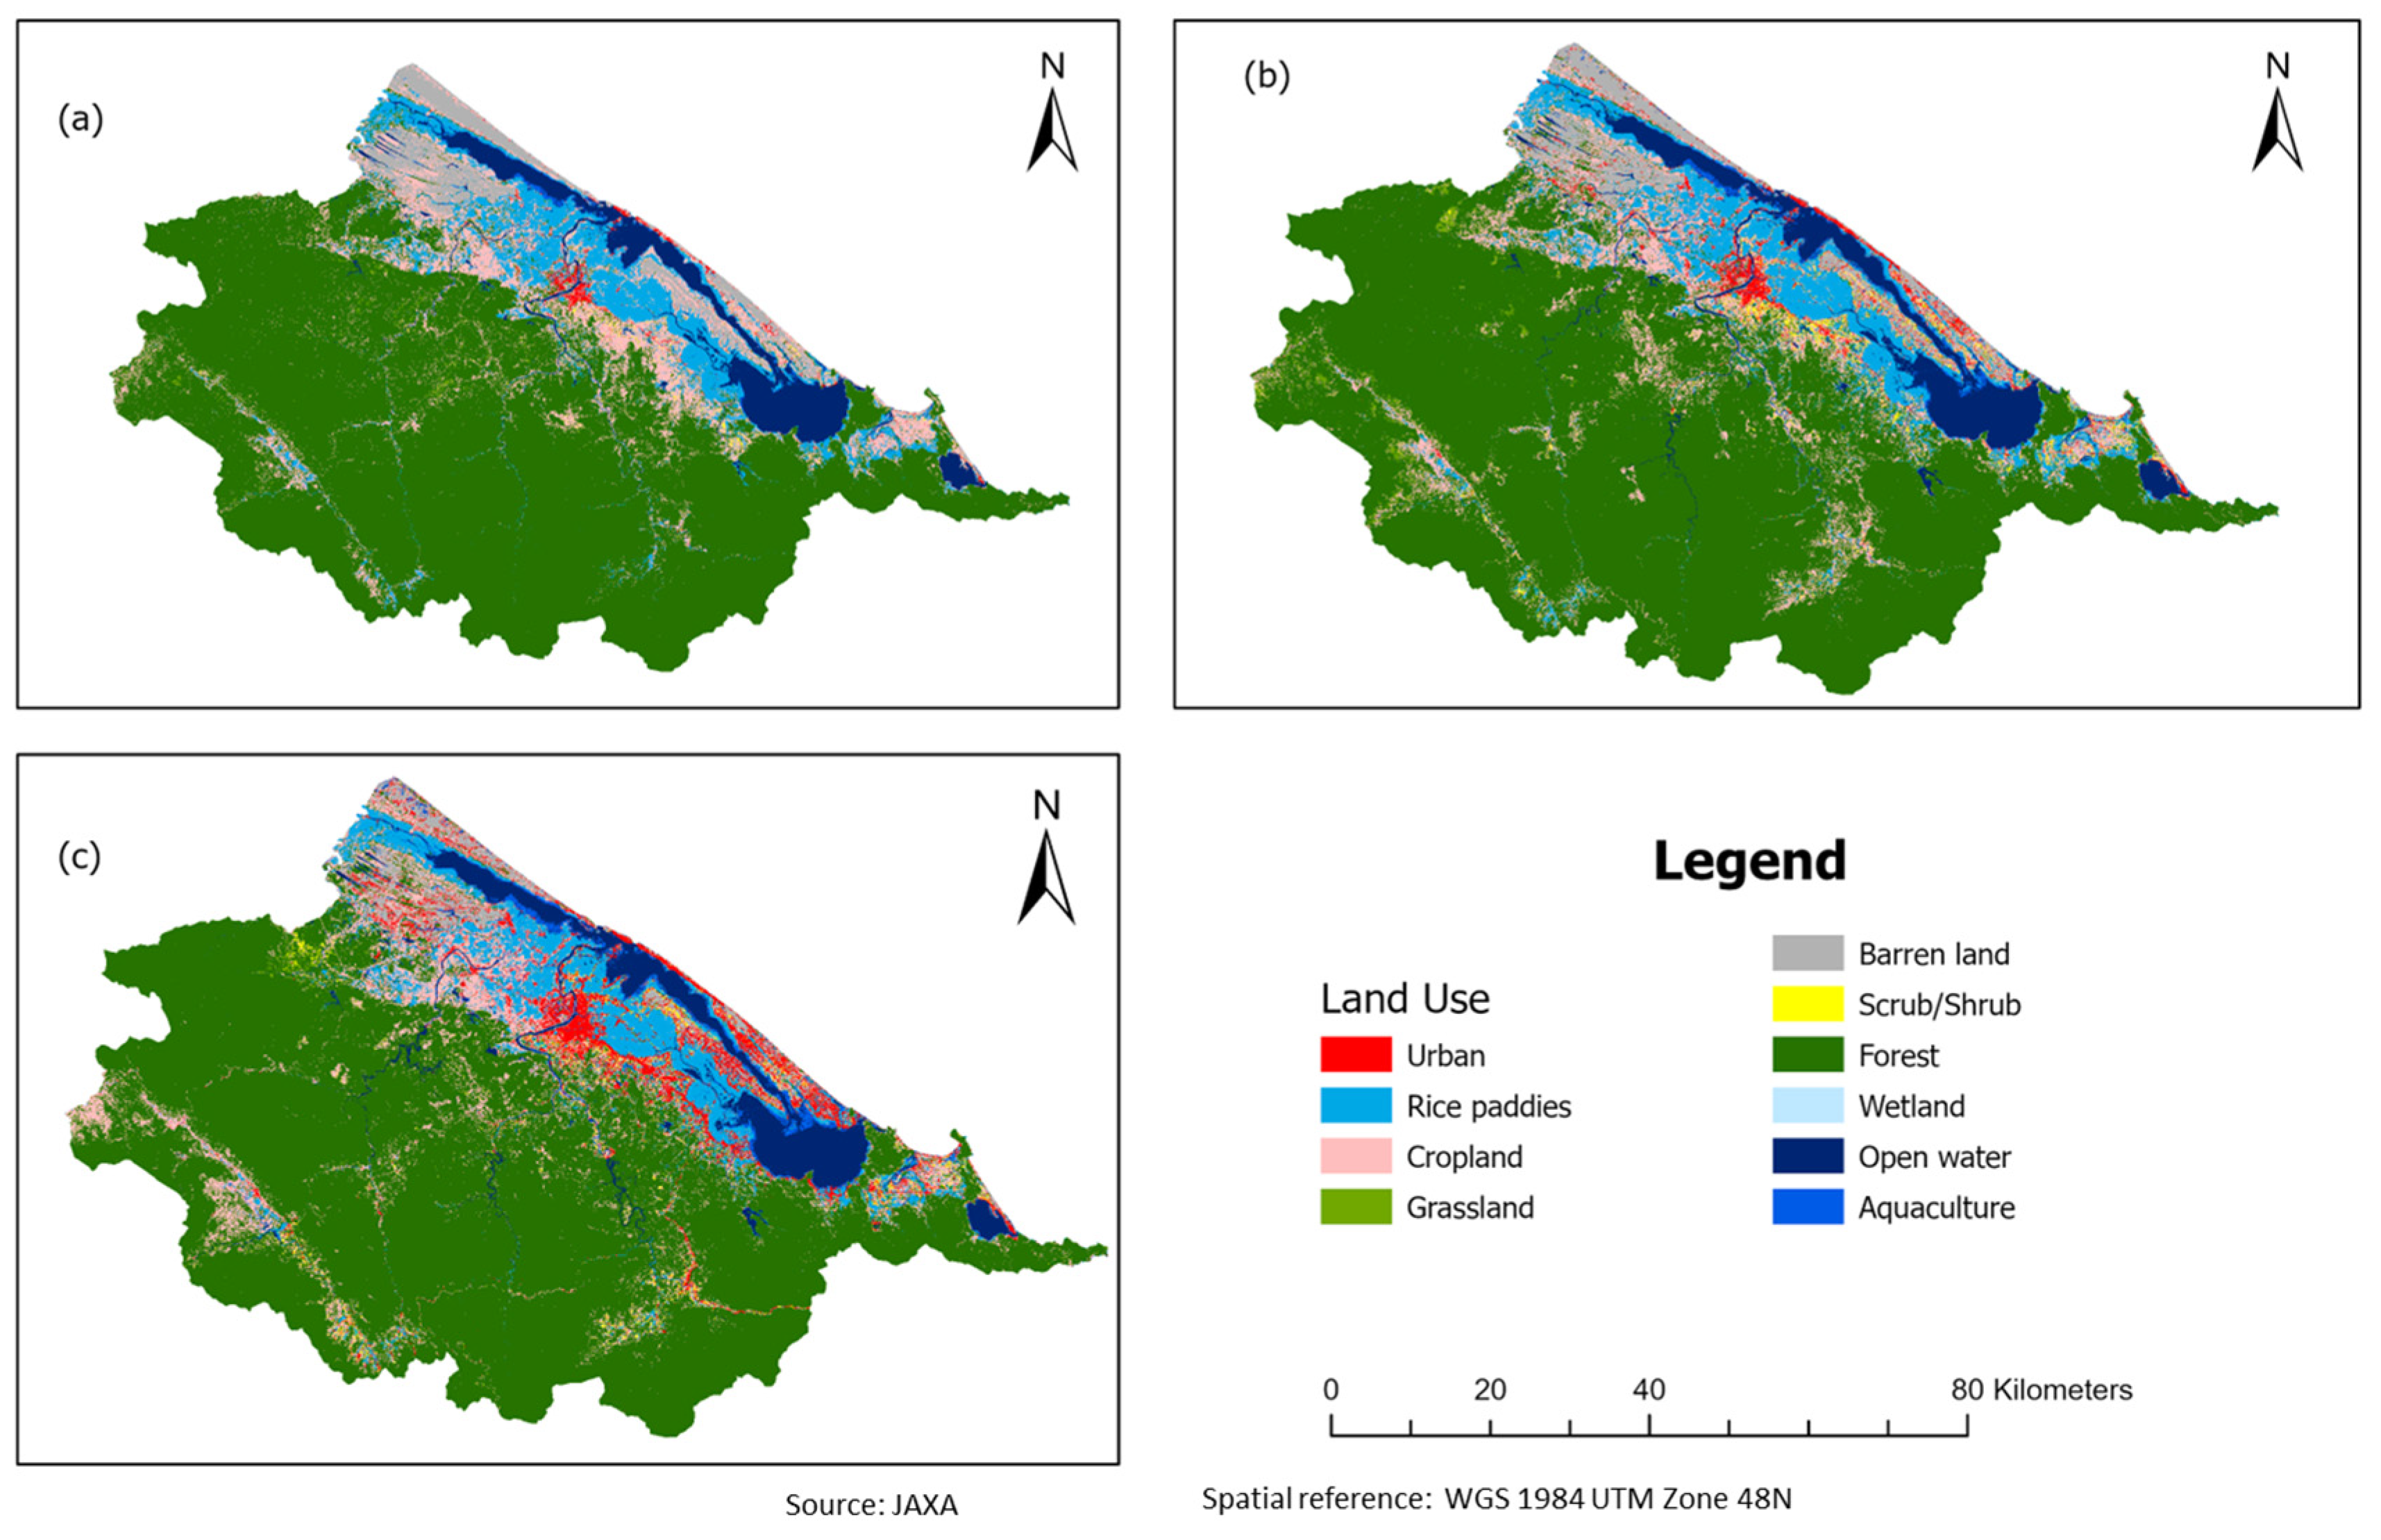
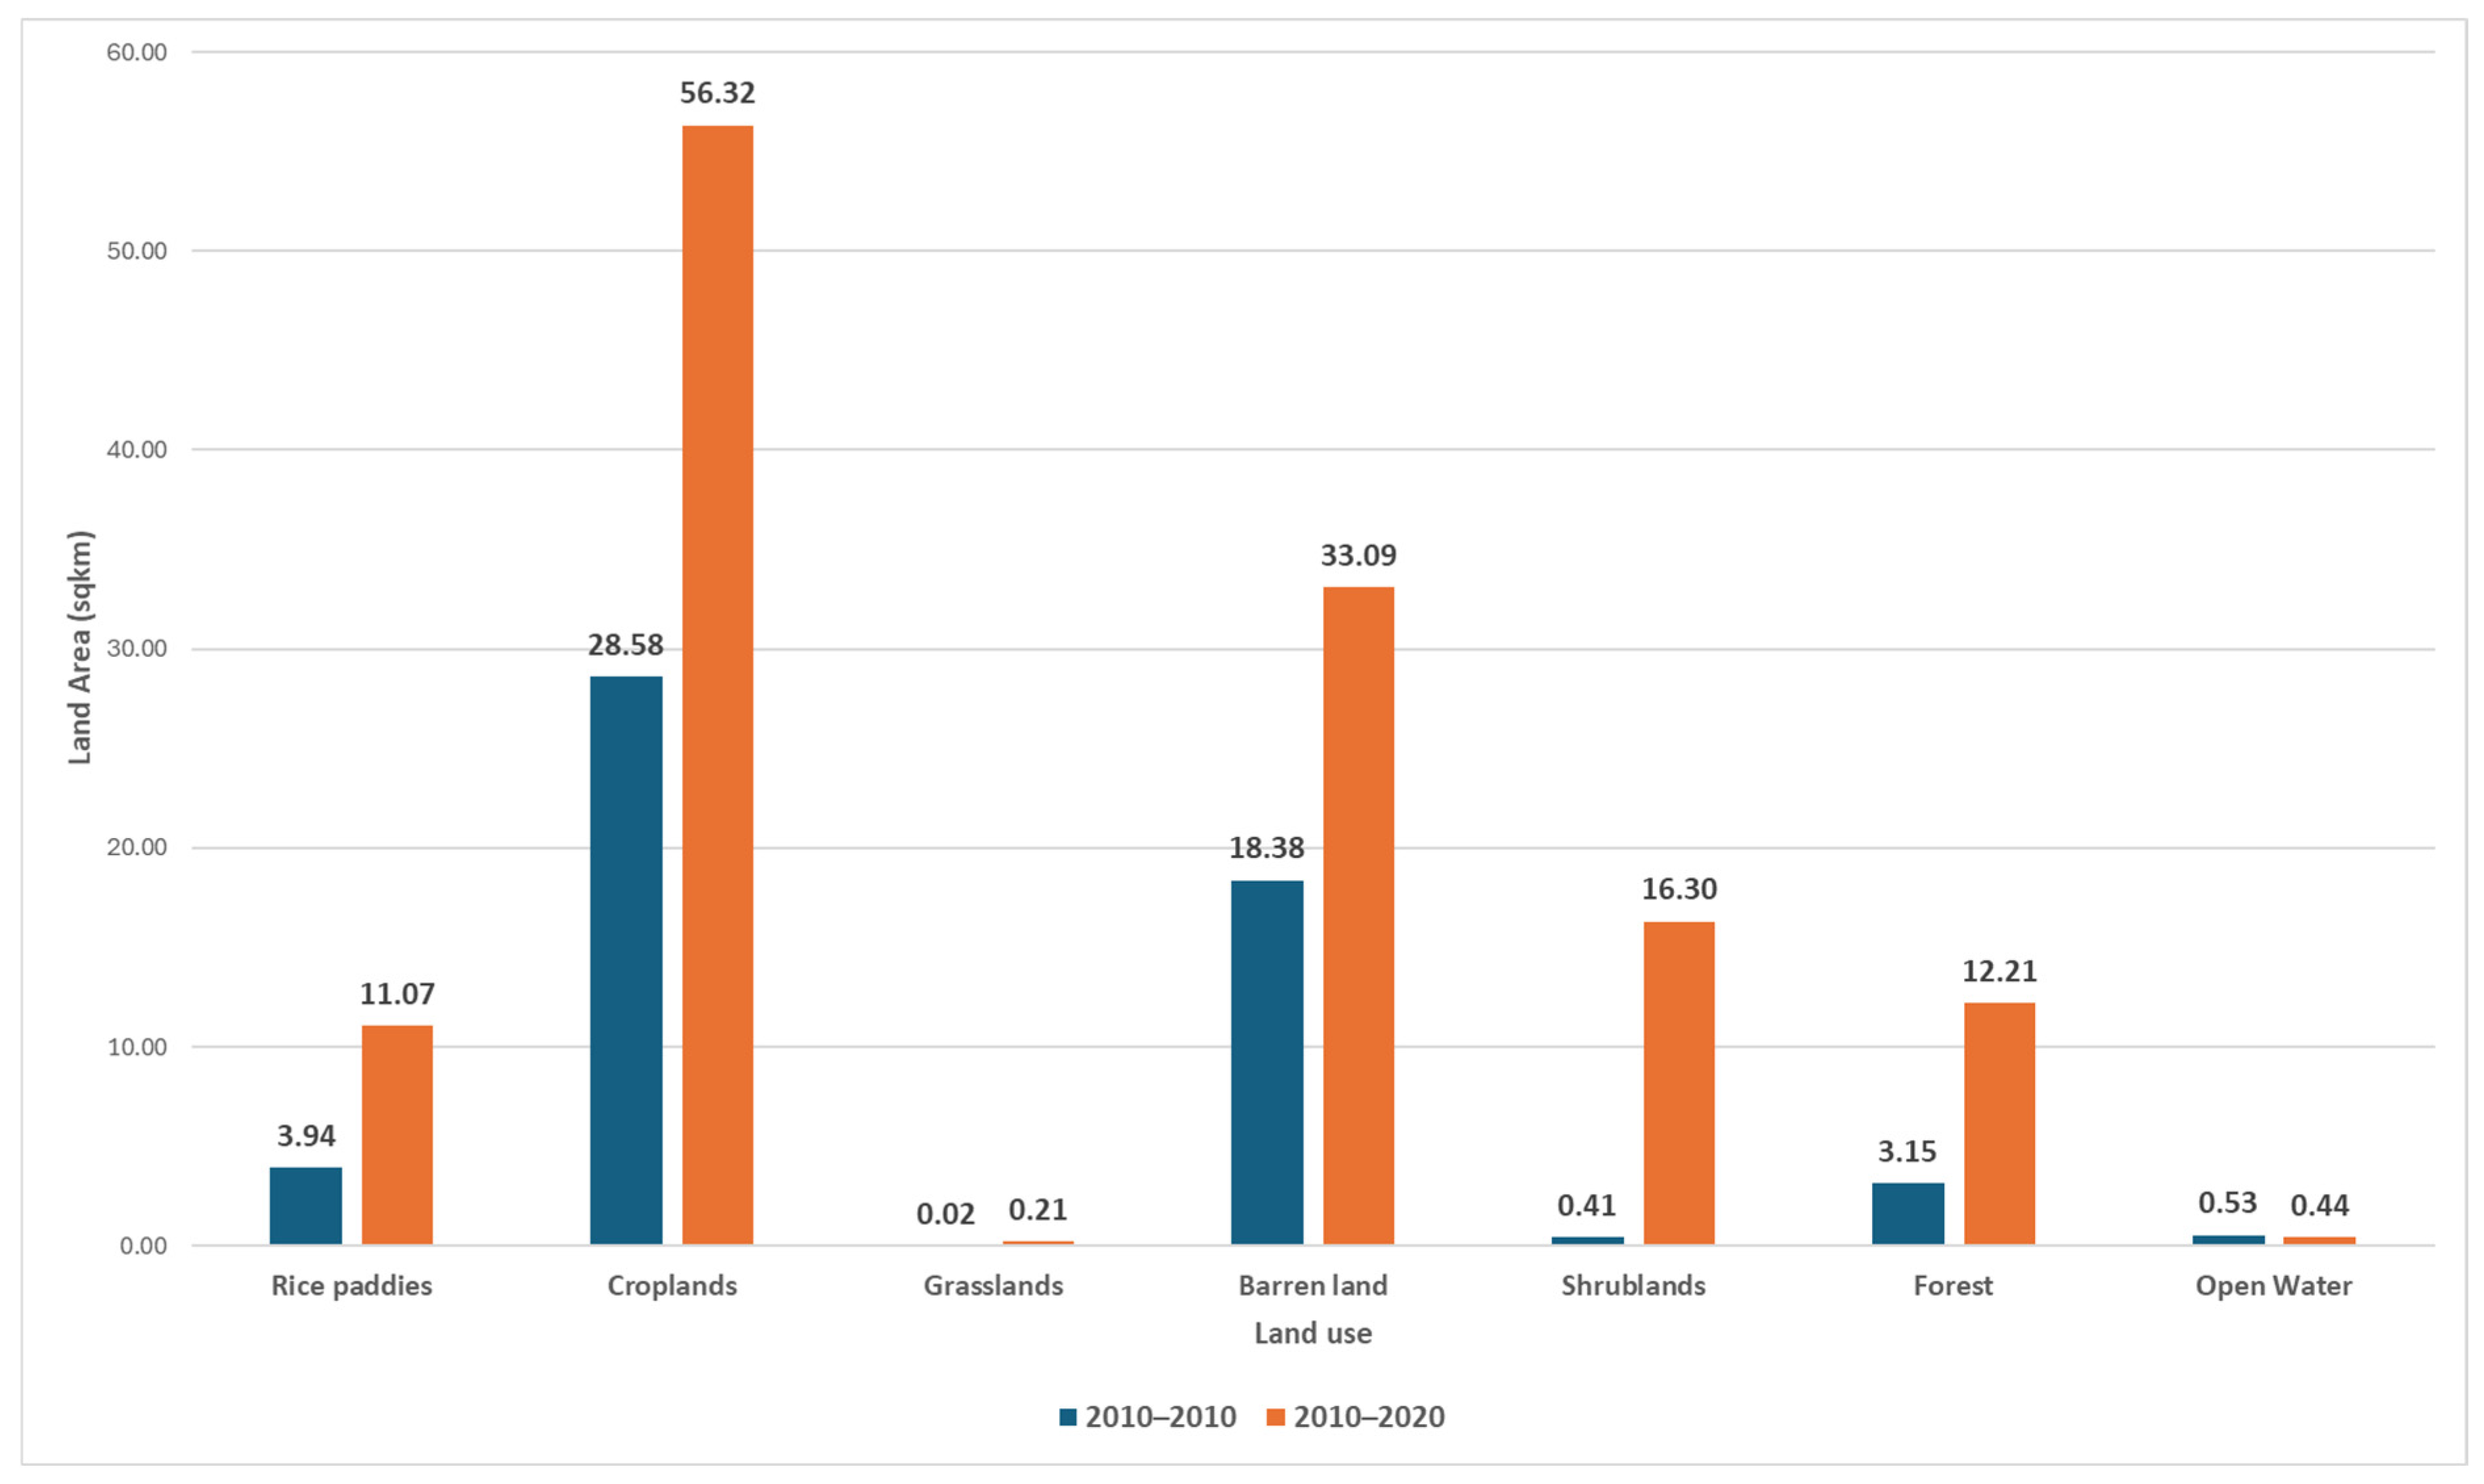
3.2. Urban Encroachment upon Other Land Use Types (2000–2020) in TTH
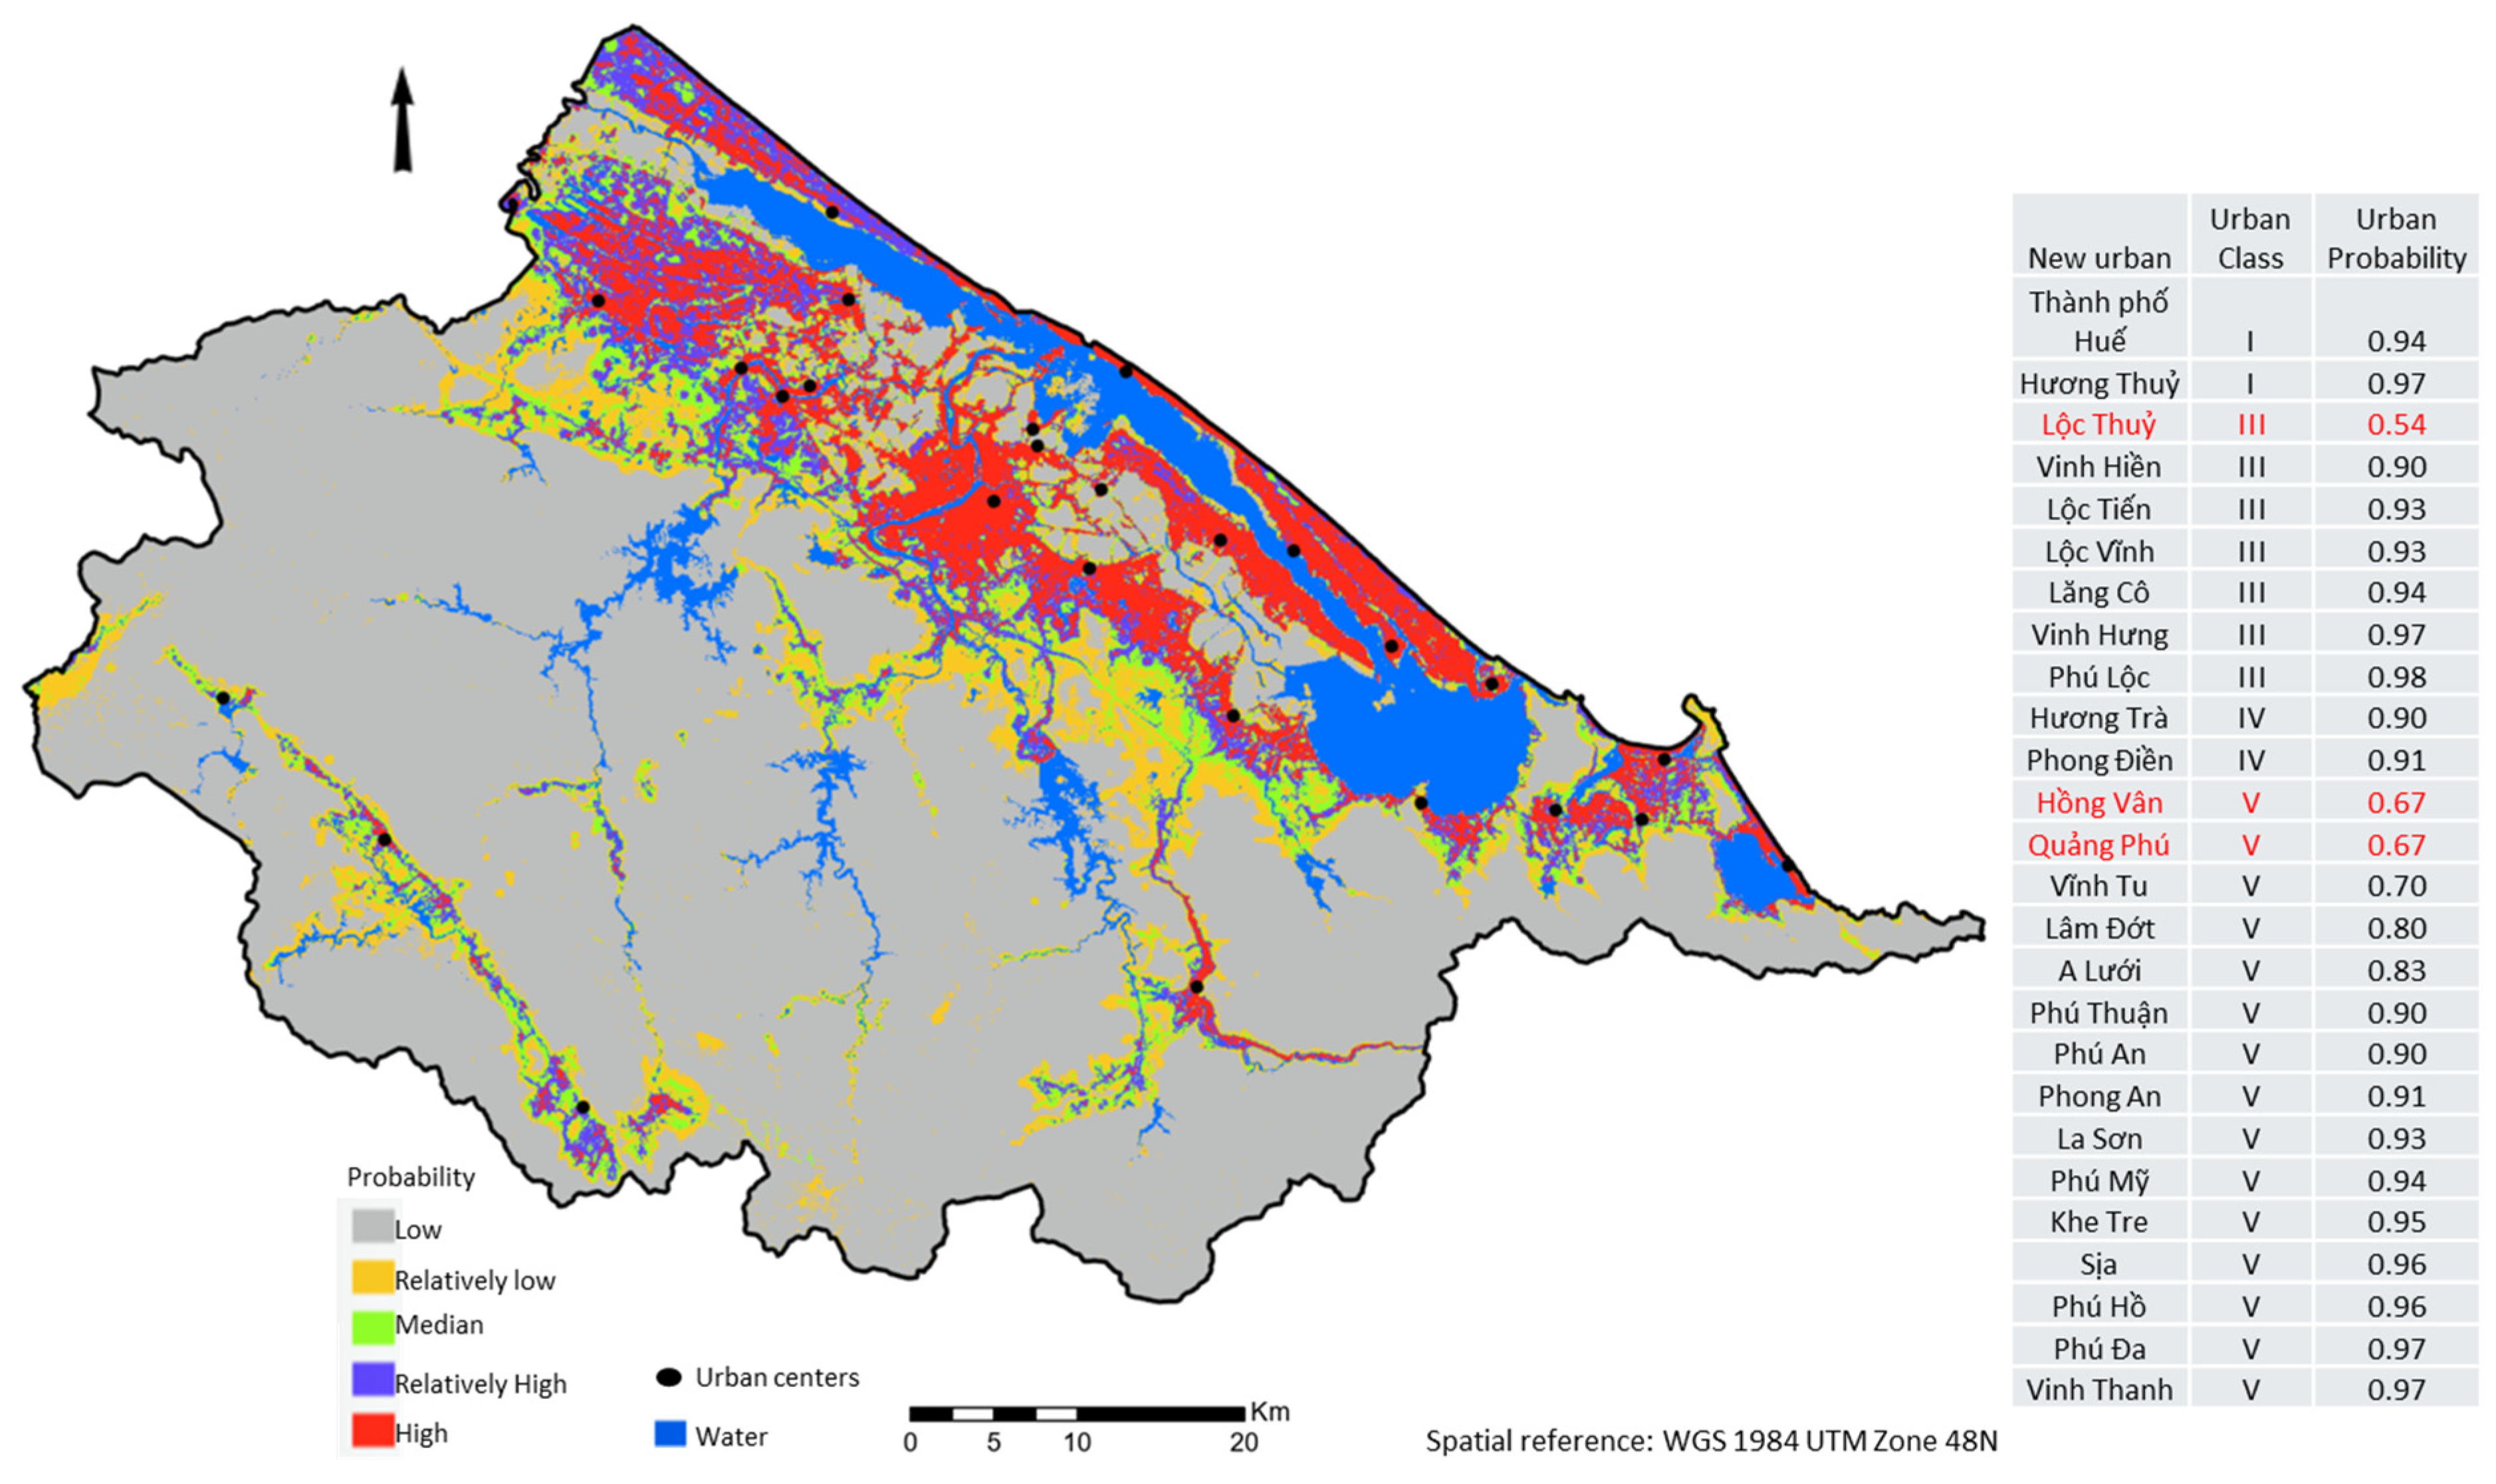
3.3. Urban Probability in TTH Province
“Urban expansion in mountainous areas does occur but at a much slower rate because the main purposes of these regions are to preserve biodiversity and develop ecosystem services, contributing to climate change mitigation and adaptation”.(Participant D, Male, 30 years, Forest manager)
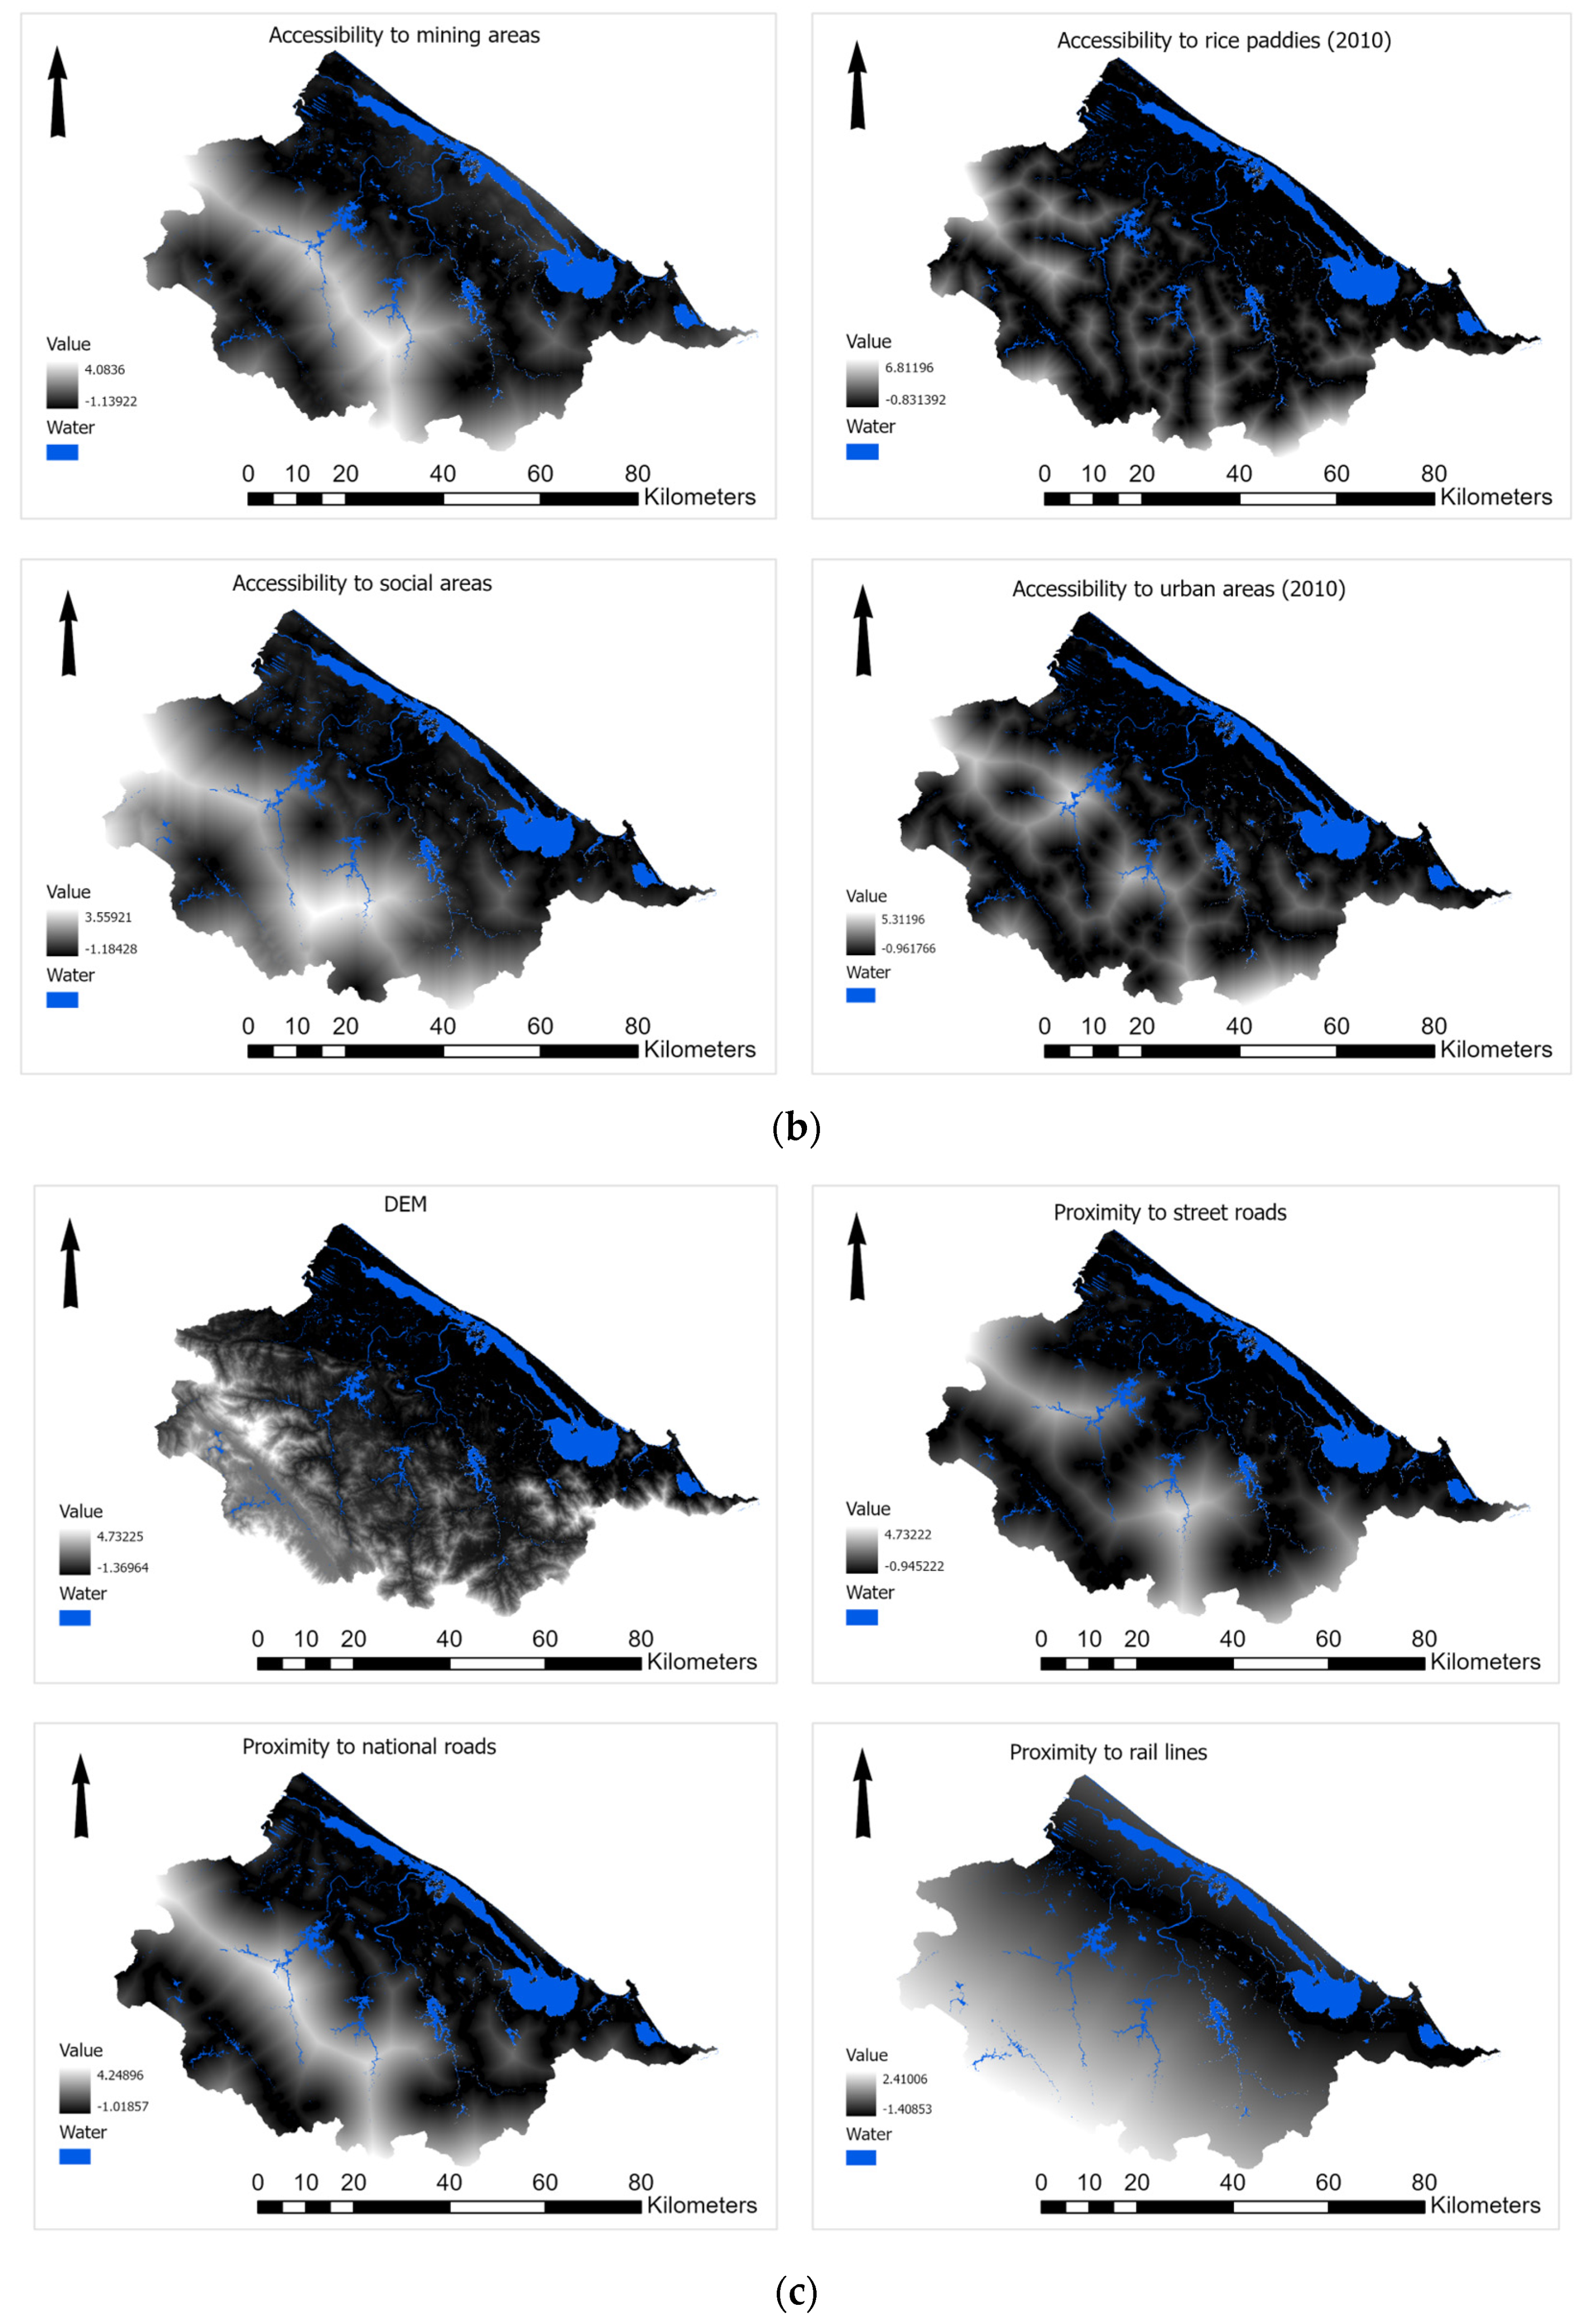
3.4. Drivers of Urban Growth in TTH
“The probability of urban expansion near agricultural areas, particularly rice fields, tends to be higher compared to expansion near forests because of the stringent protection of forest land. And that during land acquisition for urban expansion or resettlement area development, agricultural land, especially fields, is often reclaimed for such purposes”.(Participant A, Male, 55 years, Town Planner)
“Old urban areas typically possess established infrastructure, so the expansion of new urban areas can leverage existing infrastructure to its advantage”.(Participant A, Male, 55 years, Town Planner)
“Areas that have been previously built-up benefit from established infrastructure, which reduces the costs and challenges associated with new development, making them prime targets for continued urban growth”.(Participant B, Female, 38 years, Town Planner)
“In the study area, urban expansion always prioritizes nearby inner city and coastal directions. Meanwhile, urban expansion in mountainous areas does occur but at a much slower rate, because the main purposes of these regions are to preserve biodiversity and develop ecosystem services, contributing to climate change mitigation and adaptation”.(Participant C, Male, 33 years, Scientist)
“While urban expansion is indeed concentrated near inner-city and coastal areas, the topography of the mountainous regions poses significant challenges for large-scale development. These areas are not only less accessible due to steep slopes and rugged terrain, but they are also environmentally sensitive zones. As a result, urban growth in these regions remains limited, as preserving biodiversity and supporting ecosystem services take precedence over new developments. Additionally, the infrastructure costs for building in mountainous regions are far higher, further discouraging urban expansion in these areas”.(Participant D, Male, 30 years, Forest manager)
“Tourist and cultural hubs, like Minh Mang Tomb, play a pivotal role in driving urban expansion in the province. These areas not only attract visitors but also stimulate economic activity, which leads to increased development around them. The frequent use by both residents and tourists makes these locations prime targets for infrastructure and commercial growth”.(Participant C, Male, 33 years, Scientist)
4. Discussion
4.1. Historical Pattern of Urban Growth
4.2. Urban Encroachment upon Other Land Use Types (2000–2020)
4.3. Drivers of Urban Growth
4.4. Global Perspective and Insights for Urban Sustainability
4.5. Limitation and Implications for Further Studies
5. Conclusions
Author Contributions
Funding
Data Availability Statement
Conflicts of Interest
References
- UNDESA. World Urbanization Prospects: The 2018 Revision; United Nations Department of Economic and Social Affairs: New York, NY, USA, 2019; Volume 12, p. 126. [Google Scholar]
- Ma, H.; Sun, Z. Comprehensive urbanization level and its dynamic factors of five Central Asian countries. Dili XuebaoActa Geogr. Sin. 2021, 76, 367–382. [Google Scholar] [CrossRef]
- Kaur, R.; Kaur, T. How Urbanization and Economic Growth affects the Health in East Asian Countries? Evidence from the VECM approach. Indian J. Public Health Res. Dev. 2020, 11, 769–774. [Google Scholar] [CrossRef]
- Farrell, K. The rapid urban growth Triad: A new conceptual framework for examining the urban transition in developing countries. Sustain. Switz. 2017, 9, 1407. [Google Scholar] [CrossRef]
- Bai, X.; McPhearson, T.; Cleugh, H.; Nagendra, H.; Tong, X.; Zhu, T.; Zhu, Y.-G. Linking Urbanization and the Environment: Conceptual and Empirical Advances. Annu. Rev. Environ. Resour. 2017, 42, 215–240. [Google Scholar] [CrossRef]
- Smit, W. Urbanization in the Global South. In Oxford Research Encyclopedia of Global Public Health; Oxford University Press: Oxford, UK, 2021; pp. 1–22. [Google Scholar] [CrossRef]
- UN-Habitat. Envisaging the Future of Cities. 2022. Available online: https://unhabitat.org/sites/default/files/2022/06/wcr_2022.pdf (accessed on 17 September 2024).
- Weerakoon, P. GIS Integrated Spatio-Temporal Urban Growth Modelling: Colombo Urban Fringe, Sri Lanka. J. Geogr. Inf. Syst. 2017, 9, 372–389. [Google Scholar] [CrossRef]
- Yuan, Z.; Zhou, L.; Sun, D.; Hu, F. Impacts of Urban Expansion on the Loss and Fragmentation of Cropland in the Major Grain Production Areas of China. Land 2022, 11, 130. [Google Scholar] [CrossRef]
- Han, L.; Zhang, L.; Zhou, W.; Li, W.; Qian, Y. China’s urban-rural expansion and natural habitat loss since the 1980s: Retrospective analysis and future suggestions. Front. Environ. Sci. 2022, 10, 1065174. [Google Scholar] [CrossRef]
- Ye, H.; Yang, Z.; Xu, X. Ecological corridors analysis based on MSPA and MCR model-a case study of the tomur world natural heritage region. Sustain. Switz. 2020, 12, 959. [Google Scholar] [CrossRef]
- Haase, D.; Nuissl, H. Does urban sprawl drive changes in the water balance and policy? The case of Leipzig (Germany) 1870–2003. Landsc. Urban Plan. 2007, 80, 1–13. [Google Scholar] [CrossRef]
- Jimoh, B.A.; Mustapha, D.; Bejide, O.I.; Ojeifo, D.O. Effects of Urban Encroachment on Rural Agricultural Land: A Case Study of Ibie-Nafe Community of Edo State, Nigeria. Asian Rev. Environ. Earth Sci. 2020, 7, 35–40. [Google Scholar] [CrossRef]
- Al Mazroa, A.; Maashi, M.; Kouki, F.; Othman, K.M.; Salih, N.; Elfaki, M.A.; S, S.B. An analysis of urban sprawl growth and prediction using remote sensing and machine learning techniques. J. South Am. Earth Sci. 2024, 142, 104988. [Google Scholar] [CrossRef]
- Wang, H.; Guo, J.; Zhang, B.; Zeng, H. Simulating urban land growth by incorporating historical information into a cellular automata model. Landsc. Urban. Plan. 2021, 214, 104168. [Google Scholar] [CrossRef]
- Bratley, K.; Ghoneim, E. Modeling urban encroachment on the agricultural land of the Eastern Nile Delta using remote sensing and a GIS-Based Markov Chain Model. Land 2018, 7, 114. [Google Scholar] [CrossRef]
- Li, X.; Wang, Y.; Li, J.; Lei, B. Physical and socioeconomic driving forces of land-use and land-cover changes: A Case Study of Wuhan City, China. Discrete Dyn. Nat. Soc. 2016, 2016, 8061069. [Google Scholar] [CrossRef]
- Tran, T.N. Measuring urban growth dynamics: A study in Hue city, Vietnam. Open Geosci. 2024, 16, 20220640. [Google Scholar] [CrossRef]
- Goldblatt, R.; Deininger, K.; Hanson, G. Utilizing publicly available satellite data for urban research: Mapping built-up land cover and land use in Ho Chi Minh City, Vietnam. Dev. Eng. 2018, 3, 83–99. [Google Scholar] [CrossRef]
- Seto, K.C.; Güneralp, B.; Hutyra, L.R. Global forecasts of urban expansion to 2030 and direct impacts on biodiversity and carbon pools. Proc. Natl. Acad. Sci. USA 2012, 109, 16083–16088. [Google Scholar] [CrossRef]
- Lin, X.; Wang, Y.; Wang, S.; Wang, D. Spatial differences and driving forces of land urbanization in China. J. Geogr. Sci. 2015, 25, 545–558. [Google Scholar] [CrossRef]
- Wolff, C.; Nikoletopoulos, T.; Hinkel, J.; Vafeidis, A.T. Future urban development exacerbates coastal exposure in the Mediterranean. Sci. Rep. 2020, 10, 14420. [Google Scholar] [CrossRef]
- Yoo, W.G. Effect of unilateral exercises on low back pain in an urban driver. J. Phys. Ther. Sci. 2016, 28, 3257–3258. [Google Scholar] [CrossRef]
- Zhang, S.; de Roo, G.; van Dijk, T. Urban Land Changes as the Interaction Between Self-Organization and Institutions. Plan. Pract. Res. 2015, 30, 160–178. [Google Scholar] [CrossRef]
- Surya, B.; Muhibuddin, A.; Suriani, S.; Rasyidi, E.S.; Baharuddin, B.; Fitriyah, A.T.; Abubakar, H. Economic evaluation, use of renewable energy, and sustainable urban development mamminasata metropolitan, Indonesia. Sustain. Switz. 2021, 13, 1165. [Google Scholar] [CrossRef]
- Yan, Y.; Ju, H.; Zhang, S.; Jiang, W. Spatiotemporal patterns and driving forces of urban expansion in coastal areas: A study on urban agglomeration in the pearl river delta, china. Sustain. Switz. 2019, 12, 191. [Google Scholar] [CrossRef]
- Aljoufie, M.; Zuidgeest, M.; Brussel, M.; van Maarseveen, M. Urban growth and transport: Understanding the spatial temporal relationship. WIT Trans. Built Environ. 2011, 116, 315–328. [Google Scholar] [CrossRef]
- Yue, W.; Liu, Y.; Fan, P. Measuring urban sprawl and its drivers in large Chinese cities: The case of Hangzhou. Land. Use Policy 2013, 31, 358–370. [Google Scholar] [CrossRef]
- Liu, W.; Meng, Q.; Allam, M.; Zhang, L.; Hu, D.; Menenti, M. Driving factors of land surface temperature in urban agglomerations: A case study in the pearl river delta, china. Remote Sens. 2021, 13, 2858. [Google Scholar] [CrossRef]
- Tripathi, S. Do large agglomerations lead to economic growth? evidence from urban India Do Large Agglomerations lead to Economic Growth? Evidence from Urban India. Rev. Urban Reg. Dev. Stud. J. Appl. Reg. Sci. Conf. 2012, 25, 176–200. [Google Scholar] [CrossRef]
- Zhou, K.; Yin, Y.; Chen, Y. Drivers of water pollutant discharge in urban agglomerations and their scale effects: Empirical analysis of 305 counties in the Yangtze River Delta. J. Geogr. Sci. 2023, 33, 195–214. [Google Scholar] [CrossRef]
- Luo, T.; Tan, R.; Kong, X.; Zhou, J. Analysis of the driving forces of urban expansion based on a modified logistic regression model: A case study of Wuhan City, Central China. Sustain. Switz. 2019, 11, 2207. [Google Scholar] [CrossRef]
- Sheladiya, K.P.; Patel, C.R. The Impacts of Urban Growth Drivers on the Spatial and Temporal Pattern of City Expansion. J. Indian. Soc. Remote Sens. 2023, 51, 1631–1655. [Google Scholar] [CrossRef]
- Guo, J.; Zhang, M. Exploring the patterns and drivers of urban expansion in the Texas triangle megaregion. Land 2021, 10, 1244. [Google Scholar] [CrossRef]
- Guastella, G.; Oueslati, W.; Pareglio, S. Patterns of Urban Spatial Expansion in European Cities. Sustainability 2019, 11, 2247. [Google Scholar] [CrossRef]
- Salem, M.; Tsurusaki, N.; Divigalpitiya, P. Analyzing the driving factors causing urban expansion in the peri-urban areas using logistic regression: A case study of the greater Cairo region. Infrastructures 2019, 4, 4. [Google Scholar] [CrossRef]
- Gilbert, K.M.; Shi, Y. Quantitatively Analyzing the Driving Factors of Urban Spatial Evolution in Lagos. Open Access Libr. J. 2024, 11, 11303. [Google Scholar] [CrossRef]
- Li, G.; Sun, S.; Fang, C. The varying driving forces of urban expansion in China: Insights from a spatial-temporal analysis. Landsc. Urban. Plan. 2018, 174, 63–77. [Google Scholar] [CrossRef]
- Siddiqui, A.; Siddiqui, A.; Maithani, S.; Jha, A.K.; Kumar, P.; Srivastav, S.K. Urban growth dynamics of an Indian metropolitan using CA Markov and Logistic Regression. Egypt. J. Remote Sens. Space Sci. 2018, 21, 229–236. [Google Scholar] [CrossRef]
- Carlino, G.A.; Saiz, A. Beautiful city: Leisure amenities and urban growth. J. Reg. Sci. 2019, 59, 369–408. [Google Scholar] [CrossRef]
- Dolui, S.; Sarkar, S. Modelling landuse dynamics of ecologically sensitive peri-urban space by incorporating an ANN cellular automata-Markov model for Siliguri urban agglomeration, India. Model. Earth Syst. Environ. 2024, 10, 167–199. [Google Scholar] [CrossRef]
- Zhang, L.; Pfoser, D. Using openstreetmap point-of-interest data to model urban change—A feasibility study. PLoS ONE 2019, 14, e0212606. [Google Scholar] [CrossRef]
- Boarnet, M.G.; Chalermpong, S. New highways, house prices, and Urban development: A case study of toll roads in orange county, Ca. Hous. Policy Debate 2001, 12, 575–605. [Google Scholar] [CrossRef]
- Ferreira, J.; Ferreira, C.; Bos, E. Spaces of consumption, connection, and community: Exploring the role of the coffee shop in urban lives. Geoforum 2021, 119, 21–29. [Google Scholar] [CrossRef]
- Xu, Z.; Chang, J.; Cheng, F.; Liu, X.; Yao, T.; Hu, K.; Sun, J. Examining the Impact of the Built Environment on Multidimensional Urban Vitality: Using Milk Tea Shops and Coffee Shops as New Indicators of Urban Vitality. Buildings 2024, 14, 3517. [Google Scholar] [CrossRef]
- Duy, T.D.; Xuan, Y.N.T.; Thuy, T.N.T.; Diem, T.L.T. A study on the coffeeshop space in Vinh Long City, Vietnam. In 2020 Applying New Technology in Green Buildings (ATiGB); IEEE: Piscataway, NJ, USA, 2020; pp. 18–24. [Google Scholar] [CrossRef]
- Long, H.V.P.; Hien, B.T.T. The Impact Of Cultural Identity And Attitude-to-brands On Customer Loyalty In Vietnam Context. Ho Chi Minh City Open Univ. J. Sci-Econ. Bus. Adm. 2025, 15, 105–127. Available online: https://ideas.repec.org/a/bjw/econen/v15y2025i2p105-127.html (accessed on 30 November 2024).
- Maspul, K.A. Exploring Ho Chi Minh City’s Coffee Value Chain through the Unique Intersection of Specialty Coffee and Tourism. Khazanah Sos. 2024, 6, 60–70. [Google Scholar] [CrossRef]
- Van Ingen, E.; van Eijck, K. Leisure and social capital: An analysis of types of company and activities. Leis. Sci. 2009, 31, 192–206. [Google Scholar] [CrossRef]
- Waxman, L. The Coffee Shop: Social and Physical factors Influencing Place Attachment. J. Inter. Des. 2006, 31, 35–53. [Google Scholar] [CrossRef]
- Vansintjan, A.; Van, N.H.; Chi, L.Q.; Tu, N.T. Adaptation strategies used by low-income residents affected by land use changes in Hanoi, Vietnam. J. Sci. Technol. Civ. Eng. STCE-NUCE 2019, 13, 78–88. [Google Scholar] [CrossRef]
- Thi, N.P.; Kappas, M.; Faust, H. Improving the socioeconomic status of rural women associated with agricultural land acquisition: A case study in Huong Thuy town, Thua Thien Hue province, Vietnam. Land 2019, 8, 151. [Google Scholar] [CrossRef]
- Bach, K.H.V.; Kim, S.K. Towards evaluation the cornerstone of smart city development: Case study in Dalat city, Vietnam. Smart Cities 2020, 3, 1–16. [Google Scholar] [CrossRef]
- Lord, F. Transformation to Sustainable and Resilient Urban Futures in Southeast Asia. ISPRS Ann. Photogramm. Remote Sens. Spat. Inf. Sci. 2020, 6, 43–50. [Google Scholar] [CrossRef]
- Wang, C.N.; Nguyen, H.K. Enhancing urban development quality based on the results of appraising efficient performance of investors-A case study in Vietnam. Sustain. Switz. 2017, 9, 1397. [Google Scholar] [CrossRef]
- Thua Thien Hue province (TTH). Plan for Natural Disaster Prevention and Search and Rescue for the Period 2021–2025; 2020. Available online: https://thuvienphapluat.vn/van-ban/Tai-nguyen-Moi-truong/Quyet-dinh-2365-QD-UBND-2020-Phong-chong-thien-tai-Tim-kiem-cuu-nan-Hue-giai-doan-2020-2025-456385.aspx (accessed on 17 September 2024).
- Tuan, N.T. Urbanization and land use change: A study in Vietnam. Environ. Socio-Econ. Stud. 2022, 10, 19–29. [Google Scholar] [CrossRef]
- World Bank. Vietnam’s Urbanization at a Crossroads: Embarking on an Efficient, Inclusive, and Resilient Pathway; World Bank: Washington, DC, USA, 2020. [Google Scholar] [CrossRef]
- Sen, L.T.H.; Bond, J.; Dung, N.T.; Hung, H.G.; Mai, N.T.H.; Phuong, H.T.A. Farmers’ barriers to the access and use of climate information in the mountainous regions of Thừa Thiên Huế province, Vietnam. Clim. Serv. 2021, 24, 100267. [Google Scholar] [CrossRef]
- Thua Thien Hue Province (TTH). Thừa Thiên Huế Province Planning for the Period 2021–2030, Vision to 2050. THƯ VIỆN PHÁP LUẬT 2023. Available online: https://thuvienphapluat.vn/van-ban/Xay-dung-Do-thi/Quyet-dinh-1745-QD-TTg-2023-phe-duyet-Quy-hoach-tinh-Thua-Thien-Hue-thoi-ky-2021-2030-594454.aspx (accessed on 18 September 2024).
- Wang, L.; Jia, Y.; Li, X.; Gong, P. Analysing the Driving Forces and Environmental Effects of Urban. Expansion by Mapping the Speed and Acceleration of Built-Up. Areas in China between 1978 and 2017. Remote Sens. 2020, 12, 3929. [Google Scholar] [CrossRef]
- Hue Statistics Office. Statistical Yearbook Thanh Pho Hue 2021; GSO: Hue, Vietnam, 2022. [Google Scholar]
- Chaudhry, P.; Ruysschaert, G. Climate Change and Human Development in Viet Nam: A Case Study; Human Development Report 2007/2008, Fighting Climate Change: Human Solidarity in a Divided World; Human Development Report Office, Occasional Paper; United Nations Development Programme (UNDP): New York, NY, USA, 2007. [Google Scholar]
- Seto, K.C.; Fragkias, M.; Güneralp, B.; Reilly, M.K. A Meta-Analysis of Global Urban Land Expansion. PLoS ONE 2011, 6, e23777. [Google Scholar] [CrossRef]
- JAXA. Dataset | ALOS@EORC. ALOSEORC Homepage. 2003. Available online: https://www.eorc.jaxa.jp/ALOS/dataset/lulc_e.htm (accessed on 18 November 2023).
- Phan, D.C.; Trung, T.H.; Truong, V.T.; Sasagawa, T.; Vu, T.P.T.; Bui, D.T.; Hayashi, M.; Tadono, T.; Nasahara, K.N. First comprehensive quantification of annual land use/cover from 1990 to 2020 across mainland Vietnam. Sci. Rep. 2021, 11, 9979. [Google Scholar] [CrossRef] [PubMed]
- González, C.; Bachmann, M.; Bueso-Bello, J.-L.; Rizzoli, P.; Zink, M. A Fully Automatic Algorithm for Editing the TanDEM-X Global DEM. Remote. Sens. 2020, 12, 3961. [Google Scholar] [CrossRef]
- Andualem, T.G.; Peters, S.; Hewa, G.A.; Boland, J.; Myers, B.R. Spatiotemporal trends of urban-induced land use and land cover change and implications on catchment surface imperviousness. Appl. Water Sci. 2023, 13, 223. [Google Scholar] [CrossRef]
- Güneralp, B.; Seto, K.C. Futures of global urban expansion: Uncertainties and implications for biodiversity conservation. Environ. Res. Lett. 2013, 8, 014025. [Google Scholar] [CrossRef]
- Bren D’Amour, C.; Reitsma, F.; Baiocchi, G.; Barthel, S.; Güneralp, B.; Erb, K.-H.; Haberl, H.; Creutzig, F.; Seto, K.C. Future urban land expansion and implications for global croplands. Proc. Natl. Acad. Sci. USA 2017, 114, 8939–8944. [Google Scholar] [CrossRef]
- Trung Thanh, H.; Tschakert, P.; Hipsey, M.R. Moving up or going under? Differential livelihood trajectories in coastal communities in Vietnam. World Dev. 2021, 138, 105219. [Google Scholar] [CrossRef]
- Verma, A.; Das, P. Urbanization in the Global South: Perspectives and Challenges. Vikalpa J. Decis. Mak. 2024, 49, 110–112. [Google Scholar] [CrossRef]
- Obaitor, O.; Stellmes, M.; Lakes, T. Exploring Spatio-Temporal Pattern of Gentrification Processes in Intracity Slums in the Lagos Megacity. Geographies 2024, 4, 231–252. [Google Scholar] [CrossRef]
- Tobler, W.R. A Computer Movie Simulating Urban Growth in the Detroit Region. Econ. Geogr. 1970, 46, 234. [Google Scholar] [CrossRef]
- Braimoh, A.K.; Onishi, T. Spatial determinants of urban land use change in Lagos, Nigeria. Land. Use Policy 2007, 24, 502–515. [Google Scholar] [CrossRef]
- Badmos, O.S.; Rienow, A.; Callo-Concha, D.; Greve, K.; Jürgens, C. Simulating slum growth in Lagos: An integration of rule based and empirical based model. Comput. Environ. Urban. Syst. 2019, 77, 101369. [Google Scholar] [CrossRef]
- Breiman, L. Random Forests. Mach. Learn. 2001, 45, 5–32. [Google Scholar] [CrossRef]
- Best, K.B.; Gilligan, J.M.; Baroud, H.; Carrico, A.R.; Donato, K.M.; Ackerly, B.A.; Mallick, B. Random forest analysis of two household surveys can identify important predictors of migration in Bangladesh. J. Comput. Soc. Sci. 2021, 4, 77–100. [Google Scholar] [CrossRef]
- Ali, J.; Khan, R.; Ahmad, N.; Maqsood, I. Random Forests and Decision Trees. Int. J. Comput. Sci. Issues 2012, 9, 272–278. [Google Scholar]
- Ghule, B.G.; Kim, M.; Jang, J.-H. Predicting photoresist sensitivity using machine learning. Bull. Korean Chem. Soc. 2023, 44, 900–910. [Google Scholar] [CrossRef]
- Verma, B.K.; Yadav, A.K. Advancing Software Vulnerability Scoring: A Statistical Approach with Machine Learning Techniques and GridSearchCV Parameter Tuning. SN Comput. Sci. 2024, 5, 595. [Google Scholar] [CrossRef]
- Phinzi, K.; Abriha, D.; Szabó, S. Classification Efficacy Using K-Fold Cross-Validation and Bootstrapping Resampling Techniques on the Example of Mapping Complex Gully Systems. Remote. Sens. 2021, 13, 2980. [Google Scholar] [CrossRef]
- Chen, J.; Kudjo, P.K.; Mensah, S.; Brown, S.A.; Akorfu, G. An automatic software vulnerability classification framework using term frequency-inverse gravity moment and feature selection. J. Syst. Softw. 2020, 167, 110616. [Google Scholar] [CrossRef]
- Pontius, R.G.; Schneider, L.C. Land-cover change model validation by an ROC method for the Ipswich watershed, Massachusetts, USA. Agric. Ecosyst. Environ. 2001, 85, 239–248. [Google Scholar] [CrossRef]
- Tayyebi, A.; Delavar, M.R.; Yazdanpanah, M.J.; Pijanowski, B.C.; Saeedi, S.; Tayyebi, A.H. A Spatial Logistic Regression Model for Simulating Land Use Patterns: A Case Study of the Shiraz Metropolitan Area of Iran. In Advances in Earth Observation of Global Change; Chuvieco, E., Li, J., Yang, X., Eds.; Springer: Dordrecht, The Netherlands, 2010; pp. 27–42. [Google Scholar] [CrossRef]
- iVIVu. Suối Tiên Hoang sơ ở Huế—iVIVU.com. 2020. Available online: https://www.ivivu.com/blog/2020/06/suoi-tien-hoang-so-o-hue/ (accessed on 25 November 2024).
- People’s Committee of Quang Phu Commune. Report on the Natural, Economic, and Social Conditions of Quang Phu Commune, Quang Dien District, Thua Thien Hue Province; People’s Committee of Quang Phu Commune: Quang Phu, Vietnam, 2020. [Google Scholar]
- Chigbu, U.E. Land, Women, Youths, and Land Tools or Methods: Emerging Lessons for Governance and Policy. Land 2020, 9, 507. [Google Scholar] [CrossRef]
- Pham Thi, N.; Kappas, M.; Faust, H. Impacts of Agricultural Land Acquisition for Urbanization on Agricultural Activities of Affected Households: A Case Study in Huong Thuy Town, Thua Thien Hue Province, Vietnam. Sustainability 2021, 13, 8559. [Google Scholar] [CrossRef]
- Nguyen, T.H. Vietnamese Regulations on the Compensation for Damage upon State Agricultural Land Acquisition. Int. J. Law. Polit. Stud. 2024, 6, 180–192. [Google Scholar] [CrossRef]
- Fan, P.; Ouyang, Z.; Nguyen, D.D.; Nguyen, T.T.H.; Park, H.; Chen, J. Urbanization, economic development, environmental and social changes in transitional economies: Vietnam after Doimoi. Landsc. Urban. Plan. 2019, 187, 145–155. [Google Scholar] [CrossRef]
- Thieu, D.T.M. An Accessibility of New Urban Area’s Residents to Social Infrastructure in Hue City. Case Study: An Cuu and My Thuong New Urban Area. In International Conference on Sustainable Urban Development; Ha, V.T., Nguyen, H.N., Linke, H.-J., Eds.; Springer Nature: Singapore, 2024; pp. 203–218. [Google Scholar] [CrossRef]
- Phuc, N.Q. Urban Expansion and Compulsory Land Acquisition in Hue, Vietnam Challenges and Ways Toward Fair Urbanization. 2016. Available online: https://www.landgovernance.org/wp-content/uploads/2017-LANDac-Policy-Brief-05-Phuc-Urban-Expansion-and-Compulsory-Land-Acquisition-in-Hue-Vietnam.pdf (accessed on 30 November 2024).
- Embassy of Denmark; World Bank; Embassy of Sweden. Recognizing and Reducing Corruption Risks in Land Management in Vietnam; National Political Publishing House: Su That, Vietnam, 2011. [Google Scholar]
- Ty, P.H.; Laura, B.; Phuong, T.T.; Tan, N.Q. Impoverishment Persistence in Hydropower Dam-Induced Resettled Communities: A Sociological Investigation on Livelihood and Food Security in Vietnam. Soc. Sci. 2023, 12, 222. [Google Scholar] [CrossRef]
- Ngu, N.H.; Tan, N.Q.; Non, D.Q.; Dinh, N.C.; Nhi, P.T.P. Unveiling urban households’ livelihood vulnerability to climate change: An intersectional analysis of Hue City, Vietnam. Environ. Sustain. Indic. 2023, 19, 100269. [Google Scholar] [CrossRef]
- Rösler, K.; Konopatzki, P.; Jache, J.; Hoang, T.B.M.; Nguyen, D.H.L.; Scheuer, S.; Sumfleth, L.; Stolpe, F.; Haase, D. Status Quo Report: Nature-Based Solutions in the City of Hue; GreenCityLabHuế Project; Funded by the German Federal Ministry of Education and Research (BMBF); Independent Institute for Environmental Issues (UfU), Humboldt-Universität zu Berlin: Berlin, Germany; Hue, Vietnam, June 2020. [Google Scholar]
- Faiyetole, A.A.; Adewumi, V.A. Urban expansion and transportation interaction: Evidence from Akure, southwestern Nigeria. Environ. Plan. B Urban. Anal. City Sci. 2024, 51, 57–74. [Google Scholar] [CrossRef]
- Knowles, R.D.; Ferbrache, F.; Nikitas, A. Transport’s historical, contemporary and future role in shaping urban development: Re-evaluating transit oriented development. Cities 2020, 99, 102607. [Google Scholar] [CrossRef]
- Müller, K.; Steinmeier, C.; Küchler, M. Urban growth along motorways in Switzerland. Landsc. Urban. Plan. 2010, 98, 3–12. [Google Scholar] [CrossRef]
- Soltani, A.; Zali, N.; Aghajani, H.; Hashemzadeh, F.; Rahimi, A.; Heydari, M. The nexus between transportation infrastructure and housing prices in metropolitan regions. J. Hous. Built Environ. 2024, 39, 787–812. [Google Scholar] [CrossRef]
- Lu, J.; Peng, Q.; Song, Y.; Lyu, L.; Chen, D.; Huang, P.; Peng, F.; Liu, Y. Characteristics and effects of global sloping land urbanization from 2000 to 2020. Sci. Total Environ. 2024, 937, 173348. [Google Scholar] [CrossRef]
- Thapa, R.B.; Murayama, Y. Drivers of urban growth in the Kathmandu valley, Nepal: Examining the efficacy of the analytic hierarchy process. Appl. Geogr. 2010, 30, 70–83. [Google Scholar] [CrossRef]
- Wang, X.; Liu, G.; Xiang, A.; Xiao, S.; Lin, D.; Lin, Y.; Lu, Y. Terrain gradient response of landscape ecological environment to land use and land cover change in the hilly watershed in South China. Ecol. Indic. 2023, 146, 109797. [Google Scholar] [CrossRef]
- Bui, H.T.; Pham, L.H.; Jones, T.E. Governance and Management of Protected Areas in Vietnam: Nature-Based Tourism in Mountain Areas. In Nature-Based Tourism in Asia’s Mountainous Protected Areas: A Trans-Regional Review of Peaks and Parks; Jones, T.E., Bui, H.T., Apollo, M., Eds.; Springer International Publishing: Cham, Switzerland, 2021; pp. 173–195. [Google Scholar] [CrossRef]
- Hoare, A. (Ed.) Chatham House Forest Policy Assessment: Vietnam; Chatham House—The Royal Institute of International Affairs: London, UK, 2020; Available online: https://forestgovernance.chathamhouse.org/media/data-download/Forest-Policy-Assessment-Vietnam.pdf (accessed on 1 October 2024).
- Stolton, S.; Thi Dao, N.; Dudley, N. Categorising protected areas in Vietnam. In Protected Area Cartegories; IUCN: Gland, Switzerland, 2004; Volume 14, pp. 23–27. [Google Scholar]
- Nguyen, N.T.T.; Tran, T.H.; Phan, L.T.T.; Le, X.T.T. How Responsible Tourism Behavioral Intentions Influence Tour Choices: Effects of Economic, Socio-Cultural, and Environmental Responsibility. Int. J. Hosp. Tour. Adm. 2024, 25, 1062–1090. [Google Scholar] [CrossRef]
- Trang, N.H.M.; Duc, N.H.C. The contribution of tourism to economic growth in Thua Thien Hue Province, Vietnam. Middle East. J. Bus. 2013, 8, 70–77. [Google Scholar] [CrossRef]
- Nguyen, T.T.N.; Phan, T.N. Sustainable cultural heritage tourism in hue city, Vietnam: Focusing on Nguyen dynasty ceremonies. Proc. Int. Conf. Hosp. Tour. Manag. 2024, 8, 72–88. Available online: https://tiikmpublishing.com/proceedings/index.php/icoht/article/view/1579 (accessed on 30 November 2024).
- Tan, N.Q.; Fumikazu, U.; Dinh, N.C. Development process of the community-based tourism: From two case studies in Central Vietnam. Vietnam. Sci. Technol. Symp. 2019, VJST2019, 124–128. [Google Scholar]
- Zhang, Z.; Guo, A.; Tian, C. Realizing the soft infrastructure mixing of Shanghai ’ s catering industry based on land expansion and population growth. Heliyon 2024, 10, e28744. [Google Scholar] [CrossRef] [PubMed]
- Zhou, Y.; He, X.; Zikirya, B. Boba Shop, Coffee Shop, and Urban Vitality and Development—A Spatial Association and Temporal Analysis of Major Cities in China from the Standpoint of Nighttime Light. Remote Sens. 2023, 15, 903. [Google Scholar] [CrossRef]
- Gao, Y.; Wang, D.; Liao, Y.; Zou, Y. Relationship between urban tourism traffic and tourism land use: A case study of xiamen island. J. Transp. Land. Use 2021, 14, 761–776. [Google Scholar] [CrossRef]
- Liu, X.; Huang, Y.; Xu, X.; Li, X.; Li, X.; Ciais, P.; Lin, P.; Gong, K.; Ziegler, A.D.; Chen, A.; et al. High-spatiotemporal-resolution mapping of global urban change from 1985 to 2015. Nat. Sustain. 2020, 3, 564–570. [Google Scholar] [CrossRef]
- Li, X.; Zhou, Y.; Zhu, Z.; Cao, W. A national dataset of 30 m annual urban extent dynamics (1985–2015) in the conterminous United States. Earth Syst. Sci. Data 2020, 12, 357–371. [Google Scholar] [CrossRef]
- Murayama, Y.; Estoque, R.C.; Subasinghe, S.; Hou, H.; Gong, H. Land-use/land-cover changes in major Asian and African cities. Annu. Rep. Multi-Use Soc. Econ. Data Bank 2015, 92, 1–48. Available online: https://www.researchgate.net/publication/274712830_Land-useland-cover_changes_in_major_Asian_and_African_cities (accessed on 9 January 2025).
- Odunsi, O.M.; Onanuga, M.Y.; Obaitor, O.S. The new millennium so far: Analysing land cover change in Ogun State Nigeria. J. Contemp. Afr. Stud. 2024, 42, 612–627. [Google Scholar] [CrossRef]
- Ren, Q.; He, C.; Huang, Q. Impacts of urban expansion on natural habitats in global drylands. Nat. Sustain. 2022, 5, 869–878. [Google Scholar] [CrossRef]
- Güneralp, B.; Reba, M.; Hales, B.U.; Wentz, E.A.; Seto, K. Trends in urban land expansion, density, and land transitions from 1970 to 2010: A global synthesis. Environ. Res. Lett. 2020, 15, 044015. [Google Scholar] [CrossRef]
- Ansari, N.; Sarkar, R. Shrinking of Cropland Using Geospatial Approach: A Case Study of Asansol Urban Agglomeration. In Agriculture and Climatic Issues in South Asia; CRC Press: Boca Raton, FL, USA, 2024; pp. 41–62. [Google Scholar]
- Danegulu, A.; Karki, S.; Bhattarai, P.K. Characterizing urban flooding in the Kathmandu Valley, Nepal: The influence of urbanization and river encroachment. Nat. Hazards 2024, 120, 10923–10947. [Google Scholar] [CrossRef]
- Odeh, L.E. A comparative analysis of global north and global south economies. J. Sustain. Dev. Afr. 2010, 12, 338–348. [Google Scholar]
- Gao, H.; Song, X.; Xu, H.; Li, X.; Tang, J.; Zhao, G. Promoting sustainable development by mitigation of natural habitat quality decline through multifunctional urban land use: Insights from a multi-scenario simulation. Sustain. Cities Soc. 2024, 110, 105563. [Google Scholar] [CrossRef]
- Daniels, T. Smart Growth: A New American Approach to Regional Planning. Plan. Pract. Res. 2001, 16, 271–279. [Google Scholar] [CrossRef]
- Ingram, G.K.; Carbonell, A.; Hong, Y.H.; Flint, A. Smart Growth Policies: An Evaluation of Programs and Outcomes; Lincoln Institute of Land Policy: Cambridge, MA, USA, 2009. [Google Scholar]
- Zimmermann, K.; Atkinson, R. Urban Policy in European Cohesion Policy. In EU Cohesion Policy and Spatial Governance; Edward Elgar Publishing: Gloucestershire, UK, 2021; pp. 83–97. [Google Scholar]
- Artmann, M.; Kohler, M.; Meinel, G.; Gan, J.; Ioja, I.C. How smart growth and green infrastructure can mutually support each other—A conceptual framework for compact and green cities. Ecol. Indic. 2019, 96, 10–22. [Google Scholar] [CrossRef]
- Shum, K.; Watanabe, C. From compact city to smart city: A sustainability science & synergy perspective. J. Environ. Sci. Eng. A 2017, 4, 200–208. [Google Scholar]


| Driver Type | Variable Description | Data Type | Justification | Data Source |
|---|---|---|---|---|
| Target Variable | Urban (1) and non-urban (0) | Binary | ||
| Site-Specific Characteristics | Slope | Continuous | TTH province includes mountains, hills, and plains, which has impacted urban development in the province (Interviews, 2024) | Developed from TanDEM-X |
| DEM | Continuous | TanDEM-X | ||
| Distance-Related Characteristics | Euclidean distance to streets roads | Continuous | Urban expansion along transportation lines drives pattern of urban development [69] | OSM |
| Euclidean distance to national roads | Continuous | |||
| Euclidean distance to rail lines | Continuous | |||
| Cost-weighted distance to rice paddies | Continuous | Most croplands are located near urban areas, leading to potential competition between agriculture and urban land use [70] | LULC, JAXA, 2010 | |
| Cost-weighted distance to croplands | Continuous | LULC, JAXA, 2010 | ||
| Euclidean distance to water bodies | Continuous | Adoption of water-related activities like fishing and aquaculture can improve livelihoods [71], thus increasing the potential for urban growth closer to water bodies | OSM, Government agencies in TTH | |
| Cost-weighted distance to mining area | Continuous | Closeness to employment areas drives urban growth [72]; therefore, areas close to mining, commercial, and industrial areas are potential areas for urban development | ||
| Cost-weighted distance to commercial areas | Continuous | |||
| Cost-weighted distance to industrial areas | Continuous | |||
| Cost-weighted distance to worship areas | Continuous | Worship areas can impact changes to the landscape [73] | ||
| Cost-weighted distance to social areas: tourism areas, restaurants, coffee shops | Continuous | Urban areas with attractive places for leisure, coffee shops, and restaurants tend to grow faster [40,43] | ||
| Cost-weighted distance to current urban areas, 2013 | Continuous | The current urban area is more attractive for new urban development in the province (Interview, 2024) | LULC, JAXA, 2010 |
Disclaimer/Publisher’s Note: The statements, opinions and data contained in all publications are solely those of the individual author(s) and contributor(s) and not of MDPI and/or the editor(s). MDPI and/or the editor(s) disclaim responsibility for any injury to people or property resulting from any ideas, methods, instructions or products referred to in the content. |
© 2025 by the authors. Published by MDPI on behalf of the International Society for Photogrammetry and Remote Sensing. Licensee MDPI, Basel, Switzerland. This article is an open access article distributed under the terms and conditions of the Creative Commons Attribution (CC BY) license (https://creativecommons.org/licenses/by/4.0/).
Share and Cite
Obaitor, O.S.; Odunsi, O.M.; Vu, T.B.; Grobusch, L.C.; Schultz, M.; Hochschild, V.; Khanh, L.N.H.; Garschagen, M. Spatial Dynamics and Drivers of Urban Growth in Thua Thien Hue Province, Vietnam: Insights for Urban Sustainability in the Global South. ISPRS Int. J. Geo-Inf. 2025, 14, 44. https://doi.org/10.3390/ijgi14020044
Obaitor OS, Odunsi OM, Vu TB, Grobusch LC, Schultz M, Hochschild V, Khanh LNH, Garschagen M. Spatial Dynamics and Drivers of Urban Growth in Thua Thien Hue Province, Vietnam: Insights for Urban Sustainability in the Global South. ISPRS International Journal of Geo-Information. 2025; 14(2):44. https://doi.org/10.3390/ijgi14020044
Chicago/Turabian StyleObaitor, Olabisi S., Oluwafemi Michael Odunsi, Thanh Bien Vu, Lena C. Grobusch, Michael Schultz, Volker Hochschild, Linh Nguyen Hoang Khanh, and Matthias Garschagen. 2025. "Spatial Dynamics and Drivers of Urban Growth in Thua Thien Hue Province, Vietnam: Insights for Urban Sustainability in the Global South" ISPRS International Journal of Geo-Information 14, no. 2: 44. https://doi.org/10.3390/ijgi14020044
APA StyleObaitor, O. S., Odunsi, O. M., Vu, T. B., Grobusch, L. C., Schultz, M., Hochschild, V., Khanh, L. N. H., & Garschagen, M. (2025). Spatial Dynamics and Drivers of Urban Growth in Thua Thien Hue Province, Vietnam: Insights for Urban Sustainability in the Global South. ISPRS International Journal of Geo-Information, 14(2), 44. https://doi.org/10.3390/ijgi14020044