Abstract
Traditional geoportals depend primarily on keyword-based search, which often fails to retrieve relevant datasets when metadata are heterogeneous, incomplete, or inconsistent with user terminology. This limitation reduces the efficiency of data discovery and selection, particularly in domains where metadata quality varies widely. This study aims to address this challenge by developing a semantic collaborative filtering recommendation system designed to enhance dataset discovery in geoportals through the analysis of implicit user interactions. The system captures users’ search queries, viewed datasets, downloads, and applied filters to infer feedback and organize it into a user–item matrix. Because interaction data are typically sparse, semantic user clustering is applied to mitigate this limitation by grouping users with semantically related interests through hierarchical relationships represented in the Simple Knowledge Organization System (SKOS). However, as users often need complementary datasets to complete specific tasks, association rule mining is employed to identify co-occurrence patterns in search histories and enhance task-related result diversity. The final recommendation scores are then computed by factorizing the user–item matrix with Alternating Least Squares (ALS), using cosine similarity on the latent user vectors to identify nearest neighbors, and applying a standard user-based neighborhood prediction model to rank unseen datasets. The system is implemented within an existing ontology-based geoportal as a standalone, configurable component, requiring only access to user interaction logs and dataset identifiers. Evaluation using precision, recall, and Precision@5 demonstrates that increasing user interactions improves recommendation performance by strengthening behavioral evidence used for ranking. The findings indicate that integrating semantic relationships and behavioral patterns can strengthen dataset discovery in geoportals and complement conventional metadata-based search mechanisms.
1. Introduction
Over the past decade, the number of online datasets has exploded across thousands of repositories, meta portals, and dataset aware web search services, spanning fields from machine learning to earth science [1,2]. Sharing mandates and the FAIR movement accelerated this growth, while new discovery tools improved publishing and reuse tracking [3,4,5,6,7,8]. However, the volume and diversity of data related to geospatial data, especially real-time observations, are exponentially growing, which presents a substantial challenge for the retrieval, selection, integration, and analysis of geospatial data in various domains.
International efforts to improve geospatial data discovery and retrieval have resulted in the creation of several geoportals, including those established by the United States National Aeronautics and Space Administration [9], Environment and Climate Change Canada (ECCC) [10], the European Space Agency (ESA) [11], the Australian Geoscience Data Cube (AGDC) [12], and more recently the GeoCube spatio-temporal data cube platform in China [13,14]. However, discovery in practice still leans heavily on keyword search over heterogeneous metadata, which is prone to vocabulary mismatch, uneven or incomplete descriptions, and result overload for task specific needs [6,8]. This is particularly problematic because descriptions of geospatial resources are inherently multi-dimensional: they must characterize, for example, the observed phenomenon, the spatial domain and resolution, the temporal coverage and sampling scheme, and key acquisition or processing characteristics [15,16,17,18]. In practice, these dimensions are often recorded with uneven levels of detail and non-uniform terminology, which makes it difficult for simple keyword matching to capture how they jointly determine whether a dataset is suitable for a given analysis task [19,20]. Empirical studies of geoportal and open-data portal usage show that user queries tend to be short and under-specified and that ranking options frequently emphasize a single characteristic such as download popularity or spatial resolution [6,21,22]. For instance, a query such as “hourly water-level time series” implicitly constrains the target variable, the temporal sampling interval, and the type of product, yet a bag-of-words search may return any dataset mentioning “water” or “level”, regardless of its temporal resolution or data structure. This combination of multi-dimensional metadata, under-specified queries, and simple lexical ranking often leads to long lists of candidate datasets and requires users to manually inspect detailed metadata records to identify products that fit their needs [21]. To mitigate these limitations of purely keyword-based search in the presence of rich multi-dimensional metadata, a growing body of work has introduced semantic and ontology-based approaches that map query terms and metadata elements to shared controlled vocabularies or concept schemes and use these structures to reduce vocabulary mismatch and organize geospatial resources more coherently [23,24,25,26,27].
Even with semantic or ontology-based descriptions, however, different analysis tasks may prioritize different combinations of thematic, spatial, temporal, and resolution-related characteristics, and these priorities are not fully expressed in short keyword queries or generic ranking options. In many consumer web domains, such as e-commerce or travel booking, explicit ratings and textual reviews are routinely collected by prompting users to rate products or services after purchase or completion, and these ratings play a central role in recommendation and ranking models [28,29]. In the geospatial domain, although standards such as the OGC Geospatial User Feedback (GUF) model and the W3C Dataset Usage Vocabulary (DUV) provide data models for ratings, comments, and usage reports, reviews indicate that these recommendations have not yet impacted many real implementations in the geospatial domain [30,31]. In practice, operational geoportals and Earth observation catalogues rarely provide per-dataset rating or review mechanisms and instead rely on usage logs, user-support channels, and periodic satisfaction surveys to obtain feedback [30,31,32,33,34,35,36]. This difference reinforces the view that geospatial data portals are a natural setting for recommendation approaches that build primarily on implicit interaction logs rather than on explicit per-dataset ratings. Hybrid recommenders that combine collaborative filtering with content-based or knowledge-based components can exploit both interaction logs and item descriptions or domain rules [29,37,38]. However, they require additional design choices about how to integrate these signals and tend to be more sensitive to missing or inconsistent metadata. Collaborative-filtering methods, by contrast, can be implemented as a separate layer on top of existing search and browsing functionality because they only require interaction logs and shared item identifiers, which makes them particularly attractive for integration into already deployed geoportals without modifying their underlying metadata schemas or search services.
Addressing these issues constitutes a critical phase within the Qaujjikairit project focused on the Nunavik region of northern Quebec, Canada. The Qaujjikairit project (Available online: https://sentinelnorth.ulaval.ca/en/research/qaujikkaut-line-advanced-foresight-tool-extreme-meteorological-events-and-natural-hazards-nunavik, accessed on 11 December 2025), founded by Sentinel North and co-led by the Centre d’etudes nordiques (CEN) and the Centre de recherche en donnees et intelligence geospatiales (CRDIG) of Universite Laval, seeks to develop an advanced online tool for forecasting extreme meteorological events and natural hazards in Nunavik. Within this context, the present paper (based on the doctoral thesis of the first author, defended at Laval University, Canada, in 2025 [39]) addresses the challenge of data discovery by introducing a collaborative-filtering geospatial recommender that learns from user interactions in the geoportal to surface task-relevant datasets that users may not yet know. Notably, the proposed recommendation system seeks two objectives: (i) to suggest the most potential geospatial datasets with semantic themes aligned to users’ search queries, and (ii) to suggest the most potential geospatial datasets to complete user tasks by extracting rules from users’ search histories.
2. Related Work
2.1. Recommender-System Categories
In large scale information systems, recommendation methods are commonly grouped into four families. Collaborative filtering infers preferences from the behavior of many users, assuming that users who acted similarly in the past are likely to act similarly again. It can be user based, where the system finds users similar to the target user and suggests what they preferred, or item based, where the system suggests items like those the user engaged with. Collaborative filtering is effective when interactions exist. Content-based methods compare item features with a user profile. For example, if someone often works on coastal erosion, the system suggests datasets about coastal erosion. These methods work well for new or long tail items but may overspecialize and depend on metadata quality. Knowledge-based systems use explicit domain rules and user specifications rather than past behavior. For example, to recommend geospatial data for mapping extreme weather, the system matches data characteristics to stated requirements. These systems suit precise needs but require ongoing domain curation. Hybrid systems combine two or more of these approaches to leverage strengths and reduce weaknesses, for example combining collaborative and content-based methods to temper cold start and overspecialization. These four categories are summarized in Table 1, which outlines their core principles, main strengths, and key challenges. Taken together, they define a design space in which system builders must decide which signals (interaction logs, item descriptions, domain rules) can realistically be exploited under the constraints of a given application. In the context of geospatial data portals, these constraints are particularly shaped by the availability and quality of usage logs and metadata, and by the need for recommendations that remain transparent and maintainable over time.

Table 1.
Main categories of recommendation systems and their properties.
Previous work on open data portals and geoportals shows that metadata records are often incomplete or inconsistently filled, which limits the effectiveness of search and content-based recommendation methods that rely only on these fields to estimate similarity between datasets and users [18,19,44]. In addition, explicit rating or review functions are rarely provided inside geoportals, and user feedback is instead collected mainly through usage logs, user-support channels, and periodic satisfaction surveys [31,32,33,45]. In this situation, collaborative filtering is a suitable choice because it interprets log-derived interactions as implicit feedback and learns from regularities in how users access datasets together, without requiring explicit rating profiles or detailed user preference statements [46,47]. Hybrid recommenders that combine collaborative filtering with content-based or knowledge-based components can exploit both interaction logs and item descriptions or domain rules [29,37,38]. However, they require additional design choices about how to integrate these signals and tend to be more sensitive to missing or inconsistent metadata. Collaborative-filtering methods, by contrast, can be implemented as a separate layer on top of existing search and browsing functionality because they only require interaction logs and shared item identifiers, which makes them particularly attractive for integration into already deployed geoportals without modifying their underlying metadata schemas or search services [29,37,40].
Using collaborative filtering in portals brings well documented challenges, including heterogeneous user preferences where similarity holds only on subsets, data sparsity, scalability for large user to item spaces, and cold start for new users or items [48,49,50,51]. Remedy families include matrix factorization, which uncovers latent structure but can be sensitive to context and sparsity [52], deep models, which can be more accurate but are resource intensive and less interpretable [53,54], and graph-based methods, which are expressive but complex to scale in large portals [55]. A complementary line groups users or items before collaborative filtering. Clustering creates denser neighborhoods that stabilize similarity estimates and improve top N quality under sparse logs. Simultaneous user and item clustering, often called co clustering, additionally reduces dimensionality and improves efficiency [48,49]. When metadata are uneven and query vocabularies vary, clustering only on raw interactions can be brittle. Studies that inject domain semantics, for example by using controlled vocabularies or ontologies to compute query or concept similarity before collaborative filtering, report better robustness under sparsity and improved recommendation stability relative to interaction only baselines [56].
2.2. Semantic and Ontology-Based Recommenders
The growth of geospatial data on the web, together with advances in web technologies, motivated the establishment of a joint OGC–W3C Working Group on Spatial Data on the Web (SDW) [20]. This group develops best-practice guidelines for publishing geospatial data online, with the aim of making spatial data infrastructures more accessible, interoperable, and effective. Consistent with the SDW recommendations, several studies have shown that integrating semantic web technologies such as the Resource Description Framework (RDF) and OWL into geoportals can substantially enhance their functionality [23,24,25,26,27]. A key ingredient in many semantic approaches to geodata management and discovery is the use of shared knowledge organization systems (KOS) to structure domain vocabularies. The Simple Knowledge Organization System (SKOS) is a W3C data model for representing thesauri, classification schemes, and other KOS as RDF concept schemes, with explicit broader–narrower and related-concept relationships [45]. For geodata management and discovery, several KOS have been published as Linked Data and expressed in SKOS in order to interlink domain vocabularies and code lists. The LusTRE framework illustrates how multilingual environmental thesauri and controlled vocabularies can be exposed as a single interlinked SKOS-based knowledge infrastructure, supporting metadata compilation and cross-portal discovery for environmental spatial data infrastructures [57,58]. In the food and agriculture domain, AGROVOC provides a large multilingual SKOS concept hub that connects terms across organizations, languages, and datasets and is published as Linked Open Data [59]. These interconnected KOS demonstrate how the Linked Data paradigm and SKOS concept schemes can provide a shared semantic backbone for describing and discovering domain-specific resources, and they offer a reusable semantic layer that could support more advanced discovery and recommendation functions.
In the recommender-systems literature, hierarchical knowledge organization systems and ontologies have been used not only for query expansion but also to enrich user and item representations for recommendation and data discovery. Wenige and Ruhland [60] present SKOS-based recommendation frameworks for digital libraries in which items are annotated with SKOS subjects and recommendations are produced by combining item-to-item similarity over these concept annotations with graph-based queries on Linked Open Data repositories. Sheridan et al. [61] present an ontology-based recommender system that integrates a large hierarchical ontology of literary themes into an item-based k-nearest neighbors model. The ontology-derived item similarities are used to alleviate item cold-start problems and provide more interpretable recommendations than purely collaborative filtering approaches. Other ontology-based recommender approaches use domain ontologies to cluster users and items and then apply collaborative filtering within these semantically defined groups, thereby mitigating sparsity and improving similarity estimation [62,63]. The ontology-based recommender-systems literature emphasize that representing preferences over concept hierarchies allows recommendation methods to propagate evidence across related concepts, aggregate behavior at different levels of abstraction, and better cope with sparse interaction data [64,65]. These works illustrate how SKOS-based and ontology-based hierarchical structures can be integrated with collaborative filtering to support data discovery in domains where interaction data are limited but rich KOS are available.
2.3. Collaborative Filtering Recommendation System in Geoportals
Although recommendation systems are widely used in many domains, their application to discovering and selecting the most suitable geospatial data remains under explored [32]. Early work demonstrated that adding recommendation to geoportal workflows can mitigate limitations of keyword search under semantic heterogeneity. Vockner et al. [23,33,66] examined how to augment an ESRI Geoportal Server deployment with a recommender that exploits user interaction traces in the EnerGEO project. In their proof of concept, the open-source easyrec engine is integrated as an additional component: sequences of viewed or downloaded spatial resources are treated as “baskets” and an Apriori-based Association Rule Miner is used to derive rules of the form {item A, item B} → {item C}. The resulting “other users also viewed” suggestions are presented inside the portal interface alongside keyword-based search results, so that datasets that tend to be used together in specific tasks are recommended as complementary resources. The recommender is positioned as an overlay that complements catalogue search and existing semantic linkages such as thesauri or ontologies, highlighting semantic heterogeneity and sparse interaction data as persistent challenges and arguing for bringing web-style recommendations into geoportals that still behave like traditional catalogue systems.
Dareshiri et al. [32] designed and prototyped a recommender geoportal that integrates content based and collaborative filtering with singular value decomposition to address sparsity and scale. The system operates in three scenarios, namely blind recommendations for anonymous sessions, user based for logged in users using profile and ratings, and resource based using metadata similarity. They model attributes from ISO conformant metadata together with user characteristics and context. Evaluation on a working prototype showed the approach could predict user preferences in practice. Reported constraints include cold start that is only partially mitigated by contextual cues, accuracy that depends on users providing ratings, and ranking that tends to repeat similar items, which reduces serendipity. The authors propose tagging, semantic web–based approaches for managing multiple languages and ambiguity, and clustering as potential directions for improvement. Jiang et al. [21,67] targeted the intent gap in keyword search by integrating four evidence sources, namely user search histories, clickstreams, existing ontologies, and portal metadata, to discover semantic relationships among geospatial vocabulary terms and then use those relationships for query augmentation and recommendation.
More recent and closely related work reinforces two themes important for geoportals. Recommendation is most useful when explicit ratings are scarce and metadata are uneven, and injecting domain semantics into representation or expansion improves robustness under sparsity. Mai et al. [24] showed that semantically enriched search for ArcGIS Online, where user queries are expanded with thematically related terms, improves retrieval when catalog metadata and user vocabularies diverge, which supports the value of semantics before or alongside recommendation. Complementarily, Miao et al. [68] proposed an ontology-semantics–based similarity model for OGC Web Services (OWS) discovery by integrating thematic similarity with spatiotemporal similarity and reported better retrieval performance than keyword-based matching (e.g., Lucene) in terms of recall, precision, and F-measure. However, their contribution is framed as semantic search and ranking rather than recommendation.
Across these studies, collaborative filtering is attractive in geoportals where rich ratings are rare, but interaction logs exist. At the same time, practical challenges persist, including heterogeneous user preferences across thematic subareas, sparse user to item matrices, scalability, cold start, and limited attention to diversity in evaluation. Recent semantics enrichment results directly support bringing controlled vocabulary or learned semantic similarity into the pipeline to reduce vocabulary mismatch and to stabilize representation under sparsity. These observations set up the need for behavior-driven recommendation in geoportals that can work with incomplete metadata and can expose complementary, not only similar, datasets; however, existing implementations treat KOS-based semantic clustering, implicit-feedback collaborative filtering, and association-rule-based modelling of co-used datasets in isolation rather than within a single integrated recommendation pipeline.
3. Methodology
3.1. Framework Overview
To leverage the unique benefits of recommender systems for geospatial data discovery and selection, a new semantic collaborative filtering recommender system for geospatial data is proposed. The collaborative filtering recommender system was chosen after considering the limitations of other methods. Knowledge-based recommendation systems, for instance, often struggle because users are unmotivated to provide feedback on the datasets they access or download, and many do not fully complete their profiles, leading to ineffective recommendations. Similarly, content-based systems, which rely heavily on metadata, are unsuitable since the system needs to function independently of detailed metadata. In contrast, a collaborative filtering approach can bypass these issues by relying on patterns in user interactions.
As shown in Figure 1, the proposed semantic recommendation system framework for geoportals comprises three main steps: Tracking User Behavior, User–Item Matrix, and Recommender Model, which will be explained in detail in the following sections. Before explaining these steps, it is necessary to specify a preliminary stage, shown in the UML activity diagram as the “User Interaction (via Geoportal Interface)”. The User Interaction box represents user-driven activities, including search terms, viewing dataset details, downloading datasets, and applying filters. These activities serve as the starting point for system processes but are not directly connected to the approach. Instead, a starting point leads to the “Collecting User Interactions” process, where these actions are logged and analyzed to improve the recommendation system. The following subsections present each step of the framework.
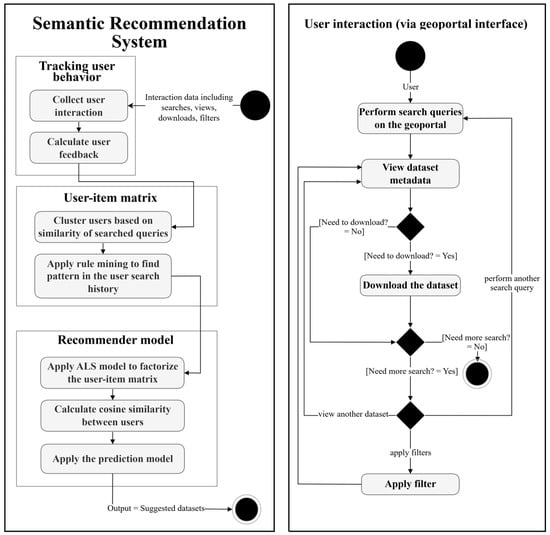
Figure 1.
Semantic recommender system framework with the process of user interactions (UML activity diagram).
3.2. Tracking User Behavior
As mentioned earlier, users are often unmotivated to provide the necessary feedback (ratings) when viewing or downloading their intended geospatial datasets. Consequently, since recommendation systems typically rely on this feedback, there would not be enough rated datasets available to generate accurate recommendations. One alternative approach is to implicitly calculate user feedback by collecting user interactions with the geoportal. As highlighted in many studies [69,70,71,72], implicit feedback for rating datasets can be obtained from user interactions such as viewed datasets, downloaded datasets, the time spent observing information on each dataset, applied filters, and search terms.
Figure 2 adapted from Li et al. [46], illustrates a typical user search process. Users begin by entering keywords (as search terms) and selecting several datasets from the search results. They may then apply a filter (e.g., spatial coverage) and proceed to view additional datasets before eventually downloading some. It is also possible for users to click on other datasets after downloading. As stated in many studies [21,46], strong relationships exist between the search query, applied filters, viewed datasets, and downloaded datasets, making these interactions valuable for analysis. However, certain dependencies, such as the sequence of clicks, can introduce noise. For instance, clicking on Dataset 2 (D2) after D1 does not necessarily indicate that D2 is more relevant than D1.
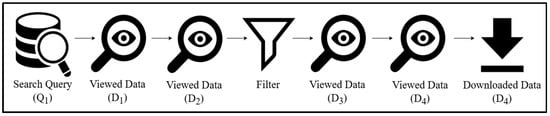
Figure 2.
Common user search process adapted from Li et al. [46].
In this study, Equation (1), inspired by [21], is used to calculate implicit feedback from users’ activities based on two key assumptions: (1) datasets which have been downloaded (D4 in Figure 2) indicate a higher level of user interest compared to those merely viewed (D1, D2, and D3); and (2) views of datasets after applying filters (D3 and D4) are more significant than those viewed before applying filters (D1 and D2). Equation (1) assigns a weight to each user action associated with a dataset, determining how much influence each type of action (viewing before or after filtering, and downloading) has on the overall feedback score for that query.
The coefficients α, β, and γ weights views before filters, views after filters, and downloads, respectively. In this study they are fixed to α = 1, β = 1.75, and γ = 3. These values were obtained by testing several combinations and selecting the setting that achieved the best overall precision and recall for the recommender system (Section 4.5).
3.3. User–Item Matrix
After obtaining user feedback through tracking interactions within the geoportal, the next step is to organize this feedback into a structured format. The User–Item Matrix represents these interactions between users and geospatial datasets, forming the foundation for generating recommendations. This matrix is essential for structuring the interaction data to enable efficient similarity computations and accurate recommendation generation. Suppose there is a collection of data that records the preferences of a given number of users, denoted by “n”, for some or all of “m” items (in our study geospatial data). These preferences are typically recorded as tuples in the form of (Userid, Itemid, rating), where the rating is a numerical value (e.g., on a scale from 1 to 5) indicating how much the user identified by Userid likes the item identified by Itemid. Figure 3 illustrates a sample of the user–item matrix “R” of size n × m, which contains these preference records. In this matrix, each cell “Rij” holds either the rating given by user “i” to item “j”, or a null value if the user has not rated the data yet. Typically, this matrix is sparse because users do not usually rate all items in the dataset. The role of a recommender system is to predict these missing ratings, in other words, to estimate how a user might rate an item in the future. This prediction helps the system recommend datasets that are likely to receive high ratings from the user.
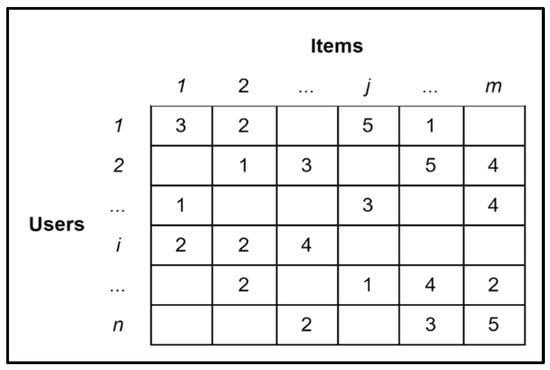
Figure 3.
An example of the user–item matrix.
In this study, the creation of the User–Item Matrix involves essential prerequisites to ensure that the data is organized effectively for addressing the challenges mentioned in collaborative filtering recommender systems, specifically, heterogeneous user preferences, data sparsity, scalability issues, the cold-start problem, and limited data diversity (task completion). This process is divided into two key subcomponents (a) Semantic User Clustering and (b) Search Query Rule Mining.
- (a)
- Semantic User Clustering
Traditional recommendation systems often rely on simple keyword matching, which overlooks the context and intent behind users’ searches. In contrast, clustering based on the semantic similarity of users’ search terms, enables the system to consider the context and intent behind their searches. As discussed, the cold start problem occurs when a system lacks sufficient data about new users, making it difficult to provide accurate recommendations. By clustering users based on the semantic similarity of their queries, even new users who have not interacted much with the system can be grouped with others who have made semantically similar search queries. This clustering also increases the amount of usable data within each cluster, therefore by focusing on the most relevant interactions, this approach enhances data density, mitigating the issue of sparse data. Finally, clustering improves scalability by reducing the computational complexity. Since the system processes clusters of users rather than comparing every user with every item, the number of calculations required is reduced.
To achieve the clustering based on the semantic similarity of users’ search terms, the concept of semantic distance is utilized, which measures the closeness between two concepts or individuals based on their semantic properties [73]. This is achieved by analyzing the hierarchical relationships defined within an ontology that organizes geospatial dataset themes. Within this ontology, SKOS is employed, where SKOS concepts represent dataset themes and the skos:broader and skos:narrower properties define hierarchical relationships among them. OWL 2 [74,75] provides the underlying formal structure that supports reasoning over these relationships. Semantic distance is then calculated by examining these relationships and determining the connections between concepts, including their common ancestors and relative positions within the hierarchy. Consequently, when a user seeks to retrieve datasets related to a particular theme, the ontology can infer connections between the search query that may not be directly performed but share a broader or narrower relationship through common ancestors or related concepts. In addition to that, by doing it, the system can retrieve datasets not only based on exact matches but also by considering their semantic proximity to the user’s query if the vocabulary in the ontology also have been used for tagging each dataset. From a computational point of view, the clustering step operates on semantic profiles derived from users’ queries rather than on pairwise distances between all user pairs. Consequently, the cost of building clusters grows with the number of logged interactions and the size of the concept hierarchy, rather than with the square of the number of users, and clusters can be recomputed offline and updated periodically as new interactions are added.
In this study, semantic similarity is computed using the Global Change Master Directory (GCMD) keyword vocabulary [76] and its SKOS representation, which provide hierarchical relationships (skos:broader, skos:narrower) and lexical variants (skos:altLabel) aligned with Earth science concepts. General-purpose lexical resources such as WordNet were not applied, since the objective was to capture Earth science–specific semantics rather than purely linguistic similarity, particularly for remote sensing imagery and in situ observations. To relate user queries to these GCMD SKOS concepts, an ontology-based keyword–concept classification inspired by Li [77] is applied: query strings are normalized (lowercased and stripped of punctuation), N-grams (unigrams and bigrams) are generated from the query text, and these N-grams are matched case-insensitively against the GCMD SKOS labels (both skos:prefLabel and skos:altLabel). Any match adds the corresponding concept to the query’s concept set. In the ontology, each GCMD hierarchical chain (for example, Precipitation > Precipitation Amount > Hourly Precipitation Amount) is represented as a single individual, so when a label in the chain matches a query N-gram, the corresponding hierarchy individual is selected and used in semantic clustering, ensuring that semantic profiles are built from coherent concept chains rather than isolated labels. The Q-TREE algorithm [73] is used as the foundation for computing the shortest distance within this structure. The relative order of subcategories associated with a given node is determined using the SKOS relationships, taking advantage of the fact that these relationships provide an ordered taxonomy. Given any two nodes v,z, the query algorithm for finding their distance d(v,z) is defined as follows:
where d(v,r) + d(z,r) is the distance of the nodes v and z from the root r (in the case that both have the same root, otherwise the nodes are not related to each other), and d(LCA(v,z),r) is the distance from the root to their least common ancestor. In other words, queries are considered similar if they share a common ancestor with the query of the target user (the user for whom the system wants to make a recommendation). This approach ensures that the system clusters users based on the semantic similarity of users’ search terms. In the clustering step, the semantic distance d(v,z) between concepts is computed using Equation (2), and only concepts that belong to the same GCMD hierarchy (i.e., share the same root) are treated as related and can contribute to placing users in the same cluster. If a search query does not contain any terms that can be mapped to GCMD concepts via the SKOS labels, the corresponding semantic profile remains empty and the user cannot be placed into any semantic cluster; in the current implementation, such queries simply do not trigger the recommendation component, and the user interacts only with the standard geoportal search results.
d(v,z) = d(v,r) + d(z,r) − 2d(LCA(v,z),r)
For instance, a user searches for datasets that measure “Hourly Precipitation Amount”, and the SKOS-based ontology organizes this concept within a hierarchy where “Precipitation” has the narrower concept “Precipitation Amount”, which in turn has the narrower concept “Hourly Precipitation Amount” (“Atmosphere” > “Precipitation” > “Precipitation Amount” > “Hourly Precipitation Amount”). The system computes the semantic similarity between this concept and other related themes, clustering users according to their semantic distance from the common ancestors. In the example above, the semantic distance of the performed query with the themes “3 Hour Precipitation Amount”, “6 Hour Precipitation Amount”, and “12 Hour Precipitation Amount” was computed using Equation (2), and the following was concluded:
- Precipitation > Precipitation Amount > 3 h Precipitation Amount.
- Precipitation > Precipitation Amount > 6 h Precipitation Amount.
- Precipitation > Precipitation Amount > 12 h Precipitation Amount.
The following example utilizes the proposed approach to demonstrate how the system creates the User–Item Matrix in a simplified real situation in a geoportal. Figure 4 illustrates a user–item matrix constructed from user interactions as shown in Table 2, extracted from the logs of a geoportal, when the system provides recommendation for User1. As shown in Table 2, Users 1 to 4 searched for datasets related to “precipitation” “rainfall” “total surface precipitation rate” and “soil moisture” If a New User searches for “precipitation,” the user–item matrix created through semantic clustering will include only the users who have previously searched for terms semantically similar to “precipitation.” The matrix will also include the datasets related to those similar search terms using Equation (2), along with their feedback calculated using Equation (1). For instance, in our example, only users 1 to 3 would be grouped in the same cluster as the new user, since the search terms “precipitation”, “rainfall”, and “total surface precipitation rate” are considered semantically similar in the GCMD taxonomy according to Equation (2).
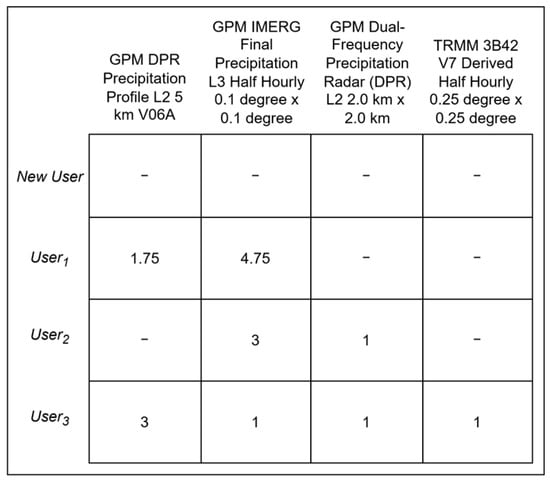
Figure 4.
User–item matrix reflecting semantic clustering based on similar search terms related to precipitation.
Table 2.
An example of user interactions with geospatial datasets related to precipitation, rainfall, total surface precipitation rate, soil moisture, and DTM/DEM, including the specific actions of viewing, applying filters, and downloading.
- (b)
- Search Query Rule Mining
In the proposed semantic recommender system, traditional recommender systems are improved by having rule mining processes to facilitate search query completion and address the limited diversity of results in the geospatial dataset domain. The system applies association rule mining within user clusters that are formed based on the semantic similarity of their search queries, uncovering correlations between different user queries to inform the recommendation of new search terms. For instance, if a New User interested in flood modeling searches for “Precipitation” and “Soil Moisture” datasets, they will likely also require datasets related to the “Digital Terrain Model (DTM)”, because understanding the topography is crucial for predicting how precipitation will flow and accumulate in areas with varying soil moisture levels during flooding. Association rule mining identifies these patterns by analyzing past user behavior, learning from frequent co-occurrences of search terms and then appending the related datasets to the user–item matrix. Returning to the previous example of the creation of the user–item matrix, by considering the associations between the search terms “Precipitation” “Soil Moisture” and “DTM”, the updated user–item matrix also includes the users’ interests in the datasets regarding DTM, even if the new user only searched for “Precipitation” and “Soil Moisture”. Figure 5 illustrates the final user–item matrix by considering both semantic clustering and rule mining of the provided example for New User.
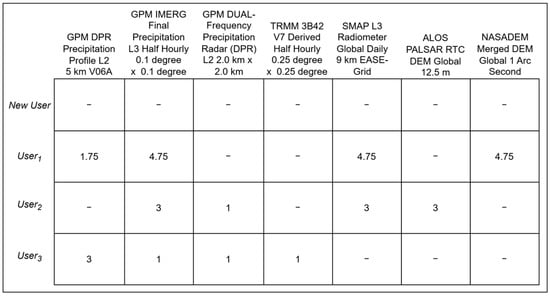
Figure 5.
Expanded user–item matrix incorporating association rule mining to include additional relevant datasets.
Two measures, support and confidence, are used to evaluate the relevance of the association rules. Support, as defined in Equation (3), measures the proportion of searches that contain both terms in the set X ∪ Y compared to the total number of searches. This measure indicates how frequently these terms appear together in the dataset. Confidence, as expressed in Equation (4), represents the likelihood that a user who searches for term X will also search for term Y. It is calculated by dividing the number of searches that include both X and Y by the number of searches that include only X. These measures are defined by the following Equations:
In the association-rule mining component, each user session is treated as a transaction (basket) of datasets viewed or downloaded together. Association rules of the form are mined using the Apriori algorithm with minimum support and confidence thresholds. Several configurations were examined, with minimum support values in the range 0.02–0.10 and confidence thresholds between 0.3 and 0.7, and a setting was chosen that produces a manageable number of strong rules without overwhelming the interface. In the final configuration, the minimum support is set to 0.05, meaning that a rule’s antecedent–consequent itemset must appear in at least 5% of the transactions, and the minimum confidence is set to 0.40, meaning that the consequent occurs in at least 40% of the transactions containing the antecedent. Rules that do not satisfy both thresholds are discarded and do not contribute to the “also used” recommendations.
3.4. Recommender Model
Moving to Recommender Model step, the system applies (a) the Alternating Least Squares (ALS) model to factorize the user–item matrix and calculates cosine similarity between users to measure user similarity, and finally (b) applies the prediction model to generate and suggest relevant datasets.
- (a)
- Alternating Least Squares (ALS) and Cosine similarity
Measuring user similarity is essential in a user-based collaborative filtering system because it determines the foundation upon which recommendations are made. By identifying users with similar behavior and preferences, the system can recommend datasets that these similar users have found valuable.
To create the recommender model, a low-rank matrix factorization is applied to decompose the user–item matrix into latent factors that represent both users and items. A standard Singular Value Decomposition (SVD) formulation, which is a popular approach for matrix factorization and has been recommended in previous work on geospatial data recommendation [32], was initially considered. However, in this context the user–dataset matrix is very sparse and encodes implicit feedback derived from views and downloads, so treating all missing entries as zeros leads to unstable behavior and biased estimates for users with few interactions. For this reason, a low-rank matrix factorization model trained with alternating least squares (ALS), a widely used method in collaborative filtering for large, sparse datasets, is adopted. The user–item interaction matrix is decomposed into two lower-dimensional matrices: ( matrix) and ( matrix), where is the number of latent factors, is the number of users, and is the number of items. The factorization is learned by minimizing the squared error between the non-zero entries of and the corresponding dot products of the user and item factors, with additional regularization terms to reduce overfitting. Once the latent factors have been estimated, the product approximates and provides estimates for the unobserved entries, allowing the system to infer user preferences for datasets that have not yet been interacted with. The relationship between the original user–item matrix R and the factorized matrices and is given by:
After this decomposition, the similarity between users is calculated using the cosine similarity function Sim (u, ), as shown in Equation (6). In this context, the vectors and correspond to rows in the reduced matrix where each row represents a user. The cosine similarity between these vectors indicates how closely aligned the users’ interests are, particularly in relation to geospatial datasets. The more similar the vectors, the more similar the users are in terms of their preferences, which allows the system to recommend datasets that align with the preferences of similar users.
The cosine similarity between users and is calculated using Equation (6):
The loss function used to measure the difference between R and the product × is often the squared error, summed over all user–item pairs for which the interaction is known (non-missing entries in R) as Equation (7). Regularization terms are also typically added to prevent overfitting. The loss function L can be expressed as:
where
- is the actual interaction (such as rating) of user u with item i.
- is the latent factor vector for user u.
- is the latent factor vector for item i.
- K is the set of (user, item) pairs for which is known.
- λ is the regularization parameter.
- and are the L2 norms of the user and item factor vectors, respectively, used for regularization.
Training this model involves iteratively optimizing the user and item factors using ALS. In each iteration, the user factors are fixed while optimizing the item factors to minimize the loss function. Then, the item factors are fixed, and the user factors are optimized. This alternating process continues until convergence is reached or the improvement in the loss function falls below a predefined threshold.
- (b)
- Prediction model
After calculating the similarity between the target user u and all other users using cosine similarity on the latent user vectors obtained from the ALS factorization described above, the next step is to predict how much user u would likely rate a specific geospatial dataset r. This predicted rating helps determine which datasets to recommend to the user u. The goal is to leverage the influence of ratings given by users similar to user u to estimate how user u would rate a dataset that they have not yet interacted with. This prediction allows the system to recommend datasets that the user is likely to find valuable. In this framework, ALS is used to obtain low-dimensional user representations for similarity computation, whereas the final recommendation scores are produced by a standard user-based neighborhood model. This prediction is made using Equation (8):
The prediction starts with the average rating that user u has given across all datasets they have rated, serving as the baseline. Equation (8) then adjusts this baseline by considering how similar users have rated the same dataset r. The similarity score Sim (u, ) indicates how closely user resembles user u, determining the influence of rating on the prediction. The term represents the difference between the rating given by user to dataset r and their own average rating. By combining these influences, Equation (8) predicts how much user u is likely to rate dataset r. Finally, once the predicted ratings are calculated, the system selects the top N datasets with the highest predicted ratings and recommends them to user u.
4. Testing the Quality of the Recommender System
4.1. System Architecture
To validate the proposed recommender system, we implemented it within a semantic geoportal previously developed in our earlier work [78]. The geoportal provides ontology-based data retrieval and selection, serving here solely as a testbed for the recommender system. This design choice ensured that the recommender system remained standalone and portable, capable of being configured in any geoportal that exposes comparable activity data.
The overall system architecture is shown in Figure 6. It comprises three layers: a presentation layer responsible for user interaction through the geoportal interface, an application layer that hosts both the ontology-based engine and the proposed recommender system, and a data layer that manages the ontology and user activity logs.
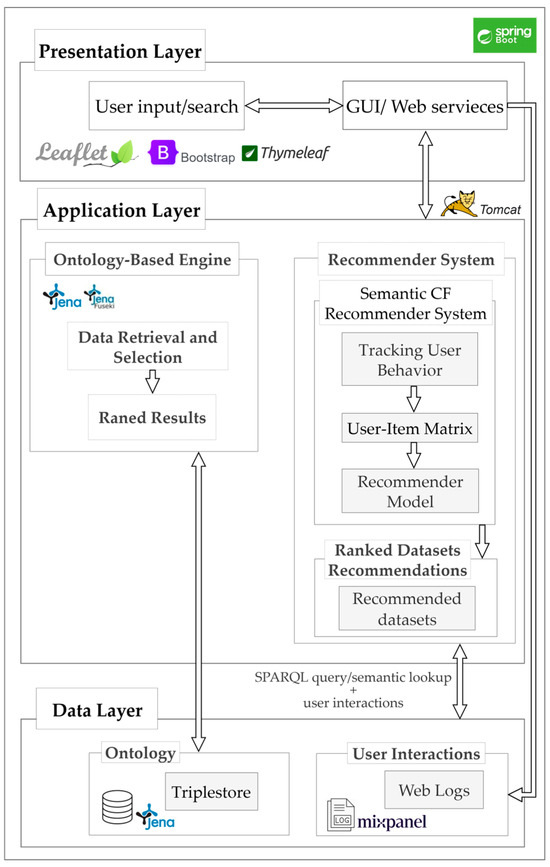
Figure 6.
System architecture of the implemented semantic recommendation system within the geoportal.
The ontology-based engine retrieves datasets from the triplestore using SPARQL queries. The recommender system operates on real-time user interaction data captured through Mixpanel (version 2.11.1; Mixpanel Inc., San Francisco, CA, USA). Mixpanel enables the collection of detailed interaction data such as search queries, dataset views, downloads, and filter usage in real time. Its JavaScript SDK was integrated into the front-end interface to capture client-side events, while server-side tracking was handled through Spring Boot REST controllers using the Mixpanel API. Mixpanel’s free plan supports tracking up to 20 million events per month, providing a cost-effective solution for initial system deployment and user behavior analysis. Alternative analytics tools such as Google Analytics (Google LLC, Mountain View, CA, USA) and Matomo (InnoCraft Ltd., Wellington, New Zealand) were considered; however, Mixpanel was preferred for its event-based data model, ease of integration with Java applications, and robust visualization capabilities that support iterative refinement of the recommender system.
4.2. Interface and Recommendation Display
Users interact with the system through geoportal’s web interface, which provides a simple search box supporting free-text queries. Users can enter keywords or phrases describing the type of geospatial data they are looking for. Figure 7 shows the initial search interface where users can formulate their query.
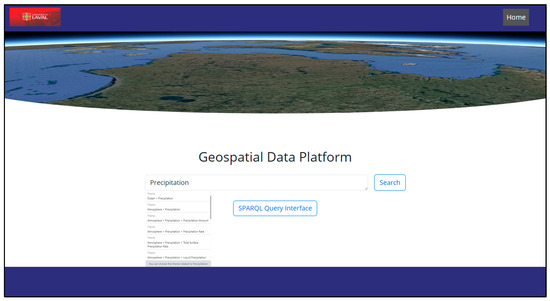
Figure 7.
Geoportal system’s main web interface page [78].
Figure 8 presents the search results for the query “Precipitation,” where the system retrieved all datasets associated with this theme based on their semantic metadata. The results page lists relevant datasets along with key descriptive attributes such as title, spatial and temporal coverage, and source information.
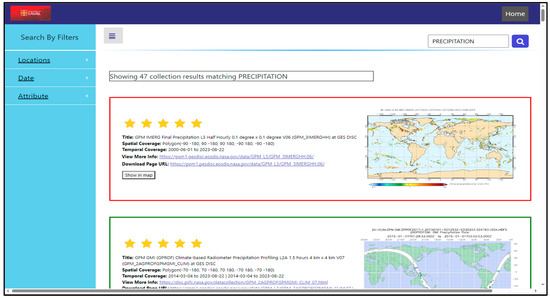
Figure 8.
Example of search results retrieved for the keyword “Precipitation”.
After a user selects a dataset to view more detailed information, the semantic recommendation system analyzes the interaction context—including viewed datasets, search history, and similarity patterns—to suggest additional datasets that are thematically or spatially related. Figure 9 illustrates this recommendation panel, which appears dynamically within the geoportal interface to guide users toward potentially relevant data resources.
Figure 9.
Recommended datasets displayed after a user views a selected dataset.
4.3. Evaluation Metrics
The quality of the results is assessed using two key metrics as recall and precision, which are widely recognized in the field of recommendation systems [47,79,80,81]. Recall, as defined in Equation (9), measures the system’s ability to retrieve all relevant items, reflecting its coverage. Precision, as expressed in Equation (10), evaluates the proportion of recommended items that are relevant, indicating the system’s accuracy. Additionally, the specialized metric Precision@K, as defined in Equation (11), focuses on the top K recommendations, offering a more user-centered evaluation by measuring the proportion of relevant items among those top K recommendations. This metric provides a practical assessment of the system’s effectiveness from the user’s perspective, emphasizing the relevance of the most immediately accessible recommendations.
In these equations:
- True Positives (TP): The number of items correctly identified as relevant by the system, where “true” refers to items that are genuinely relevant to the user’s query or needs, based on ground truth data or expert validation.
- False Positives (FP): The number of items incorrectly identified as relevant.
- False Negatives (FN): The number of relevant items that the system failed to identify.
4.4. Experiment Results
Recommendation systems can be evaluated through two main methods, as described by Herlocker et al. [82]. The first is offline evaluation, which tests the system’s precision and accuracy using an existing dataset. The second is online evaluation, which gathers user feedback over time while the system is actively being used. In the context of the geospatial community, no dataset is currently available that includes user interactions, which would allow for an offline evaluation of the proposed system. Furthermore, conducting an online evaluation would require implementing the system within a national Spatial Data Infrastructure (SDI), which is beyond the scope of this study. To approximate the performance of the proposed recommender system, two controlled scenarios were developed using a curated dataset collection. These scenarios provide a ground truth—a reference set of datasets relevant to each simulated task—against which recall, precision, and Precision@K (Equations (9)–(11)) are computed. To perform these scenarios, real users were initially involved, but due to the limited number of users and interactions, a second round was conducted using dummy users to simulate a broader range of interactions.
A total of 75 NASA datasets were selected and grouped into three thematic categories used in hydroclimatic analysis: 47 related Precipitation datasets, 15 related Soil Moisture datasets, and 13 related DTM/DEM datasets. Two usage scenarios were defined. Scenario 1 represents high temporal resolution monitoring. Precipitation and Soil Moisture datasets must have a temporal resolution better than daily such as hourly, 3 hourly, 6 hourly, or 12 hourly. DTM/DEM datasets must have a spatial resolution better than 60 m. All datasets must cover a specific region (Nunavik territory) and include data for the year 2023. Scenario 2 represents lower temporal resolution or long-term monitoring. Precipitation and Soil Moisture datasets must have weekly or monthly temporal resolution. DTM or DEM datasets again must have spatial resolution better than 60 m. Coverage over Nunavik territory and the year 2023 is required. It should be noted that the criteria for DTM/DEM datasets were kept identical in both scenarios to create a common element between them. This overlap was intentionally designed to evaluate whether the recommendation system could accurately differentiate the two scenarios based on user interactions with the Precipitation and Soil Moisture datasets, which have distinct criteria in each scenario. For evaluation, each dataset in the collection was manually labeled by the authors according to the scenario criteria. A dataset was considered relevant for a scenario if it satisfied all requirements on temporal resolution, spatial resolution, spatial coverage, and temporal coverage. Table 3 summarizes, by theme and by scenario, the number of datasets that meet all criteria.
Table 3.
The categorization of datasets for each scenario.
To test the system under realistic conditions, twelve graduate students in GIS participated in the first round of experiments, split into two groups of six. Each group tested exactly one scenario. For each scenario, initialization interactions were collected from users who did not participate in testing that scenario, which prevents information leakage between initialization and test phases. All participants followed a single procedure aligned to the assigned scenario. First, perform a search for either DEM or DTM or Soil Moisture to create search history for rule mining. Next, search for Precipitation. Apply spatial and temporal filters as needed. View between one and five datasets. Download at least one dataset that meets the scenario relevance criteria.
Figure 10 reports the evaluation of the recommender system under the two scenarios used as ground truth. It shows a side-by-side comparison of Recall, Precision, and Precision@5 for two groups of participants. For each metric there are two bars, one for Group 1 (assigned to test scenario 1) and one for Group 2 (assigned to test scenario 2), and the bar height represents the mean value. Error bars in black show the range from the minimum to the maximum across users. A green horizontal line marks the average of the two group means for the corresponding metric, providing a visual reference for combined performance.
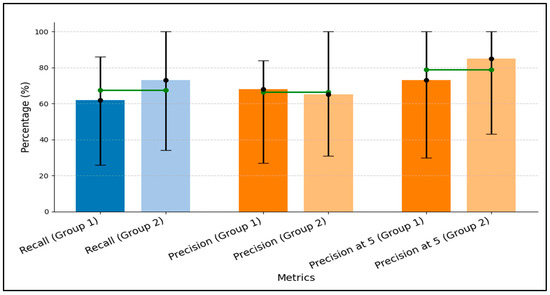
Figure 10.
Evaluation results of the recommender system across scenarios, showing mean values of recall, precision, and precision@5, with ranges indicating minimum and maximum observed outcomes for real users.
As shown in Figure 10, Group 1 vs. Group 2 achieved 62% vs. 73% Recall, 68% vs. 65% Precision, and 73% vs. 85% Precision@5. Users with fewer interactions had the lowest values (minimum Recall 26% vs. 34%, minimum Precision 27% vs. 31%). The ground truth contained more relevant items for Group 1 than for Group 2 (Precipitation 17 vs. 10, Soil Moisture 7 vs. 4, DTM/DEM 10 vs. 10), which increased task complexity for Group 1 and reduced Recall. Overall, two factors are highlighted. First, more user interactions strengthen behavioral signals and improve both Recall and Precision. Second, a smaller, more focused relevant set reduces ranking complexity, improving coverage (Recall) and Precision@5.
The second round of evaluation used simulated (dummy) users to increase both the number of users and the volume of interactions, enabling a more comprehensive assessment of recommendation accuracy. This round complements the first by overcoming small-sample limitations and was designed to measure the effect of increasing users and interactions on performance. For each dummy user, interactions were generated programmatically using the scenario ground truth. Each dummy user viewed between two and five datasets that fully or partially met the scenario conditions, downloaded one or two datasets that fully met the scenario conditions, and applied spatial and temporal filters sampled within the Nunavik boundary and the year 2023. Tasks mirrored the first round. Figure 11 illustrates the results of this test.
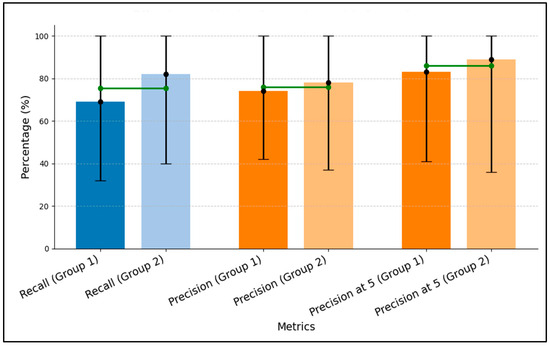
Figure 11.
Evaluation results of the recommender system across scenarios, showing mean values of precision, recall, and precision@5 with ranges indicating minimum and maximum observed outcomes for dummy users.
As shown in Figure 11, for simulated users, Group 2 achieved higher mean Recall (82% vs. 69%), Precision (78% vs. 74%), and Precision@5 (89% vs. 83%) than Group 1. This difference is consistent with the relevant-set sizes summarized in Table 3: Group 2′s scenario contains fewer datasets that meet all criteria, which reduces ranking complexity and enables better coverage of relevant items and stronger prioritization.
As summarized in Table 4, using fifty dummy users per scenario increased the number and diversity of interactions, supporting more accurate and relevant recommendations.
Table 4.
Performance metrics (Recall, Precision, and Precision@5) for real and dummy users across different scenarios.
4.5. Optimizing the Parameters of the Recommendation System
Optimizing the parameters of a recommendation system is necessary to fine-tune how the system interprets user interactions and generates recommendations [80]. Examples of such parameters in this system include the weights assigned to different types of user interactions (e.g., viewing datasets before applying filters, viewing datasets after applying filters, and downloading datasets, represented by the coefficients α, β, and γ, respectively) and the number of iterations for training algorithms like ALS. This fine-tuning ensures that the system delivers more accurate and relevant recommendations, aligning better with actual user preferences and behaviors observed during these interactions.
The coefficients α, β, and γ in Equation (1) are used to weight the different types of user interactions with datasets: viewing datasets before applying filters, viewing datasets after applying filters, and downloading datasets, respectively. These weights determine the influence of each type of action on the overall feedback score for a given query.
Through testing with various combinations, where α was consistently set to 1, β ranged from 1.25 to 2, and γ varied from 2 to 5, the optimal values were determined to be α = 1, β = 1.75, and γ = 3. This combination provided the highest recall and precision in testing the recommender system as shown in Figure 12. Therefore, these values were selected for use in the implementation of the system.
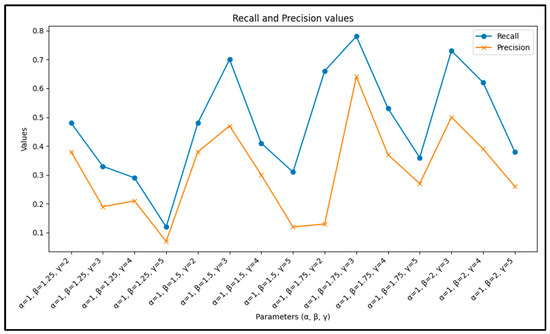
Figure 12.
Obtaining the coefficients γ, β, and α by comparing the ultimate performance of recommendation system.
4.6. Finding the Best Iteration for Training the ALS
In developing the recommender system, it was essential to determine the optimal number of iterations for the ALS. This process is necessary because the number of iterations directly impacts both the accuracy of the model, and the computational resources required. To address this, a conditional break was implemented within the ALS training loop, designed to terminate the process once the mean variance of cosine similarity between users fell below a predefined threshold of 0.01. The use of cosine similarity in this context is essential because it directly measures the similarity between users based on the factorized matrices produced by ALS. By tracking the variance in cosine similarity across iterations, we can assess whether the model is making meaningful improvements. A lower variance indicates that the user vectors in the reduced matrix are stabilizing, meaning that the model’s understanding of user preferences has reached a reliable level.
Figure 13 illustrates the relationship between the number of iterations and the mean variance of cosine similarity in the ALS algorithm. As shown, the variance decreases steadily with each iteration, but after a certain point (50 iterations in this case), further reductions are minimal. This indicates that the model has reached a point where additional iterations would not significantly enhance the user similarity metrics, validating the decision to use the predefined threshold as a stopping criterion.
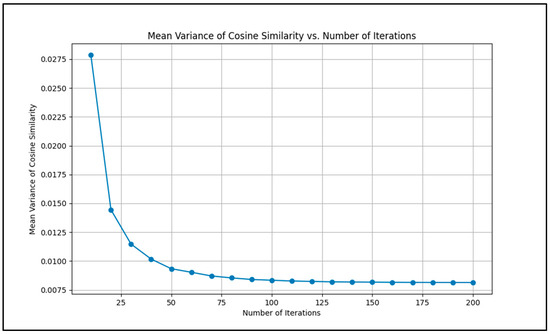
Figure 13.
Relationship between the mean variance of cosine similarity and the number of iterations in the ALS algorithm.
5. Conclusions
This paper presents a semantic recommendation system designed to enhance geospatial data discovery and selection in geoportals by providing personalized suggestions. Unlike traditional systems that rely heavily on metadata, this recommender system leverages user behavior and collective knowledge to provide dataset recommendations, making it particularly effective in scenarios where metadata may be incomplete or inadequate.
To tackle scalability issues, the system clusters users based on the semantic similarity of their search terms by taking advantage of the GCMD vocabulary defined in the SKOS ontology. This clustering reduces the computational load by allowing the system to process smaller, more homogeneous user groups rather than comparing every user with every dataset. By increasing data density within each cluster, this method also alleviates the sparsity problem, ensuring that the system can still generate accurate and meaningful recommendations even with limited interaction data. The cold-start problem is addressed by associating new users with clusters of existing users who have similar search terms. Additionally, rule mining is employed to refine recommendations by uncovering correlations between different user queries, enabling the system to recommend datasets that are highly relevant to the users’ tasks.
Across these evaluation rounds, the findings indicate that recommendation quality improves as the user count increases. With more users, the system observes more diverse behavioral patterns, learns more stable associations, and yields higher recall, precision, and Precision@K. Variability in performance was primarily due to small user cohorts, underscoring the importance of scaling the user base for reliable recommendations.
Certain aspects of the system’s evaluation highlight areas for further investigation. First, in tracking user behavior, the system monitored the time users spent browsing each dataset; however, no correlation was found between browsing time and implicit feedback. This suggests that time spent viewing a dataset may not reliably indicate user interest. Future studies could explore this relationship further with a larger user base to determine if any significant patterns emerge. Additionally, while dummy users were utilized to simulate user interactions and increase the dataset size for evaluation, the sample size remains relatively small compared to real-world scenarios. Testing the recommendation system within active SDI geoportals could provide valuable insights into its real-world applicability, contributions, and scalability.
Beyond these points, several broader limitations suggest directions for future research. The current evaluation focuses on relevance-oriented metrics (precision, recall, and precision@k) that match the scenario-based ground truth design. Extending the evaluation protocol with measures that capture diversity, novelty, and coverage would offer a more comprehensive view of recommendation quality, particularly for complementary task-based dataset suggestions. Moreover, the reported results correspond to a single, fixed configuration of the main model components, selected based on prior work and preliminary configuration checks. A more systematic analysis of how alternative configurations and design choices affect effectiveness and robustness would further strengthen the framework. Finally, the approach operates within the classical recommender systems paradigm combined with ontology-based semantics. An important avenue for future work is to investigate how transformer-based models and large language models for geospatial search could be integrated with this semantic collaborative filtering framework, for example by enriching metadata, generating semantically informed candidate sets, or assisting users in formulating task descriptions that can be exploited by the recommender.
Author Contributions
Conceptualization, methodology, and validation, Amirhossein Vahdat; investigation, software, formal analysis, and writing—original draft preparation, Amirhossein Vahdat; writing—review and editing, Amirhossein Vahdat, Jacynthe Pouliot, and Thierry Badard; supervision, Jacynthe Pouliot and Thierry Badard. All authors have read and agreed to the published version of the manuscript.
Funding
This research was funded by the Sentinel North program of Université Laval (via a research fund to R. Fortier and T. Badard), made possible, in part, thanks to funding from the Canada First Research Excellence Fund, under project number GF522489.
Data Availability Statement
The data presented in this study are available on request from the corresponding author due to privacy and confidentiality restrictions.
Acknowledgments
The authors wish to acknowledge the other members of the Working Group ‘Qaujjikairit project’, especially Richard Fortier.
Conflicts of Interest
The authors declare no conflict of interest.
References
- Sambasivan, N.; Arriaga, R.I.; Prabhakar, A.; Kamar, E.; Chayes, J. Everyone wants to do the model work, not the data work. In Proceedings of the 2021 CHI Conference Human Factors Computing Systems, Yokohama, Japan, 8–13 May 2021; ACM: New York, NY, USA, 2021. [Google Scholar]
- Brickley, D.; Burgess, M.; Noy, N. Google Dataset Search: Building a search engine for datasets in an open web ecosystem. In Proceedings of the World Wide Web Conference, San Francisco, CA, USA, 13–17 May 2019; pp. 1365–1375. [Google Scholar]
- Stall, S.; Robinson, E.; Wyborn, L.; Yarmey, L.R.; Parsons, M.A.; Lehnert, K.; Cutcher-Gershenfeld, J.; Nosek, B.; Hanson, B. Enabling FAIR Data Across the Earth and Space Sciences. Eos 2017, 98. [Google Scholar] [CrossRef]
- Stall, S.; Cruse, P.; Cousijn, H.; Cutcher-Gershenfeld, J.; de Waard, A.; Hanson, B.; Heber, J.; Lehnert, K.; Parsons, M.; Robinson, E.; et al. Data sharing and citations: New author guidelines promoting open and FAIR data in the Earth, space, and environmental sciences. Sci. Ed. 2018, 41, 83–87. [Google Scholar] [CrossRef]
- Van Loenen, B.; Grothe, M.J.M. INSPIRE Empowers Re-Use of Public Sector Information. Int. J. Spat. Data Infrastruct. Res. 2014, 9, 86–106. [Google Scholar] [CrossRef]
- Chapman, A.; Simperl, E.; Koesten, L.; Konstantinidis, G.; Ibáñez, L.-D.; Kacprzak, E.; Groth, P. Dataset search: A survey. Knowl. Eng. Rev. 2020, 35, e2. [Google Scholar] [CrossRef]
- Nativi, S.; Mazzetti, P.; Santoro, M.; Papeschi, F.; Craglia, M.; Ochiai, O. Big Data challenges in building the Global Earth Observation System of Systems. Environ. Model. Softw. 2015, 68, 1–26. [Google Scholar] [CrossRef]
- Goldstein, J.C.; Mayernik, M.S.; Ramapriyan, H.K. Identifiers for Earth Science Data Sets: Where We Have Been and Where We Need to Go. Data Sci. J. 2017, 16, 23. [Google Scholar] [CrossRef][Green Version]
- National Aeronautics and Space Administration. NASA Homepage. Available online: https://www.nasa.gov/ (accessed on 13 October 2025).
- Environment and Climate Change Canada. Environment and Climate Change Canada Homepage. Available online: https://www.canada.ca/en/environment-climate-change.html (accessed on 13 October 2025).
- European Space Agency. ESA Homepage. Available online: https://www.esa.int/ (accessed on 13 October 2025).
- Geoscience Australia. Digital Earth Australia—Open Data Cube. Available online: https://www.dea.ga.gov.au/about/open-data-cube (accessed on 13 October 2025).
- Gao, F.; Yue, P.; Cao, Z.; Zhao, S.; Shangguan, B.; Jiang, L.; Hu, L.; Fang, Z.; Liang, Z. A Multi-Source Spatio-Temporal Data Cube for Large-Scale Geospatial Analysis. Int. J. Geogr. Inf. Sci. 2022, 36, 1853–1884. [Google Scholar] [CrossRef]
- GeoCube Portal. Available online: http://www.openearth.org.cn/en-US (accessed on 13 October 2025).
- ISO 19115-1:2014; Geographic Information—Metadata—Part 1: Fundamentals. International Organization for Standardization: Geneva, Switzerland, 2014.
- ISO 19115-2:2019; Geographic Information—Metadata—Part 2: Extensions for Acquisition and Processing. International Organization for Standardization: Geneva, Switzerland, 2019.
- United Nations Committee of Experts on Global Geospatial Information Management. Future Trends in Geospatial Information Management: The Five to Ten Year Vision; United Nations: London, UK, 2013.
- Quarati, A.; De Martino, M.; Rosim, S. Geospatial Open Data Usage and Metadata Quality. ISPRS Int. J. Geo-Inf. 2021, 10, 30. [Google Scholar] [CrossRef]
- Neumaier, S.; Umbrich, J.; Polleres, A. Automated Quality Assessment of Metadata across Open Data Portals. J. Data Inf. Qual. 2016, 8, 2. [Google Scholar] [CrossRef]
- W3C; OGC. Spatial Data on the Web Best Practices; W3C Working Group Note and OGC Best Practice. 28 September 2017. Available online: https://www.w3.org/TR/sdw-bp/ (accessed on 19 September 2025).
- Jiang, Y.; Li, Y.; Yang, C.; Hu, F.; Armstrong, E.M.; Huang, T.; Moroni, D.; McGibbney, L.J.; Greguska, F.; Finch, C.J. A smart web-based geospatial data discovery system with oceanographic data as an example. ISPRS Int. J. Geo-Inf. 2018, 7, 62. [Google Scholar] [CrossRef]
- Kacprzak, E.; Koesten, L.; Ibáñez, L.-D.; Blount, T.; Tennison, J.; Simperl, E. Characterising dataset search—An analysis of search logs and data requests. J. Web Semant. 2019, 55, 37–55. [Google Scholar] [CrossRef]
- Vockner, B.; Mittlböck, M. Geo-enrichment and semantic enhancement of metadata sets to augment discovery in geoportals. ISPRS Int. J. Geo-Inf. 2014, 3, 345–367. [Google Scholar] [CrossRef]
- Mai, G.; Janowicz, K.; Prasad, S.; Shi, M.; Cai, L.; Zhu, R.; Regalia, B.; Lao, N. Semantically-enriched search engine for geoportals: A case study with ArcGIS Online. arXiv 2020, arXiv:2003.06561. [Google Scholar] [CrossRef]
- Zhang, F.; Lu, Q.; Du, Z.; Chen, X.; Cao, C. A comprehensive overview of RDF for spatial and spatiotemporal data management. Knowl. Eng. Rev. 2021, 36, e10. [Google Scholar] [CrossRef]
- Athanasis, N.; Kalabokidis, K.; Vaitis, M.; Soulakellis, N. Towards a semantics-based approach in the development of geographic portals. Comput. Geosci. 2009, 35, 301–308. [Google Scholar] [CrossRef]
- Frey, J.; Müller, K.; Hellmann, S.; Rahm, E.; Vidal, M.E. Evaluation of metadata representations in RDF stores. Semant. Web 2019, 10, 205–229. [Google Scholar] [CrossRef]
- Ricci, F.; Rokach, L.; Shapira, B. Introduction to recommender systems handbook. In Recommender Systems Handbook; Ricci, F., Rokach, L., Shapira, B., Kantor, P., Eds.; Springer: Boston, MA, USA, 2011; pp. 1–35. [Google Scholar]
- Aggarwal, C.C. Recommender Systems; Springer: Cham, Switzerland, 2016. [Google Scholar]
- Zabala, A.; Masó, J.; Bastin, L.; Giuliani, G.; Pons, X. Geospatial User Feedback: How to Raise Users’ Voices and Collectively Build Knowledge at the Same Time. ISPRS Int. J. Geo-Inf. 2021, 10, 141. [Google Scholar] [CrossRef]
- Ziaimatin, H.; Nili, A.; Barros, A. Reducing Consumer Uncertainty: Towards an Ontology for Geospatial User-Centric Metadata. ISPRS Int. J. Geo-Inf. 2020, 9, 488. [Google Scholar] [CrossRef]
- Dareshiri, S.; Farnaghi, M.; Sahelgozin, M. A recommender geoportal for geospatial resource discovery and recommendation. J. Spat. Sci. 2019, 64, 49–71. [Google Scholar] [CrossRef]
- Vockner, B.; Belgiu, M.; Mittlböck, M. Recommender-based enhancement of discovery in geoportals. Int. J. Spat. Data Infrastruct. Res. 2012, 7, 441–463. [Google Scholar]
- NASA EOSDIS. American Customer Satisfaction Index (ACSI) Reports for NASA Earth Science Data Systems. Available online: https://www.earthdata.nasa.gov/eosdis/system-performance/acsi-reports (accessed on 13 October 2025).
- European Environment Agency. Copernicus Land Monitoring Service (CLMS) Annual Feedback Surveys, 2020–2024. Available online: https://land.copernicus.eu/ (accessed on 13 October 2025).
- European Space Agency. Copernicus Data Space Ecosystem (CDSE) User Satisfaction Survey 2025. Available online: https://remotesensing.vito.be/news/cdse-user-satisfaction-survey-2025 (accessed on 13 October 2025).
- Adomavicius, G.; Tuzhilin, A. Toward the next generation of recommender systems: A survey of the state of the art and possible extensions. IEEE Trans. Knowl. Data Eng. 2005, 17, 734–749. [Google Scholar] [CrossRef]
- Burke, R. Hybrid recommender systems: Survey and experiments. User Model. User-Adap. Interact. 2002, 12, 331–370. [Google Scholar] [CrossRef]
- Vahdat, A. A New Approach to Enhance Geospatial Data Selection in Geoportals: Application for Supporting Natural Hazard Early Warning System in Nunavik, Québec. Ph.D. Thesis, Université Laval, Québec, QC, Canada, 2025. [Google Scholar]
- Jannach, D.; Zanker, M.; Felfernig, A.; Friedrich, G. Recommender Systems: An Introduction; Cambridge University Press: Cambridge, UK, 2010. [Google Scholar]
- Lops, P.; de Gemmis, M.; Semeraro, G. Content-Based Recommender Systems: State of the Art and Trends. In Recommender Systems Handbook; Ricci, F., Rokach, L., Shapira, B., Kantor, P., Eds.; Springer: Boston, MA, USA, 2011; pp. 73–105. [Google Scholar] [CrossRef]
- Burke, R. Knowledge-Based Recommender Systems. In Encyclopedia of Library and Information Science; Kent, A., Ed.; Marcel Dekker: New York, NY, USA, 2000; Volume 69, pp. 180–200. [Google Scholar]
- Felfernig, A.; Burke, R. Constraint-Based Recommender Systems: Technologies and Research Issues. In Proceedings of the 10th International Conference on Electronic Commerce (ICEC ’08), Innsbruck, Austria, 19–22 August 2008; ACM: New York, NY, USA, 2008; pp. 1–10. [Google Scholar]
- Nogueras-Iso, J.; Lacasta, J.; Ureña-Cámara, M.A.; Ariza-López, F.J. Quality of Metadata in Open Data Portals. IEEE Access 2021, 9, 60364–60382. [Google Scholar] [CrossRef]
- Miles, A.; Bechhofer, S. SKOS Simple Knowledge Organization System Reference; W3C Recommendation. 18 August 2009. Available online: https://www.w3.org/TR/skos-reference/ (accessed on 13 October 2025).
- Li, Y.; Jiang, Y.; Yang, C.; Yu, M.; Kamal, L.; Armstrong, E.M.; Huang, T.; Moroni, D.; McGibbney, L.J. Improving search ranking of geospatial data based on deep learning using user behavior data. Comput. Geosci. 2020, 142, 104520. [Google Scholar] [CrossRef]
- Del Olmo, F.H.; Gaudioso, E. Evaluation of recommender systems: A new approach. Expert Syst. Appl. 2008, 35, 790–804. [Google Scholar] [CrossRef]
- Ali, S.I.M.; Majeed, S.S. A review of collaborative filtering recommendation system. MJPS 2021, 8, 120–130. [Google Scholar] [CrossRef]
- Amin, S.A.; Philips, J.; Tabrizi, N. Current trends in collaborative filtering recommendation systems. In SERVICES 2019: 15th World Congress on Services; Proceedings of the SCF 2019, San Diego, CA, USA, 25–30 June 2019; Springer: Cham, Switzerland, 2019; pp. 46–60. [Google Scholar]
- Fkih, F. Similarity measures for collaborative filtering-based recommender systems: Review and experimental comparison. J. King Saud Univ.—Comput. Inf. Sci. 2022, 34, 7645–7669. [Google Scholar] [CrossRef]
- Suganeshwari, G.; Syed Ibrahim, S.P. A survey on collaborative filtering based recommendation system. In Smart Innovation, Systems and Technologies, Proceedings of the 3rd International Symposium on Big Data and Cloud Computing Challenges, Vellur, India, 10–11 March 2016; Springer: Cham, Switzerland, 2016; pp. 503–518. [Google Scholar]
- Koren, Y. Collaborative filtering with temporal dynamics. In Proceedings of the 15th ACM SIGKDD International Conference on Knowledge Discovery and Data Mining, Paris, France, 28 June–1 July 2009; ACM: New York, NY, USA, 2009; pp. 447–456. [Google Scholar]
- Zhang, S.; Yao, L.; Sun, A.; Tay, Y. Deep learning based recommender system: A survey and new perspectives. ACM Comput. Surv. 2019, 52, 5. [Google Scholar] [CrossRef]
- Bobadilla, J.; Alonso, S.; Hernando, A. Deep learning architecture for collaborative filtering recommender systems. Appl. Sci. 2020, 10, 2441. [Google Scholar] [CrossRef]
- Ying, R.; He, R.; Chen, K.; Eksombatchai, P.; Hamilton, W.L.; Leskovec, J. Graph convolutional neural networks for web-scale recommender systems. In Proceedings of the 24th ACM SIGKDD International Conference on Knowledge Discovery & Data Mining, London, UK, 19–23 August 2018; ACM: New York, NY, USA; pp. 974–983. [Google Scholar]
- Shapira, B.; Rokach, L.; Ricci, F. (Eds.) Recommender Systems Handbook, 3rd ed.; Springer: Cham, Switzerland, 2022. [Google Scholar]
- Albertoni, R.; De Martino, M.; Podestà, P.; Abecker, A.; Wössner, R.; Schnitter, K. LusTRE: A framework of linked environmental thesauri for metadata management. Earth Sci. Inform. 2018, 11, 525–544. [Google Scholar] [CrossRef]
- Abecker, A.; Schnitter, K.; Wössner, R.; Albertoni, R.; De Martino, M.; Podestà, P. Latest Developments of the Linked Thesaurus Framework for the Environment (LusTRE). In Proceedings of the 29th International Conference on Informatics for Environmental Protection & 3rd International Conference on ICT for Sustainability (EnviroInfo/ICT4S 2015), Copenhagen, Denmark, 7–9 September 2015; pp. 137–141. [Google Scholar]
- Subirats-Coll, I.; Kolshus, K.; Turbati, A.; Stellato, A.; Mietzsch, E.; Martini, D.; Zeng, M. AGROVOC: The linked data concept hub for food and agriculture. Comput. Electron. Agric. 2022, 196, 105965. [Google Scholar] [CrossRef]
- Wenige, L.; Ruhland, J. SKOS-Based Concept Expansion for LOD-Enabled Recommender Systems. In Proceedings of the 12th International Conference on Metadata and Semantics Research (MTSR 2018), Limassol, Cyprus, 23–26 October 2018; Springer: Cham, Switzerland, 2019. [Google Scholar]
- Sheridan, P.; Onsjö, M.; Becerra, C.; Jimenez, S.; Dueñas, G. An Ontology-Based Recommender System with an Application to the Star Trek Television Franchise. Future Internet 2019, 11, 182. [Google Scholar] [CrossRef]
- Rupasingha, R.A.H.M.; Paik, I. Alleviating Sparsity by Specificity-Aware Ontology-Based Clustering for Improving Web Service Recommendation. IEEJ Trans. Electr. Electron. Eng. 2019, 14, 1507–1517. [Google Scholar] [CrossRef]
- Bagherifard, K.; Rahmani, M.; Nilashi, M.; Rafe, V. Performance Improvement for Recommender Systems Using Ontology. Telemat. Inform. 2017, 34, 1772–1792. [Google Scholar] [CrossRef]
- Cena, F.; Likavec, S.; Osborne, F. Anisotropic Propagation of User Interests in Ontology-Based User Models. Inf. Sci. 2013, 250, 40–60. [Google Scholar] [CrossRef][Green Version]
- Cantador, I.; Castells, P.; Bellogín, A. An Enhanced Semantic Layer for Hybrid Recommender Systems: Application to News Recommendation. Int. J. Semant. Web Inf. Syst. 2011, 7, 44–78. [Google Scholar] [CrossRef]
- Vockner, B.; Richter, A.; Mittlböck, M. From geoportals to geographic knowledge portals. ISPRS Int. J. Geo-Inf. 2013, 2, 256–275. [Google Scholar] [CrossRef]
- Jiang, Y.; Li, Y.; Yang, C.; Liu, K.; Armstrong, E.M.; Huang, T.; Moroni, D.; Finch, C. A comprehensive methodology for discovering semantic relationships among geospatial vocabularies using oceanographic data discovery as an example. Int. J. Geogr. Inf. Sci. 2017, 31, 2310–2328. [Google Scholar] [CrossRef]
- Miao, L.; Liu, C.; Fan, L.; Kwan, M.-P. An OGC Web Service Geospatial Data Semantic Similarity Model for Improving Geospatial Service Discovery. Open Geosciences 2021, 13, 245–261. [Google Scholar] [CrossRef]
- Choi, K.; Yoo, D.; Kim, G.; Suh, Y. A hybrid online-product recommendation system: Combining implicit rating-based collaborative filtering and sequential pattern analysis. Electron. Commer. Res. Appl. 2012, 11, 309–317. [Google Scholar] [CrossRef]
- Lee, S.K.; Cho, Y.H.; Kim, S.H. Collaborative filtering with ordinal scale-based implicit ratings for mobile music recommendations. Inf. Sci. 2010, 180, 2142–2155. [Google Scholar] [CrossRef]
- Mekouar, L.; Iraqi, Y.; Damaj, I. A global user profile framework for effective recommender systems. Multimed. Tools Appl. 2024, 83, 50711–50731. [Google Scholar] [CrossRef]
- Shokrzadeh, Z.; Feizi-Derakhshi, M.R.; Balafar, M.A.; Mohasefi, J.B. Knowledge graph-based recommendation system enhanced by neural collaborative filtering and knowledge graph embedding. Ain Shams Eng. J. 2024, 15, 102263. [Google Scholar] [CrossRef]
- Djidjev, H.N.; Pantziou, G.E.; Zaroliagis, C.D. Computing shortest paths and distances in planar graphs. In Proceedings of the 18th International Colloquium on Automata, Languages and Programming, Madrid, Spain, 8–12 July 1991; pp. 327–338. [Google Scholar]
- W3C. OWL Web Ontology Language Guide; W3C Recommendation. 2004. Available online: https://www.w3.org/TR/2004/REC-owl-guide-20040210 (accessed on 13 October 2025).
- W3C. OWL 2 Web Ontology Language—Document Overview; W3C Recommendation. 2012. Available online: https://www.w3.org/TR/owl2-overview (accessed on 13 October 2025).
- Global Change Master Directory (GCMD). GCMD Keywords, Version 22.5. Available online: https://forum.earthdata.nasa.gov/app.php/tag/GCMD+Keywords (accessed on 13 October 2025).
- Li, W. Lowering the barriers for accessing distributed geospatial big data to advance spatial data science: The PolarHub solution. Ann. Am. Assoc. Geogr. 2018, 108, 773–793. [Google Scholar] [CrossRef]
- Vahdat, A.; Badard, T.; Pouliot, J. Development of an ontology-based framework to enhance geospatial data discovery and selection in geoportals for natural-hazard early warning systems. ISPRS Int. J. Geo-Inf. 2025, 14, 369. [Google Scholar] [CrossRef]
- Fayyaz, Z.; Ebrahimian, M.; Nawara, D.; Ibrahim, A.; Kashef, R. Recommendation systems: Algorithms, challenges, metrics, and business opportunities. Appl. Sci. 2020, 10, 7748. [Google Scholar] [CrossRef]
- Shani, G.; Gunawardana, A. Evaluating recommendation systems. In Recommender Systems Handbook; Ricci, F., Rokach, L., Shapira, B., Eds.; Springer: Boston, MA, USA, 2011; pp. 257–297. [Google Scholar]
- Silveira, T.; Zhang, M.; Lin, X.; Liu, Y.; Ma, S. How good is your recommender system? A survey on evaluations in recommendation. Int. J. Mach. Learn. Cybern. 2019, 10, 813–831. [Google Scholar] [CrossRef]
- Herlocker, J.L.; Konstan, J.A.; Terveen, L.G.; Riedl, J.T. Evaluating collaborative filtering recommender systems. ACM Trans. Inf. Syst. 2004, 22, 5–53. [Google Scholar] [CrossRef]


Disclaimer/Publisher’s Note: The statements, opinions and data contained in all publications are solely those of the individual author(s) and contributor(s) and not of MDPI and/or the editor(s). MDPI and/or the editor(s) disclaim responsibility for any injury to people or property resulting from any ideas, methods, instructions or products referred to in the content. |
© 2025 by the authors. Published by MDPI on behalf of the International Society for Photogrammetry and Remote Sensing. Licensee MDPI, Basel, Switzerland. This article is an open access article distributed under the terms and conditions of the Creative Commons Attribution (CC BY) license (https://creativecommons.org/licenses/by/4.0/).