Abstract
The unbalanced allocation of educational resources in kindergartens across China has attracted increasing attention from scholars and the public. However, few studies have examined their spatially imbalanced distribution and its influencing factors. Based on point-of-interest data, this study systematically analyzes the spatially imbalanced distribution characteristics of kindergartens in China from a multiscale perspective using the spatial analysis and spatial regression model to identify the factors influencing its formation pattern. The results reveal that the distribution pattern is “more in the southeast and fewer in the northwest,” with the Hu Huanyong Line serving as the boundary. Kernel density analysis revealed that areas with a density greater than 0.34 individual/km2 were primarily concentrated in provincial capitals and major metropolitan areas, exhibiting a gradual decrease outward from these core zones. It also reveals a “large dispersion and small aggregation”, with a concentration around mega-cities, urban agglomerations, and provincial capitals. Significant spatial auto-correlations were found at all administrative levels, with hotspots distributed in northeast, north, and southeast China. The spatial determinants of kindergartens distribution in China exhibited significant spatial heterogeneity. The findings provide a reference in improving the spatial pattern and the state of unbalanced development of kindergarten education in China, as well as scientific suggestions to optimize resource allocation.
1. Introduction
Educational equity is a crucial indicator of common prosperity, and equitable educational resource development is a fundamental component of China’s educational policy framework [1]. China’s transition from a moderately prosperous society to one of common prosperity necessitates the expansion of access to early childhood education (ECE) and the enhancement of educational equity [2,3]. ECE equity serves not only as the cornerstone of social justice but also as the critical starting point for lifelong equality. The growing societal demand for ECE, coupled with persistent equity challenges, has transformed preschool education into both a potential equalizer and an inadvertent driver of social stratification. This underscores the need for transparent and equitable kindergarten environments that ensure quality and fairness when dealing with issues that have become focal points in contemporary Chinese educational discourse. The efficient allocation of preschool resources depends on the rational spatial distribution of educational facilities, requiring adherence to the principles of educational equity, systematic development, and benefit optimization [4,5]. However, current empirical studies reveal obviously spatial imbalances and disproportionate resource distribution in China’s ECE system [6,7,8], which are becoming increasingly pronounced amidst China’s rapid socioeconomic development. The geographical maldistribution of ECE resources has precipitated institutional differentiation among kindergartens, resulting in heterogeneous educational quality that adversely affects children’s academic outcomes, potential development, and long-term prospects. Spatial imbalance in kindergarten distribution represents a critical challenge requiring immediate policy intervention. Addressing this inequity is essential in realizing China’s goals of educational justice and sustainable social development [1,9].
As the main carrier of preschool education, the research on the spatial distribution characteristics and influencing factors of kindergartens is vital for education planning and social equity. Academic research on the allocation of educational resources represents a core domain in contemporary scholarship, generally focusing on: (1) the functional significance and implications of rational spatial distribution, (2) characteristics of current resource distribution patterns, (3) determinants influencing resource allocation, and (4) strategies for resource optimization [10,11,12,13,14,15,16]. Although many previous studies have been conducted regarding kindergartens, few have revealed the uneven distribution of kindergartens at the national scale and its spatial determinants in China.
Therefore, this study investigates the spatial equilibrium and spatial determinants of kindergarten education in China through a multiscale analytical framework encompassing provincial, municipal, and county levels. It leverages spatial analysis of kindergarten point-of-interest (POI) data to systematically examine the spatial distribution patterns, regional interdependencies, and driving factors of educational resource allocation. It employs integrated spatial analysis combining kernel density estimation (KDE), Moran’s I index, and multiscale geographically weighted regression (MGWR) modeling. Kernel density mapping quantitatively demonstrates the “core-periphery” disparity in kindergarten distribution. Through global Moran’s I and Hot Spot Analysis, spatial autocorrelation patterns in kindergarten resource distribution can be identified, revealing homogeneity characteristics within spatial units and heterogeneity patterns across regions, while spatial regression modeling elucidates the key external spatial determinants influencing these distribution patterns.
2. Literature Review
2.1. Unbalanced Spatial Distribution of Kindergarten
As a foundational component of education and social development, ECE has consequently garnered growing scholarly attention. Consequently, a substantial body of research has emerged focusing on the spatial allocation of ECE resources [12,17,18]. For instance, Li and Huang employed Geographic Information System (GIS) technology to analyze preschool resource distribution in Beijing’s Xicheng District, revealing systemic deficiencies in kindergarten allocation, including suboptimal spatial configurations and disproportionate clustering of high-quality institutions [19]. Zheng et al. conducted a GIS-based evaluation of public preschool resources in Shanghai, identifying imbalances in quantitative availability and qualitative standards [20,21] and highlighting pronounced spatial agglomeration patterns and structurally irrational distribution frameworks, with resource density concentrated in urban cores and systemic undersupply plaguing peripheral areas [22]. Despite ongoing government interventions, a quality gap persists in China’s inclusive kindergartens, highlighting issues of resource allocation efficiency [23]. There are significant disparities in the regional accessibility of high-quality educational resources. Li and Wang’s GIS-based analysis of Guangzhou’s preschool education system identified spatial imbalance, resource scarcity, and qualitative deficits in high-quality provision [24]. Huo and Wang employed Gini coefficient analysis to reveal significant regional disparities in fiscal allocations [25], revealing that while western provinces receive substantially greater governmental investment in ECE, inefficient fund utilization perpetuates their disadvantaged position in resource allocation hierarchies [17,18,26].
Methodologically, common approaches include survey instruments (e.g., questionnaires), comparative analyses, and efficiency evaluation techniques such as data envelopment analysis [27,28]. While some studies have employed quantitative indicators including coefficient of variation (CV), Gini coefficient, and Theil index at the administrative scale to assess the fairness of resource allocation, there remains a lack of detailed evaluation at the local spatial aggregation. Specifically, KDE and exploratory spatial data analysis are still conspicuously underutilized. Empirical analyses reveal that rational spatial distribution of educational infrastructure catalyzes structural optimization in education systems, fostering balanced regional development and advancing educational equity [29]. Current studies reveal persistent spatial inequalities in China’s ECE system across provincial, municipal, and county administrative divisions, manifesting distinctive geographical patterns that warrant systematic investigation. The extent of spatial dependency and spatial determinants in kindergarten distribution shows critical knowledge gaps in educational geography. Investigating the regional disparities patterns and spatial determinants of ECE is significant for educational equity and the holistic advancement of ECE nationwide.
2.2. Spatial Determinants of Kindergarten Distribution
Contemporary scholarship has largely overlooked the role of spatial elements in shaping the distribution of educational resources. The spatial distribution of kindergartens is not random but is influenced by a combination of various socioeconomic, natural environment, and policy factors [1,17]. In terms of socioeconomic factors, aspects such as population density, economic development levels, family socioeconomic status, and transportation accessibility affect the spatial distribution of kindergartens [30,31,32,33]. Specifically, densely populated areas have a large and consistently stable number of preschoolers, leading to a high demand for preschool education resources [30,31]. Therefore, residential population is one of the significant factors influencing the spatial distribution of basic education resources, including kindergartens [30]. Additionally, changes in the number of preschool children directly affect the demand for kindergarten teachers, which in turn influences the overall layout and quantity of kindergartens [32]. Economically developed areas typically have more substantial educational investments and better-equipped educational facilities. Studies have found that factors such as economic development levels, registered capital of enterprises, and per capita disposable income can influence the allocation of basic education resources [30]. Further transportation accessibility is a key consideration in kindergarten. Road density and public transport route coverage affect the convenience for residents to send their children to kindergarten [33]. Well-developed transportation infrastructure can expand the service range of kindergartens, thereby influencing their spatial distribution. Furthermore, certain natural factors, such as topography, have also been proven to affect the distribution of kindergartens [34]. In terms of policy factors, education policies, urban planning, and land use policies, among others, can also influence the distribution of kindergartens [35]. Although previous studies have explored and analyzed the reasons for the spatial distribution of kindergartens, few have utilized the GTWR model to reveal the spatial non-stationarity of these influencing factors.
3. Methods
3.1. Data Sources
This study systematically integrated multi-source geospatial datasets to assess the spatial distribution of ECE resources in China. The primary dataset comprised POI records of kindergarten facilities, collected through Application Programming Interface extraction from Amap (AutoNavi Map 3.3.1) in December 2019. First, a rigorous data cleaning process was conducted, which included removing POIs with significant information gaps, eliminating duplicate POIs, and standardizing classification information. Additionally, POIs with ambiguous or incorrect classifications underwent secondary verification based on field information. These steps ensured the high quality of the final dataset. Based on the processed data, a comprehensive geographic database containing 190,964 validated kindergarten locations was established (Figure 1).
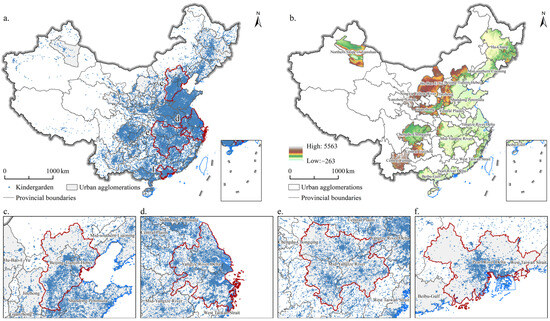
Figure 1.
Location of kindergartens and urban agglomerations in China at the end of 2019. (a) represents the spatial distribution of kindergarten in China; (b) represents the spatial distribution of urban agglomerations in China; (c–f) represent the spatial distribution of kindergarten in urban agglomerations of the Beijing-Tianjin-Hebei, the Yangtze River Delta, the middle reaches of the Yangtze River, and the Pearl River Delta.
The data sources for the influencing factors are described below. Socioeconomic and environmental variables were obtained from national databases. Demographic statistics, including permanent population figures, were derived from the Seventh National Population Census (2020). Economic indicators and average elevation (1000 m resolution) were acquired from the Resource and Environment Science and Data Center (RESDC; https://www.resdc.cn/). Urban land use parameters, specifically the proportion of construction land area, were extracted from the China Land Use Remote Sensing Monitoring Dataset (30 m resolution). Transportation network data were obtained from the National Geomatics Center of China (NGCC; https://www.ngcc.cn/). Administrative boundaries at provincial, prefectural, and county levels were derived from the NGCC.
3.2. Analysis
3.2.1. Kernel Density Estimation
The KDE algorithm constructs a moving window that systematically scans the study area, wherein a kernel function assigns distance-weighted density values to each grid cell based on the spatial proximity of neighboring facilities [36,37]. The bandwidth parameter selection, which determines the spatial scale of analysis, is crucial. The kernel density estimator is mathematically expressed as follows:
where x is the position of the estimated point; h is the search radius, representing the space extension width of the surface with x as the source point, and h > 0; and xi represents the location of the i-th kindergarten facility point within a circle with x as the center and h as the radius. After many experiments, a search radius of 100 km was selected to generate the distribution map of the core density of kindergarten educational resources in China.
3.2.2. Exploratory Spatial Data Analysis
Spatial autocorrelation analysis, a geostatistical method to quantify spatial dependency patterns, comprises two complementary approaches: global and local measurements [38,39]. To statistically confirm whether the observed clusters were not due to random chance, we applied global Moran’s I to provide a single measure of overall spatial autocorrelation for the entire region, while the Hot Spot Analysis (Getis-Ord Gi*) statistic was used to pinpoint the specific locations of statistically significant hotspots and cold-spots. This step quantitatively validated the visual patterns suggested by the KDE analysis. Global Moran’s I index, a widely used spatial autocorrelation statistic, was calculated using the following formula:
where n is the number of samples and wij is the (i, j) element of the spatial weight matrix W. According to the first law of geography, the construction of W adopts the principle of inverse distance weight. xi and xj are the observed values of space units i and j, respectively. x is the average of the observed values. A positive Moran’s I index reflects a positive spatial correlation, while a negative value reflects a negative spatial correlation.
The Hot Spot Analysis (Getis-Ord Gi*) statistic quantifies the spatial agglomeration characteristics through the following formula:
where xi is the number of kindergartens in region i, wij is the spatial weight between elements i and j, n is the total number of regions, and Gi* is the standard deviation of kindergarten density z in each region. Higher z scores reflect closer clustering of kindergartens per 10,000 people and lower z scores reflect closer low-value clustering in the distribution of the number of kindergartens per 10,000 people in China.
3.2.3. MGWR Model
Building upon the identified spatial patterns, we employed MGWR to delve into the “why” behind these distributions. Unlike global regression models, MGWR captures the spatial non-stationarity of relationships, allowing us to model how the influences of various determinants on kindergarten distribution vary across different geographical contexts. The prominent advantage of MGWR lies in its calibration of unique bandwidths for each independent variable, which captures the distinct spatial scales at which different underlying processes operate [40,41].
First, following the spatial autocorrelation analysis of kindergarten distribution patterns across China, this study employs GWR to investigate spatial heterogeneity in spatial determinants [40]. GWR—an extension of traditional ordinary least squares (OLS) regression—constitutes a localized spatial modeling framework that incorporates geographical coordinates into regression parameters, allowing for non-stationary parameter estimation across spatial units [41]. The operational form of the GWR model can be expressed as follows:
where Yi is the global dependent variable, Xij is the observed value of the j-th variable in the i-th sample space unit; (ej, dj) is the geographical location coordinate of the j-th sample space unit, β0(ej, dj) is the constant term of regression, βi(ej, dj) is the i-th regression parameter of the j-th sample space unit, and ԑj is the random error term.
Second, when examining the factors influencing the spatial distribution of kindergartens, the GWR applies a uniform bandwidth to multiple variables for search and calculation. However, different influencing factors and the number of kindergartens are associated with varying spatial scales. Therefore, based on the GWR model, this study adopts the MGWR model to incorporate spatially stationary variables for exploring the factors affecting the spatial distribution of kindergartens, thereby better capturing the spatial heterogeneity of the independent variables and reducing errors in the regression analysis results [41]. The expression of its model is as follows:
where Pj represents the number of kindergartens at sample point j, βbwj denotes the regression coefficient of variable j at different bandwidth levels, Xij is the observed value of variable j at point i, and is the random error term. The model determines the bandwidth value based on the Akaike information criterion (AICc).
Building upon prior research examining determinants of kindergarten educational resource allocation [1,26,30,42], this study incorporates six indicators into the kindergarten provision pattern analysis: population density, road network density, elevation, built-up area proportion, distance to prefecture-level cities center, and GDP density. These variables were selected to align with the dual theoretical framework recognizing educational systems as both socioeconomic constructs and natural environment-embedded entities after the variance inflation factor test. Socioeconomic dimensions are represented by demographic pressure (population density), infrastructure development (road network density), urbanization level (proportion of construction land), regional economic output (GDP density), and administrative proximity (distance to prefecture-level city center). The elevation parameter accounts for topographic influences on service accessibility and infrastructure development costs.
4. Results
4.1. Spatial Pattern of Kindergarten Educational Resources in China
In 2019, China’s ECE infrastructure comprised a total of 190,964 kindergartens, exhibiting pronounced regional disparities (Figure 2). Geospatial analysis revealed a predominant concentration in central and eastern regions and sparse distribution patterns in western China. Nationally, the kindergarten supply metric (KPP: kindergartens per 10,000 population) was 0.95, demonstrating a distinct east-to-west decline gradient. Provincial-level analysis identified Guangxi as the region with the highest KPP (1.55), followed by Hainan (1.39) and Jiangxi (1.34). Tibet registered the lowest density at 0.21. At both the prefectural and county levels, the proportion of cities/counties with a KPP exceeding the threshold of 1.2/10,000 people surpassed 50%, while those with a KPP below 0.3/10,000 people accounted for less than 7%, indicating structural consistency across administrative scales. Meanwhile, from the perspective of distribution across different administrative levels, cities/counties with low KPP are predominantly concentrated in Yunnan, Sichuan, Tibet, Qinghai, and vast portions of Xinjiang. Conversely, elevated densities were observed in China’s northeast, north, and southeastern coastal belt.
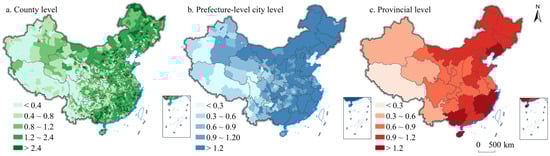
Figure 2.
Spatial distribution of kindergarten educational resources ownership per 10,000 people in China at the end of 2019.
The comparative analysis of southern and northern China reveals significant spatial heterogeneity, highlighting a distinct south–north differentiation pattern. National statistical data reveals that kindergarten distribution exhibits a distinct “south–north gradient” with intensified spatial clustering observed in southern regions. Specifically, the southern provinces comprise 103,810 registered kindergartens, 54.36% of the national total, with the spatial density reaching 432.54 per 10,000 km2, exceeding both the national average (199 per 10,000 km2) and their northern counterparts. This contrasts markedly with the northern regions, where kindergarten distribution demonstrates lower density (360.64 per 10,000 km2) and greater spatial dispersion. Northern provinces comprise 87,154 kindergartens, 45.64% of the national inventory, with facilities distributed across broader geographical areas.
Significant regional disparities were observed between eastern and western regions. Regarding service density, KPP indices were 1.12, 0.97, and 0.74 for eastern, central, and western regions, respectively, revealing three distinct tiers: the eastern and central region exceeded the national KPP average (0.95), while the western region underperformed. The density gradient exhibited a progressive east-to-west attenuation, decreasing by 15.46% from eastern to central regions and further by 31.08% toward western areas. Quantitative analysis reveals pronounced regional concentrations, with eastern provinces accounting for 47.17% (n = 90,077) of national kindergarten establishments, followed by central (31.24%, n = 59,658) and western (21.59%, n = 41,229) regions. The spatial distribution adheres to an “inverse core-periphery” model, where educational infrastructure density decreases proportionally with distance from eastern economic hubs. This concentration gradient indicates a strong correlation between regional socioeconomic development and the distribution of educational resources. Understanding the spatial distribution characteristics of kindergartens within urban agglomerations (UAs) is crucial, as it visually reveals inequalities in educational resource allocation, directly links these disparities to urban development patterns, and provides an evidence base for targeted policymaking and equitable resource distribution. As primary hubs of China’s urbanization process, UAs accommodate 148,400 kindergartens nationwide, with quantitative analysis revealing significant regional disparities in their distribution. The Beibu Gulf UAs have the highest concentration, with 8318 kindergartens 2.34, 2.33, and 2.24 times that of the Lanzhou-Xining UAs, Northern Slope of Tianshan UAs, and Central Yunnan UAs, respectively. Secondary concentrations emerge in the mid-southern Liaoning UAs (2.07), Ha-Chang (1.94), West Taiwan Strait (1.76), Central Plains (1.72), Hu-Bao-E-Yu (1.64), Beijing-Tianjin-Hebei (1.63), Yangtze River Delta (1.61), Shandong Peninsula (1.57), and Pearl River Delta UAs (1.54). Collectively, these top 10 UAs account for 59.08% of national kindergarten provision. This spatial pattern correlates with regional development disparities; high-density UAs—predominantly in southern and eastern economic zones—are characterized by advantageous geographical locations with developed transportation infrastructure, robust socioeconomic foundations, and high population densities generating substantial ECE demand. Conversely, UAs including the Northern Slope of Tianshan, Lanzhou-Xining, Central Guizhou, and Central Yunnan—predominantly in northwest regions—exhibit sparser, lower-density kindergarten distribution. They face harsh natural environments marked by challenging topography, climatic constraints, and limited socioeconomic production capacity, which hinder large-scale population agglomeration. Distribution density analysis identifies the Beibu Gulf UAs as the national leader in kindergarten accessibility, achieving a KPP index of 2.11 institutions per 10,000 residents.
The analysis reveals significant regional disparities in KPP across major Chinese UAs. Figure 3 reveals that 10 UAs exceeded the threshold of 1.50 kindergartens per 10,000 inhabitants, with Beibu Gulf UAs ranking highest and Pearl River Delta ranking lowest. Notably, high-KPP regions predominantly cluster in eastern and northern China, characterized by advanced socioeconomic development, concentrated populations, and substantial public investment in ECE infrastructure. This aligns with the positive correlation between urbanization levels and educational resource allocation identified in previous studies.
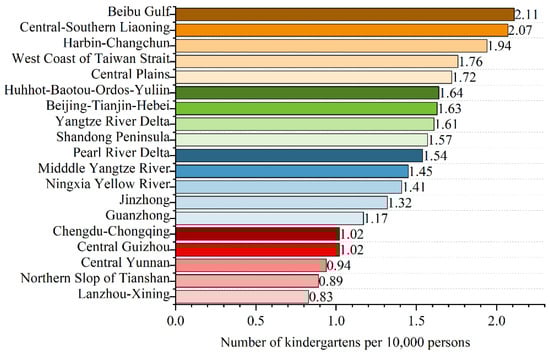
Figure 3.
Kindergarten educational resources ownership per 10,000 persons in 19 Chinese urban agglomerations.
4.2. Kernel Density of Kindergarten Educational Resources in China
The KDE method in ArcGIS 10.2 was used to systematically analyze the distribution characteristics of Chinese kindergartens. Through iterative experiments with search radii parameters (e.g., 50 km, 60 km, 70 km, and 150 km), a 100 km bandwidth was selected to optimally reveal spatial differentiation patterns, while maintaining critical details that become oversimplified at larger radii (e.g., 150 km). Figure 4 shows that the spatial distribution of kindergartens exhibits distinct hierarchical characteristics with a stepped ladder configuration, manifesting a typical “core-periphery” structure. Three distinct patterns emerge: high-density clusters concentrated in UAs, medium-density polycentric formations in prefecture-level city clusters, and dispersed low-density distributions in peripheral urban areas. This demonstrates a pronounced circular-layered density gradient. Primary core areas (density > 0.34/km2) predominantly encompass provincial capitals and major metropolitan regions, surrounded by secondary transitional zones. Notably, the core areas are most prominent in the Beijing-Tianjin-Hebei, the Yangtze River Delta, the Pearl River Delta, and the Chengdu-Chongqing UAs. Conversely, the vast western regions exhibit significantly lower densities (<0.013/km2), forming extensive low-density peripheries. Density distribution progressively attenuates from urban cores to suburban transition areas, reaching minimum values in rural hinterlands.
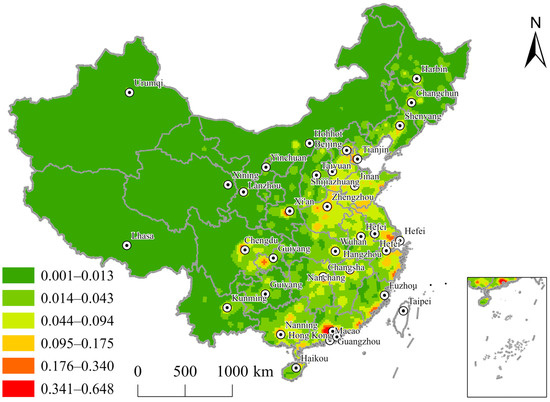
Figure 4.
Kernel density analysis results of kindergarten education resources in China at the end of 2019 (100 km search radius).
4.3. Spatial Agglomeration of Kindergarten Educational Resources in China
Building upon the kernel density analysis, global Moran’s I and the CV were employed to further examine the distribution patterns of KPP across different levels of administrative divisions in China. The results revealed significant spatial autocorrelation at all administrative levels, with Moran’s I values of 0.478 (provincial), 0.568 (prefecture-level city), and 0.332 (county), all demonstrating statistical significance at p < 0.001, indicating pronounced spatial clustering in China’s KPP distribution (Figure 5). The scale-dependent analysis revealed progressively increasing spatial disparities with administrative unit refinement, evidenced by CV values of 0.337 (provincial), 0.432 (prefecture-level city), and 0.729 (county), suggesting that regional inequalities in educational resource allocation become more apparent at finer spatial resolutions. Spatial hotspot analysis revealed a distinct “hot-east versus cold-west” dichotomy. High-value clusters (hotspots) were predominantly located in northeastern and southeastern coastal areas, indicating concentration zones of kindergarten resources. Conversely, cold-spots were primarily distributed across western and southwestern regions, reflecting relative scarcity of ECE resources.
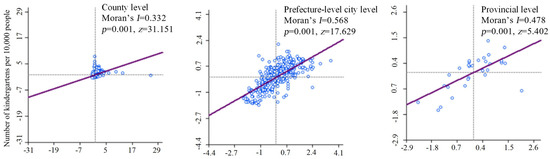
Figure 5.
Moran’s I index scatter plot of kindergarten education resources in China at different scales.
The spatial distribution of cold-spot clusters aligns with China’s topographic transition zones, predominantly concentrated in western and southwestern regions (Figure 6). This pattern emerges from the complex interplay of multiple factors including regional disparities in transportation accessibility, uneven economic development, and differential policy implementation. These elements influence—and potentially constrain—the equitable allocation of kindergarten educational resources. Multiscale spatial analysis reveals significant variations in hotspot distributions. County-level kindergarten hotspots demonstrate the most extensive spatial coverage, encompassing northeastern China, eastern Inner Mongolia, and vast areas of central-eastern China. At the prefecture level, the primary hotspot concentration shifts to the Northeast China Plain, eastern Inner Mongolia, and the Yangtze River Delta region (particularly Shandong and Jiangsu provinces), with secondary clusters emerging in other southeastern coastal areas. Provincial-scale analysis reveals pronounced hotspots discretely distributed in the eastern region, contrasting sharply with cold-spot concentrations in northwestern territories. This hierarchical spatial pattern suggests scale-dependent mechanisms governing educational resource distribution.
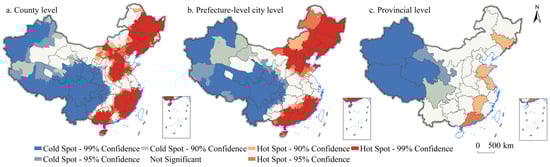
Figure 6.
Hotspots analysis of kindergarten education resources in China at different scales.
4.4. Influencing Factors of Spatial Imbalanced Distribution of Kindergarten in China
Significant regional disparities in KPP across China are emerging from the multiple determinants. KPP data served as the dependent variable in regression analysis to systematically investigate the driving forces behind this spatial configuration. Preliminary spatial autocorrelation analysis of kindergarten educational resources shows that, while the county-level Moran’s I index indicates the lowest spatial clustering intensity nationwide, it also exhibits the highest CV, suggesting superior information richness at the county scale. First, we conducted a county-scale OLS regression. The test results showed significant spatial autocorrelation in the residuals (Table 1).

Table 1.
Diagnostics for spatial dependence.
Comparative evaluation of model performance demonstrates substantial improvements in the MGWR framework relative to conventional GWR approaches (Table 2). The MGWR model demonstrates a marked improvement in adjusted R2 value (0.725) compared to the GWR model (0.642). Furthermore, model selection criteria confirm this advantage through a notable reduction in the corrected AICc (578.16 → 522.78), indicating a substantial refinement of the model. The residuals show lower spatial autocorrelation. The MGWR model captures spatial heterogeneity through local regression, allowing the explanatory variables to more fully account for the dependent variable within local neighborhoods, thereby eliminating spatial autocorrelation in the residuals and reducing bias in the variable estimates (Figure 7).
Table 2.
Comparison of accuracy between GWR and MGWR models.
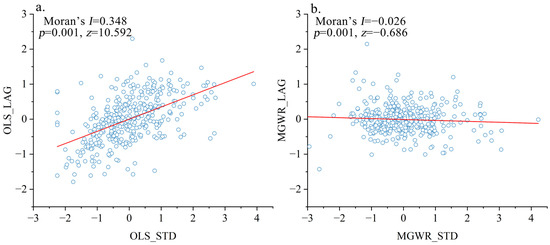
Figure 7.
Global Moran’s I of residuals from the OLS model and the MGWR model. (a) Moran’s I of residuals from the OLS model. The residuals exhibit relatively high spatial autocorrelation. (b) Moran’s I of residuals from the MGWR model.
Notably, while GWR only provides insights into the average scale of each influencing factor across the study area, MGWR can directly capture the multiscale variations among different influencing factors. Therefore, we adopted MGWR to deeply explore the complex relationships between the spatial distribution of kindergartens and various influencing factors, as well as to understand the mechanisms underlying the formation of kindergarten spatial patterns. Table 3 displays the statistical characteristics of the coefficients for each influencing factor.
Table 3.
Statistics of MGWR parameter estimates.
The regression analysis reveals the spatially heterogeneous influences on the distribution of KPP. Elevation demonstrates a negative correlation with KPP, though in northeastern China, higher elevation exhibits a positive influence on KPP (Figure 8). Population density shows a significant positive correlation with KPP, with the strongest positive coefficients in western regions (e.g., Xinjiang and Tibet) and relatively weaker positive correlations south of the Yangtze River. Proximity to urban centers indicates that shorter distances to prefecture-level cities generally correlate with higher KPP values, especially in Henan, Hubei, Anhui, and southeastern coastal provinces. The proportion of built-up area primarily shows positive spatial correlations, particularly in western and southern regions. However, an inverse relationship emerges in areas with intensive human activity, including the Huang-Huai-Hai Plain, the middle and lower reaches of the Yangtze River, and northeastern China. Regarding road network density, the coefficients exhibit significant regional variations, with negative correlations predominating in western China, northeastern regions, and parts of the south. However, positive correlations were observed in areas such as the Huang-Huai-Hai Plain, the middle and lower reaches of the Yangtze River, the core zones of the Chengdu-Chongqing UAs, and the Pearl River Delta, where increased road density corresponds to higher KPP values. The impact of GDP density on KPP exhibits significant positive spatial heterogeneity, with the strongest positive effects observed in western regions and relatively weaker effects in areas south of the Yangtze River.
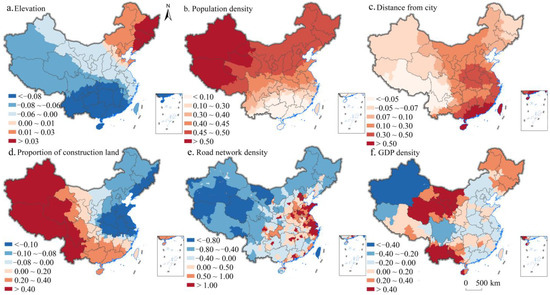
Figure 8.
Regression coefficients of factors influencing the kindergarten education resources in China.
5. Discussions
5.1. Summary of Research Findings
This study addresses this imperative by implementing a comprehensive geospatial analytical framework across multiple administrative levels in China. This methodological approach is fundamental to systematically diagnosing the precise spatial distribution patterns of ECE resources and identifying the underlying structural determinants of allocation disparities. By doing so, our research moves beyond mere description to provide an evidence-based foundation for developing targeted policy interventions and optimizing resource allocation strategies, thereby contributing to both scholarly discourse and practical improvements in educational equity.
The study revealed significant spatial heterogeneity in kindergarten distribution between economically developed and less developed regions. High-density clusters with intensive facility distribution were observed in prosperous areas, while underdeveloped regions exhibited sparse and uneven coverage. This is largely consistent with previous studies [43,44,45]. Spatial statistical analysis identified UAs and national central cities as core high-density zones for kindergarten facilities. These regions benefit from robust economic foundations, advanced urban infrastructure, superior living environments, dense population concentrations, and heightened demands for quality educational resources—all reinforced by national UAs’ development strategies and central city designation policies [46,47,48]. Conversely, low-density clusters were primarily in western China (e.g., Tibet, Xinjiang, Qinghai, and Gansu) and southwestern provinces (Sichuan, Yunnan)—areas facing geographical barriers (mountainous terrain, plateau landscapes), economic development challenges, population dispersion patterns, and comparatively lower prioritization of ECE infrastructure investment [9,49].
The spatial distribution of kindergartens in China exhibits agglomeration and dispersion [50,51], demonstrating significant correlations with regional socioeconomic development and geographical conditions. Kindergarten clusters predominantly emerge in economically advanced, densely populated urban areas [30,52,53,54,55], aligning with economic efficiency, policy intervention, and social demand. Market forces naturally drive kindergarten establishments toward regions with robust infrastructure and economic vitality to optimize operational efficiency and resource utilization [56,57]. Governmental preschool education planning promotes cluster development through targeted resource allocation and institutional support in designated zones. High population density areas manifest intensified demand for quality ECE, particularly among middle-class families prioritizing educational investment. Conversely, dispersed distribution patterns prevail in economically underdeveloped regions experiencing geographical barriers and resource disparity [30]. Rural and mountainous areas face constraints in sustaining concentrated educational facilities owing to limited fiscal capacity and insufficient demand thresholds [56]. Topographic complexity and transportation inadequacies impede facility accessibility and service coverage. Regions with scarce educational resources encounter systemic challenges including teacher shortages, inadequate funding, and suboptimal operational sustainability of kindergartens [35]. This distribution pattern highlights the critical intersection of market mechanisms, government regulation, and geographical determinants in educational resource allocation [54]. The findings underscore the need for differentiated policy frameworks addressing both cluster optimization in UAs and accessibility enhancement in disadvantaged regions [48].
5.2. Suggestions for Optimizing the Spatial Distribution of Kindergartens
The spatial organization of education is constantly reshaped by socioeconomic forces, often leading to regional disparities and inefficient resource allocation [58]. These issues, in turn, exacerbate educational inequality. To inform better planning, our research systematically maps the spatial patterns of kindergartens in China and identifies the structural factors that drive these distributional differences.
Based on the research findings, we propose the following policy recommendations. In the sparsely populated area northwest of the Hu Huanyong Line, a centralized and targeted kindergarten establishment strategy should be adopted, considering community distribution and population mobility trends. Efforts should be made to encourage coordinated development of public kindergartens and inclusive private kindergartens to address service gaps. In high-demand areas (such as provincial capitals and major metropolitan regions), measures should be taken to redirect educational resources toward suburban areas and surrounding counties. Through clustered kindergarten development and teacher mobility mechanisms, the issue of excessive concentration in core areas can be alleviated, promoting balanced development within regions. Given the spatial heterogeneity of influencing factors (such as population density, economic level, and public budget) across different regions, we recommend that eastern regions strengthen the mandatory coordination of land planning and educational facilities, while central and western regions should increase financial transfers and investment in teacher training to enhance resource suitability. By leveraging GIS and population big data, a matching degree evaluation mechanism between kindergarten distribution and preschool-aged children should be established. This will enable regular optimization and adjustment of resource allocation plans, achieving “needs-based planning and precise allocation.” Policy and institutional frameworks are pivotal in formulating optimization strategies for kindergarten spatial distribution [59], not only providing scientific foundations for spatial planning but also facilitating equitable resource allocation while balancing educational equity and quality in ECE.
The level of regional economic development and fiscal capacity directly determines investment in preschool education, leading to significant disparities in kindergarten resources between eastern coastal and central-western regions, as well as between urban and rural areas [35,60]. The government’s educational policies, especially its investment and management in preschool education, have a decisive influence on the layout of kindergartens [35]. The household registration system, coupled with the public services tied to it, ensures that public kindergarten resources primarily cater to the local registered population. This has resulted in lagging planning and a severe shortage of supply in rapidly urbanizing areas, such as new urban districts and urban-rural transitional zones, where population influx is high [61]. Against the backdrop of insufficient public supply, policies encouraging private sector involvement in establishing kindergartens have increased the overall quantity of resources but have also led to their spontaneous concentration in affluent urban areas with stronger payment capacity, exacerbating the coexistence of “difficult access to kindergartens” and “high cost of kindergarten enrollment” [62]. National standards and guidelines for kindergarten spatial distribution should be established and refined to incorporate demographic variables including population density, regional economic development levels, preschool-age population distribution, and educational policies and institutional background. Scientific spatial planning enables regions to achieve demand-responsive resource allocation while mitigating issues of resource redundancy and concentration.
5.3. Advantage of the MGWR Model in Revealing the Spatial Determinants of Kindergartens
The OLS model assumes that the effects of influencing factors are globally constant, whereas the GWR model, although accounting for spatial heterogeneity, imposes the same bandwidth for all variables. The superiority of MGWR lies in its ability to identify the optimal spatial scale of influence for each individual factor in revealing the spatial determinants of kindergartens. For instance, population density may exert influence at a fine, localized scale, while regional economic conditions may operate at a broader scale. MGWR enables the precise capture of such distinctions. In local regression within the GWR framework, when multiple independent variables are highly correlated spatially, local multicollinearity can be exacerbated, leading to unstable parameter estimates. By independently specifying the bandwidth for each variable, MGWR effectively isolates and differentiates the local effects of different variables, thereby yielding more robust and reliable estimation results. Furthermore, by allowing covariates to operate at their specific spatial scales, the MGWR model more effectively mitigates spatial autocorrelation in residuals compared to global OLS and single-bandwidth (GWR) models, leading to a better-specified model [41].
5.4. Limitations and Future Prospects
Reliance on public datasets (e.g., POI, census, remote sensing) poses temporal lags obscuring real-time dynamics and lacks granular micro-level details (e.g., specific facility attributes), limiting analytical resolution and precision. The POI and population data we utilized were primarily from December 2019 and 2020, which may not fully capture the latest developments following the full implementation of the “Double Reduction” and “Three-Child” policies. Nevertheless, these datasets provide crucial baseline information from the pre-policy period. Future research could focus on: (1) collecting annually updated POI and population data from 2021 onward to dynamically track the impact of the “Double Reduction” policy on the distribution and accessibility of educational facilities; and (2) integrating the effects of the “Three-Child” policy to conduct an in-depth analysis of the spatial distribution of multi-child families and the evolving demand for public services, thereby enabling a more precise evaluation of policy outcomes and offering data-driven support for resource allocation decisions. While incorporating socioeconomic and environmental factors, latent mechanisms (regional cultural norms, intergenerational care, neighborhood social capital) and subnational variations in policy implementation efficacy remain underexplored. Derived macro-level recommendations lack operational guidelines differentiated by regional disparities (urban–rural, economic zones) or kindergarten types (public/private), hindering practical application. Furthermore, future research should seek to deepen the interpretive depth of findings by explicitly engaging with theoretical frameworks of spatial justice to better elucidate the mechanisms behind educational inequity. Thus, future research should: develop real-time spatial analytics; integrate sociocultural dimensions and localized policy mediation; and co-design adaptive, evidence-based policy toolkits with tiered implementation strategies to optimize China’s preschool ecosystem amidst urbanization and demographic shifts, ensuring equitable access through context-sensitive resource allocation. Alternatively, policy text analysis could be employed to examine relevant education policies issued by central and local governments through methods such as word frequency analysis, semantic network analysis, and thematic modeling, thereby constructing quantifiable indicators of “policy intensity” or “policy attention”. This approach could be combined with itemized “education expenditure” data from municipal or district/county-level fiscal budgets and final accounts to directly quantify the “intensity of investment in educational resources”.
6. Conclusions
Based on the POI data of kindergartens, this study demonstrates that the spatial distribution of kindergartens in China is characterized by significant spatial non-stationarity, driven by a combination of natural and socioeconomic factors. Specifically, the findings confirm the initial hypothesis that kindergarten distribution exhibits clear spatial imbalance, which can be summarized in three key dimensions: (1) a distinct southeast–northwest density gradient, with concentrated distribution in southeastern and northeastern regions and sparse coverage in northwestern and southwestern peripheries; (2) a pronounced urban–rural dichotomy, reflecting higher density in urban cores compared to suburban and rural areas; and (3) a structural configuration best described as “large-scale dispersion with localized aggregation.” These patterns reveal substantial spatial disparities, with cold–spot areas predominantly located in western China and exhibiting notable scale variations.
The application of the MGWR model further reveals that kindergarten distribution is jointly influenced by natural and human factors, displaying marked spatial heterogeneity. By integrating sociological frameworks with geospatial analysis techniques, this study not only advances methodological approaches in spatial equity research but also addresses critical gaps in understanding the drivers of educational resource allocation. The multi-scalar perspective—spanning provincial, prefecture, and county levels—coupled with the use of high-precision POI big data, enhances the robustness and relevance of the findings. This research provides a theoretical foundation and practical reference for promoting educational equity at the starting point, safeguarding children’s rights, and supporting evidence-based optimization of preschool education resource allocation in China. Ultimately, it underscores the need for spatially sensitive policies to mitigate regional imbalances and foster equitable access to ECE.
Author Contributions
Conceptualization, Guiling Tang and Feng Xu; methodology, Guiling Tang and Feng Xu; software, Guiling Tang and Feng Xu; validation, Guiling Tang and Feng Xu; formal analysis, Guiling Tang and Feng Xu; investigation, Guiling Tang and Feng Xu; resources, Guiling Tang and Feng Xu; data curation, Guiling Tang and Feng Xu; writing—original draft preparation, Guiling Tang and Feng Xu; writing—review & editing, Guiling Tang and Feng Xu; visualization, Guiling Tang and Feng Xu; supervision, Guiling Tang and Feng Xu; project administration, Guiling Tang and Feng Xu; funding acquisition, Guiling Tang and Feng Xu. All authors have read and agreed to the published version of the manuscript.
Funding
This research was funded by the Research Project on Higher Education Management of China University of Geosciences (grant number 2021FZA02), and Discipline Construction Project of China University of Geosciences (grant number MX2204). This research was also funded by the Postgraduate Education and Teaching Reform Research Project of China University of Geosciences in 2024 (grant number YJGGJ202403).
Data Availability Statement
The datasets used and/or analyzed during the current study are available from the corresponding author on reasonable request.
Acknowledgments
I sincerely thank the teachers for their help during the writing process and all the anonymous reviewers for their time and energy in reviewing the paper.
Conflicts of Interest
The authors declare no conflict of interest.
References
- Wang, F.; Bai, Y.; Zhou, L.; Ji, X.; Xu, Z.; Qiao, F. Spatial pattern and influencing factors of the equalization of basic education public service in China. Geogr. Res. 2019, 38, 285–296. [Google Scholar]
- Qin, Y. Objective positioning and strategic layout of education in promoting common prosperity in the new development stage. People’s Educ. 2022, 5, 33–39. [Google Scholar]
- Liu, P.; Qian, T.; Huang, X.; Dong, X. The connotation, realization path and measurement method of common prosperity for all. Manag. World 2021, 37, 117–129. [Google Scholar]
- Li, B.; Ge, W.; Wu, L. Core ideas and indexes evaluation on the layout of kindergartens. Educ. Res. 2017, 38, 72–77. [Google Scholar]
- Dai, T.; Liao, C.; Hu, K.; Zhang, W.; Liu, Z. Secondary school allocation optimization towards equal access: A case study on Shijingshan District, Beijing. Acta Geogr. Sin. 2017, 72, 1476–1485. [Google Scholar]
- Chen, Y.; Luo, Z. The characteristics and efficiency of spatial distribution of basic education resources in Lanzhou city. Arid Land Resour. Environ. 2017, 31, 44–50. [Google Scholar]
- Cong, X.; Li, X.; Tian, S.; Gong, Y. Study on the characteristics of the spatial distribution of urban compulsory educational resources based on POI: A case study of the main urban area of Dalian. Educ. Teach. Forum. 2021, 40, 5–9. [Google Scholar]
- Bai, X.; Bai, Y.; Wang, F.; Zhang, M.; Che, L. Characteristics of spatial distribution of basic education resources in Xi’an City on street scale. Arid Land Geogr. 2019, 42, 1470–1477. [Google Scholar]
- Yuan, Z.; Guo, J.; Yang, Y.; Zhu, H. Analysis of the spatial structure, mechanism and social-political effects of the high-quality basic educational resources in China. Acta Geogr. Sin. 2020, 75, 318–331. [Google Scholar]
- Abulibdeh, A.; Al-Ali, M.; Al-Quraishi, D.; Al-Suwaidi, W.; Al-Yafei, B.; Al-Mazawdah, S. Assessing the spatial distribution and accessibility of public and private schools in Qatar: A GIS-based analysis. Geomatica 2024, 76, 100015. [Google Scholar] [CrossRef]
- Cai, Y.; Cui, C.; Zi, M.; Zhang, C. Current situation, causes and optimization suggestions on the spatial layout suitability of urban kindergartens in China. Stud. Early Child. Educ. 2024, 1, 24–37. [Google Scholar]
- Huang, J.; Ouyang, S.; Rao, Y. Research on spatial equity of preschool education resource allocation in megacities from the perspective of common prosperity—Empirical experience from Chengdu. Stud. Early Child. Educ. 2024, 11, 30–39. [Google Scholar]
- Wang, X.; Zhao, J.; Lu, Y.; Li, X. Spatial pattern, quality evaluation, and implications of preschool education facilities in new urban areas using multi-source data: A case study from Lingui New District in West China. Buildings 2024, 14, 1718. [Google Scholar] [CrossRef]
- Wazzan, K. The spatial distribution of the basic education schools in Lattakia City (Syria). Nephron Clin. Pract. 2017, 7, 71–79. [Google Scholar] [CrossRef][Green Version]
- Wu, L.; Zhou, J.; Yuan, Z. Analysis of the spatial structure and formation elements of the high-quality basic educational resources in Guangdong province. J. Guangzhou Univ. 2021, 20, 87–95. [Google Scholar]
- Yang, X.; Bai, Y.; Cai, J.; Sun, S. Analysis of spatial distribution and agglomeration characteristics of preschool education based on POI data taking the main urban area of Lanzhou City as a case. Resour. Dev. Market. 2020, 36, 1062–1066. [Google Scholar]
- Zhang, Z.; Luan, W.; Tian, C.; Su, M.; Li, Z. Spatial distribution equilibrium and relationship between construction land expansion and basic education schools in Shanghai based on POI data. Land 2021, 10, 1059. [Google Scholar] [CrossRef]
- Xie, K.; Wang, L. The evolution and influential factors on urban kindergarten spatial pattern based on POI data: A case study of Nanchang City. J. Shaanxi Xueqian Normal Univ. 2024, 40, 96–104. [Google Scholar]
- Li, J.; Huang, D. On the spatial distribution of preschool education resources—Taking the Xicheng District of Beijing as an example. Stud. Early Child. Educ. 2014, 5, 3–10. [Google Scholar]
- Zheng, C.; Jiang, Y.; Yue, M. Current situation analysis of the balanced allocation of preschool education resources between provinces in China: Based on GIS. J. Educ. Dev. 2017, 9, 5–10. [Google Scholar]
- Zheng, C.; Jiang, Y.; Wang, J.; Kan, W. A study on the equality of early childhood education in Shanghai from the perspective of regional resource allocation based on the technology support of GIS. Stud. Early Child. Educ. 2017, 266, 17–26. [Google Scholar]
- Zhang, A.H. Analysis on the difference of urban and rural preschool education development in China from the perspective of fairness. In Proceedings of the 2018 4th International Conference on Education, Management and Information Technology (ICEMIT 2018), Changchun, China, 6–7 July 2018; pp. 1482–1486. [Google Scholar]
- Hong, X.; Chen, J.J. A critical analysis of the changing landscape of early childhood education in mainland China: History, policies, progress, and future development. In Early Childhood Education Policies in Asia Pacific; Education in the Asia-Pacific Region: Issues, Concerns and Prospects; Li, H.; Park, E.; Chen, J., Translators; Springer: Singapore, 2017; Volume 35. [Google Scholar]
- Li, H.; Wang, H. Visualization research on spatial distribution and equilibrium degree of preschool education resources in Guangzhou. J. Shanghai Educ. Res. 2018, 9, 33–37. [Google Scholar]
- Huo, L.; Wang, G. Spatial balance degree changes of preschool education resources in China. Mod. Educ. Manag. 2019, 10, 14–20. [Google Scholar]
- Shen, M.X. Spatial Distribution Characteristics and Influencing Factors of Kindergartens in Shenyang Based on GIS. Master’s Thesis, Shen-yang Normal University, Shenyang, China, 2019. [Google Scholar]
- Yang, T.; Wang, P.; Li, F. Centralized resource allocation and target setting based on data envelopment analysis model. Math. Probl. Eng. 2018, 2018, 3826096. [Google Scholar] [CrossRef]
- Liu, L.; Liu, B.; Huang, H. Imbalanced development of Chinese compulsory education system: A quantitative analysis. Educ. Res. Mon. 2014, 11, 38–43. [Google Scholar]
- Cheng, L.; Chen, C.; Xiu, C.L. Excess kindergarten travel in Changchun, Northeast China: A measure of residence-kindergarten spatial mismatch. J. Transp. Geogr. 2017, 60, 208–216. [Google Scholar] [CrossRef]
- Jiang, L.; Chen, J.; Tian, Y.; Luo, J. Spatial pattern and influencing factors of basic education resources in rural areas around metropolises—A case study of Wuhan city’s New Urban Districts. ISPRS Int. J. Geo-Inf. 2022, 11, 576. [Google Scholar] [CrossRef]
- Liu, J.; Yang, Q.; Liu, J.; Zhang, Y.; Jiang, X.; Yang, Y. Study on the spatial differentiation of the populations on both sides of the “Qinling-Huaihe Line” in China. Sustainability 2020, 12, 4545. [Google Scholar] [CrossRef]
- Sha, L.; Chen, W.; Yang, J.J.; Xi, Y.C.; Ren, Y.Q.; Li, H. Preschool teacher demand in China by 2050: A prediction analysis of the impact of negative population growth. Early Child. Educ. J. 2025, 53, 1501–1511. [Google Scholar] [CrossRef]
- Su, X.; Zhi, Y.; Jiang, C.Y.; Zhang, K. Spatial dynamics of Airbnb: Locational factors in birth and survival. Tour. Econ. 2025, 31, 1674–1701. [Google Scholar] [CrossRef]
- Kyselov, V. Topography of the southern Ukraine, potential and prospects of placement of preschool educational institutions in the difficult terrain conditions. Probl. Theor. Hist. Archit. Ukraine 2020, 20, 68–81. [Google Scholar] [CrossRef]
- Wang, Y.; Calero, J.; Gao, C.; Ma, J. Temporal and spatial dynamics of preschool education resource allocation in China from 2011 to 2019: Based on statistical and spatial analysis methods. Sage Open 2024, 14, 1–14. [Google Scholar] [CrossRef]
- Chen, W.; Yang, L.; Wu, J.; Wu, J.; Wang, G.; Bian, J.; Zeng, J.; Liu, Z. Spatio-temporal characteristics and influencing factors of traditional villages in the Yangtze River Basin: A GeoDetector model. Herit. Sci. 2023, 11, 111. [Google Scholar] [CrossRef]
- Liu, W.; Xue, Y.; Shang, C. Spatial distribution analysis and driving factors of traditional villages in Henan province: A comprehensive approach via geospatial techniques and statistical models. Herit. Sci. 2023, 11, 185. [Google Scholar] [CrossRef]
- Anselin, L.; Bera, A.K.; Florax, R.; Yoon, M.J. Simple diagnostic tests for spatial dependence. Reg. Sci. Urban Econ. 1993, 26, 77–104. [Google Scholar] [CrossRef]
- Anselin, L. A test for spatial autocorrelation in seemingly unrelated regressions. Econ. Lett. 1988, 28, 335–341. [Google Scholar] [CrossRef]
- O’Sullivan, D. Geographically weighted regression: The analysis of spatially varying relationships. Geogr. Anal. 2003, 35, 272–275. [Google Scholar] [CrossRef]
- Lu, B.B.; Ge, Y.; Shi, Y.L.; Zheng, J.H.; Harris, P. Uncovering drivers of community-level house price dynamics through multiscale geographically weighted regression: A case study of Wuhan, China. Spat. Stat. 2023, 53, 15. [Google Scholar] [CrossRef]
- Chen, B.; Zhang, H.; Wong, C.U.I.; Chen, X.; Li, F.; Wei, X.; Shen, J. Research on the spatial distribution characteristics and influencing factors of educational facilities based on POI data: A case study of the Guangdong–Hong Kong–Macao greater bay area. ISPRS Int. J. Geo-Inf. 2024, 13, 225. [Google Scholar] [CrossRef]
- Ai, Z.; Liu, H. Chinese space distribution and planning of preschool education resources based on ArcGIS. Mod. Educ. J. 2022, 5, 43–50. [Google Scholar]
- Zheng, Y.; Shi, W. Supply-and-Demand pattern of regional preschool education resources and its countermeasures under the background of “Universal two-child” policy. Educ. Sci. 2019, 35, 62–71. [Google Scholar]
- Huang, J.; Cao, N. Preschool education resource allocation model for index system evaluation based on nonlinear random matrix. Math. Probl. Eng. 2022, 2022, 1–10. [Google Scholar] [CrossRef]
- Li, X.; Luo, X.; Gu, J. Research on the allocation of basic education resources and the impact of demographic factors in the Yangtze River Delta urban agglomeration. J. Shanghai Educ. Res. 2025, 4, 1–10. [Google Scholar]
- Zhao, M.; Zhang, S.; Huang, M. Research on the promotion strategy of regional synergy of basic education in Guangdong-Hong Kong-Macao urban agglomeration. Mod. Educ. Manag. 2023, 3, 29–37. [Google Scholar]
- Sun, J.; Wu, H.; Shi, S. A research of the evaluation of preschool education resource allocation level and spatio-temporal differences: Based on repeated indicators method and Theil index. Heliyon 2023, 9, e16362. [Google Scholar] [CrossRef]
- Xie, E.; Wang, X. Regional inequality of opportunity in preschool education in China. Jinan J. (Philos. Soc. Sci.) 2025, 47, 165–181. [Google Scholar]
- Yang, J.; Huang, X.; Liu, X. An analysis of education inequality in China. Int. J. Educ. Dev. 2014, 37, 2–10. [Google Scholar] [CrossRef]
- Zhang, D.; Li, X.; Xue, J. Education inequality between rural and urban areas of the People’s Republic of China, migrants’ children education, and some implications. Asian Dev. Rev. 2015, 32, 196–224. [Google Scholar] [CrossRef]
- Burger, K. The socio-spatial dimension of educational inequality: A comparative European analysis. Stud. Educ. Eval. 2019, 62, 171–186. [Google Scholar] [CrossRef]
- Cortés, Y. Spatial accessibility to local public services in an unequal place: An analysis from patterns of residential segregation in the metropolitan area of Santiago, Chile. Sustainability 2021, 13, 442. [Google Scholar] [CrossRef]
- Hu, L.R.; He, S.J.; Luo, Y.; Su, S.L.; Xin, J.; Weng, M. A social-media-based approach to assessing the effectiveness of equitable housing policy in mitigating education accessibility induced social inequalities in Shanghai, China. Land Use Policy 2020, 94, 17. [Google Scholar] [CrossRef]
- Wen, H.Z.; Xiao, Y.; Zhang, L. School district, education quality, and housing price: Evidence from a natural experiment in Hangzhou, China. Cities 2017, 66, 72–80. [Google Scholar] [CrossRef]
- Tang, M.M.; Lan, Q. Research on policy effect and regional difference of allocation efficiency of rural preschool education resources: Evidence from China. PLoS ONE 2025, 20, e0301064. [Google Scholar] [CrossRef] [PubMed]
- Wu, X.G. Economic transition, school expansion and educational inequality in China, 1990–2000. Res. Soc. Strat. Mobil. 2010, 28, 91–108. [Google Scholar] [CrossRef]
- Xiang, L.L.; Stillwell, J.; Burns, L.; Heppenstall, A.; Norman, P. A geodemographic classification of sub-districts to identify education inequality in Central Beijing. Comput. Environ. Urban 2018, 70, 59–70. [Google Scholar] [CrossRef]
- Su, Y.F.; Lau, C.; Rao, N. Early education policy in China: Reducing regional and socioeconomic disparities in preschool attendance. Early Child. Res. Quart. 2020, 53, 11–22. [Google Scholar] [CrossRef]
- Hong, X.; Luo, L.; Cui, F. Investigating regional disparities of preschool education development with cluster analysis in mainland China. Int. J. Child Care Educ. Policy 2013, 7, 67–80. [Google Scholar] [CrossRef]
- Zhang, Z.; Luan, W.; Tian, C.; Su, M. Impact of urban expansion on school quality in compulsory education: A spatio-temporal study of Dalian, China. Land 2025, 14, 265. [Google Scholar] [CrossRef]
- Matthew, I.A. Participation of the private sector in the provision of early childhood care, development, and education: Issues, challenges, and way forward in Nigeria’s context. Child. Educ. 2015, 91, 370–377. [Google Scholar] [CrossRef]
Disclaimer/Publisher’s Note: The statements, opinions and data contained in all publications are solely those of the individual author(s) and contributor(s) and not of MDPI and/or the editor(s). MDPI and/or the editor(s) disclaim responsibility for any injury to people or property resulting from any ideas, methods, instructions or products referred to in the content. |
© 2025 by the authors. Published by MDPI on behalf of the International Society for Photogrammetry and Remote Sensing. Licensee MDPI, Basel, Switzerland. This article is an open access article distributed under the terms and conditions of the Creative Commons Attribution (CC BY) license (https://creativecommons.org/licenses/by/4.0/).