Article

The Potential Use of Electric Bicycles in the Historic Quarter of the Seaport City of Valparaíso, Chile, Through Participatory Mapping and Focus Groups Supported by AI Data Processing

by
Vicente Aprigliano
1,2,
Catalina Toro
1,3,
Gonzalo Rojas
1,3,*,
Mitsuyoshi Fukushi
1,
Iván Bastías
4,
Sebastián Seriani
1,
William Ribeiro da Silva
5,
Álvaro Peña
1 and
Luis López-Quijada
1
1
Escuela de Ingeniería de Construcción y Transporte, Pontificia Universidad Católica de Valparaíso, Valparaíso 2362804, Chile
2
Centro de Acción Climática, Pontificia Universidad Católica de Valparaíso, Valparaíso 2340025, Chile
3
Instituto de Geografía, Pontificia Universidad Católica de Chile, Macul 7820436, Chile
4
Instituto de Geografía, Pontificia Universidad Católica de Valparaíso, Valparaíso 2362807, Chile
5
Departamento de Geografía, Universidade Federal do Rio de Janeiro, Rio de Janeiro 21941-916, Brazil
*
Author to whom correspondence should be addressed.
ISPRS Int. J. Geo-Inf. 2025, 14(10), 405; https://doi.org/10.3390/ijgi14100405
Submission received: 1 August 2025 / Revised: 6 October 2025 / Accepted: 14 October 2025 / Published: 16 October 2025

Abstract

The Seaport City of Valparaíso, Chile, declared a World Heritage Site (WHS) by the United Nations, is known for its built landscape shaped during the first phase of globalization in the late 19th century, including early transport systems. However, the city now faces growing 21st-century urban and transport challenges common in Latin America. Amid the rise of electric micromobility in Chile, this study explores the potential use of electric bicycles (E-Bikes) in Valparaíso’s historic quarter. A qualitative methodology was employed, including participatory mapping to identify strengths, weaknesses, opportunities, and threats (SWOT), and focus group discussions supported by AI-based text analysis. Findings reveal that barriers to E-Bike use extend beyond topography and infrastructure, highlighting concerns such as deteriorated public spaces, lack of green areas, and safety issues. Promoting E-Bike adoption will require improving infrastructure, launching educational campaigns, optimizing routes, and fostering community participation. This study aims to inform local decision-makers on how to enhance sustainable mobility by integrating E-Bikes into the historical electric transport of Valparaíso, thereby contributing to the modernization of mobility within a heritage context.

1. Introduction

Cities worldwide are re-evaluating their transportation models to foster more sustainable and human-centered urban mobility. The post-pandemic era has notably accelerated this shift, promoting the development and consolidation of cycling infrastructure as a key strategy for creating greener and more resilient urban environments. This paradigm shift is reflected in the assessment of the environmental and functional characteristics of bicycle infrastructure [1] and the transition from temporary bike lanes to permanent, cycling-oriented mobility systems in major cities [2].
Within this transformation, electric bicycles (E-Bikes) have emerged as a key technological innovation, offering significant health and environmental advantages while addressing common adoption challenges [3]. Critically, their greatest potential lies in democratizing cycling and promoting social inclusion. By overcoming physical barriers such as steep topography or long distances, E-Bikes expand access to active mobility for populations that might otherwise be excluded, such as older residents [4].
The seaport city of Valparaíso, Chile, presents a paradigmatic case study for these global trends. In 2003, a historic area of the city was declared a World Heritage Site (WHS) by UNESCO, recognizing its unique landscape and early transport systems from the late 19th century [5]. However, this heritage is under threat. According to the Group of Users of Valparaíso Elevators, in the last 20 years, the city has ceased the operation of seven of its iconic funicular elevators (see Figure 1A) [6], which, along with the trolleybus and metro system, form the core of its historic electric transport landscape [7]. This decline has led to an increase in private transport and unsustainable mobility, which affects the heritage landscape and exposes pedestrians to risk. This situation is compounded by the city’s complex geography, characterized by steep hills where most of the population resides [8].
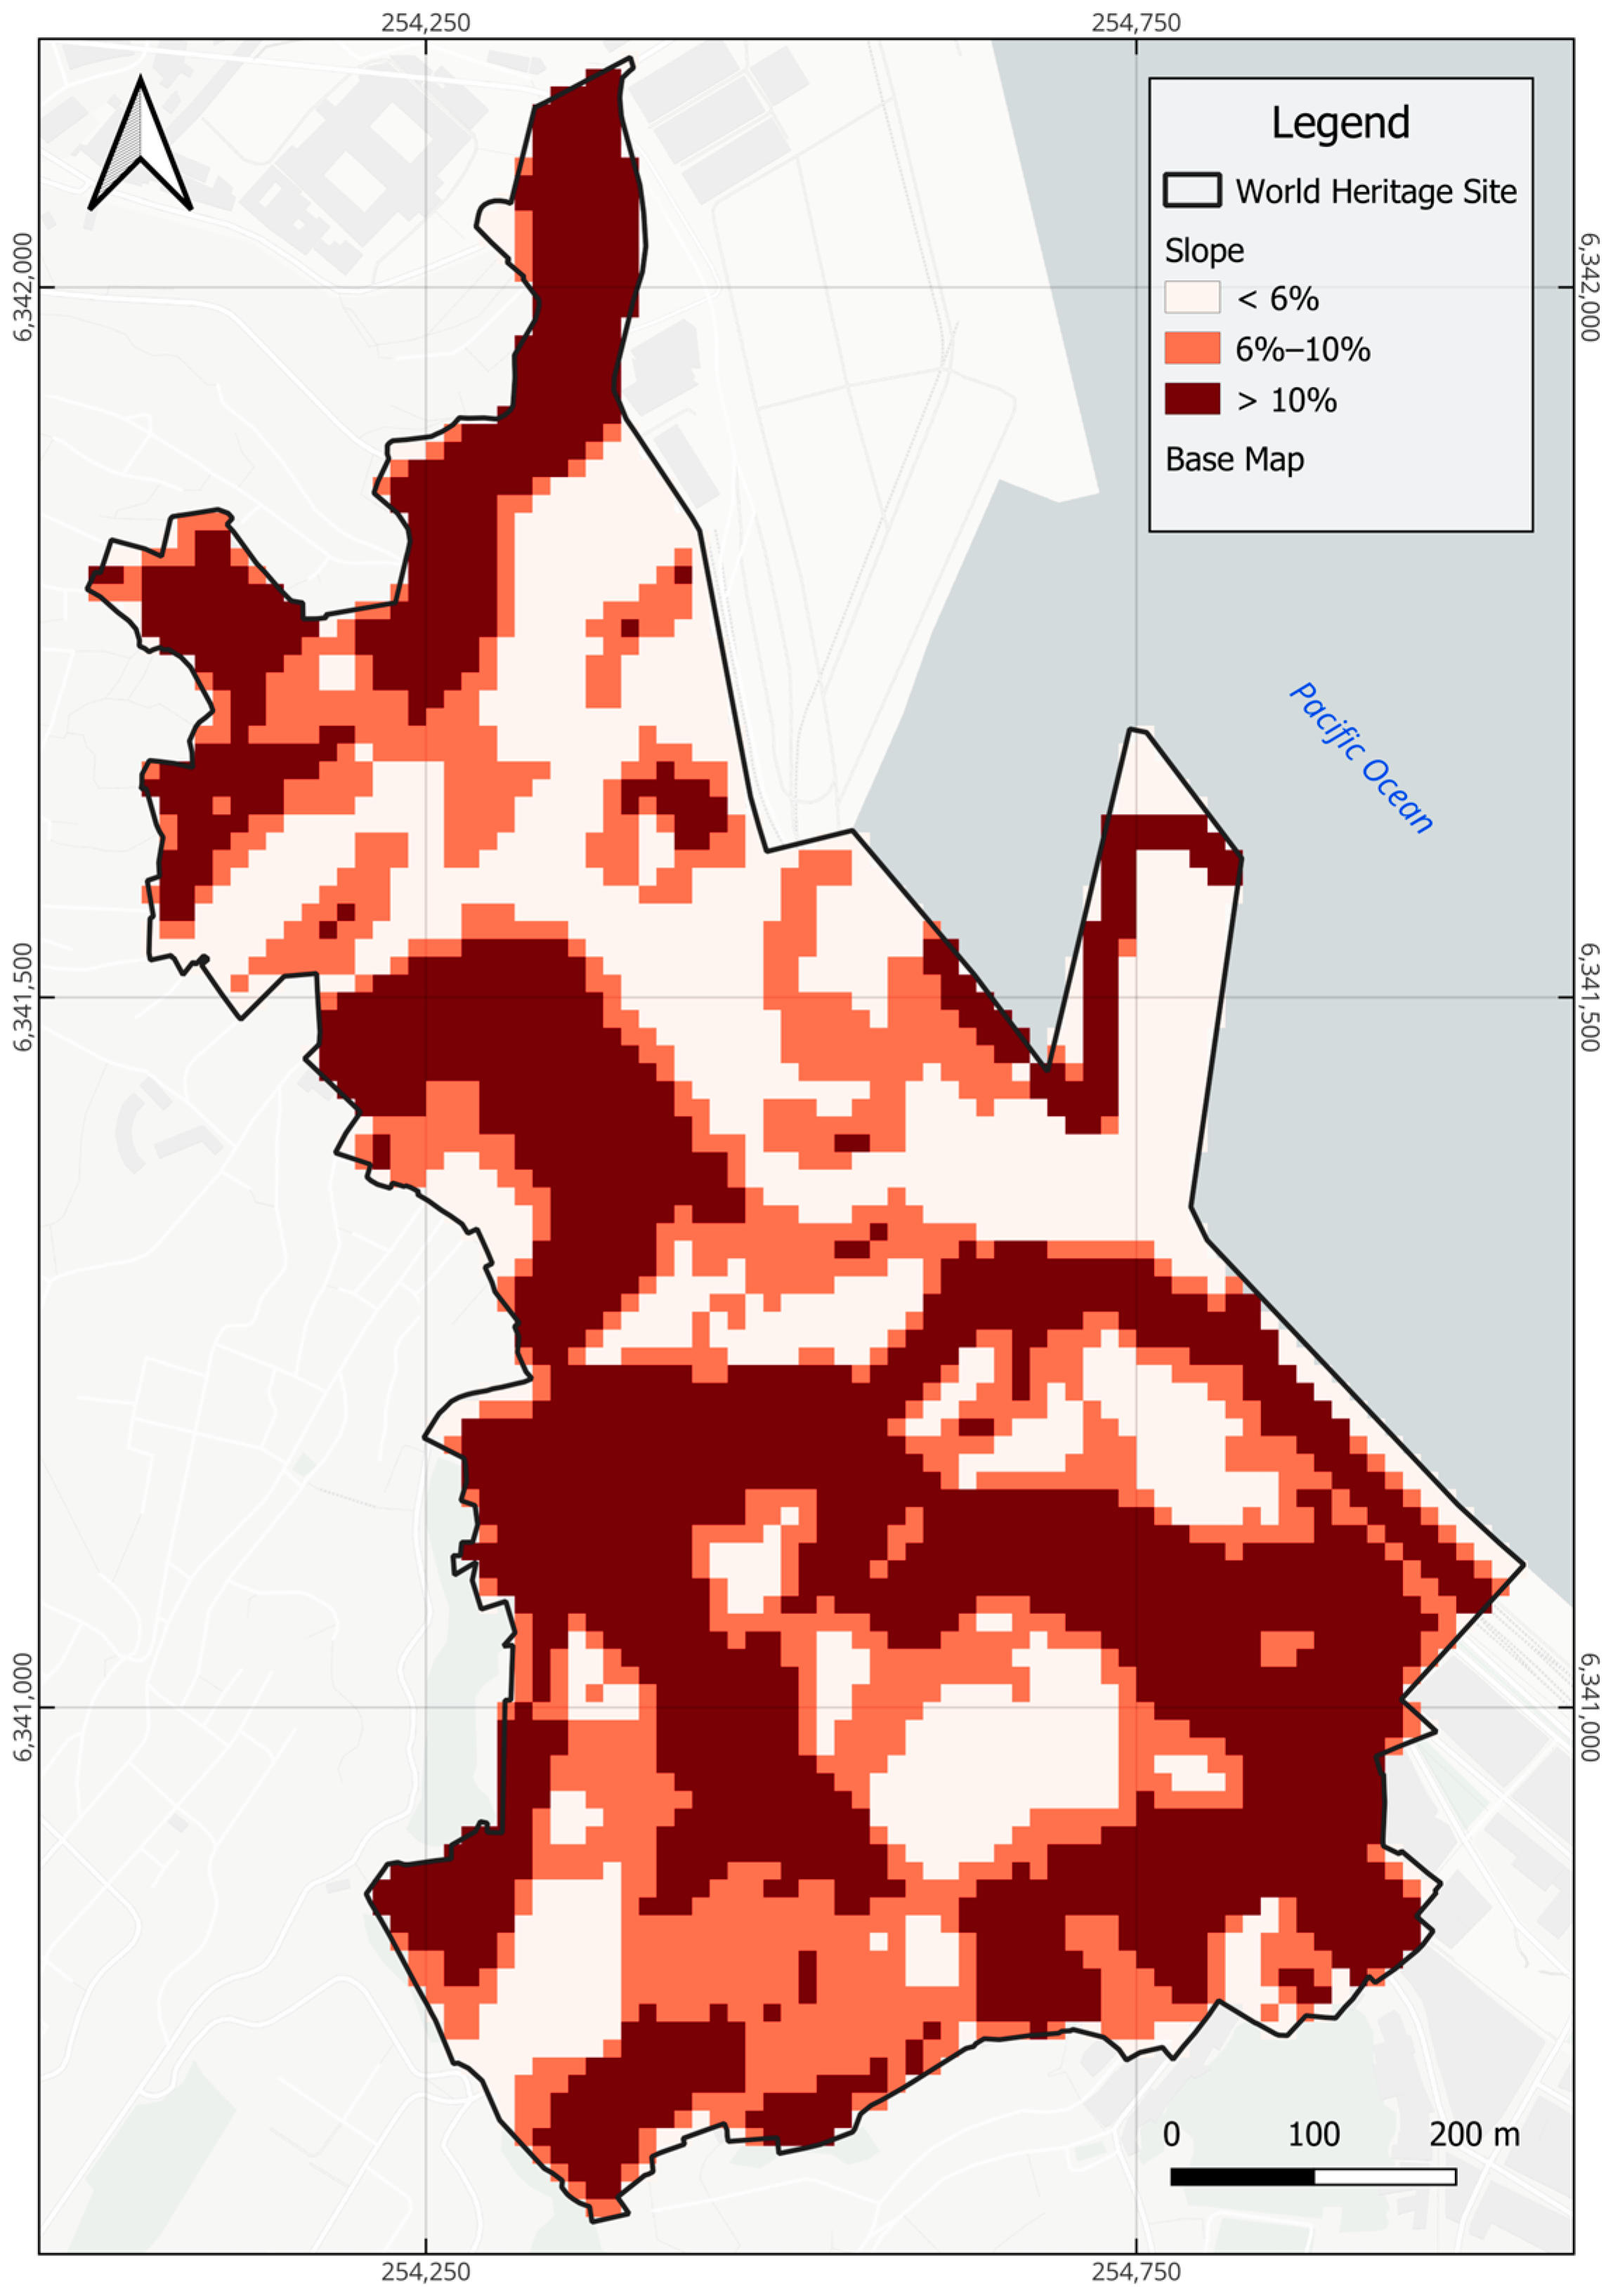
While E-Bikes present a promising solution to overcome the city’s topographical barriers—especially considering that Chilean regulations discourage bicycle lanes on slopes over 6% [9], a threshold widely surpassed in the historic quarter (see Figure 2)—their successful implementation in a complex heritage context like Valparaíso requires understanding barriers that extend beyond infrastructure. Given that the existing origin and destination survey for the metropolitan area of Valparaíso is from 2014 and therefore not representative [10], this study employs a qualitative methodology to explore the potential use of E-Bikes in Valparaíso’s historic quarter. Through participatory mapping to identify strengths, weaknesses, opportunities, and threats (SWOT), and focus group discussions supported by AI-based text analysis [11], this research aims to inform local decision-makers on how to enhance sustainable mobility. The goal is to contribute to the modernization of mobility by integrating E-Bikes into the city’s rich history of electric transport, fostering a more inclusive and sustainable future within a heritage context [12].

2. Mobility and the Participatory Mapping Approach: A Review

According to Hasanzadeh [13], participatory mapping approaches are gaining visibility in various fields of research. The authors highlight that participatory mapping elevates the link between individuals and places, facilitating a person-based research approach. However, there are many challenges regarding the quality of the data. In addition, Delpino-Chamy and Pérez Albert [14] affirm that participatory mapping methods offer more visibility and empowerment regarding the role of citizenship in enhancing an urban or transport planning process.
Seeking to examine the effects of residential location and stated residential preference on activity space size and centricity, Kajosaari et al. [15] applied linear regression and multinomial logistic regression analyses using data collected through online participatory mapping. Applying quantitative analysis methods, this study shows that residential location significantly affects the activity space size and polycentricity. On the other hand, Pánek and Benediktsson [16] explore emotional reactions related to cycling routes through an online participatory mapping platform with a sample of 100 users, applying a descriptive analysis approach of participants and emotional expressions regarding specific parts of cycling routes. Results of this study show that cyclists tend to relate positively to natural environments and negatively to car traffic.
Mindell et al. [17] report tools to measure and value community severance from the mobility and accessibility perspective. The tools tackle participatory mapping, spatial analysis, video surveys, street audits, health and neighborhood mobility surveys, and stated preference surveys, which were tested in an area of London. Most of the analysis is descriptive and focused on the stated problems people experienced in the study area, collected through closed and open-ended questions and also with the possibility of drawing areas of influence of the participants’ daily mobility, including their experience, through two community mapping workshops. The authors find that the study area is not pleasant for pedestrians due to noise and air pollution, high traffic, and poor-quality crossing facilities for pedestrians.
With a focus on the effects of free-fare public transport on the active travel of children, Pesola et al. [18] apply participatory mapping with children. The information marked on a map by participants included all the places they visited the previous week, the frequency of visits to these places, and their travel modes. In this study, there were a total of 427 participants, and the results showed that children with the benefit of free-fare public transport demonstrated less use of bicycles than children without this benefit for all trips. On the other hand, children with more access to free-fare public transport walked more to access public transport.
Through focus groups and participatory mapping, Mahmoudi et al. [19] evaluated the perception of citizens about a six-mile biking and walking path around downtown Portland, Oregon (United States of America). The data collection activity involved filling out a previous questionnaire, then the focus group activity, which discussed the barriers to mobility, neighborhood livability, movement to and from downtown, and perceptions of infrastructure changes in the study area. Furthermore, researchers also requested from participants suggestions for enhancing movement and mobility within neighborhoods. Afterward, the participatory mapping took place by asking participants, for example, to mark dots in the map related to four topics: places they visit more frequently a week, places avoided, areas that restrict mobility, and barriers perceived when traveling downtown from their neighborhood. Results of this found that 80% of participants travel frequently outside the downtown area, indicating that the top-down planning of the studied route does not achieve the expected solutions related to the daily mobility condition of participants.
Hasanzadeh et al. [13] combine online participatory mapping with accelerometer data to study the relationship between children’s activity, active travel behavior, sociodemographic factors, and environmental attributes. Some of the data collected through participatory mapping included the location of destinations, travel behavior, and sociodemographic information. Moreover, the accelerometers collected data related to physical activity and weather information and downloaded it from a secondary source. The authors indicate that the density of cycling routes relates to physical activity; however, there were varying results regarding the combination of other data used. Therefore, this study concludes that there is a complex relationship between a person and the environment.
Within the challenging process of including participatory mapping in urban planning, Molinero-Parejo et al. [20] focus on exploring the participatory mapping method to create dialog between stakeholders and experts. The activity was based on envisioning the metropolitan area of Madrid, Spain, in 2050, collecting information from transport engineers, urban planners, environmental consultants, and property developers about future land use and transport development scenarios. The authors conclude that this method is useful concerning the city’s future in terms of urban growth in land use and the expectation of growth of the transport network.
From a pilot study perspective, Vajjhala and Walker [21] apply participatory mapping in Lesotho to engage communities in transport planning and reduce the mobility gap in the study area. Unlike previous studies, Vajjhala and Walker [21] apply sketch mapping, where participants without a base map draw their mobility experiences, identifying important services in the area, key destinations, transport options, distances, travel times, and quality of services. Results indicated that the participatory mapping complemented with focus groups gave the opportunity to participants to evidence their perceptions, providing important insights about gender differences in mobility and access to key services, such as healthcare and education.
It is possible to observe in the reviewed papers that there is no standard way of applying participatory mapping in mobility studies. It is possible to observe the increasing use of technology to gather online information. However, still, the value of performing in-person participatory mapping complemented with focus groups or discussion groups offers the possibility of developing more dynamic and interactive environments, which allows a more person-oriented perspective in studies, as mentioned by Hasanzadeh [22]. In this direction, this study proposes a structured methodology combining focus groups and participatory mapping in a way that could be replicated in other mobility studies.

3. Description of Case Study

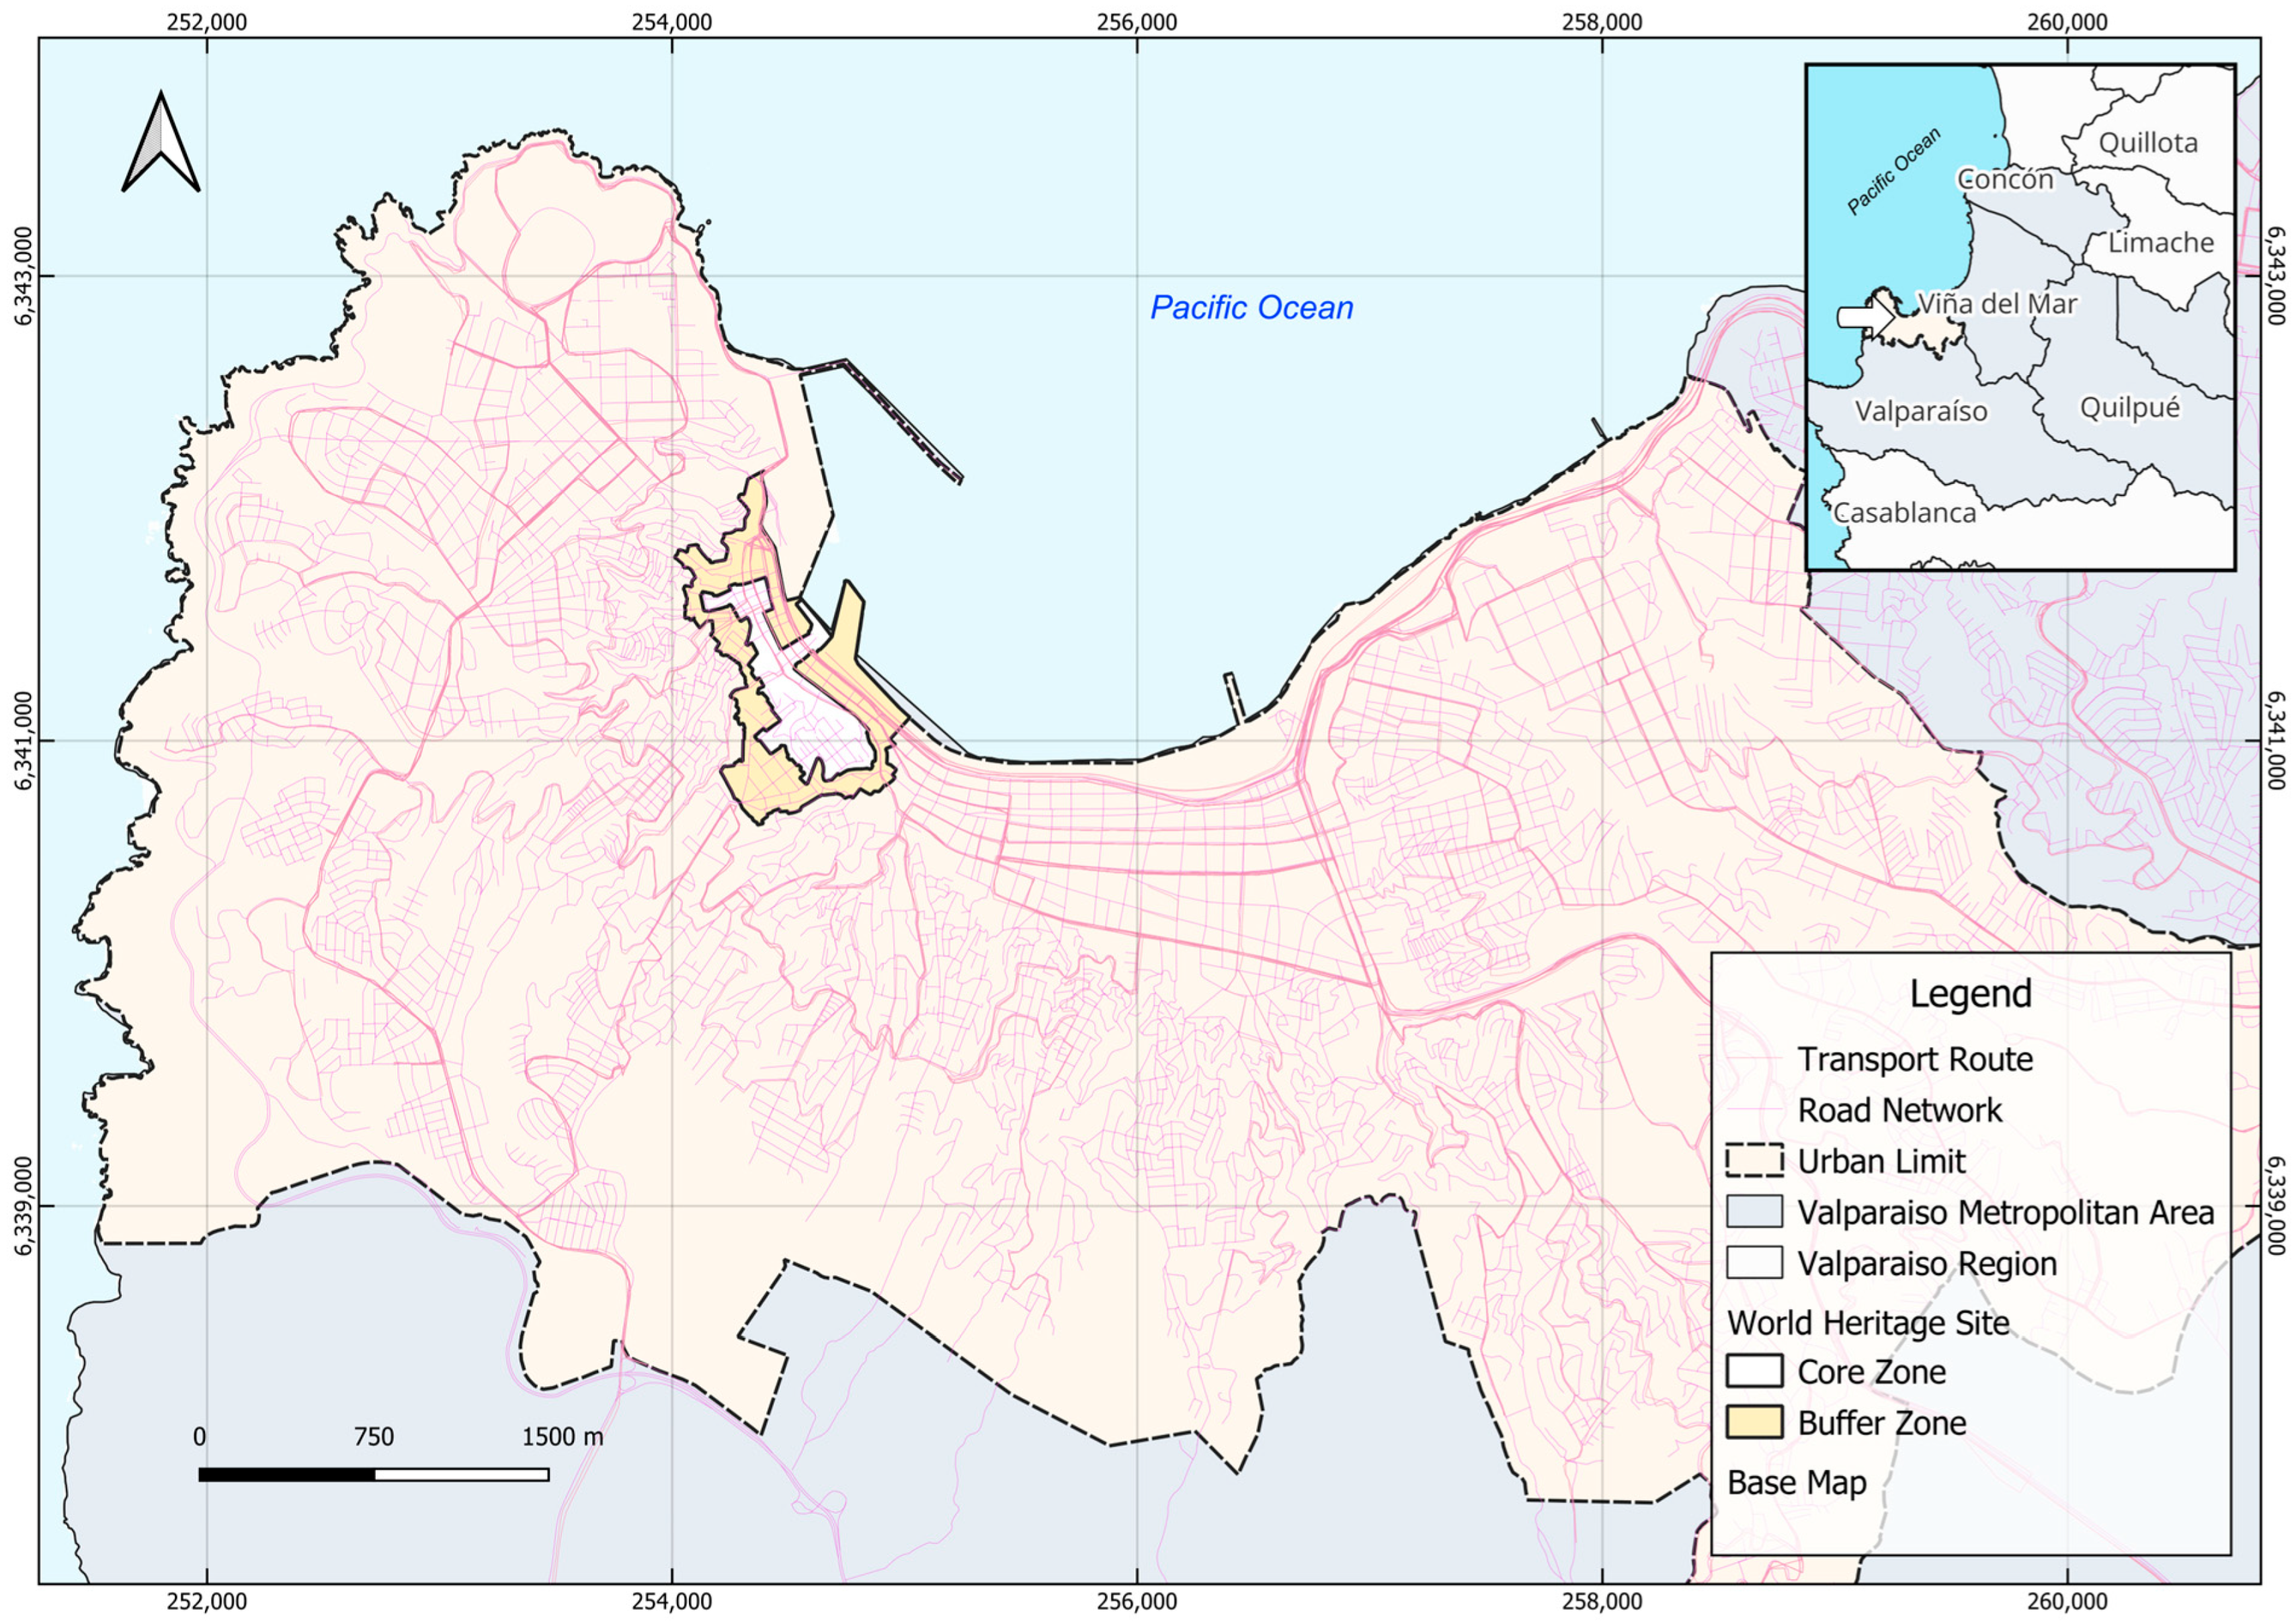
The research focuses on the Valparaíso World Heritage Site (WHS), recognized by UNESCO [23], composed of a buffer zone and a core zone, located in the city of Valparaíso (Urban limit), belonging to the Metropolitan Area of Valparaíso in the Valparaíso Region, Chile, an area also composed of the municipalities of Viña del Mar, Concón, Quilpué and Villa Alemana. Figure 3 highlights the location of the WHS within the metropolitan area, showing the borders of the core zone and the buffer zone, as well as the relationship with other municipalities.
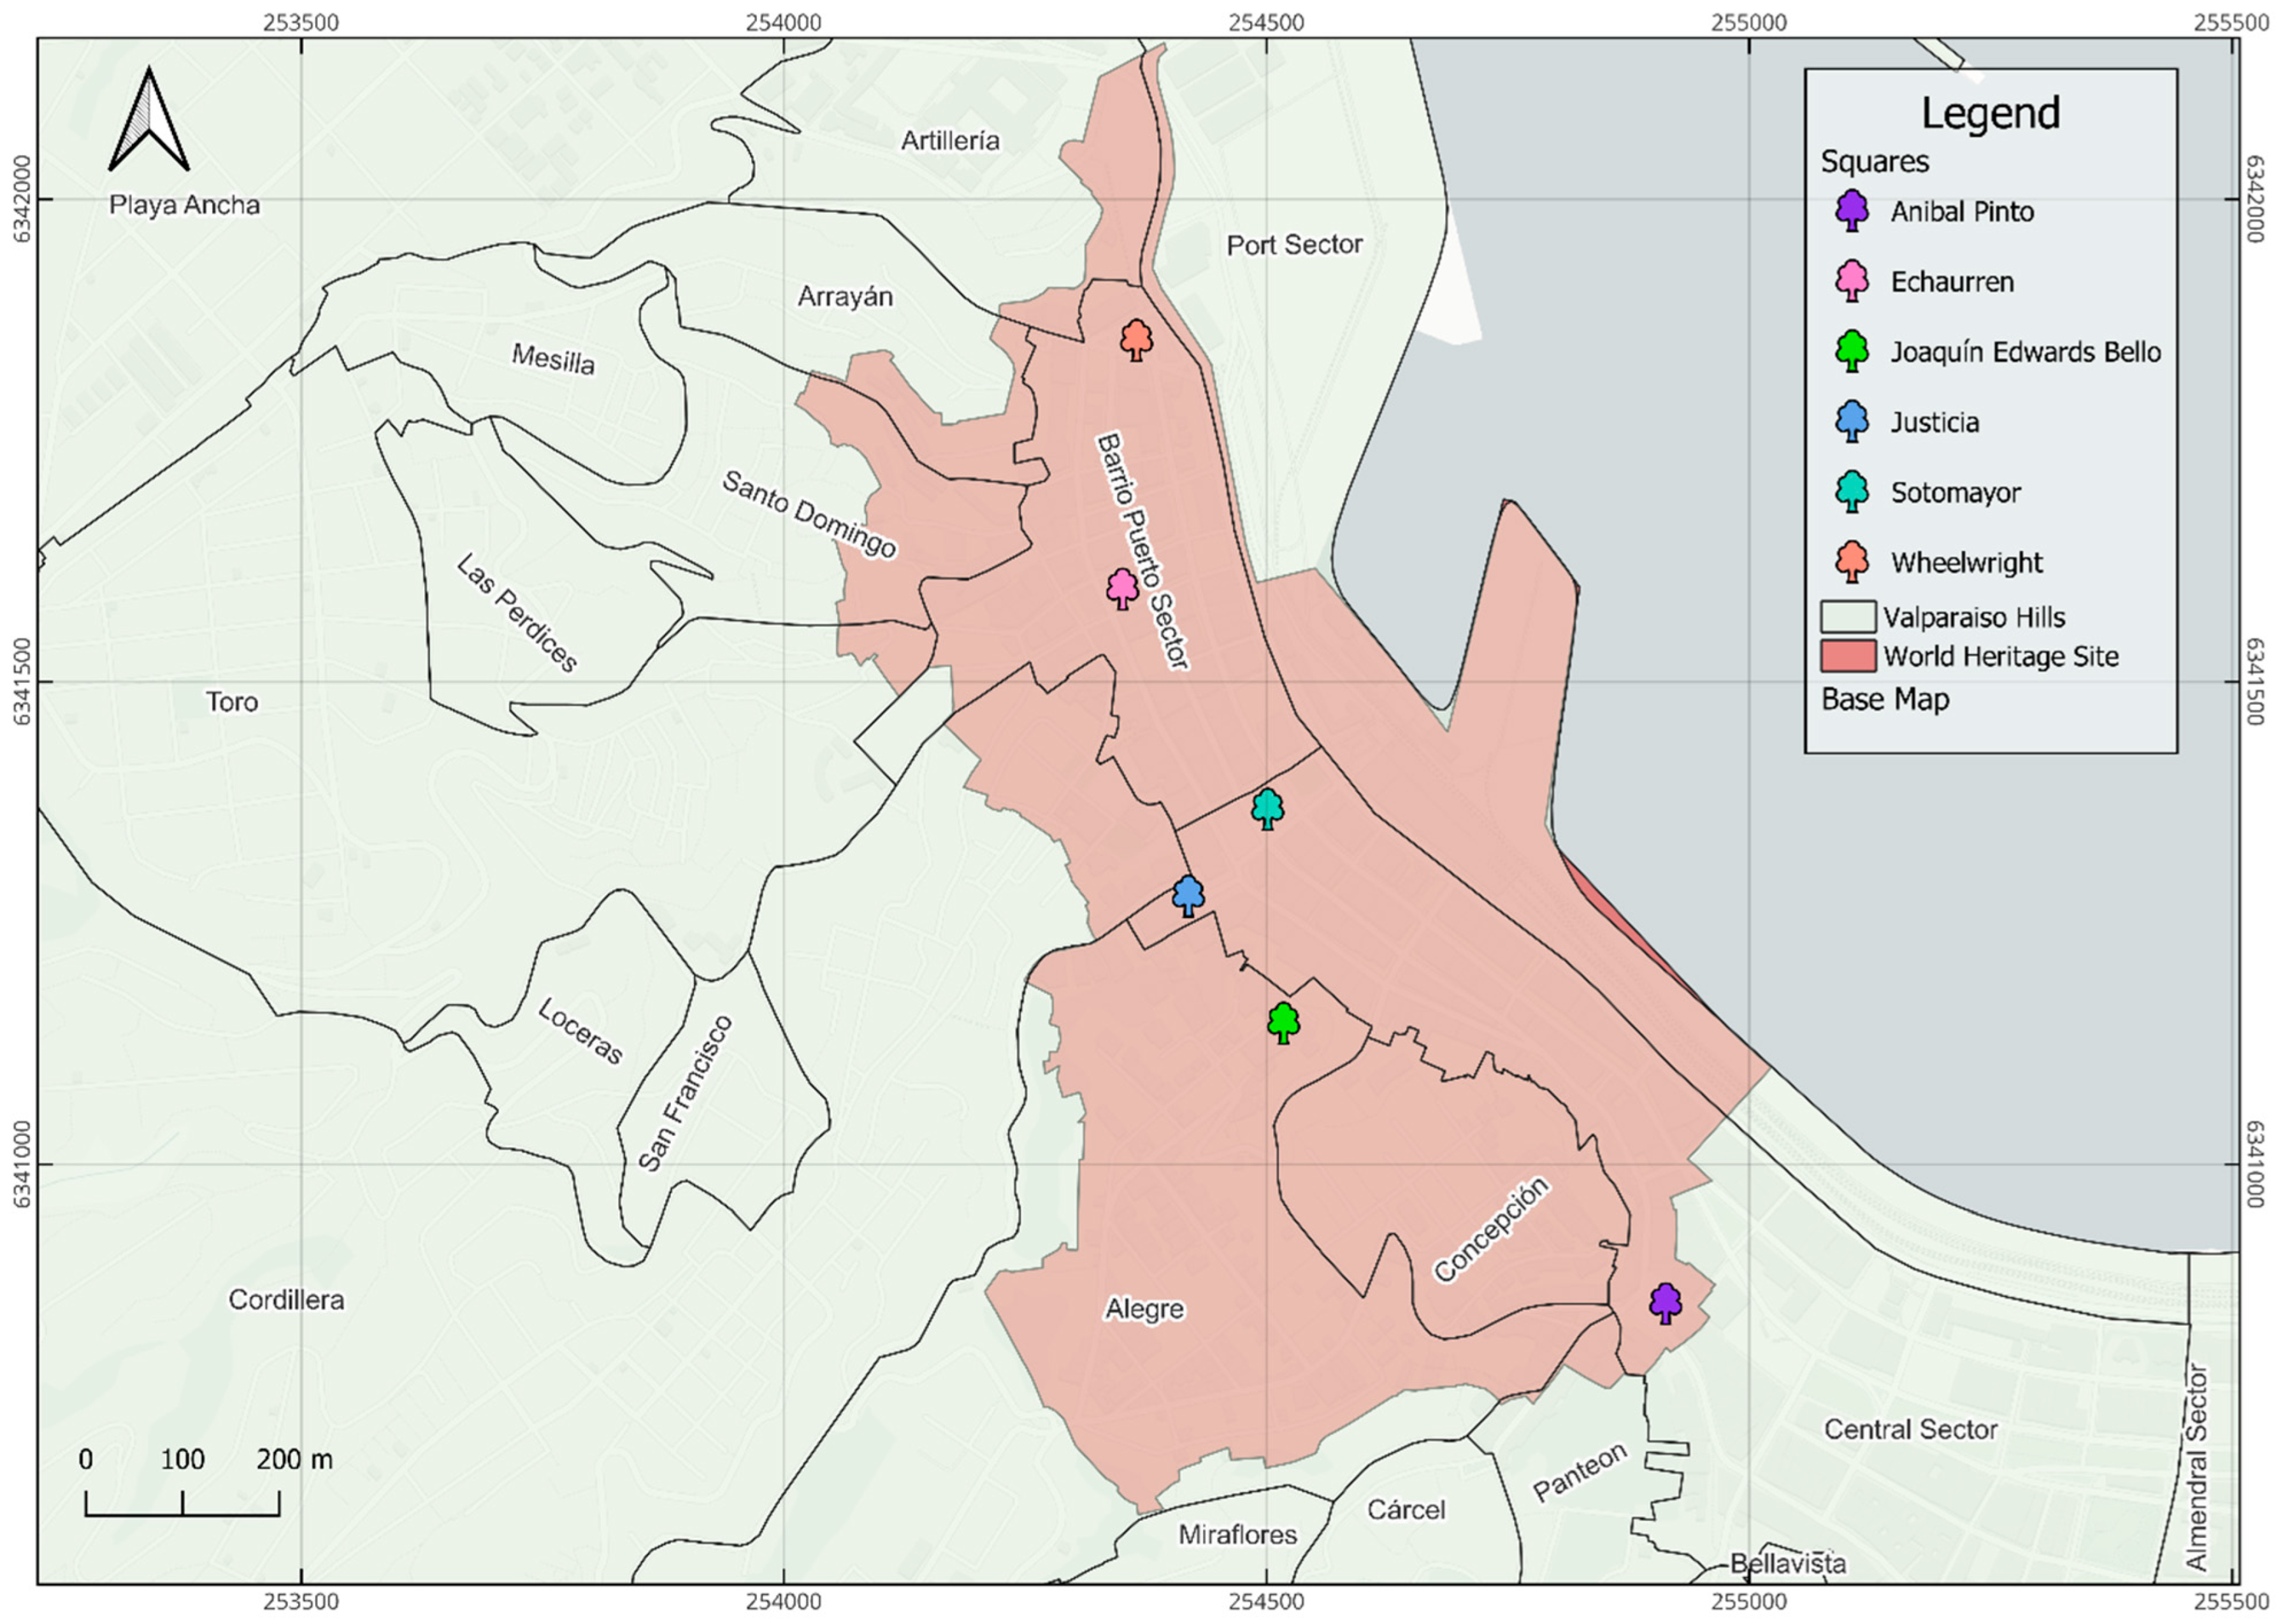
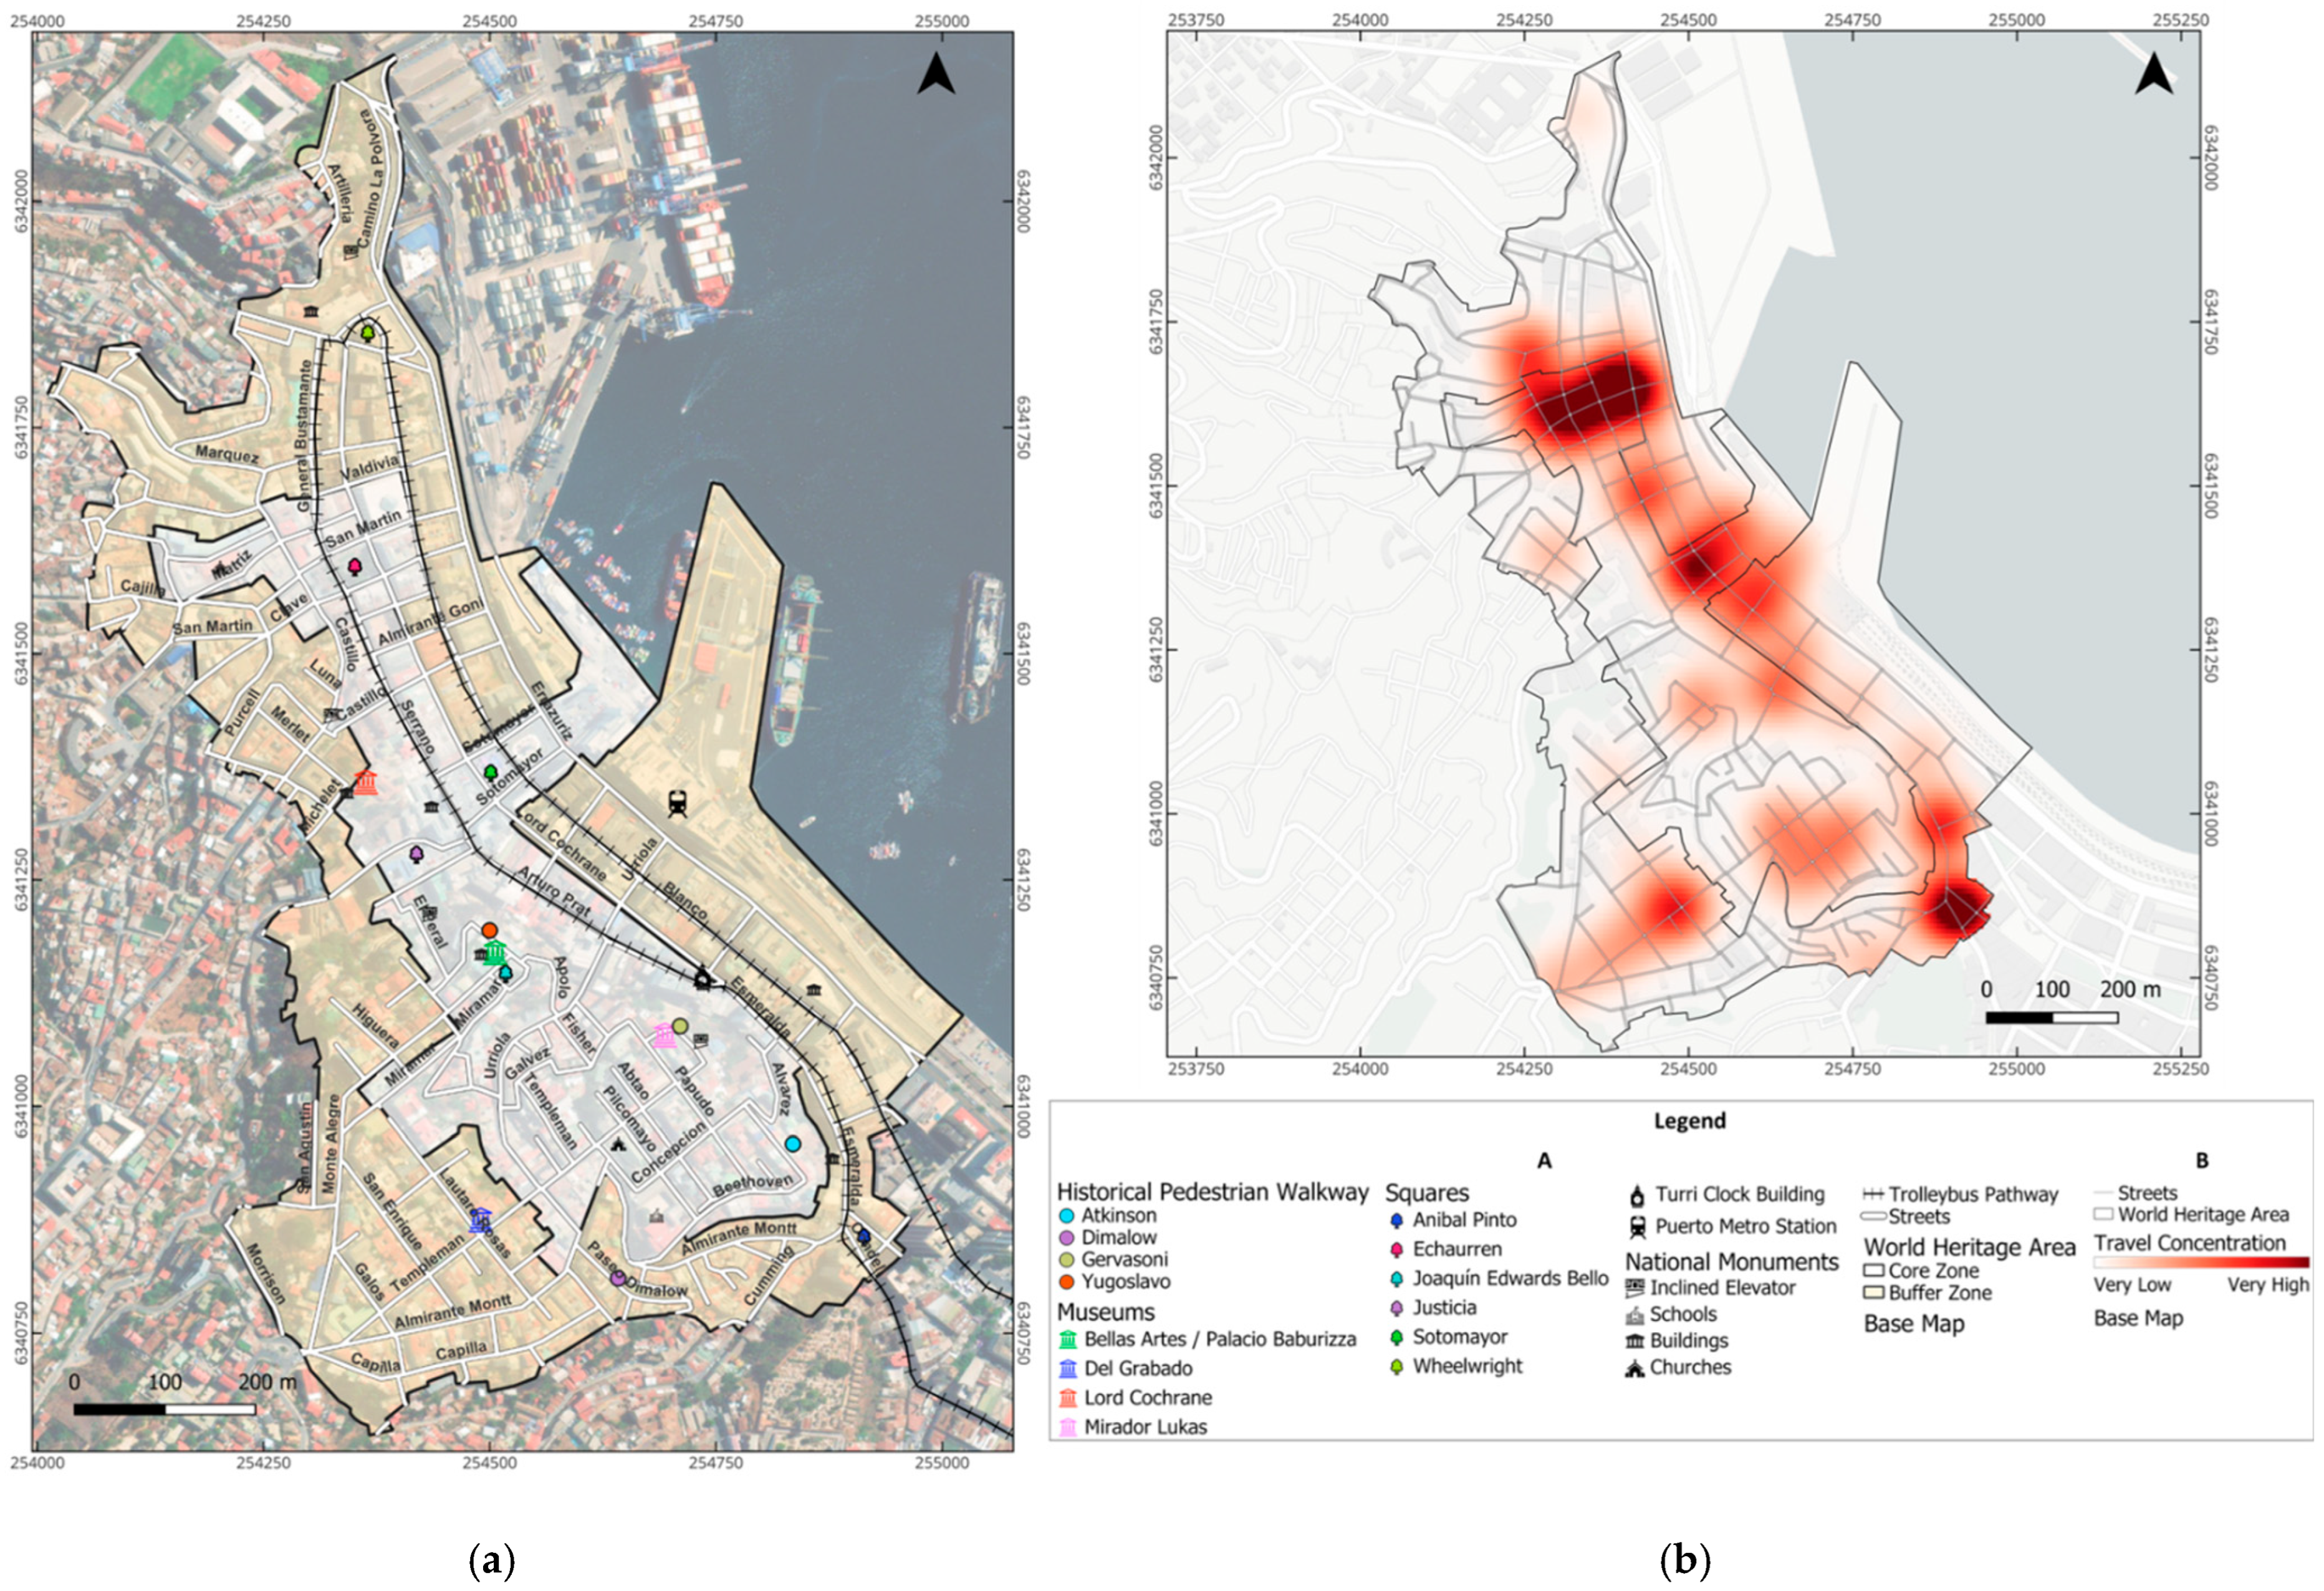
The historic area of Valparaíso, designated as a National Monument in the category of Typical or Picturesque Zone by the National Monuments Council of Chile in 2001, received UNESCO recognition as a World Heritage Site in 2003 [24]. According to UNESCO [7], this distinction highlights its peculiar urbanism on hills, church bell towers, and historic funiculars in a singular landscape, comprising a central area of 23,200 ha and a buffer zone of 44,500 ha (Figure 4a). This area receives trips from various parts of Valparaíso city and other cities in the region, mainly from Greater Valparaíso. The main areas to which people go within the WHS can be seen in Figure 4b, which shows the concentration of destinations within this area, according to data from the Origin–Destination Survey [10]. In this figure, it is possible to identify areas of greater concentration, such as Plaza Echaurren and its surroundings, Plaza Sotomayor, Plaza Anibal Pinto, and the tourist sector of Alegre Hill (location of the hill in Appendix A Figure A1).
The characterization of the study area presented in this section relies on secondary data obtained from various publicly available, open-source Chilean government platforms. Specifically, mobility and demographic data were sourced from the Secretariat of Transport Planning (SECTRA) Origin–Destination Survey, the National Statistics Institute (INE), and the National Tourism Service (Sernatur). Geographic data for the World Heritage Site polygon and tourist infrastructure were obtained from the Chilean Data Infrastructure (IDE). Information on National Monuments was sourced from the National Monuments Council of Chile (CMN).

3.1. Tourism

Regarding the tourist description of the area, according to data from the Chilean Data Infrastructure (IDE), there are 128 tourist attractions in the city of Valparaíso, where 36 are located within the WHS and 21 in the core of this area [28]. Within the WHS are 22 National Monuments, including 12 Historical Monuments (such as elevators, churches, and customs houses) designated between 1963 and 2016 (see Table 1). There are also 10 Typical or Picturesque Zones designated between 1971 and 2001, highlighting the Alegre and Concepción hills and the Aníbal Pinto and Sotomayor squares, distinctive elements of the city [29].
The Valparaíso region is Chile’s main tourist attraction, hosting 20.07% of all tourist trips [31]. Both the city of Valparaíso and Viña del Mar, belonging to the Greater Valparaíso Metropolitan Area, are among the municipalities with the highest number of visitors. Viña del Mar leads tourist arrivals with a total of 5,399,441 trips between 2019 and 2022 [31], representing 2.66% of the national total (see Table 2). Valparaíso is in seventh place with 1.54% of total tourist trips.
Regarding trip characteristics, through the Origin Destination Survey (EOD) [10], it is possible to analyze the purposes of trips and the predominant mode of transportation. The main purpose of mobility towards the WHS is ‘Others’ (Returning home, picking up/dropping off someone, procedures, health, other activities, picking up/dropping off something), followed by ‘Work’ and ‘Leisure’. People prefer Public Transportation (44.4%) as a mode of transportation, followed by non-motorized mobility (37.4%). For ‘Leisure’ (16,832 total trips), non-motorized stands out with 65% (Figure 5).

3.2. Inhabitant Profile

The 2017 Census [33] reveals that approximately 4894 people reside within the WHS, 1.65% of the city population. Table 3 provides a detailed sociodemographic description, showing a slight male predominance, as the average female proportion in relation to the total population is 0.47, varying from 0 to 0.76 by traffic zone, determined by the OD survey [10]. The average age of the population is 41.57 years.
As for household size, the average is 2.44 people per household, with a maximum of 4.17. The 2014 Origin Destination Survey (EOD) [10] indicates an average of 0.29 cars per household, with a maximum of 1. The population in need of care (children under or equal to 14 years old and adults aged 60 years or older) represents an average of 1.26, reaching a maximum of 2.81.
In terms of education, the average number of people who have only completed primary education is 0.13, while the average of people with secondary education is 0.41. The unemployment of potentially active people is, on average, 0.15, while the average of working people is 0.5.
Finally, regarding the means of transport available in households, there is an average of 0.32 driving licenses per household, with a maximum of 0.72. The average number of households with at least one bicycle is 0.33, with 100% of households in blocks owning at least one bicycle.

3.3. Visitant Profile

Regarding those who visit the area for different purposes (leisure, work, others), Table 4 shows, as a characterization, averages of some sociodemographic indicators of this group of people, where the number of people who visit the area for other reasons stands out (returning home, study, health, looking for/dropping off someone, looking for/dropping off something, paperwork, other activities), being a total of 15,374 people, followed by work that brings together around 10,830 people and, to a lesser extent, leisure, representing a total of 4742 visitors. In addition, those who travel to this area for work are those who predominate in certain indicators such as average age (42.74 years), cars per household (0.82), higher education (0.67), workers (1.1), and driver’s license (0.66). In the trips originating in the city of Valparaíso with destination to WHS, those for other reasons predominate with approximately 26,033 trips, as well as this purpose prevails in the trips originating from other municipalities of Greater Valparaíso (the metropolitan area), with just over 33 thousand trips.

4. Materials and Methods

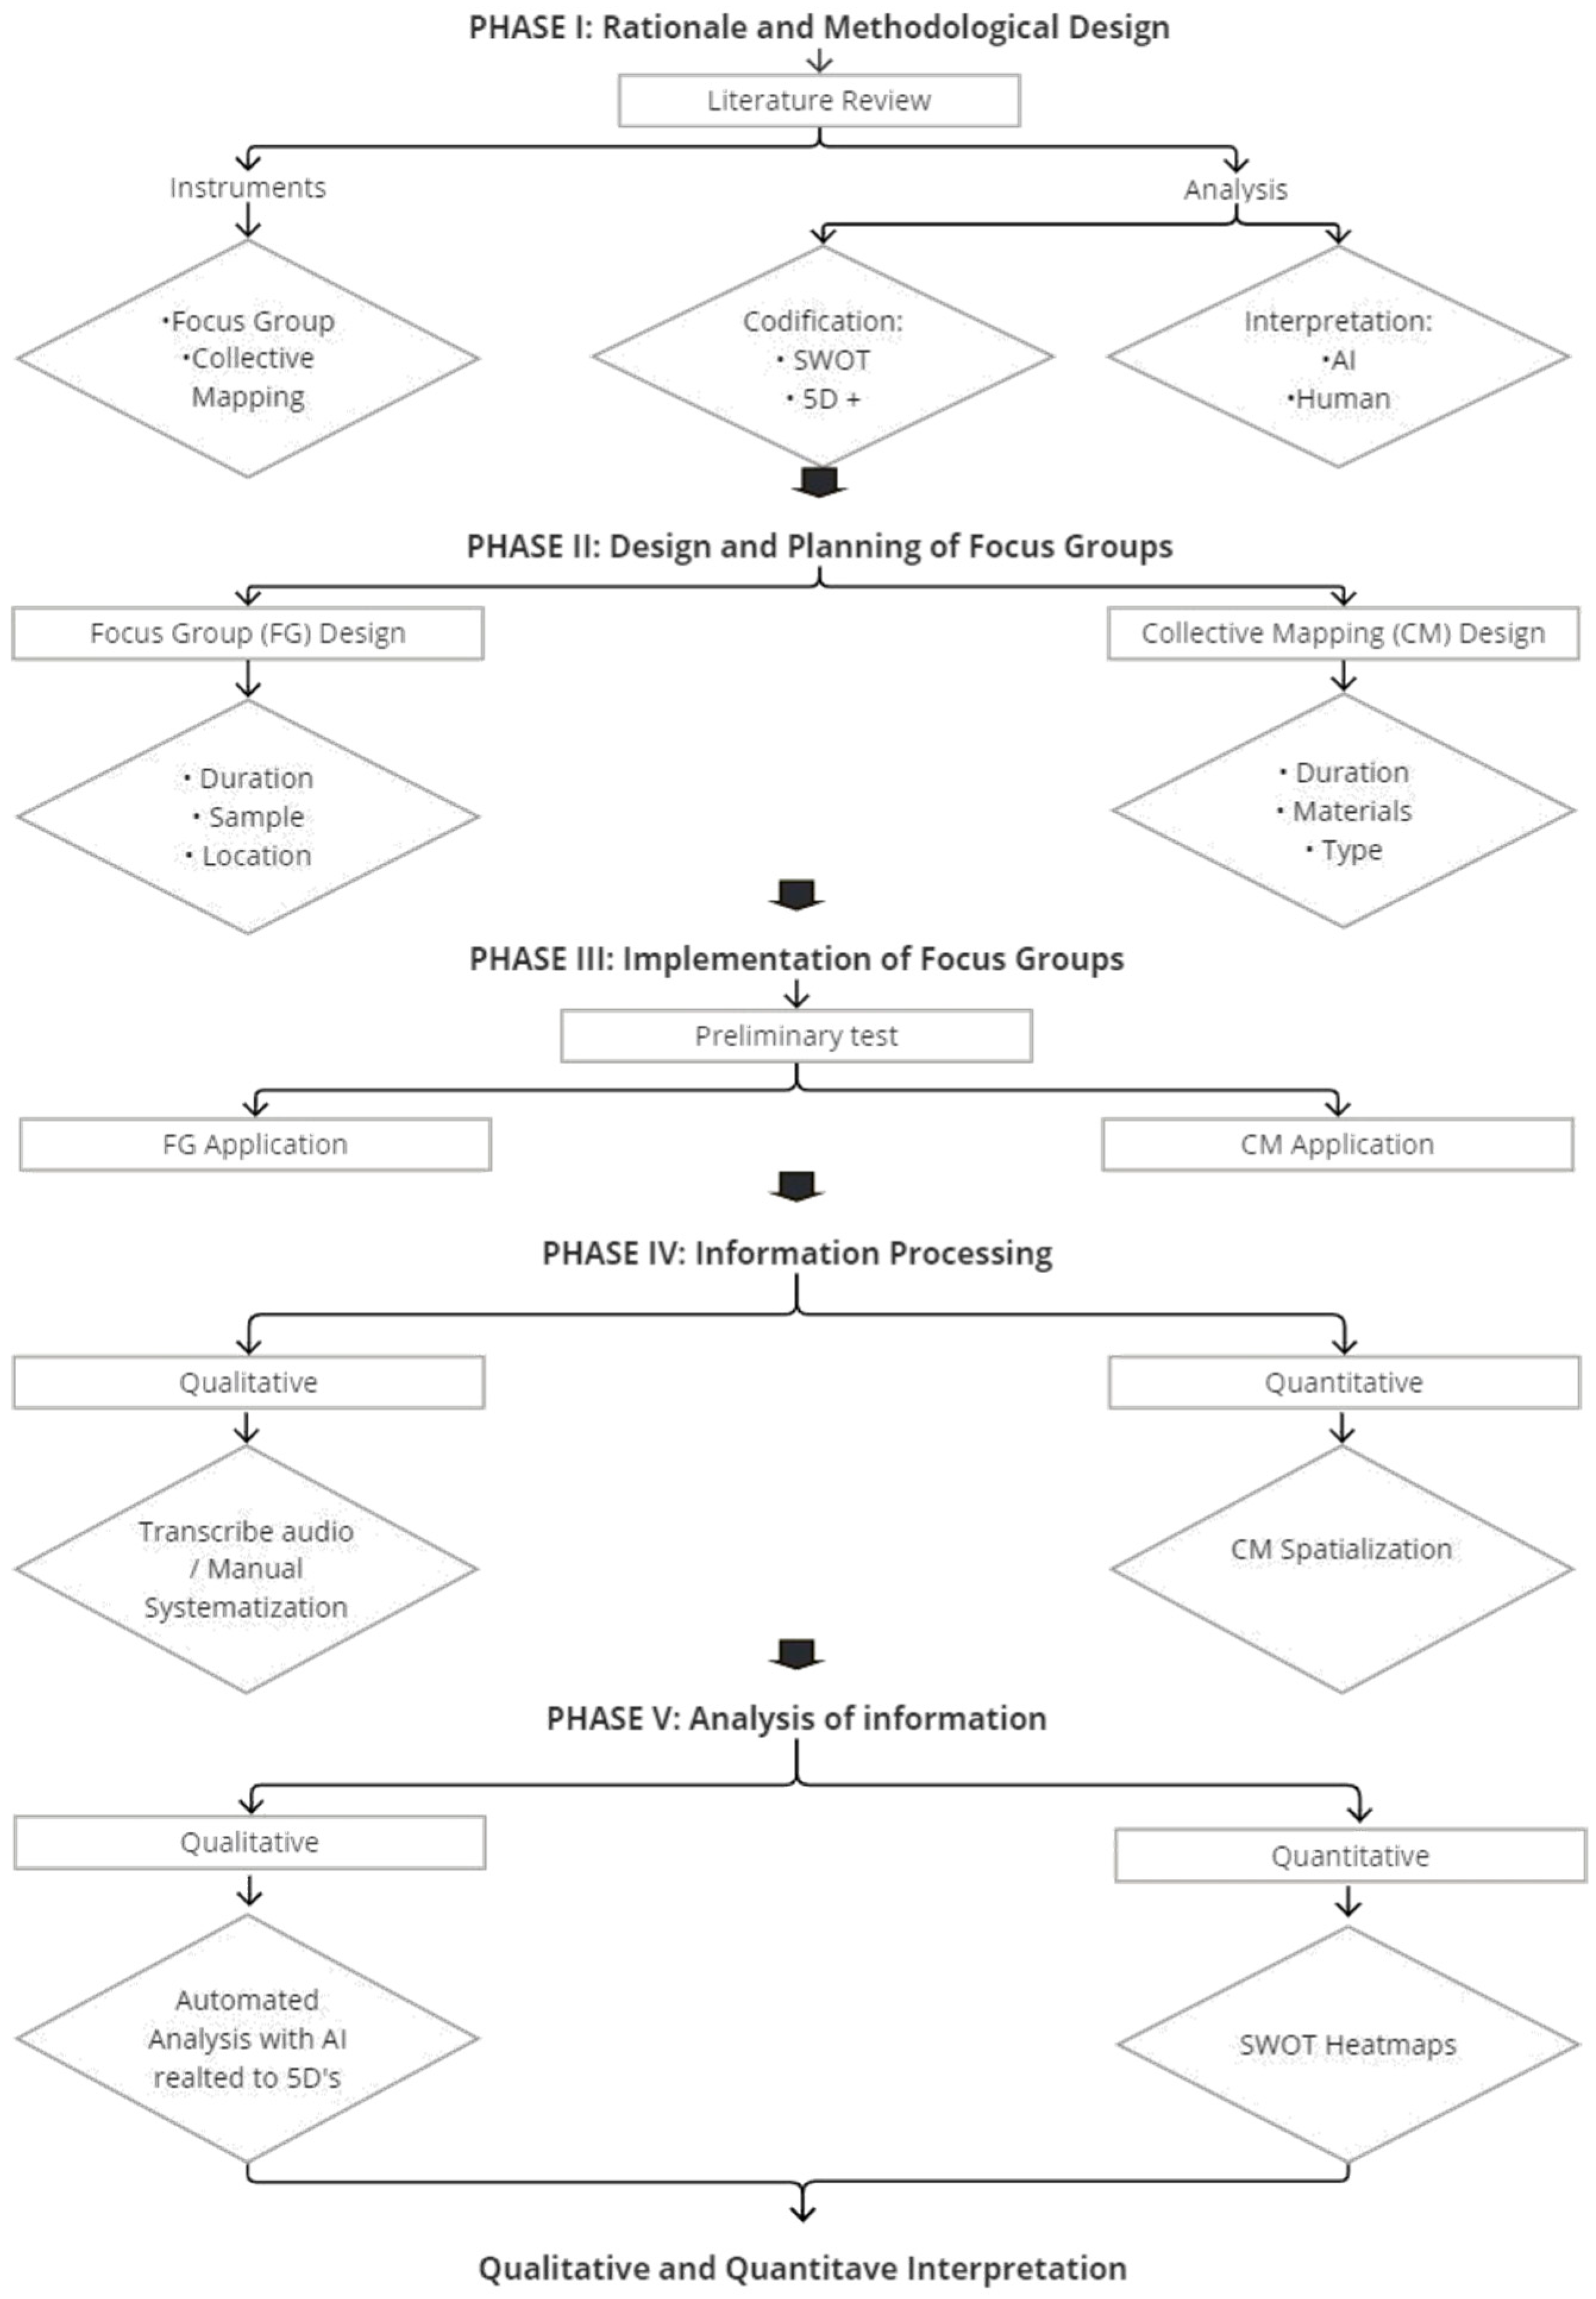
The methodology was structured in five phases (see Figure 6). The first, called “Rationale and Methodological Design”, consisted of a bibliographic review to select participatory methodologies. Techniques such as focus groups [34,35], tourism-oriented SWOT analysis [36], and collective mapping [37] were chosen.
The second phase, “Design and Planning of Focus Groups”, focused on the creation of the necessary instruments for their development (duration, number of participants, number of groups, moderators, among others) following the guidelines of Stewart and Shamdasani [38] and Puchta & Potter [11]. In addition, the precoding [39] was designed based on the SWOT analysis, built environment elements, and the type of collective mapping [37]. The third phase consisted of “Implementation of Focus Groups”, which included a preliminary test and the final implementation of the Focus Groups.
The fourth phase, “Information Processing”, was carried out, which involved the treatment of qualitative and quantitative information, involving the organization and coding of information, along with the definition and elaboration of all inputs, transcription of audios, georeferencing SWOTs, list of words organized from the transcripts, and the coding context so that the transcripts converged with the Focus Group automation method using Artificial Intelligence.
The fourth phase consisted of “Information Processing” resulting from the sessions, that is, the transcribed audios and the spatialization of the results of the participatory mappings, which will be explained in depth in Section 4.4. The analysis of the information collected from the audios was performed through Artificial Intelligence (AI), allowing the automation of the qualitative information analysis process to relate it to the 5 dimensions of the urban environment [40,41] and complemented with condition and use of social infrastructure [42]. Regarding the quantitative data, heat maps were generated with what was obtained from the collective mapping for each SWOT dimension.

4.1. Rational and Methodological Design

Based on a bibliographic review, a methodology was designed to obtain information from primary sources using tools related to concepts such as “Focus Group”, “Mobility”, “SWOT analysis”, and “Collective mapping”. The choice to implement a Focus Group was based on its effectiveness as a qualitative method to collect information [12], bringing together participants exposed to structured group interactions in order to obtain opinions and experiences on a specific topic defined by the researcher [43]. Focus Groups have advantages such as speed, efficiency, and the ability to provide more information than a survey, in addition to not requiring participants to prepare in advance [44]. Also, collective mapping was considered under the conception of a process of creating opinion and experience on the territory [37].
For the analysis structure, a coding of the selection of analytical work methods proposed by Saldaña [39] was considered. Specifically, for the first coding cycle, the SWOT Analysis was considered, understood as a method of analysis of the external and internal situation determining the characteristics of a scenario [45], and used for the purpose of obtaining the perception and opinion of the participants about mobility and electro-mobility in the WHS of Valparaíso from a tourism perspective. In addition, Table 5 presents established definitions for each SWOT dimension.
For the second coding cycle, we employed a ‘5D+’ framework to analyze the data extracted from the participants. This approach is based on the five dimensions of the urban environment [40,41]: density (the concentration of population and activity) [49], diversity (the mix of land uses) [49,50], design (the quality of the urban fabric and public space) [50,51,52,53], destination (accessibility to transit and points of interest) [50,54,55,56,57,58], and distance (the proximity to key services and transport) [50,51,53,54]. This framework was complemented by a sixth dimension (the ‘+’), called condition and use of social infrastructure [42]. Each of the above dimensions was described in detail in a dictionary, generating a full definition and keywords (Appendix A Table A1), with the aim of entering them as instructions to artificial intelligence to automate an organized output of information generated by focus groups that will be interpreted and analyzed.

4.2. Design and Planning of Focus Groups

The generalities of the Focus Group sessions considered the type of sample, number of Focus Group sessions and number of focus groups per session, location of the activity, moderators, along with the ethical considerations required for this exercise. The duration of the activity was defined according to the recommendations of Puchta & Potter [11], who suggest 2:30 h on average, and the number of sessions, in addition to the techniques of encouraging participation as suggested by Stewart & Shamdasan [38], where a coffee break was offered in each session. An online survey was also developed in Google Forms to collect information on the profile of the participants, which included questions on socioeconomic and mobility information, along with a consent section to ensure anonymous use of the data.
For the Focus Groups, a manual was prepared for participants that included an explanation of the SWOT analysis, with examples related to the consumption of a chocolate bar, opening questions, and SWOT matrices for individual and group responses to pre-established questions (Appendix A Table A2). In addition, information maps were generated (corresponding to map “a” in Figure 4), and iconography was used with designs by iconoclasts [37], along with colored flags and markers corresponding to the SWOT (Strengths: Green, Opportunities: Light Blue, Weaknesses: Yellow, and Threats: Red), to stimulate participation and represent ideas on maps.
An opening question was created to start the group discussion: “What do you think of the historic center of Valparaíso from your experience of mobility and leisure and tourism activities?”. Then, participants were asked to individually answer a SWOT analysis form based on Section 1, which contained general questions about public transport. Subsequently, group activities were carried out in which participants reflected and completed a group SWOT form. In Section 2, these activities were repeated around questions oriented to the use of electric bicycles in the WHS. The sections and questions mentioned are available in Appendix A Table A2.
Afterward, a coffee break was held, and collective mapping was carried out with the same groups, starting with the opening question, “What do you think about the use of electric bicycles in the historic center of Valparaíso for leisure and tourism activities?” in which participants were able to express their opinions or experiences related to the question.
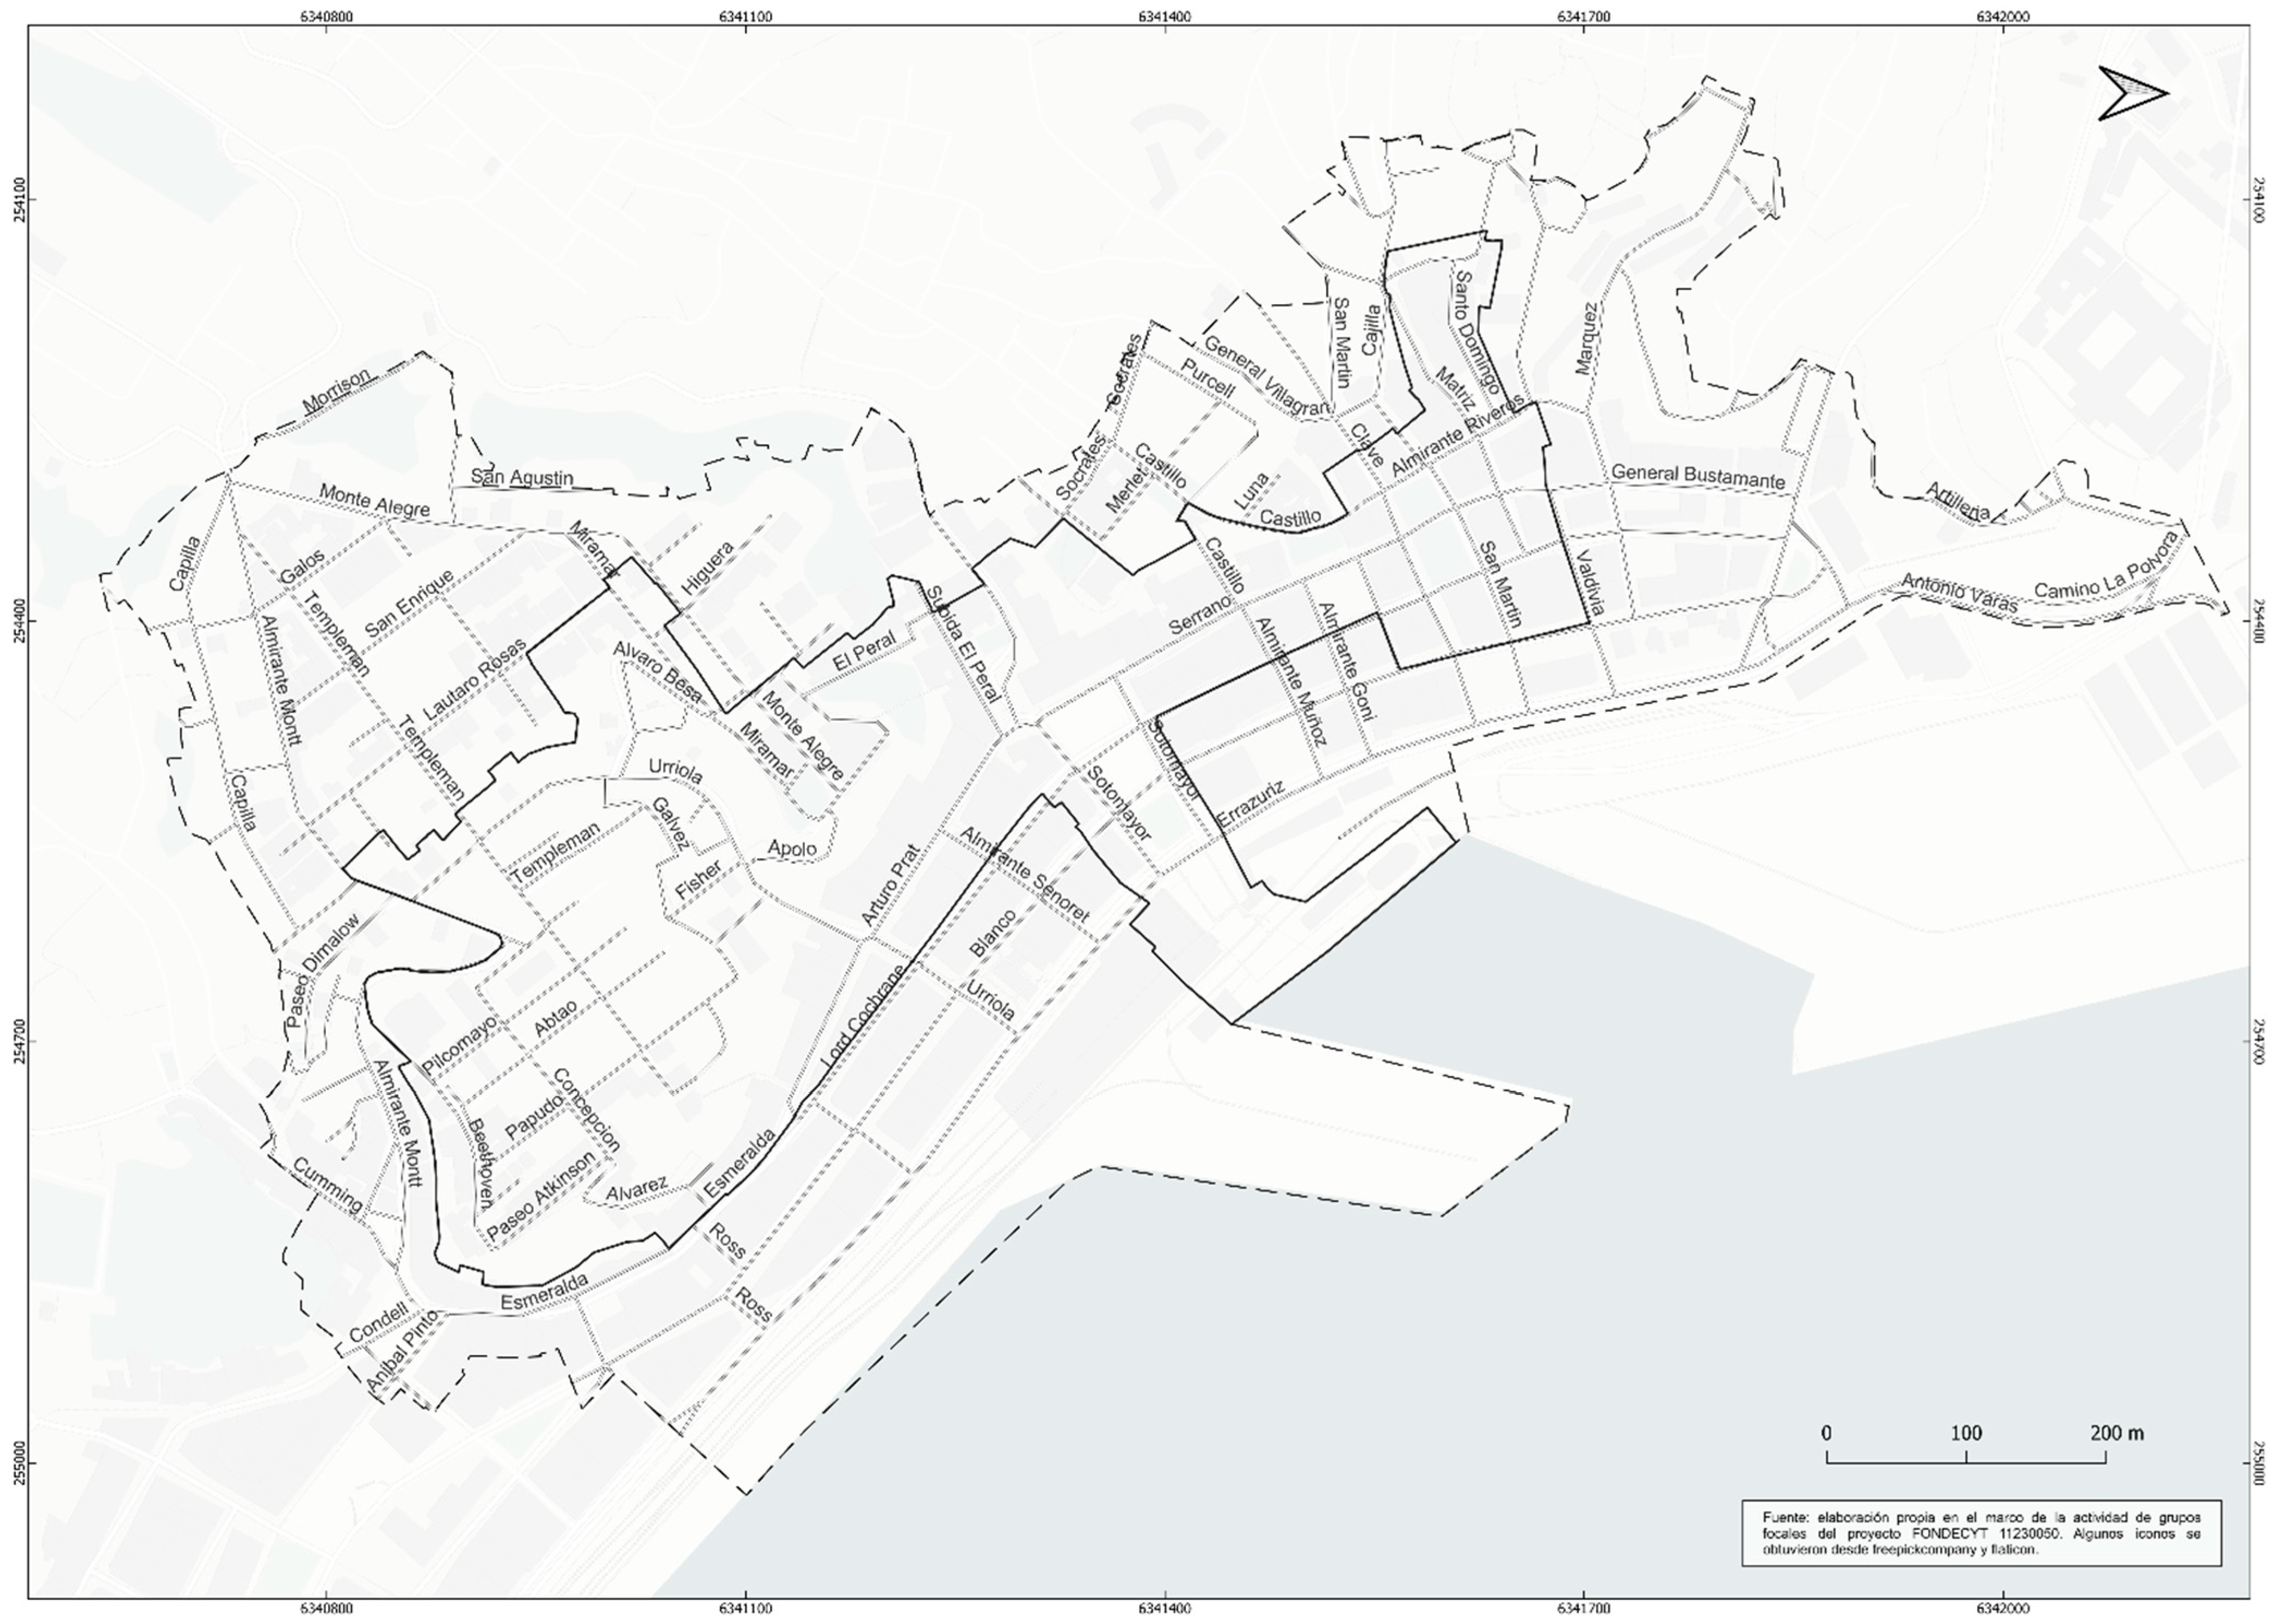
The materials given to each group consisted of a base plan of the WHS with the area boundary, its buffer area, and the streets in the same area (Appendix A Figure A2), along with flags and an information map highlighting the attractions of the WHS (Figure 4a), in addition to providing them with iconography to facilitate the identification of relevant situations.
The aim was for participants to be able to express their opinions or experiences described in the first part of the activity in the territory, that is, on the map provided, making use of the flags and iconography that they could stick on them, in addition to colored pencils corresponding to those used by dimension to draw areas of influence and frequent routes, writing or scratching if necessary to express their opinions.

4.3. Implementation of Focus Groups

The focus group and participatory mapping pilot test were started, where the necessary adjustments were made not to exceed the stipulated time limit. The focus group application was carried out on 4 different days, with 4 sessions, bringing together a total of 13 focus groups, with a total of 70 participants (19 in the first and second, 28 in the third, and 4 in the fourth). The sample mainly included undergraduate and master’s students, divided into groups of 4 to 7 participants. These sessions were held at the facilities of the university and the department of the main researcher of this study. This activity was accompanied by a previous online survey, with the aim of knowing the profile of the focus group participants.
The sample was defined as students of a Higher Education Institution at the campuses in the city of Valparaíso. Special attention was paid to ethical considerations, and consent forms certified by the university were obtained to ensure the proper use of the results and the anonymity of the participants. These consent forms were addressed to both the online survey participants and the Focus Group participants, and their online approval and in-person signature were required.

4.4. Information Processing

This stage included the systematization of the results of the sessions, considering the information that each participant wrote in their respective manual, the audio recordings of the activity obtained from each group, and the results of the collective mappings. First, the comments and opinions that the participants expressed in the manuals were digitized in an Excel spreadsheet by answering the questions described in Table A2. Secondly, the maps resulting from the collective mapping were also digitized, which contained the representative flags of each SWOT dimension, areas of influence, and most frequent routes. This digitization carried out in the QGIS software (version 3.28.7) sought to generate vector files with the three types of spatial files (points, lines, and polygons), with the objective of analyzing the information from the collective mappings from a spatial perspective, where the flags were considered as points, the areas of influence as polygons and the frequent routes as lines. To visualize the spatial distribution and concentration of these points, heatmaps were generated for each SWOT dimension using a Kernel Density Estimation (KDE) algorithm. This technique calculates the density of features in a neighborhood, allowing for the visual identification of perceptual hotspots.
For the processing of the information, a data coding methodology was used following the indications proposed by Saldaña [39], carrying out in the first instance a First Cycle Coding Method, making use of the Exploratory, Grammatical, and Elemental methods simultaneously (see Table 6). All the coding presented in the table was used for processing the information of the Focus Groups, while the Holistic and Provisional coding was used for processing the collective mappings.

4.5. AI-Supported Qualitative Analysis and Validation

The AI solution was employed as a tool to support the qualitative analysis of the focus group transcripts. The system utilized a pre-trained Large Language Model (LLM), specifically OpenAI’s gpt-4o-mini model, integrated within a Python (version 3.10.11) environment using the Langgraph library to structure the analysis process [59]. The system integrates a memory component in the form of a vector database and a set of tools, including a semantic retriever function.
The AI agent system functions by receiving a written instruction and executing a deterministic set of steps, represented as a graph. The proposed solution is inspired by graph formulations that have been successfully presented in the literature [60]. The specific steps were designed to automate the extraction and synthesis of information from the focus group data and are presented as follows: Information Gathering, Initial Outline Generation, Question Generation, Tool Utilization for Question Answering (via a Retrieval-Augmented Generation mechanism), Response Compilation and Outline Refinement, and Final Report Generation.
This approach to automated analysis offers several advantages, including increased efficiency in processing large volumes of qualitative data and consistency in analysis [60]. Moreover, by using a vector database for memory and accessing external tools for enhanced data retrieval, the system ensures that the analysis is grounded in relevant information sources [61].
The adoption of such an AI agent approach aligns with recent trends in the development of automated systems that combine various components for complex tasks, as discussed in AI research [62]. These systems, which integrate large language models, external memory, and tool usage, have been shown to enhance the flexibility and scalability of automated analyses in various domains [60,61].
Crucially, to ensure the reliability and validity of the results, a rigorous human validation process was implemented. The outputs generated by the AI agent—specifically the phrases and thematic classifications—were systematically reviewed by two of the researchers against the original transcripts. This manual cross-referencing served to correct any misinterpretations, discard irrelevant outputs, and verify that the AI’s classifications accurately reflected the context and intent of the participants’ statements. This human-in-the-loop approach was essential to guarantee the qualitative integrity of the findings and mitigate any potential for model-induced errors.

4.6. Data Reliability and Quality Control

To ensure the reliability of the findings from the focus groups, a multi-stage quality control process was implemented. First, each focus group was guided by trained researchers from the team, who followed a consistent script to ensure comparability across sessions.
Second, a two-step transcription process was employed. The audio recordings from each session were initially transcribed using an AI-assisted service. Recognizing the limitations of AI in accurately capturing the nuances and local idioms of Chilean Spanish, a rigorous human verification process was conducted. Two researchers meticulously reviewed each AI-generated transcript while listening to the original audio recordings. This crucial step involved correcting transcription errors, ensuring the accurate capture of participant statements, and preserving the original intent and context.
Finally, a data cleaning phase was performed. The verified transcripts were reviewed to filter out any off-topic discussions or segments not directly related to the research questions, ensuring that the subsequent AI-supported analysis was performed on a relevant and coherent dataset.

5. Results

5.1. Participants Profile

The sample of focus group participants is made up of 70 people, distributed among undergraduate (66) and graduate students (4). Table 7 shows a summary of the distribution of participants by sessions, where a predominance of participation by men over women is observed in 3 of the 4 sessions that were held, with an average age between 22 and 24 years for the first 3 sessions, while in the last one, an average of 34 years of age was reached. Of this sample of participants, 68 are of Chilean nationality, 1 of Panamanian nationality, and 1 of French nationality.
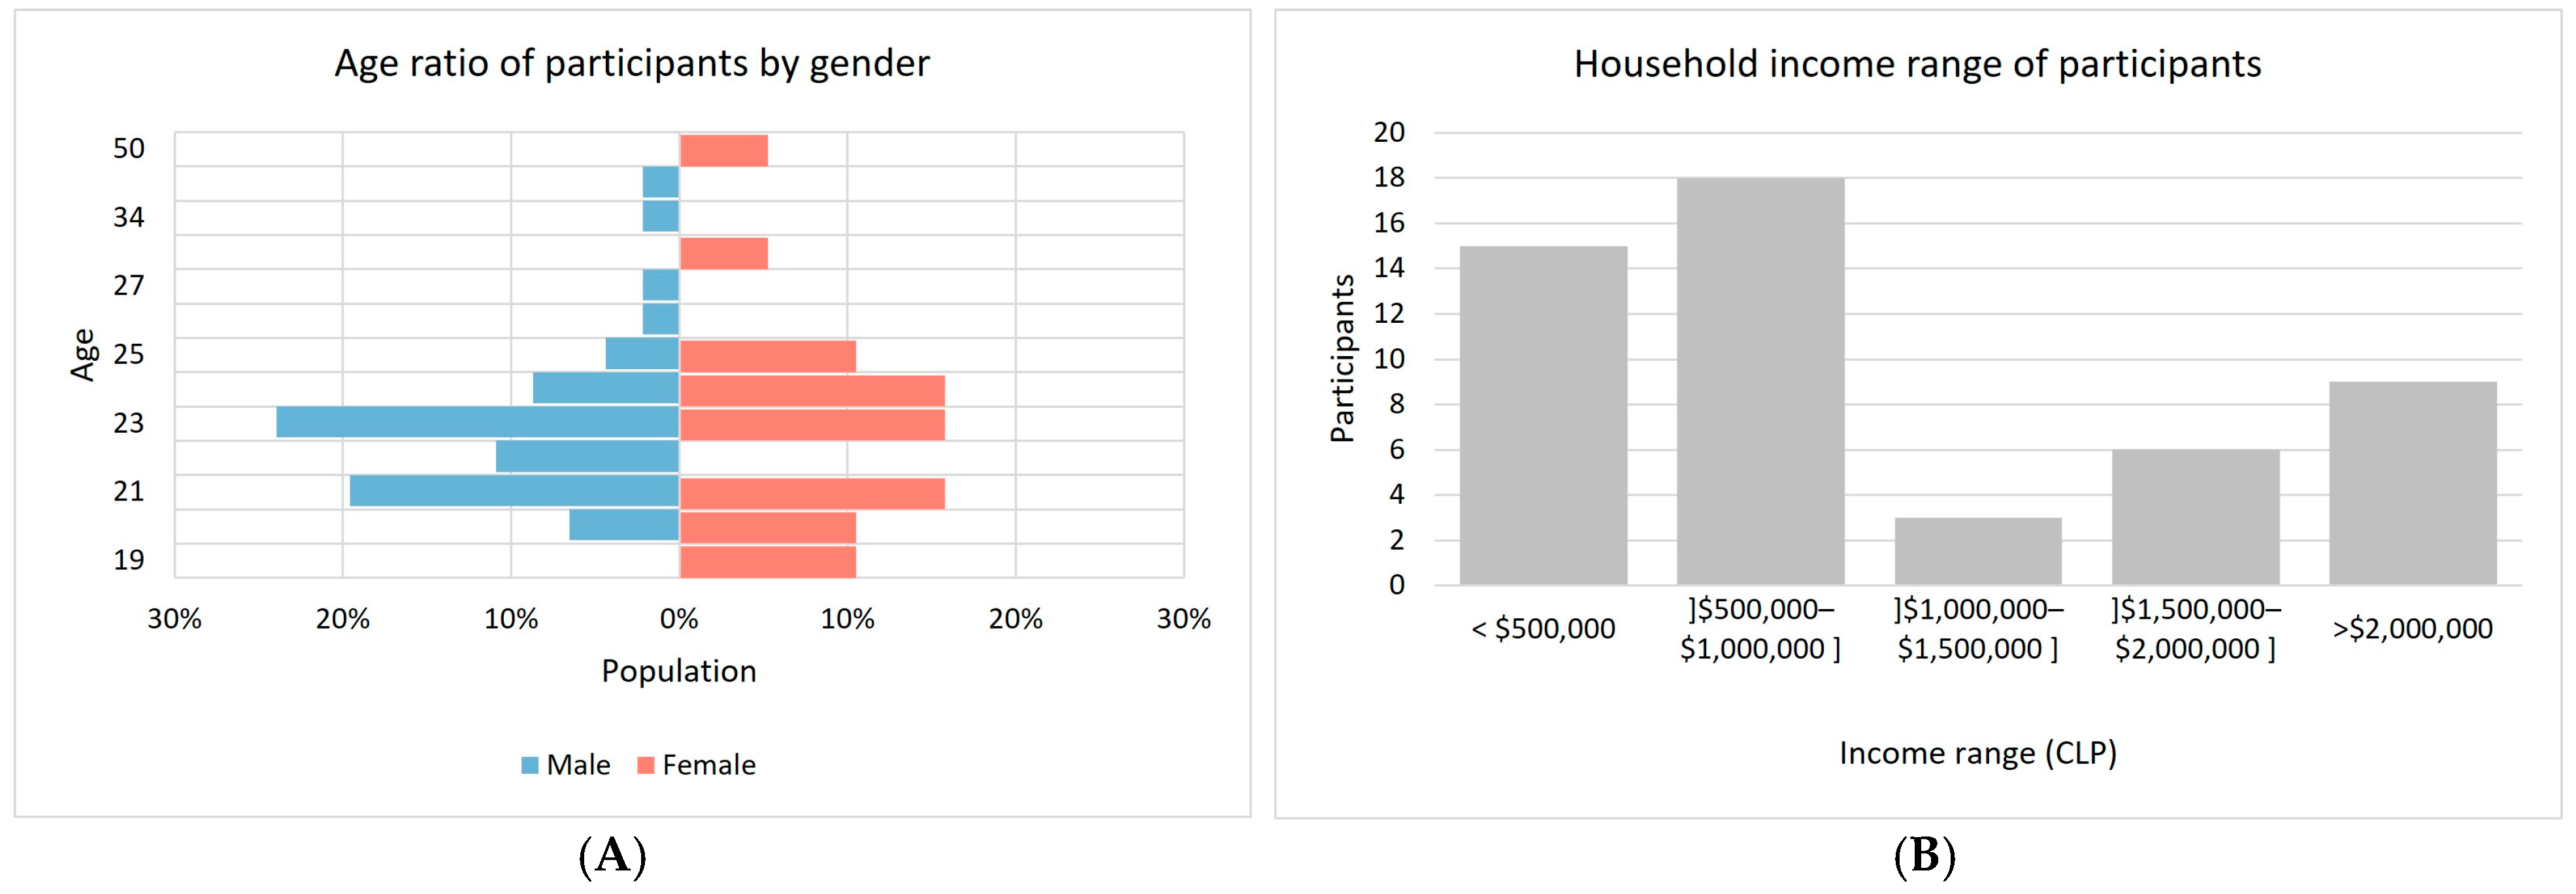
The survey conducted prior to each activity was answered by 58 people who participated in the focus groups, with a greater number of men than women, reaching almost 25% of male participants aged 23, in addition to almost 20% of men aged 21. As for women, the ages most represented are 21, 23, and 24 years, with approximately 15% each (Figure 7A). The survey allowed us to know the range of family income of the participants presented in Figure 7B, where it is observed that most of the responses are between $500,000 and $1,000,000 CLP, while the smallest number of responses are centered on the range of $1,000,000 to $1,500,000 CLP.

5.2. Tourism Aspects of WHS

Regarding the results related to tourism, participants prefer to make leisure trips to the WHS on weekends, predominantly on Saturdays (34.1%), Sundays (21.2%), and Fridays (20.5%), visiting mainly points of interest such as viewpoints (20.2%), walks (13.3%), and elevators (11.3%). To a greater extent, participants respond that they prefer to make these trips by bus (23.8%), walking (16.5%), and subway (14.6%), highlighting the very low percentage of responses related to trips by bicycle with 0.6%. The reason for choosing these modes of transport to make the tour in the heritage site was mainly cost (18.9%), comfort (18.3%), landscape (15.9%), and security (15.2%).
The survey contained a question related to establishing an order of importance of the most valuable aspects within the WHS on a scale of 1 to 10. The result of this is shown in Figure 8, where an average score was calculated for each aspect according to the participants’ responses, highlighting architecture in the first place, followed by green areas, landscape, security, and cultural activities among the best scores.

5.3. SWOT Analysis from Participatory Mapping

Regarding the SWOT analysis related to the potential use of E-Bikes in the WHS of Valparaíso, of a total of 279 flags placed in 4 Focus Group sessions, specifically the participatory mapping activities (see Figure 9), 80% were icons, 16% writing, 3% none, and the remaining 2% icon and writing. Of the total points marked on the map, Strengths 25%, Opportunities 20%, Weaknesses 29%, and Threats 27%. Furthermore, it is interesting to note the similarities between the marked areas, representing more recent perspectives of places participants visit, and the concentration of trips identified in Figure 4b, which is based on 2014 data. This validates that patterns of attractive and visited places for visitors have not suffered a significant change in the WHS of Valparaíso.
The Kernel Density Estimation analysis (Figure 9) reveals distinct spatial patterns in participants’ perceptions. The results show a significant concentration of Strengths in social hubs like Plaza Sotomayor and Plaza Aníbal Pinto (see Figure 9a). Weaknesses are concentrated in Plaza Echaurren and Plaza Sotomayor and are also concentrated in various parts of the WHS. Opportunities are concentrated mostly in Plaza Sotomayor (see Figure 9c). Finally, threats are concentrated in Plaza Echaurren and Plaza Aníbal Pinto (see Figure 9d).
In addition, it is possible to observe that the strengths are mostly concentrated and related to meeting places, popular activities, and music events. This suggests that these social hubs, such as Plaza Sotomayor, could serve as strategic locations for E-Bike rental stations and starting points for tourist routes, leveraging the existing flow of people. On the other hand, weaknesses demonstrate a more dispersed pattern, highlighting deteriorated street conditions and potholes on streets and walking pathways beside the steep hills of this area. This weakness is critical for cyclists, as poor pavement not only reduces comfort but also poses a direct safety risk that an E-Bike’s electric motor cannot mitigate. The combination of steep slopes with deteriorated surfaces creates a more significant accessibility barrier than the topography alone. Regarding opportunities, there is a slightly more dispersed pattern related to improving public spaces, in general, and safer cycling conditions. This indicates that promoting E-Bikes should not be seen as an isolated cycling infrastructure project, but as an integral part of a broader urban renewal strategy that benefits all users of public space. With respect to threats, there are two areas highlighted that indicate an unsafe perception of places, risk of harassment, excessive use of alcohol, exposition to crimes, and dependencies on illegal substances. The concentration of these threats in areas like Plaza Echaurren is a key deterrent that could render certain E-Bike routes unviable, especially for tourists or during off-peak hours. This demonstrates that the feasibility of electric micromobility depends as much on the physical infrastructure as on the creation of a socially safe environment.
Overall, the SWOT analysis reveals that the barriers to E-Bike adoption in the heritage site are socio-spatial in nature, not merely topographical or infrastructural. Weaknesses, such as deteriorated pavement, and threats, like the perception of insecurity, are determinant factors that shape the mobility experience and the viability of any new transport initiative. This implies that the mere introduction of electric bicycles would be insufficient if the quality and safety of the urban environment were not addressed. The promotion of E-Bike use therefore should not be viewed only as a transportation solution, but as an opportunity to catalyze a comprehensive improvement of public space. The planning of cycling routes must actively consider the threat-prone zones to either avoid them or, preferably, integrate them into urban regeneration projects that tackle the underlying causes of insecurity. Ultimately, the success of the E-Bike in Valparaíso is intrinsically linked to building a safer, more attractive, and well-maintained city for everyone.

5.4. Focus Group Analysis with Artificial Intelligence

The integration of focus group methodology with artificial intelligence (AI) provides a framework for analyzing qualitative data related to the urban environment. In this study, AI was employed to enhance the analysis of focus group discussions, specifically examining the perceptions of participants regarding the use of electric bicycles (E-Bikes) in the Historic Quarter of the Seaport City of Valparaíso, Chile. This section explores the interplay between focus group insights and the urban environment, highlighting how AI facilitated a deeper understanding of the factors influencing sustainable mobility and urban planning.

5.4.1. Application of AI in Analyzing Focus Group Data

The utilization of AI, specifically the AI agent system developed with the LangChain library, streamlined the analysis of extensive qualitative data generated from focus groups. The AI facilitated the transcription, coding, and thematic analysis of discussions, enabling the identification of key patterns and insights related to urban mobility and infrastructure. It is important to highlight that the outputs and transcripts are in Spanish because it is the language used by participants. However, the interpretation presented in the results section seeks to express in English the main ideas from the output of the AI process.
By automating the initial stages of data processing, AI allowed for a more efficient and consistent analysis, ensuring that the focus group findings were accurately interpreted and aligned with the study’s objectives. The AI-driven approach also enabled the integration of diverse data points, such as density, diversity, design, destination, distance, and the condition of social infrastructure, into a cohesive analytical framework. This methodological synergy between human insights and machine processing enhanced the depth and reliability of the study’s conclusions.

5.4.2. Relationship Between Focus Groups and the Urban Environment

Focus groups serve as a vital tool for capturing the nuanced perceptions of community members about their urban surroundings. In the context of Valparaíso, participants provided valuable insights into how the city’s unique topography, infrastructure, and social dynamics influence mobility patterns and the potential adoption of E-Bikes. The discussions revealed that the steep hills, narrow streets, and varied sociospatial conditions significantly impact the feasibility and attractiveness of E-Bikes as a sustainable transport option.
Participants emphasized the importance of designing E-Bike routes that accommodate the city’s challenging terrain while promoting safety and accessibility. The focus group discussions highlighted the need for improved signage, dedicated cycling paths, and educational campaigns to foster coexistence between cyclists and motorists. These insights underscore the critical relationship between community perceptions and the physical urban environment, informing targeted interventions for enhancing sustainable mobility.

5.4.3. Findings on the Urban Environment from Focus Groups

The focus group analysis, supported by AI, identified several key themes concerning the urban environment of Valparaíso. Participants noted that the high density of services and points of interest presents both opportunities and challenges for E-Bike route design. While dense areas offer numerous destinations, the existing infrastructure may be inadequate to support safe and efficient cycling, particularly on steep and narrow streets. Participants noted that the mixed land uses within the proposed cycling routes affect cyclists’ experiences. Areas with a blend of urbanized zones and quieter neighborhoods require adaptable infrastructure solutions to accommodate varying traffic patterns and ensure accessibility for all users.
The focus group concluded that urban design elements, including signage and dedicated cycling lanes, are crucial for the safety and comfort of E-Bike users. Participants stressed the need for well-maintained and clearly marked cycling paths to effectively navigate the city’s topographical challenges. In addition, it is commented that the accessibility to tourist attractions and services is fundamental for the success of E-Bike routes. Ensuring that destinations are easily reachable by E-Bike, despite the city’s steep streets, is essential for promoting sustainable tourism and enhancing the overall visitor experience.
Participants noted that optimal distances between points of interest are vital for maintaining cyclist satisfaction and safety. Routes ranging from 5 to 15 km were suggested as ideal, balancing users’ need for comprehensive coverage with manageable exertion levels. Participants comment that the current state of urban infrastructure, such as sidewalks and cycling paths, significantly impacts E-Bikes’ usability. Participants highlighted the need for improvements in infrastructure to create a safe and inviting environment for cyclists, thereby encouraging greater adoption of E-Bikes.

5.4.4. Integration of AI-Driven Insights with Urban Planning

The AI-analyzed focus group data provided actionable insights that can inform sustainable mobility strategies in Valparaíso. By understanding the community’s perceptions and the specific urban challenges, urban planners can develop targeted interventions to promote E-Bike infrastructure. Recommendations generated by AI analysis are divided into four areas, which include the following:
  • Infrastructure Enhancement: Upgrading the current transport infrastructure to accommodate and the creation of dedicated E-Bike lanes to improve safety and accessibility.
  • Educational Campaigns: Implementing initiatives to educate cyclists and motorists about safe practices and E-Bikes’ benefits, fostering a shared road use culture.
  • Route Optimization: Designing E-Bike routes that consider the city’s topography and density, ensuring that routes are both practical and enjoyable for users.
  • Community Engagement: Continuously involve community members in planning through participatory mapping and focus groups, ensuring that urban development aligns with residents’ needs and preferences.
To complement this analysis, Table 8 brings paraphrases from transcripts generated from the focus group sessions. It is important to notice that the original transcripts are in Spanish, and that the table presents paraphrases translated by the authors of this article. In terms of infrastructure enhancement, participants comment on the need for creating separate cycle paths that connect to metro stations of the city, improving existing transport infrastructure and urban equipment (such as lighting), and installation of charging points for E-Bikes in potential routes. In terms of educational campaigns, paraphrases indicate that there is a need for educational programs and actions for drivers to coexist safely in the streets of the city, in addition to the installation of road signs in the city that depict the street as shared spaces between modes of transport. Regarding route optimization, a participant highlights the need for the integration of bicycle routes with public transport, the generation of dedicated and safe routes for E-Bikes, and transport and urban planning that can prioritize bicycle lanes over car parking. Lastly, the community engagement area paraphrases selected indicate that planning E-Bike routes and their inclusion in the city should follow the example of other organizations that seek to understand where improvements are needed and to whom. Also, in this area of improvement, a participant affirmed that there is a need for political will, referring to an expected better cohesion between governance and infrastructure development to ensure better usage of public spaces and possible use of streets for E-Bikes.
Integrating AI-driven analysis with urban planning enhances data processing efficiency and ensures that the strategies developed are grounded in real community experiences and perceptions. This approach supports the creation of a sustainable and inclusive urban environment that promotes active mobility and preserves the historic character of Valparaíso.
The combination of focus group methodology and artificial intelligence has proven to be a powerful tool in understanding the intricate relationship between community perceptions and the urban environment. In Valparaíso, AI-facilitated analysis of focus group discussions provided deep insights into the factors influencing the adoption of E-Bikes, highlighting both opportunities and challenges within the city’s unique urban landscape. These findings offer valuable guidance for urban planners and policymakers aiming to promote sustainable mobility and enhance the quality of life in historic urban areas. The successful application of AI in this context demonstrates its potential to support ongoing community engagement and informed decision-making in urban development initiatives.

6. Conclusions

The results of this study show that the potential use of E-Bikes is not limited to the slopes of the historic quarter of Valparaíso. This is evidenced by the combination of participatory SWOT mapping and transcript analysis based on key urban environment concepts, giving participants the opportunity to share perspectives on mobility while geographically locating their experiences. The combination of focus groups with participatory mapping was also found relevant in the study of Vajjhala and Walker [21], confirming the value of integrating qualitative perceptions with spatially explicit methods.
While transcripts from focus group discussions emphasized topics related to transport planning and educational issues, participatory mapping was able to highlight behavioral and sociospatial problems affecting mobility—such as areas of illegal substance use and harassment—similar to the community severance and social–environmental barriers identified by Mindell et al. [17] in London. This indicates that qualitative mapping can capture complex, non-infrastructural barriers often overlooked in survey-based or purely quantitative transport studies.
Barriers to E-Bike use in Valparaíso therefore extend beyond slope or infrastructure, encompassing safety, public space maintenance, and perceptions of insecurity. This aligns with Banister’s [63] broader argument that transport problems stem from urban social conditions, and with Mahmoudi et al. [19], who also found that community perceptions of neighborhood safety and infrastructure quality critically influence active mobility adoption.
In comparison with other research, our findings confirm several recurring patterns. Similarly to the work of Pánek and Benediktsson [16], who showed cyclists’ strong emotional responses to unsafe or traffic-heavy routes, our focus groups revealed that fear of harassment and crime are decisive deterrents, even when infrastructure exists. Likewise, the emphasis placed by participants on green areas and public space echoes the importance of environmental quality observed in Mindell et al. [17]. Methodologically, our AI-assisted analysis contributes a novel layer compared to studies relying solely on descriptive coding (e.g., Hasanzadeh et al. [13,22]), demonstrating how automated tools can accelerate qualitative synthesis while still requiring human validation.
Moreover, the focus on participatory planning resonates with Molinero-Parejo et al. [20], who stressed the importance of involving both citizens and experts in shaping long-term mobility visions. Our results reinforce that co-designed solutions are indispensable in heritage contexts where urban renewal, safety, and tourism overlap.
In light of these comparisons, this study highlights that while the specific conditions of Valparaíso (steep hills, heritage constraints, and socio-economic disparities) are unique, the methodological framework applied here can be positioned within a broader body of participatory and perception-driven mobility research. Thus, the findings contribute not only locally but also to international debates on how E-Bikes and other forms of active mobility can be integrated into complex urban settings.
Based on these findings, this study puts forward several specific recommendations for policymakers and urban planners in Valparaíso:
  • Integrate E-Bike planning into broader urban renewal projects that improve public space quality, pavement, and lighting, particularly in areas identified as Weaknesses and Threats.
  • Address safety perceptions with targeted measures in critical zones and launch educational campaigns to foster a culture of coexistence among cyclists, motorists, and pedestrians.
  • Design strategic E-Bike routes that connect tourist and social hubs (‘Strengths’) with public transport nodes, while actively improving or navigating areas perceived as unsafe (‘Threats’).
  • Institutionalize participatory planning methods to ensure that mobility solutions are co-designed with residents and visitors, reflecting their real needs and experiences.

7. Final Considerations

It is relevant to mention that it possesses an exploratory approach, meaning that results are not completely conclusive. However, it indicates initial results that can support policymakers to consider other aspects of the city, beyond specific factors of transport infrastructure, when dealing with transport-related solutions, not only for E-Bikes but also for public transport and other non-motorized modes. In addition, this study brings insights into the potential use of participatory mapping in combination with a focus group analysis with the support of AI-related procedures within the Latin American and Chilean context. Furthermore, the methods and variables applied in this study have been explained in detail to guarantee replicability.
In a context where there is a growing concern in generating participatory transport and urban planning processes, AI-based solutions can support the processing and analysis of the extensive amount of information generated through qualitative methods, with a reduced cost in time and human resources, which are, usually, the limiting factors that in many occasions discourage urban and transport planners from giving more value to qualitative information to support their decisions.
For the authors of the article, this study is inspiring to explore two further research areas. Firstly, to expand the application of participatory mapping and AI-supported focus groups to topics related to urban planning and other transport issues, besides considering a more diverse sample of participants, for example, in terms of gender, socioeconomic status, and mobility conditions, besides exploring other parts of the city of Valparaíso and even other cities in Chile.
The authors acknowledge that this sample bias, with a predominance of students, limits the generalizability of the findings. The perceptions gathered may over-represent the views of a younger, academic demographic, potentially prioritizing aspects related to leisure mobility and cost, while under-representing the daily mobility challenges faced by other groups such as permanent residents, families, or older adults. Nonetheless, as a foundational exploratory study in this specific urban context, the sample was sufficient to achieve thematic saturation and provide a robust qualitative baseline that was previously non-existent. This approach was also necessary, as collecting new data at this stage would not only be costly but could also introduce a contextual lag, compromising the coherence of the findings. Therefore, future research must actively include these diverse populations to obtain a more comprehensive and robust understanding of the potential for E-Bikes in the city. The second area, specifically related to E-Bikes, is to develop experimental studies exposing people to the experience of riding an E-Bike in different urban and topographical conditions to demonstrate that effectively, the slopes of Valparaíso are not limiting the potential E-Bike use but the urban and social conditions of the city.
Moreover, this study, in complement with further exploration of this topic, can potentially shed light on strategies and actions to promote sustainable mobility and tourism in Valparaíso, which is aligned with its history as one of the most important cities that between the 19th and 20th innovated in terms of electric mobility, with the trolleybuses, elevators, trams, and railway system. This brings us to an open question: “Why not re-imagine and strengthen electric mobility in Valparaíso by preserving and modernizing historic electric transport systems and by promoting new electric mobility options, such as the E-Bike, in the city?”.

Author Contributions

Conceptualization: Vicente Aprigliano. Methodology: Vicente Aprigliano, Catalina Toro, Gonzalo Rojas, Mitsuyoshi Fukushi, and Iván Bastías. Validation: Vicente Aprigliano, Sebastián Seriani, Álvaro Peña, and Luis López-Quijada. Formal Analysis: Vicente Aprigliano, Catalina Toro, Gonzalo Rojas, Mitsuyoshi Fukushi, and Sebastián Seriani. Investigation: Vicente Aprigliano, Catalina Toro, Gonzalo Rojas, Mitsuyoshi Fukushi, Iván Bastías, and Sebastián Seriani. Data Curation: Catalina Toro, Gonzalo Rojas, and Iván Bastías. Writing—original draft: Vicente Aprigliano, Catalina Toro, Gonzalo Rojas, and William Ribeiro da Silva. Writing—review and editing: Vicente Aprigliano, Sebastián Seriani, William Ribeiro da Silva, Álvaro Peña, and Luis López-Quijada. Visualization: Catalina Toro and Gonzalo Rojas. Supervision: Vicente Aprigliano. Project administration: Vicente Aprigliano. Funding acquisition: Vicente Aprigliano. All authors have read and agreed to the published version of the manuscript.

Funding

Agencia Nacional de Investigación y Desarrollo (ANID), Chile, Fondecyt 11230050.

Data Availability Statement

The raw data supporting the conclusions of this article will be made available by the authors on request.

Acknowledgments

The authors gratefully acknowledge the research support provided by Agencia Nacional de Investigación y Desarrollo (ANID), Chile.

Conflicts of Interest

The authors declare no conflicts of interest.

Appendix A

Figure A1. Valparaíso heritage area in the context of the city’s hills.
Ijgi 14 00405 g0a1
Table A1. Definitions of the 5 dimensions of urban environment plus the dimension of condition and use of social infrastructure that was entered into artificial intelligence to relate the audio transcripts with the 6 dimensions described in the table.
DimensionDescriptionKey Words
DensityConcentration of specific elements in each area, such as population, employment, housing, and commercial establishments. For Cervero et al. [40], it focuses mainly on the housing unit per hectare, the percentage of land area occupied by buildings, and the average height of the building floor. It is a measure that reflects how these entities are distributed and grouped in a geographic space, in this way administrative, residential, and commercial density are mentioned [49]. Density is crucial to understanding urban patterns and efficiently planning land use.Concentration, Urban Patterns, Housing
DiversityDiversity refers to the variety of land uses within an area, including the mix of different types of housing, retail, offices, and other services. This variety encourages proximity of different destinations, which can reduce the need for long vehicle trips and promote sustainable modes of transport such as walking and cycling [40]. Land use heterogeneity is a prominent indicator in urban planning, as it supports the needs of residents, ensuring a vibrant and welcoming community, and has a fundamental effect on travel patterns. A decrease in diversity leads to greater use of private cars to meet needs, while an increase in diversity favors the presence of pedestrians and cyclists [49]. Therefore, diversity increases the willingness to walk and cycle on streets and contributes to the perceived quality of the environment [50]. In addition, the entropy index is used to measure the diversity of land uses, quantifying the equitable distribution of different categories of land use and reflecting the degree of mixing and balance between these uses [40].Entropy Index, Land Use, Services, Multifunctionality, Heterogeneity
DesignThe definition by Cervero et al. [40] clearly distinguishes between amenities, streets, and security. Amenities focus on green spaces and elements that beautify and enhance the landscape, such as the number of traffic lights, street vegetation, sky view, building façade, pedestrian space, motorization length, and diversity [50]. Street design focuses on the structure and connectivity of the urban fabric, including connectivity index, cycle path length, street density, shortest street distance, intersection density (per hectare), link node ratio, street length density [51], road network density, pedestrian network density, pedestrian network accessibility, entrances and exits at each station, floor area, and intersection ratio of road density [52], as well as street connectivity, accessibility, land use mix, street design level [49], and street connectivity (average block size) [53]. Safety addresses aspects related to the protection and well-being of pedestrians and drivers, considering the number of pedestrian accidents per year, average speeds of cars on main streets, deaths in traffic accidents and reported crimes, all per year [40].Security, Urban Structure, Planning, Functionality, Connectivity, Landscape
DestinationMovement potential at each street link from the centrality of the interrelation [50], as also understood from the density of bus stops, density of metro stations, network density [54], or the number of metro lines, metro frequency, metro station accessibility, number of bus stations, and number of parking [55]. From the stations, the attributes of capacity and number of nearby stations, cycling infrastructure and public transport facilities are observed [56], such as access to public transport (count-based index), trips within urban/suburban areas (boolean) [57]. It is also understood as the number of ca and walking trips made by a person in a single day; transport options in the neighborhood [58]. On the other hand, for Cervero et al. [40], it is understood from the amount of equipment, such as the number of public schools, hospitals, public bookstores, shopping centers, churches, banks, that is, towards service points.Points of Interest, Shops, Accessibility, Transport Network, Facilities
DistanceSpatial measure between two points of interest. Cervero et al. [40] focuses on the transport network, such as shortest distances in the network to the nearest station and the exit of the metro station. Zhang et al. [50] focus on the nearest bus stop or approaches such as the distance to public centers in the city. It is also considered from points such as housing, work centers, services, and public transport [50]. Travel distance is understood as the distance to facilities [51]. In addition, distance is considered from the perspective of travel time, such as to the nearest educational establishments (primary, secondary, and higher education), travel time to the nearest urban center and travel time to the nearest public transport network, considering this as relative accessibility [53].Public Transport, Proximity to bus stops, travel time, efficiency, short distance.
Condition and use of social infrastructureThe condition and manner of use of social infrastructure, which includes public and private institutions serving the general population (e.g., libraries, schools, playgrounds, parks, sports fields, swimming pools, community organizations, scheduled markets, commercial establishments) and also elements of public space, such as sidewalks, courtyards, community gardens, and other spaces that invite people into the public realm [42]. Regarding the condition of social infrastructure, this refers to the state of maintenance of this infrastructure, while the manner of use refers to aspects of social behavior in places of social infrastructure, such as presence of trash on the streets, urban violence, ways in which users of means of transport behave in public space, carrying out of cultural activities in public space (e.g., music, art, meetings), and social norms (rules of behavior and ways of relating and treating people).Social Behavior, Condition of Public Space, Perception of a Place
Table A2. Questions asked in the focus group sessions for each dimension, which were divided into Section 1 and Section 2, the latter focusing on the use of the electric bicycle.
DimensionSection 1Section 2
StrengthWhat are the positive aspects of the transportation system and the current environment (social, urban and natural) of the Historic Heritage Center of Valparaíso from your mobility experience?What characteristics does the Historic Heritage Centre of Valparaíso (transport system and surroundings) currently have that allow the use of electric bicycles (without making any changes to the city)? From your perception and/or experience in tourist and leisure routes.
OpportunityWhat are the points to improve in the transportation system and the environment (social, urban and natural) of the Historic Heritage Center of Valparaíso based on your experience of mobility and frequent trips?What characteristics could the Historic Heritage Centre of Valparaíso (transport system and surroundings) must allow for greater use of electric bicycles? From your perception and/or experience and for tourist and leisure routes.
WeaknessWhat are the negative points of the transportation system and the current environment (social, urban and natural) of the Historic Heritage Center of Valparaíso from your mobility experience?What features does the Historic Heritage Centre of Valparaíso (transport system and surroundings) currently have that do not allow the use of electric bicycles (without making any changes to the city)? From your perception and/or experience in tourist and leisure routes.
ThreatWhat external factors could worsen or put at risk your mobility experience considering the transport system and the environment (social, urban and natural) of the Historic Heritage Centre of Valparaíso? From your perception and/or experience and tourist and leisure routes.What external factors could worsen or jeopardize the development of electromobility?
Figure A2. Base map provided to groups for collective mapping. Contains WHS boundary, buffer area and streets within said area.
Ijgi 14 00405 g0a2

References

  1. Moslem, S.; Campisi, T.; Al-Rashid, M.A.; Simic, V.; Esztergár-Kiss, D.; Pilla, F. Greening Urban Mobility: Assessing Environmental and Functional Characteristics of Bicycle Infrastructure in the Post-Pandemic Era. Habitat Int. 2024, 153, 103200. [Google Scholar] [CrossRef]
  2. Ortar, N.; Lejoux, P.; Ovtracht, N. From Temporary Bike Lanes to a Cycling Oriented Mobility Paradigm. The Case of Lyon during and after the Pandemic of COVID-19. J. Urban Mobil. 2025, 7, 100103. [Google Scholar] [CrossRef]
  3. Sampieri, A. The Evolution of E-Bikes: Health and Environmental Advantages, Adoption Challenges, and the Emerging Technological Innovations. Ph.D. Thesis, Università Degli Studi Di Padova, Padova, Italy, 2025. [Google Scholar]
  4. Wisutwattanasak, P.; Watcharamaisakul, F.; Banyong, C.; Chantaratang, A.; Champahom, T.; Ratanavaraha, V.; Jomnonkwao, S. Promoting Electric Bicycle Sharing for Older Residents in Regional Areas: Multilevel Structural Equation Modeling Insights. Res. Transp. Bus. Manag. 2025, 61, 101399. [Google Scholar] [CrossRef]
  5. de la Paz, V. Valparaíso, Patrimonio de La Humanidad: Revisión de Algunos Indicadores Urbanos; Biblioteca del Congreso, Nacional de Chile: Santiago, Chile, 2023. [Google Scholar]
  6. ASCENVAL Usuarios de Ascensores de Valparaíso—Ascenval. Available online: https://www.ascenval.cl/ (accessed on 26 June 2024).
  7. UNESCO World Heritage Centre Barrio histórico de la Ciudad Portuaria de Valparaíso. Available online: https://whc.unesco.org/es/list/959 (accessed on 1 September 2023).
  8. Fernandes, V.A.; Tirado, H.M. Sustainable Mobility in Valparaíso, Chile, and Its Relationship with Topography and Socio-Spatial Conditions. J. Sustain. Sci. Manag. 2021, 16, 122–134. [Google Scholar] [CrossRef]
  9. Ministerio de Vivienda y Urbanismo. Vialidad Ciclo-Inclusiva; Serie Espacios Públicos Urbanos; Ministerio de Vivienda y Urbanismo: Santiago, Chile, 2015. [Google Scholar]
  10. SECTRA Encuestas de Movilidad. Available online: https://www.sectra.gob.cl/encuestas_movilidad/encuestas_movilidad.htm (accessed on 10 April 2023).
  11. Puchta, C.; Potter, J. Focus Group Practice; SAGE Publications Ltd.: London, UK, 2004; ISBN 978-0-7619-6691-3. [Google Scholar]
  12. Dilshad, R.M.; Latif, M.I. Focus Group Interview as a Tool for Quailitative Research: An Analysis. Pak. J. Soc. Sci. 2013, 33, 191–198. [Google Scholar]
  13. Hasanzadeh, K.; Ikeda, E.; Mavoa, S.; Smith, M. Children’s Physical Activity and Active Travel: A Cross-Sectional Study of Activity Spaces, Sociodemographic and Neighborhood Associations. Child. Geogr. 2023, 21, 287–305. [Google Scholar] [CrossRef]
  14. Delpino-Chamy, M.; Pérez Albert, Y. Assessment of Citizens’ Perception of the Built Environment throughout Digital Platforms: A Scoping Review. Urban Sci. 2022, 6, 46. [Google Scholar] [CrossRef]
  15. Kajosaari, A.; Haybatollahi, S.M.; Hasanzadeh, K.; Kyttä, M. Examining the Effects of Residential Location and Stated Residential Preferences on Activity Space Size and Centricity. Travel Behav. Soc. 2021, 23, 65–75. [Google Scholar] [CrossRef]
  16. Pánek, J.; Benediktsson, K. Emotional Mapping and Its Participatory Potential: Opinions about Cycling Conditions in Reykjavík, Iceland. Cities 2017, 61, 65–73. [Google Scholar] [CrossRef]
  17. Mindell, J.S.; Anciaes, P.R.; Dhanani, A.; Stockton, J.; Jones, P.; Haklay, M.; Groce, N.; Scholes, S.; Vaughan, L. Using Triangulation to Assess a Suite of Tools to Measure Community Severance. J. Transp. Geogr. 2017, 60, 119–129. [Google Scholar] [CrossRef]
  18. Pesola, A.J.; Hakala, P.; Berg, P.; Ramezani, S.; Villanueva, K.; Rinne, T. The Effects of Free-Fare Public Transportation on the Total Active Travel in Children: A Cross-Sectional Comparison between Two Finnish Towns. J. Transp. Health 2022, 27, 101506. [Google Scholar] [CrossRef]
  19. Mahmoudi, D.; Lubitow, A.; Christensen, M.A. Reproducing Spatial Inequality? The Sustainability Fix and Barriers to Urban Mobility in Portland, Oregon. Urban Geogr. 2020, 41, 801–822. [Google Scholar] [CrossRef]
  20. Molinero-Parejo, R.; Aguilera-Benavente, F.; Gómez-Delgado, M.; Soria-Lara, J.A. Mapping Disruptive Long-Term Scenarios Using a Participatory Approach. J. Maps 2021, 17, 106–115. [Google Scholar] [CrossRef]
  21. Vajjhala, S.P.; Walker, W.M. Roads to Participatory Planning: Integrating Cognitive Mapping and GIS for Transport Prioritization in Rural Lesotho. J. Maps 2010, 6, 488–504. [Google Scholar] [CrossRef]
  22. Hasanzadeh, K. Use of Participatory Mapping Approaches for Activity Space Studies: A Brief Overview of Pros and Cons. GeoJournal 2022, 87, 723–738. [Google Scholar] [CrossRef]
  23. UNESCO World Heritage Centre Lista del Patrimonio Mundial. Available online: https://whc.unesco.org/es/list/ (accessed on 15 April 2024).
  24. Consejo de Monumentos Nacionales Área Histórica de Valparaíso|Consejo de Monumentos Nacionales de Chile. Available online: https://www.monumentos.gob.cl/monumentos/zonas-tipicas/area-historica-de-valparaiso (accessed on 13 June 2025).
  25. IDE Patrimonio Polígonos Sitios de Patrimonio Mundial. Available online: https://idepat.patrimoniocultural.gob.cl/portal/sharing/rest/content/items/02ad13b6ea5d4421ad18ae73401844d3/data (accessed on 29 July 2025).
  26. Freepik Freepik|La Suite Creativa de IA Más Completa. Available online: https://www.freepik.es (accessed on 29 July 2025).
  27. Flaticon Flaticon, la Mayor Base de Datos de Iconos Gratuitos. Available online: https://www.flaticon.es/iconos (accessed on 29 July 2025).
  28. Servicio Nacional de Turismo Atractivos Turísticos Nacionales. Available online: https://www.geoportal.cl/geoportal/catalog/35088/Atractivos%20Tur%C3%ADsticos%20Nacionales (accessed on 29 July 2025).
  29. IDE Patrimonio Catálogo de Metadatos y Descarga de Capas del Patrimonio Cultural en Chile. Available online: https://ide.patrimoniocultural.gob.cl/es/centro_descargas (accessed on 9 January 2025).
  30. Consejo de Monumentos Nacionales de Chile Monumentos Nacionales|Consejo de Monumentos Nacionales de Chile. Available online: https://www.monumentos.gob.cl/monumentos (accessed on 29 July 2025).
  31. Instituto Nacional de Estadísticas Actividad del Turismo. Available online: https://regiones.ine.cl/valparaiso/estadisticas-regionales/economia/comercio-servicios-y-turismo/actividad-del-turismo (accessed on 29 July 2025).
  32. SERNATUR. Big Data Para el Turismo Interno; Servicio Nacional de Turismo|SERNATUR: Santiago, Chile, 2024. [Google Scholar]
  33. Instituto Nacional de Estadísticas Microdatos Censo 2017: Manzana. Available online: https://ine-chile.maps.arcgis.com/home/item.html?id=54e0c40680054efaabeb9d53b09e1e7a (accessed on 10 April 2023).
  34. Ibeas, A.; dell’Olio, L.; Montequín, R.B. Citizen Involvement in Promoting Sustainable Mobility. J. Transp. Geogr. 2011, 19, 475–487. [Google Scholar] [CrossRef]
  35. Zuev, D.; Tyfield, D.; Urry, J. Where Is the Politics? E-Bike Mobility in Urban China and Civilizational Government. Environ. Innov. Soc. Transit. 2019, 30, 19–32. [Google Scholar] [CrossRef]
  36. Kantawateera, K.; Naipinit, A.; Promsaka Na Sakolnakorn, T.; Churngchow, C.; Kroeksakul, P. A SWOT Analysis of Tourism Development in Khon Kaen, Thailand. Asian Soc. Sci. 2013, 9, 226. [Google Scholar] [CrossRef]
  37. Ares, P.; Risler, J. Manual de Mapeo Colectivo: Recursos Cartográficos Críticos Para Procesos Territoriales de Creación Colaborativa, 1st ed.; Tinta Limón: Buenos Aires, Argentina, 2013. [Google Scholar]
  38. Stewart, D.W.; Shamdasani, P.N. Focus Groups: Theory and Practice, 3rd ed.; Applied Social Research Methods Series; Sage: Los Angeles, LA, USA; London, UK; New Delhi, India; Singapore; Washington, DC, USA, 2015; ISBN 978-1-4522-7098-2. [Google Scholar]
  39. Saldaña, J. The Coding Manual for Qualitative Researchers, 3rd ed.; Sage: Los Angeles, LA, USA; London, UK; New Delhi, India; Singapore; Washington, DC, USA, 2016; ISBN 978-1-4739-0249-7. [Google Scholar]
  40. Cervero, R.; Sarmiento, O.L.; Jacoby, E.; Gomez, L.F.; Neiman, A. Influences of Built Environments on Walking and Cycling: Lessons from Bogotá. Int. J. Sustain. Transp. 2009, 3, 203–226. [Google Scholar] [CrossRef]
  41. Aprigliano, V.; Toro, C.; Rojas, G.; Barros, G.; Fukushi, M.; Seriani, S. Effects of the Built Environment and Sociodemographic Factors on Accessibility in the City of Valparaíso, Chile. J. Transp. Geogr. 2024, 118, 103931. [Google Scholar] [CrossRef]
  42. Latham, A.; Layton, J. Social Infrastructure and the Public Life of Cities: Studying Urban Sociality and Public Spaces. Geogr. Compass 2019, 13, e12444. [Google Scholar] [CrossRef]
  43. Morgan, D.L. Focus Groups. Annu. Rev. Sociol. 1996, 22, 129–152. [Google Scholar] [CrossRef]
  44. Bader, G.E.; Rossi, C.A. Focus Group: A Step-By-Step Guide; The Bader Group: San Diego, CA, USA, 2002. [Google Scholar]
  45. Foschiatti, A.M.; Alberto, J.A. El Uso de Matrices DAFO Como Herramientas de Gestión y Análisis Geográfico. Geográfica Digit. 2012, 9, 1–11. [Google Scholar] [CrossRef]
  46. Benzaghta, M.A.; Elwalda, A.; Mousa, M.; Erkan, I.; Rahman, M. SWOT Analysis Applications: An Integrative Literature Review. J. Glob. Bus. Insights 2021, 6, 55–73. [Google Scholar] [CrossRef]
  47. Ponce, H. La Matriz FODA: Alternativa de Diagnóstico y Determinación de Estrategias de Intervención En Diversas Organizaciones. Enseñ. Investig. Psicol. 2007, 12, 113–130. [Google Scholar]
  48. Namugenyi, C.; Nimmagadda, S.L.; Reiners, T. Design of a SWOT Analysis Model and Its Evaluation in Diverse Digital Business Ecosystem Contexts. Procedia Comput. Sci. 2019, 159, 1145–1154. [Google Scholar] [CrossRef]
  49. Motieyan, H.; Mesgari, M. Towards Sustainable Urban Planning Through Transit-Oriented Development (A Case Study: Tehran). ISPRS Int. J. Geo-Inf. 2017, 6, 402. [Google Scholar] [CrossRef]
  50. Zhang, L.; Ye, Y.; Zeng, W.; Chiaradia, A. A Systematic Measurement of Street Quality through Multi-Sourced Urban Data: A Human-Oriented Analysis. Int. J. Environ. Res. Public Health 2019, 16, 1782. [Google Scholar] [CrossRef]
  51. Masoumi, H. Home-Based Urban Commute and Non-Commute Trip Generation in Less-Studied Contexts: Evidence from Cairo, Istanbul, and Tehran. Case Stud. Transp. Policy 2022, 10, 130–144. [Google Scholar] [CrossRef]
  52. Qiang, D.; Zhang, L.; Huang, X. Quantitative Evaluation of TOD Performance Based on Multi-Source Data: A Case Study of Shanghai. Front. Public Health 2022, 10, 820694. [Google Scholar] [CrossRef]
  53. Lopes, M.; Mélice Dias, A.; Silva, C. The Impact of Urban Features in Cycling Potential—A Tale of Portuguese Cities. J. Transp. Geogr. 2021, 95, 103149. [Google Scholar] [CrossRef]
  54. Yang, W.; Chen, B.Y.; Cao, X.; Li, T.; Li, P. The Spatial Characteristics and Influencing Factors of Modal Accessibility Gaps: A Case Study for Guangzhou, China. J. Transp. Geogr. 2017, 60, 21–32. [Google Scholar] [CrossRef]
  55. Mahmoudi, J.; Zhang, L. Impact of County-Level Built Environment and Regional Accessibility on Walking: A Washington, DC–Baltimore Case Study. J. Urban Plann Dev. 2018, 144, 04018020. [Google Scholar] [CrossRef]
  56. Zhang, Y.; Thomas, T.; Brussel, M.; Van Maarseveen, M. Exploring the Impact of Built Environment Factors on the Use of Public Bikes at Bike Stations: Case Study in Zhongshan, China. J. Transp. Geogr. 2017, 58, 59–70. [Google Scholar] [CrossRef]
  57. Cheng, J.; Yan, R.; Gao, Y. Exploring Spatial Heterogeneity in Accessibility and Transit Mode Choice. Transp. Res. Part D Transp. Environ. 2020, 87, 102521. [Google Scholar] [CrossRef]
  58. Joh, K.; Boarnet, M.G.; Nguyen, M.T.; Fulton, W.; Siembab, W.; Weaver, S. Accessibility, Travel Behavior, and New Urbanism: Case Study of Mixed-Use Centers and Auto-Oriented Corridors in the South Bay Region of Los Angeles, California. Transp. Res. Rec. J. Transp. Res. Board 2008, 2082, 81–89. [Google Scholar] [CrossRef]
  59. Langchain AI. LangChain. GitHub. Available online: https://github.com/langchain-ai/langchain (accessed on 29 July 2025).
  60. Shao, Y.; Jiang, Y.; Kanell, T.A.; Xu, P.; Khattab, O.; Lam, M.S. Assisting in Writing Wikipedia-like Articles From Scratch with Large Language Models. arXiv 2024, arXiv:2402.14207. [Google Scholar] [CrossRef]
  61. Wang, L.; Ma, C.; Feng, X.; Zhang, Z.; Yang, H.; Zhang, J.; Chen, Z.; Tang, J.; Chen, X.; Lin, Y.; et al. A Survey on Large Language Model Based Autonomous Agents. Front. Comput. Sci. 2024, 18, 186345. [Google Scholar] [CrossRef]
  62. Hu, S.; Lu, C.; Clune, J. Automated Design of Agentic Systems. arXiv 2024, arXiv:2408.08435. [Google Scholar] [CrossRef]
  63. Banister, D. The Sustainable Mobility Paradigm. Transp. Policy 2008, 15, 73–80. [Google Scholar] [CrossRef]
Figure 1. Photographs of the Alegre Hill area taken on 25 April 2024. (A) Reina Victoria elevator. (B) Cumming Street. (C) Templeman Street.
Ijgi 14 00405 g001
Figure 2. Slope range in the World Heritage Site, Valparaíso.
Ijgi 14 00405 g002
Figure 3. World Heritage Site in Valparaiso city.
Ijgi 14 00405 g003
Figure 4. (a) World Heritage Site of Valparaíso with the main tourist attractions and transport context. Source: elaborated by authors, with tourist data referenced from Google maps and polygon world Heritage Site [25], using iconography from Freepik [26] and Flaticon [27]. (b) Concentration of trips to World Heritage Site from the municipalities of “Gran Valparaíso”. Source: elaborated by authors with data from the origin-destination survey [10].
Ijgi 14 00405 g004
Figure 5. Trips by purpose and modal split with destination the World Heritage Site.
Ijgi 14 00405 g005
Figure 6. Methodology Phases.
Ijgi 14 00405 g006
Figure 7. Age ratio by gender and household income range of participants. (A) Age ratio of participants by gender. (B) Household income range of participants.
Ijgi 14 00405 g007
Figure 8. Key aspects of WHS for focus group participants who responded to the survey.
Ijgi 14 00405 g008
Figure 9. Heatmap results from the participatory mapping activities. (a) Spatial hotspots identified as Strengths; (b) Spatial hotspots identified as Weaknesses; (c) Spatial hotspots identified as Opportunities; (d) Spatial hotspots identified as Threats.
Ijgi 14 00405 g009
Table 1. Description of National Monuments and Typical or Picturesque Areas in Valparaíso. Source: elaborated by authors based on the National Monuments Council of Chile [29].
Category Original Name of the Place (in Spanish)Designation YearSource
National Monuments12 (54.5%)Inclined ElevatorArtillería1998[30]
Concepción
Cordillera
El Peral
ChurchesAnglicana de San Pablo1979
La Matriz del Salvador1971
SchoolsColegio Alemán2015[30]
BuildingsCastillo San José1963[30]
Edificio de calle Esmeralda N° 11181976
Edificio Luis Cousiño1981
Aduana de Valparaíso1976
Intendencia de Valparaíso1976
Typical or Picturesque Areas10 (45.5%)Valparaíso Historic AreaSector Pasaje Ross2003
Plaza Aníbal Pinto
Cerros Alegre y Concepción
Plaza Sotomayor
Entorno de la Iglesia La Matriz
Sector Quebrada Márquez
Sector Plaza Echaurren y calle Serrano
Sector del Cerro Cordillera’ y ‘Sector Bancario de Calle Prat
Table 2. Municipalities in Chile that receive the most tourist trips. Source: elaborated by authors based on data from Sernatur [32].
Destination MunicipalitiesTotal Trips%
Viña del Mar5,399,4412.66
El Tabo3,665,2851.8
La Serena3,413,8341.68
Algarrobo3,359,6081.65
El Quisco3,362,9111.65
Coquimbo3,341,6421.64
Valparaíso3,127,5691.54
Santiago3,127,3151.54
Pichilemu2,769,3841.36
Pucón2,712,1551.33
Table 3. Profile of the inhabitant living in the WHS. Source: prepared by authors based on the Origin Destination Survey [10].
IndicatorsMeanStdMin25%50%75%Max
Ratio of women to total population0.470.1400.460.500.540.76
Average age41.864.3937.0638.0841.5743.5550.51
Household Size2.440.611.332.022.412.774.17
Cars per household0.290.300.050.250.41
Household income615,952.94449,574.8296,884292,423503,292776,652.52,840,178
Population in need of care1.260.760.020.351.431.792.81
Primary education0.130.070.050.080.110.170.23
Secondary education0.410.170.170.290.440.530.64
Unemployed workforce0.150.060.060.110.140.170.26
Workers0.50.160.190.450.490.590.75
Immobility by illness0.040.030.010.020.040.050.24
Car driving license0.320.180.160.210.270.330.72
Households with bicycles0.330.180.020.180.30.431
Table 4. WHS visitor profile. Source: elaborated by authors based on Origin Destination Survey [10].
Indicators (Mean)LeisureWorkOthers
Total Population474210,83015,374
Ratio of women total population1.240.411.02
Average age40.3942.7436.44
Household Size1.291.191.68
Cars per household0.510.820.54
Household income852,3601,117,365736,564
Population in need of care0.280.10.27
Primary education0.090.030.04
Secondary education0.270.310.32
Superior0.450.670.51
Workers0.541.10.68
Car driving license0.350.660.48
Households with bicycles0.040.020.03
Trips from Valparaíso14,07911,93126,033
Trips from Greater Valparaíso16,83221,57233,019
Table 5. Definition of SWOT matrix dimensions.
StrengthsOpportunities
Favorable internal elements or circumstances that help achieve objectives [45,46]Favorable external circumstances originating in the environment that can lead to improvements or growth [45,47]
WeaknessesThreats
Circumstances, skills, or negative and internal elements that harm the achievement of objectives [45]Uncontrollable external negative factors or elements that impact the environment and hinder or delay the achievement of objectives [45,47,48]
Table 6. Description and use of coding methods proposed by Saldaña [39].
MethodCodingDescriptionUse
ExploratoryHolisticIt seeks generalities of the data, being useful for investigating different types of data, and considers a high amplitude in the sample size.Variety of data types, crossing between Audio, Writing and geospatial information.
ProvisionalList codes before collecting information, these can be modified during the course of the study.Pre-coding:
SWOT analysis
Iconography
5D+
GrammaticalAttributeCollect essential information from participants in terms of demographics.Age, Gender, Academic Degree, Income
MagnitudeStatistical description for detailed analysis of demographic data.Statistical measures
ElementalStructuralCompile topic lists or category indexes for already standardized or semi-structured data.With the precoding of the SWOT Analysis, the structural coding seeks to identify those categories of relevance by SWOT dimension for the participants from the 5D+ codes.
Table 7. Focus group session information from the online survey prior to the activities.
DateFocus Group SessionTotal Focus GroupTotal
Participants
FemaleMaleAverage Age
5 September 2023I4194 (21.1%)15 (78.90%)23
6 November 2023II41910 (52.6%)9 (47.4%)24
19 March 2024III4285 (17.9%)23 (82.1%)22
11 May 2024IV142 (50%)2 (50%)34
Table 8. Paraphrases of focus group participants related to areas of improvement identified and highlighted by the AI analysis process of transcriptions.
Areas of ImprovementTranslated Paraphrasing
Infrastructure Enhancement“Complementing what he (another participant) said, it would be like separating areas that are for vehicular traffic and for walking, like a separate cycle path, areas exclusively for cycle paths, and the other thing would be to designate key points because it is useless to make a route and still have to walk or go through sidewalks or streets in busy areas, for example creating a circuit that crosses as a key point, for example, the Puerto station, so that the cycle path is not too far from the Puerto station…” (male, date: 6 November 2023)
“Good lighting, charging points, and better infrastructure…” (male, date: 19 March 2024)
“…improve bus stops…” (male, date: 19 March 2024)
“I think it is adapted, but with what is there, it is difficult to reach certain parts, so I think that improvement has to start from what is already created (referring to infrastructure), improve it in order to know what options there are to improve.” (Male, date: 19 March 2024)
“From my experience, I believe that in terms of the historic center of Valparaíso, there is a focus on the hills more than anything else, in addition to what other participants said, I agree, I think that…the geography of Valparaíso is a limitation…the solutions that exist today, such as public transportation, elevators do not always respond to the demand that exists and the plan perhaps for Valparaíso not so much on the hills…it is not so limiting but yes the infrastructure, for example, the streets, the sidewalks due to their maintenance, make the hills less accessible” (Female, 11 May 2024)
Educational Campaigns“I think that perhaps the electric bike does not necessarily require you to pedal, perhaps it is a plus on a slope, and obviously the issue of intimidation between the car and the bicycle and that the streets are very narrow, there should be good road signs, perhaps there should be campaigns like road safety education for drivers to do their part and not be so arrogant when driving with cyclists. That is what I think more than anything.” (female, date: 5 September 2023)
“…encourage the use of bicycles in every sense and educate drivers, because drivers do not know how to coexist with cyclists here in Valparaíso” (male, date: 6 November 2023)
Route Optimization“I believe that the most relevant factors are that there is a connection with other means of transportation…. such as the metro, for example, leaving bicycles outside…, connected to routes that are delimited and have security, and that the use of the bicycle is prioritized over the use of urban space for parking, for example, because of course there is a street that could be a two-way street but when one lane is occupied only by parking that in the end does not fulfill any function other than leaving a car there just like that and making an exclusive route for bicycles and leaving the route for pedestrians, they do not leave them (streets) integrated but rather they leave them separately segregated.” (male, 11 May 2024)
Community Engagement“...for example, organizations that help, how do you see it? Because here too, here in Echaurren, there is a church here, so it is like the church’s soup kitchen, and that soup kitchen helps people on the street, they give them food, shelter, clothes, so it can be used in the same way.” (Female, 6 November 2023)
“I believe that for me, one of the most relevant factors is that there is a political will so that governance can converse with infrastructure, and it is designed and planned to strengthen use (referring to the use of E-Bikes). So that means making decisions so that certain things happen, so in this case, designing tourist routes also has to do with that, that is, there is a will that we want it and not that a certain part of the community wants it but finally finds itself with bureaucracy and with a lack of interest or political apathy…” (Female, 11 May 2024)
Disclaimer/Publisher’s Note: The statements, opinions and data contained in all publications are solely those of the individual author(s) and contributor(s) and not of MDPI and/or the editor(s). MDPI and/or the editor(s) disclaim responsibility for any injury to people or property resulting from any ideas, methods, instructions or products referred to in the content.