Article

Exploring the Spatial Relationship Between Severe Depression, COVID-19 Case Rates, and Vaccination Rates in US Counties: A Spatial Analysis Across Two Time Periods

1
Department of Internal Medicine, Montefiore Medical Center, Albert College of Medicine, Bronx, NY 10466, USA
2
GIS Center, Florida International University, Miami, FL 33199, USA
*
Author to whom correspondence should be addressed.
These authors contributed equally to this work.
ISPRS Int. J. Geo-Inf. 2025, 14(10), 376; https://doi.org/10.3390/ijgi14100376
Submission received: 26 June 2025 / Revised: 16 September 2025 / Accepted: 21 September 2025 / Published: 25 September 2025

Abstract

Severe depression is shaped by complex interactions between public health crises and socioeconomic conditions, yet the spatial and temporal dynamics of these factors remain underexplored. This study investigates the impact of COVID-19 case rates, vaccination rates, and socioeconomic factors on severe depression rates across 1470 counties in the contiguous USA in 2021 and 2022. We combined Ordinary Least Squares (OLS) regression with Multiscale Geographically Weighted Regression (MGWR) to capture both global associations and local geographic variability. Results show that higher COVID-19 case rates in 2021 were associated with increased rates of severe depression in 2022, while higher vaccination rates during the same period were associated with decreased rates of severe depression. However, these associations weakened when using 2022 data, suggesting a temporal lag in the impact on mental health. MGWR analyses revealed regional disparities: COVID-19 case rates had a stronger impact in the Midwest, while vaccination benefits were more pronounced on the West Coast. Additional factors, such as unemployment, limited sunlight exposure, and the availability of mental health resources, also influenced outcomes. These findings underscore the importance of temporally and geographically nuanced approaches to public mental health interventions and support the need for region-specific strategies to address mental health disparities in the wake of public health crises.

1. Introduction

In 2019, the COVID-19 outbreak was declared a pandemic by the World Health Organization (WHO). Beyond the well-known severe acute respiratory symptoms for vulnerable patient populations, the COVID-19 pandemic is also associated with high levels of mental stress. The sources of mental stress are diverse, ranging from fear of contracting the disease and long-term symptoms to the stress caused by work, lockdowns, and quarantine in response to government policy [1,2,3,4]. The pooled prevalence of self-reported mental health problems, which estimates clinically relevant high levels of depression and anxiety symptoms during the COVID-19 pandemic, ranges from 20% to 35% [1,2,3,4]. Nevertheless, sparse research has focused on the effects of the COVID-19 pandemic on severe mental disorders, especially severe depression.
Major depressive disorder (MDD) is commonly graded by the Patient Health Questionnaire 9-item tool (PHQ-9) [5,6]. The PHQ-9 can also grade depressive symptom severity; a score of ≥20 can diagnose severe depression (Tables S1 and S2). Individuals with pre-existing depression or those exhibiting depressive symptoms related to COVID-19 face an elevated risk of hospitalizations, ICU admissions, and mortality [7,8,9,10]. Meanwhile, the COVID-19 pandemic further strained mental health services, and the uniform distribution of resources often failed to match the uneven regional burden of severe depression. This highlights the need to consider geographic variation in mental health outcomes and healthcare delivery.
COVID-19 vaccination has been associated with reductions in distress, anxiety, and depressive symptoms [11,12,13,14]. However, individuals with mental disorder conditions have been shown to exhibit attenuated post-vaccination immune responses [15], and vaccination uptake remains uneven across socioeconomic geodemographic groups [16]. Previously, policy discussions emphasized that people with severe mental illness should be prioritized for vaccinations as they have a higher risk of developing COVID–19 complications [17,18]. Yet, in reality, vaccination and mental health resources have often been allocated uniformly, without accounting for the uneven regional burden of severe depression or local patterns of vaccine uptake.
This disconnection underscores the need for spatial analysis. Spatial statistics models, such as Multiscale Geographically Weighted Regression (MGWR), have been increasingly used in public health research to pinpoint regional heterogeneity in health outcomes and help the implementation of control measures. Prior spatial studies have modeled COVID-19 incidence, COVID-19 vaccination rates, and their consequences [19,20,21], or modeled mental health outcomes. One study examined state-level clustering of mental health and financial concerns during different COVID-19 waves and demonstrated clear spatial and temporal heterogeneity. However, to our knowledge, no prior nationwide, county-level analysis has jointly examined the spatial relationship between severe depression, COVID-19 case rates, and COVID-19 vaccination rates in the US, despite apparent spatial disparities in each domain.
This study addresses this gap by combining Ordinary Least Squares (OLS) regression with MGWR to US county-level data to quantify the geographic associations between severe depression, COVID-19 incidence, and COVID-19 vaccination rates. The findings generate county-specific evidence to guide the equitable allocation of mental health and vaccination resources and offer insights for ongoing and future public health crises.

2. Data and Methods

2.1. Spatial Statistics Models in Public Health Research

2.1.1. Severe Depression Disorder Data

The depression dataset we used in this study is provided by Mental Health America (MHA) and is publicly accessible at https://mhanational.org/mhamapping/mha-state-county-data (accessed on 1 August 2023). This dataset includes responses from individuals who completed the Patient Health Questionnaire 9-item tool (PHQ-9) to screen for depression [6]. As a severity measure of depression, the PHQ-9 includes nine items, and the score can range from 0 to 27, since each of the nine items can be scored from zero (not at all) to three (nearly every day). For this study, we use severe depression individuals per 100k population, based on the PHQ-9 depression screen, as the dependent variable. In this study, severe depression is defined as any result where an individual reports experiencing symptoms of depression on “more than half the days” in the past two weeks and thus scored between 20 and 27 points on the PHQ-9. People who score moderately severe are still significantly impacted, but our research aims to understand the most severe mental health outcomes resulting from the pandemic. The use of a severe depression dataset will help us to understand the extremes of mental health impact, which might be especially relevant for policy recommendations or interventions targeting high-risk individuals. The dataset has spatial resolution at the county level; it includes data from 1482 counties in the contiguous United States and consists of two timestamps: 2021 and 2022.

2.1.2. COVID-19 Case Rates and Vaccination Rate Data

In this research, we utilize the COVID-19 Data Repository provided by the Center for Systems Science and Engineering (CSSE) at Johns Hopkins University [22]. This comprehensive dataset closely tracks COVID-19 case rates within the United States and globally from 2020 through to 2023, offering daily updates at a county level for confirmed COVID-19 case rates within the US. Our analysis uses data up to 31 December 2021 and 31 December 2022, with these cutoff points facilitating the computation of COVID-19 cases per 100,000 population when adjusted for county population sizes.
In terms of vaccination data, we have employed the Overall US COVID-19 Vaccine Administration and Vaccine Equity data at a county level, sourced from the Centers for Disease Control and Prevention (CDC, https://data.cdc.gov/Vaccinations/COVID-19-Vaccinations-in-the-United-States-County/8xkx-amqh (accessed on 01 August 2023). This dataset, updated weekly, provides an in-depth view of COVID-19 vaccine administration rates, detailing all stages of vaccine completion. For our study, we utilized the percentage of the population over five years old who had completed two or more vaccine doses by the end of both 2021 and 2022, serving as our measure of vaccination rate.

2.1.3. Control Variables: Weather, Demographic, and Socioeconomic Data

In addition to the depression and COVID-19 datasets, we included weather, demographic, and socioeconomic data as control variables to enhance the accuracy and model fit. The detailed information on variables used in our study is listed in Table 1.
In addition to the variables listed in Table 1, we also considered the gender, obesity and education level variables known to affect COVID-19 vaccination rates and mental health conditions. However, these variables are not statistically significant in the regression model and were dropped during the backward elimination process. We also conducted a multicollinearity test using the Variance Inflation Factor (VIF) on the selected predictors. All VIF values are well below the common thresholds of five or ten, indicating no problematic multicollinearity among the variables. This suggests that each predictor provides unique information and can be safely included in subsequent regression modeling without concern for redundancy.

2.2. Spatial Statistics Models Used for Analysis

2.2.1. Global Model and Local Spatial Autocorrelation

Linear regression is commonly leveraged to delineate the relationships between a target variable and numerous predictor variables. An archetypal linear regression model can be formulated as the following:
Y i = α 0 + k = 1 p α k X i k + ε i ,   i = 1 , , n
In this formula, the dependent variable Y is construed as a linear aggregation of predictor variables Xk, where k spans from 1 to p, and εi, which constitutes independently distributed error terms with zero mean and consistent variance. In this investigation, we utilized Ordinary Least Squares (OLS) to deliver an initial approximation of the global regression parameters and investigate the presence of multicollinearity within the data. It is worth noting that the parameter estimates derived from the calibration of the OLS model remain invariant across space.
We adopt Multiscale Geographically Weighted Regression (MGWR) to circumvent this limitation.

2.2.2. Spatial Regression Models (MGWR)

In addition to the global statistical model, we developed the Multiscale Geographically Weighted Regression (MGWR) model to investigate the non-stationary relationship between severe depression per 100,000 population, and a range of epidemiological, environmental, and socioeconomic factors. Table 1 depicts the details of the dependent and independent variables. Here, the dependent variable is the rate of severe depression per 100,000 population, and the independent variables encompass various health, demographic, and environmental aspects.
In this study, we employed Multiscale Geographically Weighted Regression (MGWR) to examine how the relationship between severe depression and each of the above variables varies across space. Geographically Weighted Regression (GWR) is a spatial regression model that accounts for spatial variations and non-stationary relationships between one dependent and multiple independent variables. Traditional statistical methods, such as correlation analysis and ordinary least square (OLS) regression, may obscure the impact of local variations, as they generate ‘average’ or ‘global’ parameters to estimate spatial relationships [23]. To address this, GWR was employed to explore how a dependent variable responds to one or more independent variables at the local scale [24,25]. The results derived from the GWR model are influenced by the observations nearest to the subject point, thereby illuminating the relationships within the local vicinity [26]. Fotheringham and his team have proposed a standard form of the fundamental GWR model [27,28].
Y i = α 0 ( i ) + k = 1 p α k ( i ) X i k + ε i ,   i = 1 , , n
α ( i ) = ( X T W ( i ) X ) 1 X T W ( i ) Y
W(i) is a matrix of weights specific to location i (longitude, latitude), such that observations nearer to i are given greater weight than observations further away.
The foundational concept of GWR is that it uses, or ‘borrows,’ data from locations close to a specified point, weighting it based on the proximity between the data source and the point of interest. This method allows the models to be tailored to a particular location. To ensure minimal bias in the results, the data from closer locations are given more weight than those from farther away.
Generally, various weighting schemes can be employed to establish the weighting matrix, most of which are Gaussian or resemble Gaussian due to the type of dependency commonly found in spatial processes. These weighting schemes can be either constant or adjustable [27]. In this study, we used a spatially adaptive kernel to optimize the bandwidth, and a bi-square function of distance is utilized, as depicted in the following definition of Wij:
W i j =   1 d i j / b 2 2 ,     i f   j N i   0 ,     i f   j N i
Here, dij is the distance between locations i and j, b represents the threshold distance to the Nth nearest neighbor, and the set {Ni} comprises observations falling within the threshold distance range. Observations beyond the Nth nearest neighbor’s distance are assigned weights of zero [29]. Once again, the optimal value for N is determined during the GWR calibration process, which is called bandwidth.
Choosing the optimal bandwidth is a delicate balance between minimizing bias and variance. Should the bandwidth be too large, it will result in significant bias in the local estimates, causing the model to lean towards a global approximation at each point. On the other hand, if the bandwidth is too small, the data points available for local calibration become insufficient, leading to local parameter estimates fraught with high uncertainty. Given the uneven density of locations from where the data were collected in this empirical example, we employed an adaptive bandwidth. The ideal bandwidth was determined in each GWR calibration by performing an iterative process designed to minimize the corrected Akaike Information Criterion (AICc) value, as calculated by the following:
A I C c = 2 n l o g e σ ^ + n l o g e 2 π + 2 n n + t r S n 2 t r S
where n denotes the sample size and is defined as the estimated standard deviation of the error term, and tr(S) denotes the trace of the hat matrix S.
While Geographically Weighted Regression (GWR) can discern spatial heterogeneity in relationships, it operates under the presumption that all these relationships exhibit variation at the same spatial scale across all predictors. In contrast, Multiscale Geographically Weighted Regression (MGWR) offers a notable enhancement over GWR by eschewing the “uniform spatial scale” supposition and permitting the optimization of predictor-specific bandwidths [30]. It is represented as follows:
y i = j = 0 m   β b w j ( u i , v i ) x i j + ε i
In this representation, bwj denotes the optimal bandwidth, explicitly calibrating the jth conditional relationship. Consequently, MGWR enables varying processes to function at distinct spatial scales by generating separate bandwidths for the conditional relationships between the response variable and the different predictor variables.
The calibration of MGWR employs a back-fitting algorithm, as detailed by Fotheringham et al. [30]. The back-fitting process commences with GWR parameter estimates, which form the foundation for the iterative calibration process. All local parameter estimates and optimal bandwidths undergo assessment within each iteration. The iterative process halts when the deviation between parameter estimates from successive iterations converges to a predetermined threshold, chosen as 1 × 10⁻⁵ for this study. More comprehensive process details can be found in studies by Fotheringham et al. and Oshan, Li, Kang, Wolf, and Fotheringham [30,31]. All calibrations were conducted using the MGWR2.2 software, accessible at https://sgsup.asu.edu/sparc/mgwr (accessed 01 Jan 2023).
In this research, the relationship between severe depression rates and contributing factors presents spatial heterogeneities due to variations in factors such as local health policies, social determinants of health, lifestyle habits, and socioeconomic conditions across the US. Therefore, the MGWR model, which accommodates such spatial heterogeneity, is a fitting approach for our analysis.

3. Results

3.1. Descriptive Statistics of the Study Variables

In this section, we detail our dataset (Table 2), encompassing data from 1482 counties across the contiguous United States. These counties represent a diverse range of geographic and demographic characteristics. Our goal in this analysis is to gain a foundational understanding of the various variables within the dataset, shedding light on critical aspects such as public health, vaccination rates, COVID-19 impact, demographic composition, environmental factors, mental health resources, health behaviors, and economic indicators.
Table 2 shows a notable range in severe depression rates among counties. On average, there were approximately 41 cases per 100,000 people in 2022, with the minimum rate recorded at 12.38 and the maximum at a significantly higher 118.54. This variation highlights the differing mental health challenges faced by various regions. Examining vaccination rates, we observed that, on average, about 53.53% of the population had received the second dose of the COVID-19 vaccine in 2021. However, during 2022, the proportion of people who received two doses of the vaccine has decreased to an average of 6.04%, making the overall vaccination rate close to 60%. This decline could be attributed to factors such as vaccine hesitancy or changes in vaccination strategies. COVID-19 case rates varied considerably across counties. In 2021, the average case rate was approximately 11,052 per 100,000 people, with a minimum of 2833.33 and a maximum of 21,032.36. By 2022, the average rate had increased to around 12,670 per 100,000 people, with a minimum of 1749.78 and a maximum of 30,513.09. It is worth noting that, on average, approximately 25% of the total population in these counties falls within the age range of 5 to 24 years. This demographic composition can have implications for educational and healthcare needs.
Daily sunlight hours vary between counties, with an annual average of approximately 16,317 h annually. These variations may influence factors including energy consumption and residents’ exposure to natural light.
The United States is a vast country with multiple climate zones, and daily sunlight hours vary significantly among counties, with an annual mean of approximately 16,317 h. Such disparities affect many aspects of life and environmental conditions. Notably, of particular relevance to mental health, variations in sunlight exposure have been linked to depressive disorders. Studies have documented the role of sunlight in regulating human circadian rhythms and serotonin levels, suggesting a link between sunlight exposure and mood disorders, including depression [32,33].
In terms of mental health resources, counties had an average of 196.02 mental health providers per 100,000 people. However, there were significant variabilities, with some counties having as few as four providers and others as many as 2408. Such disparities in mental health resources are likely to influence access to care. The data also reveals that, on average, about 19.26% of the population engaged in excessive drinking in 2019. These variations in drinking behavior may have implications for public health and well-being.
Finally, regarding economic indicators, the average unemployment rate in 2021 stood at 4.77%. However, this rate varied widely among counties, with some experiencing unemployment rates as low as 1.80% and others as high as 16.20%.
These descriptive statistics offer a comprehensive snapshot of the dataset, illustrating the substantial diversity and disparities across U.S. counties. Subsequent analyses will further investigate these variations to enhance the understanding of regional differences and their potential impacts.

3.2. Summary of Statistic Models

To analyze the relationship between severe depression and COVID-19 case rates and vaccination rates, we developed three statistical models. For the first two models, we used Ordinary Least Square to explore the change in the global relationship between severe depression and independent variables during different periods. For both models, we used the severe depression data from 2022. To study the temporal relationship between COVID-19 and severe depression, we used the COVID-19 case rates and vaccination data in 2021 for Model 1 and the COVID-19 case rates and vaccination data in 2022 for Model 2. For Model 3, we used the Multiscale Geographically Weighted Regression model to evaluate the spatial relationship and spatial heterogeneities between COVID-19 and severe depression. A summary of the results from all three models is listed in Table 3 below. We also calculated the evaluation metrics for each model, including the adjusted R-squared and the Corrected Akaike Information Criterion (AICc). As the significance level and coefficient for MGWR results vary by data points, we have included maps of the MGWR results to discuss the spatial pattern of these results further.
In Model 1, which uses the COVID-19 case rates and vaccination data from 2021, there is a significant negative relationship between this variable and the rate of severe depression. This suggests that as the percentage of the fully vaccinated population increases, the rate of severe depression decreases. This could possibly be due to reduced stress and anxiety related to the fear of contracting COVID-19. There is also a significant positive association between COVID-19 case rates and severe depression, indicating that higher county-level COVID-19 case rates are linked to higher rates of severe depression. However, in Model 2, which uses 2022 data, the two main variables (2dose_Vac_Complete_5PlusPop_Pct and covid_case_per100k) are no longer significant, and the R-squared value is reduced compared to Model 1. The differences in R-squared suggest that Model 1 provides a slightly better fit to the data than Model 2. The differences in the relationships between these two variables and the rate of severe depression between the two models highlight the dynamic nature of the COVID-19 pandemic and its psychological impacts.
More importantly, the results underscore the lag effect between severe depression and independent variables. In Model 1, the significant relationships between both 2dose_Vac_Complete_5PlusPop_Pct and covid_case_per100k with the rate of severe depression suggest that the COVID-19 case rates and vaccination rates in 2021 have a substantial impact on the rate of severe depression in 2022. This could be due to the time it takes for the psychological implications of the pandemic to manifest as changes in the rate of severe depression. In contrast, the lack of significant relationships between these variables in Model 2 suggests that the COVID-19 case rates and vaccination rates in the same year (2022) may not have an immediate impact on the rate of severe depression. This supports the idea of a lag effect, where the impacts of these factors are not immediately apparent but become evident over time. The results also suggest that the percentage of the vaccinated population and COVID-19 case rates in 2021 is predictive of severe depression in 2022.
In addition, we tested for the presence of spatial autocorrelation using Moran’s Index for the residuals of Model 1 (Table 4); the results showed a less than 1% likelihood (p-value < 0.01), which means spatial autocorrelation may be present. Together with the residual distribution maps (Figure 1), it can be concluded that the clustered patterns may not result from random chance, suggesting significant spatial autocorrelation and spatial heterogeneity.
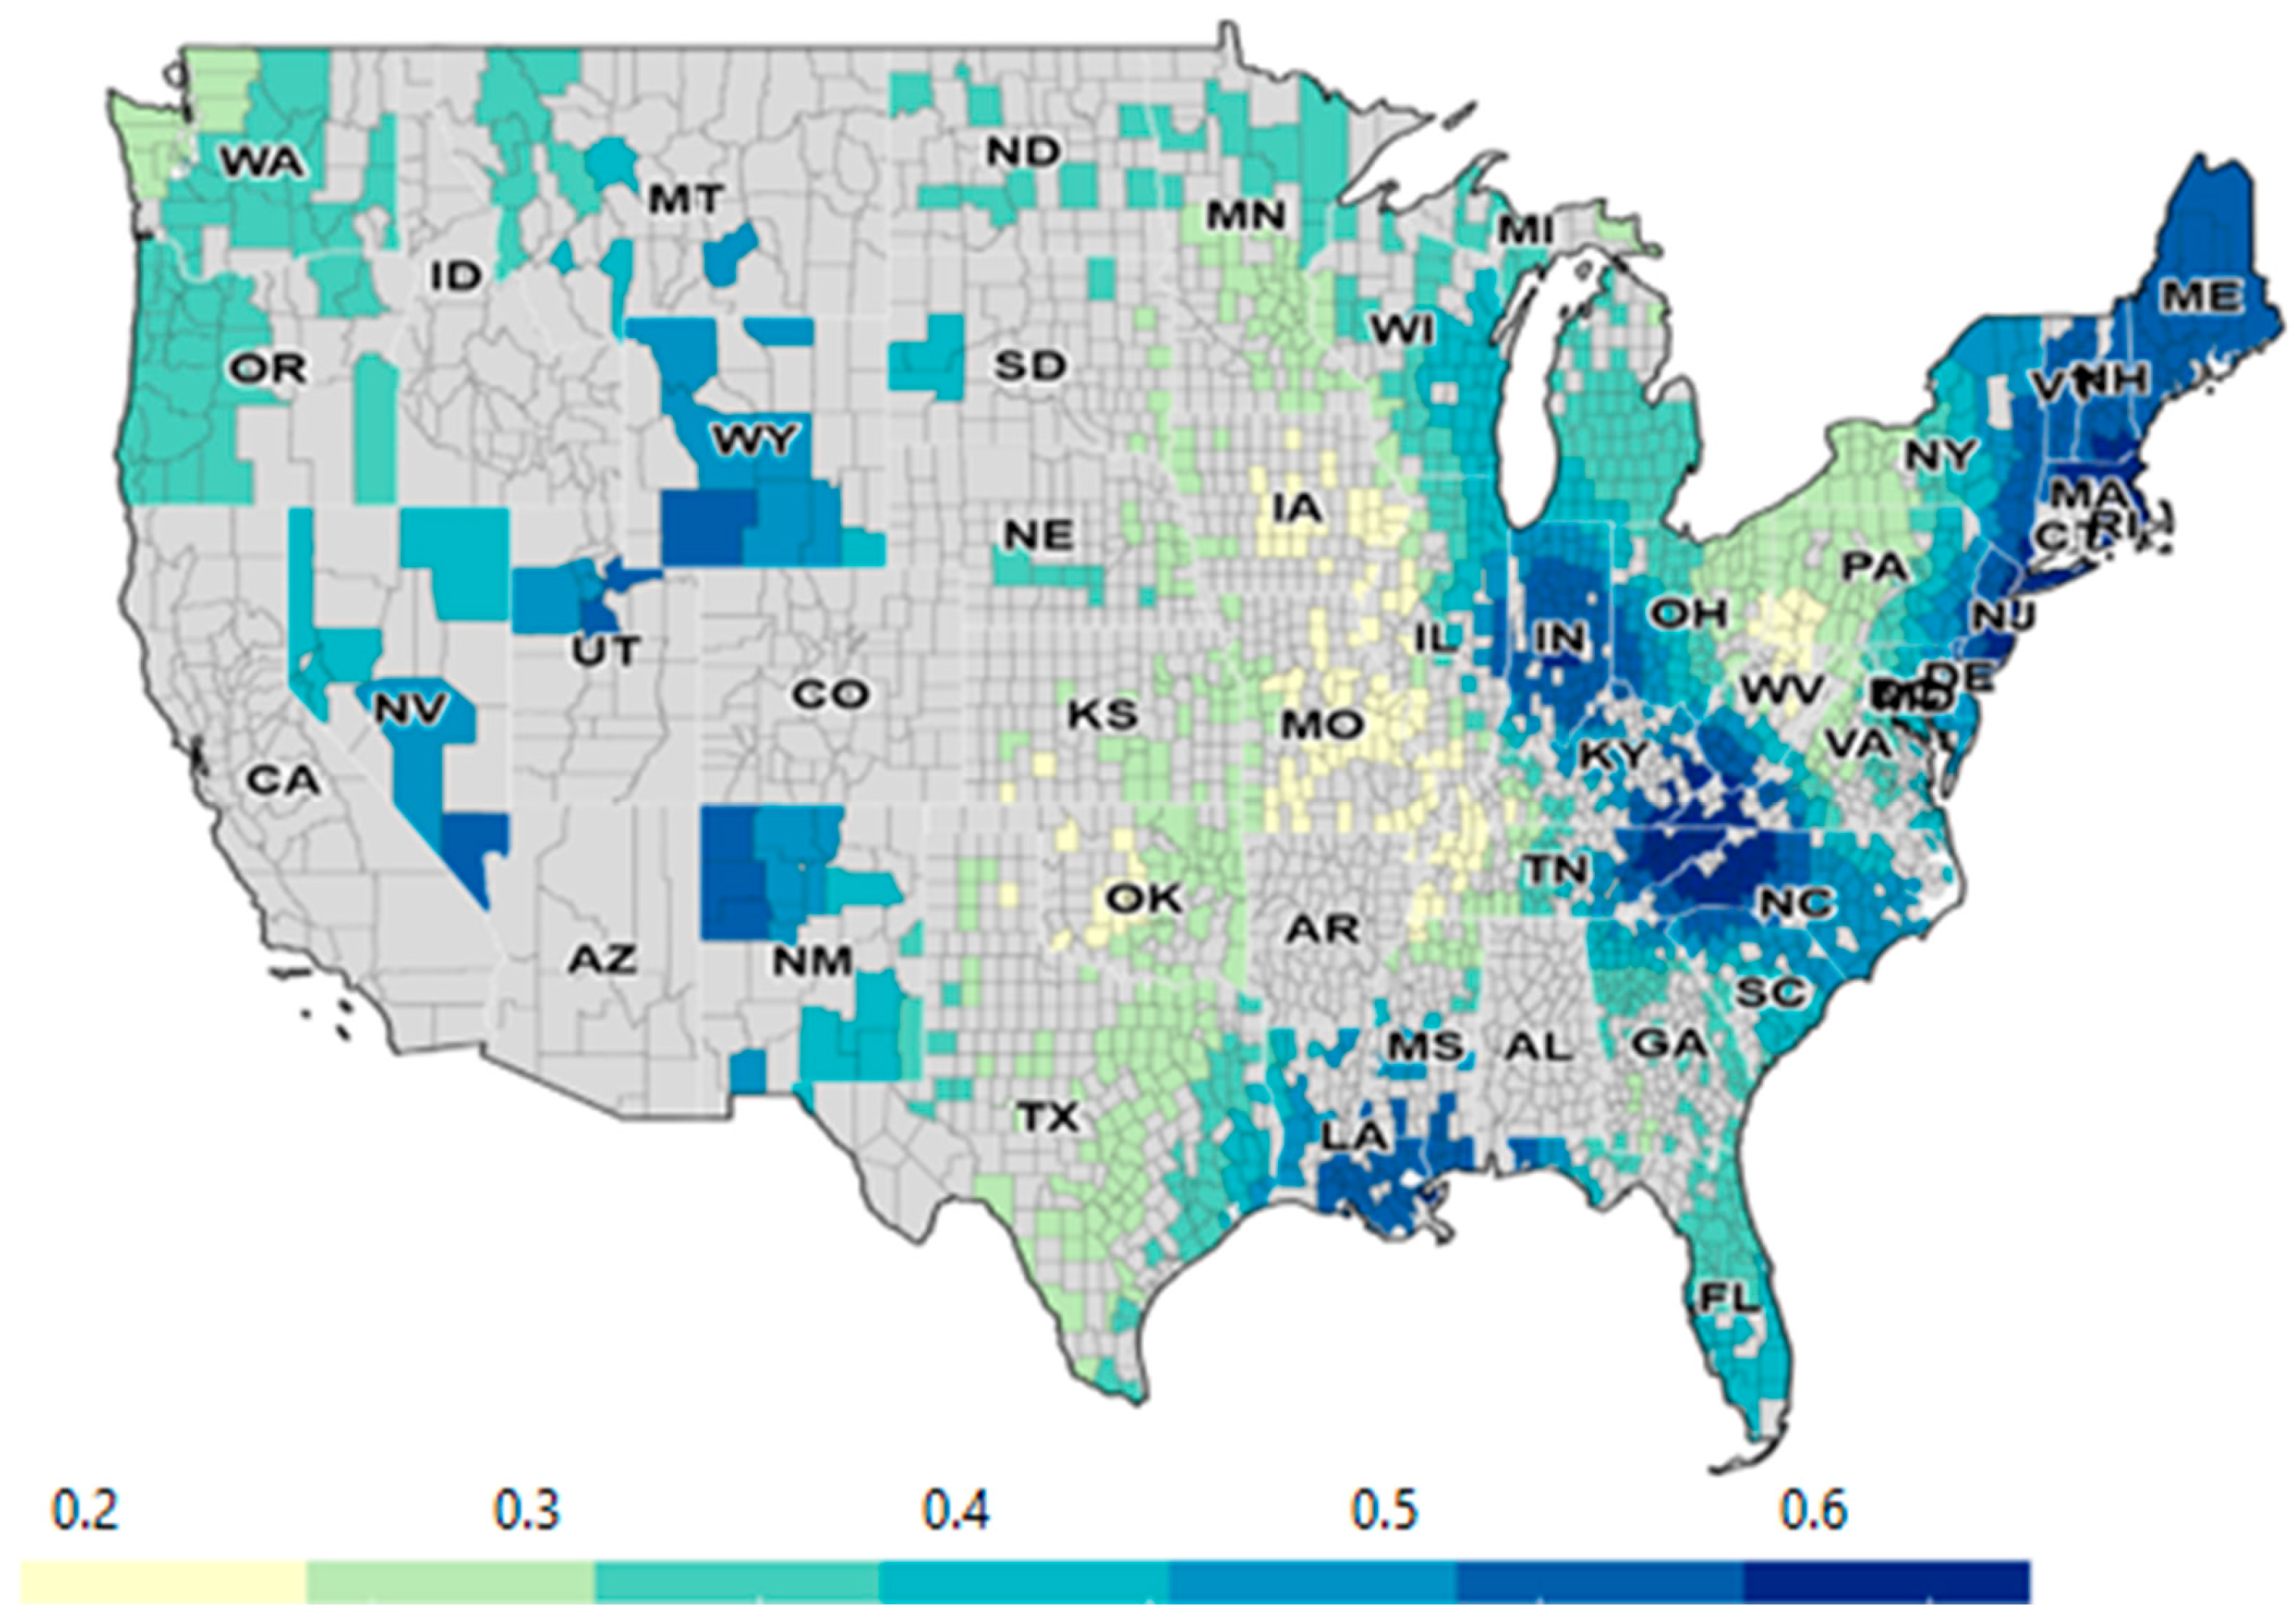
The map of local R2 (Figure 2) illustrates that the local R2 for the MGWR model exceeds 0.5 in certain regions. This suggests that our model can capture more than 50% of the variability in the standardized COVID-19 case rates, demonstrating its relative reliability.

3.3. Spatial Patterns of Severe Depression and Its Relationship with COVID-19 Case Rates and Vaccination Rates

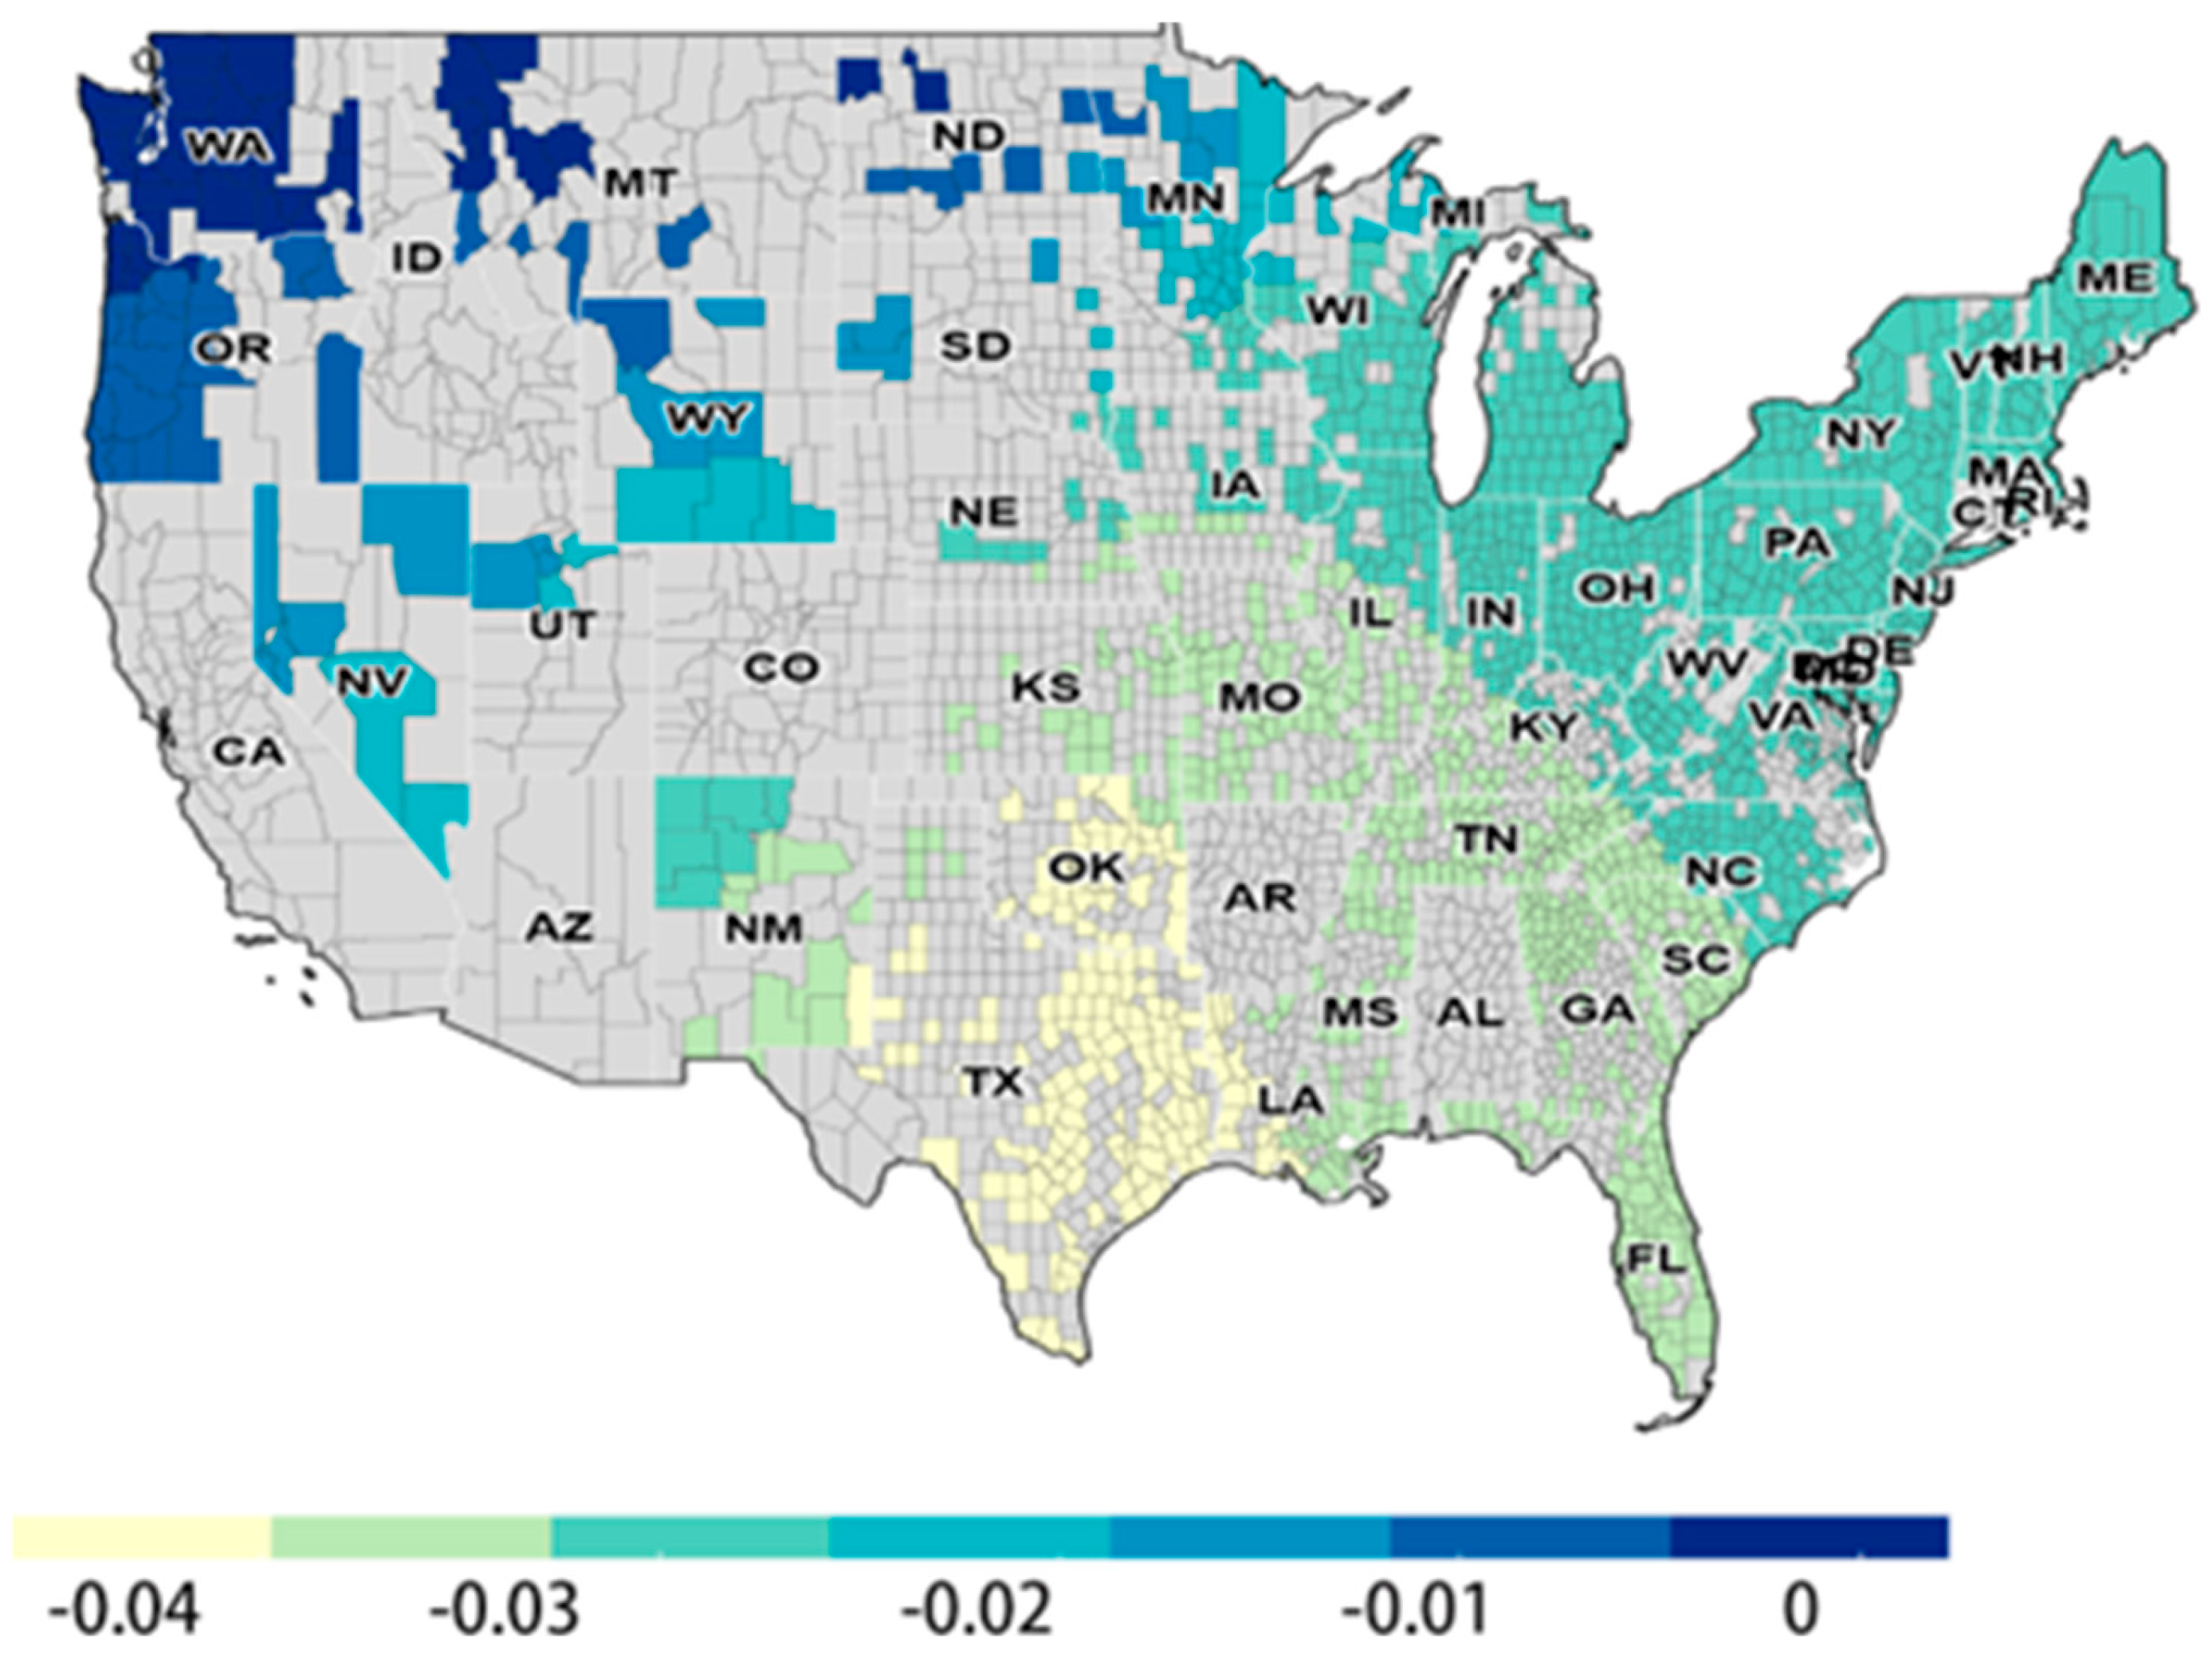
As we previously discussed, the spatial regression model captures spatial heterogeneity. However, the spatial pattern of the relationship between the dependent variable and each independent variable differs, including the variables we focus on: COVID-19 case rates and vaccination rate.
Because all variables were standardized prior to estimation, the coefficients can be interpreted as the expected change in the standardized prevalence of severe depression associated with a one standard deviation increase in each predictor. For example, a local coefficient of −0.2 for vaccination rate indicates that counties with vaccination levels one standard deviation above the mean tend to have a 0.2 standard deviation lower prevalence of severe depression, after controlling for other factors. Conversely, a coefficient of 0.1 for COVID-19 case rates implies that higher case incidence is associated with a modest but positive increase in depression prevalence. These values, while numerically modest, are meaningful at the population level and provide evidence that pandemic-related health behaviors and exposures are linked to subsequent mental health outcomes.
For the COVID-19 case per 100k (Figure 3), the high coefficients are concentrated on the Midwest states in the Great Lakes area. This indicates that in this area, the COVID-19 case rates in 2021 have a stronger relationship with severe depression disorder in 2022. This suggests that the pandemic had a more pronounced impact on mental health in these regions. Importantly, in this region, most of the high coefficients are statistically significant (see Supplementary Figure S2, which masks coefficients with p > 0.1), suggesting that these elevated values represent robust associations rather than random variation.
As shown in Figure 4, for the relationship between the two dose vaccination rate and severe depression, the West Coast counties, particularly those in Washington (WA) and Oregon (OR), have the highest negative coefficients. This denotes a robust inverse correlation between the vaccination rates and severe depression in these areas. Counties in the Northeast, encompassing the New England region, and those in the Midwest and Virginia, presented mid-level coefficients. The Southeastern states, such as Florida (FL) and Georgia (GA), demonstrated low negative coefficients, suggesting a relatively weaker correlation. In contrast, counties in the Southern U.S., notably Texas (TX) and Oklahoma (OK), exhibited the least negative coefficients. While still inverse, this relationship is considerably weaker than in other regions.

3.4. Influence of Control Variables on the Spatial Relationship

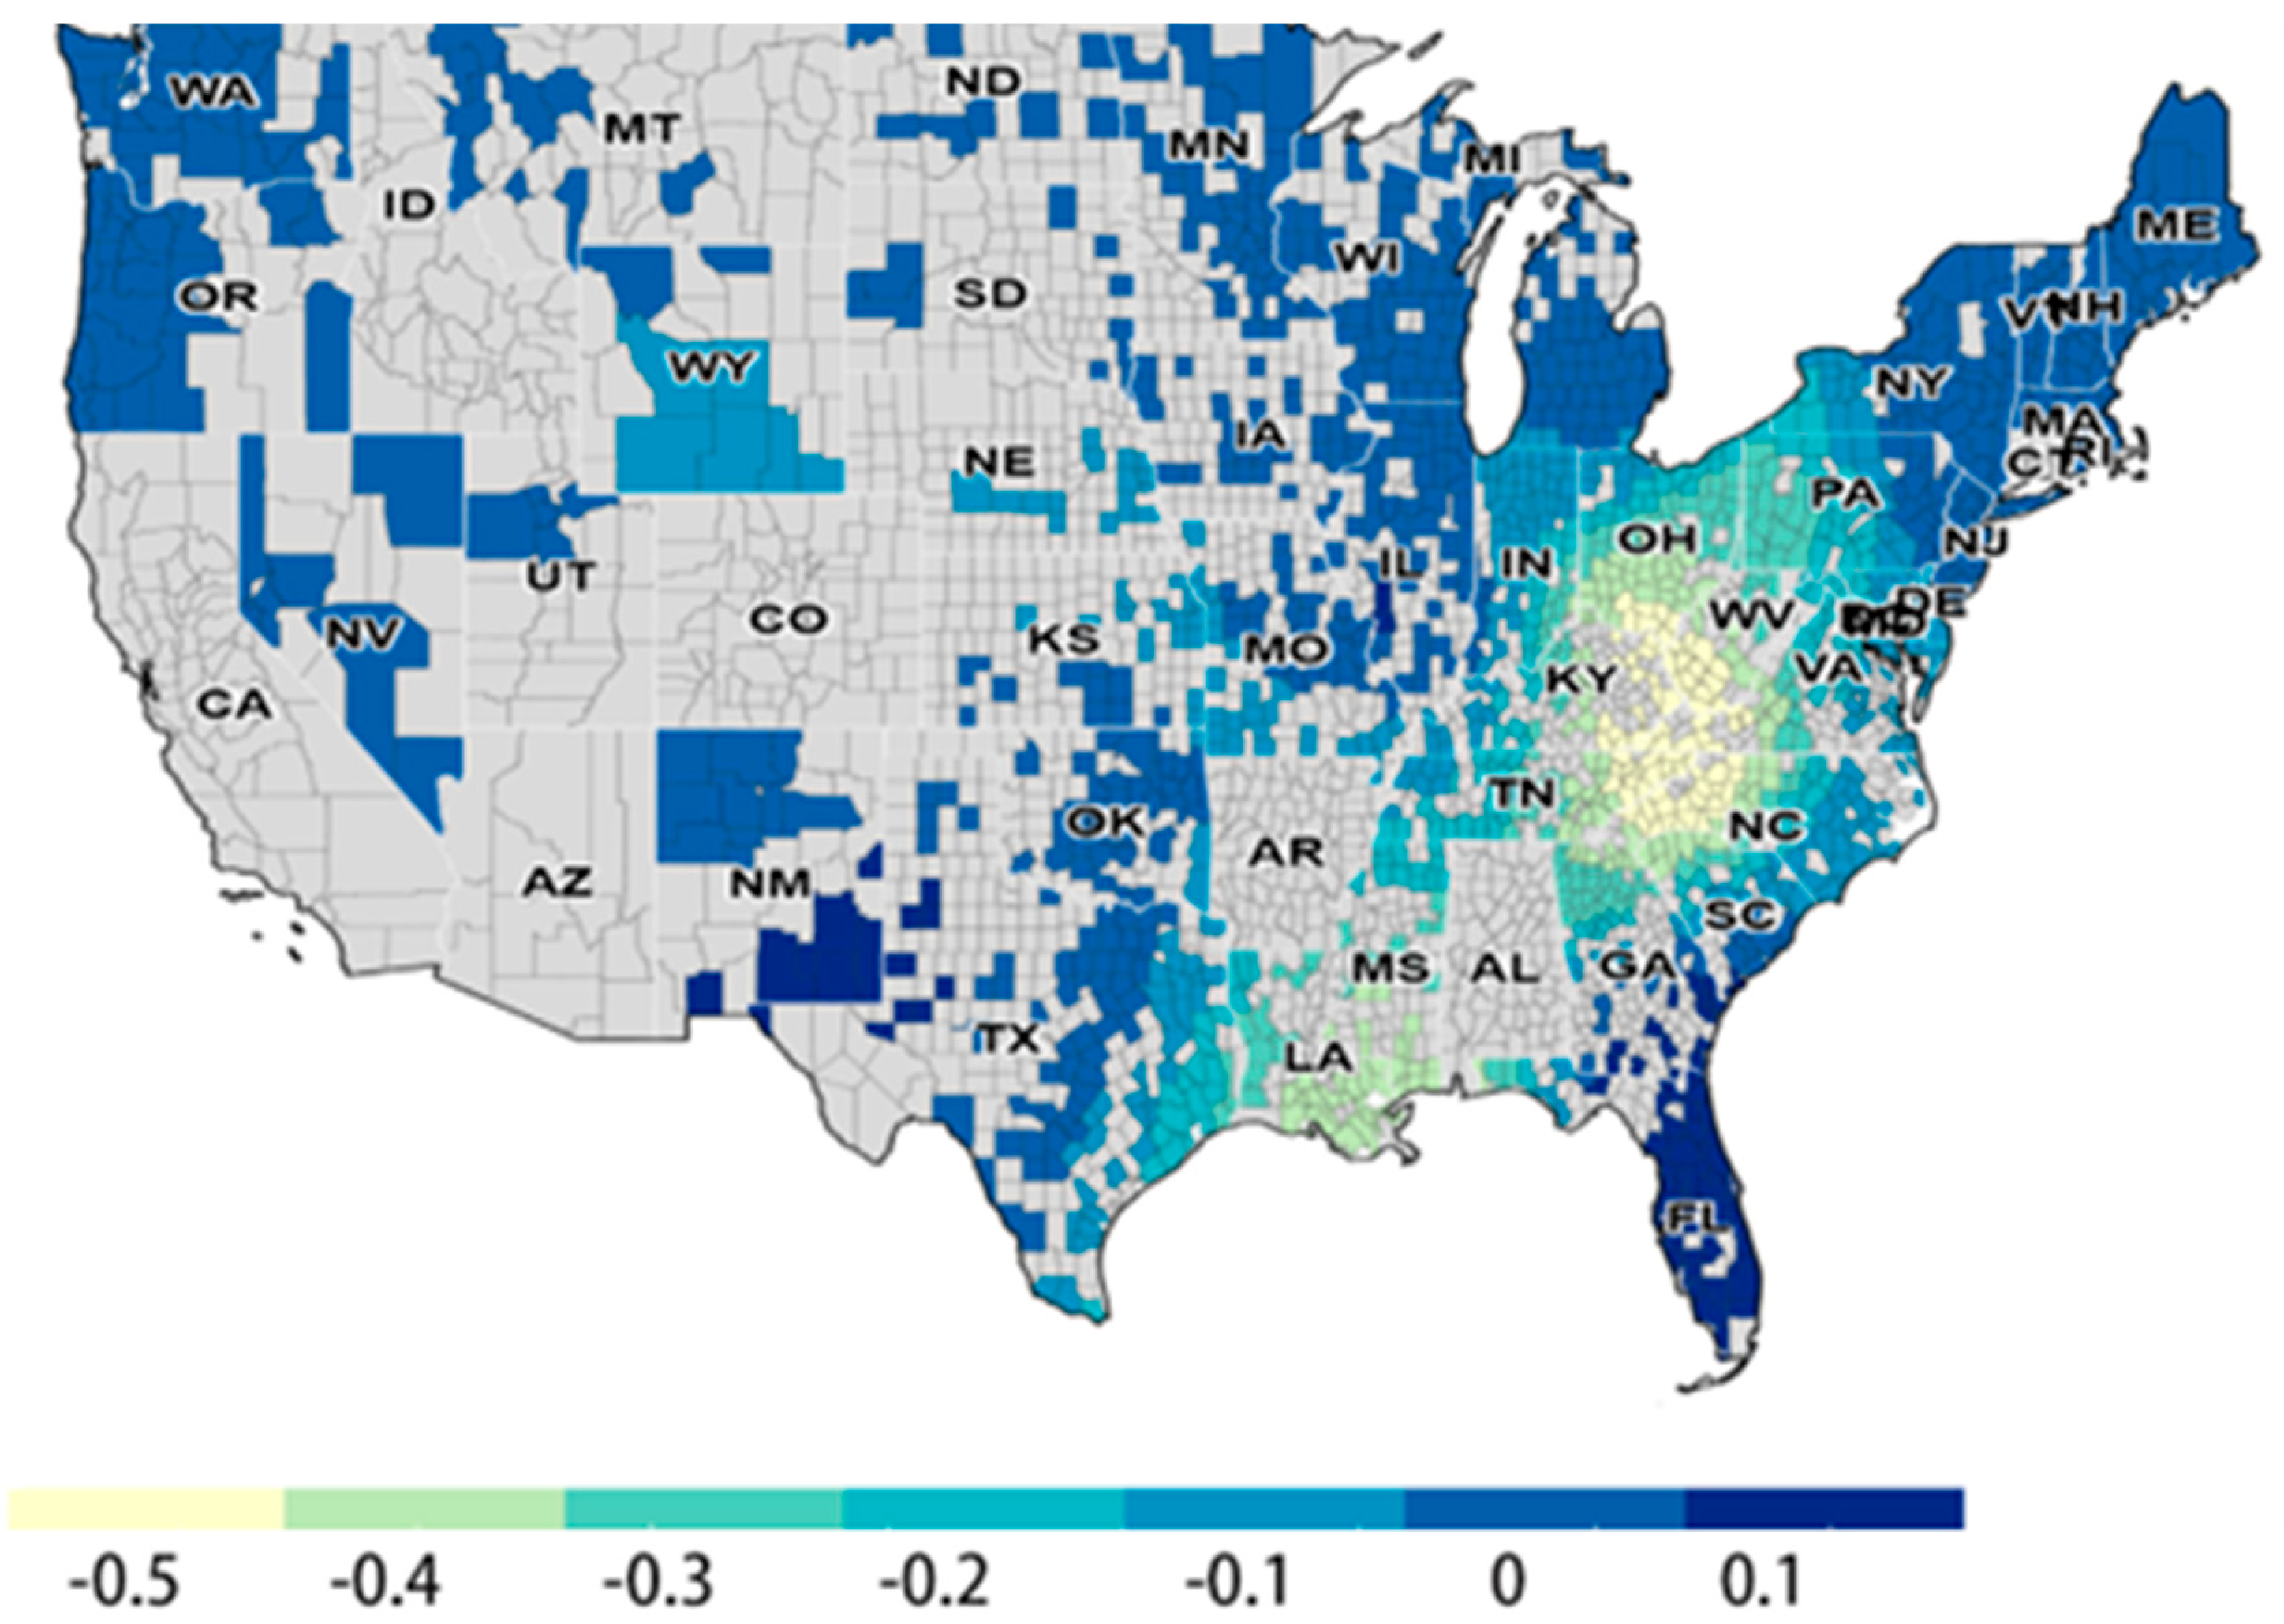
When examining the prevalence of severe depression, it is essential to consider not only the primary variables, such as COVID-19 case rates and vaccination rates, but also additional factors that exhibit spatial correlations. Established associations, such as the relationship between daily sunlight exposure [34] and the density of mental health providers [35], are corroborated by the existing literature. Nevertheless, this investigation reveals several previously unobserved correlations of significance. One prominent finding from our global model is the notable inverse relationship between excessive alcohol consumption and the prevalence of severe depression. This indicates that counties characterized by higher rates of excessive alcohol use generally report diminished occurrences of severe depression. Yet, in the local spatial model, the minimal coefficients are predominantly localized within the Appalachian mountain regions, specifically WV, VA, and NC (Figure 5). Remarkably, these regions with minimal coefficients correspond to elevated local R2 values in Figure 2, indicating a substantive contribution of the negative coefficients for excessive drinking to model fitting.
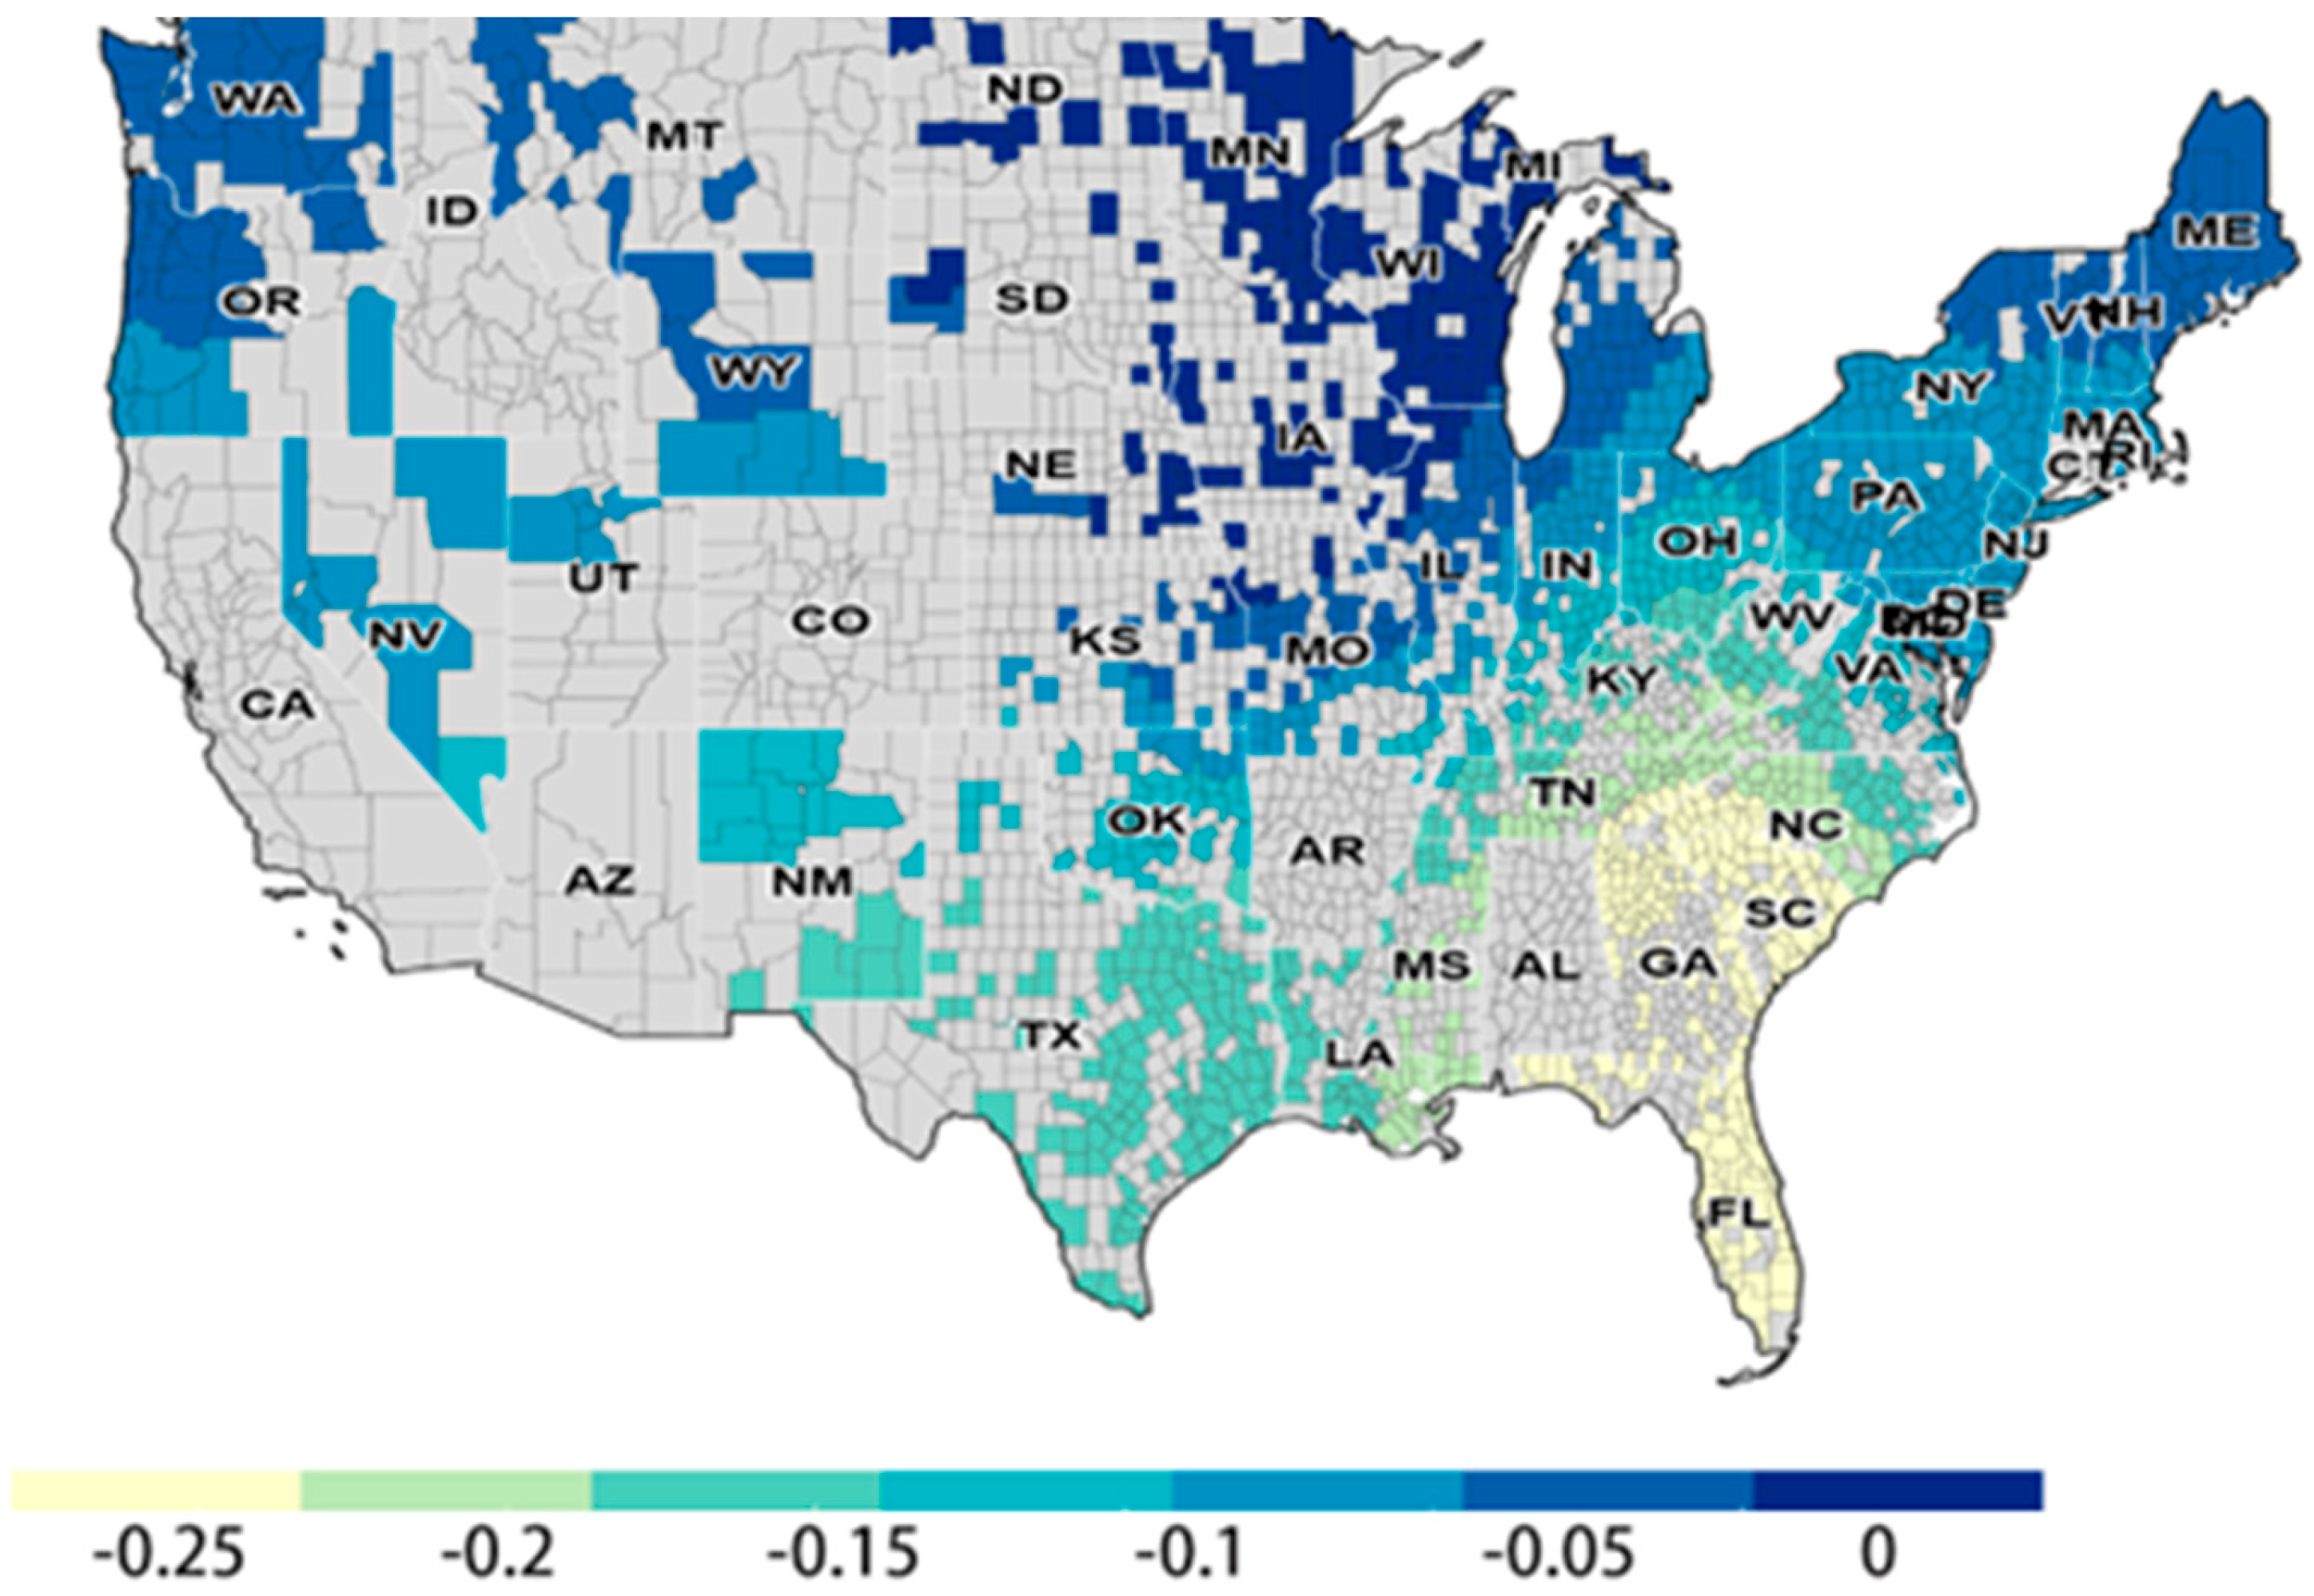
A parallel inverse correlation was discerned between unemployment rates and the onset of severe depression. The spatial models delineate the most minimal coefficients in the Southeastern region, encompassing FL, GA, and SC. In contrast, the most pronounced coefficients appear in the northern segment, particularly in the Midwest regions of WI, MN, and MI (Figure 6). Such emerging trends accentuate the multifaceted determinants of mental health and pave the way for a more intricate discourse on the interrelationship of these elements in shaping regional mental health dynamics.

4. Discussion

4.1. COVID-19 Case Rates, Vaccination, and Severe Depression

Our findings indicate a significant positive correlation between COVID-19 case rates and severe depression, suggesting that higher infection rates are associated with an increase in severe depression. Conversely, vaccination rates show a negative association with severe depression, indicating that counties with higher vaccination coverage tended to report lower depression rates. These associations highlight the broader psychological impacts of the pandemic.
The pandemic has undeniably been a source of increased stress and anxiety across populations, primarily due to the fear of infection, bereavement, and the socioeconomic repercussions of COVID-19 [36,37,38]. Vaccination may help alleviate these concerns by reducing uncertainty and restoring a sense of safety, which is consistent with a recent meta-analysis study demonstrating that vaccination significantly reduced the risk of developing post-COVID-19 conditions, including anxiety and depression [39]. Notably, we observed a temporal lag effect: COVID-19 case rates and vaccination rates in 2021 were significantly associated with severe depression in 2022, whereas such effects were not observed in the same year (2022). It could be that the enduring impact of COVID-19 infections in the previous year manifests at a later time, as symptoms of post-COVID-19 conditions can last for months or even years [39,40]. Vaccination efforts, therefore, may play a dual role in not only containing the physical health impacts of COVID-19, but also in mitigating its psychological repercussions. In addition to these health consequences, the delayed effect may also arise from broader societal disruptions. Uneven economic recovery, financial insecurity, and persistent unemployment continued to affect many communities in 2022, while extended social isolation and disruptions to social networks likely have cumulative effects on mental health. Prior study supports this interpretation, showing that economic distress in one period (t − 1) explained more than half of the variation in depression in the subsequent period (t), suggesting a clear temporal lag [41]. Taken together, these biological and socioeconomic pathways provide a plausible explanation for why the mental health impacts of COVID-19 could manifest with a temporal lag.

4.2. Spatial Interpretation

It is known that geographic disparities can contribute to substantial variations in COVID-19 case rates and in-hospital mortality rates [42,43,44]. It is uncertain whether geographical differences may impact the relationship between COVID-19 case rates and severe depression.
We observed that, when comparing the COVID-19 case rates and severe depression, the Midwest states and the Great Lakes areas have the highest coefficients, as shown in Figure 3, indicating that in these areas, the COVID-19 case rates in 2021 have the strongest positive relationship with 2022’s severe depression disorder. Several factors could contribute to this. Firstly, there is a shortage of mental health professionals in the workforce. Based on the Health Workforce Shortage Area [45] data, as of December 2023, about 170 million Americans live in areas with mental health service shortages.
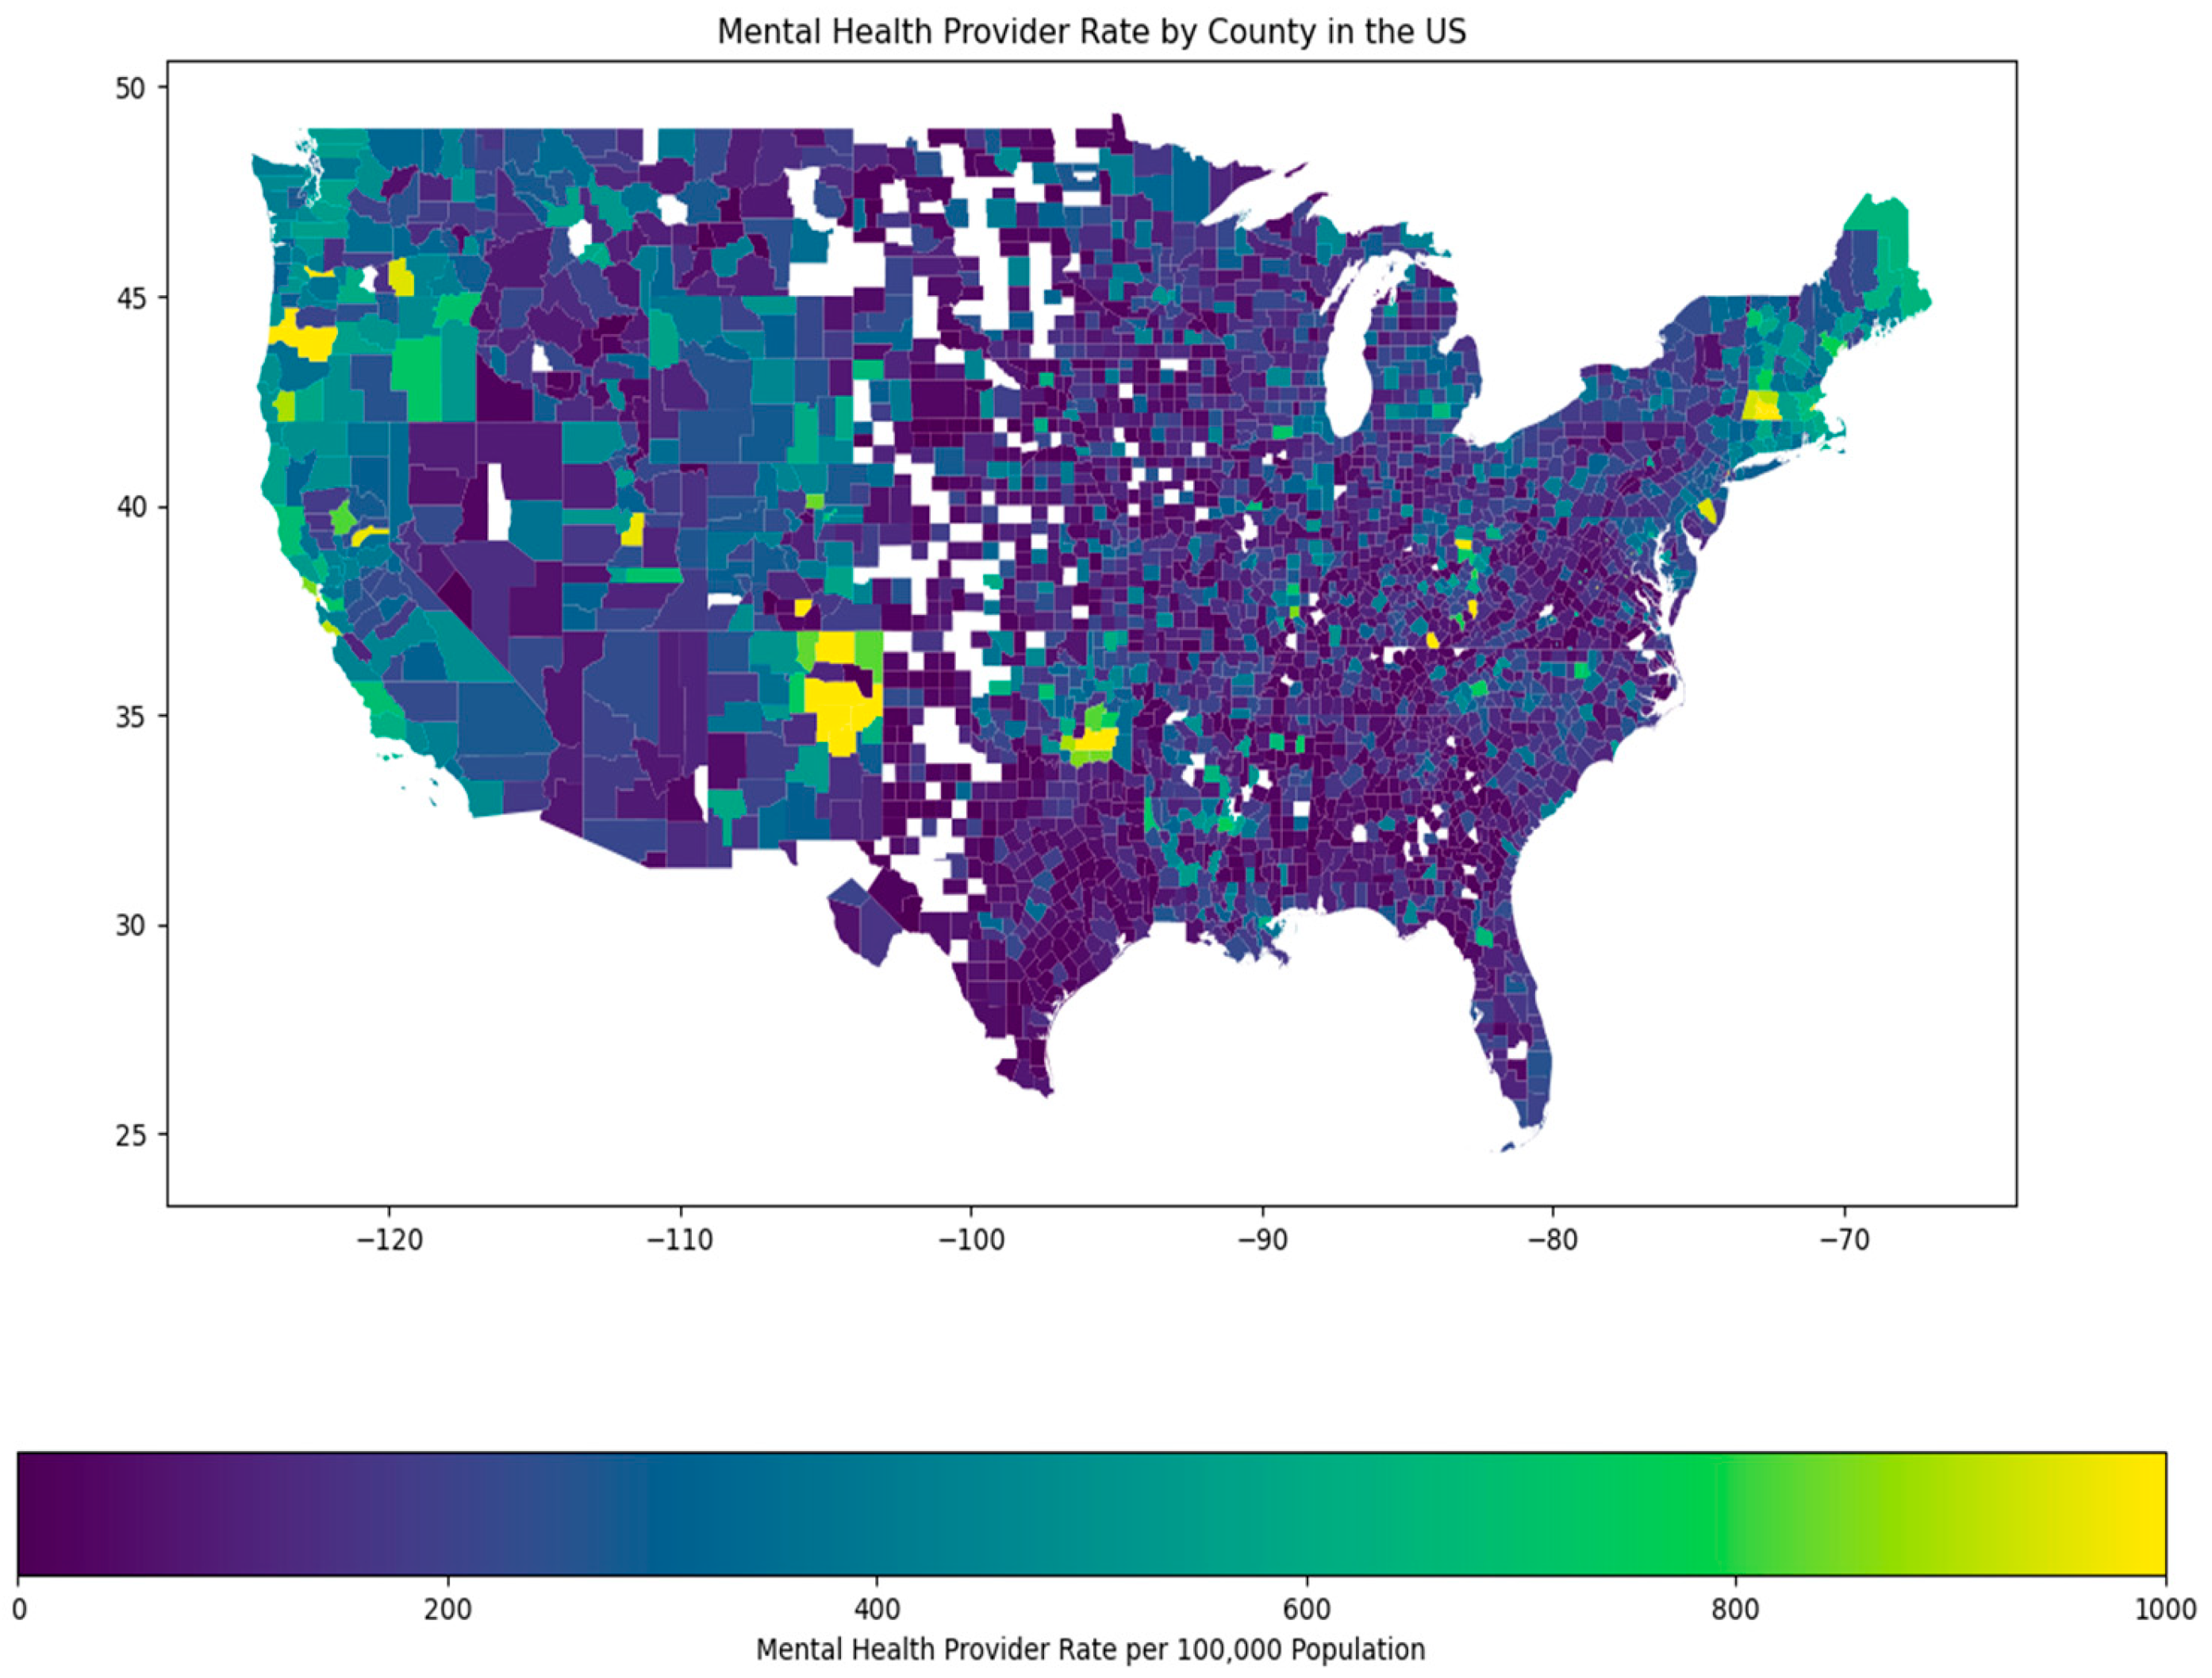
As shown in Figure 7, these areas have an inadequate number of mental health providers, which may result in a lack of access to mental health services and increased untreated mental health issues. Second, the socioeconomic factors are important. These regions, predominantly within areas known as the “Rust Belt,” are primarily characterized by traditional manufacturing industries. As such, the repercussions of the pandemic have been more profoundly felt here than in regions dominated by high-tech industries. Due to its inherent nature, the traditional manufacturing sector does not lend itself to remote working options.
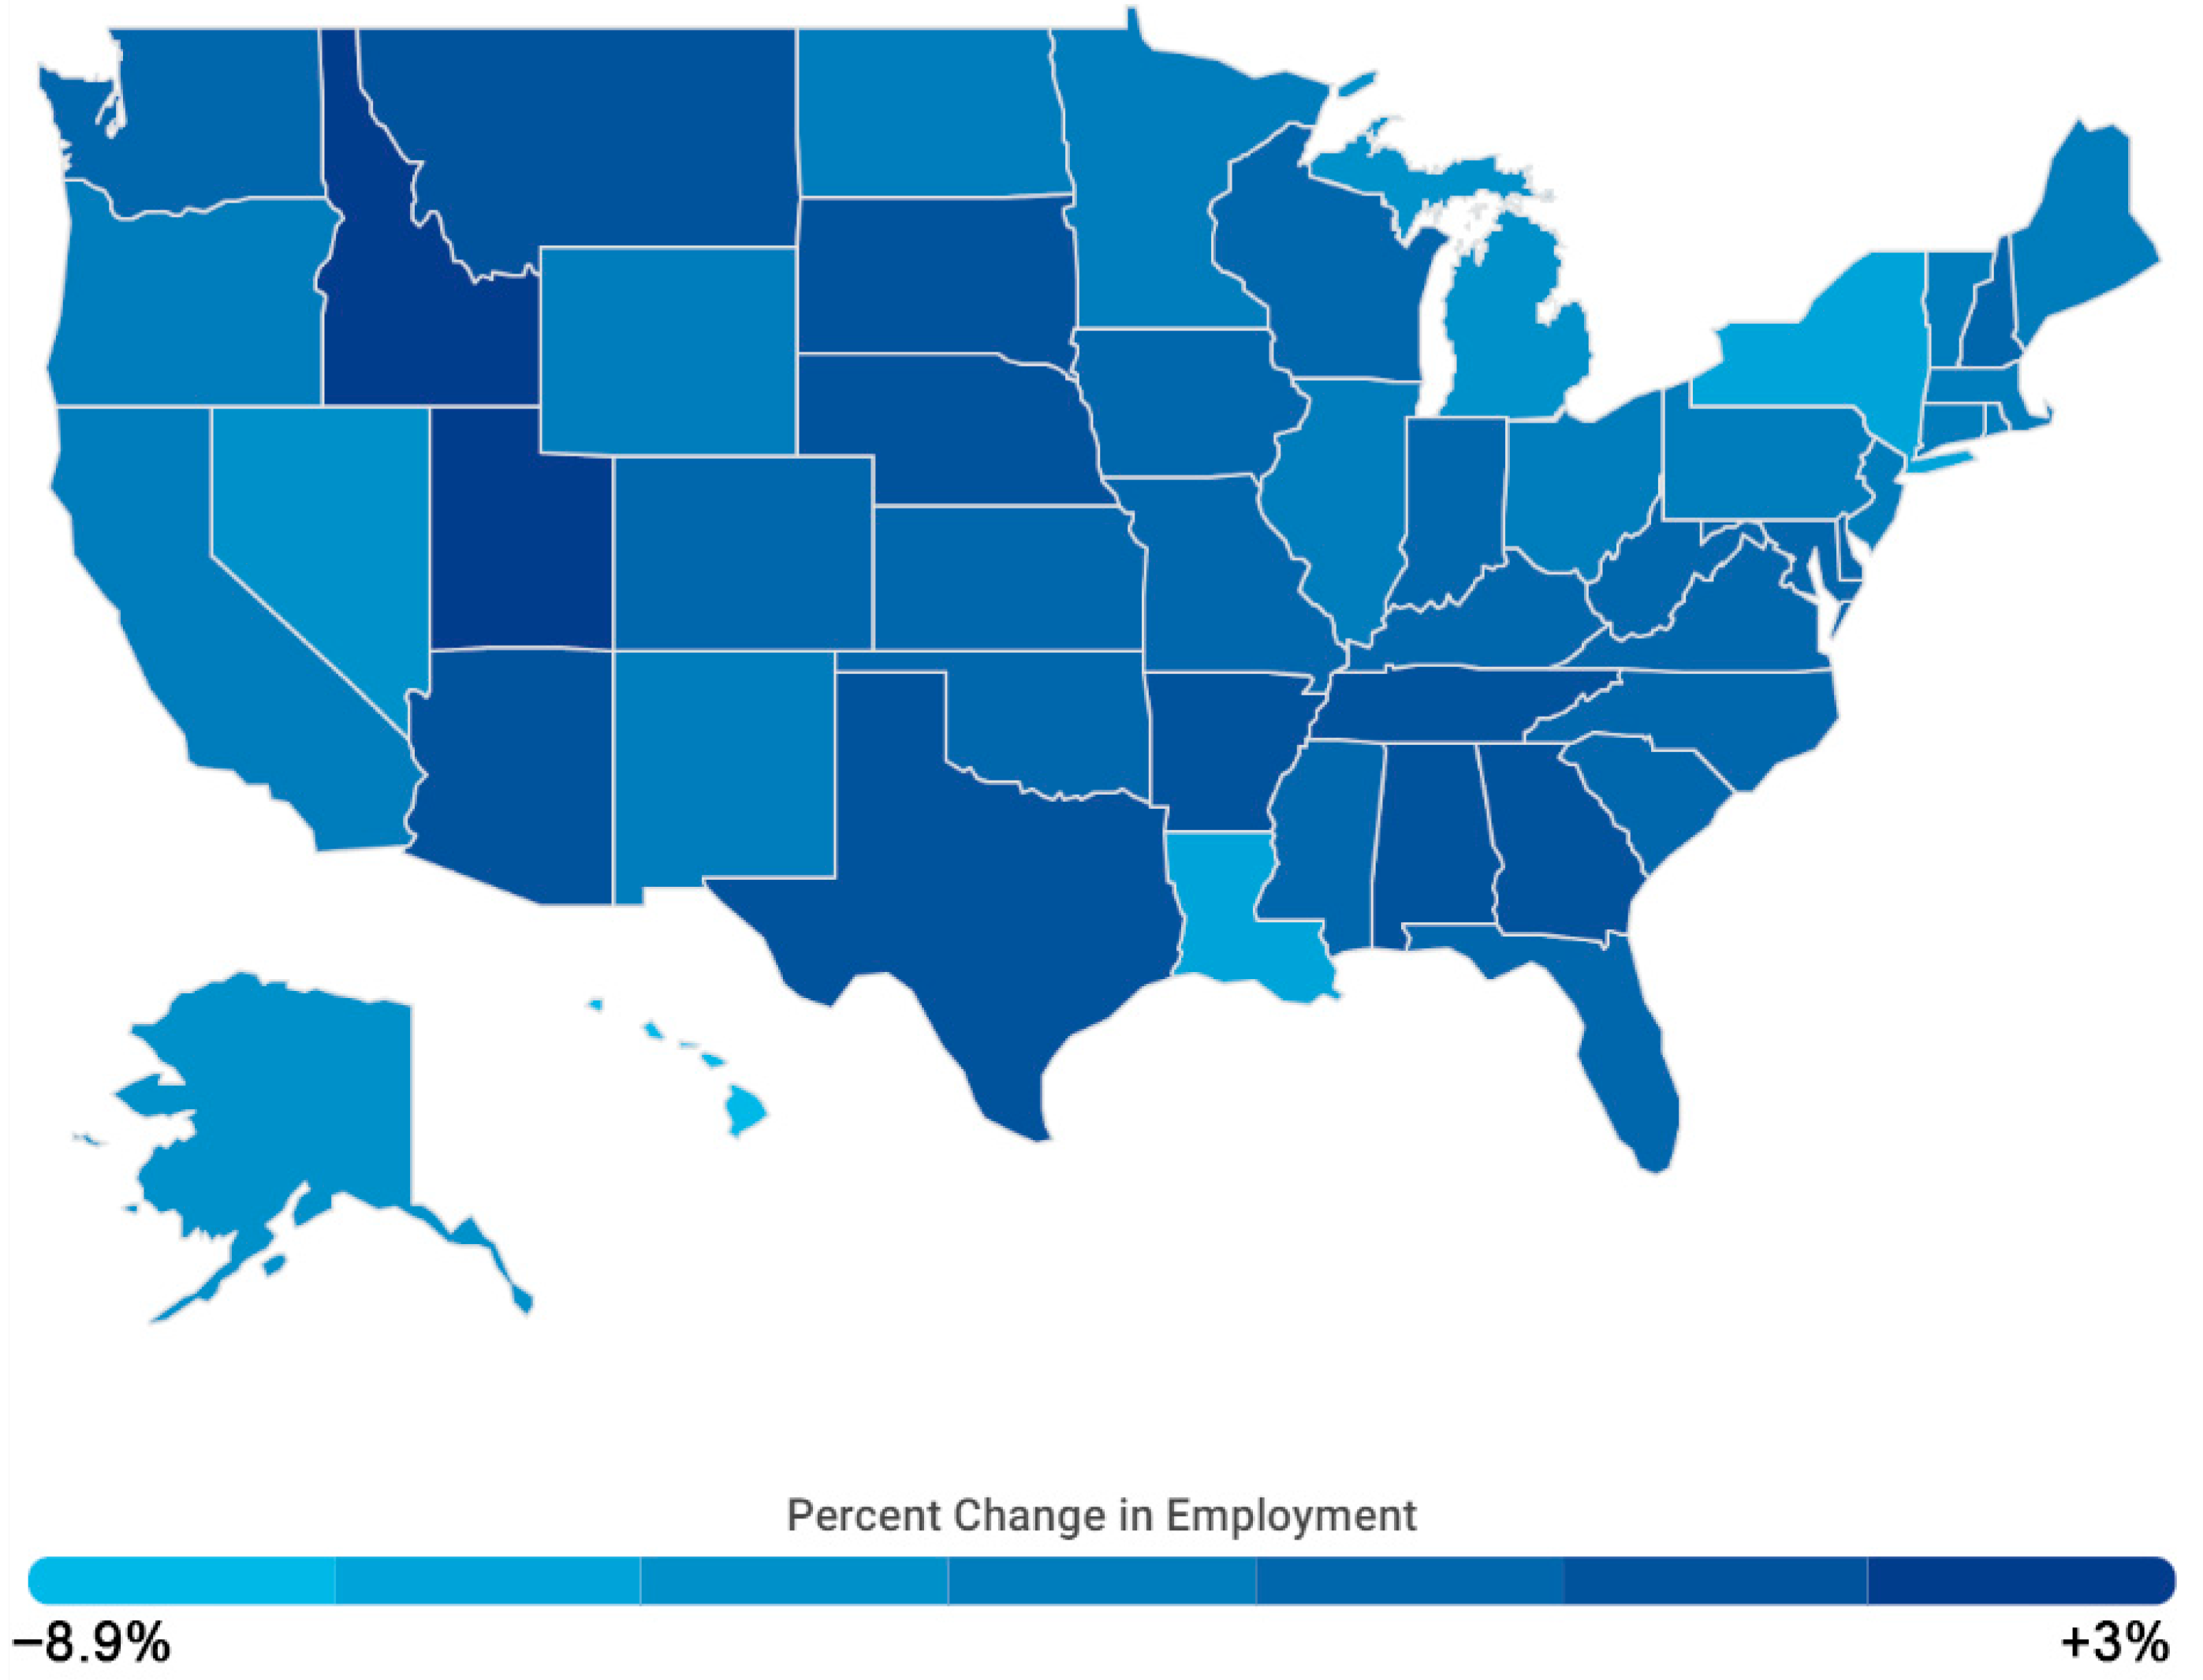
Consequently, numerous factories were compelled to halt operations during the height of the pandemic. According to the Bureau of Labor Statistics, as illustrated in Figure 8, during February 2020 and September 2021, the Midwest and Great Lakes regions faced the brunt of the employment decline, while areas less dependent on manufacturing, such as Texas and Florida, showed more resilience to job losses. During this period, New York registered an 8.9% job loss, Michigan reported a 6.1% dip in employment, and Illinois experienced a 5.3% decline. In stark contrast, regions less dependent on manufacturing, such as Texas and Florida, showed greater resilience, with job losses of 0.9% and 2.3%, respectively. In addition, Washington, with its economy leaning more towards the IT and health sectors than traditional manufacturing, witnessed a lower job loss of only 2.2% during this period.
Additionally, the weather in these areas is cold during the winter, and people rarely have the opportunity to socialize and travel. The COVID-19 pandemic exacerbates the situation due to quarantine and social distancing, resulting in prolonged social isolation and stress. The availability and quality of mental health services might also vary, making it more difficult for people in these regions to access necessary care. The economic impact of the pandemic may also be more severe in these areas, contributing to stress and subsequent mental health issues. Together, these factors help explain why the associations between COVID-19 case rates and severe depression vary regionally. The spatial heterogeneity identified by the MGWR models likely reflects these underlying structural differences, rather than random variation.
The inverse relationship between vaccination rates and severe depression corroborates our initial hypotheses. An augmented vaccination rate inherently reduces the probability of contracting COVID-19. Furthermore, in instances of infection, the disease typically presents with less severe symptoms. This reduction in the severity and duration of illness consequently diminishes the associated quarantine duration and medical costs, including direct healthcare expenditures and indirect costs such as extended sick leave and the potential for job loss. Upon examining the spatial distribution of the correlation coefficient, the Southern region, particularly Texas and Alabama, exhibits the lowest coefficient, indicating a more pronounced inverse relationship between COVID-19 vaccination rates and depression compared to other regions. Conversely, the East Coast manifests a higher coefficient, with the West Coast displaying the highest. Enhancing vaccination rates in the Southern United States could lead to a disproportionately lower rate of depression in these locales compared to other regions. This disparity highlights the potential for tailored public health strategies to enhance local vaccination rates and yield community-wide benefits. Nonetheless, the spatial heterogeneity revealed through this analysis presents a compelling aspect that warrants further investigation. At the same time, as this study is ecological in design, these regional disparities should be interpreted with caution, since within-county variation and individual-level heterogeneity may not be fully captured.

4.3. Other Contributing Factors

Beyond COVID-19-related variables, our analysis has identified several other factors contributing to the variation in severe depression rates across counties. These include demographic characteristics, environmental factors, access to mental health resources, health behaviors, and economic indicators. The diversity in mental health provider rates, for example, suggests disparities in access to mental health care, which could influence regional depression rates. We also found a negative association between excessive alcohol drinking and severe depression rates in 2022, contradicting the current robust epidemiological and psychiatric consensus. Several mechanisms could explain this pattern in the context of COVID-19. Prior studies have reported that individuals experiencing pandemic-related stress increased their alcohol consumption, suggesting that alcohol may have been used as a form of self-medication. This coping behavior could contribute to lower self-reported rates of severe depression [46,47]. Furthermore, because the minimal coefficients are predominantly localized within the Appalachian Mountain regions, this pattern may also reflect stigma and under-reporting of mental health conditions in these populations, where cultural norms and limited access to care have been shown to reduce recognition and reporting of depression, thereby influencing observed prevalence rates [48,49].
Excessive alcohol consumption, unemployment rates, and average daily sunlight are among the factors that showed significant correlations with severe depression rates. These findings underscore the multifaceted nature of mental health, where biological, environmental, and socioeconomic factors intersect. The complexity of these interactions also raises the possibility of multicollinearity in the ecological models, whereby correlated predictors could obscure the actual independent effect of alcohol use. Together, these considerations highlight that addressing severe depression requires a holistic perspective that integrates biological, behavioral, and contextual determinants.

4.4. Comparison with Pre-Pandemic Studies

Comparing these findings with pre-pandemic studies offers a unique perspective on the evolving nature of mental health determinants. Before the pandemic, research on severe depression primarily focused on individual risk factors, such as genetics [50], personal history [51], and lifestyle choices [52]. The current study expands this perspective by emphasizing the significant role of external societal factors, such as public health crises and their management strategies.
The stark contrast in the incidence and severity of depression pre- and post-onset of the COVID-19 pandemic underscores the substantial impact of external stressors on mental health. This shift suggests the need for an adaptable mental health care system capable of responding to both individual and collective psychological challenges. It also indicates the importance of resilience-building in populations, preparing them for unforeseen global crises such as a pandemic.

5. Conclusions

In this study, we developed and applied a Multiscale Geographically Weighted Regression (MGWR) model to investigate the relationships among COVID-19 case rates, vaccination rates, severe depression disorder, and various socioeconomic factors, including age and unemployment. Our findings indicate a significant positive correlation between COVID-19 incidence and severe depression, alongside a notable negative correlation between vaccination rates and severe depression. While causality cannot be definitively established due to the absence of extensive time-series data, applying a one-year lag in our model provides preliminary insights into the directional influence of these variables.
Notably, our research uncovers significant geospatial variations in the impact of COVID-19 on severe depression across the United States. These spatial disparities appear to be closely linked with socioeconomic variables, underscoring the necessity of tailored interventions targeting modifiable social and economic vulnerability, particularly among racial and ethnic minorities in underserved communities. To enhance vaccine uptake and address severe depression associated with COVID-19, policymakers must build public trust and engage local communities through collaboration with community leaders, healthcare champions, and faith-based organizations. Strategies to combat misinformation and expand the reach of accurate, science-based information about COVID-19 and its vaccines are critical in altering perceptions and increasing vaccine acceptance at individual and community levels.
This study’s contribution is particularly vital, given the scarcity of research exploring the spatial relationship between COVID-19 vaccination and mental health in the United States. Our geospatial analysis provides valuable insights for public health decision-makers, aiding in the development of region-specific strategies to monitor vaccination efforts and address long COVID-19 symptoms, which often include psychological and cognitive impairments [53].
Our study has a few limitations. Firstly, our study used PHQ-9 as the screening tool for severe depression. Although this self-reported questionnaire is valid and reliable, the results are not intended to estimate the “prevalence” of severe depression. Studies showed that reporting the percentage of patients with scores from screening questionnaires could substantially overestimate prevalence, as these scales are designed to identify far more people than those who have a mental disorder [54]. Clinicians are expected to rule out organic or medical causes of depression before the diagnosis of MDD [34]. Therefore, the actual prevalence of severe depression is lower than reported in this study [55]. Being a self-reported measure, it is also vulnerable to recall and social desirability biases, which might affect the accuracy of reported symptoms [56]. In addition, The MHA PHQ-9 dataset does not include all U.S. counties. This could introduce bias if missing counties differ systematically (e.g., rural vs. urban, or healthcare access). Another limitation is the inherent nature of our dataset, spanning only two years. This constrains our ability to establish causality between COVID-19 vaccination and severe depression firmly. A more robust analysis, potentially employing Granger causality tests, would necessitate a more extended time series to discern long-term effects. Furthermore, the lack of comprehensive mental health data in certain counties, such as those in California, introduces additional variability and uncertainty in our spatial analysis. Future research should focus on expanding the temporal and spatial scope of data collection to enhance the robustness and generalizability of our findings. Finally, the significant spatial autocorrelation observed in the OLS residuals may suggest that important explanatory variables are missing from the model, or that there are unobserved spatial processes influencing depression prevalence. While MGWR reduces this residual autocorrelation, future research could explore additional covariates or multi-level modeling approaches to better capture these unmeasured influences.

Supplementary Materials

The following supporting information can be downloaded at: https://www.mdpi.com/article/10.3390/ijgi14100376/s1, Table S1: DSM-5-TR diagnostic criteria for a major depressive episode; Table S2: Determine the severity of depression; Table S3: Descriptive Statistics of Variables; Table S4: Detailed Information on Variables; Table S5: VIF Results on Independent Variables; Table S6: OLS Results on all Variables; Figure S1: Spatial distribution of the coefficient of vaccination rate with p > 0.1 masked; Figure S2: Spatial distribution of the coefficient of COVID-19 case rates with p > 0.1 masked; Figure S3: Spatial distribution of the coefficient of COVID-19 case rates with p > 0.1 masked; Figure S4: Spatial distribution of the coefficient of unemployment rates with p > 0.1 masked. References [32,33,57] cited in the supplementary material file

Author Contributions

Conceptualization, Yuqing Wang and Wencong Cui; methodology, Yuqing Wang and Wencong Cui; software, Wencong Cui; validation, Yuqing Wang and Wencong Cui.; formal analysis, Wencong Cui; investigation, Yuqing Wang; resources, Yuqing Wang and Wencong Cui; data curation, Wencong Cui; writing—original draft preparation, Yuqing Wang and Wencong Cui; writing—review and editing, Yuqing Wang and Wencong Cui; visualization, Yuqing Wang and Wencong Cui; supervision, Yuqing Wang and Wencong Cui; project administration, Yuqing Wang; funding acquisition, Wencong Cui. All authors have read and agreed to the published version of the manuscript. Yuqing Wang and Wencong Cui contributed equally to this work.

Funding

This research received no external funding.

Data Availability Statement

The dataset will be provided upon request.

Conflicts of Interest

The authors declare no conflicts of interest.

References

  1. Dragioti, E.; Li, H.; Tsitsas, G.; Lee, K.H.; Choi, J.; Kim, J.; Choi, Y.J.; Tsamakis, K.; Estradé, A.; Agorastos, A.; et al. A large-scale meta-analytic atlas of mental health problems prevalence during the COVID-19 early pandemic. J. Med. Virol. 2022, 94, 1935–1949. [Google Scholar] [CrossRef]
  2. Racine, N.; McArthur, B.A.; Cooke, J.E.; Eirich, R.; Zhu, J.; Madigan, S. Global Prevalence of Depressive and Anxiety Symptoms in Children and Adolescents During COVID-19: A Meta-analysis. JAMA Pediatr 2021, 175, 1142–1150. [Google Scholar] [CrossRef] [PubMed]
  3. Zhang, S.X.; Batra, K.; Xu, W.; Liu, T.; Dong, R.K.; Yin, A.; Delios, A.Y.; Chen, B.Z.; Chen, R.Z.; Miller, S.; et al. Mental disorder symptoms during the COVID-19 pandemic in Latin America—A systematic review and meta-analysis. Epidemiol. Psychiatr Sci. 2022, 31, e23. [Google Scholar] [CrossRef]
  4. Zhang, S.X.; Miller, S.O.; Xu, W.; Yin, A.; Chen, B.Z.; Delios, A.; Dong, R.K.; Chen, R.Z.; McIntyre, R.S.; Wan, X.; et al. Meta-analytic evidence of depression and anxiety in Eastern Europe during the COVID-19 pandemic. Eur. J. Psychotraumatol. 2022, 13, 2000132. [Google Scholar] [CrossRef]
  5. Stein, D.J.; Phillips, K.A.; Bolton, D.; Fulford, K.W.M.; Sadler, J.Z.; Kendler, K.S. What is a mental/psychiatric disorder? From DSM-IV to DSM-V. Psychol. Med. 2010, 40, 1759–1765. [Google Scholar] [CrossRef]
  6. Kroenke, K.; Spitzer, R.L.; Williams, J.B. The PHQ-9: Validity of a brief depression severity measure. J. Gen. Intern. Med. 2001, 16, 606–613. [Google Scholar] [CrossRef]
  7. Vai, B.; Mazza, M.G.; Colli, C.D.; Foiselle, M.; Allen, B.; Benedetti, F.; Borsini, A.; Dias, M.C.; Tamouza, R.; Leboyer, M.; et al. Mental disorders and risk of COVID-19-related mortality, hospitalisation, and intensive care unit admission: A systematic review and meta-analysis. Lancet Psychiatry 2021, 8, 797–812. [Google Scholar] [CrossRef]
  8. Ceban, F.; Nogo, D.; Carvalho, I.P.; Lee, Y.; Nasri, F.; Xiong, J.; Lui, L.M.W.; Subramaniapillai, M.; Gill, H.; Liu, R.N.; et al. Association Between Mood Disorders and Risk of COVID-19 Infection, Hospitalization, and Death: A Systematic Review and Meta-analysis. JAMA Psychiatry 2021, 78, 1079–1091. [Google Scholar] [CrossRef]
  9. Dutta, A. COVID-19 waves: Variant dynamics and control. Sci. Rep. 2022, 12, 9332. [Google Scholar] [CrossRef]
  10. Centers for Disease Control and Prevention. COVID-19 Vaccines. Available online: https://www.cdc.gov/covid/vaccines/index.html (accessed on 1 August 2023).
  11. Mojtabai, R. COVID-19 Vaccination and Mental Health Distress. J. Gen. Intern. Med. 2022, 37, 1020–1021. [Google Scholar] [CrossRef]
  12. Koltai, J.; Raifman, J.; Bor, J.; McKee, M.; Stuckler, D. COVID-19 Vaccination and Mental Health: A Difference-In-Difference Analysis of the Understanding America Study. Am. J. Prev. Med. 2022, 62, 679–687. [Google Scholar] [CrossRef] [PubMed]
  13. Chen, S.; Aruldass, A.R.; Cardinal, R.N. Mental health outcomes after SARS-CoV-2 vaccination in the United States: A national cross-sectional study. J. Affect. Disord. 2022, 298, 396–399. [Google Scholar] [CrossRef] [PubMed]
  14. Ceban, F.; Kulzhabayeva, D.; Rodrigues, N.B.; Di Vincenzo, J.D.; Gill, H.; Subramaniapillai, M.; Lui, L.M.; Cao, B.; Mansur, R.B.; Ho, R.C.; et al. COVID-19 vaccination for the prevention and treatment of long COVID: A systematic review and meta-analysis. Brain Behav. Immun. 2023, 111, 211–229. [Google Scholar] [CrossRef] [PubMed]
  15. Renaud-Charest, O.; Lui, L.M.; Eskander, S.; Ceban, F.; Ho, R.; Di Vincenzo, J.D.; Rosenblat, J.D.; Lee, Y.; Subramaniapillai, M.; McIntyre, R.S. Onset and frequency of depression in post-COVID-19 syndrome: A systematic review. J. Psychiatr. Res. 2021, 144, 129–137. [Google Scholar] [CrossRef]
  16. Chou, W.S.; Budenz, A. Considering Emotion in COVID-19 Vaccine Communication: Addressing Vaccine Hesitancy and Fostering Vaccine Confidence. Health Commun. 2020, 35, 1718–1722. [Google Scholar] [CrossRef]
  17. Wang, S.; Quan, L.; Chavarro, J.E.; Slopen, N.; Kubzansky, L.D.; Koenen, K.C.; Kang, J.H.; Weisskopf, M.G.; Branch-Elliman, W.; Roberts, A.L. Associations of Depression, Anxiety, Worry, Perceived Stress, and Loneliness Prior to Infection With Risk of Post–COVID-19 Conditions. JAMA Psychiatry 2022, 79, 1081–1091. [Google Scholar] [CrossRef]
  18. Ford, B.N.; Savitz, J. Depression, aging, and immunity: Implications for COVID-19 vaccine immunogenicity. Immun. Ageing 2022, 19, 32. [Google Scholar] [CrossRef]
  19. Mollalo, A.; Vahedi, B.; Rivera, K.M. GIS-based spatial modeling of COVID-19 incidence rate in the continental United States. Sci. Total Environ. 2020, 728, 138884. [Google Scholar] [CrossRef]
  20. Mollalo, A.; Tatar, M. Spatial Modeling of COVID-19 Vaccine Hesitancy in the United States. Int. J. Env. Res Public Health 2021, 18, 9488. [Google Scholar] [CrossRef]
  21. Iyanda, A.E.; Adeleke, R.; Lu, Y.; Osayomi, T.; Adaralegbe, A.; Lasode, M.; Chima-Adaralegbe, N.J.; Osundina, A.M. A retrospective cross-national examination of COVID-19 outbreak in 175 countries: A multiscale geographically weighted regression analysis (11 January–28 June 2020). J. Infect. Public Health 2020, 13, 1438–1445. [Google Scholar] [CrossRef]
  22. Dong, E.; Du, H.; Gardner, L. An interactive web-based dashboard to track COVID-19 in real time. Lancet Infect. Dis. 2020, 20, 533–534. [Google Scholar] [CrossRef] [PubMed]
  23. Ali, K.; Partridge, M.D.; Olfert, M.R. Can geographically weighted regressions improve regional analysis and policy making? Int. Reg. Sci. Rev. 2007, 30, 300–329. [Google Scholar] [CrossRef]
  24. Brunsdon, C.; Fotheringham, S.; Charlton, M. Geographically Weighted Regression. J. R. Stat. Soc. Ser. D 1998, 47, 431–443. [Google Scholar] [CrossRef]
  25. Waller, L.A.; Zhu, L.; Gotway, C.A.; Gorman, D.M.; Gruenewald, P.J. Quantifying geographic variations in associations between alcohol distribution and violence: A comparison of geographically weighted regression and spatially varying coefficient models. Stoch. Env. Res. Risk Assess. 2007, 21, 573–588. [Google Scholar] [CrossRef]
  26. Foody, G.M. Spatial nonstationarity and scale-dependency in the relationship between species richness and environmental determinants for the sub-Saharan endemic avifauna. Glob. Ecol. Biogeogr. 2004, 13, 315–320. [Google Scholar] [CrossRef]
  27. Fotheringham, A.S.; Brunsdon, C.; Charlton, M. Geographically Weighted Regression: The Analysis of Spatially Varying Relationships; John Wiley & Sons: Hoboken, NJ, USA, 2003. [Google Scholar]
  28. Fotheringham, S.; Charlton, M.; Brunsdon, C. Spatial variations in school performance: A local analysis using geographically weighted regression. Geogr. Environ. Model. 2001, 5, 43–66. [Google Scholar] [CrossRef]
  29. Wheeler, D.; Tiefelsdorf, M. Multicollinearity and correlation among local regression coefficients in geographically weighted regression. J. Geogr. Syst. 2005, 7, 161–187. [Google Scholar] [CrossRef]
  30. Fotheringham, A.S.; Yang, W.; Kang, W. Multiscale geographically weighted regression (MGWR). Ann. Am. Assoc. Geogr. 2017, 107, 1247–1265. [Google Scholar] [CrossRef]
  31. Oshan, T.M.; Li, Z.; Kang, W.; Wolf, L.J.; Fotheringham, A.S. mgwr: A Python implementation of multiscale geographically weighted regression for investigating process spatial heterogeneity and scale. ISPRS Int. J. Geo-Inf. 2019, 8, 269. [Google Scholar] [CrossRef]
  32. Kim, S.Y.; Bang, M.; Wee, J.H.; Min, C.; Yoo, D.M.; Han, S.-M.; Kim, S.; Choi, H.G. Short-and long-term exposure to air pollution and lack of sunlight are associated with an increased risk of depression: A nested case-control study using meteorological data and national sample cohort data. Sci. Total Environ. 2021, 757, 143960. [Google Scholar] [CrossRef]
  33. Wang, J.; Wei, Z.; Yao, N.; Li, C.; Sun, L. Association Between Sunlight Exposure and Mental Health: Evidence from a Special Population Without Sunlight in Work. Risk Manag. Healthc. Policy 2023, 16, 1049–1057. [Google Scholar] [CrossRef]
  34. Sun, Y.; Wu, Y.; Fan, S.; Santo, T.D.; Li, L.; Jiang, X.; Li, K.; Wang, Y.; Tasleem, A.; Krishnan, A.; et al. Comparison of mental health symptoms before and during the COVID-19 pandemic: Evidence from a systematic review and meta-analysis of 134 cohorts. BMJ 2023, 380, e074224. [Google Scholar] [CrossRef] [PubMed]
  35. Cummings, J.R.; Wen, H.; Ko, M.; Druss, B.G. Race/ethnicity and geographic access to Medicaid substance use disorder treatment facilities in the United States. JAMA Psychiatry 2014, 71, 190–196. [Google Scholar] [CrossRef]
  36. Choi, E.P.H.; Hui, B.P.H.; Wan, E.Y.F. Depression and Anxiety in Hong Kong during COVID-19. Int. J. Environ. Res. Public Health 2020, 17, 3740. [Google Scholar] [CrossRef] [PubMed]
  37. Ettman, C.K.; Abdalla, S.M.; Cohen, G.H.; Sampson, L.; Vivier, P.M.; Galea, S. Prevalence of Depression Symptoms in US Adults Before and During the COVID-19 Pandemic. JAMA Netw. Open 2020, 3, e2019686. [Google Scholar] [CrossRef] [PubMed]
  38. Hyland, P.; Shevlin, M.; McBride, O.; Murphy, J.; Karatzias, T.; Bentall, R.P.; Martinez, A.; Vallières, F. Anxiety and depression in the Republic of Ireland during the COVID-19 pandemic. Acta Psychiatr. Scand. 2020, 142, 249–256. [Google Scholar] [CrossRef]
  39. Tsampasian, V.; Elghazaly, H.; Chattopadhyay, R.; Debski, M.; Naing, T.K.P.; Garg, P.; Clark, A.; Ntatsaki, E.; Vassiliou, V.S. Risk Factors Associated With Post-COVID-19 Condition: A Systematic Review and Meta-analysis. JAMA Intern. Med. 2023, 183, 566–580. [Google Scholar] [CrossRef]
  40. Davis, H.E.; McCorkell, L.; Vogel, J.M.; Topol, E.J. Long COVID: Major findings, mechanisms and recommendations. Nat. Rev. Microbiol. 2023, 21, 133–146. [Google Scholar] [CrossRef]
  41. Sun, Y.; Kong, Z.; Song, Y.; Liu, J.; Wang, X. The validity and reliability of the PHQ-9 on screening of depression in neurology: A cross sectional study. BMC Psychiatry 2022, 22, 98. [Google Scholar] [CrossRef]
  42. Vallée, A. Heterogeneity of the COVID-19 Pandemic in the United States of America: A Geo-Epidemiological Perspective. Front. Public Health 2022, 10, 818989. [Google Scholar] [CrossRef]
  43. Igoe, M.; Das, P.; Lenhart, S.; Lloyd, A.L.; Luong, L.; Tian, D.; Lanzas, C.; Odoi, A. Geographic disparities and predictors of COVID-19 hospitalization risks in the St. Louis Area, Missouri (USA). BMC Public Health 2022, 22, 321. [Google Scholar] [CrossRef]
  44. Hsiang, S.; Allen, D.; Annan-Phan, S.; Bell, K.; Bolliger, I.; Chong, T.; Druckenmiller, H.; Huang, L.Y.; Hultgren, A.; Krasovich, E.; et al. The effect of large-scale anti-contagion policies on the COVID-19 pandemic. Nature 2020, 584, 262–267. [Google Scholar] [CrossRef]
  45. Health Workforce Shortage Areas. Available online: https://data.hrsa.gov/topics/health-workforce/shortage-areas (accessed on 1 August 2023).
  46. Grossman, E.R.; Benjamin-Neelon, S.E.; Sonnenschein, S. Alcohol consumption during the COVID-19 pandemic: A cross-sectional survey of US adults. Int. J. Environ. Res. Public Health 2020, 17, 9189. [Google Scholar] [CrossRef]
  47. Barbosa, C.; Cowell, A.J.; Dowd, W.N. Alcohol consumption in response to the COVID-19 pandemic in the United States. J. Addict. Med. 2021, 15, 341–344. [Google Scholar] [CrossRef]
  48. Snell-Rood, C.; Hauenstein, E.; Leukefeld, C.; Feltner, F.; Marcum, A.; Schoenberg, N. Mental health treatment seeking patterns and preferences of Appalachian women with depression. Am. J. Orthopsychiatry 2017, 87, 233. [Google Scholar] [CrossRef]
  49. Dotson, T.; Derringer, J.; Rose, L.H.; Vanderford, N.L.; Hinkle, A.; Cormier, L.E. An investigation into the prevalence and perceptions of mental health disorders in Appalachian West Virginia. Discov. Ment. Health 2025, 5, 80. [Google Scholar] [CrossRef] [PubMed]
  50. Shadrina, M.; Bondarenko, E.A.; Slominsky, P.A. Genetics factors in major depression disease. Front. Psychiatry 2018, 9, 334. [Google Scholar] [CrossRef] [PubMed]
  51. Gonçalves, L.C.; Endrass, J.; Rossegger, A.; Dirkzwager, A.J. A longitudinal study of mental health symptoms in young prisoners: Exploring the influence of personal factors and the correctional climate. BMC Psychiatry 2016, 16, 91. [Google Scholar] [CrossRef] [PubMed]
  52. Velten, J.; Lavallee, K.L.; Scholten, S.; Meyer, A.H.; Zhang, X.C.; Schneider, S.; Margraf, J. Lifestyle choices and mental health: A representative population survey. BMC psychology 2014, 2, 58. [Google Scholar] [CrossRef]
  53. Bourmistrova, N.W.; Solomon, T.; Braude, P.; Strawbridge, R.; Carter, B. Long-term effects of COVID-19 on mental health: A systematic review. J. Affect. Disord. 2022, 299, 118–125. [Google Scholar] [CrossRef]
  54. Bains, N.; Abdijadid, S. Major depressive disorder. In StatPearls; StatPearls Publishing: Treasure Island, FL, USA, 2020. [Google Scholar]
  55. Levis, B.; Benedetti, A.; Ioannidis, J.P.; Sun, Y.; Negeri, Z.; He, C.; Thombs, B.D. Patient Health Questionnaire-9 scores do not accurately estimate depression prevalence: Individual participant data meta-analysis. J. Clin. Epidemiol. 2020, 122, 115–128. [Google Scholar] [CrossRef]
  56. Sundaram-Stukel, R.; Davidson, R.J. Associational and plausible causal effects of COVID-19 public health policies on economic and mental distress. arXiv 2021, arXiv:2112.11564. [Google Scholar] [CrossRef]
  57. American Psychiatric Association. Diagnostic and Statistical Manual of Mental Disorderss, 5th ed.; Text Rev.; American Psychiatric Association: Washington, DC, USA, 2022. [Google Scholar]
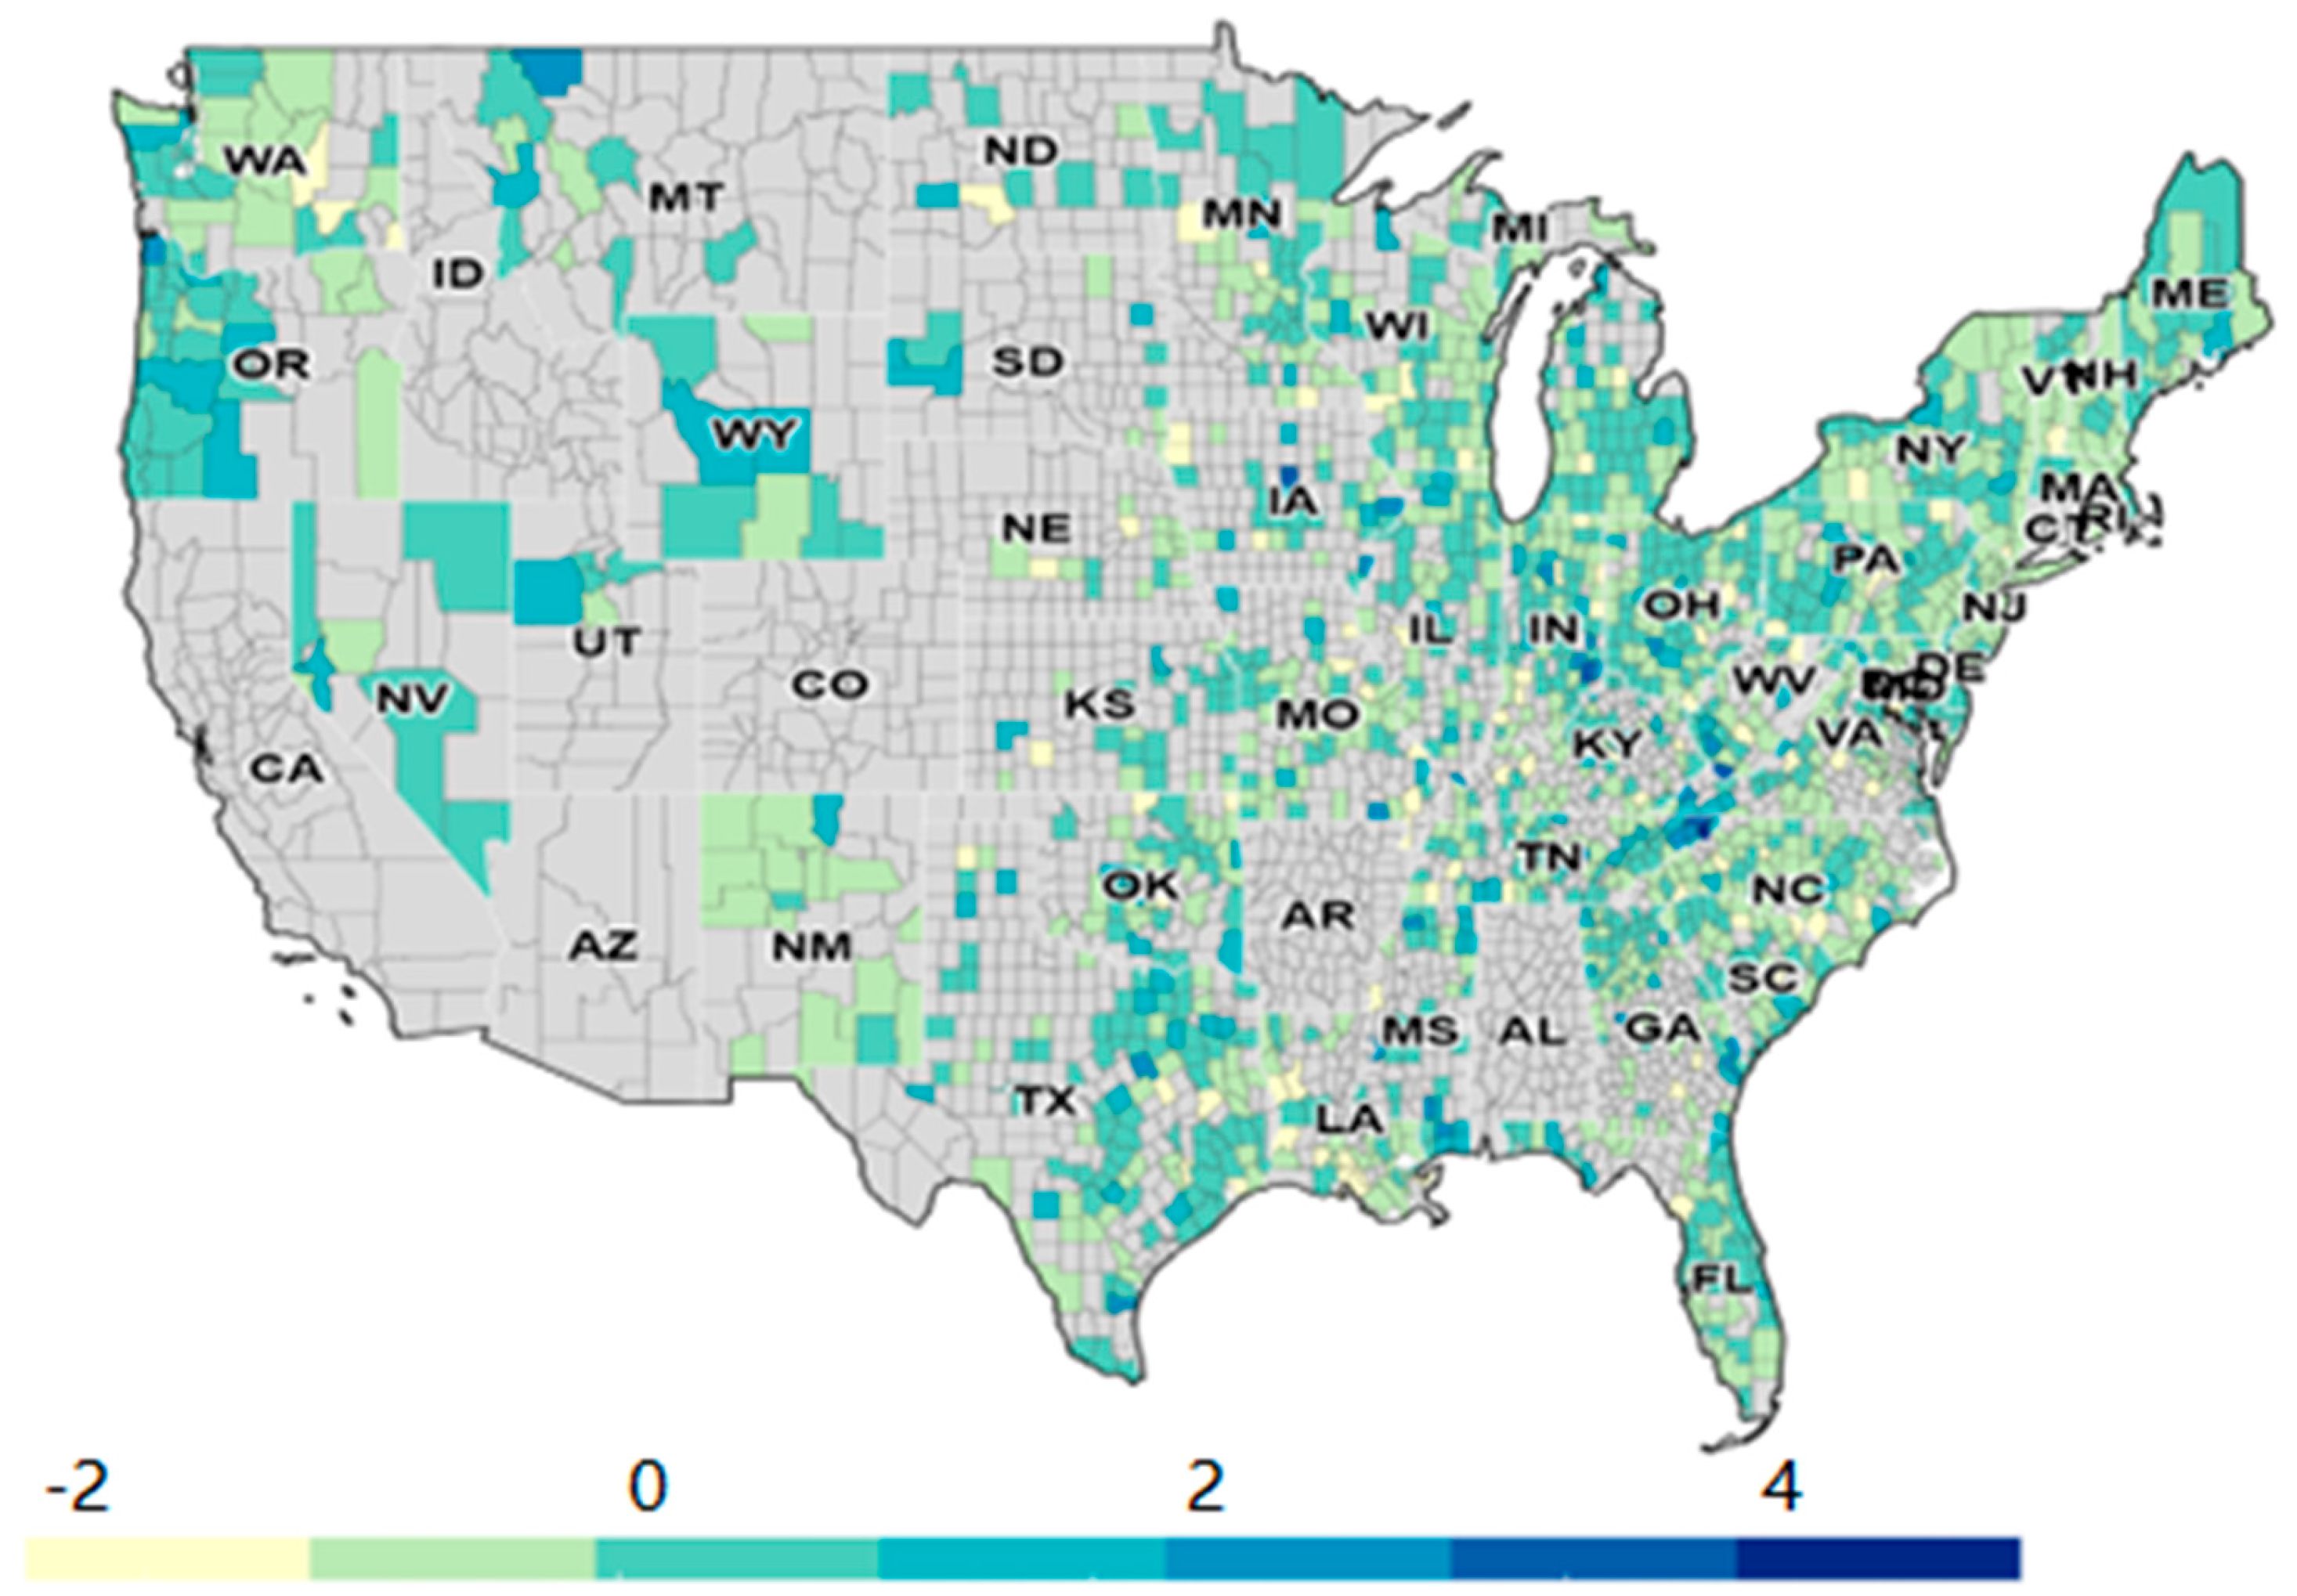
Figure 1. Spatial distribution of OLS residuals.
Ijgi 14 00376 g001
Figure 2. Spatial distribution of Local R2.
Ijgi 14 00376 g002
Figure 3. Spatial distribution of the coefficient of COVID-19 case rates.
Ijgi 14 00376 g003
Figure 4. Spatial distribution of the coefficient of vaccination rate.
Ijgi 14 00376 g004
Figure 5. Spatial distribution of the coefficients of the percentage population of excessive drinking.
Ijgi 14 00376 g005
Figure 6. Spatial distribution of the coefficients of the unemployment rate.
Ijgi 14 00376 g006
Figure 7. Mental health provider rate by county in the US (2021).
Ijgi 14 00376 g007
Figure 8. Percentage change in employment by state from Feb 2020 to Sep 2021.
Ijgi 14 00376 g008
Table 1. Detailed Information on Variables.
Variable NameDetailTimestampsSpatial ResolutionSource
severe_depression_per_100K *Incidence of severe depression disorder per 100k population2022CountyMental Health America (MHA)
2dose_Vac_Complete_5PlusPop_Pct (%) **Change in the percentage of population over age 5 that received two doses of COVID-19 vaccine from last year2021, 2022CountyCenters for Disease Control and Prevention (CDC)
covid_case_per100k **Number of COVID-19 cases per 100k population2021,2022CountyJohns Hopkins University
Age_524_pct (%)Percentage of population age between 5 and 242021CountyUS Census
Avg Daily Sunlight (KJ/m2)Average daily sunlight power-CountyNorth America Land Data Assimilation System (NLDAS)
Mental Health Provider Rate_logMental health providers per 100k population (logged)2021CountyCenters for Medicare and Medicaid Services (CMS)
pctExcessiveDrinking_logPercentage of adults reporting binge or heavy drinking (age-adjusted, logged)2019CountyBehavioral Risk Factor Surveillance System
Unemployment_rate (%)The number of unemployed divided by the labor force2021CountyU.S. Bureau of Labor Statistics
Note: * denotes dependent variable, ** denotes main independent variables, others are control variables.
Table 2. Descriptive Statistics of Variables.
Variable NameTimeMeanMinMedianMaxStd.
severe_depression_per_100K202240.9712.3839.71118.5412.08
2dose_Vac_Complete_5PlusPop_Pct202153.5314.1053.3094.2012.46
20226.04−39.005.0032.504.45
covid_case_per100k202111,051.542833.3311,131.0921,032.362165.84
202212,669.731749.7812,309.2630,513.093290.59
Age_524_pct20210.250.080.250.450.04
Avg Daily Sunlight-16,317.2212,306.6315,798.3121,701.971904.41
Mental Health Provider Rate2021196.024.00155.502408.00166.67
pctExcessiveDrinking201919.267.0019.0030.003.16
Unemployment_rate20214.771.804.5016.201.49
Table 3. Regression Results from OLS and MGWR models.
Variable NameModel 1Model 2Model 3
Coef.Coef.Med. Coef.Min.
Coef.
Max.
Coef.
Bandwidth
2dose_Vac_Complete_5PlusPop_Pct−0.0684 **−0.0246−0.032−0.0470.0021444
covid_case_per100k0.0887 ***0.01740.088−0.1410.501191
Age_524_pct0.1228 ***0.1192 ***0.1770.1650.1811481
Avg Daily Sunlight−0.1298 ***−0.1287 ***−0.192−0.202−0.1911481
Mental Health Provider Rate_log−0.0806 ***−0.1189 ***−0.038−0.2940.326216
pctExcessiveDrinking_log−0.2008 ***−0.2323 ***−0.075−0.5450.126229
Unemployment_rate−0.1430 ***−0.1517 ***−0.097−0.2800.049720
Diagnostic Results
Adjusted R-squared0.1170.1050.306
AICc403140503835.58
Note: Model 1 = OLS model used COVID-19 case rates and vaccination data in 2021. Model 2 = OLS model uses COVID-19 cases and vaccination data in 2022. Model 3 = MGWR model uses COVID-19 case rates and vaccination data in 2021. AICc = Corrected Akaike Information Criterion, Med. Coef. = Median Coefficient (for MGWR results). ** denotes significance at the 5% level. *** denotes significance at the 1% level. The significance level for MGWR results varies by data points. Bandwidths are measured in number of neighbors.
Table 4. Spatial Autocorrelation Statistics results for the OLS model.
Value
Moran’s Index0.075
Z-score10.664
p-value0.000
Disclaimer/Publisher’s Note: The statements, opinions and data contained in all publications are solely those of the individual author(s) and contributor(s) and not of MDPI and/or the editor(s). MDPI and/or the editor(s) disclaim responsibility for any injury to people or property resulting from any ideas, methods, instructions or products referred to in the content.