Article

Third Spaces to Represent Urban Greenery: A Study of Informal Green Spaces in a High-Density City Using Deep Learning and Geo-Weighted Analysis

1
School of Design, South China University of Technology, Guangzhou 510006, China
2
Faculty of Forestry, University of British Columbia, Vancouver, BC V6T 1Z4, Canada
*
Author to whom correspondence should be addressed.
ISPRS Int. J. Geo-Inf. 2025, 14(10), 368; https://doi.org/10.3390/ijgi14100368
Submission received: 2 August 2025 / Revised: 15 September 2025 / Accepted: 18 September 2025 / Published: 23 September 2025
(This article belongs to the Special Issue Spatial Information for Improved Living Spaces)

Abstract

In high-density cities like Hong Kong, green spaces are often characterized by fragmentation and uneven spatial distribution, which negatively impacts their accessibility and equity. To address this issue, studies have proposed the use of informal green spaces (IGSs) as a supplementary component to formal urban green spaces (UGSs). However, the spatial delineation and quantitative analysis of IGSs remain challenging due to the lack of standardized identification and evaluation methods. Building upon the work of urban theorists Henry Lefebvre and Edward Soja, this study explores informal green spaces as third spaces. This study employed remote sensing and GIS technologies to systematically assess the spatial distribution and benefits of IGSs, categorizing them into four types: Urban Interstitial IGSs, Transitional IGSs, Fringe IGSs, and Riparian IGSs. Subsequently, an evaluation framework was constructed across ecological, social, and economic dimensions to quantify the overall value of IGSs. The results reveal that IGS significantly contributes to ecological regulation, social interaction, and economic potential, particularly in urban areas with limited green resources. This demonstrates that IGSs can serve as a vital complement to formal urban green spaces, playing a key role in alleviating green space inequity, enhancing urban livability, and promoting sustainability. Furthermore, this study provides a scientific foundation for precise identification, benefit assessment, and optimized management of IGSs, supporting effective integration and rational utilization in future urban planning.

1. Introduction

The third space concept is derived from Lefebvre’s argument that the power inherent in everyday discourse comprises not only ‘the space of common sense, of knowledge, of social practice, of political power’, but also the space of the ‘commonplaces’ [1]. The third space concept has been proposed as a means of challenging the prevailing, binary conception of space [2]. The third space is one which is challenging to classify using binary terminology. A significant proportion of urban green spaces are designated as third spaces due to the ambiguity of their perceived location. It is therefore evident that, in this article, the term ‘third space’ is employed to denote marginal green space that has not been clearly defined for use in urban planning and design processes [3]. In the context of rapid urban population growth, the importance of green infrastructure (GI) has become increasingly prominent [4,5]. The benefits of GI can be divided into three categories: environmental ecological benefits [6,7,8,9], social benefits [10,11], and economic benefits [12].
Increasing urbanization means highly fragmented GI [13]. IGS scan be considered as a parts of and complementary to GI [14]. Compared with GI, IGSs have the characteristics of a small scale, irregular shapes, and variety [15]. Based on the above characteristics, IGSs can meet the diversified needs of residents [16], enhance the connectivity and accessibility of urban ecological network [17], and promote green space equity and social justice [18] in high-density urban architecture environments with low maintenance cost [6].
However, an IGS is a “space ignored by institutions,” characterized by governance gaps, institutional exclusion, and ambiguous boundaries. IGSs are not formally included in urban spatial planning documents. Their emergence does not appear to be a result of any deliberate governance intentions on the part of the relevant authorities. The formation of IGSs is driven by complex causes, many of which are political and economic. Typically, they arise due to the lack of government attention [19], changes in land use, economic downturns, and reduced real estate investments [20,21]. In addition, institutional exclusion is also a contributing factor. The subdivided land planning system imposes specific requirements for land parcel size and dimensions, while most IGSs are irregularly shaped and unsuitable for traditional development, which is why they are not included in the planning [22]. IGSs are located on the edges or between formal spaces, often defined by the adjacent formal spaces, resulting in blurred boundaries, such as the marginal spaces left near main roads, highways, and other infrastructure [23].
This study selects Hong Kong as the research area due to its highly concentrated urban characteristics, including extremely high population density, soaring housing prices, and growing socioeconomic inequalities. Against this backdrop, the provision of planned green spaces has become increasingly unbalanced and inequitable. As a city of immigrants, Hong Kong is home to a diverse population of newcomers, including new settlers from mainland China and approximately 360,000 foreign domestic helpers from Southeast Asian countries such as the Philippines and Indonesia. These immigrant groups, often low earners in terms of income, face cramped living conditions and a lack of planned green spaces in their neighborhoods. They also struggle to afford access to indoor fitness and recreational facilities. As a result, IGSs such as street corners, small community parks, and rooftop gardens have become vital venues for alleviating life pressures and fostering social interactions, contributing to their social integration and well-being [24]. However, formally planned green spaces are disproportionately distributed in affluent communities. Many low-income residents living in high-density urban core areas have limited access to green spaces within a 10 min walking distance, while those in high-income, low-density suburban areas enjoy the highest green space coverage [25]. This spatial disparity highlights the need for more equitable urban planning strategies to address the green space needs of all socioeconomic groups.
In summary, the distribution of IGSs is accurately identified by deep learning, a subset of machine learning that uses multi-layer neural networks to automatically extract hierarchical features from large datasets. In the context of remote sensing, deep learning methods—particularly convolutional neural networks such as U-Net—enable high-precision land cover classification and effectively address challenges like vegetation occlusion and complex urban morphology [26,27]. Combined with multispectral satellite imagery, deep learning allows for fine-grained identification of informal green spaces at multiple spatial scales, as well as analysis of the potential benefits of IGSs through the utilization of spatial analysis and spatial difference-in-differences analysis. The methods employed in this research are innovative and varied according to the characteristics of different benefits of IGSs.
This objective of this research was to answer the following questions:
(1)
How does one identify and classify Hong Kong’s IGSs?
(2)
What are the ecological, social, and economic benefits of different categories of Hong Kong’s IGSs?
(3)
How do IGSs influence the spatial equity of green space provision in Hong Kong?
Another aim of this study was to enhance our understanding of the system of IGSs in Hong Kong. Moreover, based on the specific characteristics of different categories of IGSs, they can be effectively transformed to enhance the continuity of IGSs in densely populated areas of Hong Kong. Ultimately, replicating this study in high-density cities worldwide would improve our comprehension of the global distribution of IGSs and provide valuable insights for planning policies.
This study incorporates green spaces that may impose restrictions on public access during the evaluation of the socioeconomic benefits of informal IGS, although this may result in an overestimation of their direct recreational value. The central tenet of this study is to ascertain the comprehensive contribution of IGSs to urban areas. In future, more sophisticated methodologies can be employed to analyze the specific impact of “accessibility.”

2. Literature Review

The definitions of IGSs in existing studies are inconsistent and imprecise. At the city scale, landscapes outside official urban green spaces or those supplementing formal urban green spaces are categorized as IGSs [28,29]. At the community scale, abandoned land or unutilized green spaces near residents often temporarily repurposed as community gardens are considered IGSs [15,30]. Some scholars also consider green spaces with unclear management ownership as IGSs [31,32,33,34,35]. Most scholars identify less human-intervened green spaces as IGSs [20,36,37,38,39,40].
The identification methods for IGSs can be classified as follows. At the national scale, semantic segmentation of high-resolution satellite imagery enables automated large-scale detection of IGSs and Unverified Vegetated Land (vegetated areas that are initially identified through remote sensing but lack official verification), achieving cost-effective and systematic identification [38,41]. However, vegetation or building obstructions in certain regions may compromise recognition accuracy due to limitations in analyzing complex visual patterns. At the city scale, the primary approaches for IGS identification are social media analytics and government data. Social media platforms [28,42,43] are primarily used to identify single categories of IGSs, such as wild spaces, brownfields, and unattended areas. Integration of urban use data and OpenStreetMap land use data can help further identify urban green spaces and deduce unattended sites [43]. However, these datasets primarily reflect human activities and may not comprehensively depict the distribution characteristics of IGSs, thus serving more as a supplement to government-released vector GIS data. Government vector data, though cost-efficient and standardized, faces temporal resolution constraints due to periodic updates [44], limiting their capacity to capture unregistered or emerging IGS categories.
Previous research has tended to adopt multi-source data fusion approaches. For example [43], employed such methods to identify urban vacant land, thereby addressing the inherent limitations of relying on a single data source or methodology. Moreover, the integration of spatial scale-specific advantages, temporal efficiency, and real-time monitoring capabilities is anticipated to collectively advance IGS identification toward greater precision, continuous temporal coverage, and more adaptive analytical frameworks.
In addition, these overlooked IGS harbor multiple positive values but have long been excluded from the formal framework of the GI system. From the perspective of spatial politics, the production and reproduction of urban space are deeply influenced by institutional power structures [1]. The distribution of infrastructure and resources often favors wealthy communities while excluding marginalized areas [45]. Spatial injustice is the product of existing systems and norms within specific geographic regions at different scales [46], reflecting inequalities within and between places. In this context, the development of urban green public spaces may overlook the important needs of marginalized groups and may even exacerbate spatial injustice. Therefore, the planning and construction of urban green spaces urgently need to incorporate considerations of spatial justice. It is in this context that the emergence of IGSs challenges the urban green space planning logic driven by centralized governance, offering a new practical approach for achieving potentially more inclusive and equitable green space governance.
As “urban green commons,” IGSs contribute to the reuse and redefinition of neglected spaces in urban grassroots communities. Compared to institutionalized parks, IGSs rely more on resident self-governance and the accumulation of local knowledge. IGSs’ openness, flexibility, and accessibility provide urban residents with pathways to connect with nature and promote social ties and collective identity, benefiting people’s physical and mental health and social cohesion [14]. Due to the “informality” of IGSs, they serve as an important vehicle for promoting urban social inclusivity and equity. Furthermore, from the perspective of ecological network theory, these IGSs form essential “patches” in urban ecosystems. These marginalized spaces play a hidden but crucial role in supporting biodiversity [39], mitigating the urban heat island effect [47], and enhancing ecosystem services [48], and they can supplement formal urban green spaces with minimal management costs [28,49].
Based on the above context, existing studies on the assessment of different categories of IGS benefits mainly focus on three aspects—ecological benefits, social benefits, and economic benefits—forming the core framework for evaluating the multi-dimensional value of IGSs.
The following section will provide a detailed overview of relevant studies on the value assessment of IGSs. Early studies predominantly evaluated the ecological benefits of IGSs, mainly focusing on quantifying the capacity for air purification, water purification, and biodiversity preservation. For example, studies quantified the forest structure of vacant residential land [16]. Other studies assessed the tree canopy coverage and stormwater retention potential of urban vacant land [50]. Some research evaluated the potential of urban rooftop spaces to mitigate urban heat island effects and air pollution [51]. Additionally, studies assessed the soil conservation, biodiversity, and air purification capacity of urban vacant land [52]. Current studies evaluating the benefits of IGSs predominantly adopt a singular research perspective, focusing primarily on their ecological benefits, while insufficient attention is given to their socioeconomic dimensions. Furthermore, most existing assessments evaluate the benefits of IGSs, lacking a comparative analysis of the ecological, social, and economic benefits across different categories of IGSs. This gap limits the understanding of how specific types of IGSs contribute uniquely to urban sustainability and human well-being, highlighting the need for more multi-dimensional evaluations in future research.

3. Study Area and Research Method

3.1. Study Area

The study area is in Hong Kong, located on the southern coast of China (Figure 1). Hong Kong has a total population of over 7.3 million, with an urban population density of 47,890 people per square kilometer in some street blocks [53]. Hong Kong, as one of the world’s most compact cities, is characterized by exceptionally high development and population density, reflected in its high plot ratio and highly fragmented UGSs [13]. In densely populated urban areas, the development of new UGSs is challenging. Against this backdrop, IGSs provide a feasible strategy for enhancing outdoor living environments and represent a promising alternative solution for the severe lack of UGSs in Hong Kong.

3.2. Research Method

This study adopts a combination of quantitative and qualitative research methods, providing a comprehensive framework for understanding IGSs in Hong Kong’s high-density urban environment.
This integration allows the study to more effectively address the complexity of urban IGS classification. The advantage of quantitative methods lies in their provision of clear and objective results, while qualitative methods supplement deeper interpretations of the data. In this study, through deep learning and K-means clustering, we achieved precise classification and quantitative indicators for IGSs, revealing the distribution of different types of green spaces. This enables a more comprehensive and accurate understanding of the status of relevant IGSs, providing a reproducible research framework for studies in related fields.
This paper employs deep learning based on Landsat multispectral data to identify land use in high-density urban areas. This approach effectively addresses the occlusion problem in remote sensing imagery within high-density cities and is characterized by real-time processing, high precision, and efficiency. The encoder–decoder structure of U-Net can automatically extract multi-level features from Landsat multispectral data without relying on manual feature engineering. Through data augmentation and backpropagation optimization, U-Net enables precise segmentation of complex boundary regions, such as farmland and buildings. Its skip connection structure preserves low-level detail information, effectively resolving classification blurring issues caused by resolution loss in traditional methods. This makes it suitable for fine segmentation in heterogeneous scenes, such as the urban–vegetation transition zones in Landsat imagery [27]. Given the dispersed distribution of IGS points in Hong Kong and the large dataset size, K-means clustering analysis is employed to further classify Hong Kong’s IGSs. The clustering algorithm utilizes the underlying structure of data distribution and defines rules for grouping data with similar characteristics [54]. This process does not require any prior knowledge of the dataset and can partition the given dataset based solely on clustering criteria. As a result, it better accommodates the complexity of IGS data, uncovers potential patterns within the data, and clusters them based on these features. This method is computationally efficient, highly interpretable, and highly scalable.
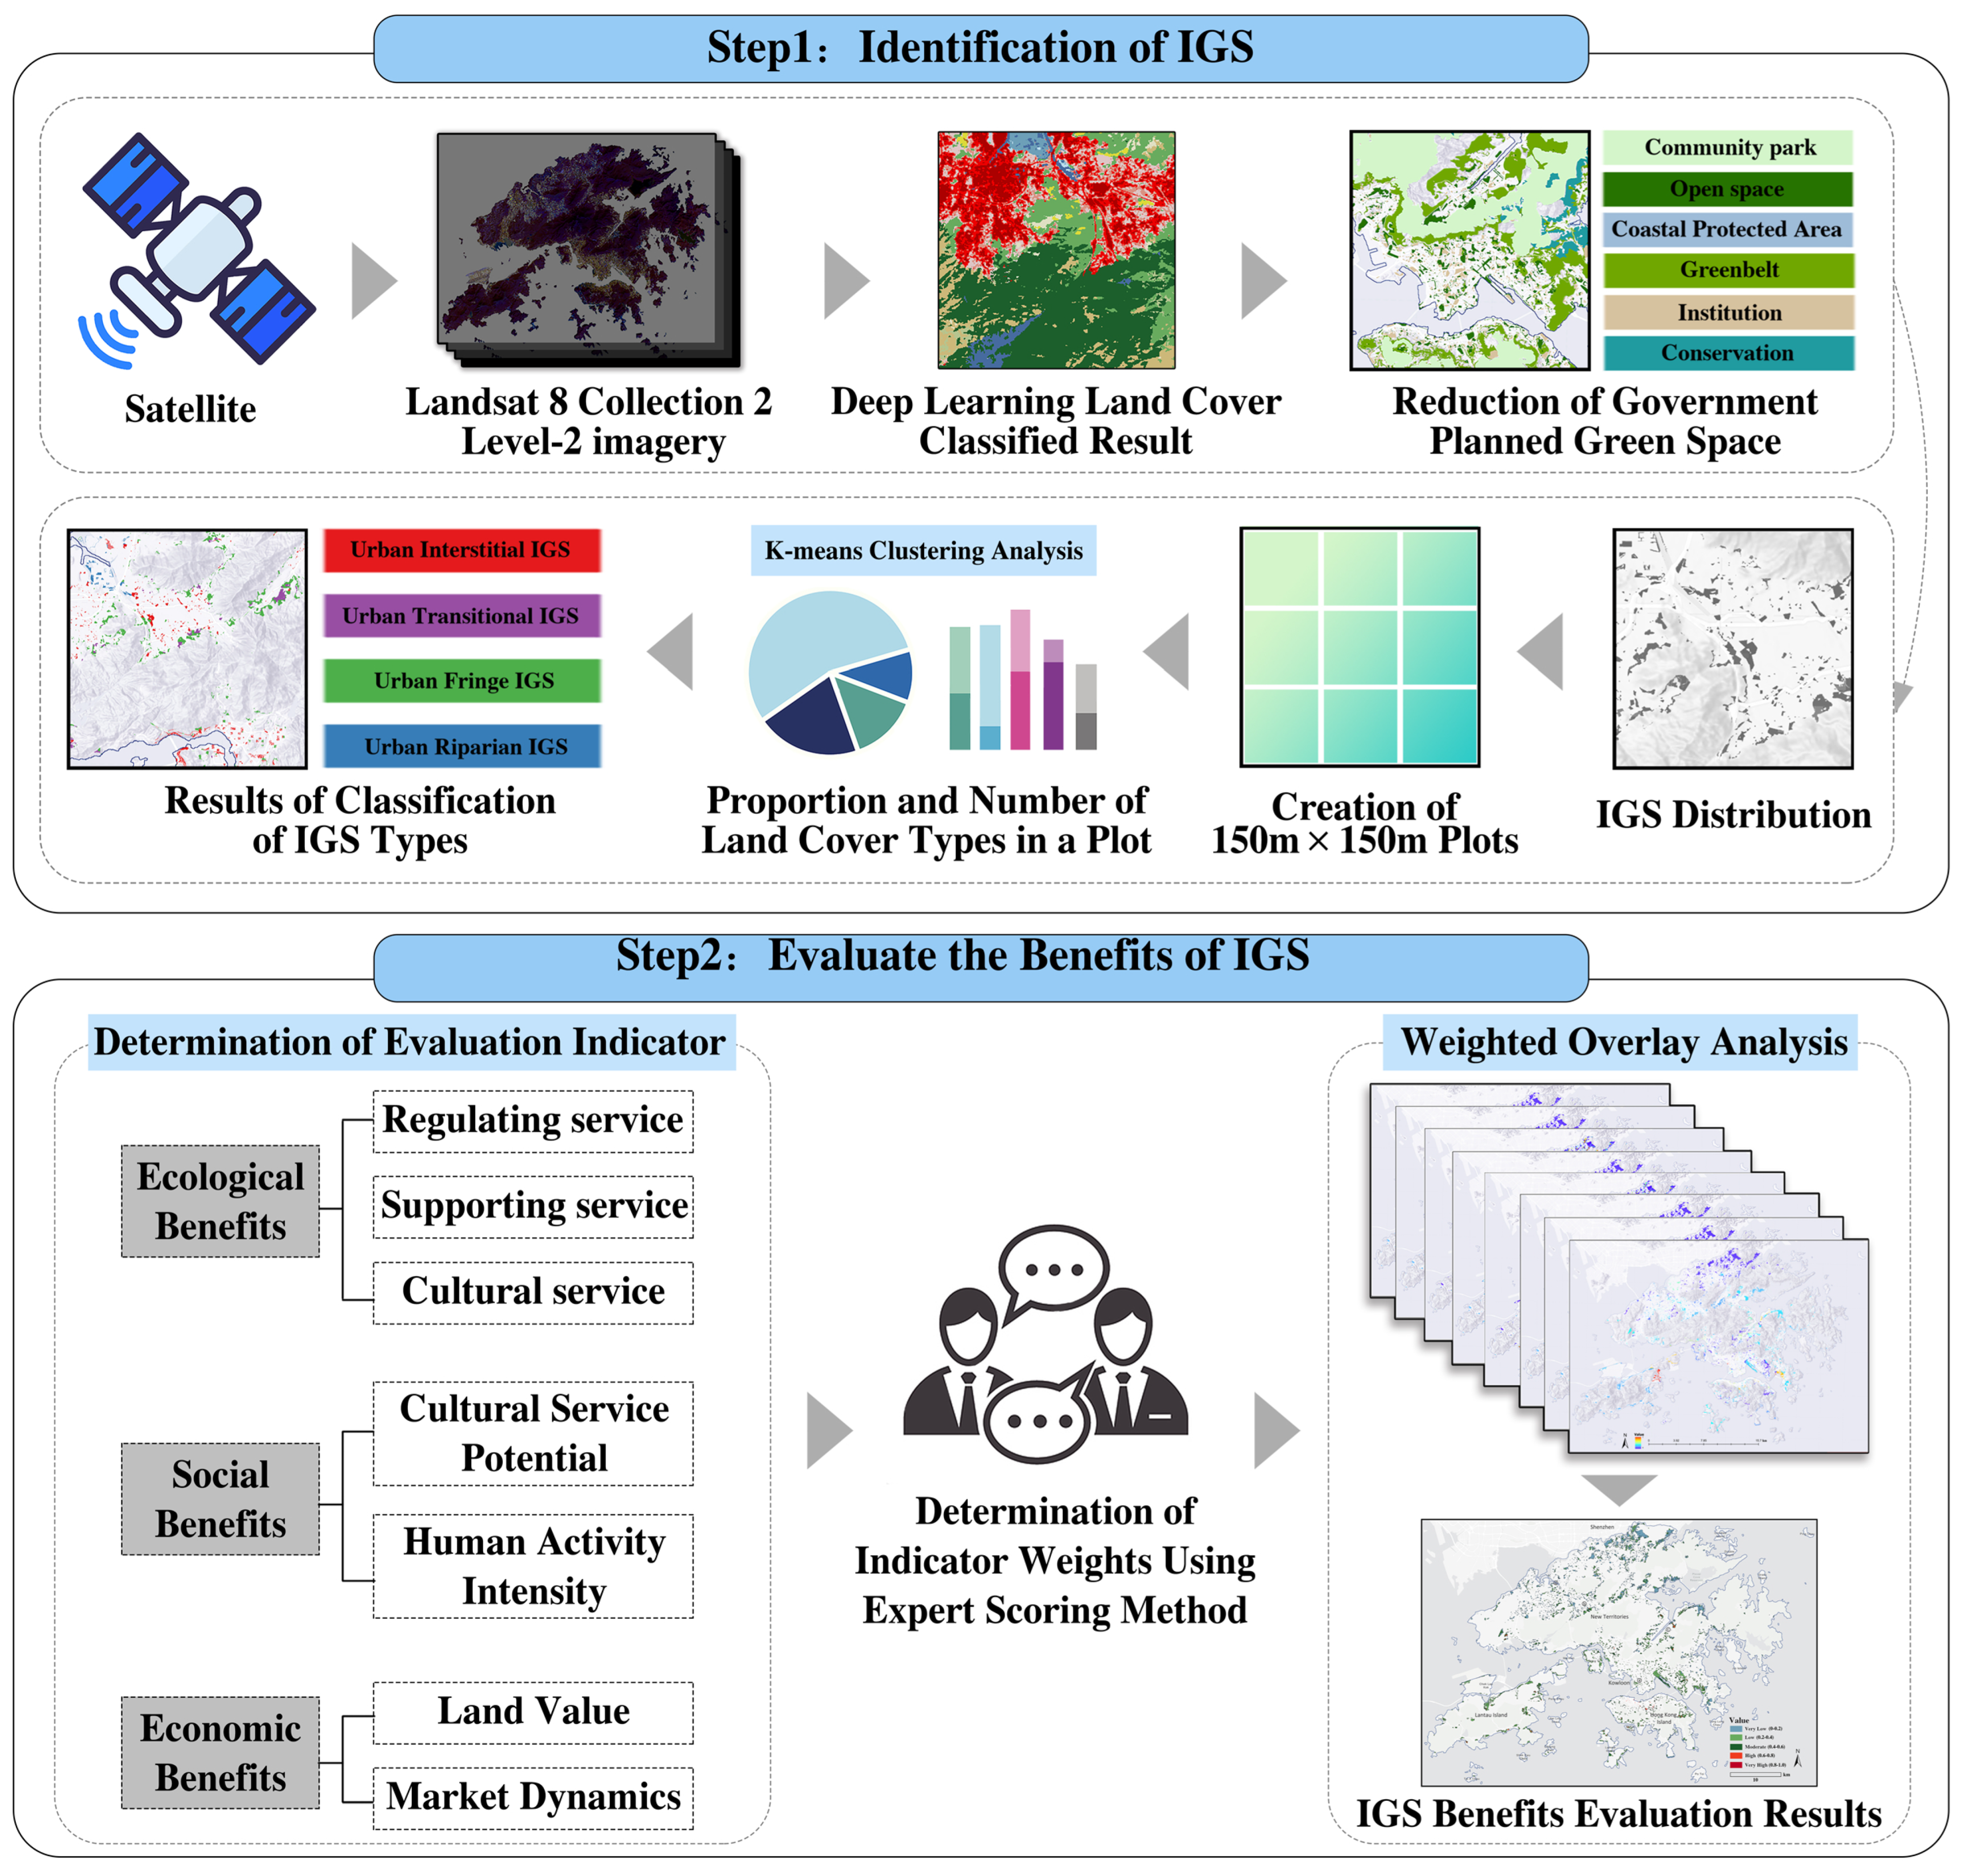
Figure 2 shows the workflow of this study. Step 1 involves classifying land cover types in Hong Kong using Landsat 8 satellite imagery and deep learning, followed by screening and extracting IGS through government planning data. The datasets used at each step are summarized in Table 1. We established a 150 m × 150 m grid system over the identified IGSs. Subsequently, K-means clustering was applied to analyze land use types and quantities within each grid cell and classifies the IGSs into four defined categories based on the clustering results. To determine the optimal number of clusters for the K-means clustering model, we calculated the sum of squared errors for K = 2–10 and observed the elbow curve. This curve exhibited a distinct inflection point at K = 4, beyond which the marginal reduction in the sum of squared errors became negligible; thus, we adopted four clusters. Following clustering, we aggregated the land cover composition of each cluster and assigned semantic labels based on the dominant IGS type within these clusters and performed satellite image verification, categorizing the IGSs as Urban Interstitial IGSs, Transitional IGSs, Fringe IGSs, and Riparian IGSs. Descriptive statistics for grid-level metrics (mean, median, standard deviation, minimum, maximum, sample size) are also reported to assess internal consistency and interpretability within clusters. Step 2 focuses on constructing an evaluation framework encompassing ecological, social, and economic benefits. We employ expert scoring methods to determine indicator weights and conduct weighted overlay analysis to calculate the comprehensive value of each IGS category. Finally, we utilize the natural breaks (Jenks) method (minimizes within-class variance and maximizes between-class variance) to categorize benefits into five levels (very low–very high) [55,56], thereby revealing the spatial distribution, ecological–social–economic value, and integrated benefits of different IGS types within Hong Kong’s high-density environment. Here, IGSs are defined as green-cover pixels identified by semantic segmentation that are not designated as UGS in the government planning layers listed in Table 1.

3.3. Step 1: Identification of IGSs

This study employs a semantic segmentation approach to identify the distribution of existing green spaces in Hong Kong using satellite imagery. The identified green spaces are compared with those included in government planning, and the green spaces not covered by government plans are selected as IGS. Based on this, cluster analysis is applied to categorize the types of IGSs.
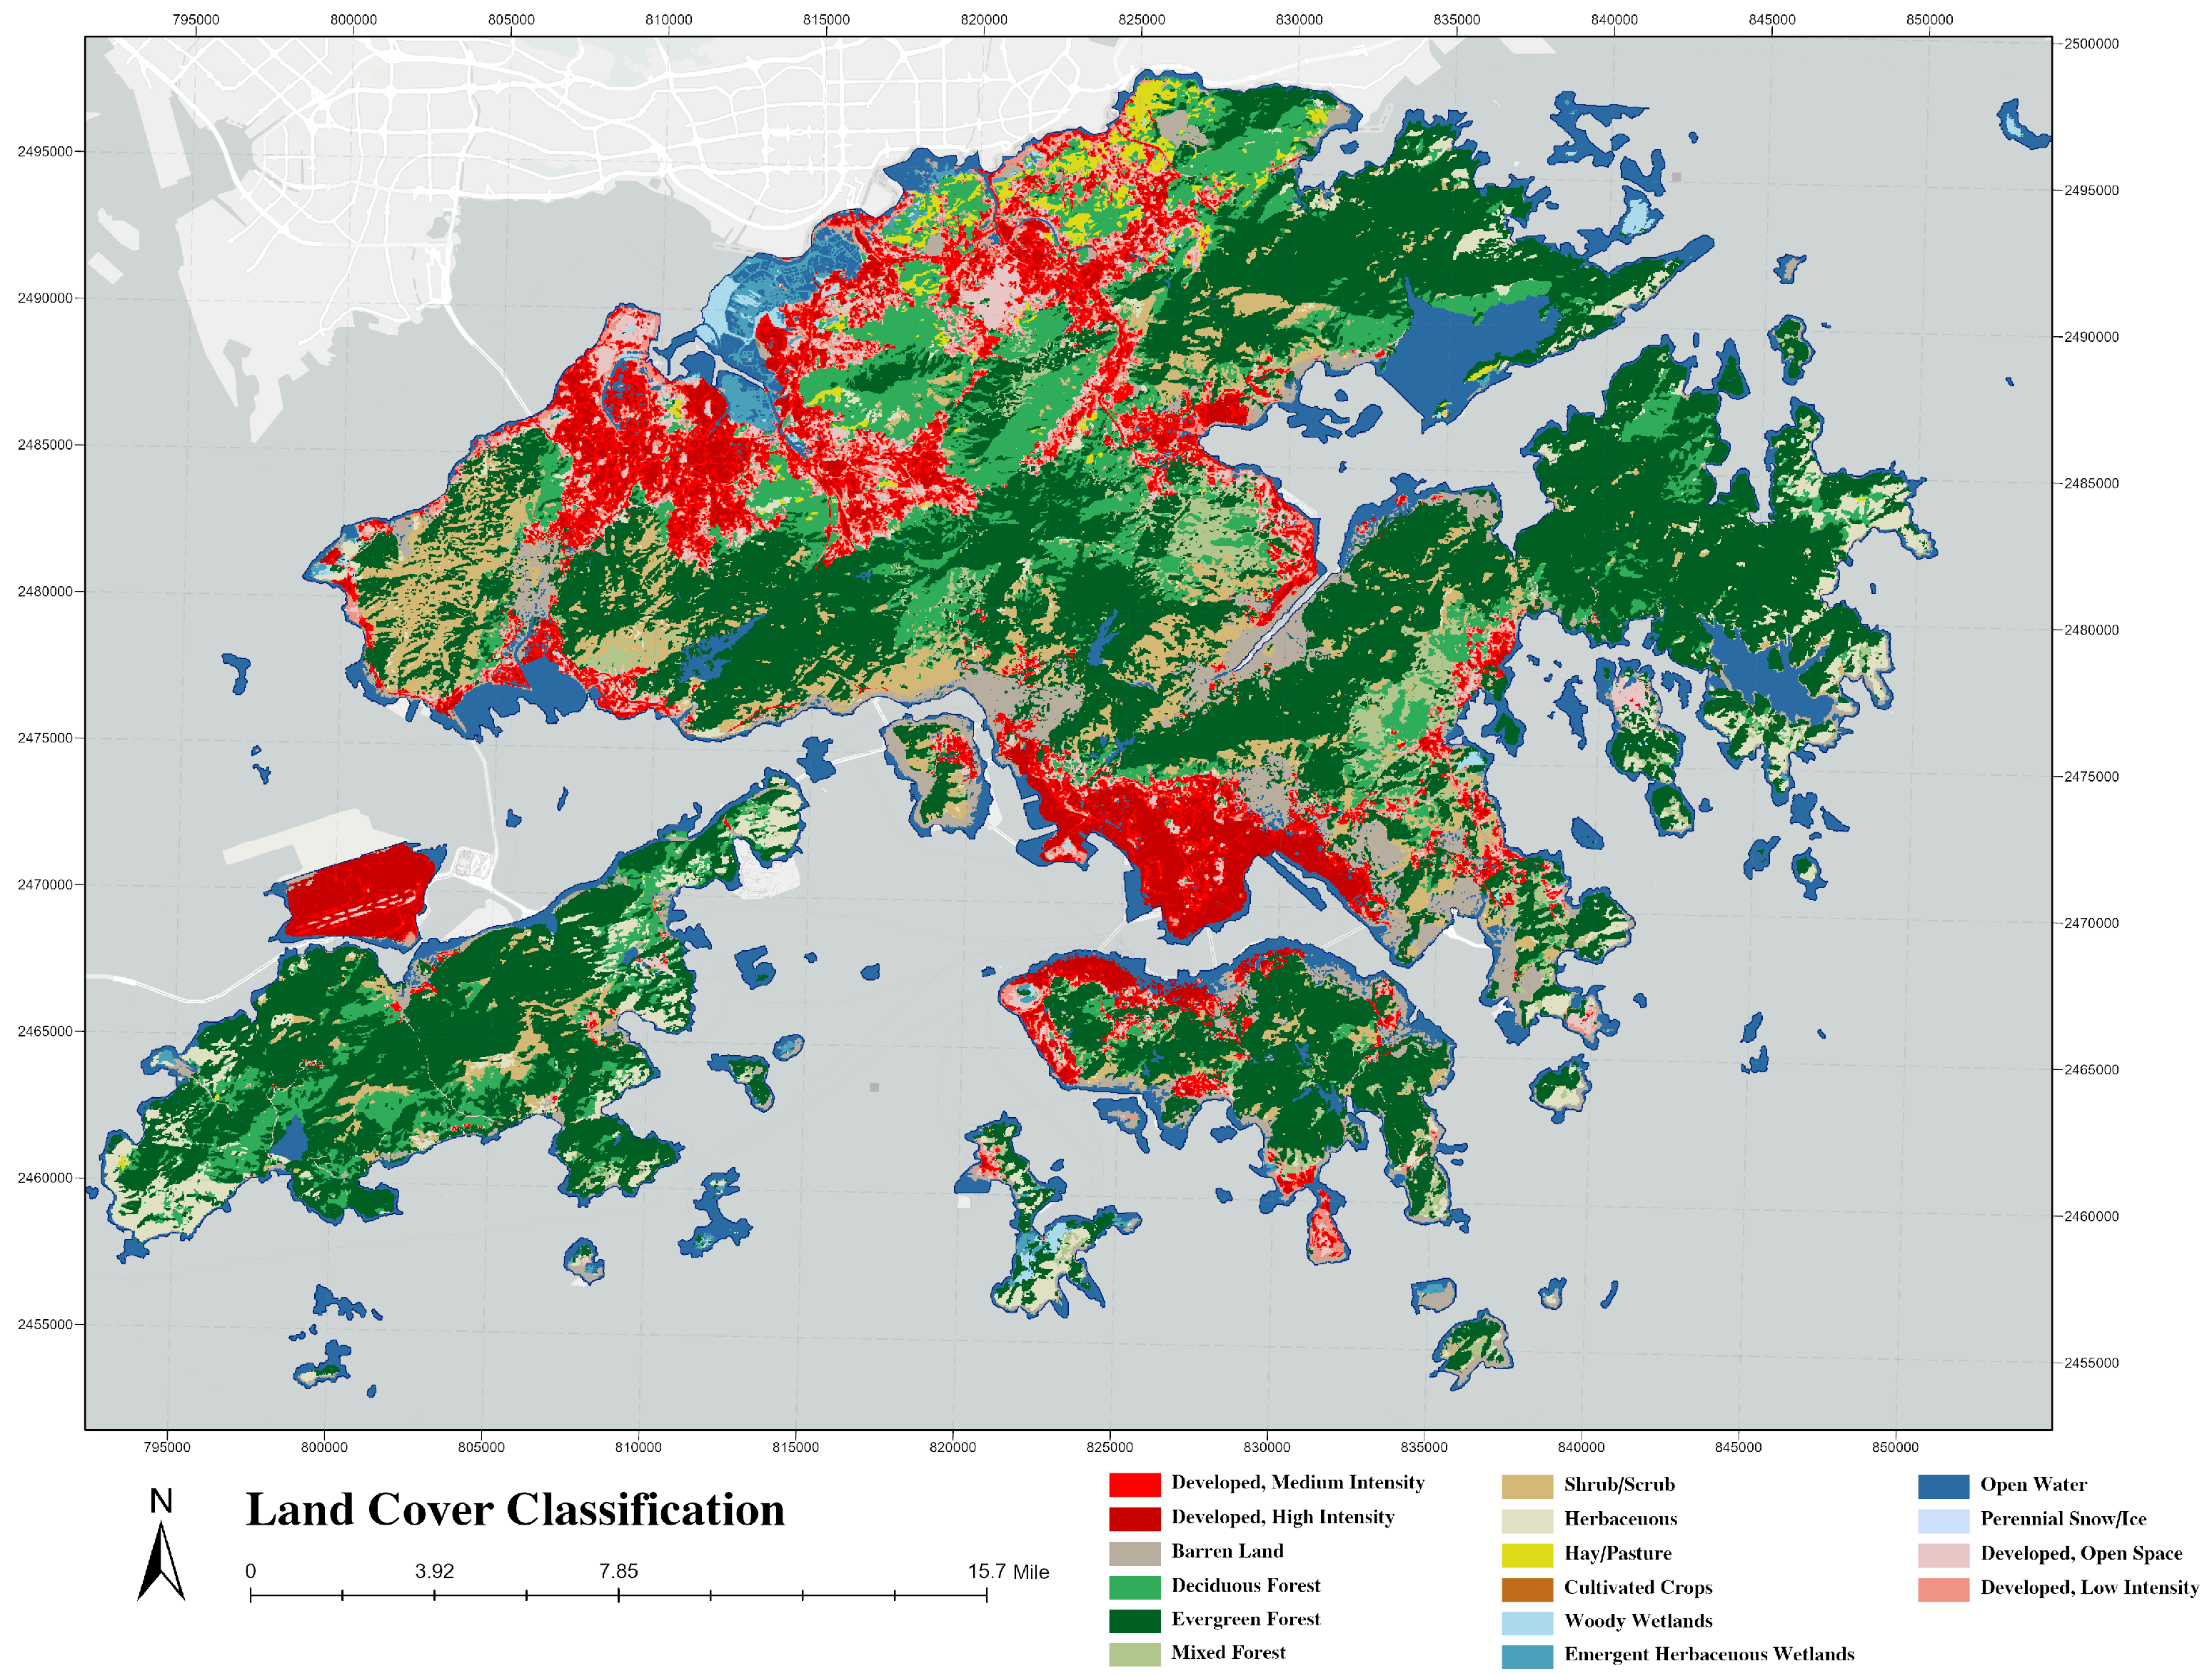
Firstly, this study adopts a semantic segmentation approach to identify the distribution of existing green spaces in Hong Kong using satellite imagery. A convolutional neural network (CNN) with a U-Net architecture is applied, achieving an overall accuracy of 77% [57,58]. U-Net’s encoder–decoder with skip connections preserves fine spatial details (e.g., vegetation–built boundaries), which improves segmentation in dense urban scenes [26,27]. This study employs Esri’s “Land Cover Classification Model (Landsat 8)” deep learning workflow (U-Net semantic segmentation) for pixel-wise land cover mapping, and the reported overall accuracy (77%) is computed from a post-classification accuracy assessment using a confusion matrix. Based on this deep learning model, Landsat image is used to classify land cover in Hong Kong. Appendix A Figure A1 shows the additional classification results. This study compares land cover categories in Hong Kong derived from satellite imagery with vector-based urban planning data provided by the government (Appendix A Figure A2), including categories such as government institutions and community facilities, open and recreational spaces, green belt areas, conservation areas, community parks, and coastal protection areas. Through this comparative analysis, IGSs in Hong Kong are identified and extracted.
The IGS identification methods mainly include field studies, suitability mapping, social media, and semantic segmentation. Among these methods, semantic segmentation offers the advantages of high efficiency and low cost, enabling high-accuracy identification and classification of urban land cover categories at various scales [26]. Many studies have demonstrated the feasibility of using U-Net for high-accuracy land cover classification of remote sensing imagery, and this method continues to evolve, improving both recognition accuracy and precision [57,59,60].
Secondly, the classification of IGS types is based on a hierarchical classification produced through sequential applications of the k-means clustering algorithm. The k-means clustering approach has been effectively utilized in urban typology studies [61,62] and geodemographic research [63]. The 150 m scale has been demonstrated to significantly reduce landscape fragmentation in comparison with lower scales. It is an effective method of identifying medium-sized rivers, lakes and artificial areas, and it is superior to higher scales at distinguishing urban areas and other areas with high population density. The present study demonstrates that this approach achieves the optimal balance between detail and the big picture in macroecological analysis [64]. In this study, a 150 × 150 m grid is constructed within the derived IGS distribution areas of Hong Kong. The inputs for the clustering algorithm were the proportions of various land cover types within each grid cell and the number of different land cover types present in each cell. The optimal number of clusters is determined using the elbow method, followed by statistical and visual analysis (aerial image interpretation) of all data within each cluster to name and describe the IGS types [65].

3.4. Step 2: Evaluate the Benefits of IGSs

To evaluate the ecological, social and economic benefits of IGSs, we developed a three-pillar evaluation index (Ecological, Social and Economic) based on the indicators and the per-cell impact factors (150 × 150 m) derived from the datasets in Table 1 (land cover/IGS categories, transit accessibility, population, commercial and educational infrastructure, housing value and average income). For each grid cell, the indicators were calculated and normalized to the range [0, 1]. They were then weighted using the analytic hierarchy process weights and aggregated via weighted overlay. The composite scores were classified into five levels using the natural breaks method, which was employed to map the spatial distribution of IGS benefits across Hong Kong. The following Table 2 presents the calculation formulas and explanations of the evaluation indicators.

3.4.1. Ecological Benefits

This study evaluates the ecological benefits of IGSs, focusing on their potential to improve urban microclimates and enhance residents’ living environments and quality of life. The assessment is based on key ecosystem service indicators, primarily examining the regulating, supporting, and cultural services of IGSs, and incorporates calculations of the ecological values associated with different land cover types within each sample plot [16,52]. The first indicator encompasses regulating service potential and evaluating IGS capacity to regulate air quality, urban climate, and water processes. Higher regulation service potential corresponds to greater ecological benefits [62,66]. The second indicator encompasses supporting service potential and was assessed through three metrics: soil conservation, nutrient cycling maintenance, and biodiversity [20]. Higher soil retention indicates greater effectiveness in mitigating soil erosion and water loss [67]. Greater vegetation coverage suggests better regulation of urban climate and ecosystems [62]. Improved habitat quality within IGS supports the conservation of biodiversity [20]. The third indicator is cultural service potential. The esthetic value of IGS landscapes reflects its cultural service potential, with higher esthetic value indicating greater cultural benefits [68].

3.4.2. Social Benefits

In this study, we set two metrics to assess the social benefit of IGSs, namely cultural service potential and human activity intensity [50,69,70]. The first indicator is cultural service potential, which mainly evaluates transit accessibility. The denser the public transport stations are distributed around IGSs, the easier it is to access the surrounding areas. The second index is the human activity intensity index, which is evaluated by integrating multiple spatial indicators derived from open-source geospatial datasets. Specifically, the following data were utilized: (1) population density data from the Hong Kong CSDI Portal, (2) the distribution of commercial infrastructure such as cultural, entertainment, and office facilities, and (3) the distribution of educational infrastructure including schools and universities. Each dataset was subjected to spatial processing within a 150 m × 150 m grid framework, encompassing all designated IGS areas. The kernel density of commercial and educational facilities was calculated, and these were then combined with the normalized population density using a weighted overlay analysis in GIS. This methodological approach facilitates a quantitative assessment of human activity intensity surrounding IGS and has been widely applied in evaluating urban green space accessibility and social benefits [30,71]. Commercial infrastructures are mainly cultural and entertainment facilities and office facilities around IGSs, because many people gather around cultural and entertainment facilities, indicating that IGSs nearby have a high intensity of crowd activity. In addition, it evaluates the distribution of education infrastructure around IGSs. These three groups are surrounded by a large and relatively stable population, and the IGSs surrounding them have a high social benefit.

3.4.3. Economic Benefits

In terms of economic benefits, this study mainly evaluates the land values and market dynamics around IGS. The first is the land value, which is evaluated by the house price around IGSs [69]. The higher the prices of houses around IGSs, the higher the IGS economic value of the region. Second, market-driven assessments are made by assessing the average income of IGS locations, where the need for urban development is greater, and the value of land investment is higher [71].

3.4.4. Weighted Overlay

The 150 m × 150 m spatial units within Hong Kong’s IGS area underwent spatial analysis through overlay and spatial join processing. This involved integrating GIS results from equal-pixel-size analysis (including various density metrics and density estimates) with regional data (socioeconomic indicators, population density, land use types). This approach consolidated ecological, social, and economic data for comprehensive spatial evaluation. Based on Hong Kong’s current conditions and expert judgments, an Analytical Hierarchy Process is applied to construct a decision matrix and determine the weights of each evaluation indicator (Table 3). The indicators are quantified using the methods described earlier, and the results are standardized. By performing weighted overlay analysis on the raster data, the benefits of Hong Kong’s IGSs are evaluated. The benefits are classified into five levels: very low (0–0.2), low (0.2–0.4), moderate (0.4–0.6), high (0.6–0.8), and very high (0.8–1.0), using the natural breaks method.

4. Results

4.1. Distribution of IGS Typology

The IGSs in Hong Kong exhibit a fragmented spatial pattern and can be categorized into four IGS types: Urban Interstitial IGSs, Transitional IGSs, Fringe IGSs, and Riparian IGSs. Among these, Urban Interstitial IGSs and Fringe IGSs are the most abundant, while Riparian IGSs are the least common.
Urban Interstitial IGSs (1964.64 hectares) primarily appear as point features, mainly located in densely populated areas and urban interstices, with a concentration in the Kowloon Peninsula and Sha Tin District. The land cover is primarily Barren Land (94.54%), indicating a singular land type with low biodiversity. Transitional IGSs (673.19 hectares) are mostly distributed in patches, situated between Urban Interstitial IGSs and Fringe IGSs, with land cover dominated by mixed forest (57.86%) and herbaceous plants (19.76%), reflecting a transitional zone between urban and natural vegetation. Fringe IGSs (2936.86 hectares) are mainly distributed in belts along the edges of protected areas, exhibiting high ecological diversity, with evergreen forest (39.04%) and deciduous forest (23.67%) as the primary land covers, along with Emergent Herbaceous Wetlands (12.10%) and Shrub (12.21%). Riparian IGS (249.79 hectares) areas are predominantly located near rivers, seas, and water bodies, with ecosystems mainly composed of wetlands, featuring land covers such as Emergent Herbaceous Wetlands (55.90%), Woody Wetlands (5.89%), and Barren Land (19.15%). Figure 3 illustrates the spatial distribution of IGSs in Hong Kong, while Figure 4 and Table 4, respectively, present the benefits, land cover types, and data analysis results of the IGS subcategories.

4.2. Benefits of IGS

This study analyzes the various types of IGSs in Hong Kong. Through data analysis (Figure 5 and Table 4), it was found that the potential benefits of Urban Interstitial IGSs are the most significant, while those of Riparian IGSs are relatively lower (Figure 5). The potential benefits of Transitional IGSs and Fringe IGSs fall within the intermediate range (Figure 5).

4.2.1. Benefits of Interstitial IGSs

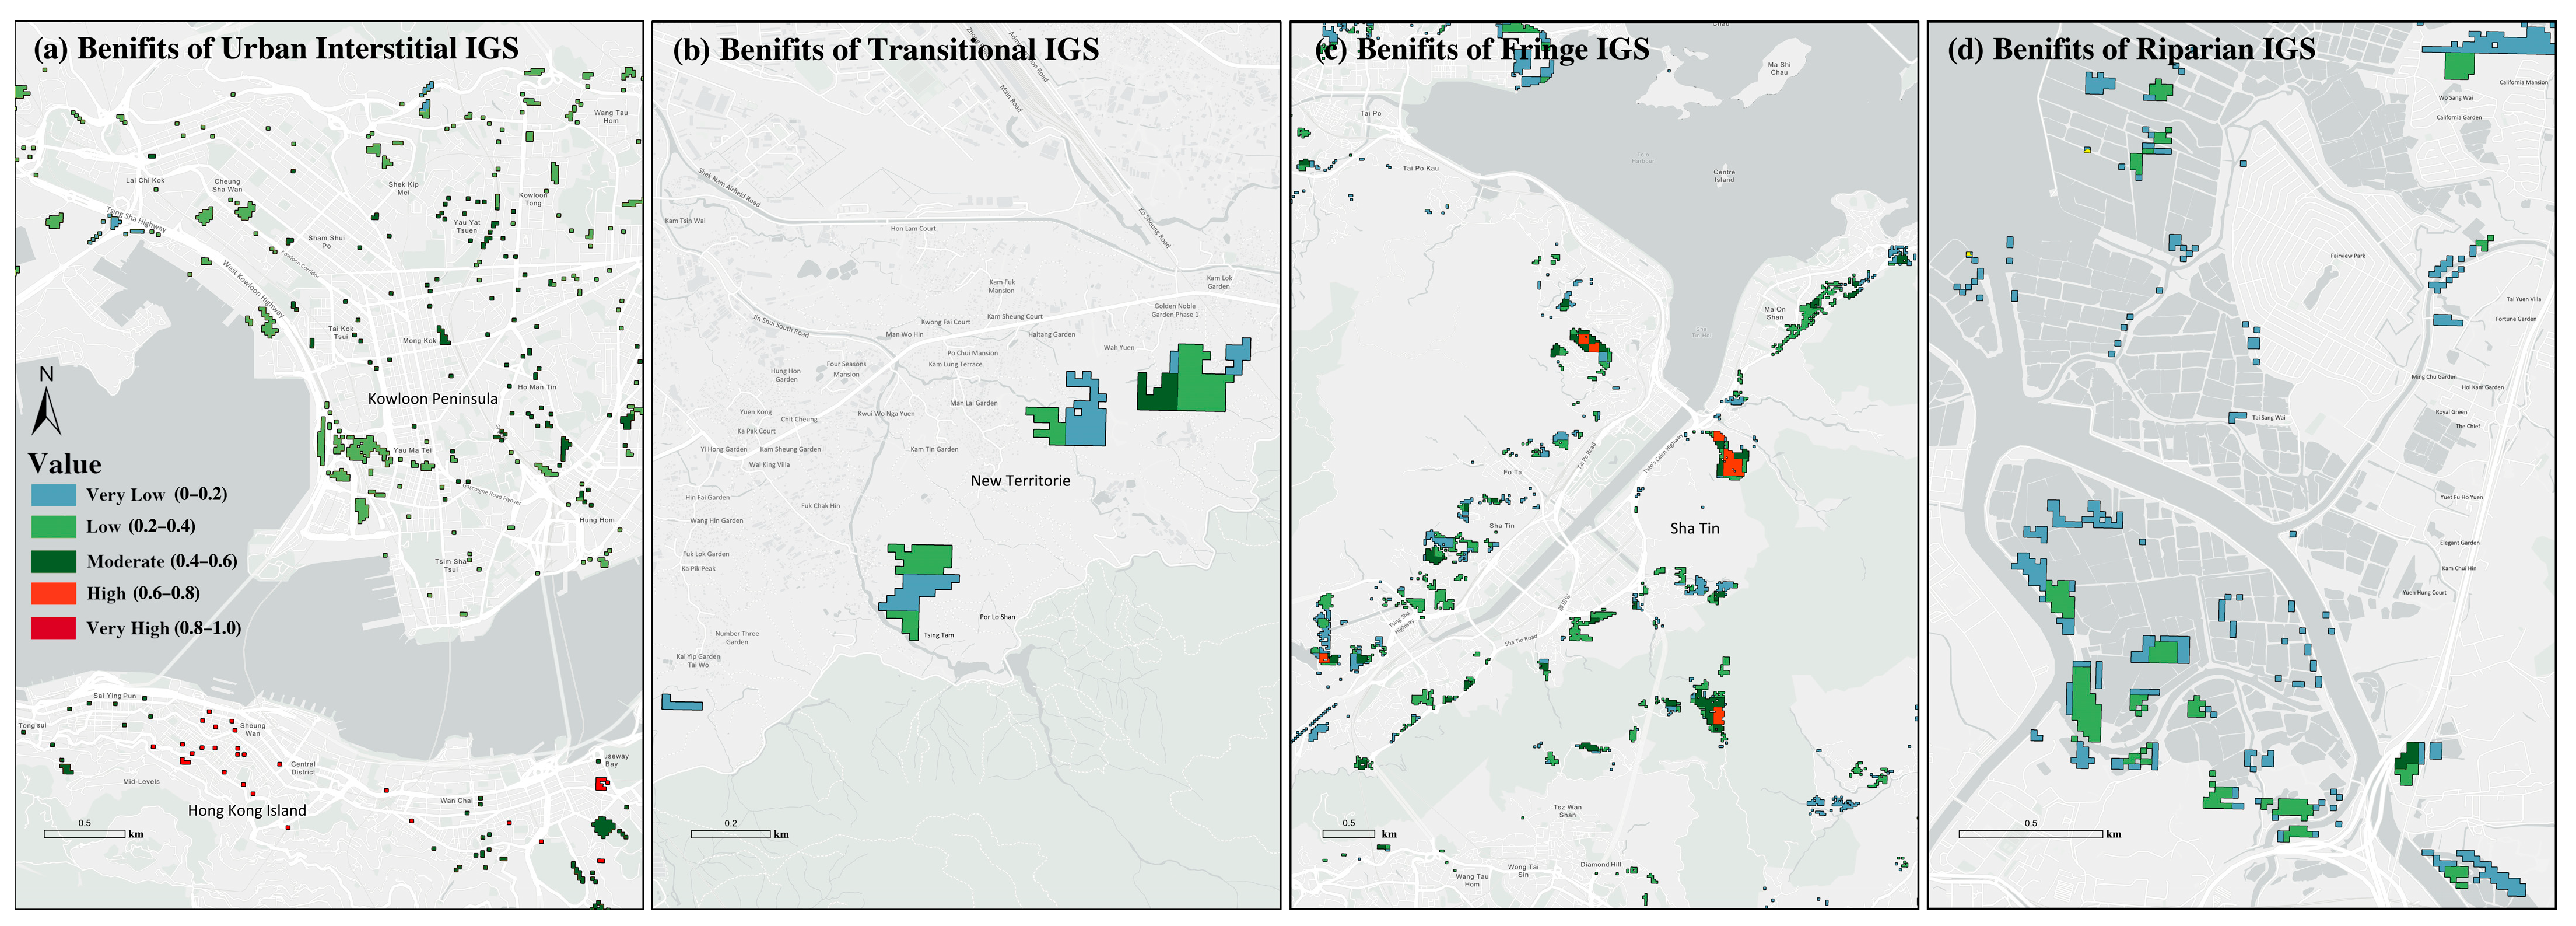
Urban Interstitial IGSs have the greatest potential benefits compared to other IGS types. The IGS located in Kowloon Peninsula and the northern part of Hong Kong Island exhibits relatively high social and economic benefits (Table 4). This category is primarily situated in areas with high urban density, commercial infrastructure (0.0316), and educational infrastructure (0.1749), as well as areas with high transit accessibility (0.2235), high population density (0.0860), high average income (0.3417) (especially the northern part of Hong Kong), and elevated housing values (0.2390). The results show that this category has the highest social (0.5160) and economic (0.5807) benefits (Figure 6). However, its ecological benefits are the lowest (0.1618). This is because the land cover in this category is relatively homogeneous, consisting mostly of bare land between urban areas, with a lack of vegetation. This limits the development of gas regulation, hydrological regulation, soil conservation, and biodiversity.

4.2.2. Benefits of Transitional IGSs

Transitional IGSs are primarily situated between low-density urban areas, with regions of higher benefits concentrated in the southeastern part of Hong Kong’s outlying islands and the New Territories (Figure 6). These areas feature relatively diverse land cover and possess certain advantages in terms of ecological benefits (0.4611). The gas regulation (0.0655) is relatively high, falling between urban Fringe IGSs (0.0229) and Riparian IGSs (0.0582), and its climate regulation (0.0663) also performs well, ranking in the upper-middle range, indicating that the area has potential in regulating temperature and air quality (Table 4). However, the social benefits of this area are relatively low, with a low population density (0.0106), less commercial infrastructure (0.0078), and less educational infrastructure (0.0361), resulting in moderate overall benefits (0.0968).

4.2.3. Benefits of Fringe IGSs

The overall comprehensive benefit of the Fringe IGS type is 0.1177, placing it at a moderate level among all categories of IGSs. Areas with higher comprehensive benefits in this type are located at the junctions between urban zones and formal green spaces on Hong Kong Island, in Sha Tin District (Figure 6), and in the outlying islands, such as green belts, conservation areas, and open spaces. Consequently, the vegetation in this IGS category predominantly consists of evergreen forests, which are rich in flora, resulting in good gas regulation (0.0916) and climate regulation (0.0880) benefits. This also favors soil conservation (0.0916) and, in turn, supports relatively high biodiversity (0.0886). As a result, this region performs well in terms of ecological benefits (0.5733). However, due to its location on the urban fringe, the supporting infrastructure is relatively limited, leading to lower social and economic benefits (Table 4).

4.2.4. Benefits of Riparian IGSs

The overall comprehensive benefit of Riparian IGS is the lowest at 0.0872, with areas of higher total value mainly located in Yuen Long District (Figure 6). The primary soil cover type in this IGS category is Woody Wetland, which holds the highest value in hydrological regulation (0.0713). Riparian IGSs play a significant role in managing water resources and flow. Riparian areas typically include water bodies such as rivers and lakes, which can effectively mitigate floods, improve water quality, and support water source protection. The biodiversity value (0.0826) is also relatively high, indicating strong support for habitats of flora and fauna, contributing to the health and diversity of ecosystems (Table 4). Riparian areas often possess natural beauty, making them popular spots for recreation and tourism among urban residents and visitors, and thus, they hold high potential and value in landscape esthetics (0.0758). However, the social and economic benefits are relatively low.

4.3. IGS as Supplements to GI in Low Green Space Areas

IGS serves as a supplement to GI, particularly in areas with low green space per capita. In this study, GI in Hong Kong includes community parks, open spaces, coastal protected areas, green belts, institutional land, and conservation zones. The World Health Organization (WHO) sets a minimum target of 9 m2 of green space per capita [72]. Table 5 shows the per capita provision of GI, IGS, and their combined total in Hong Kong districts with low green space availability. On average, the inclusion of IGSs increases per capita green space by 1.89 m2/person, with a standard deviation of 1.44 m2/person, indicating that IGS contributes to easing green space scarcity in such areas. In some districts, such as Kowloon City and Wong Tai Sin, the addition of IGSs raises the total green space per capita above the WHO-recommended minimum of 9 m2/person. However, the compensatory effect of IGSs varies spatially. Kowloon City and Kwun Tong show the most significant increases, with IGS contributing 4.46 and 2.50 m2/person, respectively. In contrast, Sham Shui Po, Wong Tai Sin, and Yau Tsim Mong report increases of less than 1 m2/person.
In summary, although most districts still fall short of the international standard for green space, IGSs play a role in mitigating the shortfall of GI in high-density urban areas.

5. Discussion

5.1. IGSs as Critical Supplements to GI in High-Density Cities

GI serves as a critical component of public facilities, significantly enhancing quality of life in Hong Kong’s high-density urban areas by providing recreational, exercise, and social interaction spaces that promote individual well-being and social cohesion [71]. It regulates urban microclimates and preserves ecological environments. However, existing GI in Hong Kong exhibits spatial inequity, being predominantly concentrated near high-end low-density residential and mixed-use commercial zones rather than high-density public housing areas [73]. Thus, vulnerable groups, low-income populations, non-public housing residents, and the elderly face limited GI access.
From the perspective of institutional justice, the unequal distribution of green resources is not accidental. As Moroni [74] points out, the spatial arrangement of green infrastructure is closely related to institutional frameworks. If urban governance mechanisms fail to set standards for fair distribution, they may allow or even institutionalize environmental injustice. In this context, rethinking the institutional structure of GI becomes a key step in achieving urban spatial justice and sustainable development. This also provides necessary theoretical support for IGS as a supplementary mechanism to address the institutional gaps in GI.
From a governance perspective, IGS aligns with Ostrom’s “commons theory.” Its openness and non-institutionalized characteristics make it representative of “urban green commons,” governed and shared by community members through informal rules. This governance not only expands the social functions of green spaces but also reflects the diversity and flexibility of governance. For example, IGS near dense residential areas, though small-scale and fragmented, constitute the most accessible GI for communities [75]. Proximity to neighborhoods enables creative spatial appropriations: walking, cooling, vegetable gardening, dog walking, child’s play, and social gatherings demonstrate residents’ spontaneous utilization diversity. Studies have confirmed that IGSs have psychological benefits through promoting exercise, social interaction, and stress reduction [75]. These spaces function as community hubs fostering neighborhood bonds when formal public spaces are inadequate [14]
In addition, from the perspective of spatial agency, IGSs demonstrate the subjective agency of residents in the absence of institutional frameworks. The reuse of these spaces is not incidental, but a response made by grassroots communities based on their needs in urban contexts where formal planning is absent and resource distribution is unequal, reflecting a bottom-up governance logic. For this reason, IGSs are not just functional supplements to the formal GI system; rather, they should be understood as an alternative governance structure in the absence of institutional frameworks, reflecting the diverse logic of urban green space governance [20,28].
From the perspective of urban resilience theory, IGSs reflect the resilient characteristics of ecosystems, providing key ecological services such as local microclimate regulation and biological shelter in the face of climate change and extreme weather events. For example, IGSs located in commercial areas, though often overlooked in mainstream planning due to their irregular shapes and marginal locations, have great potential for biodiversity conservation and ecological regulation. Ref. [75] demonstrates that core urban IGSs support climate adaptation and biodiversity. Proximity to green spaces enhances urban ecosystem value, as seen in Singapore, where scarce high-quality greenery drives premium valuations of vegetated residential properties [75]. Studies further highlight IGSs’ ecological esthetics and resilience [37].
In summary, in the context of high-density cities, especially where GI space distribution is uneven and institutional justice is lacking, IGSs not only effectively complement the functions of GI in ecological regulation, social cohesion, and mental health due to their proximity to communities and flexible use, but also, through resident self-governance and spatial agency, show their importance as a support for achieving urban spatial justice and ecological resilience [28,49].

5.2. Necessity of IGS Classification in Hong Kong’s High-Density Urban Context

Classifying IGS in Hong Kong is essential due to variations in urban density, income levels, and ecological conditions, which shape distinct spatial distribution patterns. Analyzing subclass-specific values clarifies their formation mechanisms and informs future development pathways. This section outlines Hong Kong’s IGS typology and their categorical benefits.
From a citywide perspective, Hong Kong’s four IGS types—Urban Interstitial, Transitional, Fringe, and Riparian IGSs—exhibit divergent ecological, social, and economic benefits along urbanization gradients (Figure 5 and Table 4). Ecological benefits decrease with urbanization intensity, while social and economic benefits increase inversely. Urban interstitial IGSs in core commercial areas, characterized by fragmented patches and high anthropogenic disturbance, deliver low ecological value. However, their proximity to commercial hubs ensures high accessibility and usage frequency, yielding superior social and economic benefits. Conversely, Fringe and Riparian IGSs in suburban areas, closer to natural states, provide stronger ecological services but lower socioeconomic value (Figure 5 and Table 4).
Subclass-specific analyses reveal unique value profiles. Urban Interstitial IGSs demonstrate the highest socioeconomic value due to elevated income levels, property prices, and transport accessibility (Table 4). Located in hyper-dense commercial zones with severe green space fragmentation and limited connectivity, these spaces reflect land scarcity and competing development priorities. From a policy perspective, the Conceptual Framework on Blue-Green Infrastructure [76] proposes green corridors to integrate fragmented patches, yet Urban Interstitial IGSs persist as residual spaces without governance, such as developer-owned lots, irregularly shaped plots derived from urban renewal, or infrastructural voids [75]. Assessing their benefits is critical for mitigating high-density urban challenges and guiding potential transformations into pocket parks. From a theoretical perspective, Urban Interstitial IGSs represent a typical application of the “Right to the City”. Lefebvre [1] proposes that residents have the right to fully and completely use urban space in their daily lives. Even the marginal spaces in urban gaps should ensure citizens’ right to share urban space.
Transitional IGSs and Riparian IGSs cluster near low-density residential areas (Figure 6), often repurposed as community gardens. Riparian IGSs, however, differ from vacant Riparian wetlands in the Northwest New Territories, adjacent to mixed public and private housing, with stark income disparities. In public housing estates, residents informally convert these spaces into community parks, rain gardens, or wetlands. In affluent neighborhoods, Riparian IGSs face stricter controls, sometimes being privatized or incorporated into luxury developments. These two types of IGSs represent the blurred institutional boundaries of green spaces and are typical examples of the “Governance void”.
Fringe IGSs concentrate near the Hong Kong–Shenzhen border, currently undervalued due to lower property prices. However, rising demand from high-income mainland migrants seeking spacious, ecologically favorable, and cross-border-convenient housing may increase population density and GI demand. These Fringe IGSs hold high potential for future formal GI conversion. This IGS type encompasses the need, and pressure, to transition from informal to formal, reflecting the dynamic nature of the “institutionalization” of green spaces. It shifts from gray infrastructure to green infrastructure, using natural solutions to achieve the sustainable development of green spaces [77].
Each subclass uniquely supplements Hong Kong’s GI system, with spatial positioning, land cover composition, and accessibility determining their functional roles.

5.3. Originality and Contributions

For urban-scale identification and typology, this study integrates deep learning land cover classification with government planning layers on a 150 m × 150 m grid. K-means clustering delineated four IGS types—Urban Interstitial, Transitional, Fringe, and Riparian IGSs—thereby producing a citywide base map of their spatial distribution.
To ensure a reproducible, grid-based evaluation, this study builds a three-pillar indicator system (ecological, social, economic). For each 150 m × 150 m cell, indicators were computed and standardized to [0, 1], weighted using the analytic hierarchy process, and aggregated into composite benefit scores, providing a transparent pipeline from data to benefit classification.
For cross-type comparisons, we examined the dominant locations of the four IGS categories and contrasted their ecological and social–economic outcomes, showing how urbanization context and land cover composition produce distinct benefit patterns. For equity-oriented quantification, we measured the compensatory effect of IGSs on formal green infrastructure (GI) at the district level by calculating per capita green space gains and highlighting districts that meet or approach the 9 m2/person benchmark when IGSs are included, thereby directly linking IGS analysis to green-space equity.

5.4. Limitations, Policy Implications, and Future Research Directions

Hong Kong’s green space policies are shifting from large-scale conservation to improving per capita green space provision and connectivity in built-up areas. This transition creates opportunities for IGS integration while reflecting governmental recognition of their supplementary value. However, management frameworks remain reactive and fragmented. Current planning regulations (e.g., Hong Kong Planning Standards and Guidelines) focus on formal recreational spaces without addressing IGS governance. Many IGSs lack maintenance responsibility, leading to environmental degradation, as unmanaged sites become illegal waste dumps.
This study’s IGS classification and benefit assessment framework supports policymaking by identifying IGS values, potentially fostering public–governmental recognition for sustainable IGS preservation.
The limitations of this study include the fact that it is a macro-scale analysis without individual IGS case studies. Future research could employ wearable devices and surveys to investigate user preferences. Open-source data constraints regarding resolution and real-time data availability require acknowledgment. The findings highlight IGSs’ potential in addressing green space inequality and environmental justice. Subsequent studies should compare green accessibility across demographic groups and quantify IGS contributions to environmental equity. Such evidence could inform inclusive urban greening policies, including social equity indicators in planning standards and prioritizing IGS preservation in underserved communities to reduce green welfare disparities.

6. Conclusions

This research fills a gap in the identification and classification of IGSs at the city level. By employing deep learning and suitability mapping based on these definitions, as well as by utilizing government vector data, open vector data, and high-resolution remote sensing imagery, this study efficiently classified and identified IGSs in Hong Kong from a macro perspective. Through the detailed categorization of IGS types and the comparison of benefits across different IGS categories, we have deepened our understanding of Hong Kong’s IGS system, which also contributes to the revitalization and reuse of IGSs. Ultimately, replicating this research in high-density cities worldwide will enhance our understanding of the global distribution of IGSs and provide valuable insights for planning policies.

Author Contributions

Conceptualization, Xiaoya Hou and Mingze Chen; methodology, Xiaoya Hou; software, Xiaoya Hou and Yu Tian; validation, Xiaoya Hou, Yu Tian, and Mingze Chen; formal analysis, Xiaoya Hou and Yu Tian; investigation, Xiaoya Hou and Mingze Chen; resources, Xiaoya Hou and Mingze Chen; data curation, Xiaoya Hou and Yu Tian; writing—original draft preparation, Xiaoya Hou and Yu Tian; writing—review and editing, Mingze Chen; visualization, Xiaoya Hou and Yu Tian; supervision, Mingze Chen; project administration, Xiaoya Hou and Mingze Chen; funding acquisition, Xiaoya Hou. All authors have read and agreed to the published version of the manuscript.

Funding

This research received no external funding.

Data Availability Statement

The data presented in this study is available from the corresponding author upon reasonable request.

Acknowledgments

We would like to thank the editors and anonymous referees for their constructive suggestions and comments that helped improve this paper’s quality.

Conflicts of Interest

The authors declare no conflicts of interest.

Abbreviations

The following abbreviations are used in this manuscript:
IGSsInformal green spaces
GIGreen infrastructure
UGSsUrban green spaces
CNNConvolutional neural network
WHOWorld Health Organization

Appendix A

Figure A1. Land cover classification.
Ijgi 14 00368 g0a1
Figure A2. Green spaces within government planning.
Ijgi 14 00368 g0a2

References

  1. Lefebvre, H. The Production of Space; Nicholson-Smith, D., Translator; Blackwell: Oxford, UK, 1991. [Google Scholar]
  2. Soja, E. Thirdspace: Journeys to Los Angeles and Other Real-and-Imagined Places; Blackwell: Oxford, UK, 1996. [Google Scholar]
  3. Larsson, E.P.; Giritli Nygren, K. Cultivating Thirdspace: Community, Conflict and Place in Small-City Urban Gardens. Landsc. Urban Plan. 2024, 243, 104959. [Google Scholar] [CrossRef]
  4. Lee, A.C.K.; Maheswaran, R. The Health Benefits of Urban Green Spaces: A Review of the Evidence. J. Public Health 2011, 33, 212–222. [Google Scholar] [CrossRef]
  5. Maller, C.; Townsend, M.; Pryor, A.; Brown, P.; St Leger, L. Healthy Nature Healthy People: ‘Contact with Nature’ as an Upstream Health Promotion Intervention for Populations. Health Promot. Int. 2006, 21, 45–54. [Google Scholar] [CrossRef]
  6. Byrne, J.; Sipe, N.; Searle, G. Green Around the Gills? The Challenge of Density for Urban Greenspace Planning in SEQ. Aust. Plan. 2010, 47, 162–177. [Google Scholar] [CrossRef]
  7. Korkou, M.; Tarigan, A.K.M.; Hanslin, H.M. The Multifunctionality Concept in Urban Green Infrastructure Planning: A Systematic Literature Review. Urban For. Urban Green. 2023, 85, 127975. [Google Scholar] [CrossRef]
  8. Voskamp, I.; Van de Ven, F. Planning Support System for Climate Adaptation: Composing Effective Sets of Blue-Green Measures to Reduce Urban Vulnerability to Extreme Weather Events. Build. Environ. 2015, 83, 159–167. [Google Scholar] [CrossRef]
  9. Walmsley, A. Greenways: Multiplying and Diversifying in the 21st Century. Landsc. Urban Plan. 2006, 76, 252–290. [Google Scholar] [CrossRef]
  10. Kabisch, N.; van den Bosch, M.; Lafortezza, R. The Health Benefits of Nature-Based Solutions to Urbanization Challenges for Children and the Elderly—A Systematic Review. Environ. Res. 2017, 159, 362–373. [Google Scholar] [CrossRef]
  11. Kaplan, R.; Kaplan, S. The Experience of Nature: A Psychological Perspective; Cambridge University Press: Cambridge, UK, 1989. [Google Scholar]
  12. Park, J.; Kim, J. Economic Impacts of a Linear Urban Park on Local Businesses: The Case of Gyeongui Line Forest Park in Seoul. Landsc. Urban Plan. 2019, 181, 139–147. [Google Scholar] [CrossRef]
  13. Tian, Y.; Jim, C.Y.; Tao, Y.; Shi, T. Landscape Ecological Assessment of Green Space Fragmentation in Hong Kong. Urban For. Urban Green. 2011, 10, 79–86. [Google Scholar] [CrossRef]
  14. Mahmoudi Farahani, L.; Maller, C. Investigating the Benefits of ‘Leftover’ Places: Residents’ Use and Perceptions of an Informal Greenspace in Melbourne. Urban For. Urban Green. 2019, 41, 292–302. [Google Scholar] [CrossRef]
  15. Feng, S.; Kou, X.; Chang, J.; Hu, Z.; Li, C. Urban Informal Green Space: Concept, Type, Value and Renewal Design Model. South Archit. 2022, 3, 78–87. [Google Scholar]
  16. Kim, G.; Miller, P.; Nowak, D. The Value of Green Infrastructure on Vacant and Residential Land in Roanoke, Virginia. Sustainability 2016, 8, 296. [Google Scholar] [CrossRef]
  17. Penone, C.; Machon, N.; Julliard, R.; Le Viol, I. Do Railway Edges Provide Functional Connectivity for Plant Communities in an Urban Context? Biol. Conserv. 2012, 148, 126–133. [Google Scholar] [CrossRef]
  18. Colding, J.; Barthel, S. The Potential of ‘Urban Green Commons’ in the Resilience Building of Cities. Ecol. Econ. 2013, 86, 156–166. [Google Scholar] [CrossRef]
  19. Stanford, H.R.; Garrard, G.E.; Kirk, H.; Hurley, J. A Social-Ecological Framework for Identifying and Governing Informal Greenspaces in Cities. Landsc. Urban Plan. 2022, 221, 104378. [Google Scholar] [CrossRef]
  20. Rupprecht, C.; Byrne, J. Informal Urban Greenspace: A Typology and Trilingual Systematic Review of Its Role for Urban Residents and Trends in the Literature. Urban For. Urban Green. 2014, 13, 597–611. [Google Scholar] [CrossRef]
  21. Nassauer, J.I.; Raskin, J. Urban Vacancy and Land Use Legacies: A Frontier for Urban Ecological Research, Design, and Planning. Landsc. Urban Plan. 2014, 125, 245–253. [Google Scholar] [CrossRef]
  22. Németh, J.; Langhorst, J. Rethinking Urban Transformation: Temporary Uses for Vacant Land. Cities 2014, 40, 143–150. [Google Scholar] [CrossRef]
  23. Loukaitou-Sideris, A. Cracks in the City: Addressing the Constraints and Potentials of Urban Design. J. Urban Des. 1996, 1, 91–103. [Google Scholar] [CrossRef]
  24. Luo, S. The Cultural Ecosystem Services of Informal Green Spaces in Deprived Neighborhoods: An In-Depth Interview Study. AESOP Annu. Congr. Proc. 2024, 36. Available online: https://proceedings.aesop-planning.eu/index.php/aesopro/article/view/2271 (accessed on 1 September 2025).
  25. Sit, K.Y.; Chen, W.Y.; Ng, K.Y.; Koh, K.; Zhang, H. Unveiling Environmental Inequalities in a High-Density Asian City: City-Scaled Comparative Analysis of Green Space Coverage within 10-Minute Walk from Private, Public, and Rural Housing. Landsc. Urban Plan. 2025, 253, 105225. [Google Scholar] [CrossRef]
  26. Li, Z.; Chen, B.; Wu, S.; Su, M.; Chen, J.M.; Xu, B. Deep Learning for Urban Land Use Category Classification: A Review and Experimental Assessment. Remote Sens. Environ. 2024, 311, 114290. [Google Scholar] [CrossRef]
  27. Clark, A.; Phinn, S.; Scarth, P. Optimised U-Net for Land Use–Land Cover Classification Using Aerial Photography. PFG—J. Photogramm. Remote Sens. Geoinf. Sci. 2023, 91, 125–147. [Google Scholar] [CrossRef]
  28. Biernacka, M.; Kronenberg, J.; Łaszkiewicz, E.; Czembrowski, P.; Amini Parsa, V.; Sikorska, D. Beyond Urban Parks: Mapping Informal Green Spaces in an Urban–Peri-Urban Gradient. Land Use Policy 2023, 131, 106746. [Google Scholar] [CrossRef]
  29. Nielsen, T. The Return of the Excessive: Superfluous Landscapes. Space Cult. 2002, 5, 53–62. [Google Scholar] [CrossRef]
  30. Sikorska, D.; Łaszkiewicz, E.; Krauze, K.; Sikorski, P. The Role of Informal Green Spaces in Reducing Inequalities in Urban Green Space Availability to Children and Seniors. Environ. Sci. Policy 2020, 108, 144–154. [Google Scholar] [CrossRef]
  31. Cupers, K.; Miessen, M. Spaces of Uncertainty—Berlin Revisited: Potenziale Urbaner Nischen; Birkhäuser: Basel, Switzerland, 2018. [Google Scholar]
  32. Gandy, M. Unintentional Landscapes. Landsc. Res. 2016, 41, 433–440. [Google Scholar] [CrossRef]
  33. Mubi Brighenti, A. (Ed.) Urban Interstices: The Aesthetics and the Politics of the In-Between; Ashgate: Farnham, UK, 2013. [Google Scholar]
  34. Shaw, P. The Qualities of Informal Space: (Re)Appropriation within the Informal, Interstitial Spaces of the City. In Occupation: Negotiations with Constructed Space, Proceedings of the Conference, University of Brighton, Brighton, UK, 2–4 July 2009; University of Brighton: Brighton, UK, 2009. [Google Scholar]
  35. Tonnelat, S. ‘Out of Frame’: The (In)Visible Life of Urban Interstices—A Case Study in Charenton-le-Pont, Paris, France. Ethnography 2008, 9, 291–324. [Google Scholar] [CrossRef]
  36. Foster, J. Hiding in Plain View: Vacancy and Prospect in Paris’ Petite Ceinture. Cities 2014, 40, 124–132. [Google Scholar] [CrossRef]
  37. Gandy, M. Marginalia: Aesthetics, Ecology, and Urban Wastelands. Ann. Assoc. Am. Geogr. 2013, 103, 1301–1316. [Google Scholar] [CrossRef]
  38. Hu, X.; Zhuang, S. Large-Scale Spatial-Temporal Identification of Urban Vacant Land and Informal Green Spaces Using Semantic Segmentation. Remote Sens. 2024, 16, 216. [Google Scholar] [CrossRef]
  39. Phillips, D.; Lindquist, M. Just Weeds? Comparing Assessed and Perceived Biodiversity of Urban Spontaneous Vegetation in Informal Greenspaces in the Context of Two American Legacy Cities. Urban For. Urban Green. 2021, 62, 127151. [Google Scholar] [CrossRef]
  40. Threlfall, C.G.; Kendal, D. The Distinct Ecological and Social Roles That Wild Spaces Play in Urban Ecosystems. Urban For. Urban Green. 2018, 29, 348–356. [Google Scholar] [CrossRef]
  41. Mao, L.; Zheng, Z.; Meng, X.; Zhou, Y.; Zhao, P.; Yang, Z.; Long, Y. Large-Scale Automatic Identification of Urban Vacant Land Using Semantic Segmentation of High-Resolution Remote Sensing Images. Landsc. Urban Plan. 2022, 222, 104384. [Google Scholar] [CrossRef]
  42. Ma, S.; Long, Y. Mapping Potential Wilderness in China with Location-Based Services Data. Appl. Spat. Anal. Policy 2020, 13, 69–89. [Google Scholar] [CrossRef]
  43. Xu, S.; Ehlers, M. Automatic Detection of Urban Vacant Land: An Open-Source Approach for Sustainable Cities. Comput. Environ. Urban Syst. 2022, 91, 101729. [Google Scholar] [CrossRef]
  44. Feltynowski, M.; Kronenberg, J.; Bergier, T.; Kabisch, N.; Łaszkiewicz, E.; Strohbach, M.W. Challenges of Urban Green Space Management in the Face of Using Inadequate Data. Urban For. Urban Green. 2018, 31, 56–66. [Google Scholar] [CrossRef]
  45. Fainstein, S.S. The Just City. Int. J. Urban Sci. 2014, 18, 1–18. [Google Scholar] [CrossRef]
  46. Dai, D. Racial/Ethnic and Socioeconomic Disparities in Urban Green Space Accessibility: Where to Intervene? Landsc. Urban Plan. 2011, 102, 234–244. [Google Scholar] [CrossRef]
  47. Knaus, M.; Haase, D. Green Roof Effects on Daytime Heat in a Prefabricated Residential Neighbourhood in Berlin, Germany. Urban For. Urban Green. 2020, 53, 126738. [Google Scholar] [CrossRef]
  48. Sikorski, P.; Gawryszewska, B.; Sikorska, D.; Chormański, J.; Schwerk, A.; Jojczyk, A.; Ciężkowski, W.; Archiciński, P.; Łepkowski, M.; Dymitryszyn, I.; et al. The Value of Doing Nothing—How Informal Green Spaces Can Provide Comparable Ecosystem Services to Cultivated Urban Parks. Ecosyst. Serv. 2021, 50, 101339. [Google Scholar] [CrossRef]
  49. Ke, X.; Huang, D.; Zhou, T.; Men, H. Contribution of Non-Park Green Space to the Equity of Urban Green Space Accessibility. Ecol. Indic. 2023, 146, 109855. [Google Scholar] [CrossRef]
  50. Sanches, P.M.; Mesquita Pellegrino, P.R. Greening Potential of Derelict and Vacant Lands in Urban Areas. Urban For. Urban Green. 2016, 19, 128–139. [Google Scholar] [CrossRef]
  51. Aleksejeva, J.; Voulgaris, G.; Gasparatos, A. Assessing the Potential of Strategic Green Roof Implementation for Green Infrastructure: Insights from Sumida Ward, Tokyo. Urban For. Urban Green. 2022, 74, 127632. [Google Scholar] [CrossRef]
  52. Lu, M.; Jin, M.; Yan, Z. Evaluation of the Potential for Renewing Urban Vacant Land into Green Infrastructure. Landsc. Archit. 2024, 31, 81–88. [Google Scholar] [CrossRef]
  53. Census and Statistics Department. Table E489: Land Area, Mid-Year Population and Population Density by District Council District. 2023. Available online: https://www.censtatd.gov.hk/en/web_table.html?id=110-02001 (accessed on 1 September 2025).
  54. Jain, A.K.; Murty, M.N.; Flynn, P.J. Data Clustering: A Review. ACM Comput. Surv. 1999, 31, 264–323. [Google Scholar] [CrossRef]
  55. Gui, R.; Song, W.; Lv, J.; Lu, Y.; Liu, H.; Feng, T.; Linghu, S. Digital Elevation Model-Driven River Channel Boundary Monitoring Using the Natural Breaks (Jenks) Method. Remote Sens. 2025, 17, 1092. [Google Scholar] [CrossRef]
  56. Longley, P.A.; Goodchild, M.F.; Maguire, D.J.; Rhind, D.W. Spatial Analysis Online: A Guide to Geospatial Analysis in GIS. Available online: https://www.spatialanalysisonline.com/HTML/index.html (accessed on 1 September 2025).
  57. Solórzano, J.V.; Mas, J.F.; Gao, Y.; Gallardo-Cruz, J.A. Land Use/Land Cover Classification with U-Net: Advantages of Combining Sentinel-1 and Sentinel-2 Imagery. Remote Sens. 2021, 13, 3600. [Google Scholar] [CrossRef]
  58. Esri. ArcGIS Online Item. Available online: https://www.arcgis.com/home/item.html?id=e732ee81a9c14c238a14df554a8e3225 (accessed on 31 August 2025).
  59. Talha, M.; Bhatti, F.A.; Ghuffar, S.; Zafar, H. ADU-Net: Semantic Segmentation of Satellite Imagery for Land Cover Classification. Adv. Space Res. 2023, 72, 1780–1788. [Google Scholar] [CrossRef]
  60. Xie, X.; Ye, L.; Kang, X.; Yan, L.; Zeng, L. Land Use Classification Using Improved U-Net in Remote Sensing Images of Urban and Rural Planning Monitoring. Sci. Program. 2022, 2022, 3125414. [Google Scholar] [CrossRef]
  61. Preston, P.D.; Dunk, R.M.; Smith, G.R.; Cavan, G. Not All Brownfields Are Equal: A Typological Assessment Reveals Hidden Green Space in the City. Landsc. Urban Plan. 2023, 229, 104590. [Google Scholar] [CrossRef]
  62. Aram, F.; García, E.H.; Solgi, E.; Mansournia, S. Urban Green Space Cooling Effect in Cities. Heliyon 2019, 5, e01339. [Google Scholar] [CrossRef]
  63. Vickers, D.; Rees, P. Creating the UK National Statistics 2001 Output Area Classification. J. R. Stat. Soc. Ser. A (Stat. Soc.) 2007, 170, 379–403. [Google Scholar] [CrossRef]
  64. Zeng, L.; Li, R.Y.M.; Du, H. Modeling the Ecological Network in Mountainous Resource-Based Cities: Morphological Spatial Pattern Analysis Approach. Buildings 2025, 15, 1388. [Google Scholar] [CrossRef]
  65. Rousseeuw, P.J. Silhouettes: A Graphical Aid to the Interpretation and Validation of Cluster Analysis. J. Comput. Appl. Math. 1987, 20, 53–65. [Google Scholar] [CrossRef]
  66. Galalizadeh, S.; Morrison-Saunders, A.; Horwitz, P.; Silberstein, R.; Blake, D. The Cooling Impact of Urban Greening: A Systematic Review of Methodologies and Data Sources. Urban For. Urban Green. 2024, 95, 128157. [Google Scholar] [CrossRef]
  67. Kelleher, C.; Golden, H.E.; Burkholder, S.; Shuster, W. Urban Vacant Lands Impart Hydrological Benefits across City Landscapes. Nat. Commun. 2020, 11, 1563. [Google Scholar] [CrossRef] [PubMed]
  68. Lee, J.; Kweon, B.-S.; Ellis, C.D.; Lee, S.-W. Assessing the Social Value of Ecosystem Services for Resilient Riparian Greenway Planning and Management in an Urban Community. Int. J. Environ. Res. Public Health 2020, 17, 3261. [Google Scholar] [CrossRef]
  69. Dong, J.; Guo, R.-N.; Guo, F. Potential Assessment and Renewal Strategy for Regenerating Urban Abandoned Railways: The Case Study of the Dalian Locomotive Factory Railway Line. J. Nat. Resour. 2023, 38, 2672–2686. [Google Scholar] [CrossRef]
  70. Feng, S.; Hou, W.; Chang, J. Changing Coal Mining Brownfields into Green Infrastructure Based on Ecological Potential Assessment in Xuzhou, Eastern China. Sustainability 2019, 11, 2252. [Google Scholar] [CrossRef]
  71. Wen, H.Z.; Goodman, A.C. Relationship between Urban Land Price and Housing Price: Evidence from 21 Provincial Capitals in China. Habitat Int. 2013, 40, 9–17. [Google Scholar] [CrossRef]
  72. UN-Habitat. Developing Public Space and Land Values in Cities and Neighbourhoods; United Nations Human Settlements Programme: Nairobi, Kenya, 2015; Available online: https://unhabitat.org/sites/default/files/download-manager-files/Discussion%20Paper%20-%20Developing%20Public%20Space%20and%20Land%20Values%20in%20Cities%20and%20Neighbourhoods.pdf (accessed on 1 September 2025).
  73. Tang, B. Is the Distribution of Public Open Space in Hong Kong Equitable, Why Not? Landsc. Urban Plan. 2017, 161, 80–89. [Google Scholar] [CrossRef]
  74. Moroni, S. The Just City. Three Background Issues: Institutional Justice and Spatial Justice, Social Justice and Distributive Justice, Concept of Justice and Conceptions of Justice. Plan. Theory 2020, 19, 251–267. [Google Scholar] [CrossRef]
  75. Kim, M.; Rupprecht, C.D.D.; Furuya, K. Residents’ Perception of Informal Green Space—A Case Study of Ichikawa City, Japan. Land 2018, 7, 102. [Google Scholar] [CrossRef]
  76. Hong Kong Planning Department. Green and Blue Space Conceptual Framework. 2016. Available online: https://www.pland.gov.hk/file/planning_studies/comp_s/hk2030plus/document/Green%20and%20Blue%20Space%20Conceptual%20Framework_Eng.pdf (accessed on 1 August 2025).
  77. Krull, W.; Berry, P.; Bauduceau, N.; Cecchi, C.; Elmqvist, T.; Fernandez, M.; Hartig, T.; Mayerhofer, E.; Naumann, S.; Noring, L.; et al. Towards an EU Research and Innovation Policy Agenda for Nature-Based Solutions & Re-Naturing Cities; Publications Office of the European Union: Luxembourg, 2015; Available online: https://iris.uniroma1.it/handle/11573/777994 (accessed on 1 September 2025).
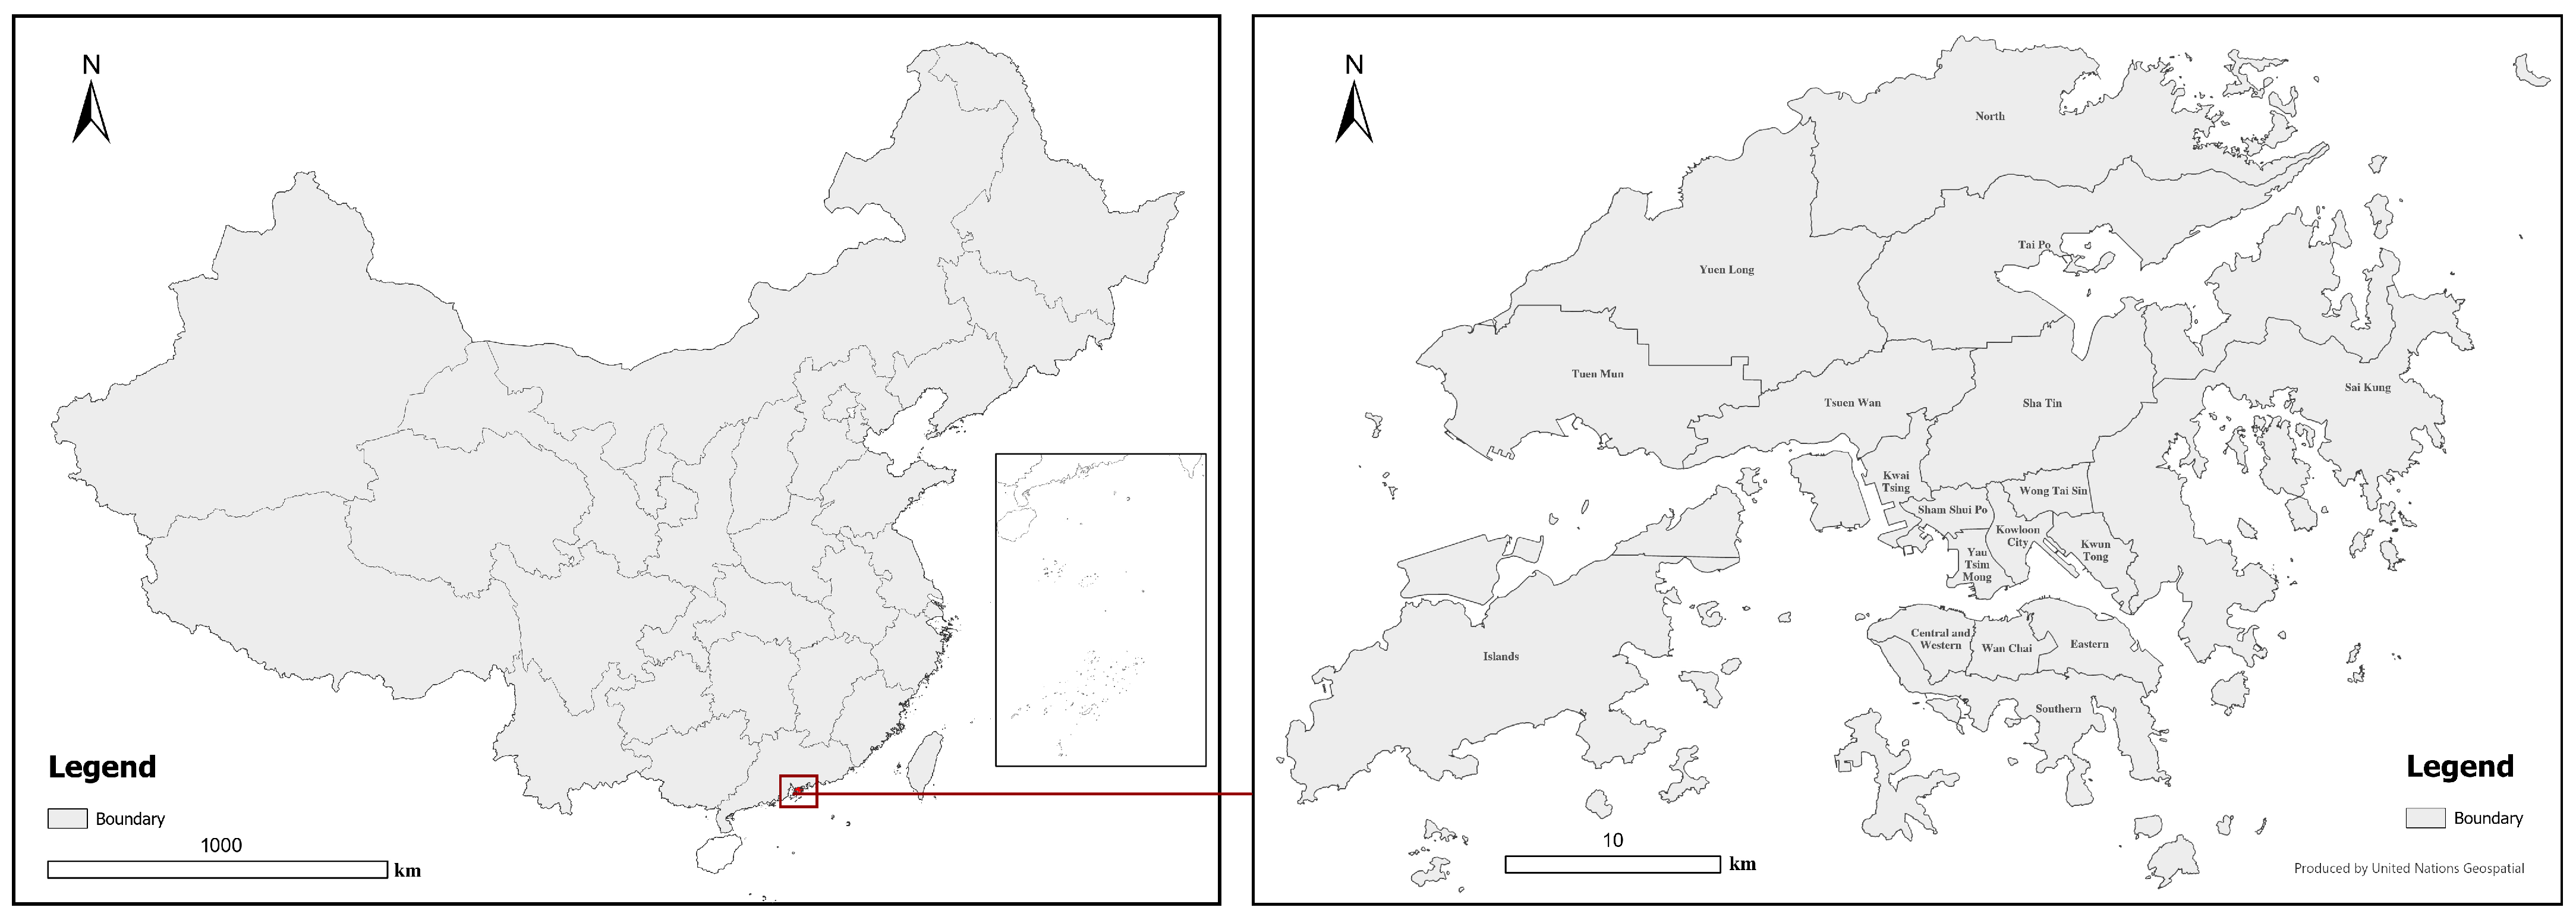
Figure 1. Study area.
Ijgi 14 00368 g001
Figure 2. Research workflow.
Ijgi 14 00368 g002
Figure 3. Distribution of IGSs in Hong Kong.
Ijgi 14 00368 g003
Figure 4. Urban Interstitial IGSs (Panel (a)), Transitional IGSs (Panel (b)), Fringe IGSs (Panel (c)), and Riparian IGSs (Panel (d)). A stacked bar plot of land cover proportions by the IGS types listed in Section 3.1. is also shown.
Ijgi 14 00368 g004
Figure 5. Benefits of overall IGSs.
Ijgi 14 00368 g005
Figure 6. Benefits of Urban Interstitial IGSs (Panel (a)), Transitional IGSs (Panel (b)), Fringe IGSs (Panel (c)), and Riparian IGSs (Panel (d)).
Ijgi 14 00368 g006
Table 1. GIS datasets and related sources.
TypeSource
Land utilization in Hong KongPlanning Department (https://www.pland.gov.hk/ accessed on 10 September 2024)
Landsat 8 remote sensing imageryNASA (https://www.nasa.gov/ accessed on 15 September 2024)
Public transportHong Kong CSDI Portal (https://portal.csdi.gov.hk accessed on 20 September 2024)
Educational infrastructureDATA.GOV.HK (https://DATA.GOV.HK/ accessed on 20 September 2024)
Commercial infrastructureDATA.GOV.HK (https://DATA.GOV.HK/ accessed on 20 September 2024)
Population densityHong Kong CSDI Portal (https://portal.csdi.gov.hk accessed on 20 September 2024)
Property valuation listDATA.GOV.HK (https://DATA.GOV.HK/ accessed on 21 September 2024)
Average incomeHong Kong CSDI Portal (https://portal.csdi.gov.hk accessed on 21 September 2024)
Table 2. IGS benefit evaluation system: indicator layer formulas and explanations.
Indicator LayerComputational FormulaExplanations
Gas Regulation E S V i = S k × V C k   E S V i   indicates different categories of ecosystem service values; S k   represents the area of land use type k ; and V C k refers to the ecosystem service value coefficient per unit area of land use type k .
Climate Regulation
Hydrological Regulation
Soil Conservation
Nutrient Cycling Maintenance
Biodiversity
Landscape Esthetics
Transit Accessibility I = Q / A The density of public transport stations within the evaluation unit, where Q is the total number of stations in the neighborhood, and A is the area of the evaluation unit.
Population Density D = W / A W denotes the population, and A represents the area of the evaluation unit.
Commercial Infrastructure f ^ x = 1 n h 2 i = 1 n K d x , x i h   f ^ x denotes the kernel density estimate at location x; n is the total number of points; h is the search radius; d x , x i represents the distance between location x and sample point X i ; K
is the kernel function.
Educational Infrastructure
Housing Value
Average Income I = D   D   denotes the per capita income of the area where the sampling unit is located.
Table 3. IGS benefit evaluation system.
Objective LayerCriteria LayerIndicator LayerWeight
Ecological Benefits
[52]
Regulating serviceGas Regulation0.1368
Climate Regulation0.1368
Hydrological Regulation0.0177
Supporting serviceSoil Conservation0.0344
Nutrient Cycling Maintenance0.0196
Biodiversity0.0381
Cultural serviceLandscape Esthetics0.0486
Social Benefits
[50,69,70]
Cultural Service PotentialTransit Accessibility0.1382
Human Activity IntensityPopulation Density0.0809
Commercial Infrastructure0.0731
Educational Infrastructure0.0369
Economic Benefits
[69,71]
Land ValueHousing Value0.1486
Market DynamicsAverage Income0.0901
Table 4. Benefits of different types of IGSs.
Benefits CategoryUrban Interstitial IGSsTransitional
IGSs
Fringe
IGSs
Riparian
IGSs
Average BenefitsGas Regulation0.02290.06550.09160.0582
Climate Regulation0.02010.06630.08800.051
Hydrological Regulation0.02110.06620.05400.0713
Soil Conservation0.02270.06550.09160.0581
Nutrient Cycling Maintenance0.02180.06540.09170.0584
Biodiversity0.02890.06600.08860.0826
Landscape Esthetics0.02430.06620.06780.0758
Transit Accessibility0.22350.05050.09850.0337
Population Density0.08600.01060.03060.0280
Commercial Infrastructure0.03160.00780.01600.0035
Educational Infrastructure0.17490.03610.07500.0354
Housing Value0.23900.18470.21300.1543
Average Income0.34170.34590.32030.3284
Unweighted Overlay of BenefitsEcological Benefits0.16180.46110.57330.4554
Social Benefits0.51600.1050.22010.1006
Economic Benefits0.58070.53060.53330.4827
Weighted Overlay of BenefitsAggregate benefits0.12270.09680.11770.0872
Table 5. Per capita provision of GI, IGSs, and their total (m2/person) in selected Hong Kong districts with low green space availability.
DistrictGI/PersonIGS/PersonCombined GI and IGS/Person
Kowloon City8.414.4612.87
Kwun Tong5.692.508.19
Sham Shui Po7.610.718.32
Wong Tai Sin8.480.849.32
Yau Tsim Mong5.490.926.41
Disclaimer/Publisher’s Note: The statements, opinions and data contained in all publications are solely those of the individual author(s) and contributor(s) and not of MDPI and/or the editor(s). MDPI and/or the editor(s) disclaim responsibility for any injury to people or property resulting from any ideas, methods, instructions or products referred to in the content.