Abstract
Cultural property includes immovable assets that are part of a nation’s cultural heritage and reflect the cultural identity of a people. Hence, information about armed conflict’s impact on historical buildings’ structures and heritage sites is extremely important. The study aims to demonstrate the application of Earth observation (EO) synthetic aperture radar (SAR) technology, and in particular Sentinel-1 SAR coherence time-series analysis, to monitor spatial and temporal changes related to the recent Russian–Ukrainian war in the urban areas of Mariupol and Kharkiv, Ukraine. The study considers key events during the siege of Mariupol and the battle of Kharkiv from February to May 2022. Built-up areas and cultural property were identified using freely available OpenStreetMap (OSM) data. Semi-automated coherent change-detection technique (CCD) that utilize difference analysis of pre- and co-conflict coherences were capable of highlighting areas of major impact on the urban structures. The study applied a logistic regression model (LRM) for the discrimination of damaged and undamaged buildings based on an estimated likelihood of damage occurrence. A good agreement was observed with the reference data provided by the United Nations Satellite Centre (UNOSAT) in terms of the overall extent of damage. Damage maps enable the localization of buildings and cultural assets in areas with a high probability of damage and can serve as the basis for a high-resolution follow-up investigation. The study reveals the benefits of Sentinel-1 SAR CCD in the sense of unsupervised delineation of areas affected by armed conflict. However, limitations arise in the detection of local and single-building damage compared to regions with large-scale destruction. The proposed semi-automated multi-temporal Sentinel-1 data analysis using CCD methodology shows its applicability for the timely investigation of damage to buildings and cultural heritage, which can support the response to crises.
1. Introduction
The provisions of the 1954 Hague Convention for the Protection of Cultural Property in the Event of Armed Conflict clearly state that cultural assets must not be the target of hostilities [1]. Emphasizing that the humanitarian catastrophe because of an armed conflict is much more serious, the protection of cultural heritage, historical monuments and arts is of great importance, since they are part of a nation’s identity and represent the historical development of a country. The ongoing armed conflict between Russia and Ukraine, which started in February 2022, threatens some centuries-old cultural property. In addition to seven (cultural) world heritage sites, Ukraine is home to a large number of historic city centers and cultural treasures. Their exposure to damage makes it crucial to provide evidence of the sites’ condition, to be ready for recovery, or to investigate allegations of war crimes [2]. Earth observation (EO) imagery is particularly effective for monitoring and assessing the state of cultural property in hostile situations where the locations are not accessible and on-site inspection is inhibited [3].
The United Nations Educational, Scientific and Cultural Organization (UNESCO) is committed, among other tasks, to safeguarding and preserving humanity’s cultural heritage. Since the beginning of the Ukrainian war, UNESCO has regularly published figures on destroyed cultural property throughout the country [4]. Damages are recorded by elaborately cross-referencing reported incidents with information from multiple sources. The United Nations Satellite Centre (UNOSAT), as part of the United Nations Institute for Training and Research (UNITAR), engaged in damage assessment based on EO data by visual interpretation of very high resolution (VHR) optical imagery [5]. Although the analysis of VHR optical data plays a fundamental role in the delineation of the impact caused by armed conflict, manual damage mapping takes a considerable amount of time and resources and may be limited in area. Furthermore, the availability of cloud-free VHR optical data after an event can cause limitations for visual analysis. Support for this vitally important task may arise from an effective change-detection (CD) methodology as an additional component in damage assessment related to armed conflict. A combination of CD with semi-automated data processing provides a pre-evaluation of the area of interest, giving important clues as to where to complement the optical investigation. CD methodology is particularly suited in the context of urban disaster monitoring, which could help analysts prioritize their activities and empower damage assessment procedures from optical imagery and the evaluation of incident reports.
CD with EO synthetic aperture radar (SAR) imagery has been investigated for rapid damage assessment in urban environments caused by natural hazards or military confrontation [6,7,8,9]. The main objective of such applications is the comparison of imagery collected over the same geographical location at different dates to discriminate changes to the built-up area, indicating destruction. Since active SAR-based satellites operate independently of weather conditions and time of day, they are advantageous over optical data in disaster-related applications, when timely monitoring is required [10]. Both incoherent and coherent methodologies using SAR data were described [11]. While incoherent methods typically compare the SAR backscattering intensity (amplitude) to identify scene changes, coherent change detection (CCD) utilizes both the amplitude and phase of the imagery. Coherence describes the similarity of the reflection properties between two SAR scenes acquired at different points in time [12]. Changes in, for example, surface conditions result in a decorrelation between the images, which is expressed by a decrease in coherence values [13]. Since coherent-based CD has the potential to identify even the smallest changes in the land surface through time, the technique promises high usability for damage assessment in urban areas affected by disastrous events. Some studies have successfully applied the difference of coherence between pre- and post-event image acquisitions as an indicator for delineating the areas affected by natural hazards [14,15] or found the level of coherence decreased related to the severity of building damages [16].
SAR-based damage mapping in urban areas has predominantly relied on VHR imagery with a spatial resolution to the sub-meter level [17,18,19,20]. Although such images enable a fine-grained analysis of building features as the primary target of investigation, on-demand high-resolution data usually comes at high costs and small area coverage, confining the approaches to single pre- and post or only post-event data. The European Space Agency’s (ESA) Copernicus Sentinel-1 mission provides freely accessible and timely available SAR images in a considerable spatial and temporal frequency and coverage. Several studies have showcased the benefits of using Sentinel-1 data over commercial VHR imagery to monitor building damage caused by armed conflict due to their capacity to map on a regular, short time interval [21,22,23]. The availability of a consistent and frequent time series of image acquisitions offers an opportunity to apply multi-pair CD approaches for the systematic, repeated monitoring of building structures and cultural assets. Temporal analysis could visualize a chronological sequence of impact locations and provide evidence of whether damage occurred within a specific time window [21].
However, damage detection from SAR data alone can be challenging, since limitations arise due to, for example, the side-looking geometry of SAR sensors and seasonal changes or snow cover on the ground, which may produce a high degree of false positives in the results [14]. Several authors have sought to achieve improvements in damage detection related to armed conflict by integrating Sentinel-1 data with Sentinel-2 optical sensors [24,25,26]. A promising approach was pursued by [27], who visualized the structural damage caused by missile strikes by analyzing Sentinel-2 and the near-infrared (NIR) range of the spectrum. Ref. [6] combined fire indices derived from the Sentinel-2 NIR band for mapping burnt areas with the CCD of urban buildings. Despite the high revisit frequency of a single Sentinel-2 satellite of 10 days and, with two satellites, the combined constellation of 5 days, the optical images were compromised by dense cloud cover throughout the weeks after the Russian invasion. This prevented a full investigation of the selected areas of interest and the detection of potential damage related to the time windows chosen for this study. In contrast, the availability of Sentinel-1 data with a temporal resolution of at least 12 days allowed for analyzing changes based on a consistent time series of regular intervals both pre- and co-conflict.
The aim of this study is to evaluate the applicability of medium-resolution Sentinel-1 SAR images to detect and assess the damage to buildings and cultural property in urban areas during an ongoing armed conflict using CCD methodology. We investigate if multi-temporal coherence change analysis can highlight significant impacts on building structures and cultural assets and enable approximating overall damage. We address the question of whether coherence change can serve as a proxy variable for building damage analysis. We applied logistic regression as a widely used method for binary classification [28]. It enables the evaluation of the functional relationship between explanatory variables and a categorical outcome, such as “yes” versus “no” or “damaged” versus “undamaged” and uses this relationship to estimate class probabilities [29]. We create a logistic regression model (LRM) to determine the likelihood of damage or collapse of buildings and cultural property as a function of the observed loss of coherence as an independent spatial proxy variable. The damage observations to be used as a training dataset to fit the LRM were obtained by visual inspection and manual tagging of building samples based on Google satellite imagery with high spatial resolution showing the extent of damage on 9 May 2022. Although high spatial resolution imagery is essential for effectively detecting changes on the building level in dense urban environments, the study aims to demonstrate the capability, strengths, and limitations of medium spatial resolution Sentinel-1 SAR imagery with broad spatial coverage (250 km swath) and high temporal resolution for keeping track of dynamic changes caused by armed conflicts. To counter limitations from the spatial resolution of the Sentinel-1 data and to increase the potential of urban area monitoring, we include free OpenStreetMap (OSM) data to relate changes that occurred at different points in time explicitly to buildings and heritage sites [13,24,30]. The estimated damages are compared with independent damage assessment data published by UNOSAT and with UNESCO-verified damaged cultural sites to assess the usability and reliability of Sentinel-1 SAR coherent time-series analysis to distinguish impact areas over time and approximate total damage.
2. Materials and Methods
2.1. Study Sites
On 24 February 2022, Russia launched a large-scale military attack on the national territory of Ukraine. The rapid advance of Russian ground troops and numerous air strikes within a few weeks after the invasion caused significant damage to the physical infrastructure of cities primarily in the east and south of Ukraine [31,32]. We have chosen the cities of Mariupol and Kharkiv, which are important cultural centers in Ukraine, as our study areas (Figure 1). The study considers the timeline of events during the first three months of the conflict, including the capitulation of Mariupol and the temporary withdrawal of Russian troops from Kharkiv city in mid-May 2022.
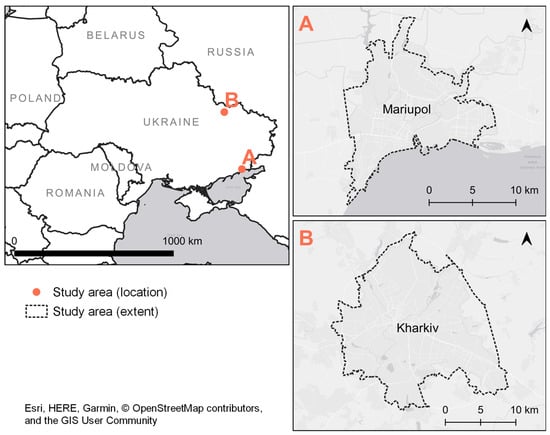
Figure 1.
Locations of the study sites in Ukraine. (A) Mariupol study area; (B) Kharkiv study area. Basemap provided by © 2024 Esri; © 2024 EuroGeographics/Eurostat for administrative boundaries.
Mariupol is located in Donetsk Oblast along the shore of the Sea of Azov and was an important port and university town with far more than 400,000 inhabitants until the Russian siege on 24 February 2022. As a result of continuous and heavy attacks, almost all major public buildings, as well as the majority of residential buildings and several churches in the city, were severely damaged or destroyed [33]. One of the most noticeable incidents was the bombing of the drama theater on 16 March 2022.
Kharkiv is the second largest city in Ukraine, with approximately 1.4 million inhabitants, and is located in the northeastern part of the country. As a home to universities and many cultural and religious sites, the city developed to become an important cultural, scientific, and educational center. Kharkiv was part of the first Eastern Ukraine offensive and allegedly suffered significant damage by the end of April 2022 [34]. Updated satellite imagery from Google Earth captured on different dates between February and May 2022 has revealed the extent of the damage in both cities. While Mariupol was showing destruction on a large scale across the entire city area, Kharkiv seemed to be affected more locally, with damage mainly on the single-building level. This preliminary assessment is supported by VHR optical image analysis published by the UNOSAT program [35,36]. Therefore, the selected sites provide the opportunity to compare the CCD methodology and the results of the present study in areas that suffered impact to varying degrees by the fighting and bombing.
2.2. Sentinel-1 SAR Data
Sentinel-1 scenes were accessed through the Alaska Satellite Facility provided by the NASA Earth Science Data and Information System (ESDIS) project [37]. Sentinel-1 carries a C-band (~5.6-centimeter wavelength) and consists of two polar-orbiting satellites, Sentinel-1A (launched in 2014) and Sentinel-1B (launched in 2016 but suffering equipment failure in 2021). Hence, only Sentinel-1A scenes were available for this study. All the images were downloaded as single-look complex (SLC) products with VV (radar pulse transmitted vertically and received vertically by the radar antenna) and VH (radar pulse transmitted vertically and received horizontally by the antenna) and in the interferometric wide swath (IW) mode, which captures data with a 250 km swath and is comprised of three sub-swath images using the terrain observation by progressive scans (TOPS) SAR mode [38], at 5 m (in range) × 20 m (in azimuth) spatial resolution, and in the ascending flight direction (satellites fly from south to north). The SLC products were selected, as it preserves information related to the phase, which is necessary to produce coherent products. All scenes were acquired with identical imaging geometries for each study area, such as the same relative orbit and pass direction. Table 1 provides an overview of the imagery used for this study, including the key acquisition parameters of each dataset.

Table 1.
Acquisition parameters of Sentinel-1 datasets. IW = interferometric wide swath, SLC = single look complex, VV = vertical–vertical polarization, VH = vertical–horizontal polarization.
We followed the processing steps suggested by [39] to obtain a coherence map from each pair of Sentinel-1 SAR SLC datasets (Figure 2). Only VV polarization was used as the input image for pre-processing, as it should provide clearer results when analyzing urban features [40]. First, we created image stacks by applying standard processing steps, such as the TOPSAR split function, to select only the sub-swath covering the area of interest, correction of the orbit state vectors for each image to provide accurate satellite position and velocity information, co-registration of two SAR images using the SRTM 1-Arcsecond digital elevation model (DEM) [41] for back-geocoding and ensuring pixel alignments within each two images [42], and the correction of the shift in the azimuthal direction using the enhanced spectral diversity function [43]. Next, coherence estimation was conducted to represent the absolute value of the cross-correlation index between each two SAR images (cf. 3.1) followed by TOPSAR deburst correction to recombine the selected sub-swaths and the multi-looking operation to reduce speckle noise by 8 range and 2 azimuth looks, as recommended in the literature [39], to increase the signal-to-noise ratio. As a last step, the images were topographically corrected using the SRTM 3-Arcsecond (~90 m) digital elevation model. All the pre-processing steps were performed using the open-source ESA Sentinel Applications Platform (SNAP) Version 9.0.0 for Windows and ESA Sentinel-1 Toolbox (S1TBX) Version 9.0.4 [44].
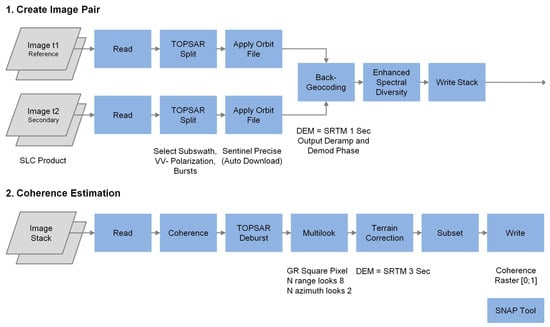
Figure 2.
Pre-processing workflow of Sentinel-1 SAR data.
Coherence maps were produced for each consecutive pair of images in the time series (image t1 and image t2, image t2 and image t3, …, image tn and image t(n+1)), starting with the first pair consisting of two pre-conflict images and the second pair consisting of the image right before the Russian invasion and the first co-conflict image. In total, four coherence maps were created from the five selected images for each study area, with the first coherence map representing the pre-conflict situation and three further coherence maps revealing the surface changes throughout the armed conflict. An additional coherence map (Cohtot) was calculated from the second pre-conflict image t2 as a reference and the last co-conflict scene t5 as a secondary image with a temporal baseline of 96 days spanning the entire investigation period. Table 2 shows the image pairs’ configuration, the temporal baseline between image acquisitions, and statistical parameters extracted for the built-up area based on OSM building outlines. Following [30], the average coherence values for the built-up area range between 0.5 and 0.7 in the pre-conflict time interval. Particularly notable is the significant decline in the mean coherence Coh3 derived from Mariupol for the third time window and the overall weak correlation for mean coherence Cohtot of around 0.38. In contrast, the estimated mean coherences for the Kharkiv built-up area show a moderate correlation independent from the time window. This allows for initial conclusions regarding the extensive structural changes occurring in Mariupol, in addition to the potential effects caused by seasonal changes or increased temporal baseline.

Table 2.
Coherence estimates and statistical parameters extracted for the built-up areas in Mariupol and Kharkiv.
2.3. Open GIS Data
To focus the analysis on the built-up area and individual cultural property features as critical elements of monitoring and damage assessment, we used OSM, an online and crowd-sourced database of geographic information, to derive building footprints and cultural property locations within the study areas. A free repository was downloaded from [45], which contained OSM data as of 28 December 2022. The subnational administrative boundaries of Mariupol and Kharkiv were obtained from the Humanitarian Data Exchange (HDX) platform, with contribution by the OCHA Field Information Services Section [46]. The extracted OSM building outlines indicated at least 56,785 structures in Mariupol city and at least 86,871 structures in Kharkiv. We performed, on a test basis, a visual examination which, in line with the studies of other authors such as ([7,24]), revealed some gaps in the OSM layer compared to the building stock visible in Google satellite imagery.
We conducted a damage assessment in line with the definition of cultural property given in Article 1 of the 1954 Hague Convention [1]. Among others, this includes immovable property, such as religious sites, monuments of historical, architectural, or artistic interest, and memorials. Table 3 presents the counts of cultural assets located within the city areas of Mariupol and Kharkiv, respectively. The locations of cultural assets were derived from the GIS-ready OSM layers representing building outlines, places of worship, and points of interest (POI), both mapped as point locations. The datasets were filtered according to the feature types listed in Table 3. The filtered point features intersected with the building outlines to separate cultural assets from the rest of the building structures. Cultural property like artwork, monuments, and memorials were not necessarily included in the building outlines dataset and were used in the analysis as point information. The identified cultural heritage sites were assigned to three groups, namely religious sites, cultural sites, and educational sites. Although educational sites, such as schools, colleges, and universities, are not explicitly mentioned in the 1954 Hague Convention definition of cultural property, we included them as important places of heritage education, as well as, buildings of potential historical interest.

Table 3.
Cultural property sites were identified based on the OSM dataset.
Based on the used OSM data, a total of 306 cultural property locations were identified in Mariupol city and 831 cultural assets in the Kharkiv area. Since we did not perform an in-depth quality check of the OSM data, the resulting dataset of heritage sites may be considered incomplete or not entirely accurate.
3. Damage Detection Methodology
Figure 3 shows an overall workflow to perform a damage assessment based on CCD combined with coherence difference calculation and damage probability estimation. First, we created a time series of coherence maps that allowed for the analysis of the coherent changes that occurred between several images acquired at the beginning of the armed conflict. We then calculated the amount of coherence loss by stepwise subtracting two coherence maps representing successive time intervals. In the next step, we analyzed the changes in the built-up areas by combining the different images with the OSM building footprints and the cultural property locations. We show the relationship between loss of coherence and the occurrence of damage by performing a logistic regression and using the results of the model to highlight the affected areas over time and estimate the total damage.
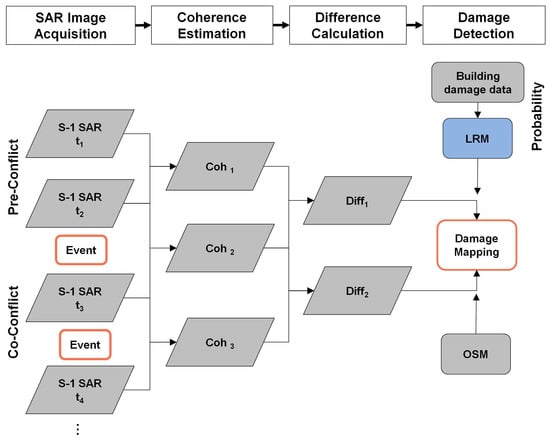
Figure 3.
Schematic workflow of the damage detection methodology.
3.1. SAR Coherence Estimation
Coherence is a measure of pixel-wise correlation and shows whether there is a strong similarity between two time-lapsed SAR images serving as a reference and a secondary image of the same geographic area [42]. It is expressed as the complex correlation coefficient according to Equation (1) [13]:
where c1 and c2 are the corresponding complex pixel values of the reference and secondary images, the notation * refers to the complex conjugate of c, and E indicates the expectation value estimated from the data with a certain window size. The size of the averaging window to calculate coherency affects the sensitivity of the results [13]. The coherence ranges on a normalized scale, with values from 0 (completely uncorrelated) to 1 (completely coherent). Areas of high stability such as built-up areas usually show a strong correlation with a similar reflection of the radar signal through time (hence, the coherency is equal to 1). A weak correlation is typical for vegetated areas undergoing seasonal changes, which show poor coherence, i.e., considerable decorrelation, even on a short timescale.
Potential loss in coherence can be associated with three major factors [13,14,47]:
with thermal decorrelation caused by random noise added to the radar measurement. However, the effect is neglectable when radar signals are acquired by the same antenna [14]. Coherence loss due to spatial separation caused by deviating positions of the SAR sensor during image acquisition can be (partially) eliminated by choosing scenes from the same relative orbit. Temporal decorrelation reflects surface changes related to natural processes between two SAR image-acquisition dates that cannot be avoided. In this context, coherence loss may be caused by seasonal effects, such as frost periods or snow cover, but also vegetation changes.
Under the temporal aspect, decorrelation is also caused by the time lag between two image acquisitions [48]. Usually, increasing temporal separation will lead to a decrease in coherence. With our coherence maps spanning at least 24 days between the co-conflict acquisitions, decorrelation will be related to additional effects, in addition to building damages such as agriculture or vegetation growth in urban green areas. We seek to improve our results by focusing further analysis on the building outlines derived from OSM. This way, surface changes caused by natural processes affecting afforested areas, agriculture, and green spaces unrelated to the urban structures shall be suppressed [13,24].
Figure 4 shows the pre-conflict coherence maps for Mariupol and Kharkiv city areas, which serve as a reference for the coherence variation prior to the armed conflict. Sentinel-2A and Sentinel-2B optical images used to visualize the study areas’ structure were downloaded through the Copernicus Open Access Hub [49]. For coherence, we chose a color ramp with green to red colors showing a strong (green colors, ~0.75), moderate (yellow colors ~0.5), and weak (red colors, ~0.25) correlation, i.e., the similarity between two images [14]. Built-up areas of high stability (high-value coherence) are displayed in green colors and are clearly distinguished from surrounding vegetated areas in red colors, which changed significantly. However, comparing the results shows that the Kharkiv built-up area has overall lower pre-conflict coherence values than Mariupol (Figure 4).
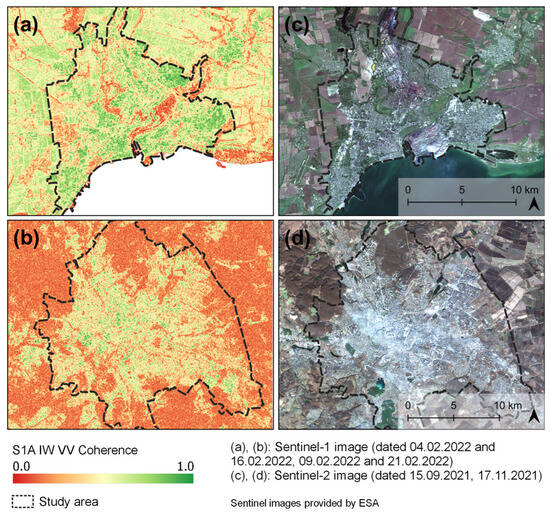
Figure 4.
Sentinel-1 pre-conflict coherence maps. (a) Mariupol, estimated from the image pairs 4 and 16 February 2022; (b) Kharkiv, estimated from the image pairs 9 and 21 February 2022. RGB composites of Sentinel-2 show the structure of the respective area. (c) Mariupol, acquired on 15 September 2021; (d) Kharkiv, acquired on 17 November 2021. Sentinel images: ESA.
3.2. Coherence Difference Calculation
In the present study, coherent change detection relies on the idea that the impact of a military confrontation causes extensive damage to the building structure and results in a temporal decorrelation of coherence for a specified location. Subsequently, the pixel-wise comparison of the pre- and co-conflict coherence maps, expressed as the coherence difference , enables the detection of destruction areas. The coherence difference was calculated in a classic way, as given in Equation (3):
where represents the coherence obtained from a pre-conflict image pair or a preceding time interval (t1 and t2), and represents the coherence obtained from a co-conflict image pair or subsequent time interval (t2 and t3). The coherence difference values cover a range between −1 (i.e., coherence gain) to +1 (i.e., coherence loss).
Changes associated with structural damage caused by the armed conflict manifest in positive difference values when the coherence of the second image pair is lower compared to the coherence of the preceding image pair [16]. We applied this principle to the time series of four respective coherence maps calculated from the collected pre- and co-conflict Sentinel-1 imagery given in Table 2 and obtained three difference images per study area. An additional difference image was calculated from the first. Hence, the pre-conflict coherence Coh1 and the overall coherence Cohtot spanning the entire investigated timeframe from February to May 2022 were applied for the parameterization of a logistic model used for damage discrimination.
4. Logistic Regression Analysis
In the present study, a key assumption is that the presence or absence of building damage is related to the amount of coherence loss. The choice of data analysis technique should allow for finding the relationship between these two data factors. The aforementioned logistic regression is a common method used to estimate class probabilities on a binary range from zero to one. It is used to determine the likelihood of buildings being damaged or undamaged, providing meaningful and interpretable analysis outputs.
Several authors, like [50,51], successfully used LRM to assess the damage vulnerability of urban structures towards natural hazards. Ref. [52] predicted the level of heritage building decay depending on various building properties. The principle of logistic regression is to model a binary target variable where can only take the values of 0 or 1 as the two possible states (e.g., 0: “undamaged” and 1: “damaged”) [53]. A logistic model is based on the logistic regression function. We are interested in the probability P of an outcome being true given a set of independent variables , expressed as in Equations (4) and (5):
where is the damage probability, z is the so-called logit, which represents a linear regression model with as the independent variables, as the regression beta coefficients, and as the error value. A positive indicates that increasing the value of is associated with an increasing probability of . With logistic regression, an s-shaped function curve is fit to the data, following a sigmoid function and running asymptotically towards and . The values of the logistic function are interpreted as the likelihood that a building was damaged or destroyed.
4.1. Sample Data
Fitting an LRM requires training data and spatially independent test data to evaluate model performance. Figure 5 shows the workflow for the logistic regression analysis. Figure 5 left shows the overlay of the OSM building outlines and the pixel-wise coherence difference ΔCohtot (16 February 2022 to 23 May 2022) to derive the mean coherence difference per building as an independent variable of the LRM. The light-to-dark red color indicates an increasing coherence difference and, thus, a loss of coherence. Figure 5 right shows the locations of the manually tagged building samples. Points in red color represent buildings categorized as damaged. Points in black color represent buildings categorized as undamaged.
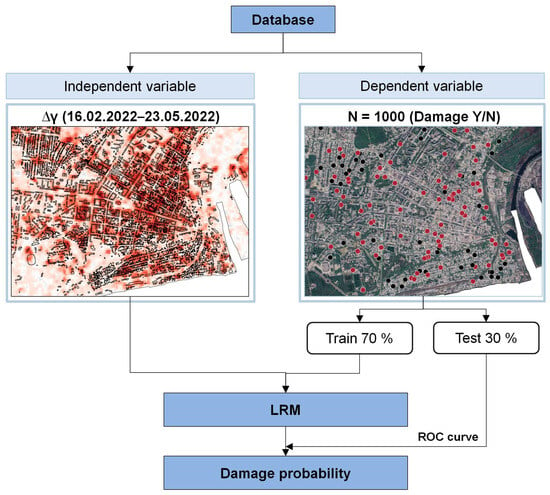
Figure 5.
Schematic representation of the workflow for the logistic regression analysis. (Left): red areas show pixel-wise coherence difference calculated as ΔCohtot = Coh1 (4 February 2022–16 February 2022) − Cohtot (16 February 2022–23 May 2022). (Right): points represent locations of manually tagged building samples. Points in red color: damaged (Y). Points in black color: undamaged (N).
We used an updated Google satellite image available for the Mariupol area to generate our own set of damage reference data as input for model development. Since the mentioned satellite images depict the extent of damage on 9 May 2022 according to Google Earth, we used coherence difference ΔCohtot calculated from Mariupol pre-conflict coherence Coh1 and co-conflict coherence map Cohtot for model training. We created a random sample of 1000 buildings spread across the entire city area of Mariupol by overlaying the OSM building outlines with the Google satellite imagery. After the visual inspection, we mapped the damaged or undamaged state of the sampled buildings. The damage to the buildings was determined on the basis of debris around the building; partial collapse of the roof, indicated by dark spots on the rooftops; or complete collapse, i.e., the building structure was no longer recognizable (Figure 6a–c). We categorized buildings as undamaged if they appeared to be structurally intact, e.g., if the roof appeared intact and no debris was visible (Figure 6d). However, the buildings may have suffered damage that could not be recognized on vertical satellite imagery. The sample dataset contained 396 points classified as damaged and 604 points classified as undamaged buildings. Slightly degraded optical images due to light clouds or other limiting factors could have influenced the visual damage assessment. As a result, the reference data may not be as accurate as the damage data obtained from on-site inspection. To determine the reference damage data associated with the estimated coherence loss, we performed zonal statistics in QGIS software version 3.10.8-A Coruña to calculate the average coherence difference for each building footprint. For cultural assets that were only carried as point locations, the average coherence difference was calculated with a 25 m buffer area, considering Sentinel-1 SLC pixel size.
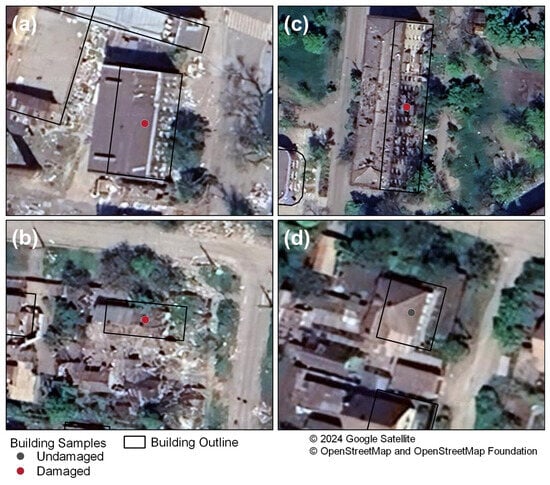
Figure 6.
Image examples interpreted during the visual damage survey. (a–c) Building samples classified as damaged; (d) Building sample classified as undamaged based on visual interpretation of the satellite imagery provided by © 2024 Google. OSM data: Geofabrik GmbH.
4.2. Model Calibration
The statistical analysis was carried out in RStudio version 2022.02.3+492. We partitioned the reference dataset, choosing a split ratio of 70:30, meaning we randomly sampled 70% of the dataset for training and 30% for testing purposes, respectively. Logistic regression is a specific form of the generalized linear model (GLM), which can accommodate for a wide range of distributions, such as binomial, and is implemented in the R package Stats as a glm() function [53,54,55] as follows:
where the response variable is the binary target variable (damaged = 1, undamaged = 0), and the so-called predictor is the independent variable (mean coherence difference). In the present case, we built the logistic model with a single predictor (explanatory variable). Table 4 presents the model summary output, including the confidence levels for the estimated model parameters. The positive sign of the predictor’s coefficient, as well as the magnitude, implies a strong positive correlation, meaning that the likelihood of observing damage significantly increases with an increase in coherence loss.
glm(response ~ predictor,family = binomial(link = “logit”),data)

Table 4.
Logistic model summary and regression parameters.
The model was applied to the test dataset to estimate the probability that a building is damaged at a given difference in coherence and, hence, coherence loss. Figure 7 visualizes the results as predictions across the range of coherence difference values derived from the test dataset. The observations of undamaged or damaged buildings are shown along the y = 0 and y = 1 lines. The grey lines identify the pointwise 95% confidence interval.
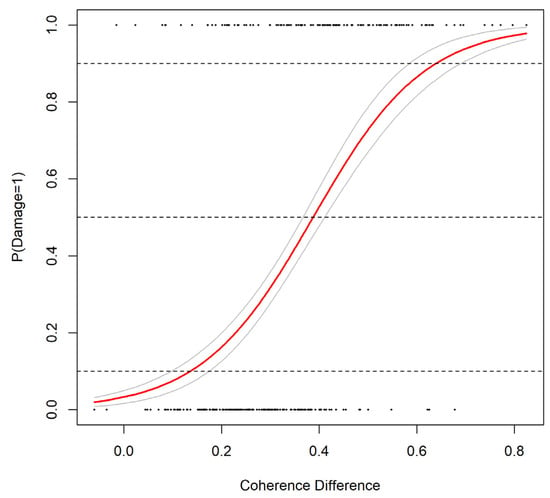
Figure 7.
Estimated probability for damage occurrence = 1 (“yes”, red line) on a scale from 0 to 1 (0 to 100%). Upper and lower 95% confidence intervals (grey lines). Dashed lines indicate 0.1, 0.5 and 0.9 damage probability. Points: observations.
4.3. Model Performance Evaluation
The predictive performance of the model was evaluated by the area under the receiver operating characteristic curve (AUC) using the R package pROC [56]. We chose AUC as a standard measure because it is independent of a previously selected classification threshold and summarizes overall model performance over all possible thresholds [57]. AUC values range on a scale of 0 to 1, with a value of 0.8 or higher attributing a generally good performance, whilst a value of 0.5 is considered a classifier worse than a random estimate. A comparison of AUC for the training and test datasets showed the logistic model achieved a value of 0.80 for the training dataset and slightly decreased for the test dataset, to 0.78, which seems an overall acceptable discrimination of the data. We classified the predicted values based on an optimal 0.49 cut point, which produced the highest AUC for the test dataset.
We then produced a confusion matrix using R package caret [58], computing several performance metrics. The overall classification accuracy achieved about 76%. Among the buildings that appeared to have remained undamaged, 150 out of a total of 171 were predicted correctly, which corresponds to a specificity of about 88%. This results in a low false-positive rate of about 12%, representing the proportion of buildings incorrectly classified as damaged although they seemed intact. For the buildings where damage was recorded, 77 out of a total of 129 were correctly classified, which corresponds to about 60% correct predictions, i.e., sensitivity. It is worth mentioning that, in the context of damage detection and monitoring of potential threats to buildings and, in particular, cultural properties, we may be more concerned with improved sensitivity, hence, a higher true positive rate, to miss out on less damage. Therefore, we suggest considering a lower probability threshold, hence, accepting a higher rate of false alarms rather than overlooking potentially damaged buildings and not taking any further action.
4.4. Evaluation Based on UNOSAT Data
We calculated the model output for all OSM building structures identified in Mariupol and Kharkiv and applied the binary threshold classification to distinguish between undamaged and damaged locations. The predicted damage sites were plotted with UNOSAT reference data to assess the overall plausibility and compare the spatial distribution patterns [21]. We identified a mismatch between the UNOSAT points and the building footprints in all cases, which complicated the comparison of the results. We filtered UNOSAT damage locations by excluding points outside the study areas and only points representing “destroyed”, “severely damaged”, “moderately damaged”, and “possibly damaged” structures were used. Each reference dataset represents the combined damages derived from repeated visual inspection carried out by UNOSAT between 14 March 2022 to 12 May 2022 in Mariupol and 24 April 2022 to 15 June 2022 in Kharkiv, respectively. Whereas UNOSAT damage assessment for Kharkiv covered the entire city area (Figure 8), the analysis for Mariupol was limited to two residential areas, Livoberezhnyi and Zhovtnevyi district, including the city center (Figure 9). We, therefore, extracted the OSM building data and model outputs based on the given district boundaries.
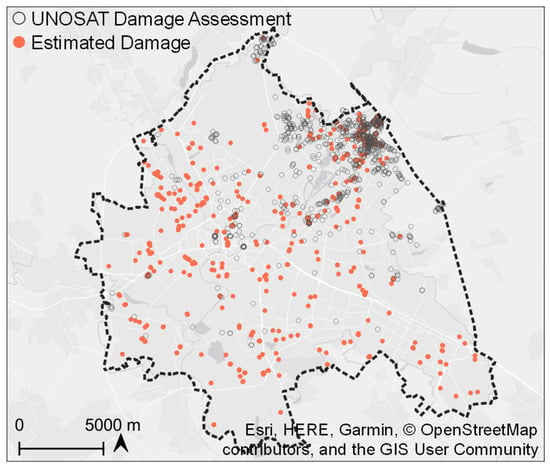
Figure 8.
Comparison of estimated building damages with UNOSAT visual damage assessment, Kharkiv. Basemap provided by © 2024 Esri.
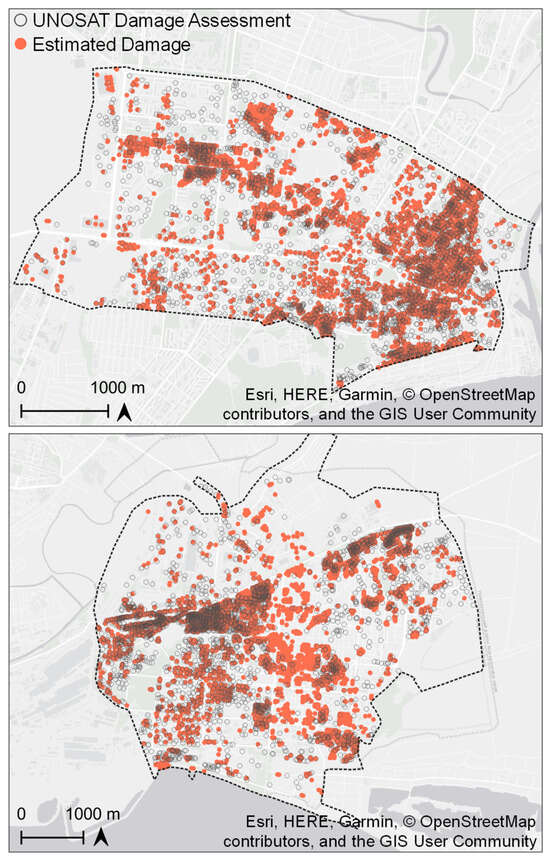
Figure 9.
Comparison of estimated building damages with UNOSAT visual damage assessment, Mariupol. Basemap provided by © 2024 Esri.
The OSM dataset indicates at least 86,871 structures in the Kharkiv area and 17,161 structures in the two selected city districts of Mariupol. Based on the building stock, UNOSAT reported that less than 1%, or 748, of the buildings in Kharkiv were affected, whereas in Mariupol about 32%, or 5647, of the structures sustained visible damage. This compares with our predicted damage rate of about 0.7% (610 buildings) for Kharkiv and about 39% (6974 buildings) for the two Mariupol districts over the same time period. For the entire city area of Mariupol, we classified 17,742 structures as damaged out of a total of 56,785, which represents about 31% of the built-up area.
A visual inspection of the major discrepancies between the results in Mariupol revealed our predictions to be consistent with the building destruction that is clearly visible in the corresponding Google satellite imagery. These deviations are probably due to the time intervals selected by UNOSAT to illustrate damage mapping, where parts of the data only represent the results from an earlier analysis dated 14 March 2022. For the Kharkiv area, our findings quite agree with UNOSAT about the overall extent of the damage, although the results indicate an underestimation compared to the manually tagged damages. The damage is predominantly identified in residential areas towards the northeastern outskirts of the city. The settlement structure in this area is reflected by small buildings lined up along roads and embedded in agricultural and afforested areas. This could influence the results in terms of Sentinel-1 spatial resolution, which makes damage detection at the individual building level more difficult and seems more aimed at delineating affected neighborhoods. However, both analyses detected hotspots throughout the city center, particularly in the vicinity of Freedom Square.
5. Damage Mapping Results
The output of the LRM is an estimated probability for damage at a location ranging on a continuous scale from zero to one, i.e., 0% to 100% probability. Instead of applying the single threshold cut point of 0.49, splitting buildings into fixed categories of damaged and undamaged, our method enables the full likelihood information that enables main users to individually evaluate the damage risk and prioritize affected sites for further investigation.
5.1. Overall Building Damage and Impact on Cultural Property
In Mariupol, the siege led to widespread destruction in entire districts, such as the city center, the Livoberezhnyi residential district, the Azovstal industrial site, the Southern Prymorskyi residential district, and the Mariupol port area. Table 5 summarizes the estimated damage probabilities for building structures and cultural heritage sites that were affected by 23 May 2022. The OSM dataset indicates at least 56,785 buildings. Considering a predicted damage probability greater than 40%, about 22,667 buildings have most likely suffered partial or full damage. This represents about 39.9% of the structures. Three hundred and six locations were extracted from the OSM dataset, reflecting the given cultural property definition, including buildings, as well as point features such as memorials, monuments, or locations labeled as artwork. Based on the estimated damage probability, 125 of these sites were afflicted with a veritable risk for structural damage or destruction between February and May 2022. This represents about 40.8% of the identified heritage sites.

Table 5.
Damage probabilities estimated for buildings and cultural property, Mariupol. Estimates are based on the coherent change detection between 16 February 2022 and 23 May 2022.
Figure 10 shows the extent of the building damage throughout the Mariupol city area, highlighting areas with large-scale destruction. The estimated damage probabilities per building are visualized as points based on the building centroids. The color variation from light red to dark red indicates increasing coherence loss and, related to the building structures, an increasing probability of damage. The overlying randomly numbered labels represent the locations of cultural heritage sites in the city area with a damage probability higher than 20%. The damage predictions were derived based on the pixel-wise coherence difference calculated from pre-conflict coherence Coh1 and co-conflict coherence Cohtot, which is displayed as background color. The pixel-based coherence change shows large areas of coherence decrease outside the built-up area, which is related to, for example, vegetation change. We therefore included the OSM data to alleviate such effects.
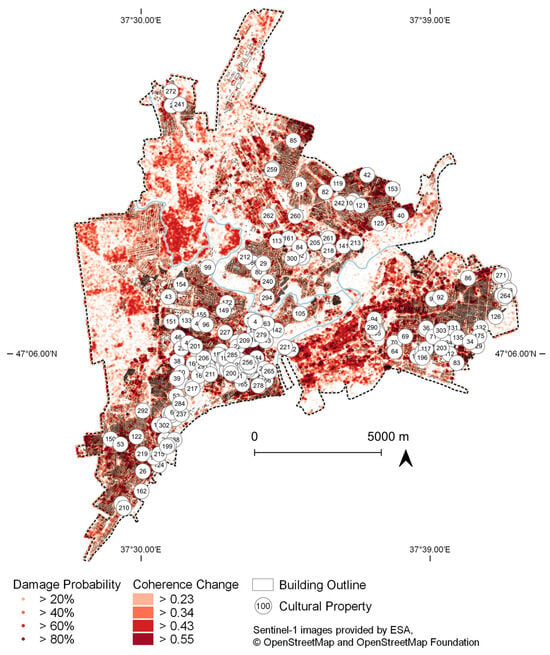
Figure 10.
Mariupol damage proxy map for the time period February to May 2022. Predicted damage probabilities > 20% are visualized based on building centroids. Numbered labels represent affected cultural property. Pixel-wise coherence change (4 February 2022–16 February 2022 to 16 February 2022–23 May 2022) was colored according to probability thresholds. OSM data: Geofabrik GmbH. Sentinel images: ESA.
Compared to the large-scale damage in Mariupol, the city of Kharkiv appears to have been less affected in the first months of the armed conflict, as shown by the results of CCD and damage probability estimation. Table 6 presents the estimated damage probabilities for building structures and cultural heritage sites. The OSM dataset indicates at least 86,871 structures for the Kharkiv study area. Here, about 1243 buildings are associated with a considerable likelihood of damage > 40%. This represents about 1.4% of the structures. A total of 831 cultural, religious, and educational sites were extracted from the OSM dataset. A small portion of eight heritage sites, which correspond to less than 1% of the cultural assets in the city area, were predicted to have a damage probability of >40%.

Table 6.
Damage probabilities estimated for buildings and cultural property, Kharkiv. Estimates are based on the coherent change detection between 21 February 2022 and 28 May 2022.
Figure 11 shows the corresponding damage map. In Kharkiv, the damage is seen to be predominantly detected in residential areas towards the northeastern outskirts of the city, as well as several hotspots throughout the city center, such as in the vicinity of Freedom Square.
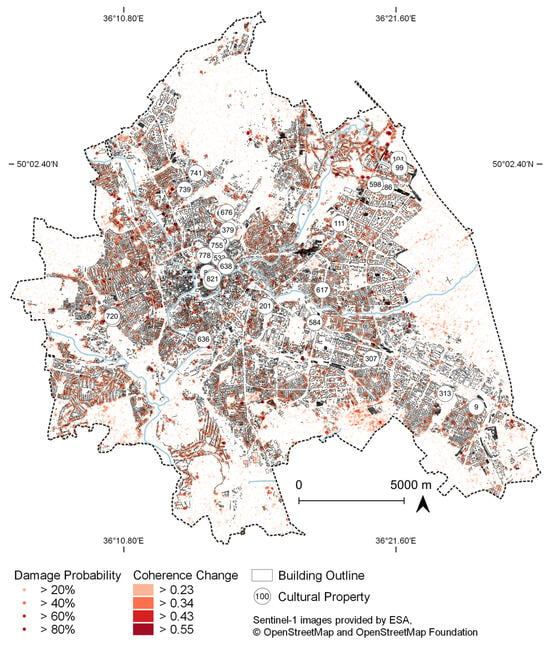
Figure 11.
Kharkiv damage proxy map for the time period February to May 2022. Predicted damage probabilities > 20% are visualized based on building centroids. Numbered labels represent affected cultural property. Pixel-wise coherence change (9 February 2022–21 February 2022 to 21 February 2022–28 May 2022) was colored according to probability thresholds. OSM data: Geofabrik GmbH. Sentinel images: ESA.
5.2. Changes along Time Series and Selected Heritage Sites
The Ukrainian war involves a large number and variety of destructive incidents, affecting different areas at different times. We demonstrate the potential of the time-series analysis of SAR coherent changes to reveal spatio-temporal dynamics during an ongoing armed conflict. For this, we analyzed the characteristics of Sentinel-1 coherence change over time and ran the logistic model with each coherence difference obtained by subtracting the subsequent pairs of coherence maps. The time-series analysis shall identify the locations of damages and allow for conclusions regarding the time period when the damages occurred. We confirmed the results by comparing detected changes aligned with increased coherence loss and, hence, damage probability from both study areas, with historical images provided through Google Earth Pro version 7.3.6, where they were available. We considered damaged cultural property verified by UNESCO with a status of publication from 8 June 2022 [4]. Based on the description given by UNESCO, we assigned the listed assets to the respective study area. However, not all sites could be identified in the OSM dataset, since they were missing specific information, which is why we used only selected sites for exemplary evaluation.
Figure 12 shows the analysis of coherence loss and damage probability for different time intervals and urban neighborhoods in Mariupol, revealing the spatial and temporal patterns of damage within the city area. Significant changes happened between 16 February 2022 and 12 March 2022, when a distinct decrease in coherence was observed for the Azov State Technical University (Figure 12a), including multiple educational buildings as well as the Christian Chapel of the Holy Martyr Tetiana [No. 160]. Pre-conflict Google Earth images recorded on 12 June 2021 show the intact complex, whereas most of the buildings were either partly damaged or fully destroyed by 9 May 2022. Significant coherence loss and high damage probability were detected in the same time span for the Orthodox Cathedral of St. Michael the Archangel [No. 83] located in Eastern Mariupol (Figure 12b). This is consistent with a corresponding satellite image taken on 13 March 2022, showing heavy damage to the church and its surrounding area. Next to the church stands a Monument to Metropolitan Ignatius of Mariupol [No. 286]. Although the monument is listed as damaged by UNESCO and Google satellite imagery reveals a large amount of debris, only minor coherence loss, and hence, damage probability, was estimated. The surrounding vegetation and the relatively small size of the object in combination with Sentinel-1 spatial resolution could be influencing factors, leading to misdetection [24,59]. Figure 12c shows parts of the old town, where there are numerous historical buildings and cultural assets such as the Museum of Folk Life [No. 147], the Kuindzhi Art Museum [No. 146], and the Mariupol Drama Theater [No. 179] (upper left corner), which was reportedly bombed on 16 March 2022. A significant change in coherence indicates that the entire area was strongly affected between 12 March 2022 and 5 April 2022. Google Earth images dated 14 March 2022 and 26 March 2022 confirm severe damage or destruction to most of the buildings in the area within the investigated time interval.
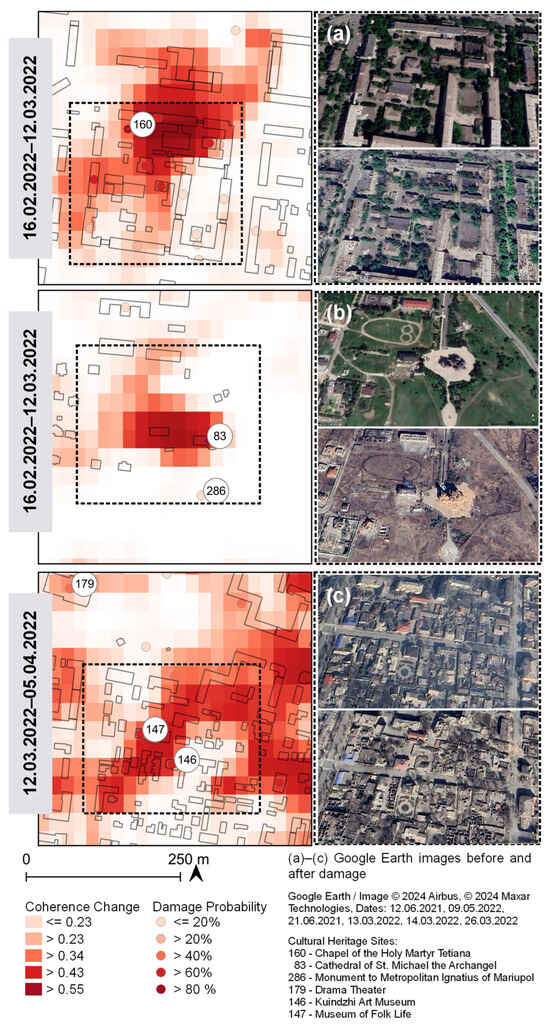
Figure 12.
Results of the time-series analysis, Mariupol. Pixel-wise coherence change and predicted damage probabilities (points) for selected time intervals and locations compared with Google Earth historical images. Optical satellite imagery by Google Earth/Image © 2024 Airbus, Image © 2024 Maxar Technologies. OSM data: Geofabrik GmbH. Sentinel images: ESA.
Figure 13 shows samples of the time-series-based damage assessment in the Kharkiv urban area. Areas with significant coherence loss, hence, a high probability of damage occurrence, were mainly detected between 21 February 2022 and 17 March 2022. As demonstrated in Figure 13a, our results indicate damage to important cultural sites in the city center, such as the Former Palace of Labour and Former Lux Store, representing a building ensemble of Constitution Square. Google Earth images depicting the situation prior to and after the respective analysis period confirm heavy damage to the building’s façade and roof. The results also show evidence of damage to the Nikolskyi Shopping Mall located in the upper-right part of the image detail, which Internet media reported as damaged on 10 March 2022 after air strikes [60]. Although reported by UNESCO, our results showed that no significant changes were detectable to the Assumption Cathedral [No. 264] and the State Puppet Theater [No. 387], which show generally low coherence difference values and damage probability. Such misdetection could be explained by the moderate spatial resolution of Sentinel-1 data combined with limitations to capturing more subtle damage to the buildings’ features [21,24]. This assumption is supported by available Google Earth imagery which did not allow for clear visual identification of severe structural damage. In Figure 13b, the results show high coherence loss near the central Freedom Square, indicating damage to the Economics Faculty of Karazin National University [No. 397] and the National State Academic Opera [No. 92] between 21 February 2022 and 17 March 2022. Damage to the Temple of Myrrh-Bearing Women [No. 452] was verified by UNESCO but could not be confirmed either by coherence difference analysis or visual inspection. Within the same period, a clear decline in coherence was detected at Kharkiv Air Force University (Figure 13c). The corresponding Google Earth image showed that several buildings on campus were destroyed, although the historic military aircraft, which are recorded as memorial point features in the OSM dataset, seemed unscathed. However, since optical images of sufficiently good quality were only available from 5 May 2022, the timing of the identified damages can only be confirmed to a limited extent. While coherence difference analysis proved to be suitable for detecting hotspots of coherence loss and high damage probability in the built-up area, the exemplary results show inaccuracies when it comes to individual building damage detection. Furthermore, by comparing with the optical images, the extent of coherence loss only seems to allow for limited conclusions to be drawn about the severity of the damage, as postulated by the literature [16].
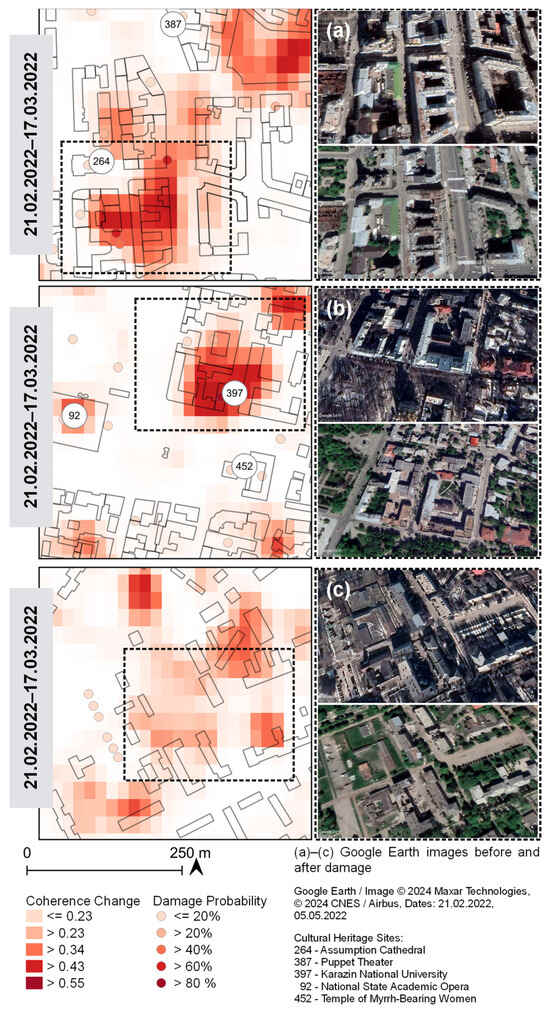
Figure 13.
Results of the time-series analysis, Kharkiv. Pixel-wise coherence change and predicted damage probabilities (points) for selected time intervals and locations compared with Google Earth historical images. Optical satellite imagery by Google Earth/Image © 2024 Maxar Technologies, Image © 2024 CNES/Airbus. OSM data: Geofabrik GmbH. Sentinel images: ESA.
6. Discussion
Our study investigated the applicability of Sentinel-1 SAR multi-temporal CCD for damage assessment in the cities of Kharkiv and Mariupol as targets of the Russian military offensive in Ukraine. SAR images are weather-independent, which makes them highly suitable to complement optical observation for continuous monitoring and damage assessment of urban neighborhoods and embedded cultural assets. Such approaches are often based on very high-resolution SAR sensors that provide on-demand imagery and fine-scale mapping [17,20]. However, they are costly and might cover a small area. Therefore, freely available Sentinel-1 data can compensate due to the high temporal and spatial coverage. Since we aimed to identify hotspots of coherent changes, indicating potential impact and correspondingly increased damage risk on cultural assets, Sentinel-1 spatial resolution seems adequate at the required level of detail of preliminary damage maps.
We exploited the difference between two subsequent coherence image pairs as the parameter for discriminating between damaged and undamaged areas. Refs. [15,61,62] proposed normalized coherence difference, as calculated by Equation (6), as an improved indicator for coherent changes showing higher sensitivity in the discrimination of building damage in disasters:
The performance of both parameters was examined based on statistical metrics of the predictive outcome of the logistic model, including cross-tabulation between predicted and observed values, overall model accuracy, and ROC computation. However, the normalized difference could not improve building damage discrimination regarding the statistic criteria. We, therefore, found a traditional coherence difference calculation in the form of simple image subtraction to be a sufficient and straightforward method.
We tackled the issue of classification, i.e., finding reasonable discrimination thresholds by applying logistic regression as an approach for estimating building damage probability in relation to coherence loss between two time periods. Since the independent input variable was binary, this implies the back-transformation of the model output into a binary form. A building is then either damaged or undamaged. Our intention is to use the full information of the predicted probabilities providing preliminary damage maps that visualize areas with a high likelihood for damage occurrence. We suggest this is an adequate way for users to individually interpret the probability output in a map based on their specific application context. Further work is intended to establish multiple scenarios of building damage probability utilizing the upper and lower confidence intervals of the prediction. Presumably due to the general lack of sufficient reference data, particularly in disaster areas, the applicability of logistic regression analysis for damage classification and vulnerability mapping has been explored by only a few studies, such as [50,51,52,63]. Our statistical analysis showed a strong correlation between coherence loss and observed building damage. Therefore, the individual coherence difference images could already be used to quickly identify potentially affected areas and be considered as a basis for detailed follow-up investigation.
The qualitative evaluation with the UNOSAT reference data showed a good agreement in the distribution of building damage. For both study sites, Sentinel-1 SAR damage detection identified structural damages that remained undetected in the reference dataset. Here lies the advantage of a semi-automated approach that can detect areas of change more effectively within a broader area in a timely manner. Whereas manual image interpretation of events is subject to experts’ knowledge, and it is time-consuming. However, the results of the semi-automated approach using freely available data can support visual inspection, especially when time is an issue. In addition, the spatial coverage of Sentinel-1 makes it possible to process an entire city area at once, meaning that the change analysis does not have to be limited to smaller sections. However, for the Kharkiv area, the evaluation revealed a potential weakness of Sentinel-1 in terms of spatial resolution compared to VHR visual analysis, which makes damage detection at the individual building level more difficult and is more aimed at delineating affected neighborhoods.
It has already been pointed out in earlier studies that it is preferable to include additional GIS data such as building outlines to mask out coherence variation caused by other effects [13,24,59]. The visual comparison of satellite data, including derived image products and open GIS datasets, showed some limitations with regard to completeness, positioning, and accuracy of fit, especially in the available OSM building footprint. Buffering of building outlines to accommodate different observation conditions and data sources could improve detecting trends of coherence loss on the building level, resulting in an improved model parameterization and performance [19]. Due to the spatial resolution of Sentinel-1 data, coherence estimation will still be affected by the backscattering intensity of other objects in a target pixel, which increases the degree of uncertainty regarding the damage detection of small buildings, buildings enclosed by dense vegetation [6,59], or single damaged objects located within rather unaffected neighborhoods.
The time-series analysis enabled the detection of hotspots of coherent changes and narrowed the time range within which the damages occurred. However, apparent contrasts were found between the severe condition of individual buildings observed in the VHR optical images and the estimated amount of coherence loss and damage probability, where no or only moderate changes seemed to have occurred. The selected locations in Kharkiv presented in Figure 13 are good examples to demonstrate the difficulties of damage assessment on the single building level. While the inspection of pixel-based coherence difference indicated even the partial damage of larger buildings, the aggregation at the building level (average coherence loss per building outline) might have resulted in less significant coherence difference and, hence, a lower estimated damage probability.
The aim of the developed logistic model is the spatial and temporal transferability of its application to provide accurate predictions in another target area. A model’s capacity for prediction can decline when transferred to another region or time period other than that upon which it is trained. One reason lies within the observed variation of coherence and its contribution to the predictive relation for damage probability estimation on the different sites. Coherence characteristics vary between the training data, that is, the coherence difference data used for model calibration and the data used for model prediction.
We obtained pre-conflict coherence based on two Sentinel-1 SAR scenes acquired as closely as possible before the start of the armed conflict as a representation of the normal coherence distribution without any damage-causing event. By comparing the results obtained from the pre-conflict image pairs for both the Mariupol and Kharkiv built-up areas, it is apparent that Kharkiv is showing lower coherence values than Mariupol (Table 2, Figure 4). This is despite the fact that both image pairs have been obtained over the same 12-day temporal interval and similar acquisition dates. The selection of images with a minimum time lag should result in low temporal decorrelation and produce consistent coherence maps [64]. However, different regions are subject to different rates of change in surface properties that influence coherence variability and the definition of thresholds for differentiation between natural and damage-related coherence loss [48].
Where decorrelation of the pre-conflict coherence map (reference) caused by the background environment, such as meteorological influences (snow coverage) or urban green spaces, becomes dominant, it decreases the expected stability in coherence over the built-up area prior to changes related to the armed conflict. Damage is assessed by detecting changes, i.e., estimating the difference between corresponding coherence maps. Overall low coherence in the reference image results in less significant coherence loss between the pre-conflict and co-conflict coherence maps in areas affected by changes related to the armed conflict. In consequence, lower coherence difference values may result in a lower estimated damage probability, leading to an increase in the false-negative rate.
Thus, a procedure is required to correct the input data for model calibration to improve the predictive performance of our model and to ensure transferability to another target area and different timeframes.
Possible approaches are shown by studies that explored a series of pre-event coherences calculated at regular intervals for the preceding year [14,23,65]. The intention is to identify trends in pre-event coherence for an individual area by calculating the sequential mean and standard deviation per pixel to be used as a baseline. The statistical values are then considered as a threshold to distinguish significant disaster-induced coherence loss. Ref. [48] trained a deep-learning algorithm based on observed pre-event coherence behavior to forecast normal coherence distribution expected without damage events. However, the workflows were developed for comparison with a single post-event SAR image. Further investigation is needed on whether and how to apply the methodology on a time series of coherences calculated for adjacent image pairs.
Mariupol shows a substantial loss of coherence over the whole investigated time period (Cohtot, Table 2). The extent of coherence decrease could be attributed to the temporal baseline of 96 days between the pre- and co-conflict image acquisitions [64]. In addition, the pre- and co-conflict coherence maps used for calculating coherence loss as input for the model calibration compare winter and early summer images from February and May 2022, representing a relatively wide temperature and precipitation range. Thus, the coherence images could be affected by natural changes in surface properties or seasonal effects in terms of the overall average value that might increase false alarms. Further investigations include a coherence difference analysis based on coherence maps calculated from image acquisitions of the corresponding pre-year period as a reference to derive a baseline for coherent change caused by seasons, not disastrous events. However, this effect would also have to be observed in the Kharkiv study region, which shows a higher similarity in terms of average coherence in the built-up area. From this, it can be concluded that the detected changes, i.e., coherence loss in Mariupol, can be related to the armed conflict and are an indication of the widespread extent of the damage.
7. Conclusions
SAR Sentinel-1 coherent-based change detection highlighted areas of major destruction over time. We provided building damage estimates based on a coherence difference analysis of subsequent pre- and co-event coherence maps and logistic regression. Coherence loss proved to be sufficient as a proxy measure for building damages related to armed conflict, with the drop level indicating the level of damage probability. Given the probability output, users can determine to which degree damage is likely to occur and prioritize further investigations based on individual requirements.
The damage probability maps should be used as guidance, giving a first, timely initial evaluation of potentially damaged areas. The free availability, regular acquisition dates, and weather independence of Sentinel-1 SAR imagery serve for the production of a stringent time series of preliminary damage maps and the detection of major changes with sufficient spatial and temporal accuracy. A semi-automated workflow to extract areas of change, as applied in this study, takes considerably less time and can support further detailed visual inspections using VHR data.
Our analysis complements visual damage verification and supports repeated monitoring that extends over larger areas and allows users to focus on detailed follow-up surveys. However, the analysis is less reliable over vegetated or agricultural areas, leading to false positives. Since we expected the detected changes to be related to the destruction of buildings caused by armed conflict, the results should only be interpreted for the built-up areas. We included additional GIS data to increase accuracy, with a focus on the building stock and heritage sites, along with enhanced usability of the damage assessment at a user-relevant information level.
The presented CCD methodology is sensitive to changes induced by armed conflict and applicable in areas with large-scale destruction. However, small-scale change or moderate structural damage may not be detected due to Sentinel-1’s spatial resolution. Modeling techniques and training data determine the transferability of the developed LRM and could be improved by integrating additional reference data from different areas and timeframes for training and prediction. However, the sampling procedure was limited by the availability of additional VHR optical satellite imagery for damage assessment.
Author Contributions
Conceptualization, Ute Bachmann-Gigl; Data curation, Ute Bachmann-Gigl; Formal analysis, Ute Bachmann-Gigl; Methodology, Ute Bachmann-Gigl; Software, Ute Bachmann-Gigl; Supervision, Zahra Dabiri; Visualization, Ute Bachmann-Gigl; Writing—original draft, Ute Bachmann-Gigl; Writing—review and editing, Ute Bachmann-Gigl and Zahra Dabiri. All authors have read and agreed to the published version of the manuscript.
Funding
Article processing charges (APC) funded by the Paris Lodron University of Salzburg Publication Fund.
Data Availability Statement
The original Sentinel imagery, OSM data, and administrative boundary data used in the study are open and freely accessible.
Acknowledgments
We would also like to emphasize the open tools and software used in this research. Pre-processing applied to the Sentinel-1 SLC files was performed with ESA Sentinel-1 Toolbox (S1TBX) version 9.0.4 in ESA Sentinel Application Platform (SNAP) version 9.0.0. Post-processing of Sentinel-1 coherence maps, damage mapping, and the creation of layouts and graphics were carried out with QGIS Desktop version 3.10.8-A Coruña. The statistical analysis was performed using RStudio v 2022.02.3 mainly with the support of R dplyr v1.1.4, plyr v1.8.7, pROC v1.18.5, and caret v6.0-94 packages.
Conflicts of Interest
The authors declare no conflicts of interest.
References
- UNESCO. Convention for the Protection of Cultural Property in the Event of Armed Conflict with Regulations for the Execution of the Convention: Adopted 14 May 1954, The Hague, Netherlands. Available online: https://www.unesco.org/en/legal-affairs/convention-protection-cultural-property-event-armed-conflict-regulations-execution-convention (accessed on 1 June 2024).
- Psikowska-Schnass, M. Russia’s War on Ukraine’s Cultural Heritage. Available online: https://epthinktank.eu/2022/04/22/russias-war-on-ukraines-cultural-heritage/ (accessed on 1 June 2024).
- Casana, J.; Laugier, E.J. Satellite imagery-based monitoring of archaeological site damage in the Syrian civil war. PLoS ONE 2017, 12, e0188589. [Google Scholar] [CrossRef] [PubMed]
- UNESCO. Damaged Cultural Sites in Ukraine Verified by UNESCO. Available online: https://www.unesco.org/en/articles/damaged-cultural-sites-ukraine-verified-unesco (accessed on 1 June 2024).
- UNITAR. United Nations Satellite Centre UNOSAT. Available online: https://www.unitar.org/sustainable-development-goals/united-nations-satellite-centre-UNOSAT (accessed on 1 June 2024).
- Huang, Q.; Jin, G.; Xiong, X.; Ye, H.; Xie, Y. Monitoring Urban Change in Conflict from the Perspective of Optical and SAR Satellites: The Case of Mariupol, a City in the Conflict between RUS and UKR. Remote Sens. 2023, 15, 3096. [Google Scholar] [CrossRef]
- Malmgren-Hansen, D.; Sohnesen, T.; Fisker, P.; Baez, J. Sentinel-1 Change Detection Analysis for Cyclone Damage Assessment in Urban Environments. Remote Sens. 2020, 12, 2409. [Google Scholar] [CrossRef]
- Mastro, P.; Masiello, G.; Serio, C.; Pepe, A. Change Detection Techniques with Synthetic Aperture Radar Images: Experiments with Random Forests and Sentinel-1 Observations. Remote Sens. 2022, 14, 3323. [Google Scholar] [CrossRef]
- Olen, S.; Bookhagen, B. Mapping Damage-Affected Areas after Natural Hazard Events Using Sentinel-1 Coherence Time Series. Remote Sens. 2018, 10, 1272. [Google Scholar] [CrossRef]
- Tapete, D.; Cigna, F. Trends and perspectives of space-borne SAR remote sensing for archaeological landscape and cultural heritage applications. J. Archaeol. Sci. Rep. 2017, 14, 716. [Google Scholar] [CrossRef]
- Preiss, M.; Stacy, N.J.S. Coherent Change Detection: Theoretical Description and Experimental Results; DSTO-TR-1851; Defense Technical Information Center: Fort Belvoir, VA, USA, 2006. [Google Scholar]
- Closson, D.; Milisavljevic, N. InSAR Coherence and Intensity Changes Detection. In Mine Action—The Research Experience of the Royal Military Academy of Belgium; Beumier, C., Closson, D., Lacroix, V., Milisavljevic, N., Yvinec, Y., Eds.; InTech: London, UK, 2017. [Google Scholar] [CrossRef]
- Plank, S. Rapid Damage Assessment by Means of Multi-Temporal SAR—A Comprehensive Review and Outlook to Sentinel-1. Remote Sens. 2014, 6, 4870–4906. [Google Scholar] [CrossRef]
- Lu, C.-H.; Ni, C.-F.; Chang, C.-P.; Yen, J.-Y.; Chuang, R. Coherence Difference Analysis of Sentinel-1 SAR Interferogram to Identify Earthquake-Induced Disasters in Urban Areas. Remote Sens. 2018, 10, 1318. [Google Scholar] [CrossRef]
- Tzouvaras, M.; Danezis, C.; Hadjimitsis, D.G. Small Scale Landslide Detection Using Sentinel-1 Interferometric SAR Coherence. Remote Sens. 2020, 12, 1560. [Google Scholar] [CrossRef]
- FAO. Impact of the May Conflict Escalation on the Agricultural Area in the Gaza Strip; Food and Agriculture Organization of the United Nations (FAO): Rome, Italy, 2021. [Google Scholar] [CrossRef]
- Tapete, D.; Cigna, F.; Donoghue, D.N.; Philip, G. Mapping Changes and Damages in Areas of Conflict: From Archive C-band SAR Data to New HR X-band Imagery, towards the Sentinels. In Proceedings of the Fringe 2015: Advances in the Science and Applications of SAR Interferometry and Sentinel-1 InSAR Workshop, Frascati, Italy, 23–27 March 2015; Ouwehand, L., Ed.; ESA Publication SP-731: Noordwijk, The Netherlands, 2015. [Google Scholar] [CrossRef]
- An, L.; Zhang, J.; Gong, L. Earthquake Building Damage Mapping Based on Feature Analyzing Method from Synthetic Aperture Radar Data. Int. Arch. Photogramm. Remote Sens. Spat. Inf. Sci. 2018, XLII-3, 39–43. [Google Scholar] [CrossRef]
- Ge, P.; Gokon, H.; Meguro, K. Building Damage Assessment Using Intensity SAR Data with Different Incidence Angles and Longtime Interval. J. Disaster Res. 2019, 14, 456–465. [Google Scholar] [CrossRef]
- Tapete, D.; Cigna, F. COSMO-SkyMed SAR for Detection and Monitoring of Archaeological and Cultural Heritage Sites. Remote Sens. 2019, 11, 1326. [Google Scholar] [CrossRef]
- Braun, A. Assessment of Building Damage in Raqqa during the Syrian Civil War Using Time-Series of Radar Satellite Imagery. GI_Forum 2018, 1, 228. [Google Scholar] [CrossRef]
- Boloorani, A.D.; Darvishi, M.; Weng, Q.; Liu, X. Post-War Urban Damage Mapping Using InSAR: The Case of Mosul City in Iraq. ISPRS Int. J. Geo-Inf. 2021, 10, 140. [Google Scholar] [CrossRef]
- ElGharbawi, T.; Zarzoura, F. Damage detection using SAR coherence statistical analysis, application to Beirut, Lebanon. ISPRS J. Photogramm. Remote Sens. 2021, 173, 1–9. [Google Scholar] [CrossRef]
- Aimaiti, Y.; Sanon, C.; Koch, M.; Baise, L.G.; Moaveni, B. War Related Building Damage Assessment in Kyiv, Ukraine, Using Sentinel-1 Radar and Sentinel-2 Optical Images. Remote Sens. 2022, 14, 6239. [Google Scholar] [CrossRef]
- Fakhri, F.; Gkanatsios, I. Integration of Sentinel-1 and Sentinel-2 data for change detection: A case study in a war conflict area of Mosul city. Remote Sens. Appl. Soc. Environ. 2021, 22, 100505. [Google Scholar] [CrossRef]
- Hasanlou, M.; Shah-Hosseini, R.; Seydi, S.T.; Karimzadeh, S.; Matsuoka, M. Earthquake Damage Region Detection by Multitemporal Coherence Map Analysis of Radar and Multispectral Imagery. Remote Sens. 2021, 13, 1195. [Google Scholar] [CrossRef]
- Sharma, A. Gaza Damage Assessment using Earth Observation Data: Monitoring Structural Damage to Buildings in North Gaza Using Sentinel 2 Satellite Imagery during the Recent Israeli-Palestinian Conflict. Available online: https://medium.com/geekculture/2021-gaza-damage-assessment-using-earth-observation-data-8e6c9c66b808 (accessed on 24 September 2022).
- Mihi, A.; Ghazela, R.; Wissal, D. Mapping potential desertification-prone areas in North-Eastern Algeria using logistic regression model, GIS, and remote sensing techniques. Environ. Earth Sci. 2022, 81, 385. [Google Scholar] [CrossRef]
- Nick, T.G.; Campbell, K.M. Logistic Regression. Methods Mol. Biol. 2007, 404, 273–301. [Google Scholar] [CrossRef]
- Washaya, P.; Balz, T.; Mohamadi, B. Coherence Change-Detection with Sentinel-1 for Natural and Anthropogenic Disaster Monitoring in Urban Areas. Remote Sens. 2018, 10, 1026. [Google Scholar] [CrossRef]
- Yerushalmy, J. Mariupol before and after: Updated Google Maps Reveal Destruction in Ukraine City. The Guardian, 28 April 2023. Available online: https://www.theguardian.com/world/2023/apr/28/mariupol-before-and-after-updated-google-maps-reveal-destruction-in-ukraine-city (accessed on 6 June 2024).
- BBC News. Ukraine Conflict: Russia Bombs Kharkiv’s Freedom Square and Opera House. BBC. 1 March 2022. Available online: https://bbc.com/news/world-europe-60567162 (accessed on 25 February 2024).
- Bachelet, M. High Commissioner Updates Human Rights Council on Mariupol, Ukraine. Available online: https://www.ohchr.org/en/statements/2022/06/high-commissioner-updates-human-rights-council-mariupol-ukraine (accessed on 28 December 2023).
- Henley, J. Moscow Confirms Attack on Kyiv during UN Chief’s Visit: Kremlin Admits Airstrike as Ukraine Acknowledges Heavy Losses from Russian Attack in East. The Guardian. 29 April 2022. Available online: https://www.theguardian.com/world/2022/apr/29/russia-carries-out-airstrike-on-kyiv-during-un-chief-visit-ukraine-antonio-guterres (accessed on 2 June 2024).
- UNOSAT. Damage Assessment Overview Map. Ukraine. Livoberezhnyi and Zhovtnevyi Districts, Mariupol City: Imagery Analysis 7, 8, 12 May 2022 and 14 March 2022. Product ID: 3300. Published 15 June 2022. Available online: https://unosat.org/products/3300 (accessed on 21 February 2023).
- UNOSAT. Damage Assessment Overview Map. Ukraine. Kharkiv, Kharkiv Oblast: Imagery Analysis 15 June 2022. Product ID: 3455. Published 25 November 2022. Available online: https://unosat.org/products/3455 (accessed on 21 February 2023).
- Alaska Satellite Facility. Distributed Active Archive Center. Available online: https://search.asf.alaska.edu/ (accessed on 2 June 2024).
- Yague-Martinez, N.; Prats-Iraola, P.; Rodriguez Gonzalez, F.; Brcic, R.; Shau, R.; Geudtner, D.; Eineder, M.; Bamler, R. Interferometric Processing of Sentinel-1 TOPS Data. IEEE Trans. Geosci. Remote Sens. 2016, 54, 2220–2234. [Google Scholar] [CrossRef]
- Serco Italia SPA. Lebanon Damage Assessment with Sentinel-1 & Sentinel-2. Version 1.1. 2020. Available online: https://eo4society.esa.int/wp-content/uploads/2022/01/HAZA08_Lebanon-Damage-Assessment.pdf (accessed on 24 November 2023).
- Deepthi, R.; Ravindranath, S.; Raj, K.G. Extraction of Urban Footprint of Bengaluru City Using Microwave Remote Sensing. Int. Arch. Photogramm. Remote Sens. Spat. Inf. Sci. 2018, XLII-5, 735–740. [Google Scholar] [CrossRef]
- Seymour, M.S.; Cumming, I.G. Maximum likelihood estimation for SAR interferometry. In Proceedings of the IGARSS’94—1994 IEEE International Geoscience and Remote Sensing Symposium, Pasadena, CA, USA, 8–12 August 1994; IEEE: Piscataway, NJ, USA, 1994; pp. 2272–2275. [Google Scholar]
- Braun, A.; Veci, L. Sentinel-1 Toolbox: TOPS Interferometry Tutorial. 2021. Available online: https://step.esa.int/docs/tutorials/S1TBX%20TOPSAR%20Interferometry%20with%20Sentinel-1%20Tutorial_v2.pdf (accessed on 7 May 2023).
- Lazecký, M.; Hlaváčová, I.; Martinovič, J.; Ruiz-Armenteros, A.M. Accuracy of Sentinel-1 Interferometry Monitoring System based on Topography-free Phase Images. Procedia Comput. Sci. 2018, 138, 310–317. [Google Scholar] [CrossRef]
- ESA. Scientific Toolbox Exploitation Platform. Available online: http://step.esa.int/ (accessed on 2 June 2024).
- Geofabrik GmbH. Ukraine (with Crimea). Available online: https://download.geofabrik.de/europe/ukraine.html (accessed on 2 June 2024).
- OCHA. Humanitarian Data Exchange: Ukraine—Subnational Administrative Boundaries. Available online: https://data.humdata.org/dataset/cod-ab-ukr? (accessed on 2 June 2024).
- Scheuchl, B.; Ullmann, T.; Koudogbo, F. Change Detection Using High Resolution Terrasar-X Data: Preliminary Results. Int. Arch. Photogramm. Remote Sens. Spat. Inf. Sci. 2009, 38, 1–47. [Google Scholar]
- Stephenson, O.L.; Kohne, T.; Zhan, E.; Cahill, B.E.; Yun, S.-H.; Ross, Z.E.; Simons, M. Deep Learning-Based Damage Mapping With InSAR Coherence Time Series. IEEE Trans. Geosci. Remote Sens. 2022, 60, 5207917. [Google Scholar] [CrossRef]
- ESA. Copernicus Open Access Hub. Available online: https://scihub.copernicus.eu/ (accessed on 8 January 2024).
- Saputra, A.; Rahardianto, T.; Revindo, M.D.; Delikostidis, I.; Hadmoko, D.S.; Sartohadi, J.; Gomez, C. Seismic vulnerability assessment of residential buildings using logistic regression and geographic information system (GIS) in Pleret Sub District (Yogyakarta, Indonesia). Geoenviron. Disasters 2017, 4, 11. [Google Scholar] [CrossRef]
- Han, J.; Park, S.; Kim, S.; Son, S.; Lee, S.; Kim, J. Performance of Logistic Regression and Support Vector Machines for Seismic Vulnerability Assessment and Mapping: A Case Study of the 12 September 2016 ML5.8 Gyeongju Earthquake, South Korea. Sustainability 2019, 11, 7038. [Google Scholar] [CrossRef]
- Chen, S.; Chen, J.; Yu, J.; Wang, T.; Xu, J. Prediction of Deterioration Level of Heritage Buildings Using a Logistic Regression Model. Buildings 2023, 13, 1006. [Google Scholar] [CrossRef]
- Dobson, A.; Barnett, A. An Introduction to Generalized Linear Models; Chapman and Hall/CRC: New York, NY, USA, 2008. [Google Scholar] [CrossRef]
- McCullagh, P.; Nelder, J.A. Generalized Linear Models; Monographs on Statistics and Applied Probability; Champman and Hall/CRC: New York, NY, USA, 2001. [Google Scholar]
- Hastie, T.J.; Pregibon, D. Generalized linear models. In Statistical Models in S; Routledge: London, UK, 2017; pp. 195–247. [Google Scholar]
- Robin, X.; Turck, N.; Hainard, A.; Tiberti, N.; Lisacek, F.; Sanchez, J.-C.; Müller, M. pROC: An open-source package for R and S+ to analyze and compare ROC curves. BMC Bioinform. 2011, 12, 77. [Google Scholar] [CrossRef]
- Melo, F. Area under the ROC Curve. In Encyclopedia of Systems Biology; Dubitzky, W., Wolkenhauer, O., Cho, K.-H., Yokota, H., Eds.; Springer: New York, NY, USA, 2013; pp. 38–39. [Google Scholar] [CrossRef]
- Kuhn, M. Building Predictive Models in R Using the caret Package. J. Stat. Softw. 2008, 28, 1–26. [Google Scholar] [CrossRef]
- Putri, A.F.S.; Wirastuti, W.; Umarhadi, D.A. Sentinel-1 and Sentinel-2 data fusion to distinguish building damage level of the 2018 Lombok Earthquake. Remote Sens. Appl. Soc. Environ. 2022, 26, 100724. [Google Scholar] [CrossRef]
- Liveuamap. Photos of Damage Nikolsky Mall in Kharkiv after Russian Army Shelling. Available online: https://liveuamap.com/en/2022/10-march-photos-of-damage-nikolsky-mall-in-kharkiv-after (accessed on 9 March 2024).
- Watanabe, M.; Thapa, R.B.; Ohsumi, T.; Fujiwara, H.; Yonezawa, C.; Tomii, N.; Suzuki, S. Detection of damaged urban areas using interferometric SAR coherence change with PALSAR-2. Earth Planets Space 2016, 68, 131. [Google Scholar] [CrossRef]
- Ge, P.; Gokon, H.; Meguro, K. A review on synthetic aperture radar-based building damage assessment in disasters. Remote Sens. Environ. 2020, 240, 111693. [Google Scholar] [CrossRef]
- Lee, S. Application of logistic regression model and its validation for landslide susceptibility mapping using GIS and remote sensing data. Int. J. Remote Sens. 2005, 26, 1477–1491. [Google Scholar] [CrossRef]
- Zebker, H.A.; Villasenor, J. Decorrelation in interferometric radar echoes. IEEE Trans. Geosci. Remote Sens. 1992, 30, 950–959. [Google Scholar] [CrossRef]
- Garzo, P.A.; Fernández-Montblanc, T. Land Use/Land Cover Optimized SAR Coherence Analysis for Rapid Coastal Disaster Monitoring: The Impact of the Emma Storm in Southern Spain. Remote Sens. 2023, 15, 3233. [Google Scholar] [CrossRef]
Disclaimer/Publisher’s Note: The statements, opinions and data contained in all publications are solely those of the individual author(s) and contributor(s) and not of MDPI and/or the editor(s). MDPI and/or the editor(s) disclaim responsibility for any injury to people or property resulting from any ideas, methods, instructions or products referred to in the content. |
© 2024 by the authors. Published by MDPI on behalf of the International Society for Photogrammetry and Remote Sensing. Licensee MDPI, Basel, Switzerland. This article is an open access article distributed under the terms and conditions of the Creative Commons Attribution (CC BY) license (https://creativecommons.org/licenses/by/4.0/).