

Analysis of Road Safety Perception and Influencing Factors in a Complex Urban Environment—Taking Chaoyang District, Beijing, as an Example
Abstract
1. Introduction
2. Materials and Methods
2.1. Study Area and Data Source
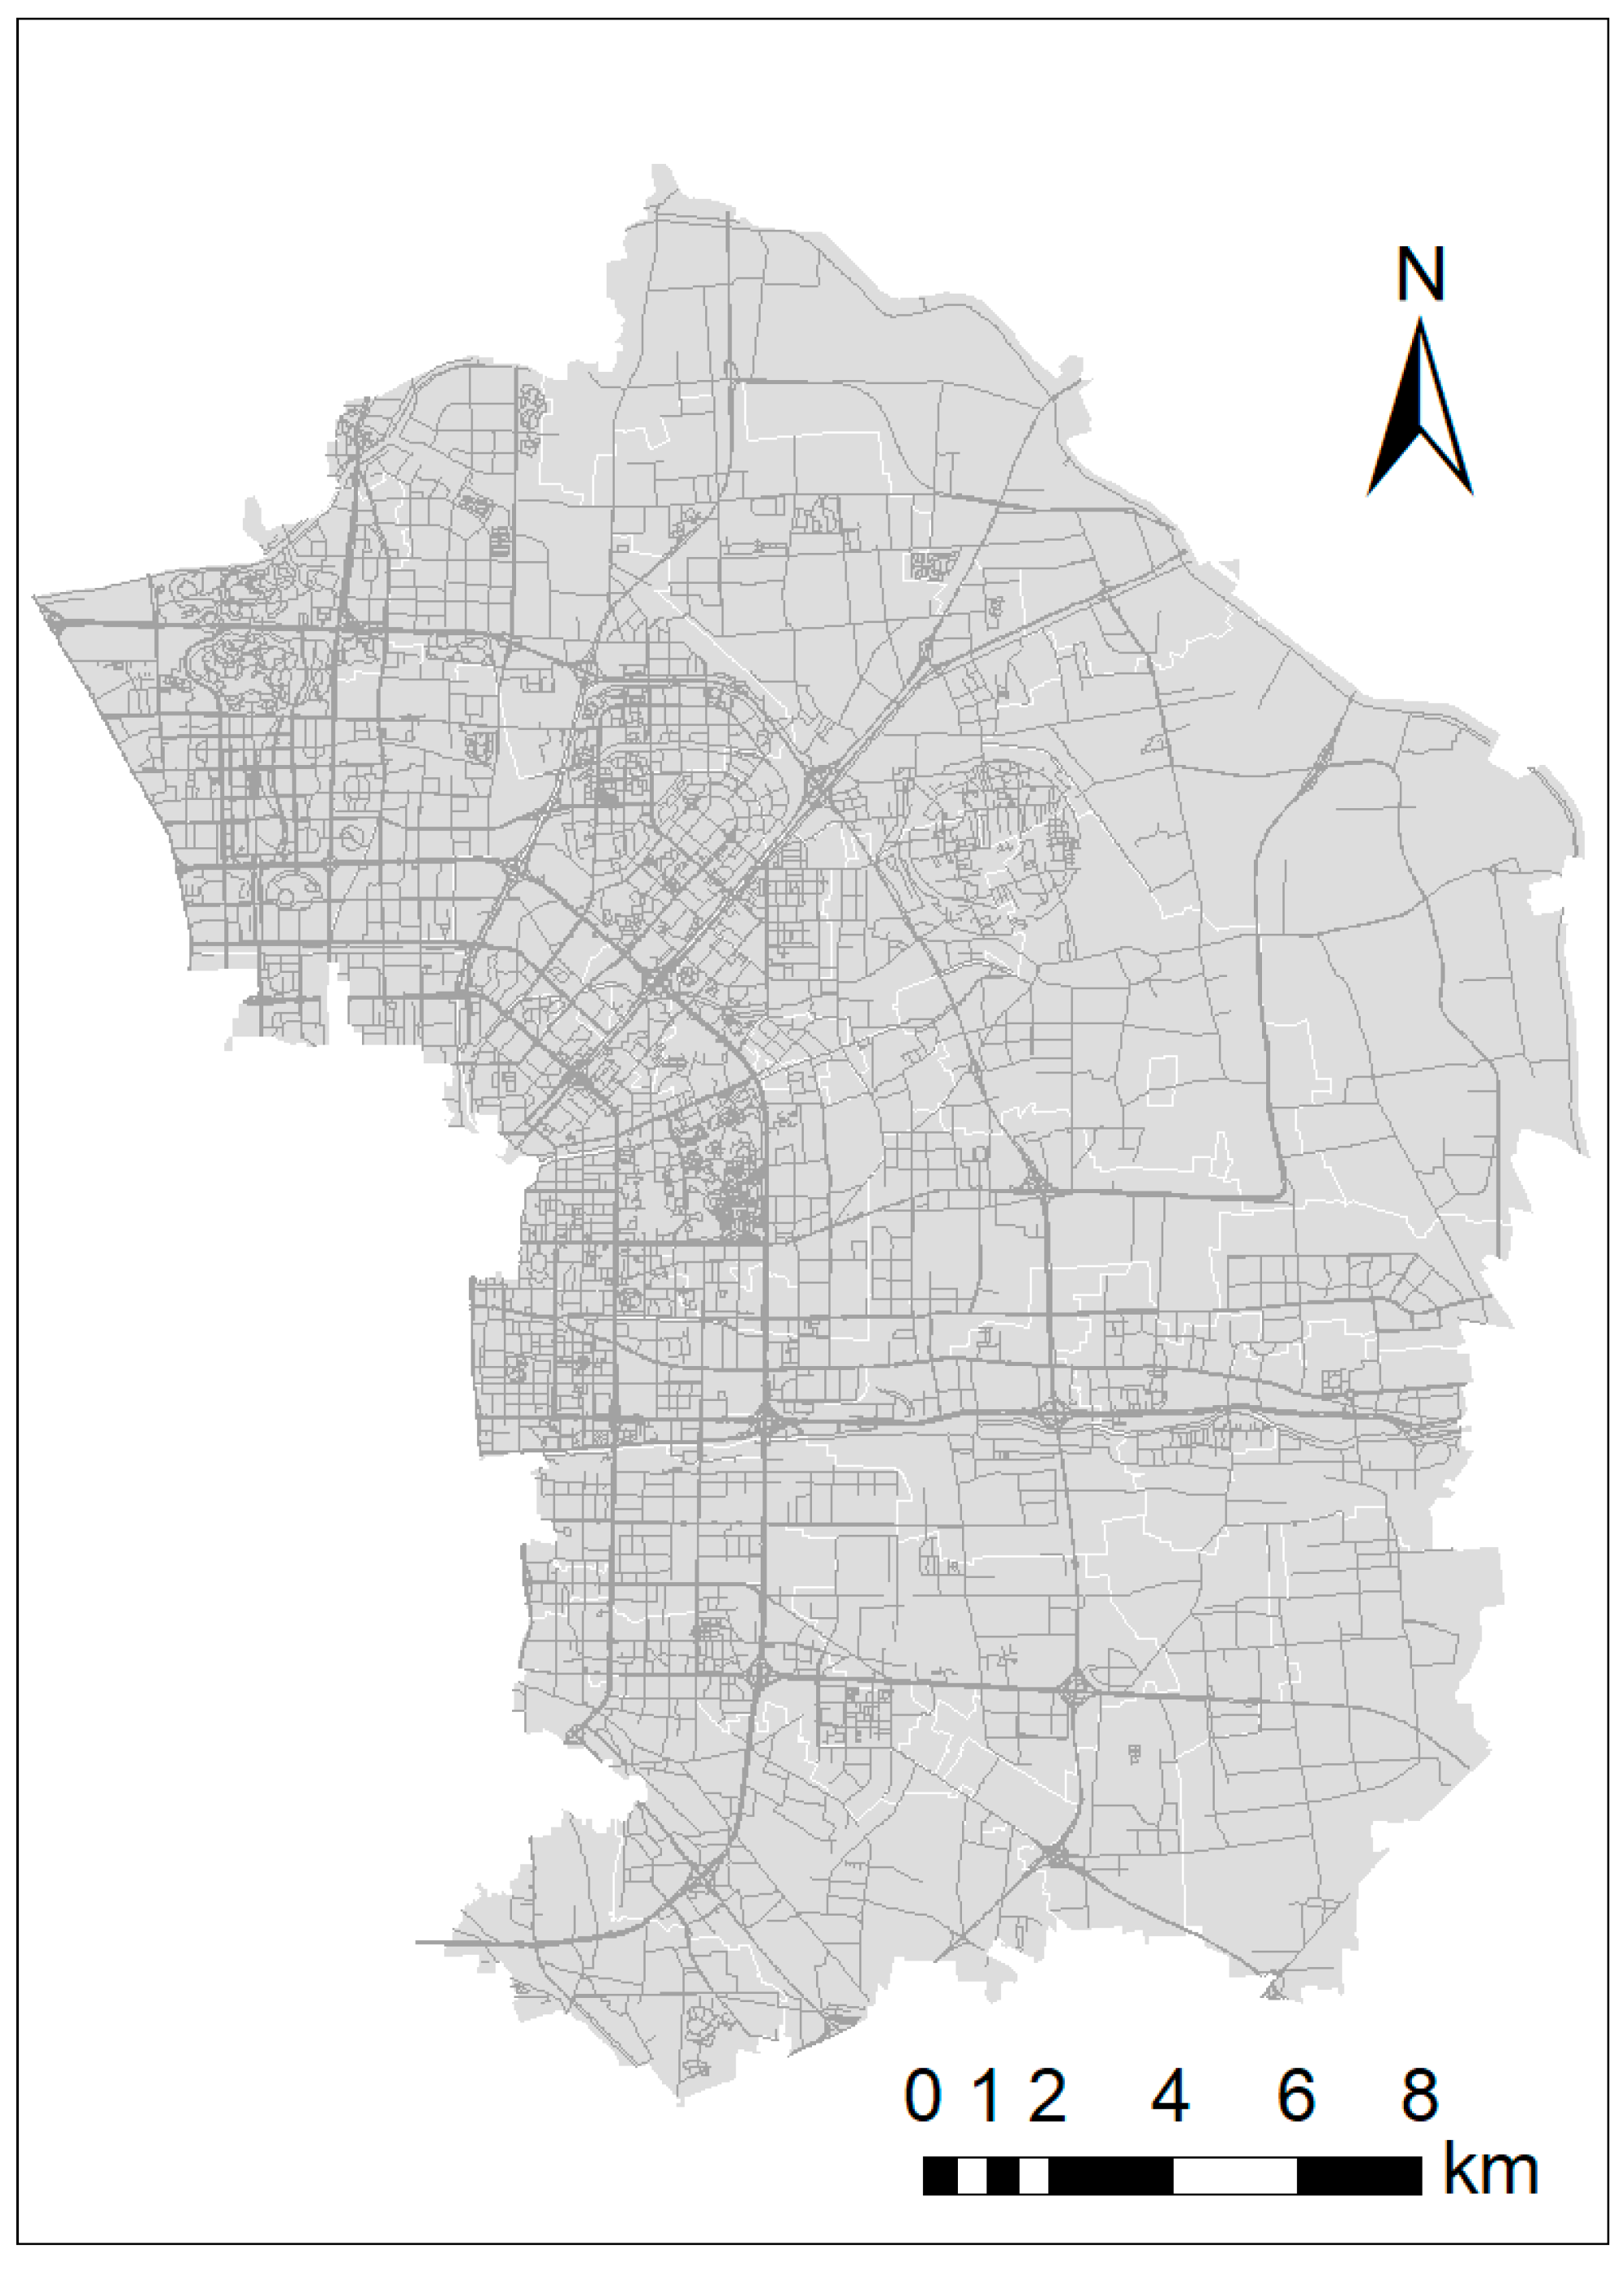
2.1.1. Study Area
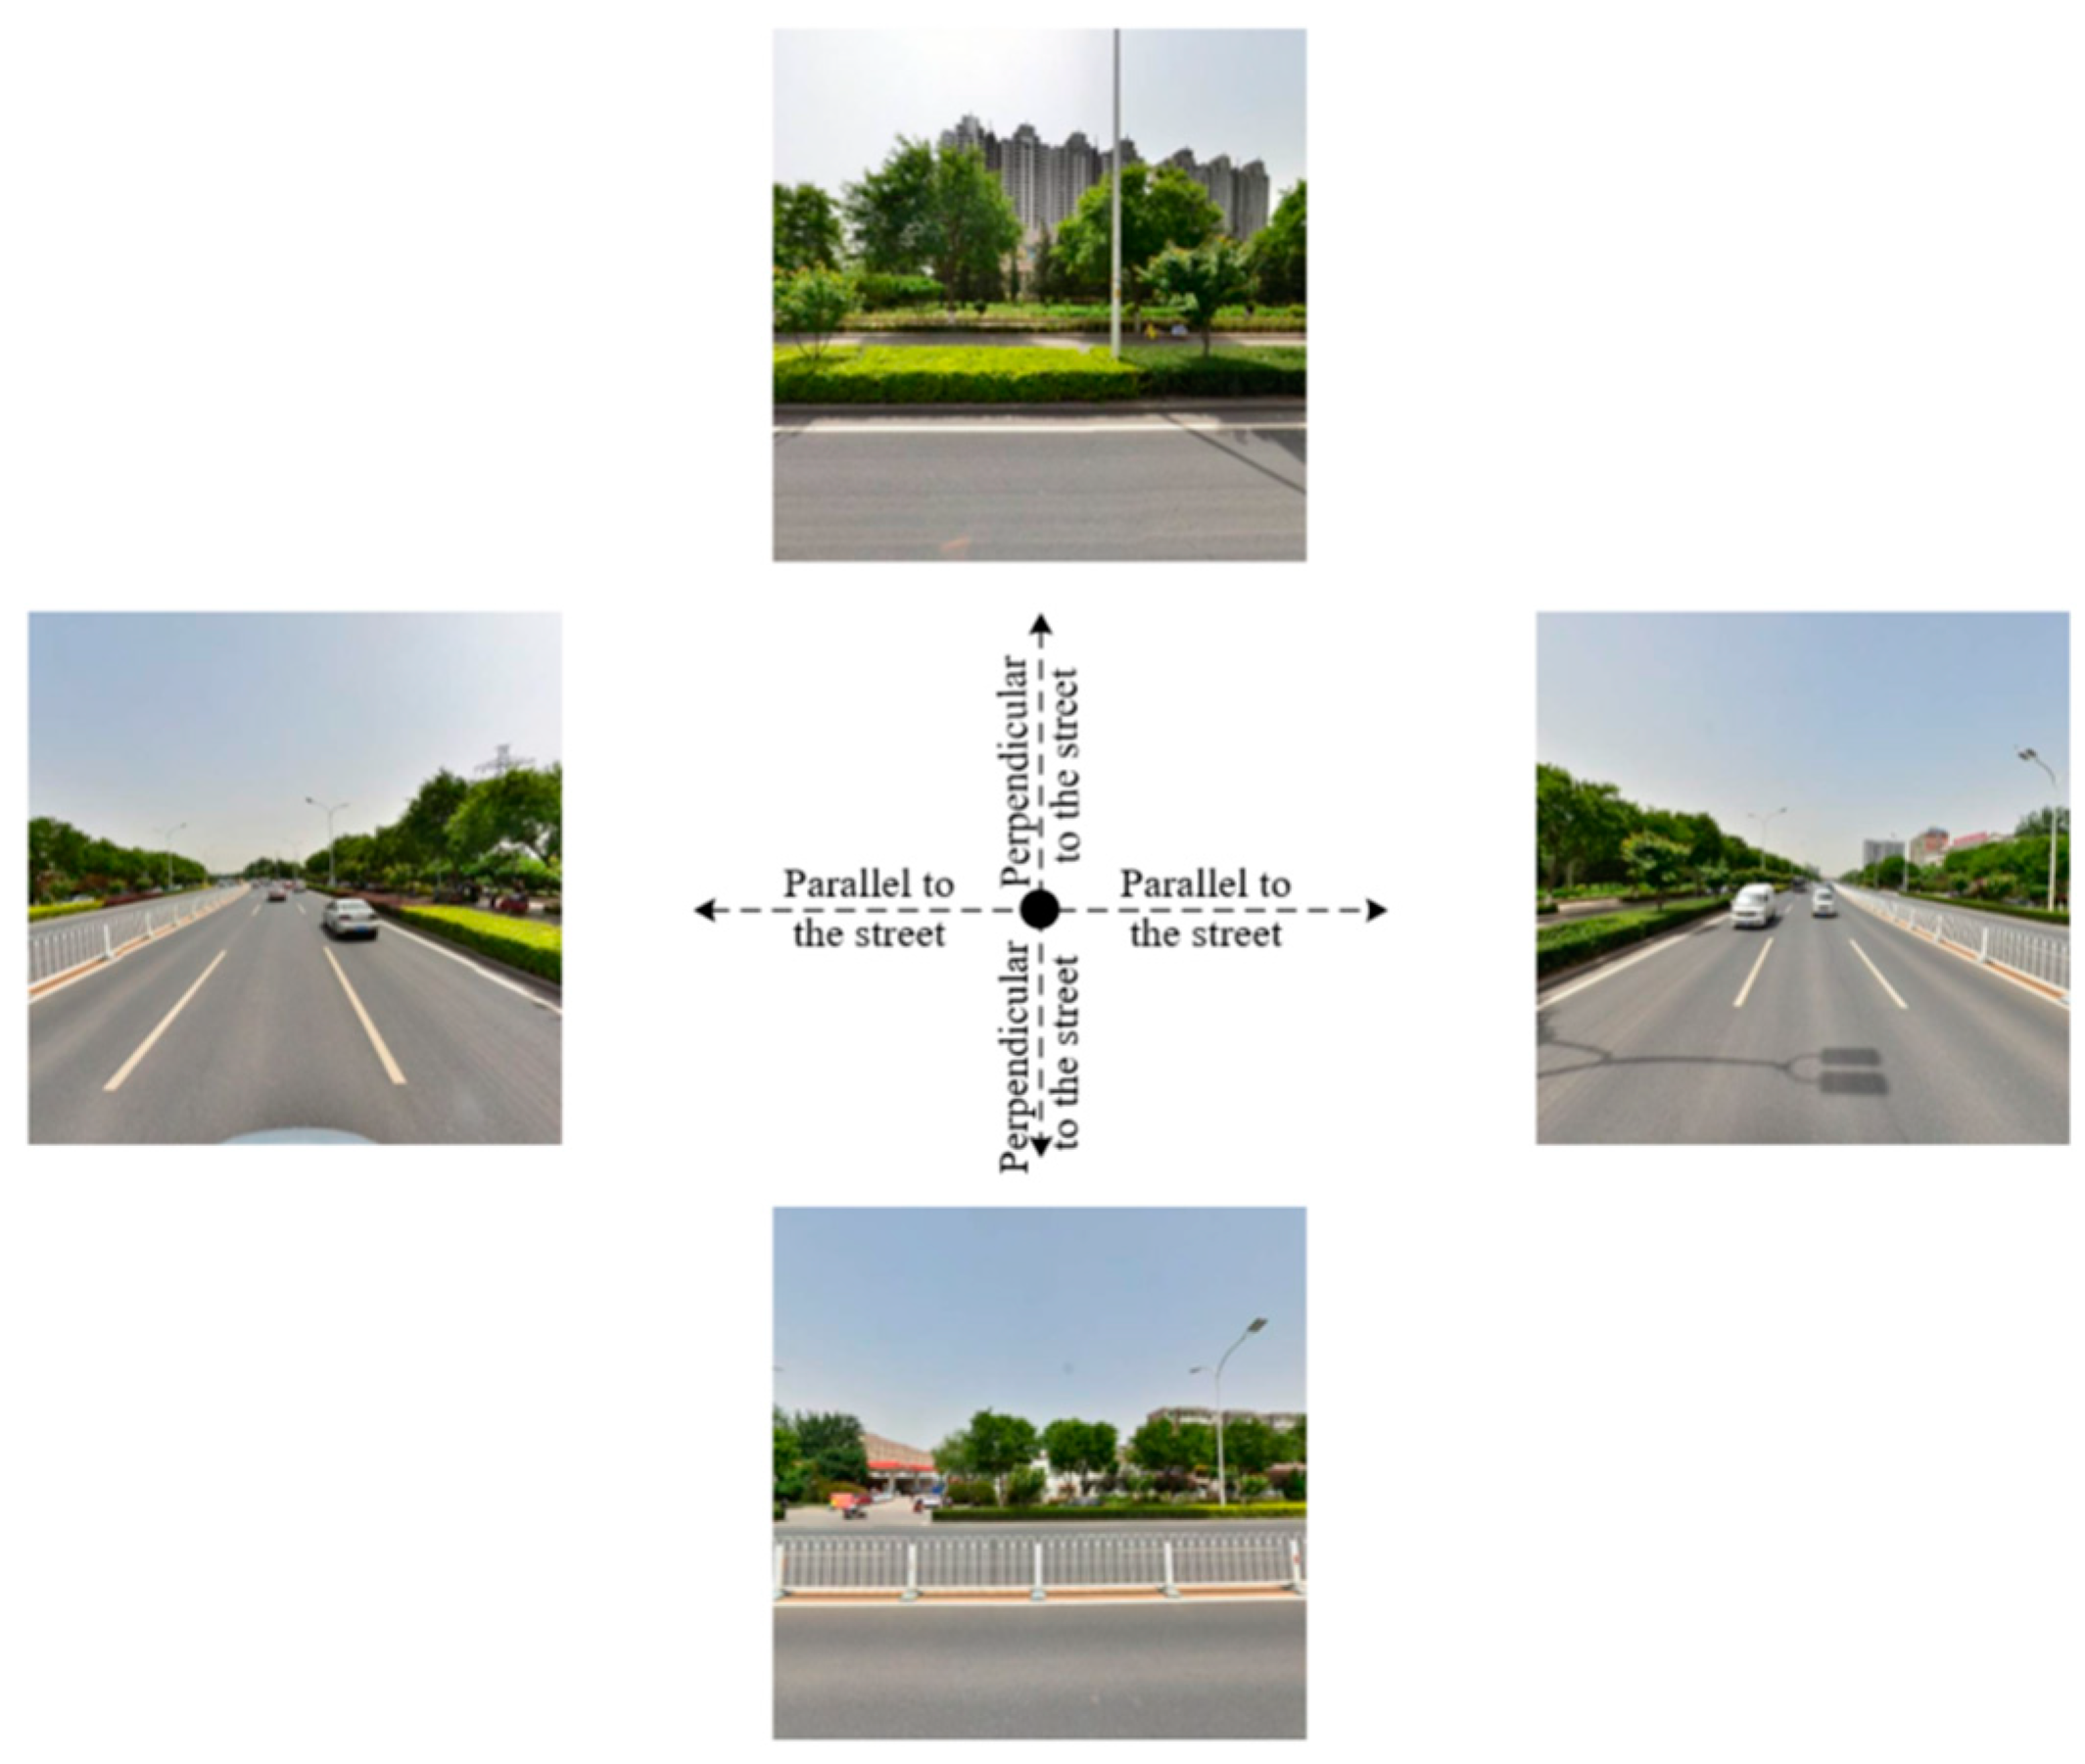
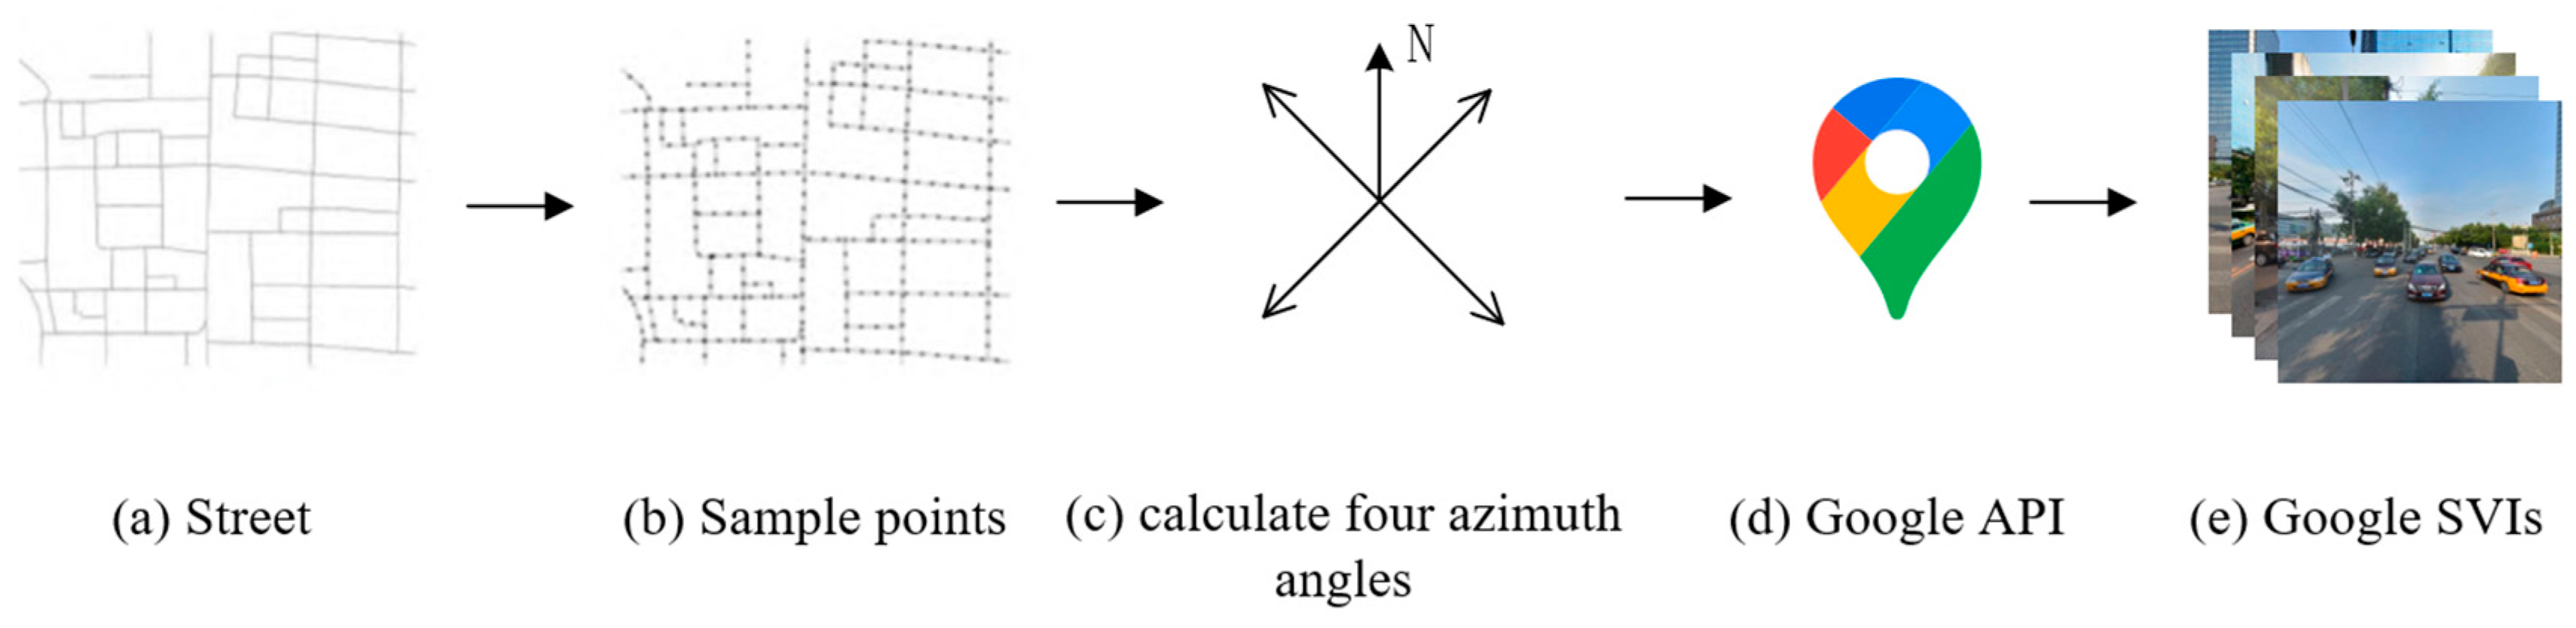
2.1.2. Data Source
2.2. Research Method
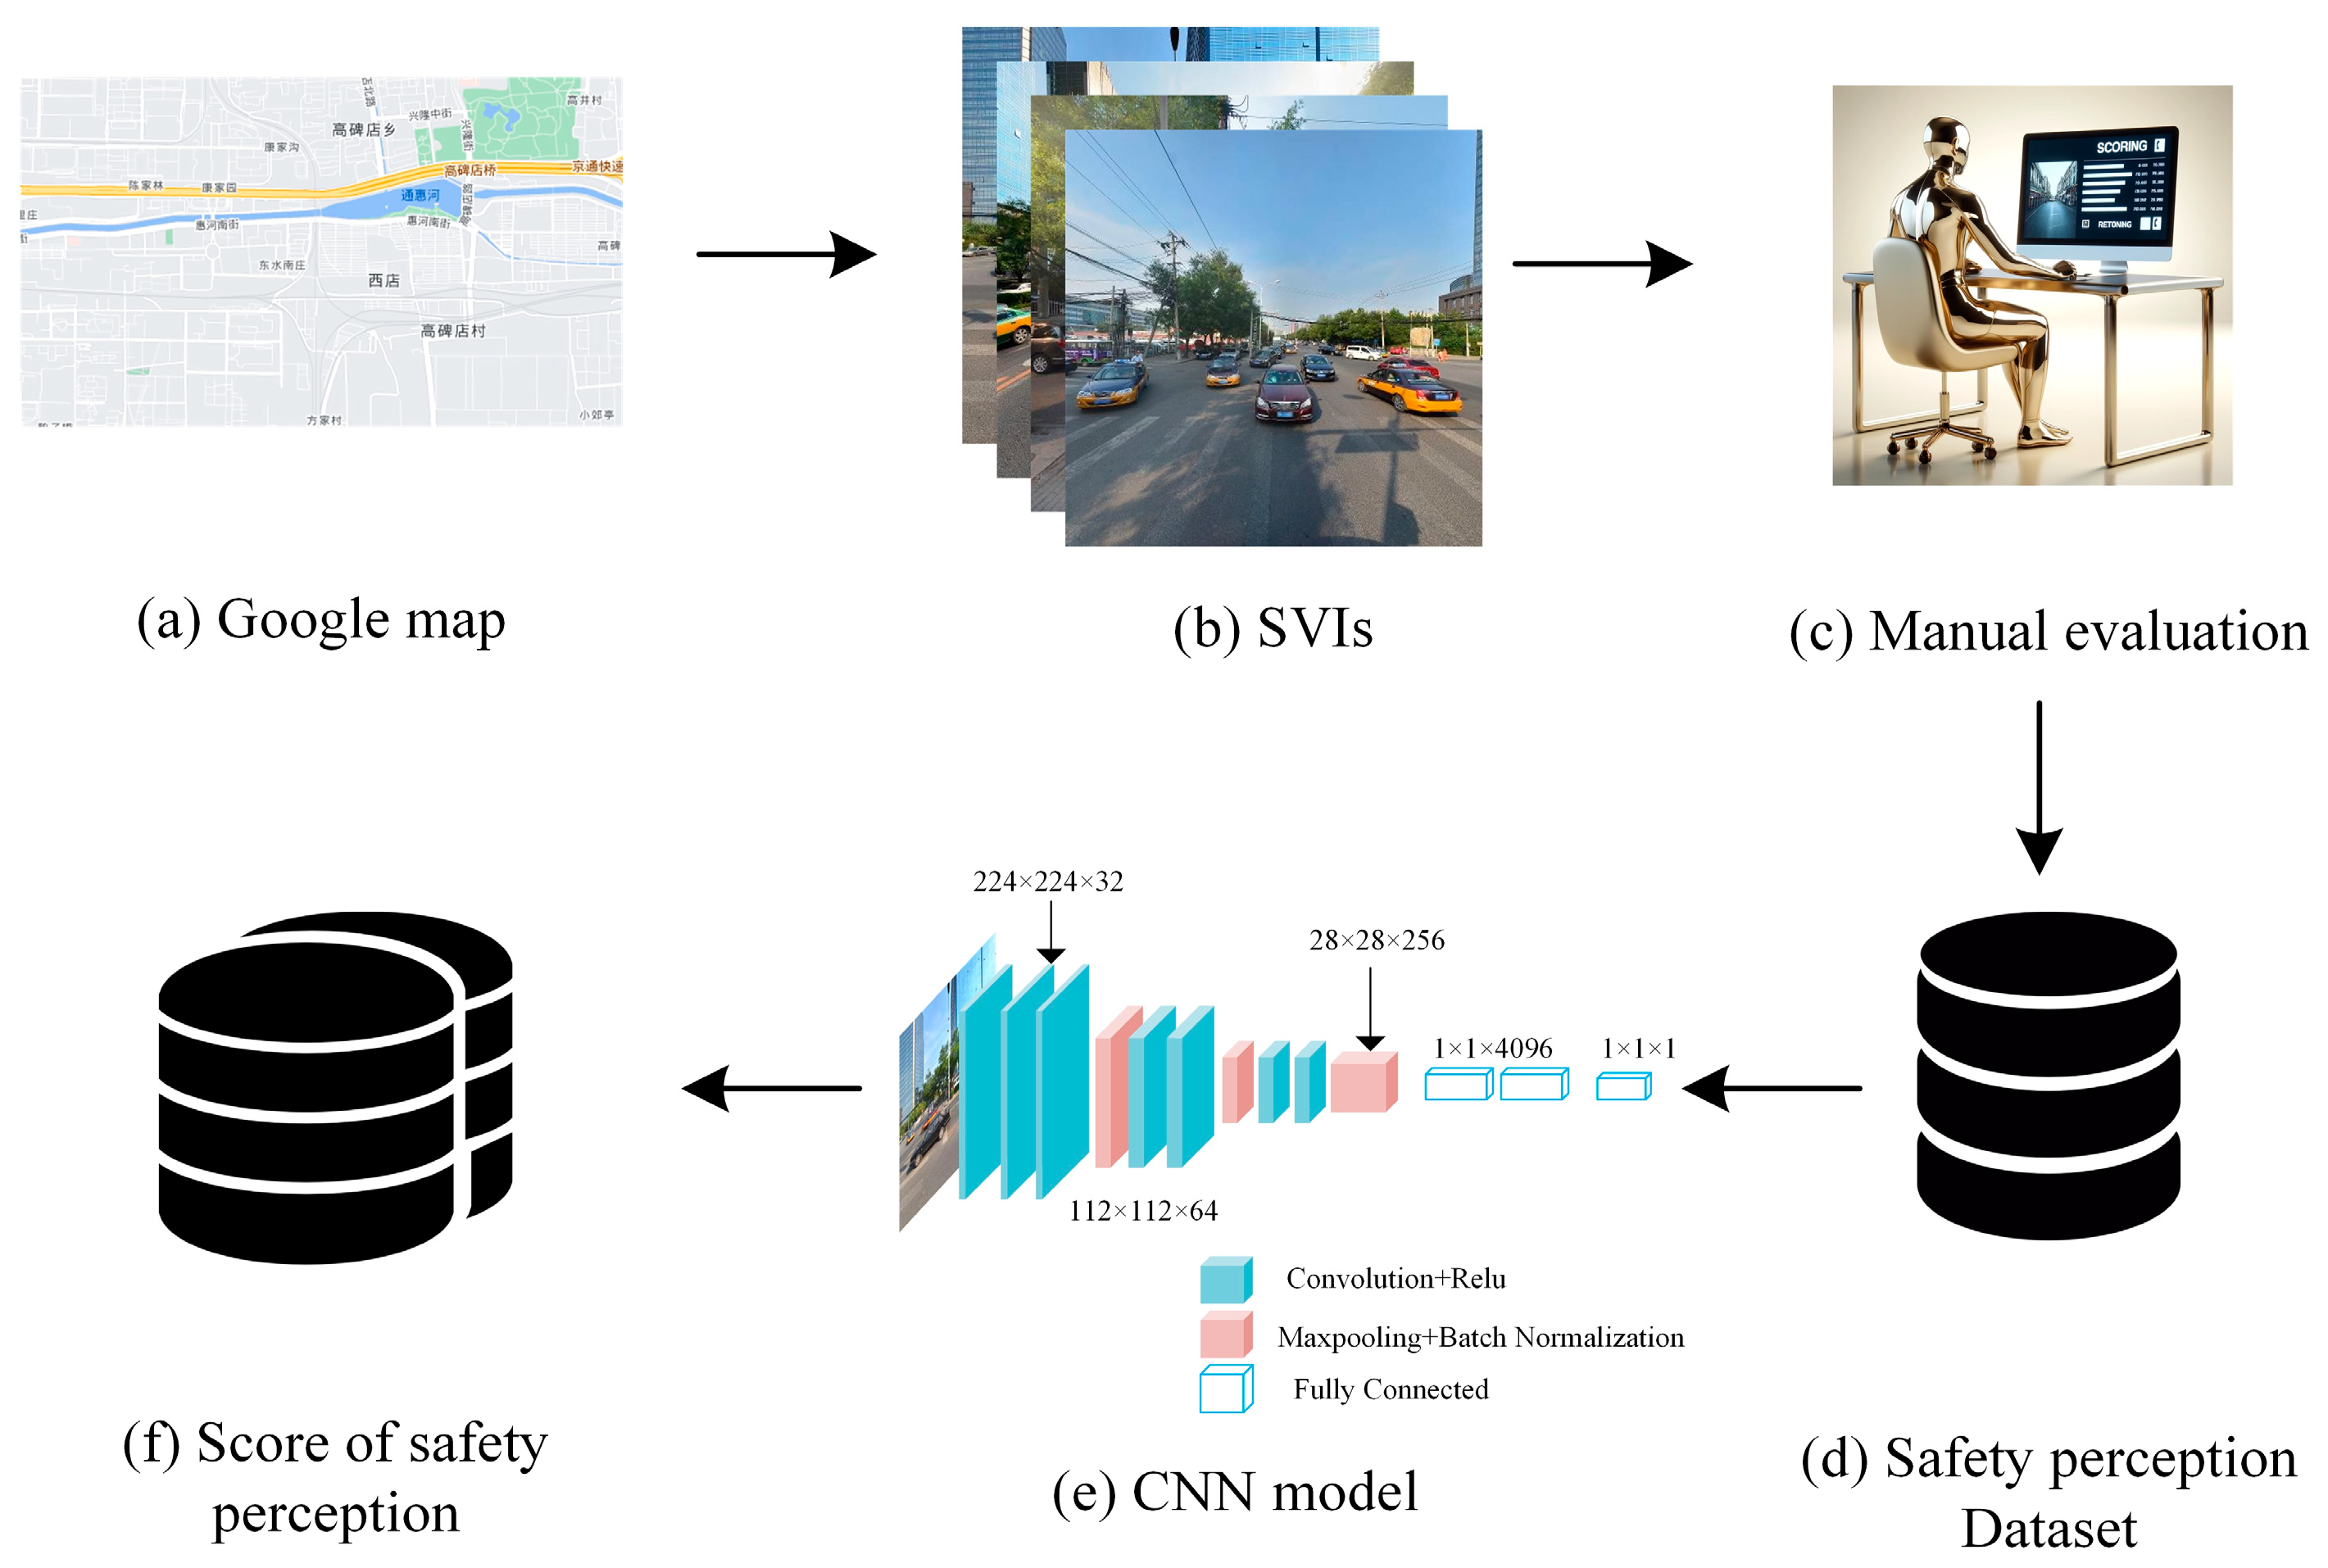
2.2.1. Research Framework
2.2.2. Safety Perception Score and Street View Element Extraction
- (1)
- Safety perception score
- (2)
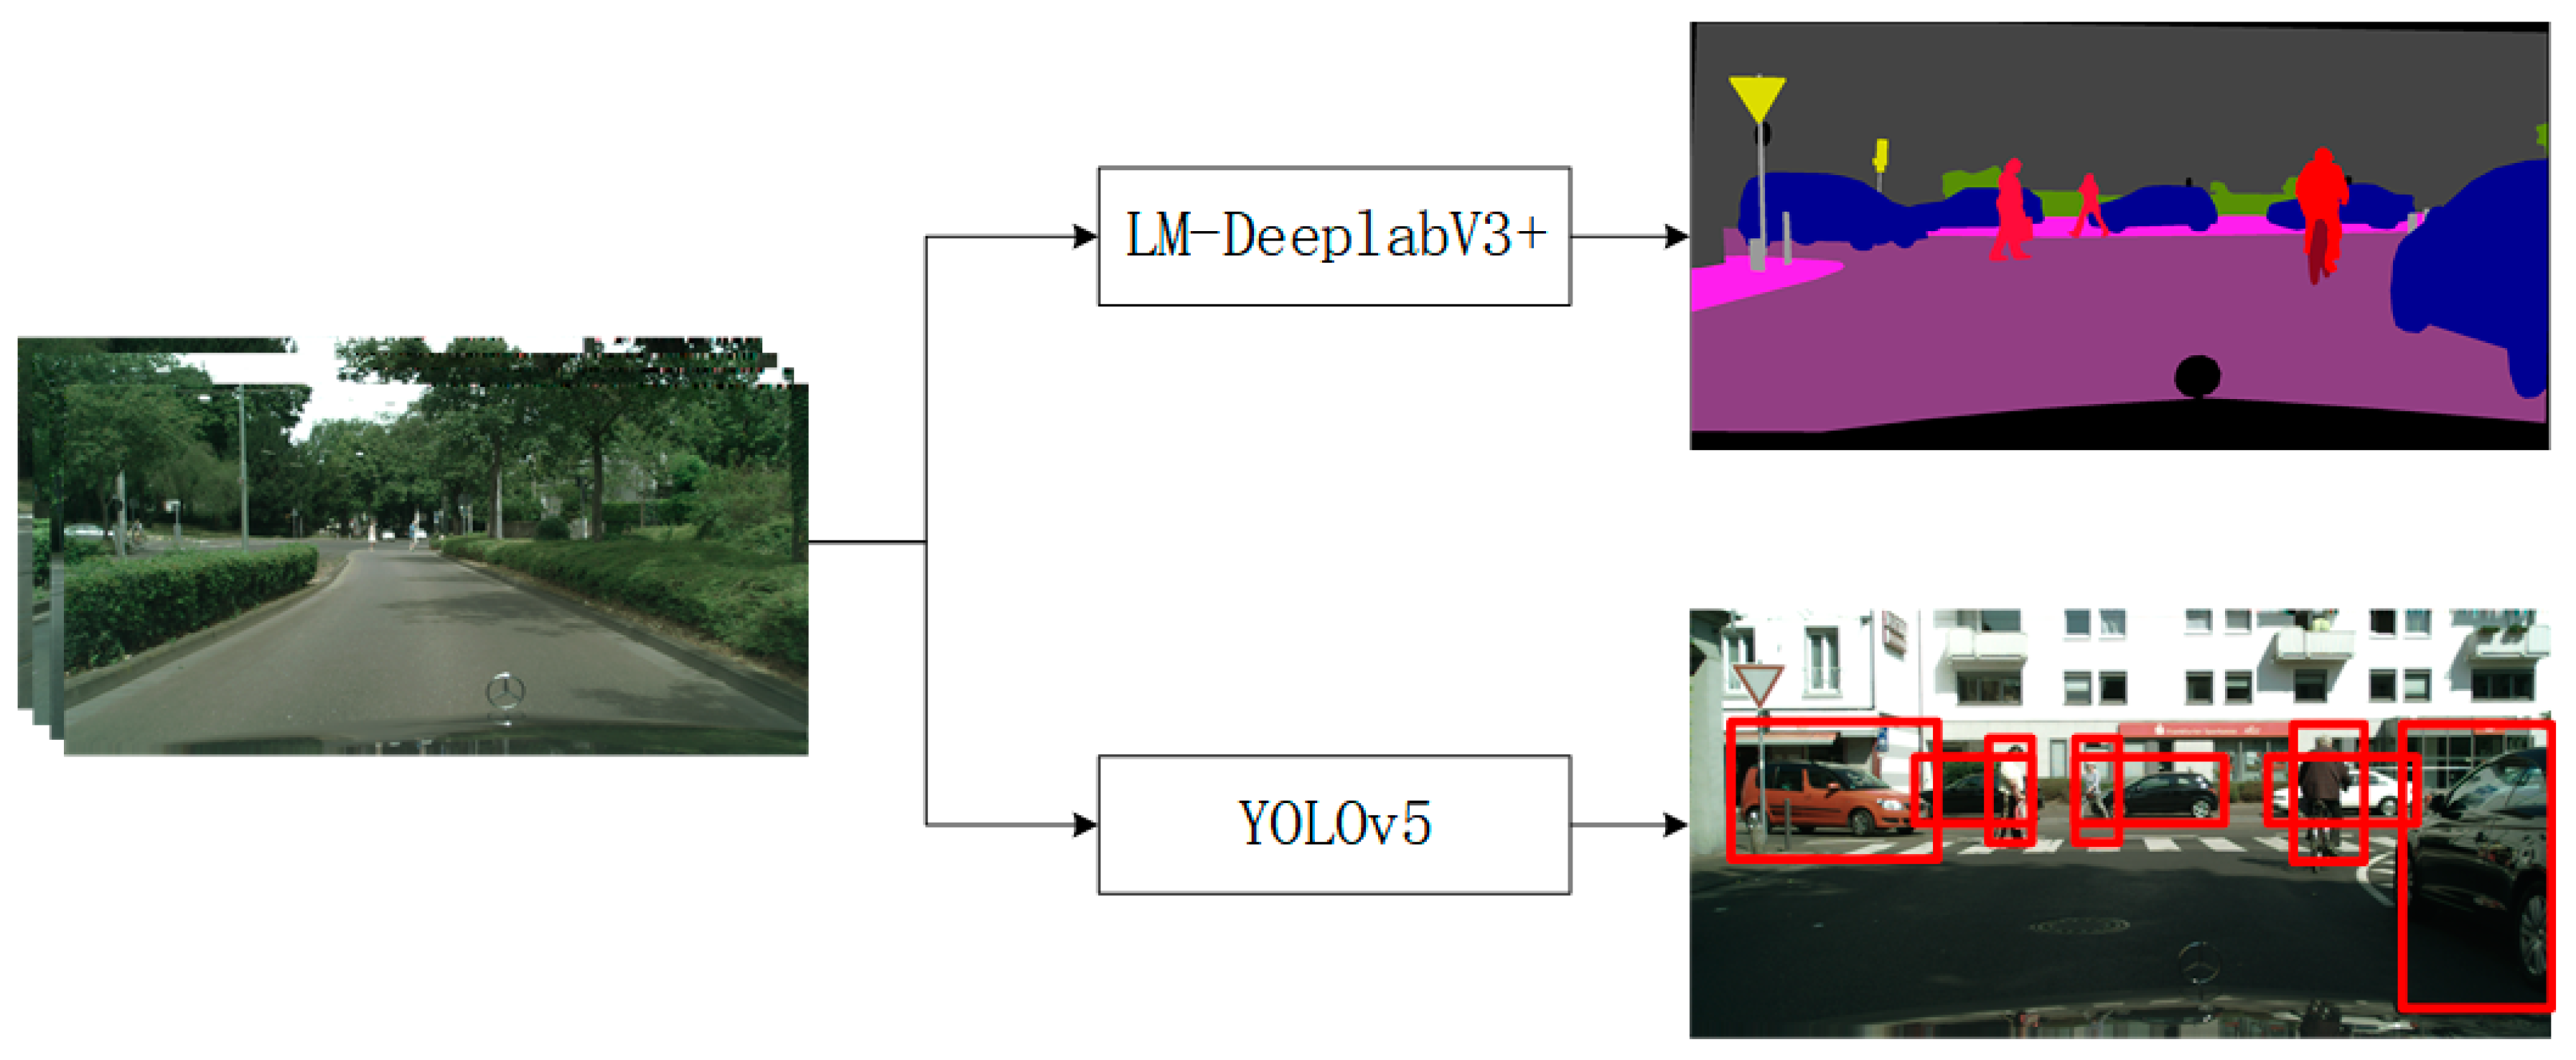
- Street view element extraction
2.2.3. LightGBM and SHAP
- (1)
- LightGBM
- (2)
- SHAP
3. Results
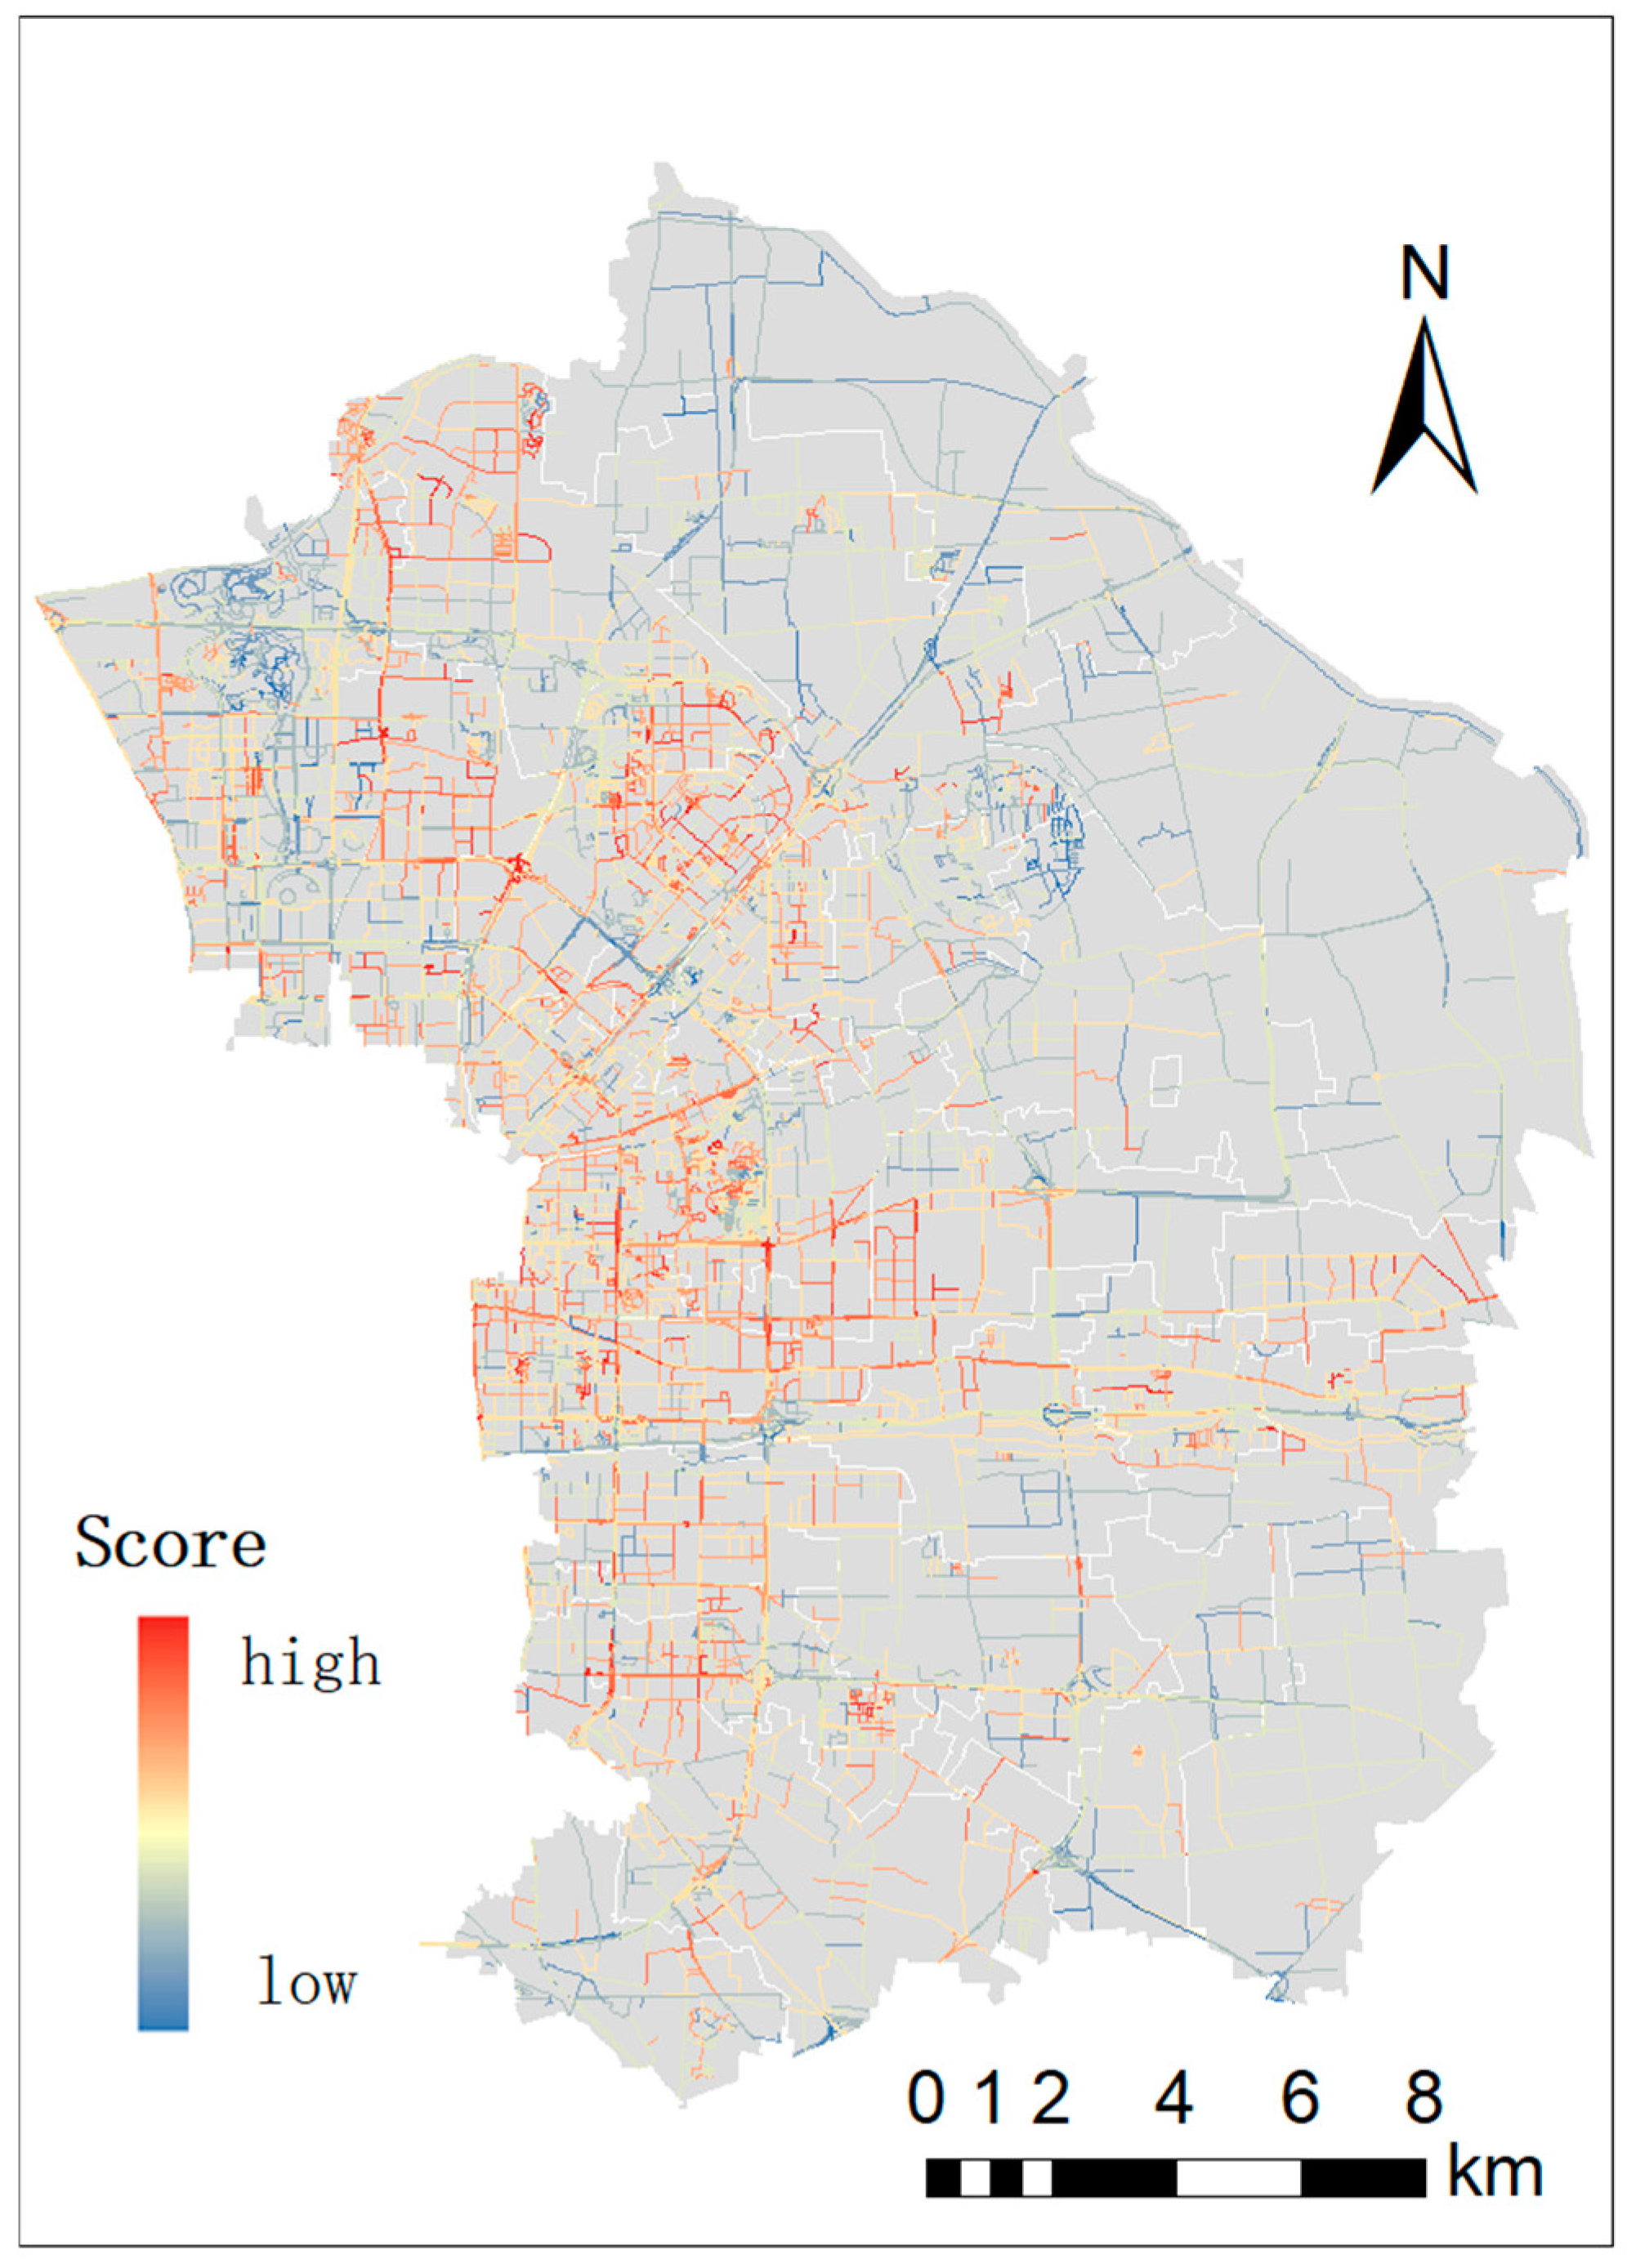
3.1. Spatial Distribution of Street View Safety Perception
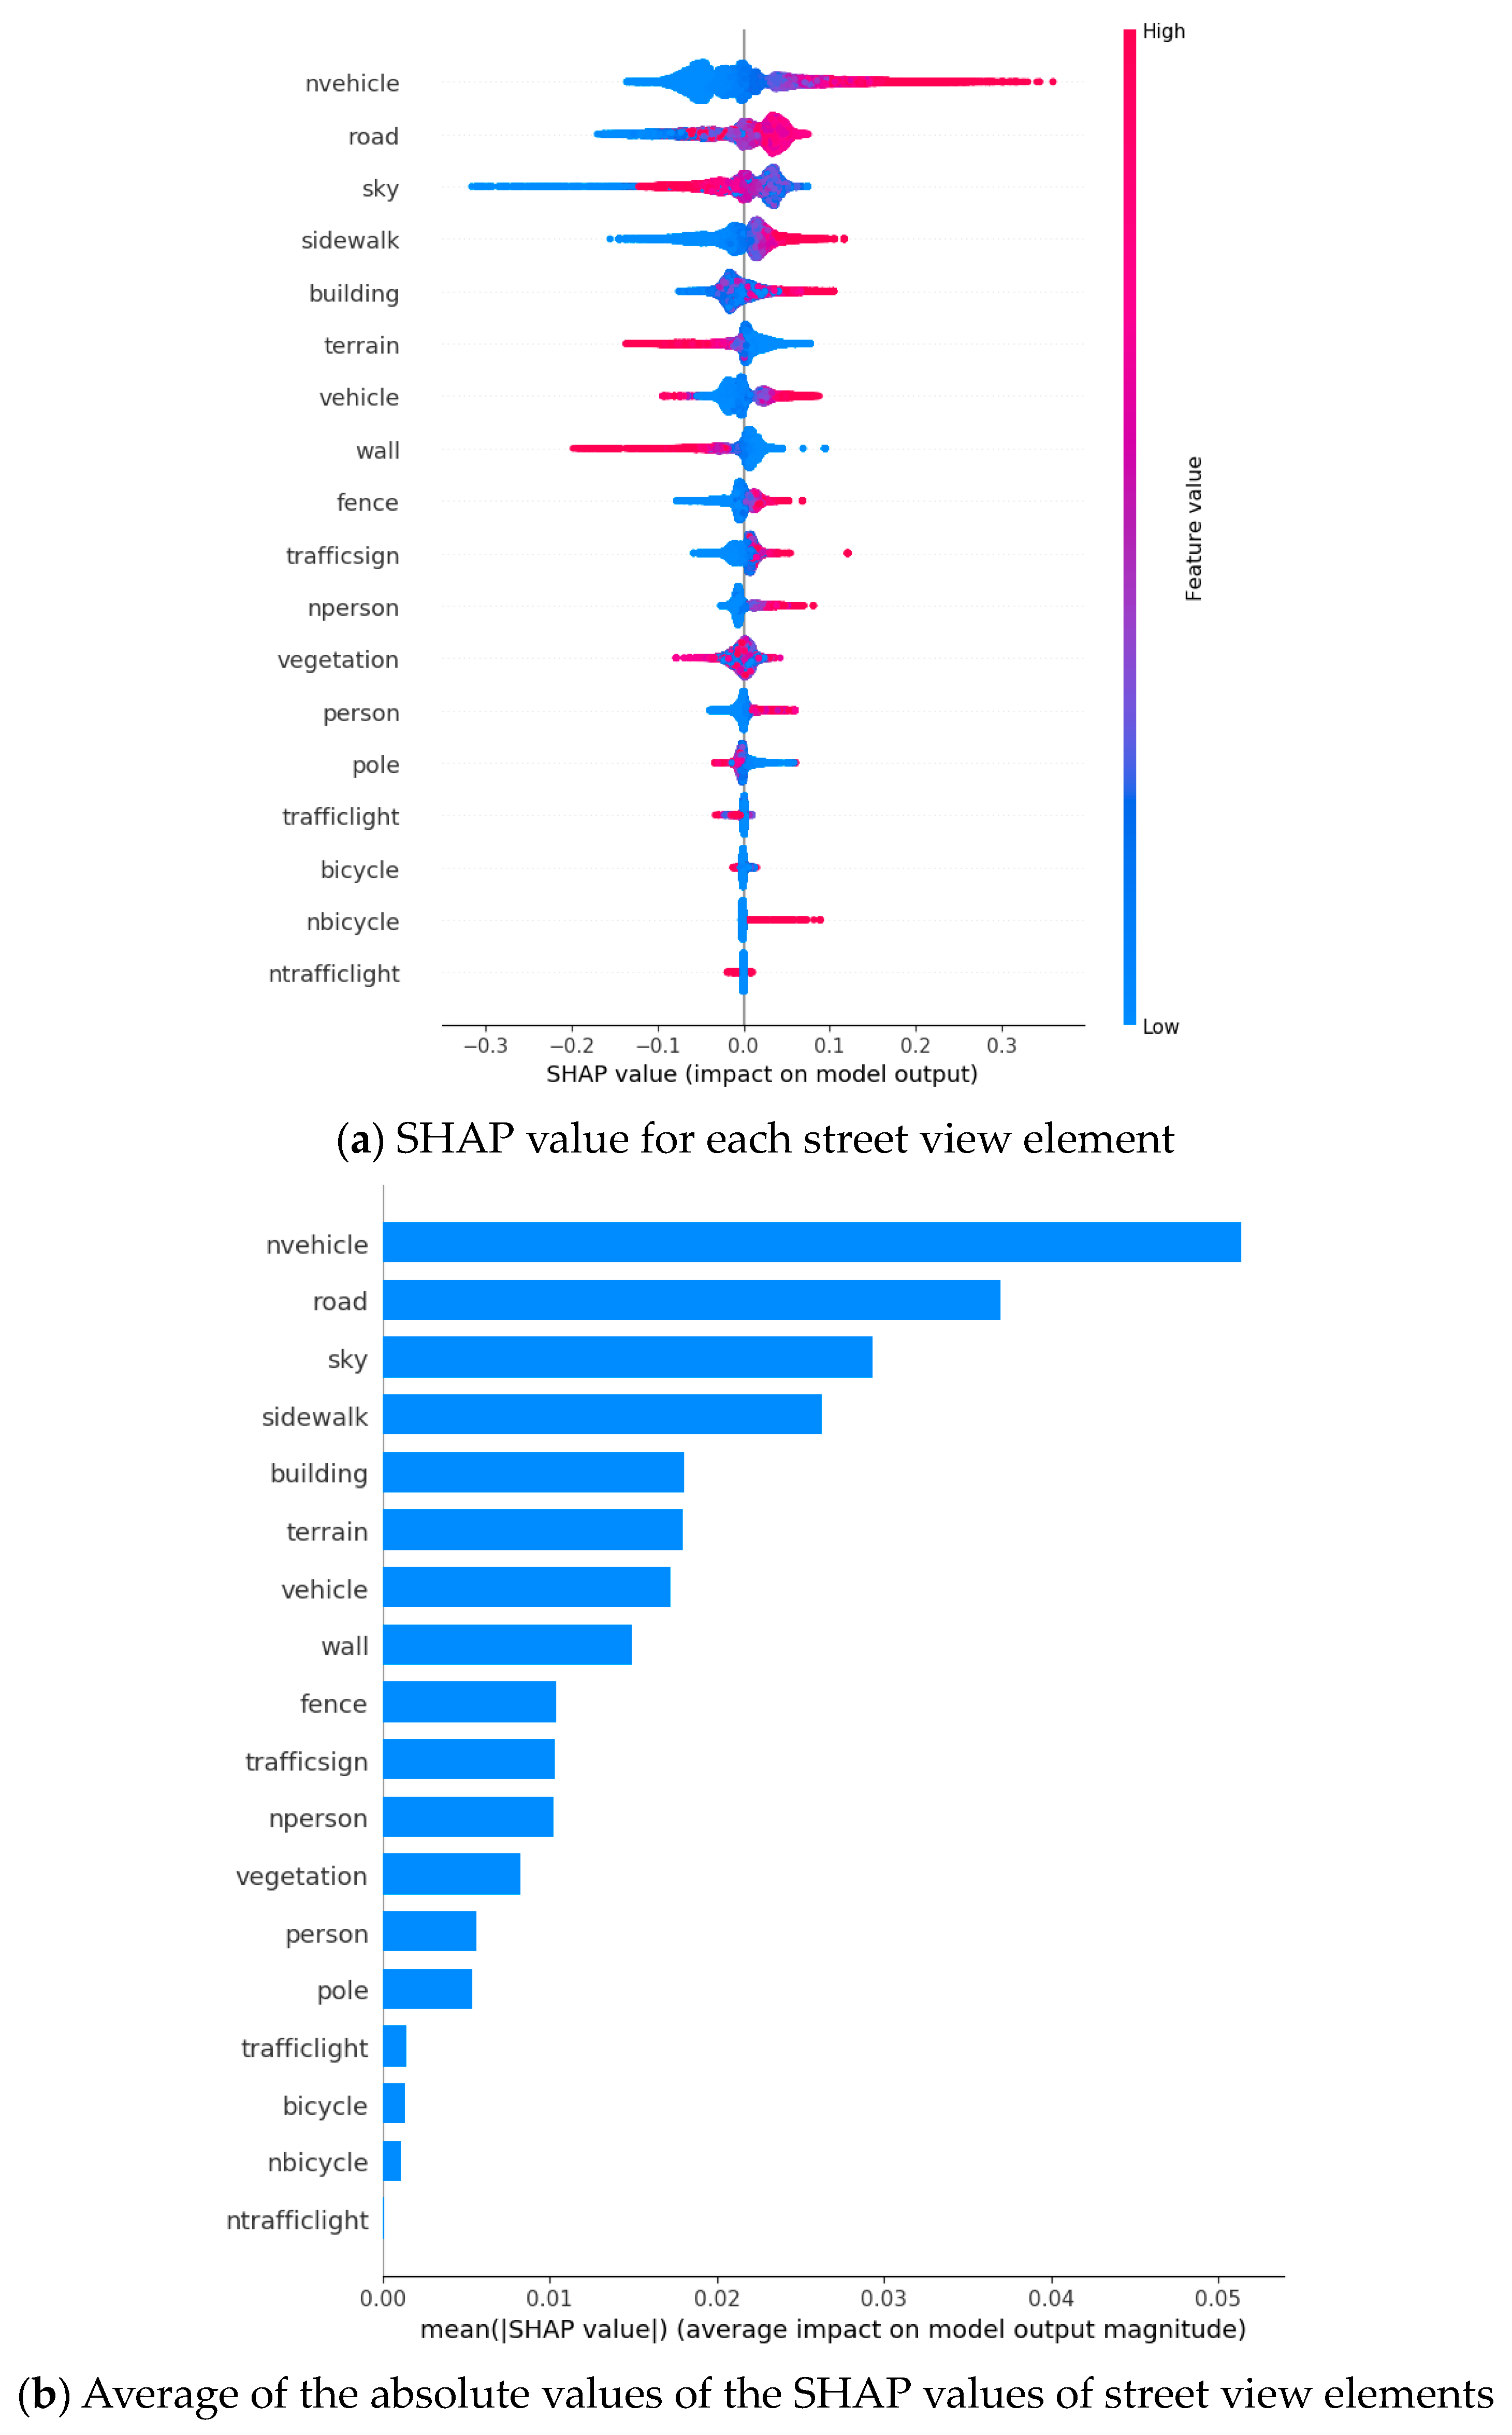
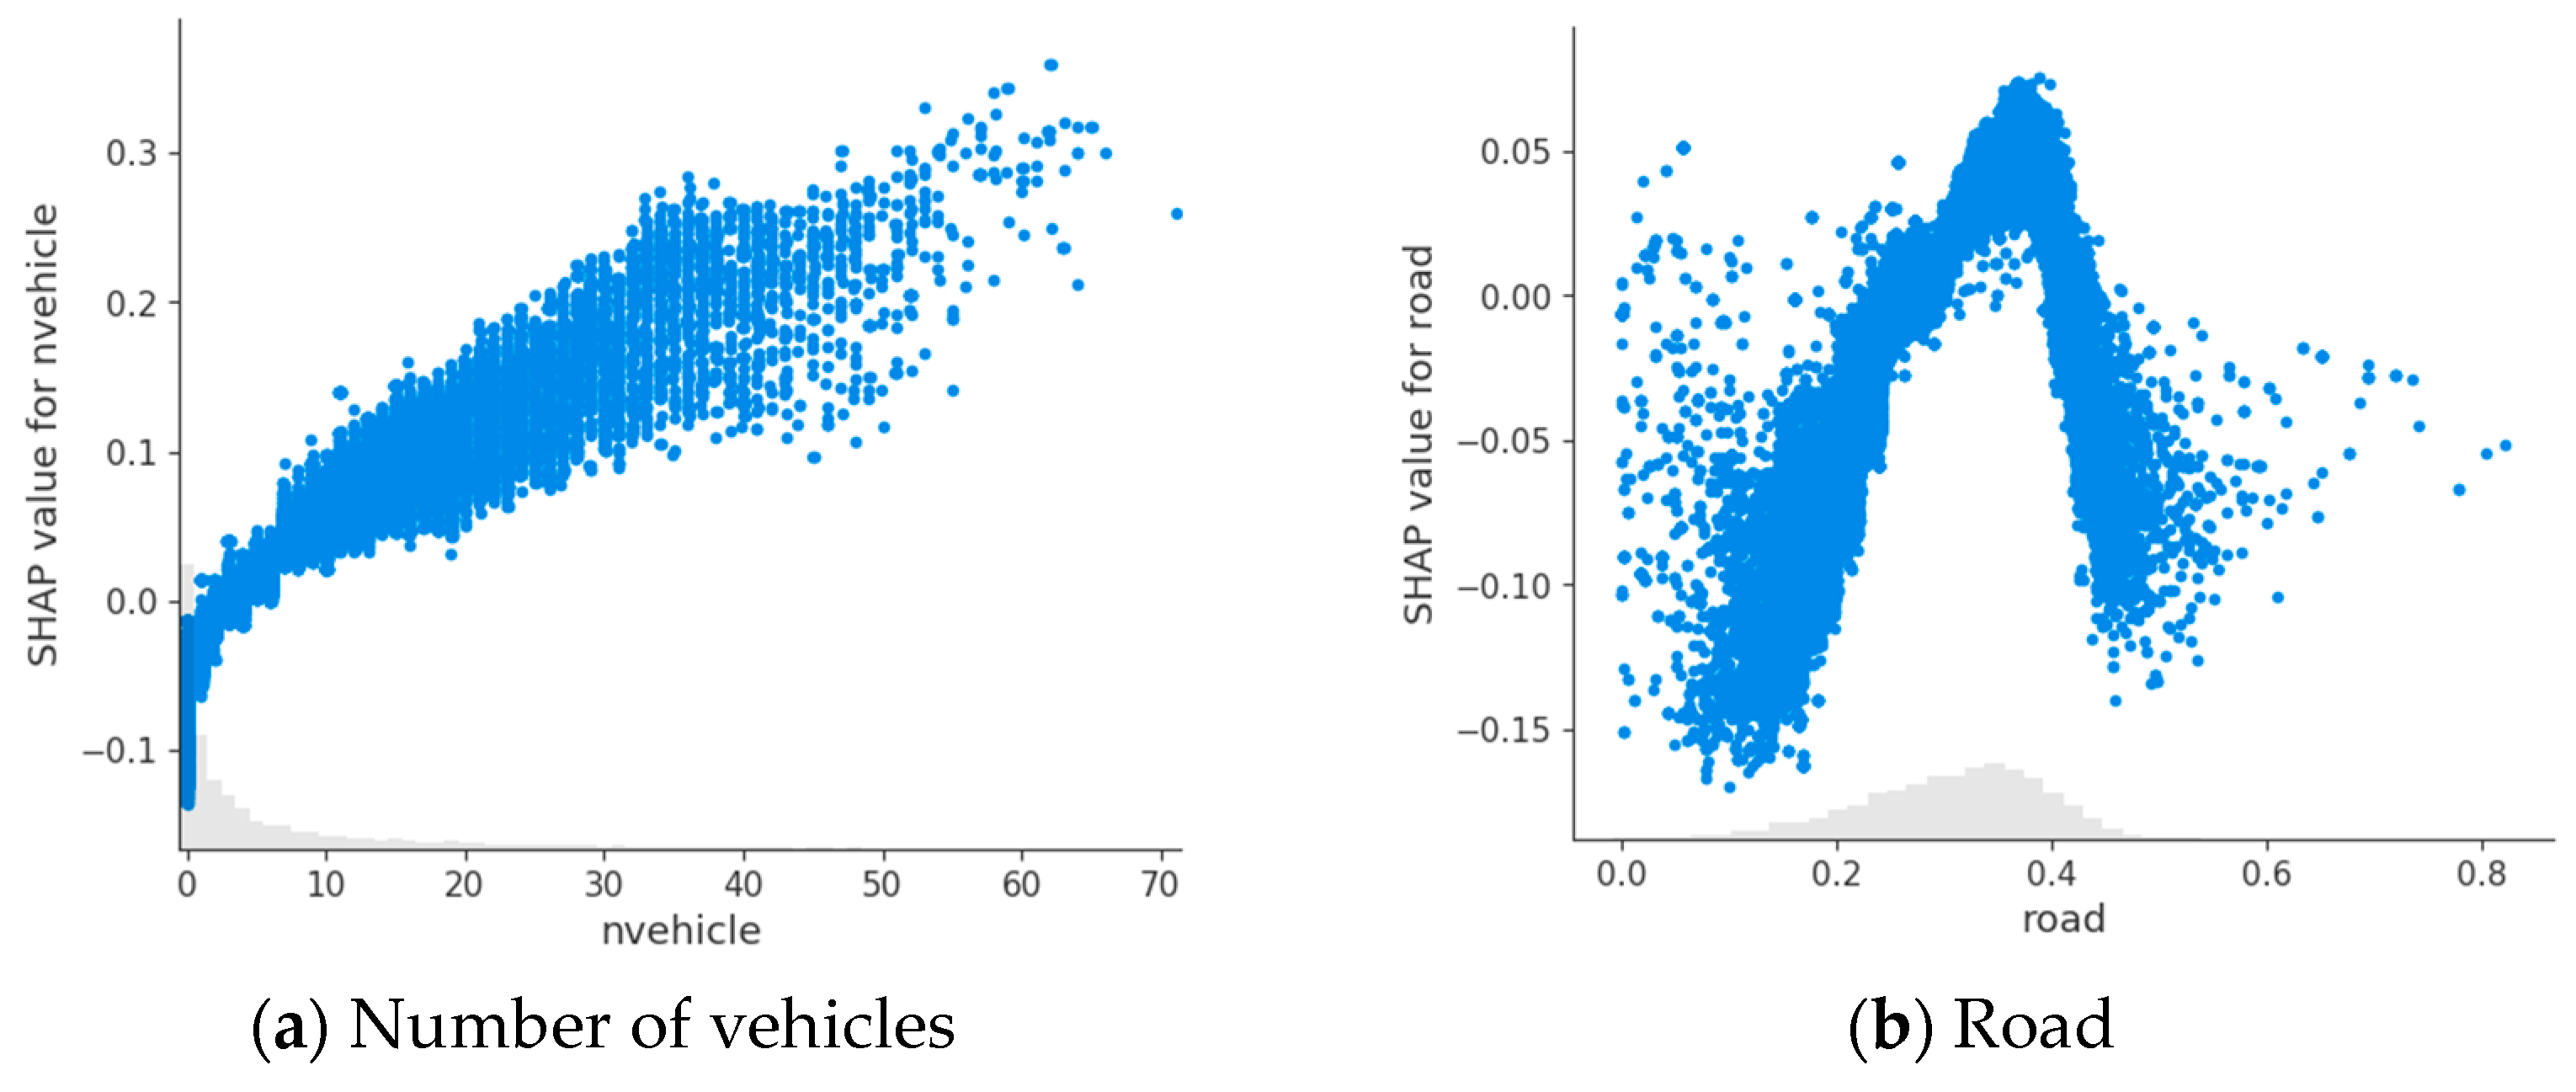
3.2. Analysis of Influencing Factors of Street View Safety Perception
3.3. Interaction of Street View Elements
- (1)
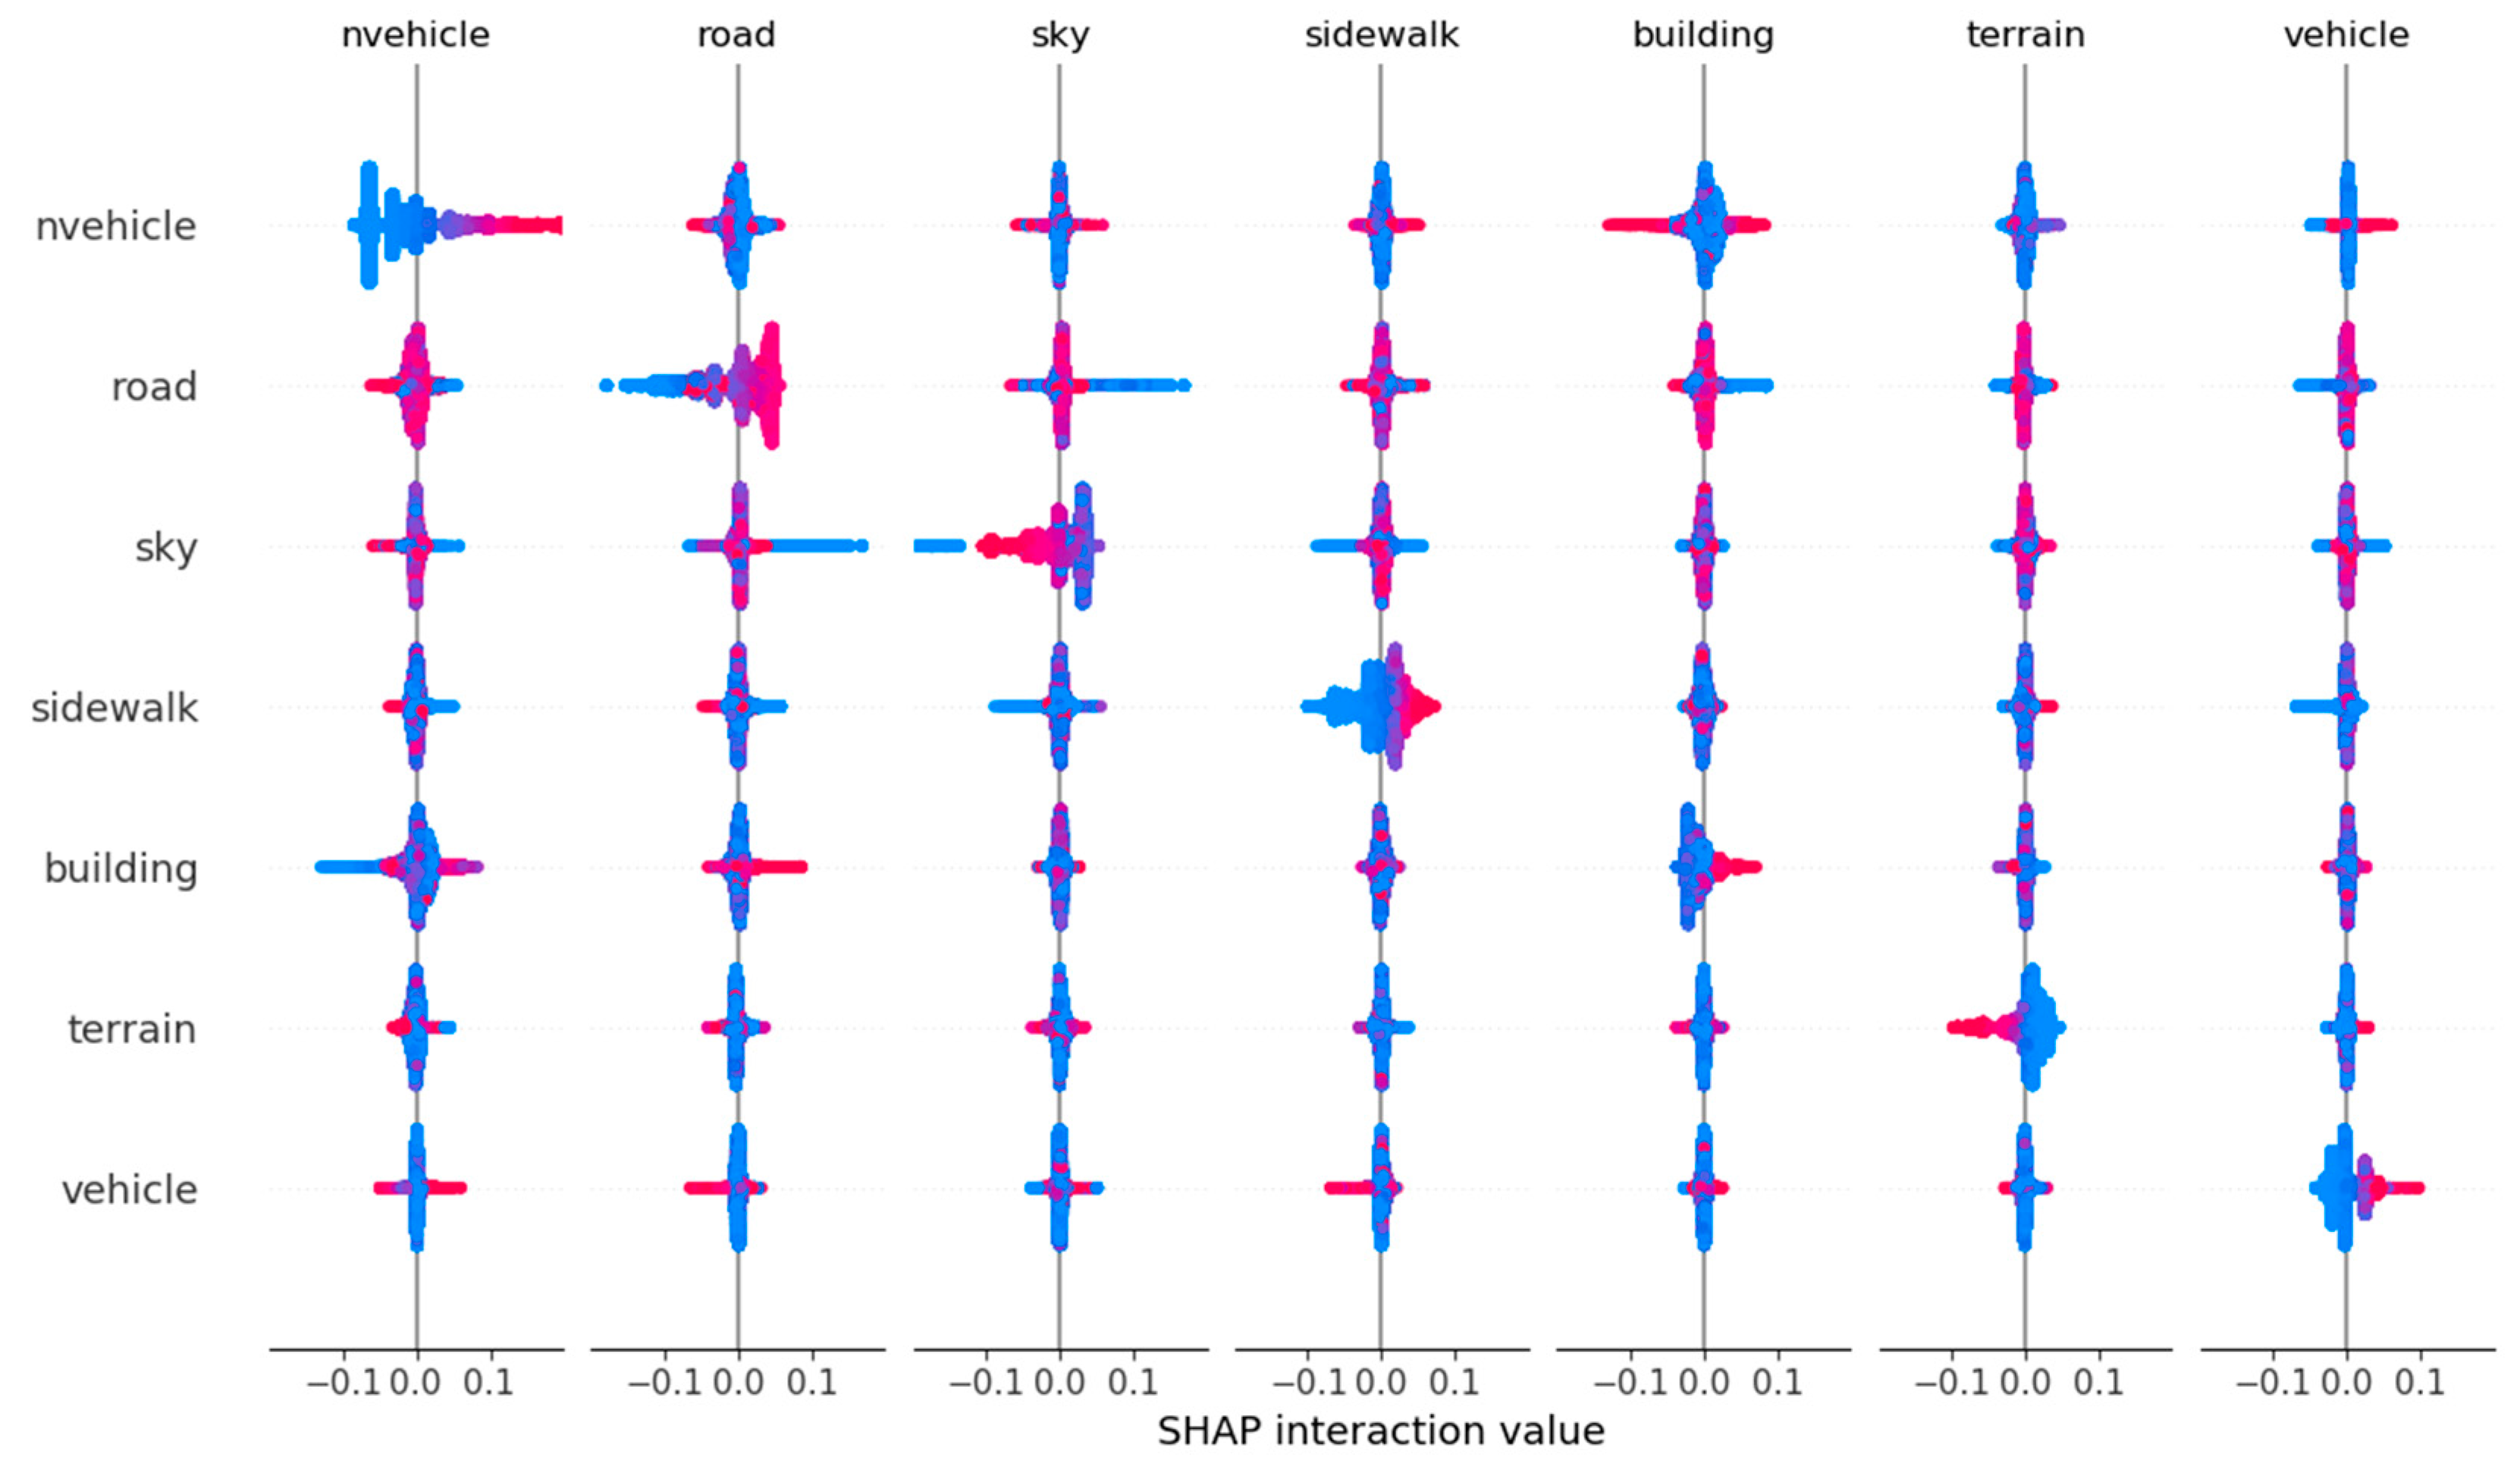
- Interaction of different street view elements on safety perception
- (2)
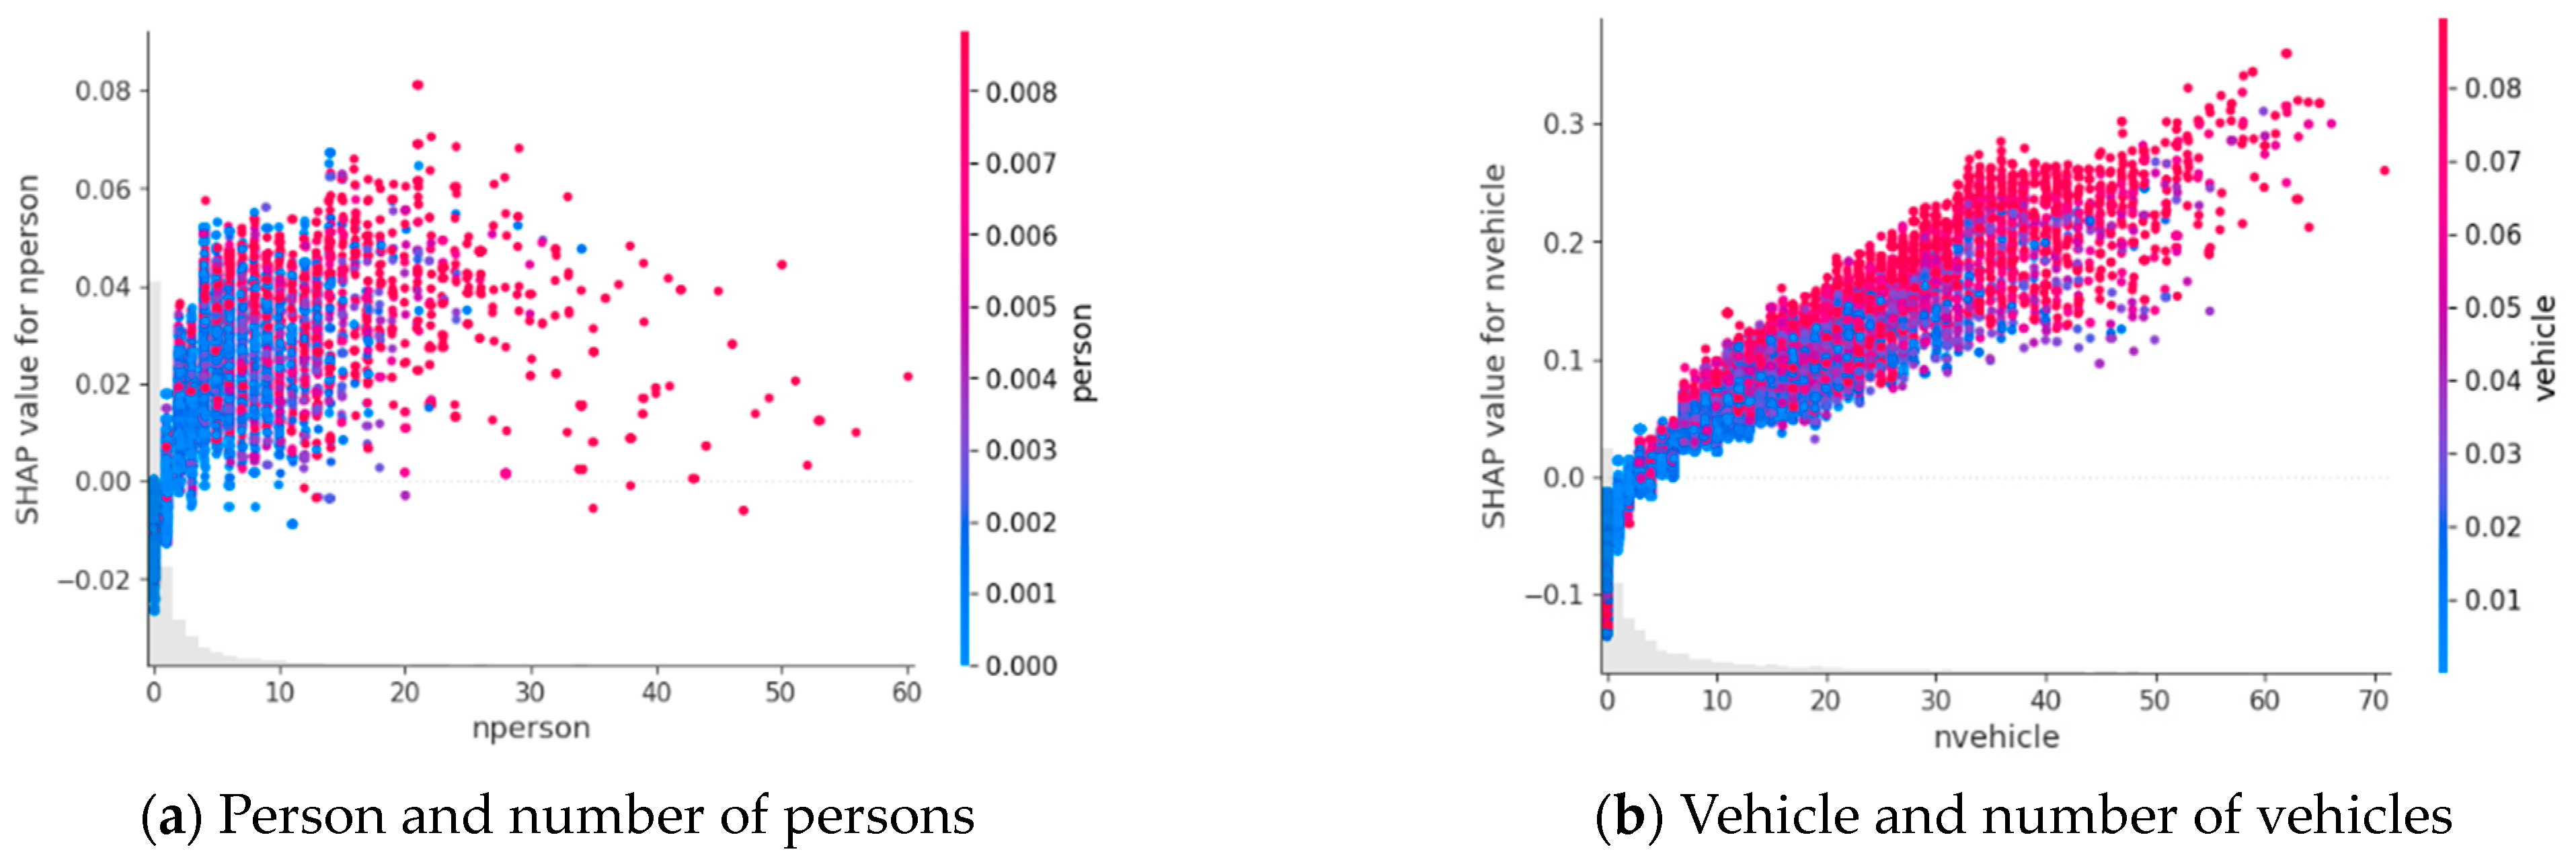
- Interaction between the proportion and quantity of street view elements
3.4. Local Interpretation of Street View Environment
4. Conclusions
4.1. Conclusions
- (1)
- The overall street view safety perception level of Chaoyang District in Beijing is relatively high. The region with the highest level of safety perception is the western central region with dense road networks, which has a high economic level and dense population. The overall level of safety perception in the eastern region is relatively low, and the road network in this region is relatively sparse, indicating that the level of economic development is relatively low compared with the western region, and the street construction is not as good as the western region as a whole. The rich and diverse functional layout increases accessibility and watchability, which has a positive impact on enhancing safety perception [63].
- (2)
- The four most influential street view elements are the number of motor vehicles and the proportion of the area of roads, skies, and sidewalks. Among them, the greater the number of motor vehicles and the higher the proportion of roads and sidewalks, the greater the positive impact on safety perception and the higher the degree of safety perception; the higher the proportion of sky area, the greater the negative impact on safety perception and the lower the degree of safety perception. Human activities can increase informal monitoring, thereby enhancing residents’ safety perception.
- (3)
- There is interaction between street view elements on safety perception: when the number of motor vehicles is fixed, the greater the proportion of road area is, the less conducive to the improvement of safety perception; when the number of motor vehicles is fixed, the larger the proportion of building area, the more conducive to the improvement of safety perception. When there are fewer roads and more buildings, it is more conducive to the improvement of safety perception. When the proportion of sky area is fixed, the more trees, the less conducive to the improvement of safety perception. The proportion and number of street view elements interact with safety perception: when the number of pedestrians is less than two, the area proportion of fewer pedestrians will make people feel safer. When the number of motor vehicles is less than four, the area proportion of motor vehicles is relatively small, which makes people feel safer; when the number of motor vehicles is large, the larger the proportion of motor vehicles, the more people feel safe. This discovery is consistent with the findings of psychological research, and the impact of human behavioral activities on environmental safety perception is also consistent with CPTED.
- (4)
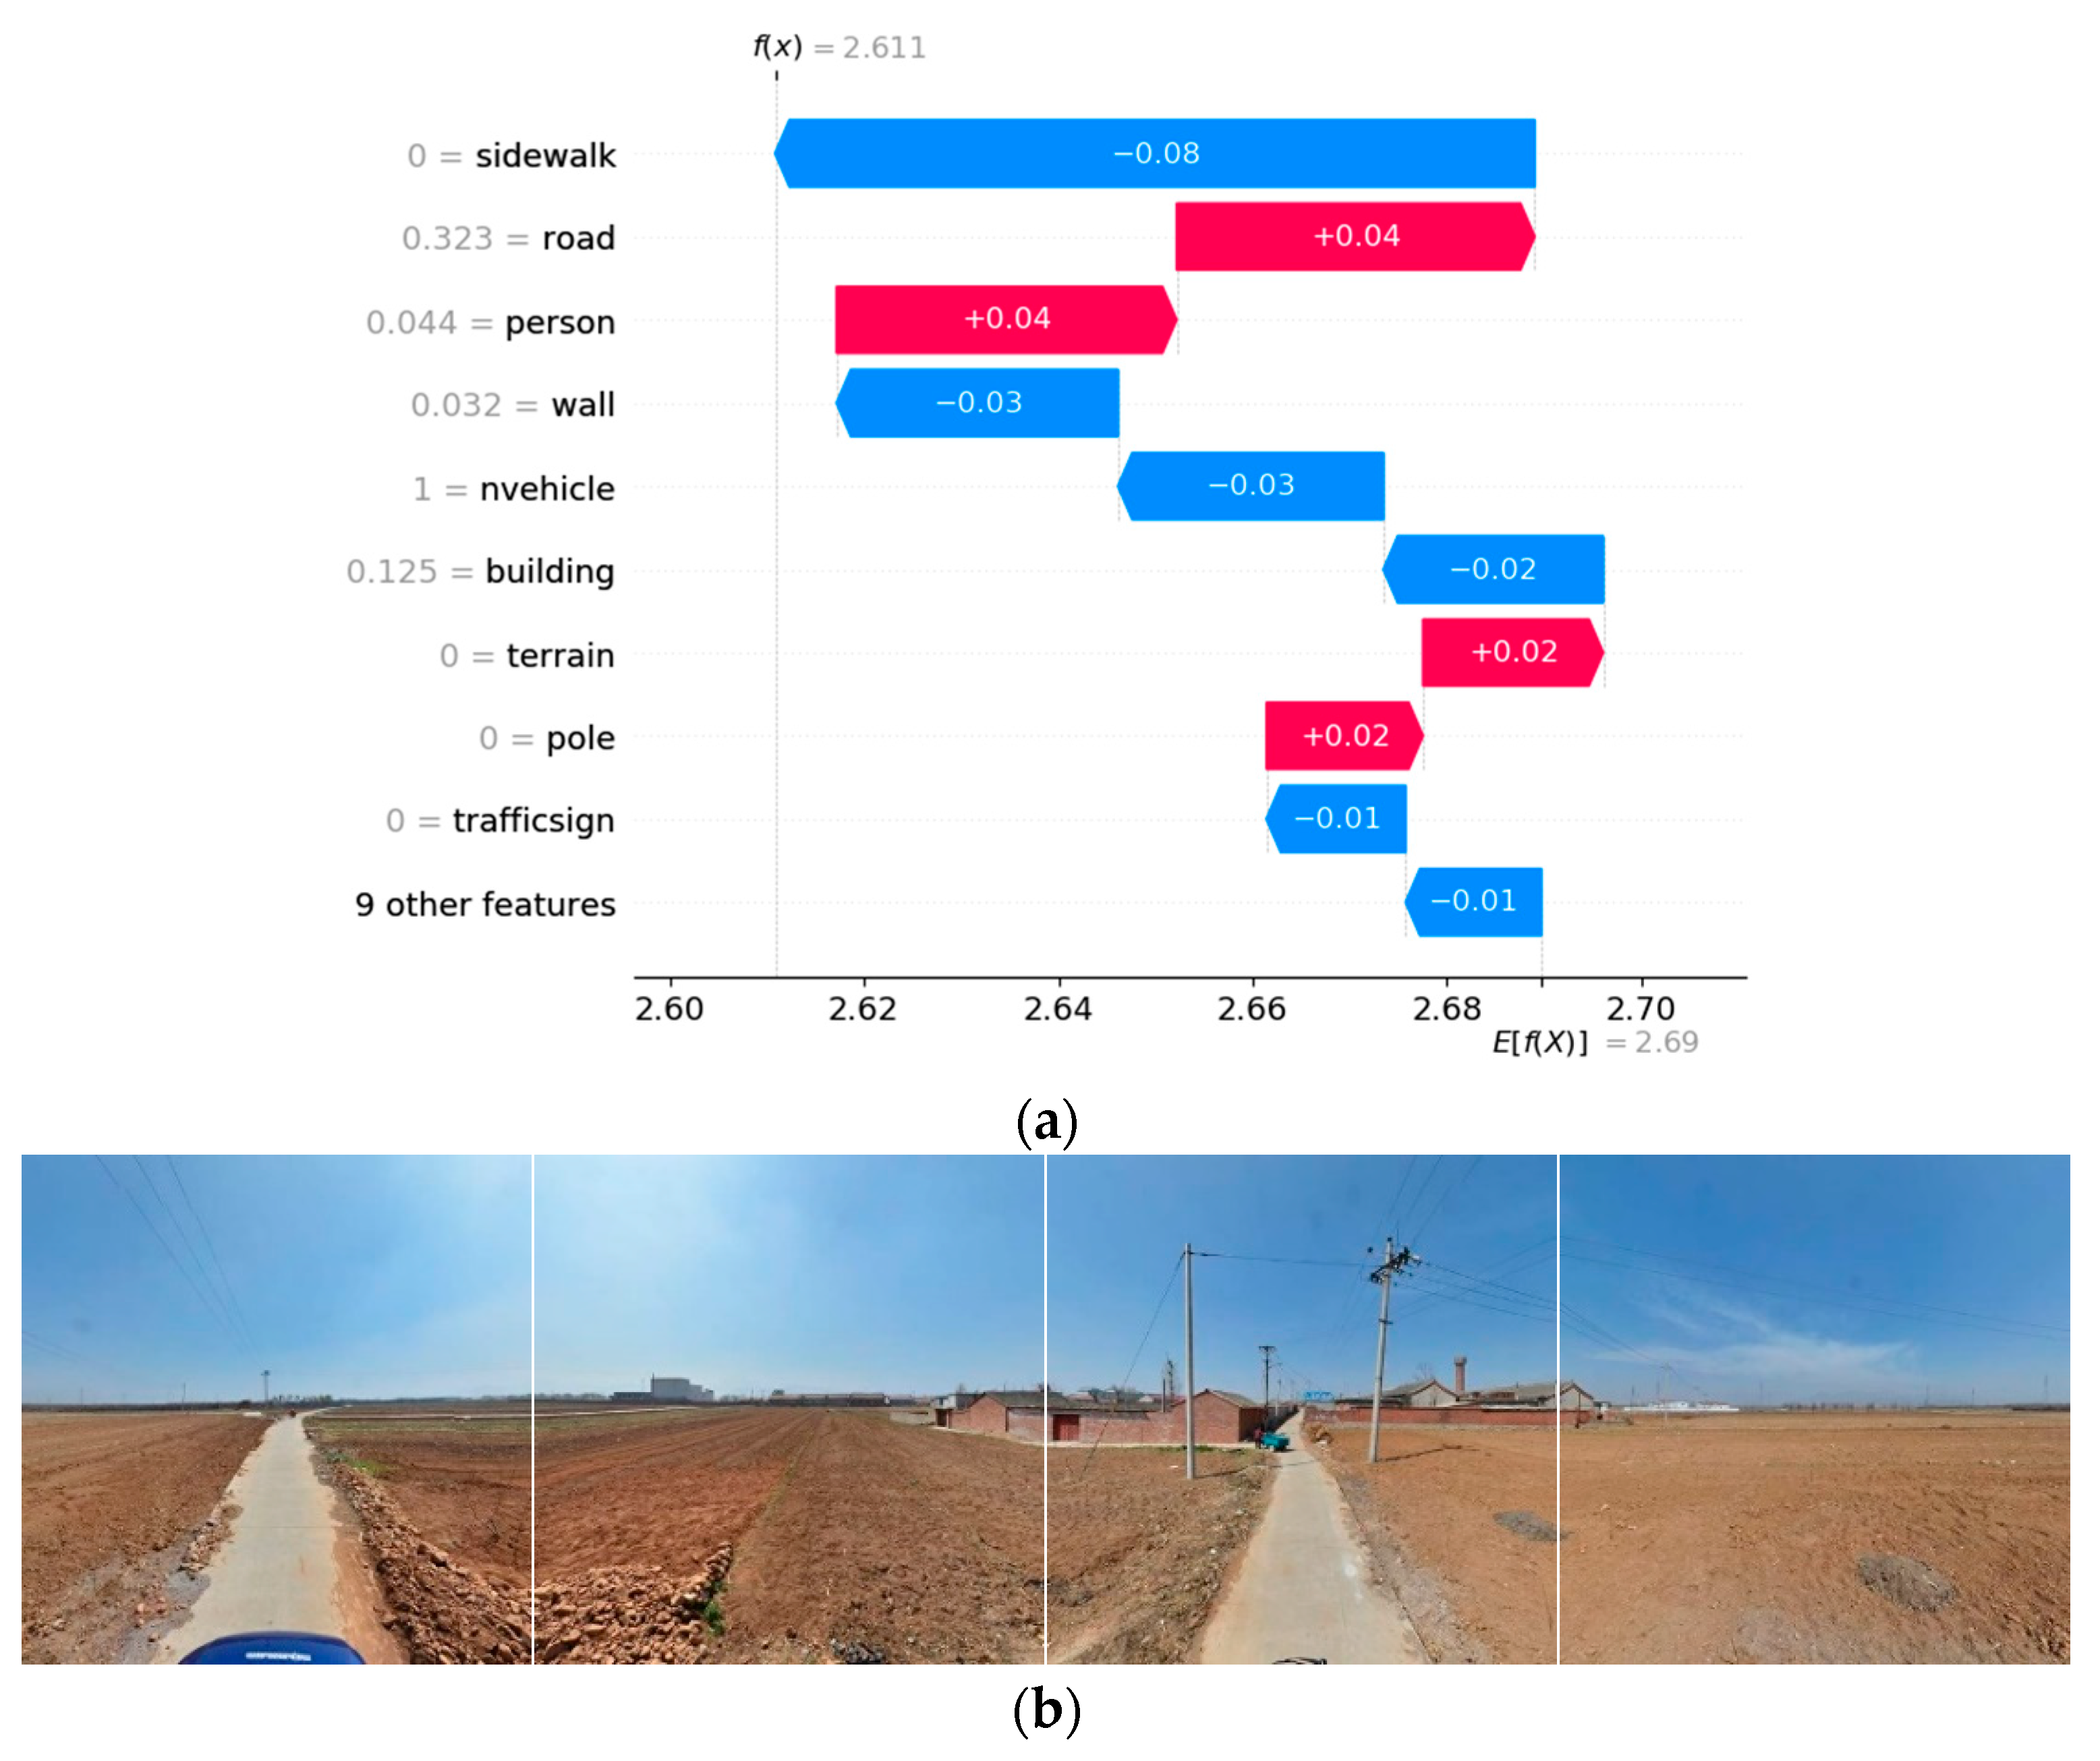
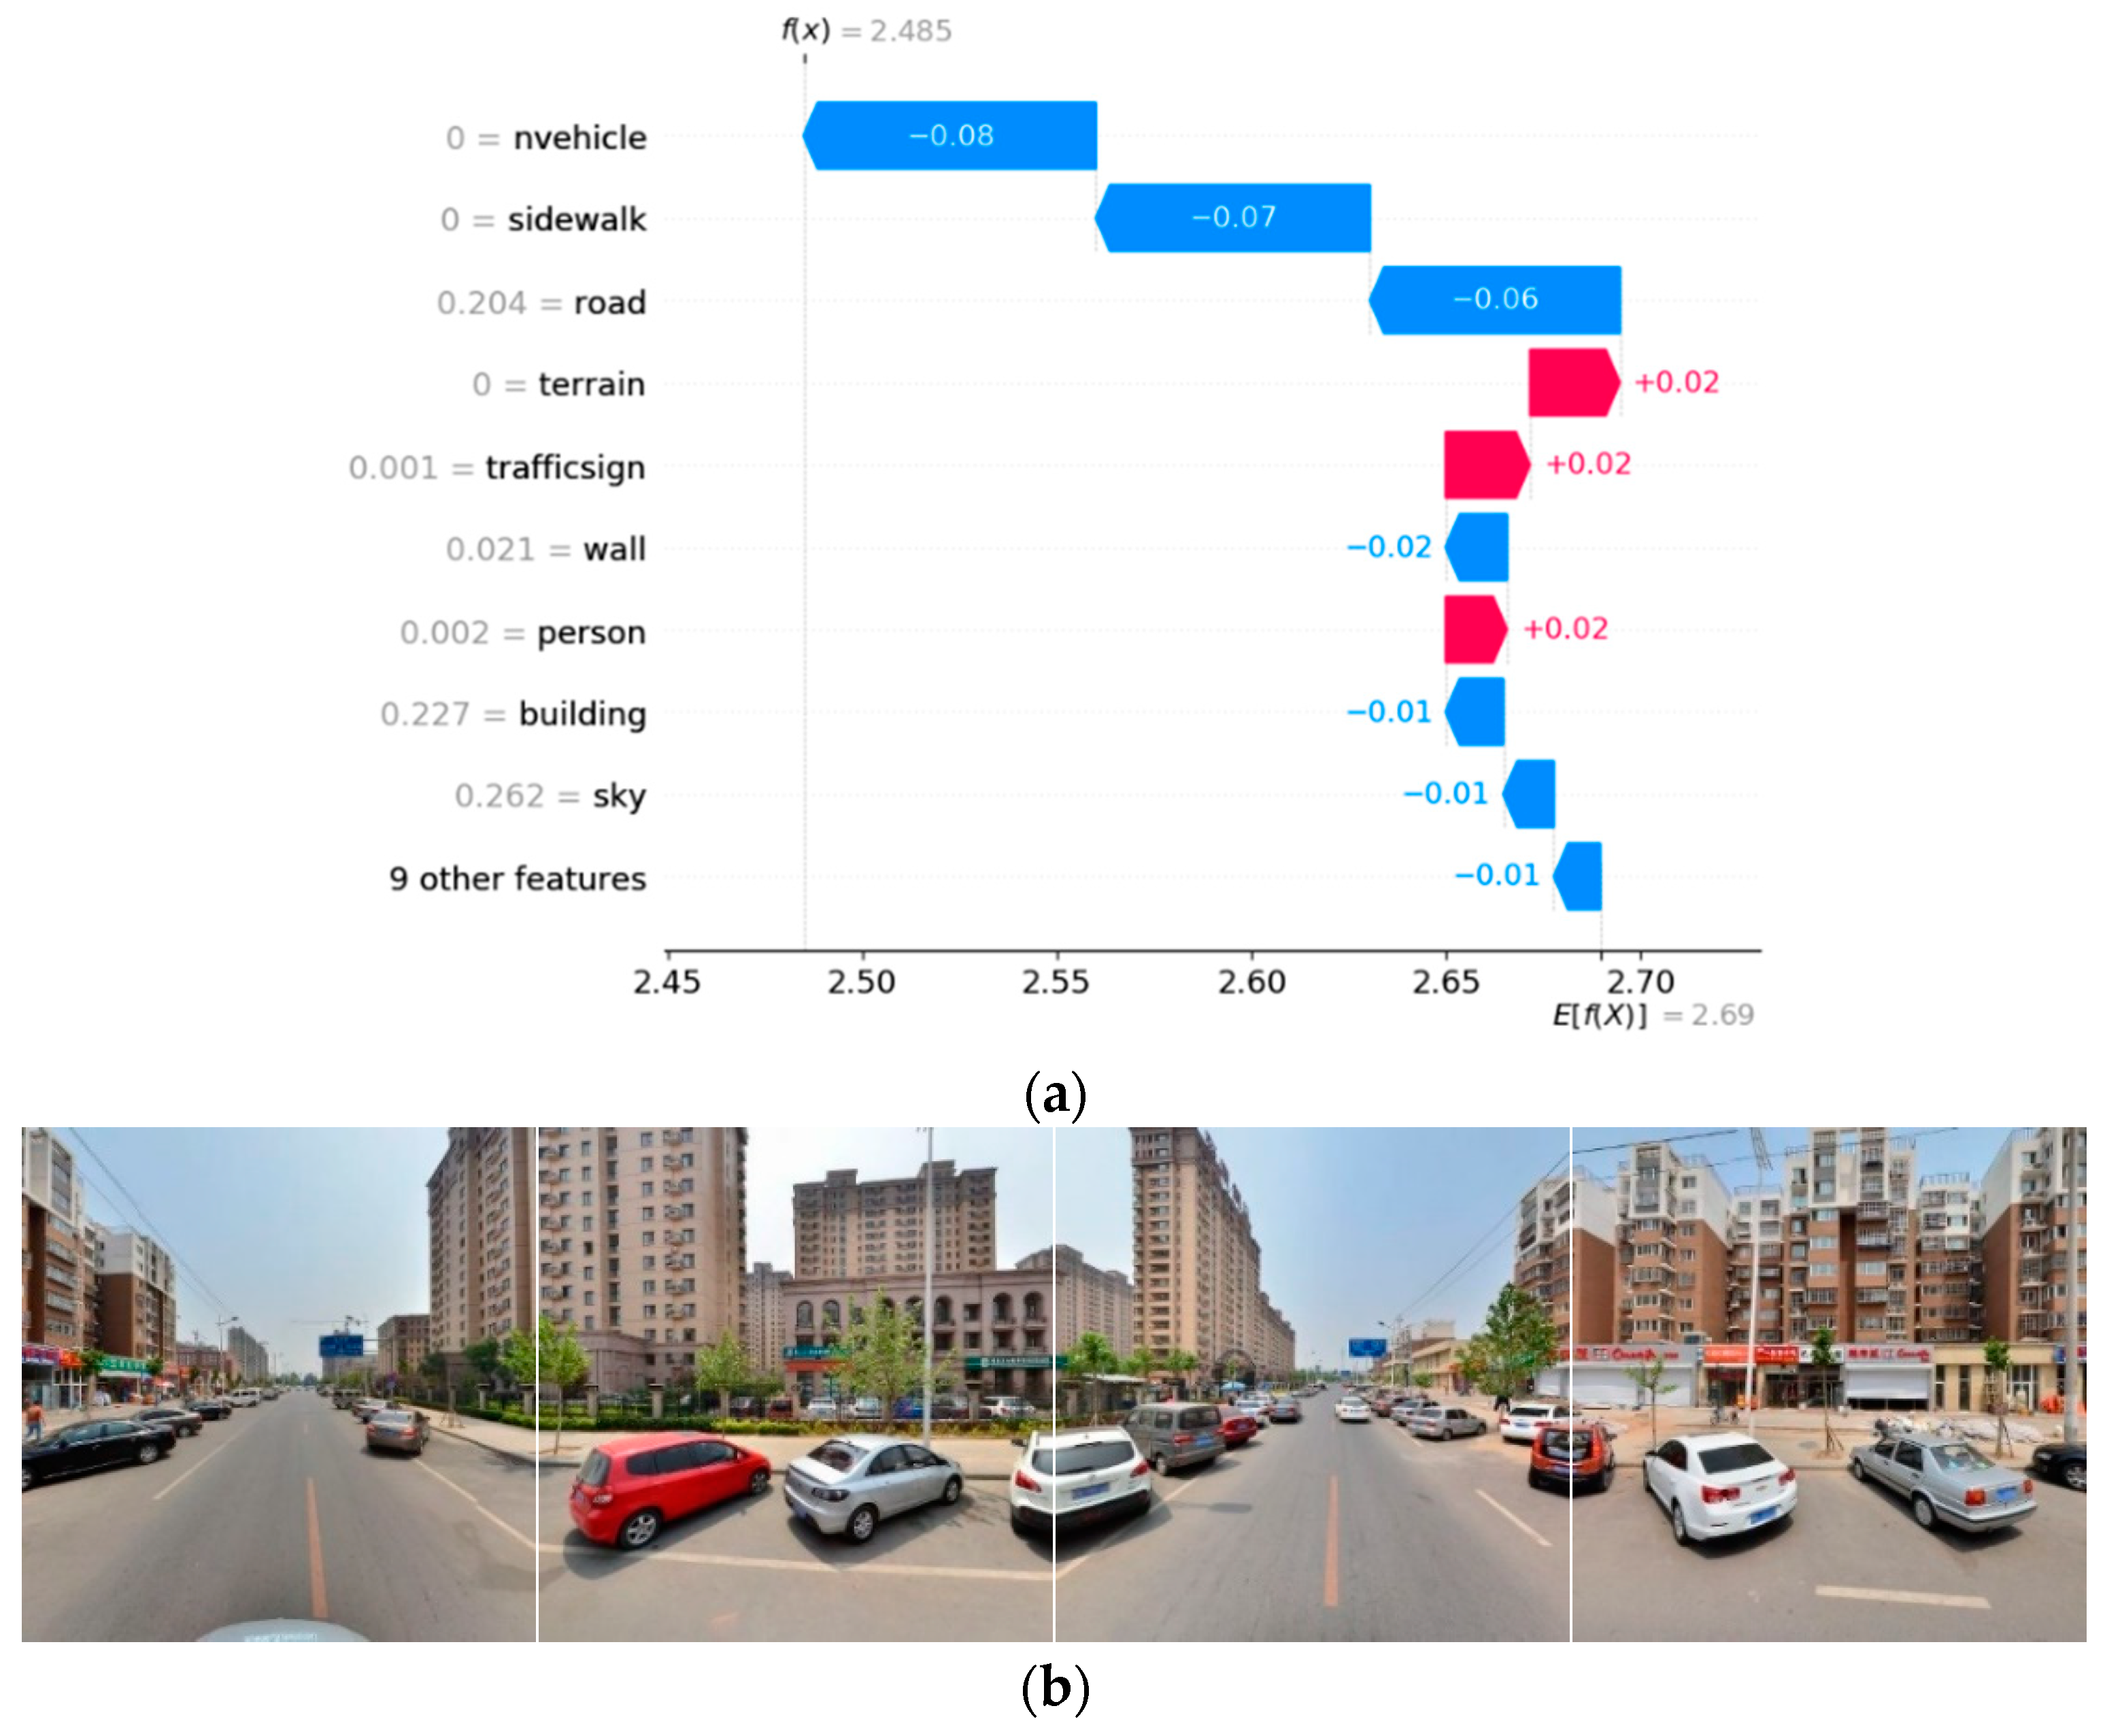
- In the sections with the lowest, moderate, and highest level of safety perception, the influence of street view elements on street view safety perception is inconsistent. In the place with the lowest safety perception, sidewalks have a significant negative impact on safety perception, while roads and pedestrians can significantly have a positive impact on safety perception. In places with moderate safety perception scores, the number of motor vehicles and sidewalks have significant negative effects on safety perception scores, while pedestrians, the sky, and roads have significant positive effects. For the places with the highest score of safety perception, the number of motor vehicles and the proportion of sidewalks and roads have the most significant impact, which has a significant negative impact on safety perception. The ground, traffic signs, and pedestrians have a certain positive impact, while the wall has a certain negative impact. It can be seen that the contribution of various street view elements to safety perception varies in different regions.
4.2. Implications for Practice
- (1)
- Appropriate monitoring can significantly enhance people’s safety perception. In areas with low safety perception, emphasis should be placed on improving the infrastructure for security prevention and security control mechanisms and configuring security infrastructure such as installing surveillance cameras.
- (2)
- Strengthen the deployment of police resources and patrols in areas with low safety perception; invest in public security human resources and improve the level of public safety service management.
- (3)
- In addition, building a good community environment can enhance residents’ safety perception. By promoting comprehensive management of spatial blind spots, making efficient use of the Internet to innovate police work, and strengthening cooperation between the police and the residents, residents’ safety perception will be improved.
4.3. Research Deficiency
- (1)
- In view of the limited resources, the safety perception dataset of this study is the domestic dataset constructed by the existing research. Although they are all domestic cities, there will be some differences between different cities. Therefore, in the follow-up study, we can consider building a local safety perception dataset in the study area to obtain more objective and real safety perception data.
- (2)
- Due to the large amount of data and limited computing resources, the image processing in this paper selects a relatively lightweight semantic segmentation and target detection model, and the processing results have some errors. In the future, more accurate models and more powerful computing resources can be used to process data.
- (3)
- The research on the interaction of street view elements in this article is at a macro level, and the interaction of street view elements may vary in different regions. We will conduct more detailed research on this issue in the future. In addition, due to the limitations of street view image data, only daytime data can be obtained on a large scale. Therefore, we have not yet considered the performance differences in different time periods.
- (4)
- The research in this article revolves around street view images, and the analysis is also based on the information obtained from street view images. For variables such as the surrounding built environment and social variables that cannot be directly obtained from street view images, we will conduct further analysis in subsequent research.
- (5)
- Existing studies have shown that there is a deviation between safety perception and actual safety (crime risk), and this deviation will be further studied in the future.
Author Contributions
Funding
Data Availability Statement
Acknowledgments
Conflicts of Interest
References
- Zhang, F.; Zhou, B.; Liu, L.; Liu, Y.; Fung, H.H.; Lin, H.; Ratti, C. Measuring human perceptions of a large-scale urban region using machine learning. Landsc. Urban Plan. 2018, 180, 148–160. [Google Scholar] [CrossRef]
- Zhang, L.; Pei, T.; Chen, Y.; Song, C.; Liu, X. A review of urban environmental assessment based on street view images. J. Geo-Inf. Sci. 2019, 21, 46–58. [Google Scholar] [CrossRef]
- Kou, S.; Yao, Y.; Zheng, H.; Zhou, J.; Zhang, J.; Ren, S.; Wang, R.; Guan, Q. Delineating China’s urban traffic layout by integrating complex graph theory and road network data. J. Geo-Inf. Sci. 2021, 23, 812–824. [Google Scholar] [CrossRef]
- Ordonez, V.; Berg, T.L. Learning high-level judgments of urban perception. In Proceedings of the Computer Vision—ECCV 2014, Zurich, Switzerland, 6–12 September 2014; Springer International Publishing: Cham, Switzerland, 2014; pp. 494–510. [Google Scholar] [CrossRef]
- Tuan, Y. Space and Place: The Perspective of Experience; University of Minnesota Press: Minneapolis, MN, USA, 1977. [Google Scholar]
- An, L.J.; Cong, Z. A review of research. Chin. J. Behav. Med. Brain Sci. 2003, 12, 698–699. [Google Scholar] [CrossRef]
- Jeffery, C.R. Crime Prevention through Environmental Design; Sage: Beverly Hill, CA, USA, 1971. [Google Scholar]
- Crowe, T.D.; Fennelly, L.J. Crime Prevention through Environmental Design, 3rd ed.; China People’s Public Security University Press: Beijing, China, 2015. [Google Scholar]
- Marzbali, M.H.; Abdullah, A.; Ignatius, J.; Tilaki, M.J.M. Examining the effects of crime prevention through environmental design (CPTED) on residential burglary. Int. J. Law Crime Justice 2016, 46, 86–102. [Google Scholar] [CrossRef]
- Márquez, L. Safety perception in transportation choices: Progress and research lines. Ing. Compet. 2016, 18, 11–24. [Google Scholar]
- Li, X.; Zhang, C.; Li, W. Does the visibility of greenery increase perceived safety in urban areas? Evidence from the place pulse 1.0 dataset. ISPRS Int. J. Geo-Inf. 2015, 4, 1166–1183. [Google Scholar] [CrossRef]
- Yao, Y.; Liang, Z.; Yuan, Z.; Liu, P.; Bie, Y.; Zhang, J.; Wang, R.; Wang, J.; Guan, Q. A human-machine adversarial scoring framework for urban perception assessment using street-view images. Int. J. Geogr. Inf. Sci. 2019, 33, 2363–2384. [Google Scholar] [CrossRef]
- Van, D.W.A.; Van, S.L.; Stringer, P. Fear of crime in residential environments: Testing a social psychological model. J. Soc. Psychol. 1989, 129, 141–160. [Google Scholar] [CrossRef]
- Farrall, S.; Bannister, J.; Ditton, J.; Gilchrist, E. Social psychology and the fear of crime. Br. J. Criminol. 2000, 40, 399–413. [Google Scholar] [CrossRef]
- Li, X.; Yan, H.; Wang, Z. Evaluation of road environment safety perception and analysis of influencing factors combining street view imagery and machine learning. J. Geo-Inf. Sci. 2023, 25, 852–865. [Google Scholar] [CrossRef]
- Liu, Y.; Liu, X.; Gao, S.; Gong, L.; Kang, C.; Zhi, Y.; Chi, G.; Shi, L. Social sensing: A new approach to understanding our socioeconomic environments. Ann. Assoc. Am. Geogr. 2015, 105, 512–530. [Google Scholar] [CrossRef]
- Sampson, R.J. Great American City: Chicago and the Enduring Neighborhood Effect; University of Chicago Press: Chicago, IL, USA, 2012. [Google Scholar]
- Long, Y.; Liu, L. How green are the streets? An analysis for central areas of Chinese cities using Tencent street view. PLoS ONE 2017, 12, e0171110. [Google Scholar] [CrossRef] [PubMed]
- Zhang, F.; Zhang, D.; Liu, Y.; Lin, H. Representing place locales using scene elements. Comput. Environ. Urban Syst. 2018, 71, 153–164. [Google Scholar] [CrossRef]
- Zhang, F.; Hu, M.; Che, W.; Lin, H.; Fang, C. Framework for virtual cognitive experiment in virtual geographic environments. ISPRS Int. J. Geo-Inf. 2018, 7, 36. [Google Scholar] [CrossRef]
- Salesses, P.; Schechtner, K.; Hidalgo, C.E.S.A. The collaborative image of the city: Mapping the inequality of urban perception. PLoS ONE 2013, 8, e68400. [Google Scholar] [CrossRef] [PubMed]
- He, L.; Páez, A.; Liu, D. Built environment and violent crime: An environmental audit approach using Google Street View. Comput. Environ. Urban Syst. 2017, 66, 83–95. [Google Scholar] [CrossRef]
- Hwang, J.; Sampson, R.J. Divergent Pathways of Gentrification: Racial Inequality and the Social Order of Renewal in Chicago Neighborhoods. Am. Sociol. Rev. 2014, 79, 726–751. [Google Scholar] [CrossRef]
- Naik, N.; Philipoom, J.; Raskar, R.; Hidalgo, C. Streetscore—Predicting the Perceived Safety of One Million Streetscapes. In Proceedings of the 2014 IEEE Conference on Computer Vision and Pattern Recognition Workshops, Columbus, OH, USA, 23–28 June 2014; pp. 793–799. [Google Scholar] [CrossRef]
- Dubey, A.; Naik, N.; Parikh, D.; Raskar, R.; Hidalgo, C. Deep Learning the City: Quantifying Urban Perception at a Global Scale. In Computer Vision—ECCV 2016 (ECCV 2016); Leibe, B., Matas, J., Sebe, N., Welling, M., Eds.; Lecture Notes in Computer Science; Springer: Cham, Switzerland, 2016; Volume 9905. [Google Scholar] [CrossRef]
- Liu, X.; Chen, Q.; Zhu, L.; Xu, Y.; Lin, L. Place-centric visual urban perception with deep multi-instance regression. In Proceedings of the 25th ACM International Conference on Multimedia, Mountain View, CA, USA, 23–27 October 2017; pp. 19–27. [Google Scholar] [CrossRef]
- Liu, X.; He, J.; Yao, Y.; Zhang, J.; Liang, H.; Wang, H.; Hong, Y. Classifying urban land use by integrating remote sensing and social media data. Int. J. Geogr. Inf. Sci. 2017, 31, 1675–1696. [Google Scholar] [CrossRef]
- Porzi, L.; Rota, B.S.; Lepri, B.; Ricci, E. Predicting and understanding urban perception with convolutional neural networks. In Proceedings of the 23rd ACM International Conference on Multimedia, Brisbane, Australia, 26–30 October 2015; pp. 139–148. [Google Scholar] [CrossRef]
- Naik, N.; Raskar, R.; Hidalgo, C.E.S.A. Cities are physical too: Using computer vision to measure the quality and impact of urban appearance. Am. Econ. Rev. 2016, 106, 128–132. [Google Scholar] [CrossRef]
- Ashihara, Y. The Aesthetic Townscape; MIT Press: Cambridge, UK, 1983. [Google Scholar]
- Liu, Y.; Chen, M.; Wang, M.; Huang, J.; Thomas, F.; Rahimi, K.; Mamouei, M. An interpretable machine learning framework for measuring urban perceptions from panoramic street view images. iScience 2023, 26, 106132. [Google Scholar] [CrossRef] [PubMed]
- Shelhamer, E.; Long, J.; Darrell, T. Fully Convolutional Networks for Semantic Segmentation. IEEE Trans. Pattern Anal. Mach. Intell. 2017, 39, 640–651. [Google Scholar] [CrossRef] [PubMed]
- Wang, R.; Ren, S.; Zhang, J.; Yao, Y.; Wang, Y.; Guan, Q. A comparison of two deep-learning-based urban perception models: Which one is better? Comput. Urban Sci. 2021, 1, 1–13. [Google Scholar] [CrossRef]
- Comber, S.; Arribas-Bel, D.; Singleton, A.; Dolega, L. Using convolutional autoencoders to extract visual features of leisure and retail environments. Landsc. Urban Plan. 2020, 202, 103887. [Google Scholar] [CrossRef]
- Krizek, K.; Forysth, A.; Slotterback, C.S. Is there a role for evidence-based practice in urban planning and policy? Plan. Theory Pract. 2009, 10, 459–478. [Google Scholar] [CrossRef]
- Xu, L.; Jiang, W.; Chen, Z. Research on Public Space Security Perception: Taking Shanghai Urban Street View Perception as an Example. Landsc. Archit. 2018, 25, 23–29. [Google Scholar]
- Fu, X.; Yang, P.; Jiang, S.; Xing, J.; Kang, D. The impact of different landscape design elements and their combinations on landscape security. Urban Probl. 2019, 37–44. [Google Scholar] [CrossRef]
- Liu, Z.; Lv, J.; Yao, Y.; Zhang, J.; Kou, S.; Guan, Q. Research method of interpretable urban perception model based on street view imagery. J. Geo-Inf. Sci. 2022, 24, 2045–2057. [Google Scholar] [CrossRef]
- Simonyan, K.; Zisserman, A. Very deep convolutional networks for large-scale image recognition. arXiv 2014, arXiv:1409.1556. [Google Scholar]
- Ha, I.; Kim, H.; Park, S.; Kim, H. Image retrieval using BIM and features from pretrained VGG network for indoor localization. Build. Environ. 2018, 140, 23–31. [Google Scholar] [CrossRef]
- Liu, X.; Chi, M.; Zhang, Y.; Qin, Y. Classifying High Resolution Remote Sensing Images by Fine-Tuned VGG Deep Networks. In Proceedings of the IGARSS 2018—2018 IEEE International Geoscience and Remote Sensing Symposium, Valencia, Spain, 22–27 July 2018; pp. 7137–7140. [Google Scholar] [CrossRef]
- Lu, X.; Duan, X.; Mao, X.; Li, Y.; Zhang, X. Feature extraction and fusion using deep convolutional neural networks for face detection. In Problems in Engineering; Wiley: Hoboken, NJ, USA, 2017; Volume 2017. [Google Scholar] [CrossRef]
- Hou, X.; Chen, P.; Gu, H. LM-DeeplabV3+: A Lightweight Image Segmentation Algorithm Based on Multi-Scale Feature Interaction. Appl. Sci. 2024, 14, 1558. [Google Scholar] [CrossRef]
- Sandler, M.; Howard, A.; Zhu, M.; Zhmoginov, A.; Chen, L.-C. MobileNetV2: Inverted Residuals and Linear Bottlenecks. In Proceedings of the 2018 IEEE/CVF Conference on Computer Vision and Pattern Recognition, Salt Lake City, UT, USA, 18–23 June 2018; pp. 4510–4520. [Google Scholar] [CrossRef]
- Chen, L.; Zhu, Y.; Papandreou, G.; Schroff, F.; Adam, H. Encoder-decoder with atrous separable convolution for semantic image segmentation. In Proceedings of the European Conference on Computer Vision (ECCV), 8–14 September 2018; pp. 801–818. [Google Scholar]
- Jocher, G. Ultralytics YOLOv5[EB/OL]. Available online: https://github.com/ultralytics/yolov5 (accessed on 22 November 2022).
- Benjdira, B.; Khursheed, T.; Koubaa, A.; Ammar, A.; Ouni, K. Car detection using unmanned aerial vehicles: Comparison between faster R- CNN and YOLOv3. In Proceedings of the 2019 1st International Conference on Unmanned Vehicle Systems-Oman (UVS), Muscat, Oman, 5–7 February 2019; IEEE: Piscataway, NJ, USA, 2019; pp. 1–6. [Google Scholar] [CrossRef]
- Li, C.; Wang, R.; Li, J.; Fei, L. Face detection based on YOLOv3. In Recent Trends in Intelligent Computing, Communication and Devices; Springer: Singapore, 2019; pp. 277–284. [Google Scholar] [CrossRef]
- Ke, G.; Meng, Q.; Finley, T.; Wang, T.; Chen, W.; Ma, W.; Ye, Q.; Liu, T. LightGBM: A highly efficient gradient boosting decision tree. In Proceedings of the 31st International Conference on Neural Information Processing Systems, Long Beach, CA, USA, 4–9 December 2017; ACM: New York, NY, USA, 2017; pp. 3149–3157. [Google Scholar] [CrossRef]
- Chen, T.; Guestrin, C. XGBoost: A Scalable Tree Boosting System. In Proceedings of the 22nd ACM SIGKDD International Conference on Knowledge Discovery and Data Mining, San Francisco, CA, USA, 13–17 August 2016. [Google Scholar]
- Lundberg, S.M.; Lee, S.I. A unified approach to interpreting model predictions. In Proceedings of the 31st International Conference on Neural Information Processing Systems, Long Beach, CA, USA, 4–9 December 2017; ACM: New York, NY, USA, 2017; pp. 4768–4777. [Google Scholar] [CrossRef]
- Lundberg, S.M.; Erion, G.; Chen, H.; DeGrave, A.; Prutkin, M.J.; Nair, B.; Katz, R.; Himmelfarb, J.; Bansal, N.; Lee, S. From local explanations to global understanding with explainable AI for trees. Nat. Mach. Intell. 2020, 2, 56–67. [Google Scholar] [CrossRef] [PubMed]
- Yu, X.; Ma, J.; Tang, Y.; Yang, T.; Jiang, F. Can we trust our eyes? Interpreting the misperception of road safety from street view images and deep learning. Accid. Anal. Prev. 2024, 197, 107455. [Google Scholar] [CrossRef] [PubMed]
- Navarrete-Hernandez, P.; Vetro, A.; Concha, P. Building safer public spaces: Exploring gender difference in the perception of safety in public space through urban design interventions. Landsc. Urban Plan. 2021, 214, 104180. [Google Scholar] [CrossRef]
- Chiodi, S.I. Crime prevention through urban design and planning in the smart city era: The challenge of disseminating CP-UDP in Italy: Learning from Europe. J. Place Manag. Dev. 2016, 9, 137–152. [Google Scholar] [CrossRef]
- Baran, P.K.; Tabrizian, P.; Zhai, Y.; Smith, J.W.; Floyd, M.F. An exploratory study of perceived safety in a neighborhood park using immersive virtual environments. Urban For. Urban Green. 2018, 35, 72–81. [Google Scholar] [CrossRef]
- Hall, E.T. The Hidden Dimension, 1st ed.; Doubleday: Garden City, NY, USA, 1966. [Google Scholar]
- Gehl, J. Cities for People; Island Press: Washington, DC, USA, 2010. [Google Scholar]
- Stephan, E.; Liberman, N.; Trope, Y. Politeness and psychological distance: A construal level perspective. J. Personal. Soc. Psychol. 2010, 98, 268–280. [Google Scholar] [CrossRef] [PubMed]
- Jacobs, J. The Death and Life of Great American Cities; Random House: New York, NY, USA, 1961. [Google Scholar]
- Liu, X.; Xiao, H.; Wang, X.; Zhao, F.; Hu, Y. Research on the sense of safety in Geography: Comprehensive understanding, application and prospect based on location. Hum. Geogr. 2018, 33, 38–45. [Google Scholar] [CrossRef]
- Aziz, H.M.A.; Nagle, N.N.; Morton, A.M.; Hilliard, M.R.; White, D.A.; Stewart, R.N. Exploring the impact of walk–bike infrastructure, safety perception, and built environment on active transportation mode choice: A random parameter model using New York City commuter data. Transportation 2018, 45, 1207–1229. [Google Scholar] [CrossRef]
- Donder, L.D.; Buffel, T.; Dury, S.; Witte, N.D.; Verté, D. Perceptual quality of neighbourhood design and feelings of unsafety. Ageing Soc. 2013, 33, 917–937. [Google Scholar] [CrossRef]


| Name | Configuration |
|---|---|
| Num_estimators | 100 |
| Boosting_type | Gbdt |
| Objective | Regression |
| Metric | L1, L2 |
| Num_leaves | 46 |
| Max_depth | 7 |
| Learning_rate | 0.05 |
| Feature_fraction | 0.6 |
| Bagging_fraction | 0.9 |
| Bagging_freq | 2 |
| Min_data_in_leaf | 86 |
Disclaimer/Publisher’s Note: The statements, opinions and data contained in all publications are solely those of the individual author(s) and contributor(s) and not of MDPI and/or the editor(s). MDPI and/or the editor(s) disclaim responsibility for any injury to people or property resulting from any ideas, methods, instructions or products referred to in the content. |
© 2024 by the authors. Licensee MDPI, Basel, Switzerland. This article is an open access article distributed under the terms and conditions of the Creative Commons Attribution (CC BY) license (https://creativecommons.org/licenses/by/4.0/).
Share and Cite
Hou, X.; Chen, P. Analysis of Road Safety Perception and Influencing Factors in a Complex Urban Environment—Taking Chaoyang District, Beijing, as an Example. ISPRS Int. J. Geo-Inf. 2024, 13, 272. https://doi.org/10.3390/ijgi13080272
Hou X, Chen P. Analysis of Road Safety Perception and Influencing Factors in a Complex Urban Environment—Taking Chaoyang District, Beijing, as an Example. ISPRS International Journal of Geo-Information. 2024; 13(8):272. https://doi.org/10.3390/ijgi13080272
Chicago/Turabian StyleHou, Xinyu, and Peng Chen. 2024. "Analysis of Road Safety Perception and Influencing Factors in a Complex Urban Environment—Taking Chaoyang District, Beijing, as an Example" ISPRS International Journal of Geo-Information 13, no. 8: 272. https://doi.org/10.3390/ijgi13080272
APA StyleHou, X., & Chen, P. (2024). Analysis of Road Safety Perception and Influencing Factors in a Complex Urban Environment—Taking Chaoyang District, Beijing, as an Example. ISPRS International Journal of Geo-Information, 13(8), 272. https://doi.org/10.3390/ijgi13080272