Abstract
This study investigates the efficacy of an open vocabulary, multi-modal, foundation model for the semantic segmentation of images from complex urban street scenes. Unlike traditional models reliant on predefined category sets, Grounded SAM uses arbitrary textual inputs for category definition, offering enhanced flexibility and adaptability. The model’s performance was evaluated across single and multiple category tasks using the benchmark datasets Cityscapes, BDD100K, GTA5, and KITTI. The study focused on the impact of textual input refinement and the challenges of classifying visually similar categories. Results indicate strong performance in single-category segmentation but highlighted difficulties in multi-category scenarios, particularly with categories bearing close textual or visual resemblances. Adjustments in textual prompts significantly improved detection accuracy, though challenges persisted in distinguishing between visually similar objects such as buses and trains. Comparative analysis with state-of-the-art models revealed Grounded SAM’s competitive performance, particularly notable given its direct inference capability without extensive dataset-specific training. This feature is advantageous for resource-limited applications. The study concludes that while open vocabulary models such as Grounded SAM mark a significant advancement in semantic segmentation, further improvements in integrating image and text processing are essential for better performance in complex scenarios.
1. Introduction
Street view imagery, rich in geospatial information, has emerged as a key resource for urban analysis and applications [1,2,3]. Scraping and understanding visual elements at the pixel level from street view imagery considerably affects many geospatial applications, due to their abundant real-world semantics [4,5]. The ability to understand street scenes and extract environmental components rapidly and accurately can significantly advance fields such as autonomous vehicles, health and well-being, greenery, urban morphology, transportation, and human mobility [2,6,7].
Recently, the advent of Large Language Models (LLMs) has ushered in a new era of possibilities for geospatial science. LLMs, exemplified by models like GPT-4, have the capacity to understand and generate text-based descriptions of geospatial data, thus enhancing geospatial analyses [8,9]. These models are proving instrumental in AI-based Spatial Data Analysis, enabling the automated interpretation of geospatial information from text data [8,9,10,11].
Multi-modal AI models combined with LLMs, including Contrastive Language-Image Pre-training (CLIP) [12] and Bootstrapped Language-Image Pre-training (BLIP) [13,14], have expanded the horizons of Geospatial Artificial Intelligence (GeoAI). These large multi-modal models align textual descriptions with visual data, facilitating a deeper understanding of geospatial context [7]. GeoAI leverages these models to extract geospatial insights from a wide range of sources, paving the way for more comprehensive urban greenery assessments and mobility solutions [11].
Semantic segmentation, which involves the classification of images at the pixel level, plays a vital role in capturing and processing the information of a user’s surroundings [15,16,17]. With this pixel level classification, the system can better understand the various objects and scenes in the street view image such as roads, traffic signs, pedestrians, vehicles, buildings, etc. [6,18].
Before the widespread adoption of deep learning, segmentation primarily relied on hand-crafted techniques such as pixel colour, Histogram of Oriented Gradients (HOG), and Scale-Invariant Feature Transform (SIFT) [19]. However, the field of semantic segmentation underwent a transformation with the advent of deep learning. Fully Convolutional Networks (FCNs) marked a significant milestone by enhancing pixel-level classification in segmentation tasks, integrating transposed convolutional layers into an end-to-end trainable architecture [20].
The subsequent emergence of innovative models, including SegNet [21], U-Net [22], DeepLab [23], and PSPNet [24], further propelled the capabilities of semantic segmentation. U-Net, known for its unique skip connections and symmetric encoder–decoder structure, achieved notable success in medical image segmentation [22,25]. DeepLab, on the other hand, enhanced segmentation accuracy by introducing dilated convolutions to expand the learnable context [23,26,27,28]. These techniques proved invaluable in urban imagery understanding.
Despite the remarkable accuracy of deep learning methods, they encounter challenges related to training datasets, domain adaptation, and object-specific segmentation. For instance, traffic signs may exhibit variations between regions, necessitating domain adaptation techniques [29]. Moreover, semantic segmentation in street view scenarios often requires the identification of specific objects, such as “pedestrians” and “riders” rather than generic “people” [30].
This is where multi-modal foundation models in geographic context come into play. Because their vast training datasets include diverse geo-information and -location, these large models have a capacity for geographical understanding. This addresses the geographical limitations often encountered by traditional deep learning models when applied to street scene understanding [30,31,32]. They can adapt seamlessly to diverse urban environments and have the capability to detect specific targets, such as “pedestrians crossing the road”, “cars with flat tires”, and “no passing signs” [30,32].
In open vocabulary tasks, the inputs are not only images but also text describing the targeted set of classes, referred to as a “prompt” in Natural Language Processing (NLP) [30,32,33]. Prompts are texts, queries, or descriptive instructions input to language-based models to complete user-expected tasks. Slight differences in input prompts would cause entirely different outputs, so careful text design is needed in open vocabulary tasks [34]. Therefore, exploring appropriate prompts (i.e., words for expected classes) is also a key to this study.
Recent advancements in open vocabulary multi-modal models have shown impressive results in many zero-shot tasks. Grounding DINO, a model designed for open-vocabulary object detection, seeks to extend the understanding of open-set concepts by integrating both language and visual modalities [30]. The Segment Anything Model (SAM), introduced in a promptable model for segmentation, excels in generating high-quality masks from just a single foreground point and demonstrates robust performance across various downstream tasks through prompt engineering [35]. Grounded SAM, which merges the Grounding DINO and SAM models, can detect and segment relevant regions in images based on arbitrary textual inputs from users [36].
The purpose of this study is to investigate the performance of open vocabulary models in the task of the semantic segmentation of street scene imagery. Four street scene datasets from open benchmarks were used for testing using Grounded SAM [36]. The specific objectives were to (1) validate the ability of the open vocabulary model to reason directly about the visual semantics of street scenes without training; (2) explore the performance of the open vocabulary model for different text prompts and the segmentation results of the open vocabulary model for individual confusable categories; and (3) compare the performance to SOTA models on the four benchmark datasets.
2. Data and Task
2.1. Dataset
To evaluate the zero-shot capabilities of open vocabulary models, we selected benchmark datasets that were not used in the training of the pre-trained models. Grounding DINO was trained on datasets including Object365, GoldG, Cap4M, OI, and RefC, while Segment Anything was trained on a specially created dataset [30,31,37]. Consequently, we choose Cityscapes [18], BDD100K [38], KITTI [39], and GTA5 [40] for testing to avoid data leakage.
2.1.1. Cityscapes
The Cityscapes dataset focuses on the semantic understanding of urban street scenes, providing a large number of diverse stereoscopic video sequences from 50 different cities [18]. It incorporates 19 pixel-level semantic categories, namely Road, Sidewalk, Building, Wall, Fence, Pole, Traffic Light, Traffic Sign, Vegetation, Terrain, Sky, Pedestrian, Rider, Car, Truck, Bus, Train, Motorbike, and Bike [18]. We utilised the validation set of Cityscapes to explore the detailed performance of the open vocabulary model.
Due to the high-quality annotation within Cityscapes, numerous studies have utilised it for research, making a vast array of reference results available. Consequently, our analysis will primarily engage with, compare, and discuss the Cityscapes dataset. Given the general applicability and usefulness of the categories defined in Cityscapes, many datasets have adopted similar categories. Hence, we have additionally selected three other Cityscapes-style datasets for comprehensive testing, to validate the performance in different conditions.
2.1.2. Additional Test Datasets
In addition to Cityscapes, BDD100K [38], KITTI [39], and GTA5 [40] were selected for further testing. While akin to Cityscapes in terms of the categorisation into 19 classes, these datasets offer unique perspectives owing to varied data collection conditions and environments. This diversity enriches the testing landscape, providing a more rounded evaluation of the model’s capabilities.
BDD100K consists of driving views and labels of various types for multitask learning. It was captured in the United States of America and its semantic segmentation set is Cityscapes-like [38]. KITTI, with its focus on both urban and rural environments in Europe, contains a Cityscapes-like semantic segmentation set which is tested in this study [39]. This offers an enriched context for model evaluation including urban and rural environments and different geographical locations. GTA5, a synthetic dataset derived from a video game engine, presents high-resolution images across a spectrum of simulated urban environments [40]. Its inclusion in the testing regimen is pivotal for assessing the model’s adaptability from controlled, synthetic scenarios to real-world situations, a critical aspect of model generalisation.
The rationale for using these additional datasets alongside Cityscapes is their complementary nature. Each introduces different variables, such as varied lighting conditions and weather scenarios, and contrasts between synthetic and real imagery. This variety not only challenges but also reinforces the model’s ability to generalise and perform accurately in diverse urban settings. Therefore, testing across these datasets offers a comprehensive evaluation of the semantic segmentation model’s robustness and effectiveness.
2.2. Task Definition
2.2.1. Traditional Semantic Segmentation
Traditional semantic segmentation for images typically involves training a model such as a CNN on datasets similar to the one seen in Figure 1a. At the training stage, the training images are learned and their semantic labels with pre-defined classes are used to update the model’s parameters. After incremental parameter optimisation, the model peaks with the best performance on the trained dataset. In the inference stage, the trained model receives an image which is of a similar scene to the training data. A segmentation result within the pre-defined classes is output.
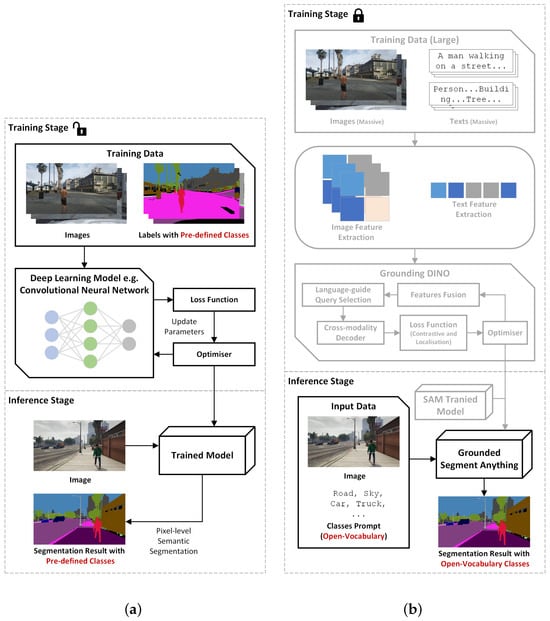
Figure 1.
The framework of models in semantic segmentation tasks including training stage and inference stage. (a) Traditional deep learning model. (b) Grounded SAM. The unlocked symbol means that time must be spent on training; the locked symbol and grey boxes mean this part is unchangeable.
Traditional semantic segmentation tasks are usually based on a fixed, predefined vocabulary (or set of categories). Given an image I with size (where W is the width of the image and H is the height of the image), the goal is to assign a category label to each pixel (where and ).
Thus, we can define a mapping function , where I is an input image and L is a labelling matrix of size , where each element is a selection of labels from a predefined set of categories C; thus, .
The function f is usually a deep neural network that accepts an input of image I and outputs a labelling matrix L. The parameters of f are then updated iteratively by a loss function that compares the ground truth , i.e., the true label of I, with L from f, until L is closer to . Normally, is used to evaluate the prediction performance from the true labels.
2.2.2. Open Vocabulary Semantic Segmentation
Taking Grounded SAM as the example of open vocabulary semantic segmentation, the training data are normally not images only, as seen in Figure 1b. Besides the labelled images, textual data and image–text pairs are used during training. The model architecture is more complex, often not only a single network for visual learning but also additional structures for language processing and image–text fusion. In the inference stage, because the model has learned natural language and is able to understand text, the expected semantics are not limited to a fixed set of categories but have an open vocabulary. The input data are a proposed image and a set of expected classes. The output is the segmentation result within the open vocabulary list the user has provided.
Open vocabulary image understanding combines image and text information to deal with object categories that are not in a pre-defined vocabulary. Given an image I of size and a set of several categories (where N is the number of category texts) whose representation is Text, the aim is to segment each pixel (where and ) to a category label , and this category label is included in the prompted classes T. The mapping function is , where I is an input image and L is a labelling matrix of size where each element is a selection of labels from the prompted categories T; thus, .
In open vocabulary semantic segmentation tasks, the function f is not a single network but a group of models. f consists of at least the following: (1) an image encoder for extracting image features; (2) a text encoder for extracting text features; and (3) a fusion mechanism that combines the image and text features to generate a category label for each pixel. The inputs are an image I and a labelling set T, and the output is a labelling matrix L (). The loss function is applied to update the weights, but in multi-modal learning, a contrastive loss between predicted objects and language tokens for classification is implemented in addition to a loss function for visual modality. However, in this study, we focused on the evaluation of the inference performance of the open vocabulary model for the benchmark datasets without any training. We used common evaluation metrics to quantify the model performance by comparing L prompted from T to ground truths .
3. Methodology
3.1. Framework of Implementation and Evaluation of Grounded SAM
To quantify the performance of open vocabulary models in the semantic segmentation of street views, we use four established image benchmark datasets and segment them with Grounded SAM. We then refine the text prompts for Grounded SAM based on our error analysis. Finally, we evaluate the performance on the benchmarks. The workflow shown in Figure 2 is structured into three stages: Initial Inference, Prompt Improvement, and Benchmarking.
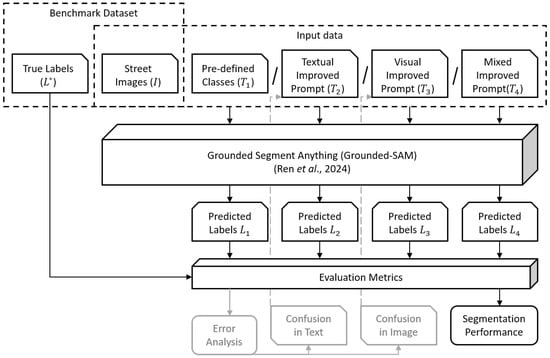
Figure 2.
The workflow of implementing Grounded SAM [36] on benchmark datasets and evaluating segmented performance.
Initially, we use the category names , defined in the Cityscapes dataset, as text prompts. We apply single-word text prompts for each category to each input image I from the benchmark dataset. Using the pre-trained open vocabulary model Grounded SAM, we generate segmented images. We then compare these segmented outputs to the ground truth labels from the benchmarks. This phase involves analysing the direct inference results without any prompt tuning. We conduct experiments on each category separately, thus solving a series of bicategorical tasks. This explores the segmentation capabilities of Grounded SAM for each category separately. We follow this with multi-category experiments where all predefined categories are combined together in a single text prompt, with category words separated by commas. Effectively, the category sets are equivalent to the text prompts. For these multi-category experiments, we can generate confusion matrices which can help in identifying different types of errors.
Upon analysing the confusion matrices together with the input images, we discern two main error categories: textual confusion and image-based confusion. Considering that changing prompts can lead to different results (see Section 1), multiple prompts have been designed. We mitigate the detected error types by refining the set of category names: for fixing a textual error, for fixing a visual error, and for both. Again, these refined names are concatenated to form text prompts (separated by commas). The enhanced text prompts are then deployed with the model to produce new segmentation results. The effectiveness of the enhanced prompts is validated through comparison with ground truth data. We both visually and quantitatively checked the improvement of the new results over the initial outputs.
Finally, we compare outcomes derived from the open vocabulary model with state-of-the-art segmentation methods on the same benchmark datasets. This comparison clarifies the advantages and limitations of open vocabulary models in the context of street view image segmentation.
3.2. Prompt Design
To assess the impact of prompts on segmentation results, we modify the names of the corresponding categories, focusing on both the nature of the errors and the visual characteristics of the categories. The analysis of the preliminary results in Section 4 reveal distinct visual differences between Traffic Light () and Traffic Sign () and between Person () and Rider (). However, Bus () and Train () present challenges in classification, even manually. This leads to the design of three different types of prompts besides the pre-determined names () by Cityscapes seen in Table 1:

Table 1.
Prompt design (i.e., input item of classes) for street view semantic segmentation using Grounded Segment Anything. Bold represents improved prompts to avoid textual misunderstandings, and underline represents improved prompts in addressing visual feature similarity.
- Prompt : Designed to address confusions not related to the visual level. This prompt aims to rectify errors arising from textual misunderstandings or misclassifications that do not stem from visual similarities.
- Prompt : Tailored to confusions at the visual level. This prompt is particularly focused on addressing the challenges in distinguishing visually similar categories, such as trains and buses.
- Prompt : A combination prompt, developed to tackle both textual and visual confusions. This prompt incorporates elements from both and to provide a more comprehensive solution to the segmentation errors.
Additionally, within , multiple prompt designs were considered, shown in Table 2. The classes Train () and Bus () are challenging to segment due to their visual similarity. This approach acknowledges the complexity of differentiating between certain categories and seeks to refine the model’s accuracy through tailored prompt adjustments.

Table 2.
Additional category enhancements for confused categories caused by image feature similarity.
The strategies used for prompt enhancement in this study are as follows: (1) Avoiding similar vocabulary for different categories, e.g., Traffic Light () and Traffic Sign () → Signal Light () and Signpost (). (2) Specialising vocabulary, e.g., Person () → Pedestrian ().
In summary, these prompt designs are integral to improving the segmentation accuracy of open vocabulary models. By addressing both textual and visual confusions, the model’s performance in segmenting complex street scenes can be significantly enhanced. Section 4 will delve into the impact of these prompts in greater detail.
3.3. Experimental Setting
One of the benefits of open vocabulary models is that they allow inference on a particular dataset without any training on that dataset. The required resources at the inference stage are considerably lower than at the training stage.
The experiments were conducted on an Ubuntu server with Intel® Core™ i7-6850K CPU @ 3.60 GHz, 64 GB random-access memory, and a single GeForce RTX 2080 Ti with 11 GB memory. The Grounded SAM by Ren et al. [36] is implemented based on the PyTorch framework with PyTorch version 1.13 and CUDA version 11.7. Based on the above configuration, the inference time for 19 classes is around 20 s per image.
We keep the hyper-parameters of Grounded SAM to their default settings. Specifically, the box threshold is 0.25, the text threshold 0.25, and the Non-Maximum Suppression (NMS) threshold is 0.8. Initial experiments are conducted independently for each category defined in Cityscapes (). We apply single-word text prompts for each category to each input image (I). This explores the segmentation capabilities of Grounded SAM for each category separately. In the multi-category experiments, all predefined categories () are combined together in a single text prompt, with category words separated by commas. The textual improved prompt (), visual improved prompt (), and hybrid improved prompt () also contain all categories in a single text prompt.
3.4. Evaluation Metrics
To effectively assess the performance of semantic segmentation in image processing, the following evaluation metrics are employed:
- Precision and Recall are common metrics used for classification tasks [41]. Precision is the proportion of positive predictions that are true positives, i.e., how many of the positive predictions are correct. Recall is the proportion of all true samples that are correctly predicted, which assesses the model’s ability to identify positive samples and how many positive samples are missed.where is the number of true samples that are predicted as positive. is the number of false samples that are predicted as positive. is false negative samples.
- Intersection over Union (IoU) is typically used in segmentation tasks. It expresses the ratio of the intersection to the combination of predicted results and ground truth for a single class [42]. Mean IoU is the average value of IoU for all classes.where C means the number of classes.
4. Experimental Results
4.1. Results for Individual Category Segmentation
This subsection presents the performance evaluation of Grounded SAM across individual categories (from to ). Our quantitative results are presented in Table 3. Some visual results are shown in Figure 3. An aggregate analysis of the results from four datasets indicates that the segmentation performance is exceptionally strong in most categories, particularly notable in Road (), Building (), Vegetation (), Sky (), Person (), Car (), Truck (), Bus (), and Mobile Bike (), where the recall rates exceed 70%. This suggests that these categories are well-recognised by the model. However, apart from Road (), the precision and IoU for other categories are somewhat disappointing, especially for the category Train (), where the precision and IoU reach only 10% in the Cityscapes, BDD100K, and GTA5 datasets. The model’s performance in other categories is reasonably good, with recall rates of around 50%, though the precision and IoU for Sidewalk () and Terrain () are relatively low. This performance pattern is somewhat expected. Considering that each category is treated as a binary classification task (presence or absence) in an open vocabulary model, some ambiguities in target definitions are likely. Overall, Grounded SAM shows robust segmentation capabilities across these categories without the necessity for category-specific training. This demonstrates the model’s proficiency in handling a variety of urban elements, though it also highlights areas where further refinement, such as prompt design, could enhance performance.

Table 3.
Semantic segmentation performance on four benchmark datasets for each category in independent binary classification experiment.
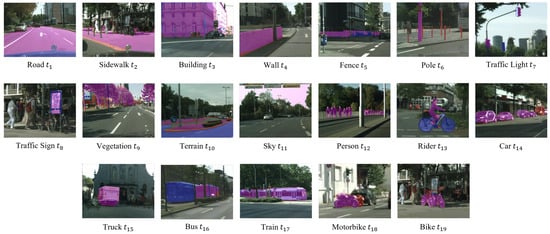
Figure 3.
Examples of the segmented prediction for each category in independent binary classification experiment. Red mask represents the ground truth; blue mask represents the prediction result; and purple mask represents the correct predicted result.
4.2. Result for Multi-Category Segmentation
This subsection discusses the performance of Grounded SAM in a multi-category classification context, focusing exclusively on the Cityscapes dataset. To evaluate the model’s performance, a confusion matrix of the segmented results was constructed, as illustrated in Figure 4. The model performed relatively well on most of the categories. Specifically, the categories of Road (), Building (), Sky (), Person (), Car (), Truck (), Bus (), and Motorcycle () have very high recognition accuracies above 0.9, which implies that the model has strong discriminatory ability on these common and obvious categories. However, there are also some categories such as Fence (), Traffic Sign (), Terrain (), Rider (), and Train (), which have significantly lower accuracies below 0.7, implying that the model may have recognition problems on these categories or confusion with other categories. In particular, the accuracies for Fence () and Terrain () ranged between 0.55 and 0.7, which may indicate that the model had some difficulty with these two categories, but the overall performance was acceptable. However, for the categories of Traffic Sign (), Rider (), and Train (), the accuracy is as low as 0.04 to 0.01, which means that the model fails almost completely on these categories.
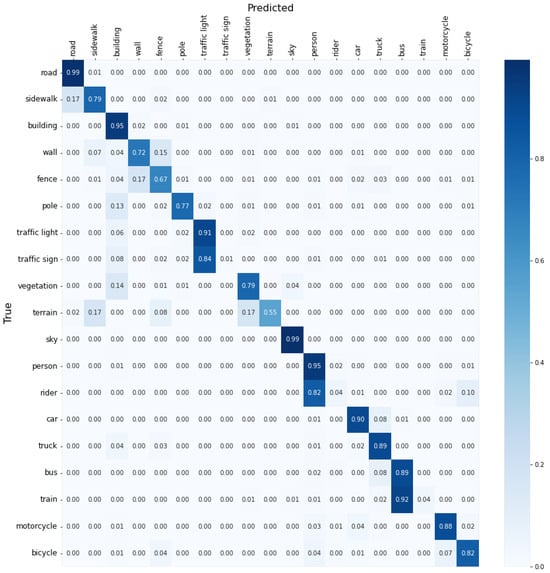
Figure 4.
Confusion matrix of the segmented results for the multi-category experiment.
The confusion matrix analysis reveals that Grounded SAM excels in identifying and segmenting several key urban elements. However, it also highlights significant challenges in certain categories. The low accuracies in categories suggest a need for further model refinement, possibly through more sophisticated prompt engineering or additional training data to improve discrimination between these and other categories.
Overall, these results for multi-category segmentation provide valuable insights into the strengths and limitations of Grounded SAM in handling complex urban environments, laying the groundwork for future improvements in model accuracy.
4.3. Improvements in Addressing Textual Similarity
After improving input prompts, we have made significant progress in the categories that are prone to confusion due to text similarity shown in Figure 5. A notable enhancement was observed in the identification of Rider () seen in Figure 5a and Figure 6. The accuracy for Rider () significantly increased from 0.04 to 0.59. This substantial improvement indicates that the majority of previous misclassifications have been effectively addressed. However, it is worth noting that there was a slight decrease in the accuracy for the Person category (). This trade-off suggests a shift in the model’s ability to differentiate between closely related categories.

Figure 5.
Confusion matrix based on original pre-defined names (left) and improved prompt (right) for categories caused by textual misunderstanding. (a) Person () and Rider (). (b) Traffic Light () and Traffic Sign ().
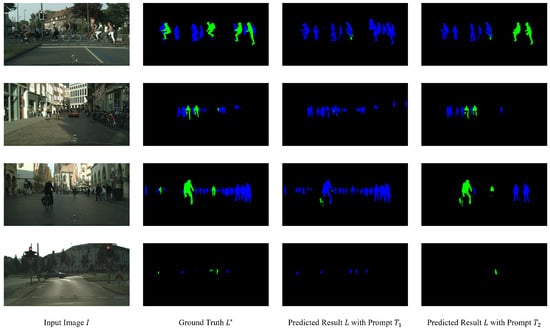
Figure 6.
Examples of the segmented prediction for Person () and Rider (). Green label represents Person () and blue label represents Rider ().
The adjusted prompts led to a remarkable improvement in distinguishing Traffic Sign (), with their accuracy soaring from 0 to 0.80 seen in Figure 5b and Figure 7. This improvement is particularly significant considering the previous challenges in differentiating Traffic Sign () from Traffic Light (). Interestingly, the accuracy of Traffic Light () remained stable, indicating that the model’s existing proficiency in recognising Traffic Light () was maintained while enhancing its ability to identify Traffic Sign ().
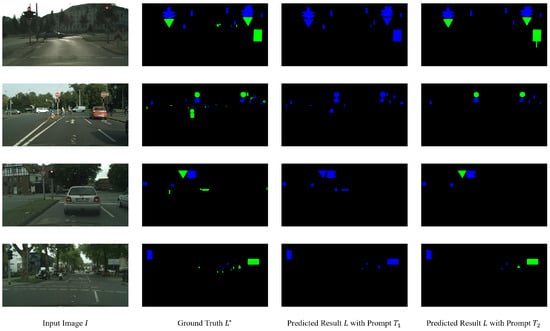
Figure 7.
Examples of the segmented prediction for Traffic Light () and Traffic Sign (). Green label represents Traffic Light (); and blue label represents Traffic Sign ().
These results demonstrate the effectiveness of prompt refinement in enhancing the model’s performance, particularly in categories prone to textual confusion. The significant increase in accuracy for Rider () and Traffic Sign () underlines the potential of prompt engineering as a powerful tool to fine-tune semantic segmentation models. This improvement is crucial for applications where the precise identification of distinct but textually similar categories is essential.
In summary, the refinements in input prompts have led to substantial improvements in Grounded SAM’s ability to accurately distinguish between categories that previously posed challenges due to textual similarities.
4.4. Improvements in Addressing Visual Similarity
For categories confused by image similarity, we explored varying input prompts. The results are shown in Figure 8. When using the open vocabulary model for semantic segmentation, subtle changes to the prompt do affect the model’s categorisation performance. Despite experimenting with a range of rail-related terms, the model continued to struggle with the Train () category. Different prompt pairings were tested, such as Bus () and On Rails (), Bus () and Locomotive (), Bus () and Streetcar (), and Bus () and Tram (). Unfortunately, these attempts resulted in the recognition accuracy for Train () remaining below 0.05, indicating persistent difficulties in differentiating trains from visually similar objects.
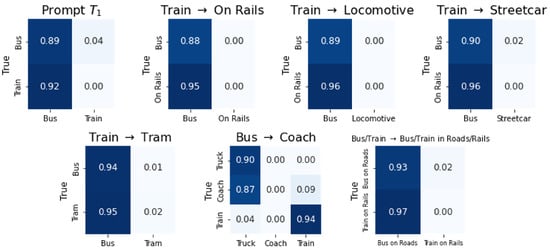
Figure 8.
Confusion matrix based on original pre-defined names () and improved prompt () for categories caused by visual similarity.
An interesting observation was made when more descriptive prompts were employed, such as “Bus on Roads” () and “Train on Rails” (). While the accuracy for Train () improved slightly, it remained relatively low. A significant breakthrough was achieved when the term “Coach” was introduced. Although this led to some new confusions, with the model misclassifying Coach () mainly as Truck (), the recognition of Train () improved dramatically, reaching an accuracy of 0.94 shown in Figure 9.
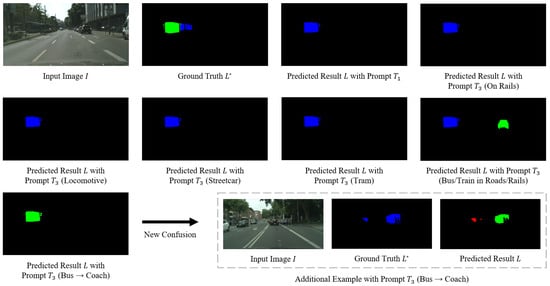
Figure 9.
Examples of the segmented prediction for Bus () and Train (). Red label represents Truck (); green label represents Bus (); and blue label represents Train ().
These experiments underscore the nuanced impact that prompt design can have on the model’s ability to categorise visually similar objects. While subtle changes in prompts can influence categorisation performance, certain categories that are too visually similar continue to pose challenges. The remarkable improvement in recognising trains using the term “Coach” highlights the potential of creative prompt engineering in overcoming these challenges.
To sum up, this study demonstrates that while prompt modifications can significantly enhance the recognition of certain visually similar categories in semantic segmentation, the process requires careful experimentation and creativity to identify the most effective terms.
4.5. Comprehensive Results
Much like in the initial test for single categories, the open vocabulary model Grounded SAM performed well on most categories, as shown in Table 4. On Road (), Building (), Sky (), Car (), and Bike (), both precision and recall exceeded 80%, showing the model’s ability to recognise and classify these categories well.

Table 4.
Semantic segmentation performance with four prompt designs on Cityscapes validation dataset. Bold values indicate the improved categories and total results, and underline values highlight the best performance in different prompts.
However, there is a significant difference in precision and recall between Traffic Light () and Traffic Sign () when using the category names defined by Cityscapes as prompts . Traffic Sign () has a high precision of 90.35% but a surprisingly low recall of 0.96%. This implies that Grounded SAM may miss many instances of Traffic Sign () due to the confusing textual descriptions. Traffic Light () has only 23.54% precision, but its recall is as high as 90.73%, which implies that the model may have misclassified instances from other categories into this category. Combined with Figure 5b and Figure 7 in Section 4.3, it can be found that the reason leading to these two extreme cases is that when applying , most of Traffic Sign () is segmented into Traffic Light (). After further adjustment using as input prompts, due to the textual similarity of the categories, Traffic Light () and Traffic Sign () improve. The precision of Traffic Light () increases to 69.91%, and the recall rate also increases slightly. After losing a little precision, the recall rate of Traffic Sign () increases to 80.22%.
For categories such as Rider () and Train (), the model performs poorly with the application of prompt (), and their precision and recall are very low. Figure 5a and Figure 6 show that Rider () and Train () are extremely easy to confuse with Person () and Bus (), respectively. Based on previous analysis in Section 4.3, the reason for the Rider () error is due to similarity in the input text, as is the case for Traffic Sign (). Similarly, with the updated prompt, the precision of Rider () increases from 17.70% to 56.44%, and its recall increases from 4.31% to 58.81%. The precision of Person () has also increased slightly, while its recall has decreased slightly. For Train (), which is visually very similar to Bus (), the recall is still almost zero with Prompt ’s improvements, and the precision, which was 45.77%, plummets to 0%. The model still has significant challenges in this visually similar category.
These results illustrate Grounded SAM’s effective performance in several categories and its challenges in dealing with textual and visual similarities. The adjustments made to the prompts led to notable improvements in some categories, but challenges persist, particularly in differentiating categories with close visual resemblances. This analysis underscores the importance of prompt design in optimising the performance of open vocabulary semantic segmentation models.
5. Discussion
In street view semantic segmentation tasks, traditional deep learning models usually rely on predefined sets of categories. In contrast, open vocabulary models lift this limitation by processing arbitrary textual descriptions to define the desired categories. This approach brings flexibility and adaptability to semantic segmentation tasks, enabling models to map and interpret complex visual scenes more accurately. Street scene understanding involves complex and diverse semantic elements with significant geographical variations. While traditional deep learning models are limited by their training conditions, the flexibility of open vocabulary models is particularly important in dealing with highly complex and variable environments. In scenarios such as urban environments, it is crucial to accurately recognise and classify numerous elements. Open vocabulary models provide an effective solution for this purpose. We explored the performance of the Grounded SAM model for the direct inference of street scene images without training, using Cityscapes and their defined categories as benchmarks. We devised multiple textual inputs to compare performance differences. In addition, we evaluated the model on four Cityscapes-style datasets and compared it to current state-of-the-art (SOTA) models.
5.1. Overall Performance of Open Vocabulary Models
Although Grounded SAM performs well when dealing with single-category street segmentation tasks, it still faces challenges in multi-category segmentation tasks, especially when there is a high degree of textual semantic or visual feature similarity between categories. For example, the model may produce misclassifications when distinguishing between visually highly similar objects such as pedestrians and cyclists. This phenomenon suggests that although the open vocabulary model is theoretically broadly adaptable, it still requires further fine-tuning or comparative learning when dealing with complex multi-classification problems.
5.2. Impact of Text Input Refinement on Results
Our study found that refined text inputs are crucial for reducing classification confusions. For example, different text inputs led to significantly different results when distinguishing between categories such as traffic signals and traffic signs or pedestrians and cyclists. This suggests that classification accuracy can be significantly improved by more specific and granular text input. However, for categories that are also difficult to distinguish visually, such as buses and trains, even fine-grained textual descriptions struggled to eliminate model confusion. This emphasises the need for open vocabulary models to be further enhanced with the combined capabilities of image processing and text understanding in future developments.
5.3. Comparison with Other SOTA Models
In our study, we compared Grounded SAM’s performance on Cityscapes, BDD100K, GTA5, and KITTI to current state-of-the-art (SOTA) methods shown in Table 5 and Table 6. Some visual results are shown in Figure 10 and Figure 11. On Cityscapes, the highest performance of Grounded SAM with the prompt was 61.1%. In comparison, the highest performance of an SOTA model was 80.8% (Table 6 last column). Similarly, on BDD100K, GTA5, and KITTI, the highest performances of the models were 40.4%, 56.2%, and 50.6%, while those of the best SOTA model were 53.5%, 75.9%, and 72.8% (Table 5). On a single category, using Cityscapes as an example shown in Table 6, Grounded SAM performs close to SOTA’s performance on most classes. For example, on Road, Building, Pole, Traffic Light, Person, and Bike, the difference is very small. However, on Fence, Terrain, Rider, Train, and Motorbike, the gap is still large, at over 20%.

Table 5.
Semantic segmentation performance of Grounded SAM compared to state-of-the-art segmentation methods. We generated Grounded SAM results for BDD100K, GTA5, and KITTI. SOTA is taken from the respective literature.

Table 6.
Semantic segmentation performance per category compared to state-of-the-art methods on Cityscapes validation dataset. Results for Grounded SAM were generated by us using , and SOTA values are collected from Takikawa et al. [55].
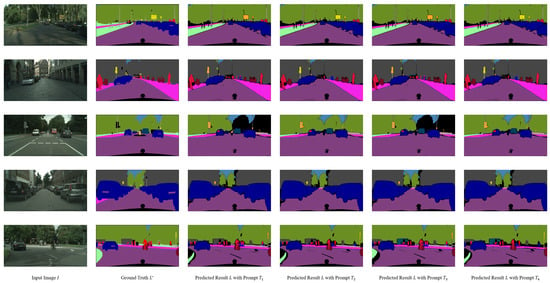
Figure 10.
Examples of segmented prediction in multi-category classification experiment with Prompt , , , and on Cityscapes. * The visualised segmented results apply the same colour map as Cityscapes.
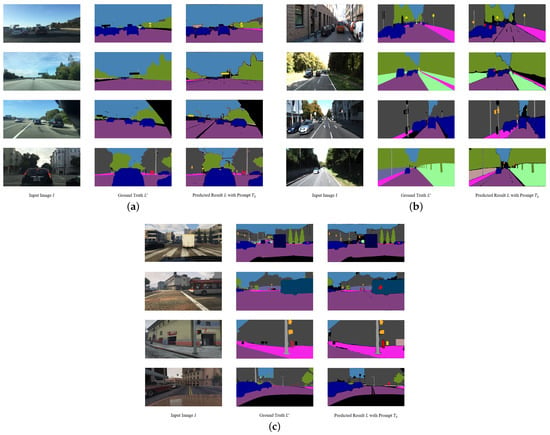
Figure 11.
Examples of segmented prediction in multi-category classification experiment with Prompt . * The visualised segmented results apply the same colour map as Cityscapes. (a) BDD100K. (b) KITTI. (c) GTA5.
When compared to current state-of-the-art models, the open vocabulary model may be slightly worse in terms of overall performance. However, it is worth noting that its performance in some specific categories is very close or even equal to these state-of-the-art models. Most importantly, instead of requiring extensive training on a specific dataset, the open lexical model allows for direct inference on lower-cost hardware. This feature provides significant advantages in terms of resource and time costs and is particularly important for resource-constrained research and application scenarios.
6. Conclusions
This study explored the capabilities of Grounded SAM, an open vocabulary model, in the context of street view semantic segmentation. Grounded SAM demonstrates significant adaptability and flexibility over traditional deep learning models, particularly in its ability to process arbitrary textual descriptions for category definition. While it excels in single-category tasks, challenges arise in multi-category segmentation scenarios, especially with categories having high textual or visual similarities. Textual input refinement proved crucial in reducing classification errors, yet the model struggled with visually similar categories like buses and trains. Compared to state-of-the-art models, Grounded SAM shows competitive performance in specific categories without the need for extensive training, highlighting its efficiency and potential in resource-constrained settings. The findings underscore the need for further enhancements in integrating image processing and text understanding to improve the model’s overall efficacy in complex urban environments. In addition, Grounded SAM performed well on datasets in different regions, which indicates that it has a strong adaptability in geography.
Finally, this study finds that open vocabulary models for segmentation such as Grounded SAM are capable of segmenting visual elements in street view imagery without any further training. Despite their significant robustness and generalisation, the performance in categories with similar visual appearance, which are also difficult to separate in traditional deep learning models or even human judgement, are still a considerable challenge. An additional finding is that minor changes in prompts can drastically influence predictions. Specific vocabulary for categories enables models to reduce confusion. The adaptability of foundation models in different geographic regions is impressive, which may supplant transfer learning for geographic regions. While we focus on street view imagery, the capabilities of open vocabulary models in the understanding of other crucial vision data such as remote sensing imagery await further exploration.
Author Contributions
Conceptualization, Zichao Zeng and Jan Boehm; methodology, Zichao Zeng and Jan Boehm; software, Zichao Zeng; validation, Zichao Zeng; formal analysis, Zichao Zeng; investigation, Zichao Zeng; resources, Jan Boehm; data curation, Zichao Zeng; writing—original draft preparation, Zichao Zeng; writing—review and editing, Jan Boehm and Zichao Zeng; visualization, Zichao Zeng; supervision, Jan Boehm; project administration, Jan Boehm; funding acquisition, Jan Boehm. All authors have read and agreed to the published version of the manuscript.
Funding
This research was funded by the Engineering and Physical Sciences Research Council (EPSRC) through an industrial Cooperative Award in Science & Technology (iCASE) with Ordnance Survey (Grant number EP/W522077/1).
Data Availability Statement
Data are contained within the article.
Acknowledgments
The authors want to thank the Ordnance Survey for their support of this research.
Conflicts of Interest
The authors declare no conflicts of interest.
References
- Zhang, F.; Zhou, B.; Liu, L.; Liu, Y.; Fung, H.H.; Lin, H.; Ratti, C. Measuring human perceptions of a large-scale urban region using machine learning. Landsc. Urban Plan. 2018, 180, 148–160. [Google Scholar] [CrossRef]
- Biljecki, F.; Ito, K. Street view imagery in urban analytics and GIS: A review. Landsc. Urban Plan. 2021, 215, 104217. [Google Scholar] [CrossRef]
- Liu, Y.; Chen, M.; Wang, M.; Huang, J.; Thomas, F.; Rahimi, K.; Mamouei, M. An interpretable machine learning framework for measuring urban perceptions from panoramic street view images. Iscience 2023, 26. [Google Scholar] [CrossRef] [PubMed]
- Kang, Y.; Zhang, F.; Gao, S.; Lin, H.; Liu, Y. A review of urban physical environment sensing using street view imagery in public health studies. Ann. GIS 2020, 26, 261–275. [Google Scholar] [CrossRef]
- Guan, F.; Fang, Z.; Zhang, X.; Zhong, H.; Zhang, J.; Huang, H. Using street-view panoramas to model the decision-making complexity of road intersections based on the passing branches during navigation. Comput. Environ. Urban Syst. 2023, 103, 101975. [Google Scholar] [CrossRef]
- Feng, D.; Haase-Schütz, C.; Rosenbaum, L.; Hertlein, H.; Glaeser, C.; Timm, F.; Wiesbeck, W.; Dietmayer, K. Deep multi-modal object detection and semantic segmentation for autonomous driving: Datasets, methods, and challenges. IEEE Trans. Intell. Transp. Syst. 2020, 22, 1341–1360. [Google Scholar] [CrossRef]
- Jongwiriyanurak, N.; Zeng, Z.; Wang, M.; Haworth, J.; Tanaksaranond, G.; Boehm, J. Framework for Motorcycle Risk Assessment Using Onboard Panoramic Camera (Short Paper). In Proceedings of the 12th International Conference on Geographic Information Science (GIScience 2023). Schloss Dagstuhl-Leibniz-Zentrum für Informatik, Leeds, UK, 12–15 September 2023. [Google Scholar]
- Li, Z.; Ning, H. Autonomous GIS: The next-generation AI-powered GIS. Int. J. Digit. Earth 2023, 16, 4668–4686. [Google Scholar] [CrossRef]
- Roberts, J.; Lüddecke, T.; Das, S.; Han, K.; Albanie, S. GPT4GEO: How a Language Model Sees the World’s Geography. arXiv 2023, arXiv:2306.00020. [Google Scholar]
- Wang, X.; Fang, M.; Zeng, Z.; Cheng, T. Where would i go next? large language models as human mobility predictors. arXiv 2023, arXiv:2308.15197. [Google Scholar]
- Mai, G.; Huang, W.; Sun, J.; Song, S.; Mishra, D.; Liu, N.; Gao, S.; Liu, T.; Cong, G.; Hu, Y.; et al. On the opportunities and challenges of foundation models for geospatial artificial intelligence. arXiv 2023, arXiv:2304.06798. [Google Scholar]
- Radford, A.; Kim, J.W.; Hallacy, C.; Ramesh, A.; Goh, G.; Agarwal, S.; Sastry, G.; Askell, A.; Mishkin, P.; Clark, J.; et al. Learning transferable visual models from natural language supervision. In Proceedings of the 38th International Conference on Machine Learning, Virtual Event, 18–24 July 2021; pp. 8748–8763. [Google Scholar]
- Li, J.; Li, D.; Xiong, C.; Hoi, S. Blip: Bootstrapping language-image pre-training for unified vision-language understanding and generation. In Proceedings of the 39th International Conference on Machine Learning, Baltimore, MD, USA, 17–23 July 2022; pp. 12888–12900. [Google Scholar]
- Li, J.; Li, D.; Savarese, S.; Hoi, S. Blip-2: Bootstrapping language-image pre-training with frozen image encoders and large language models. In Proceedings of the 40th International Conference on Machine Learning, Honolulu, HI, USA, 23–29 July 2023; pp. 19730–19742. [Google Scholar]
- Garcia-Garcia, A.; Orts-Escolano, S.; Oprea, S.; Villena-Martinez, V.; Garcia-Rodriguez, J. A review on deep learning techniques applied to semantic segmentation. arXiv 2017, arXiv:1704.06857. [Google Scholar]
- Siam, M.; Gamal, M.; Abdel-Razek, M.; Yogamani, S.; Jagersand, M.; Zhang, H. A comparative study of real-time semantic segmentation for autonomous driving. In Proceedings of the IEEE Conference on Computer Vision and Pattern Recognition Workshops, Salt Lake City, UT, USA, 18–23 June 2018; pp. 587–597. [Google Scholar]
- Badue, C.; Guidolini, R.; Carneiro, R.V.; Azevedo, P.; Cardoso, V.B.; Forechi, A.; Jesus, L.; Berriel, R.; Paixao, T.M.; Mutz, F.; et al. Self-driving cars: A survey. Expert Syst. Appl. 2021, 165, 113816. [Google Scholar] [CrossRef]
- Cordts, M.; Omran, M.; Ramos, S.; Rehfeld, T.; Enzweiler, M.; Benenson, R.; Franke, U.; Roth, S.; Schiele, B. The cityscapes dataset for semantic urban scene understanding. In Proceedings of the IEEE Conference on Computer Vision and Pattern Recognition, Las Vegas, NV, USA, 26 June–1 July 2016; pp. 3213–3223. [Google Scholar]
- Liu, X.; Deng, Z.; Yang, Y. Recent progress in semantic image segmentation. Artif. Intell. Rev. 2019, 52, 1089–1106. [Google Scholar] [CrossRef]
- Long, J.; Shelhamer, E.; Darrell, T. Fully convolutional networks for semantic segmentation. In Proceedings of the IEEE Conference on Computer Vision and Pattern Recognition, Boston, MA, USA, 7–12 June 2015; pp. 3431–3440. [Google Scholar]
- Badrinarayanan, V.; Kendall, A.; Cipolla, R. Segnet: A deep convolutional encoder-decoder architecture for image segmentation. IEEE Trans. Pattern Anal. Mach. Intell. 2017, 39, 2481–2495. [Google Scholar] [CrossRef]
- Ronneberger, O.; Fischer, P.; Brox, T. U-net: Convolutional networks for biomedical image segmentation. In Proceedings of the Medical Image Computing and Computer-Assisted Intervention–MICCAI 2015: 18th International Conference, Munich, Germany, 5–9 October 2015; proceedings, part III 18. Springer: Cham, Switzerland, 2015; pp. 234–241. [Google Scholar]
- Chen, L.C.; Papandreou, G.; Kokkinos, I.; Murphy, K.; Yuille, A.L. Semantic image segmentation with deep convolutional nets and fully connected crfs. arXiv 2014, arXiv:1412.7062. [Google Scholar]
- Zhao, H.; Shi, J.; Qi, X.; Wang, X.; Jia, J. Pyramid scene parsing network. In Proceedings of the IEEE Conference on Computer Vision and Pattern Recognition, Honolulu, HI, USA, 21–26 July 2017; pp. 2881–2890. [Google Scholar]
- Zhou, Z.; Rahman Siddiquee, M.M.; Tajbakhsh, N.; Liang, J. Unet++: A nested u-net architecture for medical image segmentation. In Proceedings of the Deep Learning in Medical Image Analysis and Multimodal Learning for Clinical Decision Support: 4th International Workshop, DLMIA 2018, and 8th International Workshop, ML-CDS 2018, Held in Conjunction with MICCAI 2018, Granada, Spain, 20 September 2018; Proceedings 4. Springer: Cham, Switzerland, 2018; pp. 3–11. [Google Scholar]
- Chen, L.C.; Papandreou, G.; Kokkinos, I.; Murphy, K.; Yuille, A.L. Deeplab: Semantic image segmentation with deep convolutional nets, atrous convolution, and fully connected crfs. IEEE Trans. Pattern Anal. Mach. Intell. 2017, 40, 834–848. [Google Scholar] [CrossRef]
- Chen, L.C.; Papandreou, G.; Schroff, F.; Adam, H. Rethinking atrous convolution for semantic image segmentation. arXiv 2017, arXiv:1706.05587. [Google Scholar]
- Chen, L.C.; Zhu, Y.; Papandreou, G.; Schroff, F.; Adam, H. Encoder-decoder with atrous separable convolution for semantic image segmentation. In Proceedings of the European Conference on Computer Vision (ECCV), Munich, Germany, 8–14 September 2018; pp. 801–818. [Google Scholar]
- Kang, Y.; Cho, N.; Yoon, J.; Park, S.; Kim, J. Transfer learning of a deep learning model for exploring tourists’ urban image using geotagged photos. ISPRS Int. J. Geo-Inf. 2021, 10, 137. [Google Scholar] [CrossRef]
- Liu, S.; Zeng, Z.; Ren, T.; Li, F.; Zhang, H.; Yang, J.; Li, C.; Yang, J.; Su, H.; Zhu, J.; et al. Grounding dino: Marrying dino with grounded pre-training for open-set object detection. arXiv 2023, arXiv:2303.05499. [Google Scholar]
- Li, L.H.; Zhang, P.; Zhang, H.; Yang, J.; Li, C.; Zhong, Y.; Wang, L.; Yuan, L.; Zhang, L.; Hwang, J.N.; et al. Grounded language-image pre-training. In Proceedings of the IEEE/CVF Conference on Computer Vision and Pattern Recognition, New Orleans, LA, USA, 18–24 June 2022; pp. 10965–10975. [Google Scholar]
- Minderer, M.; Gritsenko, A.; Stone, A.; Neumann, M.; Weissenborn, D.; Dosovitskiy, A.; Mahendran, A.; Arnab, A.; Dehghani, M.; Shen, Z.; et al. Simple open-vocabulary object detection with vision transformers. arXiv 2022, arXiv:2205.06230. [Google Scholar]
- Zareian, A.; Rosa, K.D.; Hu, D.H.; Chang, S.F. Open-vocabulary object detection using captions. In Proceedings of the IEEE/CVF Conference on Computer Vision and Pattern Recognition, Nashville, TN, USA, 20–25 June 2021; pp. 14393–14402. [Google Scholar]
- Du, Y.; Wei, F.; Zhang, Z.; Shi, M.; Gao, Y.; Li, G. Learning to prompt for open-vocabulary object detection with vision-language model. In Proceedings of the IEEE/CVF Conference on Computer Vision and Pattern Recognition, New Orleans, LA, USA, 18–24 June 2022; pp. 14084–14093. [Google Scholar]
- Kirillov, A.; Mintun, E.; Ravi, N.; Mao, H.; Rolland, C.; Gustafson, L.; Xiao, T.; Whitehead, S.; Berg, A.C.; Lo, W.Y.; et al. Segment anything. In Proceedings of the IEEE/CVF International Conference on Computer Vision, Montreal, BC, Canada, 11–17 October 2023; pp. 4015–4026. [Google Scholar]
- Ren, T.; Liu, S.; Zeng, A.; Lin, J.; Li, K.; Cao, H.; Chen, J.; Huang, X.; Chen, Y.; Yan, F.; et al. Grounded sam: Assembling open-world models for diverse visual tasks. arXiv 2024, arXiv:2401.14159. [Google Scholar]
- Caron, M.; Touvron, H.; Misra, I.; Jégou, H.; Mairal, J.; Bojanowski, P.; Joulin, A. Emerging properties in self-supervised vision transformers. In Proceedings of the Pr IEEE/CVF International Conference on Computer Vision, Montreal, BC, Canada, 11–17 October 2021; pp. 9650–9660. [Google Scholar]
- Yu, F.; Chen, H.; Wang, X.; Xian, W.; Chen, Y.; Liu, F.; Madhavan, V.; Darrell, T. Bdd100k: A diverse driving dataset for heterogeneous multitask learning. In Proceedings of the IEEE/CVF Conference on Computer Vision and Pattern Recognition, Seattle, WA, USA, 14–19 June 2020; pp. 2636–2645. [Google Scholar]
- Abu Alhaija, H.; Mustikovela, S.K.; Mescheder, L.; Geiger, A.; Rother, C. Augmented reality meets computer vision: Efficient data generation for urban driving scenes. Int. J. Comput. Vis. 2018, 126, 961–972. [Google Scholar] [CrossRef]
- Richter, S.R.; Vineet, V.; Roth, S.; Koltun, V. Playing for data: Ground truth from computer games. In Proceedings of the Computer Vision–ECCV 2016: 14th European Conference, Amsterdam, The Netherlands, 11–14 October 2016; Proceedings, Part II 14. Springer: Cham, Switzerland, 2016; pp. 102–118. [Google Scholar]
- Szeliski, R. Computer Vision: Algorithms and Applications; Springer Nature: Cham, Switzerland, 2022. [Google Scholar]
- Everingham, M.; Van Gool, L.; Williams, C.K.; Winn, J.; Zisserman, A. The pascal visual object classes (voc) challenge. Int. J. Comput. Vis. 2010, 88, 303–338. [Google Scholar] [CrossRef]
- Nag, S.; Adak, S.; Das, S. What’s there in the dark. In Proceedings of the 2019 IEEE International Conference on Image Processing (ICIP), Taipei, Taiwan, 22–25 September 2019; pp. 2996–3000. [Google Scholar]
- Hoyer, L.; Dai, D.; Wang, H.; Van Gool, L. MIC: Masked image consistency for context-enhanced domain adaptation. In Proceedings of the IEEE/CVF Conference on Computer Vision and Pattern Recognition, Vancouver, BC, Canada, 17–24 June 2023; pp. 11721–11732. [Google Scholar]
- Hoyer, L.; Dai, D.; Van Gool, L. Hrda: Context-aware high-resolution domain-adaptive semantic segmentation. In Proceedings of the European Conference on Computer Vision, Tel Aviv, Israel, 23–27 October 2022; Springer: Cham, Switzerland, 2022; pp. 372–391. [Google Scholar]
- Hoyer, L.; Dai, D.; Van Gool, L. Daformer: Improving network architectures and training strategies for domain-adaptive semantic segmentation. In Proceedings of the IEEE/CVF Conference on Computer Vision and Pattern Recognition, New Orleans, LA, USA, 18–24 June 2022; pp. 9924–9935. [Google Scholar]
- Zhang, P.; Zhang, B.; Zhang, T.; Chen, D.; Wang, Y.; Wen, F. Prototypical pseudo label denoising and target structure learning for domain adaptive semantic segmentation. In Proceedings of the IEEE/CVF Conference on Computer Vision and Pattern Recognition, Nashville, TN, USA, 20–25 June 2021; pp. 12414–12424. [Google Scholar]
- Li, G.; Kang, G.; Liu, W.; Wei, Y.; Yang, Y. Content-consistent matching for domain adaptive semantic segmentation. In Proceedings of the European Conference on Computer Vision, Virtual Event, 23–28 August 2020; Springer: Cham, Switzerland, 2020; pp. 440–456. [Google Scholar]
- Zhu, Y.; Sapra, K.; Reda, F.A.; Shih, K.J.; Newsam, S.; Tao, A.; Catanzaro, B. Improving semantic segmentation via video propagation and label relaxation. In Proceedings of the IEEE/CVF Conference on Computer Vision and Pattern Recognition, Long Beach, CA, USA, 15–20 June 2019; pp. 8856–8865. [Google Scholar]
- Bulo, S.R.; Porzi, L.; Kontschieder, P. In-place activated batchnorm for memory-optimized training of dnns. In Proceedings of the IEEE Conference on Computer Vision and Pattern Recognition, Salt Lake City, UT, USA, 18–23 June 2018; pp. 5639–5647. [Google Scholar]
- Yin, W.; Liu, Y.; Shen, C.; Hengel, A.v.d.; Sun, B. The devil is in the labels: Semantic segmentation from sentences. arXiv 2022, arXiv:2202.02002. [Google Scholar]
- Meletis, P.; Dubbelman, G. Training of convolutional networks on multiple heterogeneous datasets for street scene semantic segmentation. In Proceedings of the 2018 IEEE Intelligent Vehicles Symposium (IV), Changshu, China, 26–30 June 2018; pp. 1045–1050. [Google Scholar]
- Yang, G.; Zhao, H.; Shi, J.; Deng, Z.; Jia, J. Segstereo: Exploiting semantic information for disparity estimation. In Proceedings of the European Conference on Computer Vision (ECCV), Munich, Germany, 8–14 September 2018; pp. 636–651. [Google Scholar]
- Kong, S.; Fowlkes, C. Pixel-wise attentional gating for parsimonious pixel labeling. arXiv 2018, arXiv:1805.01556. [Google Scholar]
- Takikawa, T.; Acuna, D.; Jampani, V.; Fidler, S. Gated-scnn: Gated shape cnns for semantic segmentation. In Proceedings of the IEEE/CVF International Conference on Computer Vision, Seoul, Republic of Korea, 27 October–2 November 2019; pp. 5229–5238. [Google Scholar]
- Ghiasi, G.; Fowlkes, C.C. Laplacian pyramid reconstruction and refinement for semantic segmentation. In Proceedings of the Computer Vision–ECCV 2016: 14th European Conference, Amsterdam, The Netherlands, 11–14 October 2016; Proceedings, Part III 14. Springer: Cham, Switzerland, 2016; pp. 519–534. [Google Scholar]
- Lin, G.; Shen, C.; Van Den Hengel, A.; Reid, I. Efficient piecewise training of deep structured models for semantic segmentation. In Proceedings of the IEEE Conference on Computer Vision and Pattern Recognition, Las Vegas, NV, USA, 26 June–1 July 2016; pp. 3194–3203. [Google Scholar]
Disclaimer/Publisher’s Note: The statements, opinions and data contained in all publications are solely those of the individual author(s) and contributor(s) and not of MDPI and/or the editor(s). MDPI and/or the editor(s) disclaim responsibility for any injury to people or property resulting from any ideas, methods, instructions or products referred to in the content. |
© 2024 by the authors. Licensee MDPI, Basel, Switzerland. This article is an open access article distributed under the terms and conditions of the Creative Commons Attribution (CC BY) license (https://creativecommons.org/licenses/by/4.0/).