Abstract
The COVID-19 outbreak followed by the strict citywide lockdown in Shanghai has sparked negative emotion surges on social media platforms in 2022. This research aims to investigate the spatial–temporal heterogeneity of a unique emotion (helplessness) and its built environment determinants. First, we scraped about twenty thousand Weibo posts and utilized their sentiments with natural language processing (NLP) to extract helplessness emotion and investigated its spatial–temporal variations. Second, we tested whether “helplessness” was related with urban environment attributes when other real estate economic and demographic variables were controlled using the ordinary least squares (OLS) model. Our results confirmed that helplessness emotion peaked in early April when the lockdown started. Second, residents in neighborhoods characterized by higher rents and property management fees, higher population density, lower housing prices, lower plot ratios, or surrounded by less tree view and higher perceived visual complexity, are found to exhibit higher degree of “helplessness”. This study provides an effective data-driven framework to utilize social media data for public sentiments monitoring. The helplessness emotion identified is a unique mental distress under strict quarantine measures, which expands the growing literature of urban governance in the post-pandemic era. Decision makers should pay attention to public opinions and design tailored management measures with reference to civic emotion dynamics to facilitate social sustainability and resilience in face of future crises.
1. Introduction
In the spring of 2022, COVID-19 re-emerged as an abrupt public health crisis in Shanghai, China, causing severe levels of mental stress such as panic, anxiety, fear and depression in the general public. In face of the rapid increase of epidemic incidents and the “Zero-COVID” policy from the central government, Shanghai swiftly enacted unprecedentedly stringent measures, ushering in a period of “citywide and static” management commencing since April. Lockdown measures include restrictions on mobility, suspension of commercial activities (regardless offline shopping or online trading and delivery), and isolation at home. Given the abruption of pandemic spread and lockdown policies, the fulfill of daily demands (e.g., food, medicine, and other necessities) became a significant challenge for residents during the early stage of the lockdown [1].
Notably, during the lockdown, negative emotions rapidly piled up among the public, including the fears of being infected and the anger of being isolated at home. These emotions triggered the explosion of public opinions especially complaints on the social media, with Sina Weibo emerging as the major platform for public emotion discourse. Sina Weibo became inundated with user-generated content detailing the challenges and hardships encountered by citizens. The posts contained a variety of contents including seeking daily supplies and medical supports, exchanging real-time information on the lockdown and epidemic situations, and sharing individual feelings. That said, Weibo posts reflected the real-time psychological traces of citizens, providing valuable insights for policy makers to design more human-centric quarantine regulations. However, previous studies mainly focused on more common emotions (e.g., anxiety, depression) during moderate quarantine measures, while the case of extremely strict lockdown has never been discussed.
Therefore, by scraping the Weibo data during Shanghai’s citywide static lockdown, this study sets to investigate whether unique civic emotion patterns would emerge and prevail under strict mobility restrictions, such as the helplessness emotion due to daily supply shortages. Moreover, whether the role of commonly detected determinants from the built environment and socioeconomics would have divergent roles during strict lockdown comparing to that of moderate quarantine measures. Specifically, this paper posits that amid the lockdown, the prevailing “helplessness” emotion among Shanghai citizens may exhibit spatial-temporal heterogeneity, with its correlation to attributes of the built environment, real estate economy, and census data attributes differently from the most common civic emotion framework in prior studies [2].
First, although home quarantines have effectively contained the spread of COVID-19, the prolonged duration and extensive scope of the lockdown have extremely restricted residents’ freedom. The abrupt implementation of these measures has led to shortages of essential supplies (such as food and medicine), severely threatening individuals’ mental health and basic living needs. Second, the surge in infected cases has pressured the medical system tremendously. Despite efforts to accommodate all positive patients, the combination of frequent collective PCR testing and high-density living environments have increased the risk of infection. People are concerned that if they or their family members have been infected (including asymptomatic cases), they would be mandatorily transferred to the public-facility-turned-temporary hospital, perhaps facing more health risks, particularly for vulnerable groups such as the elderly. Third, the out-of-control governance during the COVID-19 pandemic has led to public doubt about the effectiveness of governmental measures, exacerbating the contradiction between them. The suspension of business and uncertainty about lifting restrictions have directly impacted residents’ financial stability, further increasing their psychological distress. These multifaceted challenges can contribute to the rise of the unique “helplessness” emotion.
To test our hypothesis, three research questions are asked:
- (1)
- Whether the hypothesized “helplessness” sentiment was prevailed among Shanghai citizens;
- (2)
- if so, how can we effectively extract it from Weibo posts using NLP;
- (3)
- to what extent do built environment, real estate economy, and census data attributes contribute to the formation of helplessness. By tracing the civic emotional traces under the strict urban governance during the lockdown period, this research aims to furnish insights essential for the cultivation of resilient, sustainable, and equitable urban environments for high-density cities in face of future crisis alike.
2. Literature Review
2.1. Civic Emotions during COVID-19
Lockdown measures have become the primary means for controlling the spread of COVID-19. As the restrictions within physical spaces and the maintenance of social distancing have limited public movement, residents can only express themselves and share real-time feelings through digital social media platforms like Weibo. At the same time, researchers can more easily access social media data within specific or broad spatiotemporal frameworks, such as the research period can be divided into: pre-lockdown, lockdown, initial reopening, and further relaxation phases [3]. Therefore, social media have emerged as a critical medium for monitoring public real-time emotions and psychological responses during COVID-19 [4].
For the emotional analysis of social media, most previous studies have only analyzed a few basic emotional ontologies of citizens during COVID-19. Zheng et al. [2] examined the evolution of eight public emotions on social media during COVID-19 in Wuhan, China. Although a wide range of emotional categories were included, there was no in-depth dissection of any unique emotion. Chai et al. [4] estimated the likelihood of expressing emotion (anger, fear, happiness, sadness, surprise, and others) in each post and conducted a more detailed analysis of fear in COVID-19. Since the global COVID-19 outbreak, various countries and regions have adopted different epidemic prevention measures and containment efforts. Several basic emotions can only represent the macroscopic psychological state of residents, but the demands of residents at the microscopic level cannot be ignored. Shaw [5] indicated that the COVID-19 pandemic induced the National Health Service (NHS) staff to feel hopelessness, helplessness, and even learned helplessness. Moreover, Zheng et al. [2] underscored the significance of helplessness as a prominent emotional keyword during the early stages of the COVID-19 outbreak, often intwined with emotions of anger and complaint.
2.2. Emotion Determinants
Previous studies have linked urban environments and civic emotions through social media data to promote human centered urban planning. Dorostkar and Najarsadeghi [6] assessed the urban emotions on Twitter throughout four COVID-19 phases in Tehran. Benabbou and Lee [7] explored the evolution of urban emotions on social media and found people experience different emotions and feelings when they perceive environment changes. Social media emotions can also affect community perceptions and behaviors and even policy compliance [6]. For example, citizens were found to be prevailed with the sense of losing control over their surrounding environment during quarantines [8].
Along this line, studies found outdoor spaces become even more desirable and valuable to citizens who have to be isolated at homes [9]. Studies have shown that outdoor green space benefits residents’ mental health [10], and streetscape greening is also an important predictor of resident wellbeing [11]. Moreover, some strict quarantine measures have severely impacted commercial and production activities, directly devastating residents’ financial situation [8]. People’s basic living security has been affected and felt stressed especially when facing housing expenses (e.g., mortgages behind the high housing prices, housing rents, and property management fees). Consequently, the economic pressures caused by COVID-19 can exert a detrimental influence on residents’ emotions and psychological stress [8].
Moreover, in epidemic-related research in public health, demographic data such as age, gender, and population density often appear as important measurement indicators [12,13]. During the COVID-19 outbreak, factors such as geographic location, population density, and demographic statistics have significantly affected excess mortality rates, undoubtedly impacting residents’ psychological defenses. For example, Chai et al. [4] investigated the gender differences in fear of COVID-19 and found women are mostly afraid of health problems while men are more afraid of property and economic problems. Mistry et al. [14] indicated that the elderly have an extreme fear of COVID-19, proving that psychological care for vulnerable groups such as the elderly is crucial.
3. Data and Methods
3.1. Study Area
As an economic and financial center in China, Shanghai has high-density street networks, various residential areas, and an active real estate market [15]. It is also one of the cities with the highest density of Weibo check-ins. This study takes the central urban area of Shanghai (Appendix A, Figure A1) as the study area. According to the “Regulations of Shanghai Municipality on City Planning” and “Shanghai Master Plan”, the central urban area of Shanghai has a total land area of 910.7 square kilometers within the outer ring road highway. Furthermore, as street offices are responsible for static management, supply distribution, PCR tests, and information dissemination during the public health crisis, this study uses the administrative street as the spatial unit for analysis.
The methods and workflow are shown in Figure 1. First, the value of the dependent variable (helplessness) was obtained using Weibo raw data and NLP technology. Next, data from different independent variables (urban environment, census, and real estate economy) was collected. Then, all the data were distributed by ArcGIS to 118 administrative streets in Shanghai, creating the spatial connection. Last, the ordinary least-squares (OLS) model was built, analyzing the correlation between the dependent and independent variables.
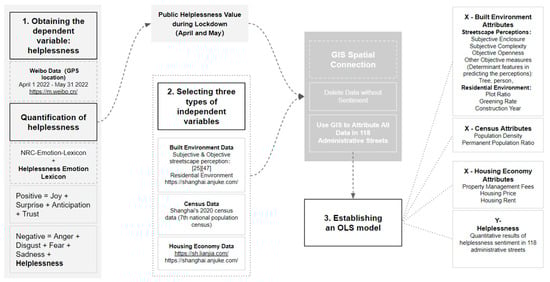
Figure 1.
Method and workflow.
3.2. Dependent Variable: Helplessness
This study used the web crawler in Python to collect 19,932 Sina Weibo posts located in the central Shanghai from 1 April to 31 May 2022 (during the lockdown period) to extract the sense of helplessness from. For each post, three types of data were extracted: the text content, the geotagged location’s name, and the coordinates (i.e., latitude and longitude). The data enables further investigation of the civic emotions and their spatial distribution. With a preliminary screening of the posts, we found the number of public complaints and help-seeking posts (lack of food and medicine, complaints about extreme lockdown measures) were overwhelming. Therefore, we denoted helplessness sentiment as a type of negative emotion generated by citizens who cannot rely on their abilities to change adverse situations when facing difficulties.
The cause of helplessness sentiment is three-fold. First, restrictions on movement and shortages of supplies have compromised residents’ fundamental living needs. Second, the insufficient supply of medical resources, coupled with the fears of the increased infection risks due to frequent PCR testing brought about extra stress to residents’ mental health especially for those in the dense living conditions. Furthermore, the homogeneously strict lockdown measures failed to prioritize the divergent needs of people, particularly ignoring the more vulnerable groups such as the elderly. Last, the suspension from jobs intensified residents’ financial burdens.
3.2.1. Customized Helpless Emotion Lexicon
The mainstream framework for sentiment analysis using NLP is lexicon-based, which matches words in text data with sentiment lexicons [16]. Keywords in lexicons are assigned a sentiment score [17] for quantifying text sentiment. This study took the NRC (National Research Council Canada) Emotion Lexicon, a word list related to eight specific emotions (i.e., joy, trust, surprise, anticipation, disgust, sadness, fear, anger) in two general signs (positive and negative) [18]. To improve sentiment classification accuracy, we expanded the NRC emotion lexicon with a customized “helplessness lexicon” within the negative category.
Specifically, we manually extracted over 500 words representing helplessness from the Weibo raw data. These words were added to the self-made emotion lexicon, being annotated according to the NRC Emotion Lexicon format. Each word was marked with a ‘1’ under the negative and helplessness categories and a “0” under the other emotion categories (Appendix A, Table A1).
3.2.2. Extracting Helplessness Value for All Weibo Posts
After incorporating the self-made lexicon, we conducted a fine-grained analysis of nine emotions (i.e., the common eight emotions including joy, trust, surprise, anticipation, disgust, sadness, fear, anger, plus the helplessness). First, we precisely cut the sentences of each post into words through Jieba, a word segmentation algorithm for Chinese language. Subsequently, we retrieved the total number of emotion words contained in the Weibo post using two emotion lexicons: the NRC-emotion-lexicon and self-made helplessness emotion lexicon. Next, we calculated the quantified result of helplessness, which was equal to the ratio of the number of helplessness words to that of all emotion words. For normalization, we made the sum of the emotion values of the nine categories equal to 1. Finally, we visualized the quantified result of helplessness on 118 administrative streets by ArcGIS spatial distribution and calculated each street’s arithmetic average of the helplessness values to facilitate subsequent correlation studies between helplessness and the independent variables.
3.3. Independent Variable Selection
Based on related literature and data availability, three types of independent variable data (Table A2) were considered for inclusion in our analysis.
3.3.1. The Built Environment
Even during the COVID-19 lockdown period, outdoor spaces still played an essential role for the public [9]. The human-eye level perceptions of the residential street qualities include subjectively measured enclosure and complexity, and other objective measures (e.g., view index of the tree, person, etc.) [19,20,21,22] have profound impacts on human behaviors [15,23,24,25,26] like walkability and running [20,23], biking [21,22], housing prices [27], and crime rates [24]. Therefore, we extracted streetscape perception data (subjective perceptions) from the research of Qiu et al. [25], and also added other residential environment data (including plot ratio, greening rate, construction year, etc.) to expand the urban environment data.
3.3.2. Real Estate Economy
Since COVID-19 weakened the public ability to afford rent, mortgages, and home repairs [28], real estate economy data (including property management fees, housing prices, and housing rent) were also introduced to complement independent variables. The unit of these three economic indicators was unified as “RMB/square meter. To acquire this real estate economy data, we utilized web crawler to collect information from two prominent online real estate platforms: the Anjuke website (https://shanghai.anjuke.com, accessed 1 May 2022) and Lianjia website (https://sh.lianjia.com, accessed on 1 May 2022). These websites are the largest online real estate websites in China [29,30]. In detail, the housing transaction data (22,902 records) were obtained from the Anjuke website, and it included the average housing prices and property management fees, as well as the mesoscale environment quality data on the residential blocks, including plot ratio, greening rate, and construction year. The housing rent data (18,670 records) was acquired from the Lianjia website.
3.3.3. Census Data
Sociodemographic data has been instrumental in numerous epidemiological studies. This study took the Seventh Census of China in 2020 to describe two attributes, namely the population density and permanent population ratio (i.e., Hukou).
To generate the variables, we first screened all valid data within the study area through ArcGIS. We then integrated the data with 118 administrative streets of the study area to track the spatial distribution of all independent variables in different streets, as well as to conduct intuitive visual analytics. Finally, the missing data in each street was removed, calculating the arithmetic average of the remaining valid data.
3.4. Regression Model
The selection of linear regression as the primary model in this study is grounded in its interpretability and widespread relevance in related studies [31,32,33]. Linear models offer the advantage of providing clear insights into the influence of independent variables on dependent ones.
We considered the public helplessness as a comprehensive product influenced by multidimensional factors. In total, more than thirty independent variables were classified into three attribute groups and their predicting powers were tested with step-wise regressions. We then included all independent variables to construct baseline models for April and May. Second, we screen independent variables through their VIF and p-value to test multicollinearity issues. Variables whose VIF > 10 or p-value > 0.1 were removed. In the end, 12 independent variables (Table A2) constructed our best model to explain the variations of helplessness value. Among the constructed models, the model in May has the best performance in terms of highest R-square (0.214). Consequently, this model was selected for further discussion and interpretation, enabling us to draw conclusions and implications.
4. Analysis Results
4.1. The Spatial–Temporal Heterogeneity of Helplessness Emotion
As events cause emotional changes [2], we divided the lockdown period (1 April to 31 May) into nine weeks to minimize daily random fluctuations, exploring helplessness dynamics (Figure 2) and elaborating on related events based on numbers of new cases (Figure 3). The helplessness value decreased during the first five weeks with the increase in the number of new cases, demonstrating the numbness of the citizens. In the sixth week, the helplessness value slightly rebounded, corresponding to the significant decrease in the number of new cases on 9 May, suggesting helplessness and frustration towards the prolonged lockdown. In the seventh week, the helplessness value abruptly decreased and reached its lowest value, consistent with the government’s gradual relaxation of control measures since mid-May due to public pressure. In the final two weeks, the helplessness value slightly rebounded. This suggests that despite the announcement of the lifting of lockdown, lingering feelings of helplessness persisted, possibly due to lingering concerns regarding strict crowd control policies and the uncertainty surrounding the possibility of future lockdown.
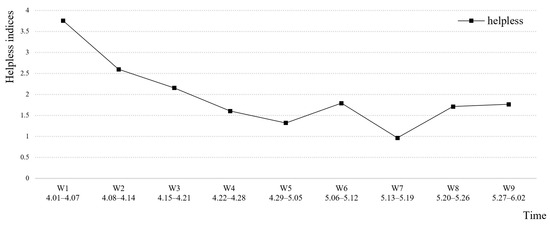
Figure 2.
The 9-week trajectory of helplessness on Shanghai’s Weibo posts.
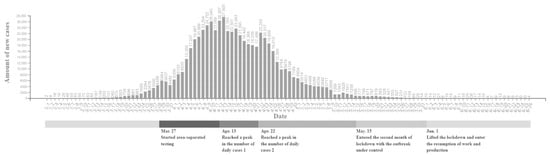
Figure 3.
Number of new cases in Shanghai 2022.
We conducted a spatial visualization of the helplessness among 118 administrative streets in the central area of Shanghai. First, the number of geotagged Weibo posts decreased slightly from April (10,358) to May (9574) and showed a concentrating pattern. Next, there were significant spatial differences in the distribution of helplessness over the two months. In April, the peak of the helplessness value (Figure 4a) was mainly concentrated in the northeast and northwest, while streets with high helplessness showed a scattered distribution, mainly in the peripheral region rather than in central areas. In May, the peak of the helplessness value (Figure 4b) was primarily concentrated in the central areas, while streets with high helplessness were mainly distributed in the central rather than the peripheral areas. Overall, the changes in helplessness from April to May (Figure 4c) increased for many central streets, while conversely, it decreased for streets situated in more peripheral areas.

Figure 4.
Map of helplessness. (a) Helplessness mapping in April (b) Helplessness mapping in May. (c) Helplessness difference (May minus April).
4.2. Spatial Heterogeneity of Independent Variables
Figure 5 presents a spatial visualization chart of 12 independent variables showing different spatial distribution patterns.
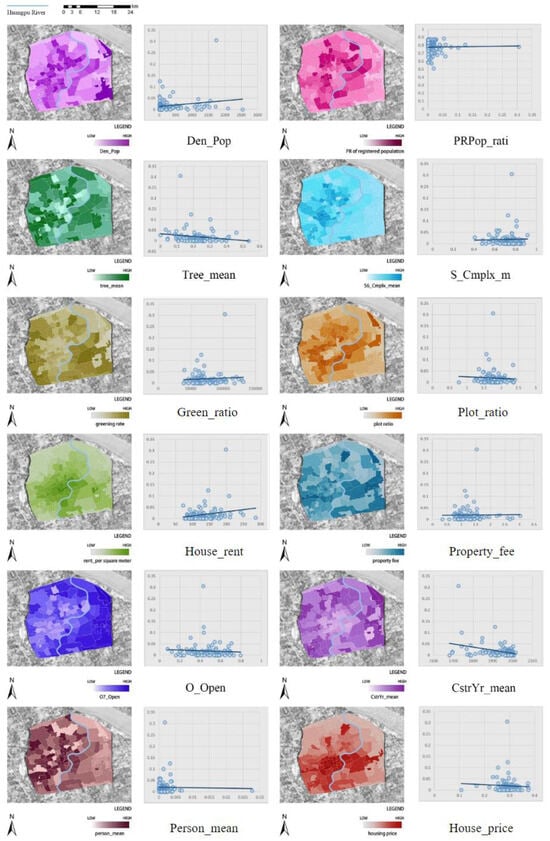
Figure 5.
The spatial distribution of the independent variables.
4.2.1. The Built Environment
Street view: Objective openness was low in the central urban areas but high in the peripheral areas. On the contrary, subjectively perceived visual complexity demonstrated a marginal declining pattern, with higher values observed in the central areas and lower values in the peripheral regions. Moreover, the mean index of street people displayed a distinct feature, with the Huangpu River serving as the boundary; Notably, this index was higher in Puxi (the western side of Huangpu River) compared to Pudong (the eastern side). Additionally, the mean index of street trees showed a multi-center distribution, with higher tree index values in the central areas.
Residential environment: The plot ratio distribution of the residential area presented a gradient change state, which was very low in the central areas but rose sharply around the central area until it dropped again in the outermost area of our research area. The greening rate in Pudong was higher than that in Puxi, and that in the periphery areas was larger than that in the central areas, reflecting the low greening rate consistent with the high urban density in Puxi. Regarding the construction year, communities closer to the center of space was built earlier, while those near the border of Shanghai’s city center were built later.
4.2.2. Real Estate Economy
The spatial distribution of property management fees was relatively scattered, which needs further detailed research in the future. Housing and rent prices were notably higher in central areas, gradually decreasing in cost towards the surrounding areas.
4.2.3. Census Data
High population density areas were mainly concentrated in the Huangpu, the south of Jing’an, the north of Xuhui, and the west of Changning, such as Caojiadu Street (47,076 people/square kilometer). In addition, regions characterized by a high proportion of Shanghai’s permanent population (i.e., Hukou) were mainly concentrated in Puxi, situating along the Pudong areas adjacent to the Huangpu River. This distribution pattern displayed an uneven distribution around Bund Street.
4.3. Roles of Independent Variables
First, while the model in May (Table A4) was used to discuss the correlations between “helplessness” and the built environment, real estate economy and census data, notably, the selected independent variables exhibit divergent strength of associations and significances for April and May (Table A3 and Table A4). This indicates the dynamic nature of civic emotion formation across different stages of the citywide lockdown [34]. In other words, the role of different civic emotion determinants (the intensity of lockdown measures, the content of restrictive policies, and the level of people’s mobility) can significantly vary across urban areas and throughout different stages of the epidemic breakout and lockdown.
Second, the attributes collectively explain 21.4% of helplessness emotion variations in May. Statistically significant variables include the population density, plot ratio, housing price, housing rent, and property fees. Among these, the standardized coefficient (Figure 6) of perceived complexity measured from street view images, the greenery view, the plot ratio, housing prices, housing rent, and property management fees were among the highest, indicating strong correlations with helplessness emotion. To further elucidate the impact of the independent variables, Table A5 shows the alterations in 12 independent variables corresponding to a 50% increase in the mean helplessness value observed in May.
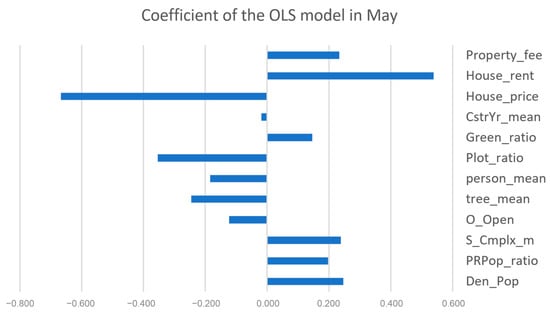
Figure 6.
The impact ranking of independent variables in May (by standardized coefficient).
4.3.1. The Built Environment
The selection of the urban environment as a key influencing factor in our paper is grounded in extensive prior research that established a substantial impact of urban environment factors on individuals’ emotions and psychological well-being during the pandemic [31,32,33,35]. While it is true that residents in Shanghai were predominantly confined to their homes during the lockdown, it is crucial to acknowledge that certain outings were deemed necessary, such as collective PCR testing and obtaining essential supplies. Since the COVID-19 infection situation exhibited different states in various residential areas, the management and control methods under the policy were also different. Not to mention the fact that the intensity of policy implementation by neighborhood-level committees could not be uniformly measured. In fact, except for medical staff and material sales and delivery personnel, certain residents could be allowed to walk freely on urban streets or within residential areas. For example, residents who have negative results of PCR tests within their entire building could walk around in the residential areas. Furthermore, in the last week of May, residents with negative PCR test in certain areas could use authorized community passes to leave their residential areas and move freely to purchase goods at designated locations for a limited time. Therefore, the helplessness sentiment in May was closely related to the built environment data. Additionally, even within the confines of their homes, external spatial factors like windows with views of greenery and the sky can influence residents’ moods [32]. The above reasons collectively explain why there was an association between emotions and the built environment during the lockdown.
In general, higher visual complexity and lower greenery view are associated with increased helplessness sentiment. Specifically, 0.392 units increase in subjectively perceived visual complexity corresponds to a 50% increase in helplessness, as the high subjective complexity of the streetscape causes residents’ sensory loads. The high complexity means the high visual richness of a place [36], such as building shapes, articulation and ornamentation [37], street furniture [38], signage [39], and human activity [40], etc. Residents, accustomed to vibrant street scenes during their daily routines, experienced a stark contrast during stay-at-home quarantine, triggering heightened negative emotions.
Meanwhile, 0.232 units decrease in the tree index corresponds to a 50% increase in helplessness. This can be explained by the fact that tree view is directly related to people’s perceived greenness of the place, resulting in a higher perceived mental restorative and relieving effects [41]. The tree view index refers to the pixel proportion of trees in the street view [29]. On one hand, for residents who had the opportunity to walk freely outdoors within the limited time, the greenness brought by a high tree index could alleviate their feelings of helplessness. On the other hand, residents residing beside the street could appreciate the greenness through their window view, thereby contributing to the relief of their sense of helplessness as well as according to prior studies [33].
Additionally, higher plot ratios were associated with lower helplessness values. Residential areas characterized by higher plot ratios might offer additional space and amenities within individual homes or neighborhoods. This increased space could enhance the overall comfort of the living environment during lockdowns when people were occasionally spending more time at home or were active in the downstairs areas. Additionally, higher plot ratios may foster a stronger sense of community, positively impacting individuals’ mental well-being and reducing feelings of helplessness.
4.3.2. Real Estate Economy
Residential areas with higher housing prices were connected to lower helplessness, being consistent with previous research [42]. A drop of 18,569 RMB per square meter in housing price was related to a 50% increase in the helplessness value. This is reasonable as lower housing prices often mean poorer housing conditions and worse living environment quality, both can negatively affect social well-being [43]. Furthermore, an increase of 54 RMB per square meter in housing rents corresponds with a 50% increase in the value of helplessness, reflecting increased financial burden and unfulfilled community expectations for residents facing high rents during lockdown.
On the one hand, residents who can afford higher housing prices represent better quality of life. During the lockdown, they are less likely to threaten by the insufficient daily supplies while they are more likely to enjoy private/internal access to the overall better residential environment even if they cannot go out to the public parks. On the other hand, the COVID-19 virus and the lockdown will have significantly more severe and negative impact on people who are less wealthy—the low-income population is just more vulnerable in crisis where most production and economic activities are banned [9]. In other words, wealthier people living in higher-price are unlikely to associated with helplessness sentiment due to their better financial capacity to secure the essential daily supplies (food and medicine) during the lockdown period, ultimately alleviating the potential psychological stresses.
On the other hand, our findings reveal contrasting implications between housing price and rent (or property management fee). This can be explained by the fact that residents suffering from higher housing rent (and property management fee) are more likely to be young professionals with fewer savings/assets. The lockdown may strain those individuals’ cash flow, resulting in higher financial stress and making them psychologically more vulnerable to the increased economic burden. Additionally, residents paying high rents are more likely to live in central areas with good accessibility to public amenities which they have paid the price premium for. When the urbanity was temporarily banned, their prior experiences and expectations cannot be satisfied. Consequently, the contrast of living quality can foster discontentment and even heightened sense of helplessness among the residents in apartments with more expensive rents and management fees.
4.3.3. Census Data
An increase in population density (by 59,187 people per square kilometer) corresponds to a 50% increase in helplessness. That said, higher population density corresponds to heightened sense of helplessness, indicating that people can suffering from maintaining a safe social distancing requirement within limited spaces, while the daily supply shortage in densely populated area can be more serious. Prior studies [9] found a significant association between housing adequacy and social distancing protection, for example, many workers were infected in overcrowded dormitories in Singapore. Our study verifies the above conclusion, as a high population density signifies an elevated infection risk during the lockdown period, especially under the circumstances of frequent gathering activities for COVID-19 PCR testing. Moreover, residents with positive test results were sent to the mobile cabin hospital for isolated treatment anytime and anywhere, increasing civic helplessness due to the uncertainty of potential cross-infection.
5. Discussion
5.1. A Unique Negative Emotion
The study constructed rigorous empirical and quantitative scrutiny of spatial–temporal heterogeneity in helplessness, complementary to previous qualitative analyses [5,44]. This investigation confirms that the experience of helplessness is intricately related to momentous events occurring during the epidemic. Notably, in May, the areas with a high helplessness value were more concentrated in the central areas compared to the helplessness map in April, exhibiting the emotional dynamics during the different stages of the pandemic. Furthermore, given the superior model performance in May than April in the OLS analysis, this research might reveal that, beyond the combination of independent variables in this study, helplessness in April was largely influenced by complex and comprehensive factors during the early stage of the epidemic, such as the timing of lockdown periods, fluctuation in the number of newly confirmed cases, and consideration of human psychological fatigue. In contrast, in May, helplessness was more significantly influenced by stable attributes such as spatial, census, and economy attributes, contributing to the correlation analysis. Detailed explanations for the disparities between April and May await future in-depth studies that involve more comprehensive variables and employ more complicated spatial models.
5.2. Distinct Roles of Independent Variables
Not surprisingly, this study verifies the quality of the urban environment and that demographic variables are related to feelings of helplessness, aligning with previous studies on civic emotions during the COVID-19 pandemic [33,41,45]. For example, 0.232 increase in the greenery view index corresponds to a 50% reduction in helplessness value. This highlights the pivotal role of green spaces and natural elements in alleviating emotional distress even during lockdown, suggesting the importance of factors such as window views and engagement in outdoor activities, including essential tasks like PCR testing and necessary shopping, even during stringent lockdowns. Moreover, a 0.507 increase in the plot ratio of residential areas is associated with a significant 50% decrease in reported helplessness in May. This could potentially indicate well-equipped facilities within the residential spaces, fostering a strong sense of community, which needs further verification to substantiate the hypothesis.
Additionally, higher population density is correlated with higher helplessness values, indicating the potentially higher risk of being exposed to virus for residents from densely populated regions. While the precise mechanisms require further exploration, it suggests the crucial linkages between urban density, the public’s psychological stress, and societal outcomes that matter to the social resilience and sustainability. While urban density and agglomeration facilitates productivity, the intricate and dynamic interplay between urban density, quality of life and public health underscores the necessity to tailor urban planning and urban management policies from a human centered perspective.
Finally, among 12 independent variables, the real estate economy, particularly housing prices and housing rents, presents not only robust statistical significance but also reveal a notable correlation with feelings of helplessness in May. More intriguingly, the two variables exhibit an inverse impact on levels of helplessness. Specifically, when housing prices escalate, the helplessness emotion diminishes. Conversely, an increase in housing rents correlates with higher levels of helplessness. The nuanced different roles between housing price and rent indicate that: higher housing prices may be associated with an increased sense of security or stability; while increased housing rents could potentially contribute to heightened financial strain which ultimately led to the overall higher likelihood of feeling helplessness during the lockdown. This study supports the connection between public mental states and socio-economic variables [46], calling attention to the multifaceted nature of economic indicators and their profound significance in the realm of emotional relief.
5.3. Implications for Urban Studies and Planning
The study provides an important reference for advancing the field of emotion analysis within the realm of urban planning research by identifying helplessness during lockdown. In discerning the unique emotional landscape of Shanghai amid the lockdown, the study goes beyond the conventional basic subsets of emotions typically explored in psychological studies. Instead, it recognizes helplessness as a noteworthy emotional state, acknowledging its complexity as an emotion arising from the unique circumstances of material shortages and mandatory isolation policies. Moreover, the sensation of helplessness transcends the roots in the real estate economy and census data. The visible physical environment has a non-negligible role. This exploration is crucial for informing urban governance strategies for future epidemic prevention and control.
Firstly, the positive correlation between the built environment and helplessness sentiment underscores that the visual quality of the living environment is a key in shaping emotional experiences during the pandemic. Urban planners, armed with this knowledge, can take a proactive approach by incorporating both subjective and objective data on the urban environment into their decision-making processes. This holistic understanding allows for the implementation of high-quality and fine-grained urban renewal for urban stock development [47]. Such endeavors may encompass improvements in infrastructure, streetscape design, and block layouts, fostering environments that contribute positively to the emotional well-being of inhabitants.
Secondly, this study sheds light on a correlation between housing costs and helplessness value, exposing emotional differences linked to socio-economic inequalities [48]. In response, governments are encouraged to formulate and implement policies that champion spatial justice. This could involve targeted support, such as material supply initiatives [49], for populations seeking affordable housing solutions. Additionally, there is an emphasis on fostering diversity within residential communities through inclusive management practices. By addressing socio-economic disparities and promoting housing diversity, urban planners play a crucial role in creating more equitable, resilient, and emotionally supportive urban environments.
5.4. Limitations
There are several limitations that futures studies can improve. First, this study focused on helplessness during a certain lockdown-related month, warranting future comparisons with different lockdown stages and even non-pandemic times. Second, the Weibo data might be biased due to the strict internet opinion control from the government regulations and intervenes – many extremely negative or hostile comments were deleted [50], together with the potentially biased user demographics distribution [43,44], both suggesting the potentially large bias from using Weibo posts to representing the general citizens [51]. Third, the NRC Emotion Lexicon may have been invalid to some extent and awaiting a full update, given the prevalence of rapidly changing Internet words, the errors brought by translation from English, and the absence of many idioms in Chinese. In future research, there are promising avenues to further deepen the methods of emotion analysis. This entails refining the accuracy of emotion quantification and mitigating biases in social media data related to users and locations [52].
6. Conclusions
This study provides an empirical reference for post-pandemic urban planning an future urban governance strategies during public health crisis. By collecting about twenty thousand Weibo data during 2022 Spring in Shanghai, “helplessness”, the unique negative emotion among Shanghai residents during the citywide lockdown was defined and quantified. Through OLS regression analysis, we confirmed the variation of helplessness emotion was significantly attributed to the real estate economy, built environment, and the sociodemographic attributes.
The present study expands the disciplinary boundaries of traditional urban research conceptually by establishing the correlation between subjective emotions and multi-dimensional urban indicators. It effectively scrutinizes the significant correlation between the distribution of helplessness and various built environment, real estate economy, and census data attributes. Furthermore, the contribution of this research extends beyond methodological enhancements. A more scientific perspective for urban governance is envisioned, particularly in the upgrade of human-centered urban resilience [53], urban justice, and sustainable development in the post-pandemic era. This study contributes to the steppingstone of interdisciplinary urban study in the context of pandemic management, civic opinions and emotions, mental health, and built environment quality. It offers valuable insights for economists, urban planners, and policymakers. These insights are poised to play a pivotal role in decision-making during the dynamic landscape of the post-pandemic era, guiding the formulation of policies and strategies that prioritize both the emotional well-being of urban inhabitants and long-term sustainable urban development.
Author Contributions
Yuhao He and Qianlong Zhao (the two co-first authors who contributed equally to this paper): conceptualization, formal analysis, methodology, data visualization, writing—original draft, writing—review and editing; Shanqi Sun: writing—review and editing; Wenjing Li and Waishan Qiu: conceptualization, resources, supervision, writing—review and editing. All authors have read and agreed to the published version of the manuscript.
Funding
This research received no external funding.
Data Availability Statement
Due to copyright issues, the data cannot be shared for the time being.
Acknowledgments
Thank Andi Yao and Yibei Li for pre-analysis help.
Conflicts of Interest
Shanqi Sun was employed by the company Lakala Payment. The remaining authors declare that the research was conducted in the absence of any commercial or financial relationships that could be construed as a potential conflict of interest.
Appendix A
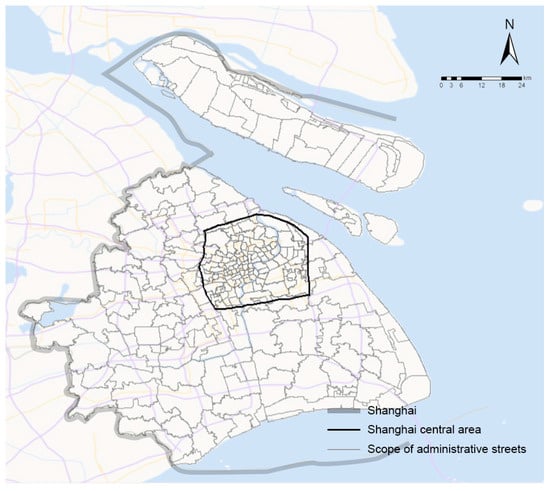
Figure A1.
The boundary of Shanghai central area in both vector map.

Table A1.
Example of the Updated National Research Council Canada (NRC) Word-Emotion Association Lexicon.
Table A1.
Example of the Updated National Research Council Canada (NRC) Word-Emotion Association Lexicon.
| Chinese (Simplified) | English | Positive | Negative | Anger | Anticipation | Disgust | Fear | Joy | Sadness | Surprise | Trust | Helplessness | |
|---|---|---|---|---|---|---|---|---|---|---|---|---|---|
| Newly added helplessness words | 糟糕 | Terrible | 0 | 1 | 0 | 0 | 0 | 0 | 0 | 0 | 0 | 0 | 1 |
| 绝望 | Desperate | 0 | 1 | 0 | 0 | 0 | 0 | 0 | 0 | 0 | 0 | 1 | |
| 生闷气 | Annoyed | 0 | 1 | 0 | 0 | 0 | 0 | 0 | 0 | 0 | 0 | 1 | |
| 坏的 | Bad | 0 | 1 | 0 | 0 | 0 | 0 | 0 | 0 | 0 | 0 | 1 | |
| 怅然若失 | Disheartened | 0 | 1 | 0 | 0 | 0 | 0 | 0 | 0 | 0 | 0 | 1 | |
| 异常 | Abnormal | 0 | 1 | 0 | 0 | 0 | 0 | 0 | 0 | 0 | 0 | 1 | |
| 焦头烂额 | Stressed | 0 | 1 | 0 | 0 | 0 | 0 | 0 | 0 | 0 | 0 | 1 | |
| 灰心丧气 | Disheartened | 0 | 1 | 0 | 0 | 0 | 0 | 0 | 0 | 0 | 0 | 1 | |
| 痛苦 | Painful | 0 | 1 | 0 | 0 | 0 | 0 | 0 | 0 | 0 | 0 | 1 | |
| 侮辱 | Insult | 0 | 1 | 0 | 0 | 0 | 0 | 0 | 0 | 0 | 0 | 1 | |
| 受迫害 | Persecuted | 0 | 1 | 0 | 0 | 0 | 0 | 0 | 0 | 0 | 0 | 1 | |
| 求助 | Seek help | 0 | 1 | 0 | 0 | 0 | 0 | 0 | 0 | 0 | 0 | 1 | |
| Original lexicon | 不方便 | inconvenient | 0 | 1 | 1 | 0 | 1 | 0 | 0 | 1 | 0 | 0 | 0 |
| 合并 | incorporate | 0 | 0 | 0 | 0 | 0 | 0 | 0 | 0 | 0 | 0 | 0 | |
| 掺入 | incorporation | 0 | 0 | 0 | 0 | 0 | 0 | 0 | 0 | 0 | 0 | 0 | |
| 不正确 | incorrect | 0 | 1 | 0 | 0 | 0 | 0 | 0 | 0 | 0 | 0 | 0 | |
| 幸运 | lucky | 1 | 0 | 0 | 0 | 0 | 0 | 1 | 0 | 1 | 0 | 0 | |
| 滑稽的 | ludicrous | 0 | 1 | 0 | 0 | 0 | 0 | 0 | 0 | 0 | 0 | 0 | |
| 坏事 | wrongdoing | 0 | 1 | 1 | 0 | 1 | 0 | 0 | 1 | 0 | 0 | 0 | |
| 非法的 | wrongful | 0 | 1 | 1 | 0 | 1 | 0 | 0 | 1 | 0 | 0 | 0 | |
| 错 | wrongly | 0 | 1 | 1 | 0 | 0 | 1 | 0 | 1 | 0 | 0 | 0 | |
| 热情 | zeal | 1 | 0 | 0 | 1 | 0 | 0 | 1 | 0 | 1 | 1 | 0 | |
| 独断论者 | zealot | 0 | 0 | 0 | 0 | 0 | 0 | 0 | 0 | 0 | 0 | 0 | |
| 热心 | zealous | 1 | 0 | 0 | 0 | 0 | 0 | 1 | 0 | 0 | 1 | 0 |
Table A2.
The 12 selected independent variables.
Table A2.
The 12 selected independent variables.
| Attribute Group | Variable | Full Name | Interpretation |
|---|---|---|---|
| Census Dimension | PRPop_rati | The ratio of permanent population; | The ratio of permanent population is the proportion of people with Shanghai nationality in the total population. |
| Den_Pop | The density of population; | The density of population is the number of people per square kilometer. | |
| Urban environment dimension | O_Open | Objective openness of street view | Openness is the degree of sky visibility and determines the amount of perceived lightness [54]. It is defined as the proportion between the area of the visible sky and the area enclosed by buildings or trees inside a street canyon. |
| S_Cmplx_m | Subjective complexity of street view | Complexity denotes the extent a street is visually rich, based on numbers as well as the variety of streetscapes such as street furniture, signage, greenery, building styles, and human activity in the administrative street. | |
| Person_mean | Mean index of people of street view | Mean index of people is the pixel proportion of people in the street view. | |
| Tree_mean | Mean index of trees of street view | Mean index of trees is the pixel proportion of trees in the street view. | |
| Plot_ratio | Average plot ratio of residential areas | Average plot ratio is the overall plot ratio of residential areas. | |
| Green_ratio | Average greening rate of residential areas | Average greening rate is the overall greening rate of residential areas. | |
| CstrYr_mean | Mean construction year of residential areas | Mean construction year is the overall construction year of residential areas. | |
| Real estate economy dimension | Property_fee | Average property management fee of residential areas; | Average property management fee is the Average property management fee per square meter in the residential areas. |
| House_rent | Average housing rent of residential areas; | Average housing rent is the housing rent per square meter in the residential areas. | |
| House_price | Average housing price of residential areas; | Average housing price is the housing price per square meter in the residential areas. |
Table A3.
The OLS model results for April.
Table A3.
The OLS model results for April.
| OLS Model in April | ||||
|---|---|---|---|---|
| R2 = 0.147 | ||||
| Evaluation Index | VIF | Coef | Std Coef | p-Value |
| Const | 127.620 | 0.026 | 0.293 | |
| Den_Pop | 1.511 | −2.75 × 10⁻⁸ | −0.039 | 0.761 |
| PRPop_ratio | 1.545 | −0.0072 | −0.030 | 0.817 |
| S_Cmplx_m | 2.748 | 0.0337 | 0.257 | 0.139 |
| O_Open | 1.772 | −0.0009 | −0.007 | 0.957 |
| Tree_mean | 2.316 | −0.0461 | −0.222 | 0.165 |
| person_mean | 1.394 | −0.0836 | −0.012 | 0.922 |
| Plot_ratio | 1.725 | −0.0089 | −0.143 | 0.297 |
| Green_ratio | 3.354 | 0.0003 | 0.085 | 0.656 |
| CstrYr_mean | 2.678 | 7.35 × 10⁻⁶ | 0.141 | 0.411 |
| House_price | 4.272 | −3.36 × 10⁻⁷ | −0.351 | 0.106 |
| House_rent | 3.755 | −3.61 × 10⁻⁵ | −0.074 | 0.715 |
| Property_fee | 1.648 | 0.0058 | 0.129 | 0.337 |
Table A4.
The OLS model results for May.
Table A4.
The OLS model results for May.
| OLS Model in May | |||||
|---|---|---|---|---|---|
| R2 = 0.214 | |||||
| Evaluation Index | VIF | Coef | Std Coef | p-Value | P > |t| |
| Const | 129.696 | 0.0119 | 0.590 | ||
| Den_Pop | 1.772 | 1.84 × 10⁻⁷ | 2.47 × 10⁻¹ | 0.078 | * |
| PRPop_ratio | 1.499 | 4.16 × 10⁻² | 0.198 | 0.124 | |
| S_Cmplx_m | 2.472 | 0.0278 | 0.239 | 0.148 | |
| O_Open | 1.643 | −0.013 | −0.122 | 0.361 | |
| tree_mean | 2.221 | −0.047 | −0.246 | 0.116 | |
| person_mean | 1.475 | −1.099 | −0.184 | 0.148 | |
| Plot_ratio | 1.396 | −0.022 | −0.354 | 0.005 | ** |
| Green_ratio | 2.256 | 0.001 | 0.147 | 0.350 | |
| CstrYr_mean | 1.971 | −9.34 × 10⁻⁵ | −1.81 × 10⁻² | 0.902 | |
| House_price | 4.453 | −5.87 × 10⁻⁷ | −0.668 | 0.003 | ** |
| House_rent | 4.312 | 2.00 × 10⁻⁴ | 0.539 | 0.015 | ** |
| Property_fee | 1.554 | 0.009 | 0.233 | 0.076 | * |
Notes: while the significant levels of p > |t| at 0.05 and 0.1 are shown as **, *.
Table A5.
The changes in independent variables corresponding to a 50% increase in helplessness.
Table A5.
The changes in independent variables corresponding to a 50% increase in helplessness.
| Variables | Change |
|---|---|
| Den_Pop | 59,187 |
| PRPop_ratio | 0.262 |
| S_Cmplx_m | 0.392 |
| O_Open | −0.813 |
| Tree_mean | −0.232 |
| Person_mean | −0.010 |
| Plot_ratio | −0.507 |
| Green_ratio | 18.160 |
| CstrYr_mean | −116.625 |
| House_price | −18,569 |
| House_rent | 54.481 |
| Property_fee | 1.197 |
References
- Kirby, W.C. Zeroing out on Zero-COVID. Science 2022, 376, 1026. [Google Scholar] [CrossRef] [PubMed]
- Zheng, P.; Adams, P.C.; Wang, J. Shifting Moods on Sina Weibo: The First 12 Weeks of COVID-19 in Wuhan. New Media Soc. 2021, 26, 14614448211058850. [Google Scholar] [CrossRef]
- Sukhwal, P.C.; Kankanhalli, A. Determining Containment Policy Impacts on Public Sentiment during the Pandemic Using Social Media Data. Proc. Natl. Acad. Sci. USA 2022, 119, e2117292119. [Google Scholar] [CrossRef] [PubMed]
- Chai, Y.; Palacios, J.; Wang, J.; Fan, Y.; Zheng, S. Measuring Daily-Life Fear Perception Change: A Computational Study in the Context of COVID-19. PLoS ONE 2022, 17, e0278322. [Google Scholar] [CrossRef] [PubMed]
- Shaw, S.C. Hopelessness, Helplessness and Resilience: The Importance of Safeguarding Our Trainees’ Mental Wellbeing during the COVID-19 Pandemic. Nurse Educ. Pract. 2020, 44, 102780. [Google Scholar] [CrossRef] [PubMed]
- Dorostkar, E.; Najarsadeghi, M. How to Evaluate Urban Emotions Using Twitter Social Media? Cities 2022, 127, 103713. [Google Scholar] [CrossRef]
- Benabbou, R.; Lee, H. Exploring the Evolution of Urban Emotions in the City of Seoul Using Social Media Information. Int. J. Knowl. Based Dev. 2019, 10, 232–248. [Google Scholar] [CrossRef]
- Marlee, B.; Caitlin, B.; Emily, R.; Amarina, D.-B. ‘Trapped’, ‘Anxious’ and ‘Traumatised’: COVID-19 Intensified the Impact of Housing Inequality on Australians’ Mental Health. Available online: https://ses.library.usyd.edu.au/handle/2123/26117 (accessed on 2 May 2023).
- Kang, M.; Choi, Y.; Kim, J.; Lee, K.O.; Lee, S.; Park, I.K.; Park, J.; Seo, I. COVID-19 Impact on City and Region: What’s next after Lockdown? Int. J. Urban Sci. 2020, 24, 297–315. [Google Scholar] [CrossRef]
- Wang, R.; Browning, M.H.E.M.; Qin, X.; He, J.; Wu, W.; Yao, Y.; Liu, Y. Visible Green Space Predicts Emotion: Evidence from Social Media and Street View Data. Appl. Geogr. 2022, 148, 102803. [Google Scholar] [CrossRef]
- Shentova, R.; de Vries, S.; Verboom, J. Well-Being in the Time of Corona: Associations of Nearby Greenery with Mental Well-Being during COVID-19 in The Netherlands. Sustainability 2022, 14, 10256. [Google Scholar] [CrossRef]
- Chen, Z.; Deng, X.; Fang, L.; Sun, K.; Wu, Y.; Che, T.; Zou, J.; Cai, J.; Liu, H.; Wang, Y.; et al. Epidemiological Characteristics and Transmission Dynamics of the Outbreak Caused by the SARS-CoV-2 Omicron Variant in Shanghai, China: A Descriptive Study. Lancet Reg. Health West. Pac. 2022, 29, 100592. [Google Scholar] [CrossRef]
- Ye, L.; Li, W.F.; Shao, J.; Xu, Z.; Ju, J.; Xu, H. Fighting Omicron Epidemic in China: Real-World Big Data from Fangcang Shelter Hospital during the Outbreak in Shanghai 2022. J. Infect. 2022, 85, 436–480. [Google Scholar] [CrossRef]
- Mistry, S.K.; Ali, A.R.M.M.; Akther, F.; Yadav, U.N.; Harris, M.F. Exploring Fear of COVID-19 and Its Correlates among Older Adults in Bangladesh. Glob. Health 2021, 17, 47. [Google Scholar] [CrossRef]
- Qiu, W.; Li, W.; Liu, X.; Zhang, Z.; Li, X.; Huang, X. Subjective and Objective Measures of Streetscape Perceptions: Relationships with Property Value in Shanghai. Cities 2023, 132, 104037. [Google Scholar] [CrossRef]
- Wang, J.; Fan, Y.; Palacios, J.; Chai, Y.; Guetta-Jeanrenaud, N.; Obradovich, N.; Zhou, C.; Zheng, S. Global Evidence of Expressed Sentiment Alterations during the COVID-19 Pandemic. Nat. Hum. Behav. 2022, 6, 349–358. [Google Scholar] [CrossRef]
- Hartmann, J.; Heitmann, M.; Siebert, C.; Schamp, C. More than a Feeling: Accuracy and Application of Sentiment Analysis. Int. J. Res. Mark. 2023, 40, 75–87. [Google Scholar] [CrossRef]
- Mohammad, S.M.; Turney, P.D. Crowdsourcing a Word–Emotion Association Lexicon. Comput. Intell. 2013, 29, 436–465. [Google Scholar] [CrossRef]
- Song, Q.; Liu, Y.; Qiu, W.; Liu, R.; Li, M. Investigating the Impact of Perceived Micro-Level Neighborhood Characteristics on Housing Prices in Shanghai. Land 2022, 11, 2002. [Google Scholar] [CrossRef]
- Wang, Y.; Qiu, W.; Jiang, Q.; Li, W.; Ji, T.; Dong, L. Drivers or Pedestrians, Whose Dynamic Perceptions Are More Effective to Explain Street Vitality? A Case Study in Guangzhou. Remote Sens. 2023, 15, 568. [Google Scholar] [CrossRef]
- Qiu, W.; Chang, H. The Interplay between Dockless Bikeshare and Bus for Small-Size Cities in the US: A Case Study of Ithaca. J. Transp. Geogr. 2021, 96, 103175. [Google Scholar] [CrossRef]
- Song, Q.; Li, W.; Li, J.; Wei, X.; Qiu, W. Disclosing the Impact of Micro-Level Environmental Characteristics on Dockless Bikeshare Trip Volume: A Case Study of Ithaca. In Proceedings of the Intelligence for Future Cities; Goodspeed, R., Sengupta, R., Kyttä, M., Pettit, C., Eds.; Springer Nature Switzerland: Cham, Switzerland, 2023; pp. 125–147. [Google Scholar]
- Dong, L.; Jiang, H.; Li, W.; Qiu, B.; Wang, H.; Qiu, W. Assessing Impacts of Objective Features and Subjective Perceptions of Street Environment on Running Amount: A Case Study of Boston. Landsc. Urban Plan. 2023, 235, 104756. [Google Scholar] [CrossRef]
- Su, N.; Li, W.; Qiu, W. Measuring the Associations between Eye-Level Urban Design Quality and on-Street Crime Density around New York Subway Entrances. Habitat Int. 2023, 131, 102728. [Google Scholar] [CrossRef]
- Qiu, W.; Zhang, Z.; Liu, X.; Li, W.; Li, X.; Xu, X.; Huang, X. Subjective or Objective Measures of Street Environment, Which Are More Effective in Explaining Housing Prices? Landsc. Urban Plan. 2022, 221, 104358. [Google Scholar] [CrossRef]
- Tian, H.; Han, Z.; Xu, W.; Liu, X.; Qiu, W.; Li, W. Evolution of Historical Urban Landscape with Computer Vision and Machine Learning: A Case Study of Berlin. J. Digit. Landsc. Archit. 2021, 16. [Google Scholar] [CrossRef]
- Yang, S.; Krenz, K.; Qiu, W.; Li, W. The Role of Subjective Perceptions and Objective Measurements of the Urban Environment in Explaining House Prices in Greater London: A Multi-Scale Urban Morphology Analysis. ISPRS Int. J. Geo-Inf. 2023, 12, 249. [Google Scholar] [CrossRef]
- Horne, R.; Willand, N.; Dorignon, L.; Middha, B. The Lived Experience of COVID-19: Housing and Household Resilience 2020.
- Fu, X.; Jia, T.; Zhang, X.; Li, S.; Zhang, Y. Do Street-Level Scene Perceptions Affect Housing Prices in Chinese Megacities? An Analysis Using Open Access Datasets and Deep Learning. PLoS ONE 2019, 14, e0217505. [Google Scholar] [CrossRef] [PubMed]
- Wu, C.; Du, Y.; Li, S.; Liu, P.; Ye, X. Does Visual Contact with Green Space Impact Housing Prices? An Integrated Approach of Machine Learning and Hedonic Modeling Based on the Perception of Green Space. Land Use Policy 2022, 115, 106048. [Google Scholar] [CrossRef]
- Guo, X.; Tu, X.; Huang, G.; Fang, X.; Kong, L.; Wu, J. Urban Greenspace Helps Ameliorate People’s Negative Sentiments during the COVID-19 Pandemic: The Case of Beijing. Build. Environ. 2022, 223, 109449. [Google Scholar] [CrossRef] [PubMed]
- Asim, F.; Chani, P.S.; Shree, V. Impact of COVID-19 Containment Zone Built-Environments on Students’ Mental Health and Their Coping Mechanisms. Build. Environ. 2021, 203, 108107. [Google Scholar] [CrossRef]
- Spano, G.; D’Este, M.; Giannico, V.; Elia, M.; Cassibba, R.; Lafortezza, R.; Sanesi, G. Association between Indoor-Outdoor Green Features and Psychological Health during the COVID-19 Lockdown in Italy: A Cross-Sectional Nationwide Study. Urban For. Urban Green. 2021, 62, 127156. [Google Scholar] [CrossRef]
- Hu, L.; Shi, M.; Li, M.; Ma, J. The Effectiveness of Control Measures during the 2022 COVID-19 Outbreak in Shanghai, China. PLoS ONE 2023, 18, e0285937. [Google Scholar] [CrossRef]
- Cheng, Y.; Zhang, J.; Wei, W.; Zhao, B. Effects of Urban Parks on Residents’ Expressed Happiness before and during the COVID-19 Pandemic. Landsc. Urban Plan. 2021, 212, 104118. [Google Scholar] [CrossRef]
- Ewing, R.; Handy, S. Measuring the Unmeasurable: Urban Design Qualities Related to Walkability. J. Urban Des. 2009, 14, 65–84. [Google Scholar] [CrossRef]
- Stamps, A.E. Sex, Complexity, and Preferences for Residential Facades. Percept Mot Ski. 1999, 88, 1301–1312. [Google Scholar] [CrossRef]
- Jacobs, A.B. Great Streets; University of California Transportation Center: Berkeley, CA, USA, 1993. [Google Scholar]
- Cullen, G. Concise Townscape, 1st ed.; Routledge: London, UK, 1961. [Google Scholar]
- Gehl, J. Life Between Buildings–Using Public Space; Van Nostrand Reinhold: New York, NY, USA, 1987. [Google Scholar]
- Dzhambov, A.M.; Lercher, P.; Browning, M.H.E.M.; Stoyanov, D.; Petrova, N.; Novakov, S.; Dimitrova, D.D. Does Greenery Experienced Indoors and Outdoors Provide an Escape and Support Mental Health during the COVID-19 Quarantine? Environ. Res. 2021, 196, 110420. [Google Scholar] [CrossRef]
- Tan, M.J.; Guan, C. Are People Happier in Locations of High Property Value? Spatial Temporal Analytics of Activity Frequency, Public Sentiment and Housing Price Using Twitter Data. Appl. Geogr. 2021, 132, 102474. [Google Scholar] [CrossRef]
- Baqutayan, S.M.; Raji, F.; Ariffin, A.S. The Impact of Housing Conditions on the Emotion, Behaviour, and Psychological Wellbeing of Middle-Income Groups. J. Sustain. Dev. 2015, 8, 262. [Google Scholar] [CrossRef]
- Lifshin, U.; Mikulincer, M.; Kretchner, M. Motivated Helplessness in the Context of the COVID-19 Pandemic: Evidence for a Curvilinear Relationship between Perceived Ability to Avoid the Virus and Anxiety. J. Soc. Clin. Psychol. 2020, 39, 479–497. [Google Scholar] [CrossRef]
- Banna, M.H.A.; Sayeed, A.; Kundu, S.; Christopher, E.; Hasan, M.T.; Begum, M.R.; Kormoker, T.; Dola, S.T.I.; Hassan, M.M.; Chowdhury, S.; et al. The Impact of the COVID-19 Pandemic on the Mental Health of the Adult Population in Bangladesh: A Nationwide Cross-Sectional Study. Int. J. Environ. Health Res. 2022, 32, 850–861. [Google Scholar] [CrossRef]
- Xu, X.; Qiu, W.; Li, W.; Liu, X.; Zhang, Z.; Li, X.; Luo, D. Associations between Street-View Perceptions and Housing Prices: Subjective vs. Objective Measures Using Computer Vision and Machine Learning Techniques. Remote Sens. 2022, 14, 891. [Google Scholar] [CrossRef]
- Ma, X.; Ma, C.; Wu, C.; Xi, Y.; Yang, R.; Peng, N.; Zhang, C.; Ren, F. Measuring Human Perceptions of Streetscapes to Better Inform Urban Renewal: A Perspective of Scene Semantic Parsing. Cities 2021, 110, 103086. [Google Scholar] [CrossRef]
- Sharifi, A.; Khavarian-Garmsir, A.R. The COVID-19 Pandemic: Impacts on Cities and Major Lessons for Urban Planning, Design, and Management. Sci. Total Environ. 2020, 749, 142391. [Google Scholar] [CrossRef] [PubMed]
- Sanderson Bellamy, A.; Furness, E.; Nicol, P.; Pitt, H.; Taherzadeh, A. Shaping More Resilient and Just Food Systems: Lessons from the COVID-19 Pandemic. Ambio 2021, 50, 782–793. [Google Scholar] [CrossRef] [PubMed]
- Qin, B.; Strömberg, D.; Wu, Y. Why Does China Allow Freer Social Media? Protests versus Surveillance and Propaganda. J. Econ. Perspect. 2017, 31, 117–140. [Google Scholar] [CrossRef]
- Sloan, L.; Morgan, J.; Burnap, P.; Williams, M. Who Tweets? Deriving the Demographic Characteristics of Age, Occupation and Social Class from Twitter User Meta-Data. PloS ONE 2015, 10, e0115545. [Google Scholar] [CrossRef]
- Qian, Y.; Yuan, F.; Lyu, H.; Luo, J. Understanding Patterns of Users Who Repost Censored Posts on Weibo. arXiv 2021, arXiv:2101.06864. [Google Scholar]
- Chu, Z.; Cheng, M.; Song, M. What Determines Urban Resilience against COVID-19: City Size or Governance Capacity? Sustain. Cities Soc. 2021, 75, 103304. [Google Scholar] [CrossRef]
- Li, X.; Cai, B.Y.; Ratti, C. Using Street-Level Images and Deep Learning for Urban La Ndscape STUDIES. Landsc. Archit. Front. 2018, 6, 20–29. [Google Scholar] [CrossRef]
Disclaimer/Publisher’s Note: The statements, opinions and data contained in all publications are solely those of the individual author(s) and contributor(s) and not of MDPI and/or the editor(s). MDPI and/or the editor(s) disclaim responsibility for any injury to people or property resulting from any ideas, methods, instructions or products referred to in the content. |
© 2024 by the authors. Licensee MDPI, Basel, Switzerland. This article is an open access article distributed under the terms and conditions of the Creative Commons Attribution (CC BY) license (https://creativecommons.org/licenses/by/4.0/).