Article

Accuracy Evaluation for Plan-Reliefs and Historical Maps Created during WWI in Northern Italy

1
Department of Civil, Chemical and Environmental Engineering (DICCA), University of Genoa, Via Montallegro 1, 16145 Genova, GE, Italy
2
Department of Humanities, University of Trento, Via Tommaso Gar 14, 38122 Trento, TN, Italy
3
Department of Civil, Environmental and Mechanical Engineering (DICAM), University of Trento, Via Mesiano 77, 38123 Trento, TN, Italy
4
Italian War History Museum, Via Castelbarco 7, 38068 Rovereto, TN, Italy
*
Author to whom correspondence should be addressed.
ISPRS Int. J. Geo-Inf. 2024, 13(3), 101; https://doi.org/10.3390/ijgi13030101
Submission received: 28 December 2023 / Revised: 14 March 2024 / Accepted: 18 March 2024 / Published: 19 March 2024

Abstract

:
The availability of digital copies of historical artifacts modeling the territory through the so-called “plan-reliefs” is important for many reasons: the preservation of the artifact if the physical object is damaged or destroyed, the possibility of creating virtual showrooms and providing researchers a tool to study the object combining information from different sources. For these reasons, a set of plan-reliefs created during World War I on the Italian front and kept by the Italian Historical War Museum of Rovereto (Italy) was surveyed to create digital models of the surfaces, which were georeferenced in the ETRS89 datum. A set of historical military maps of the same period was georeferenced to overlay the sets to the surface in the digital representation and to try to infer clues about the cartographic sources used in the historical artifact creation. The best transformation for georeferencing the maps is different depending on the map scale, map origin, conservation status and number of Ground Control Points. The georeferencing process precision and accuracy were evaluated. The digital models created in this study were compared to the official Digital Terrain Model (DTM) provided by the Regions or the autonomous provinces. The results demonstrate the feasibility of the approach, and the combination of the models with the georeferenced maps is used by historians to describe the process used in the creation of plan-reliefs.

1. Introduction

The preservation of historical artifacts constitutes one of the main goals of many museum institutions. While every effort must be dedicated to safeguarding the integrity of the physical objects, the creation of “digital twins”, i.e., digital models which incorporate all the information provided by the original item, provides a way to secure this information.
This paper reports the results of work carried out as part of a broader research project launched in 2020 between the Geo-Cartographic Study and Documentation Center (GeCo) of the University of Trento and the Italian Historical War Museum of Rovereto (responsible for the agreement are Prof. Elena Dai Prà, director of GeCo and Dr. Francesco Frizzera, PhD, director of the Museum) dedicated to the study, cataloguing and valorisation of the historical cartographic and iconographic heritage of military origin of the War Museum using innovative methodologies. In particular, the results of a theoretical–methodological research for the creation of 3D digital models of the plan-reliefs of the World War I are presented using photogrammetric techniques.
The combined use of digital representation of historical artifacts, modeling the territory through the so-called “plan-reliefs”, created during World War I to describe battlegrounds on the Italian front, and historic maps of the same period is investigated.

1.1. The Museum, Its Collections and the Collection of Military Plan-Reliefs

At the end of World War I, the problem of representing and remembering the conflict that had just ended arose in most of the belligerent nations. Commemorative and celebratory monuments were built everywhere, war cemeteries were transformed into shrines and war memorabilia were displayed in national museums. The Italian Historical War Museum was founded precisely in this climate in 1921 by a group of citizens of Rovereto, a city that had been evacuated and seriously damaged during three years of fighting. The Museum, founded in a border region, inevitably emphasized and celebrated the war that had led the Trentino people to reunite with their Italian motherland; however, this nationalist and patriotic structure was immediately accompanied by a universal message of peace. On the highest tower of the castle, home to the museum, the large Bell of the Fallen was placed in 1925, made with the bronze of those artillery which had caused so much destruction. Inaugurated by King Vittorio Emanuele III, the Museum immediately acquired national importance by collecting materials donated by private citizens and objects through direct agreements with the Armed Forces. The young Kingdom of Italy did not have a national historical war museum to which it could make primary reference for war themes; most of the homeland memories were kept in the museums of the Risorgimento, often with regional connotations. This role was assumed by the Italian Historical War Museum of Rovereto which, through donations from the allied powers, received significant quantities of materials from all fronts of the Great War [1].
The Museum’s fields of interest progressively expanded following the military history of the country. In 1929, two colonial rooms were inaugurated, which expanded following the Ethiopian War (1935–1936) [2]. Memorabilia, photos and documents flowed in following the Spanish campaign (1936–1939) and World War II, during which the Museum remained active, continuing to enrich its collections with material from the various fronts.
After World War II, the Museum accentuated the aspects relating to the technical evolution of armaments from the modern age to the second half of the 20th century. The end of the last century led the Museum to promote historical research linked to the Trentino region, promoting publications, organizing conferences and, above all, setting up temporary exhibitions on cutting-edge historiographical themes such as war voluntarism, the female role in conflicts, the impact of war on the landscape.
During the 2000s, exhibition initiatives were added as a result of cataloging and study campaigns on the collections, thus starting a process of more in-depth knowledge of the substantial preserved heritage. Furthermore, from the beginning of the new millennium, restoration work began on the Castle, home of the Museum. These, by providing new exhibition spaces, made a profound revision of the visit itinerary possible. At present, the visit experience delves into the evolution of the way of fighting from the early modern age to the end of World War I; once the various rearrangement batches are completed, the visitor will have an overview of the conflicts from the modern age to the present day, in which they will have particular relevance and their implications on society [3].
The Museum currently preserves approximately 100,000 objects to which are added the volumes of the historical library (over 47,000) and the archival funds (200 collections of institutions or individuals, dozens of collections, over 100,000 images). Only a small part of the collections can be displayed to the public within the visit itinerary or at other institutions with which loan and storage agreements are active. The heritage is constantly growing, above all thanks to donations, which amount to around a hundred a year, from organizations and private individuals who wish to entrust their material testimonies to the Museum, contributing to the construction of a collective memory [4].
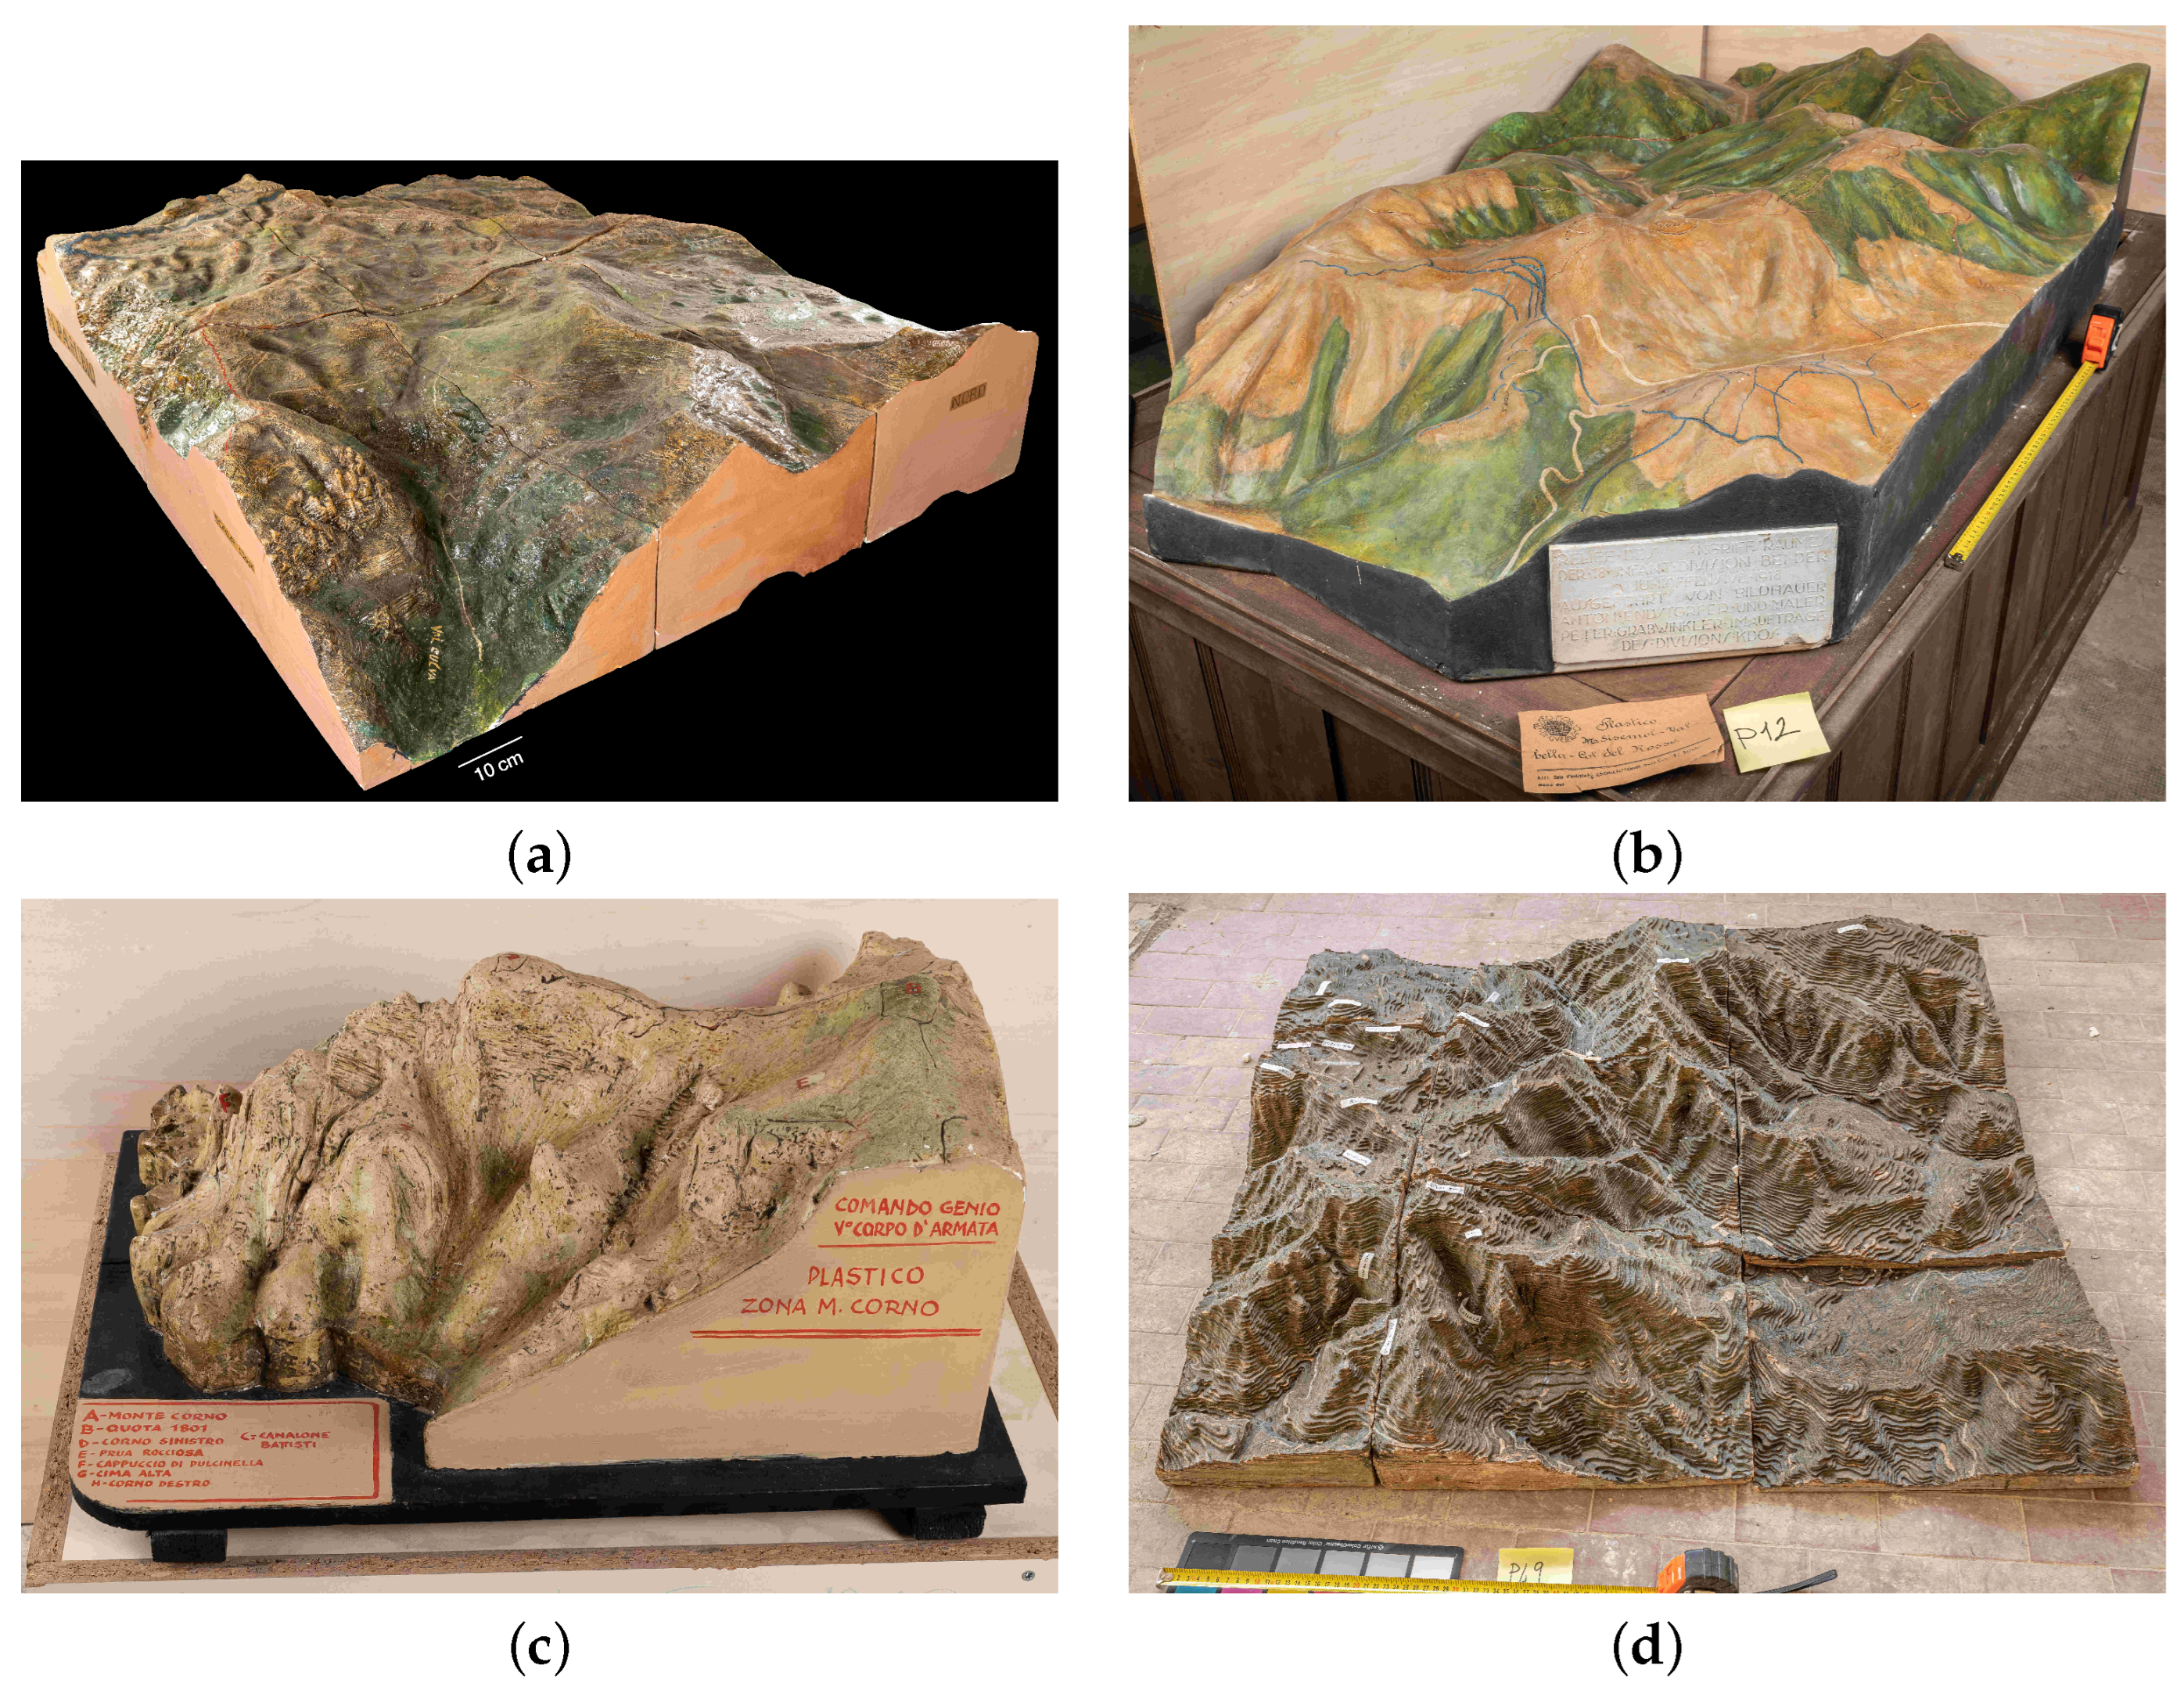
The collection of plan-reliefs preserved by the Museum consists of 60 pieces that have been acquired by the institution since its foundation. An important source for the study of the history of the collection is certainly represented by the museum visit guides, published since the 1920s, which contain traces of the plan-reliefs exhibited during the first decades of the museum’s life. In that period, there were around thirty plan-reliefs on display, divided between the room dedicated to the history of the city of Rovereto, the colonial rooms and the actual “plan-reliefs” room, set up in 1929 with materials from the military commands [5]. The museum continued to acquire this three-dimensional documentary typology even after the closure of the aforementioned rooms, following the various changes to the exhibition itinerary that occurred over decades of activity. However, the plan-reliefs were used for temporary exhibition events inside the castle, but also outside, as during the recent “Armies in miniature” exhibition, set up between 2019 and 2021 in Torbole sul Garda, whose theme was modeling in its various forms [6].
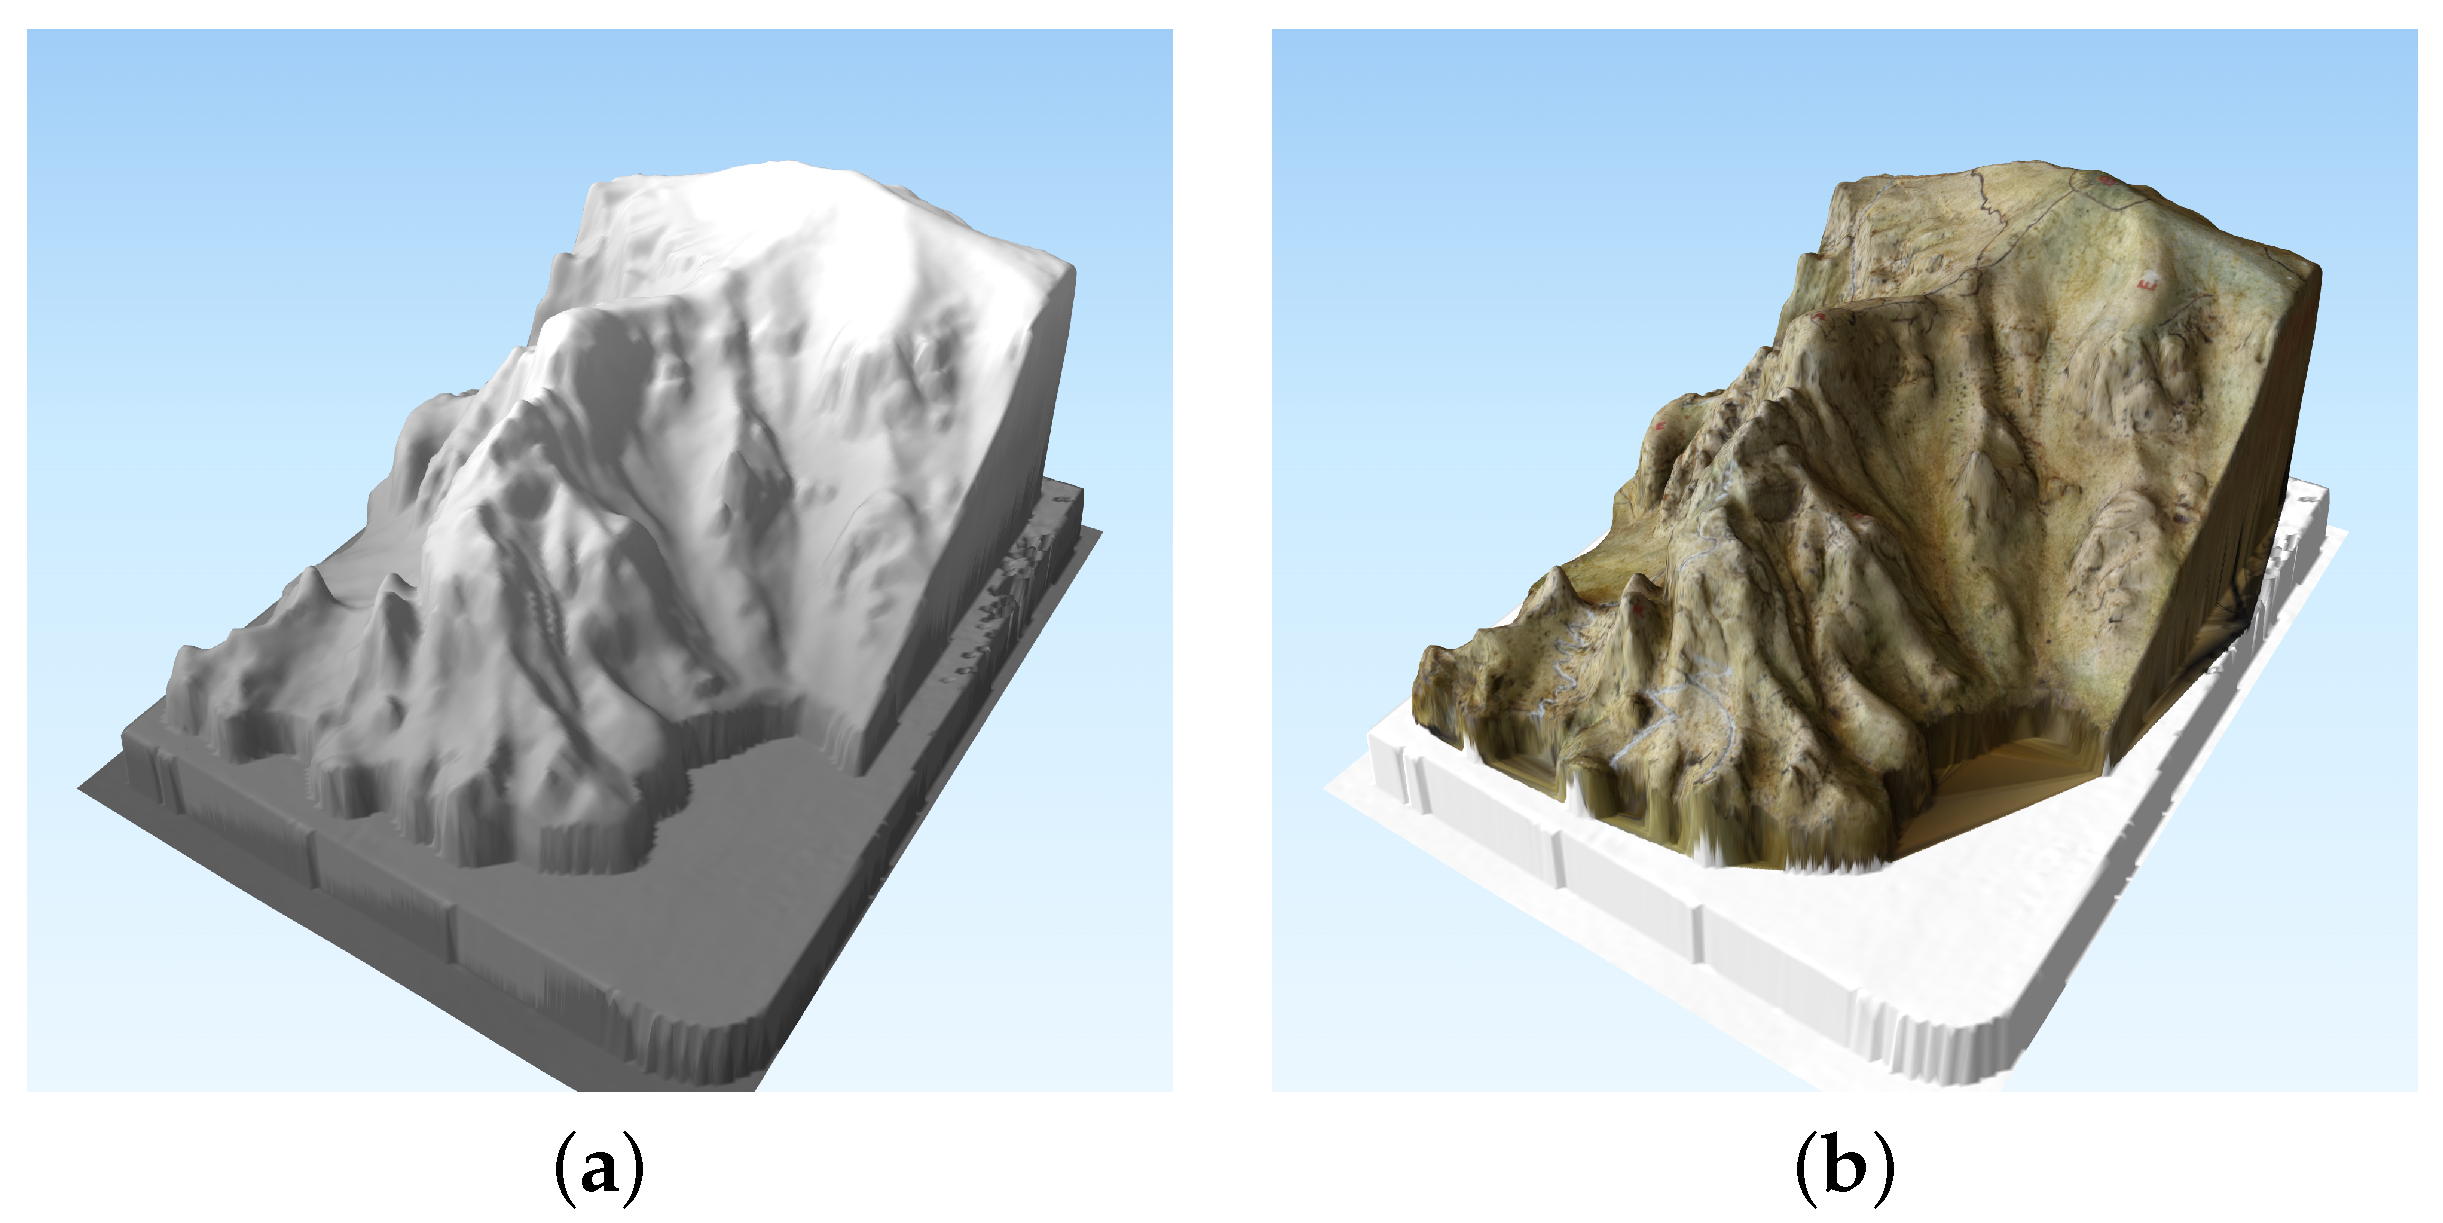
Since 2021, the plan-reliefs collection has been the subject of a project in collaboration with GeCo (the geo-cartographic laboratory of the University of Trento) which aims to study, scientifically catalog the assets and valorize them. Within this broader project, the production of digital models of the plan-reliefs allows for us to advance hypotheses of analysis and fruition implemented compared to the mere cataloging activity. From a conservative point of view, it makes possible the presence of all the necessary data on the asset without the need to manipulate it, allowing for it to be stored in sealed boxes. The virtual models are accessible to museum users (visitors, researchers, enthusiasts, etc.) on digital media within the visit itinerary, but also directly on online portals. From the digital models, it also makes possible the reproduction of the original plan-reliefs through 3D printing in order to make the product in plastic material manipulable by users without conservation problems. The possibility of manipulating copies, as accurate as possible, of original materials is an additional resource for the museum in approaching audiences with particular needs, such as blind or visually impaired people. Digital models can also be used directly in scientific research, offering the possibility of comparing plan-reliefs produced by different institutions (even by nations at war with each other). The comparison between plan-reliefs, topographical paper material and real data on the territory is interesting to understand the degree of accuracy in implementation. This can also allow considerations regarding the final purpose for which the plan-relief models were actually created and what their role was in the war events.

1.2. Digitalization of Historical Artifacts and Historical Map Georeferencing

The procedure and results described in this paper are just one aspect of a wider project aimed at digitizing the plan-reliefs property of the museum.
The purpose of this effort is (i) to create a digital copy of the artifacts for their preservation beyond the durability of the original objects, (ii) to generate a digital representation fit for virtual exhibitions, both local and on the world wide web, (iii) to test and compare different surveying techniques to identify the most suitable and (iv) to provide clues about the information and the techniques used for the artifacts’ creation.
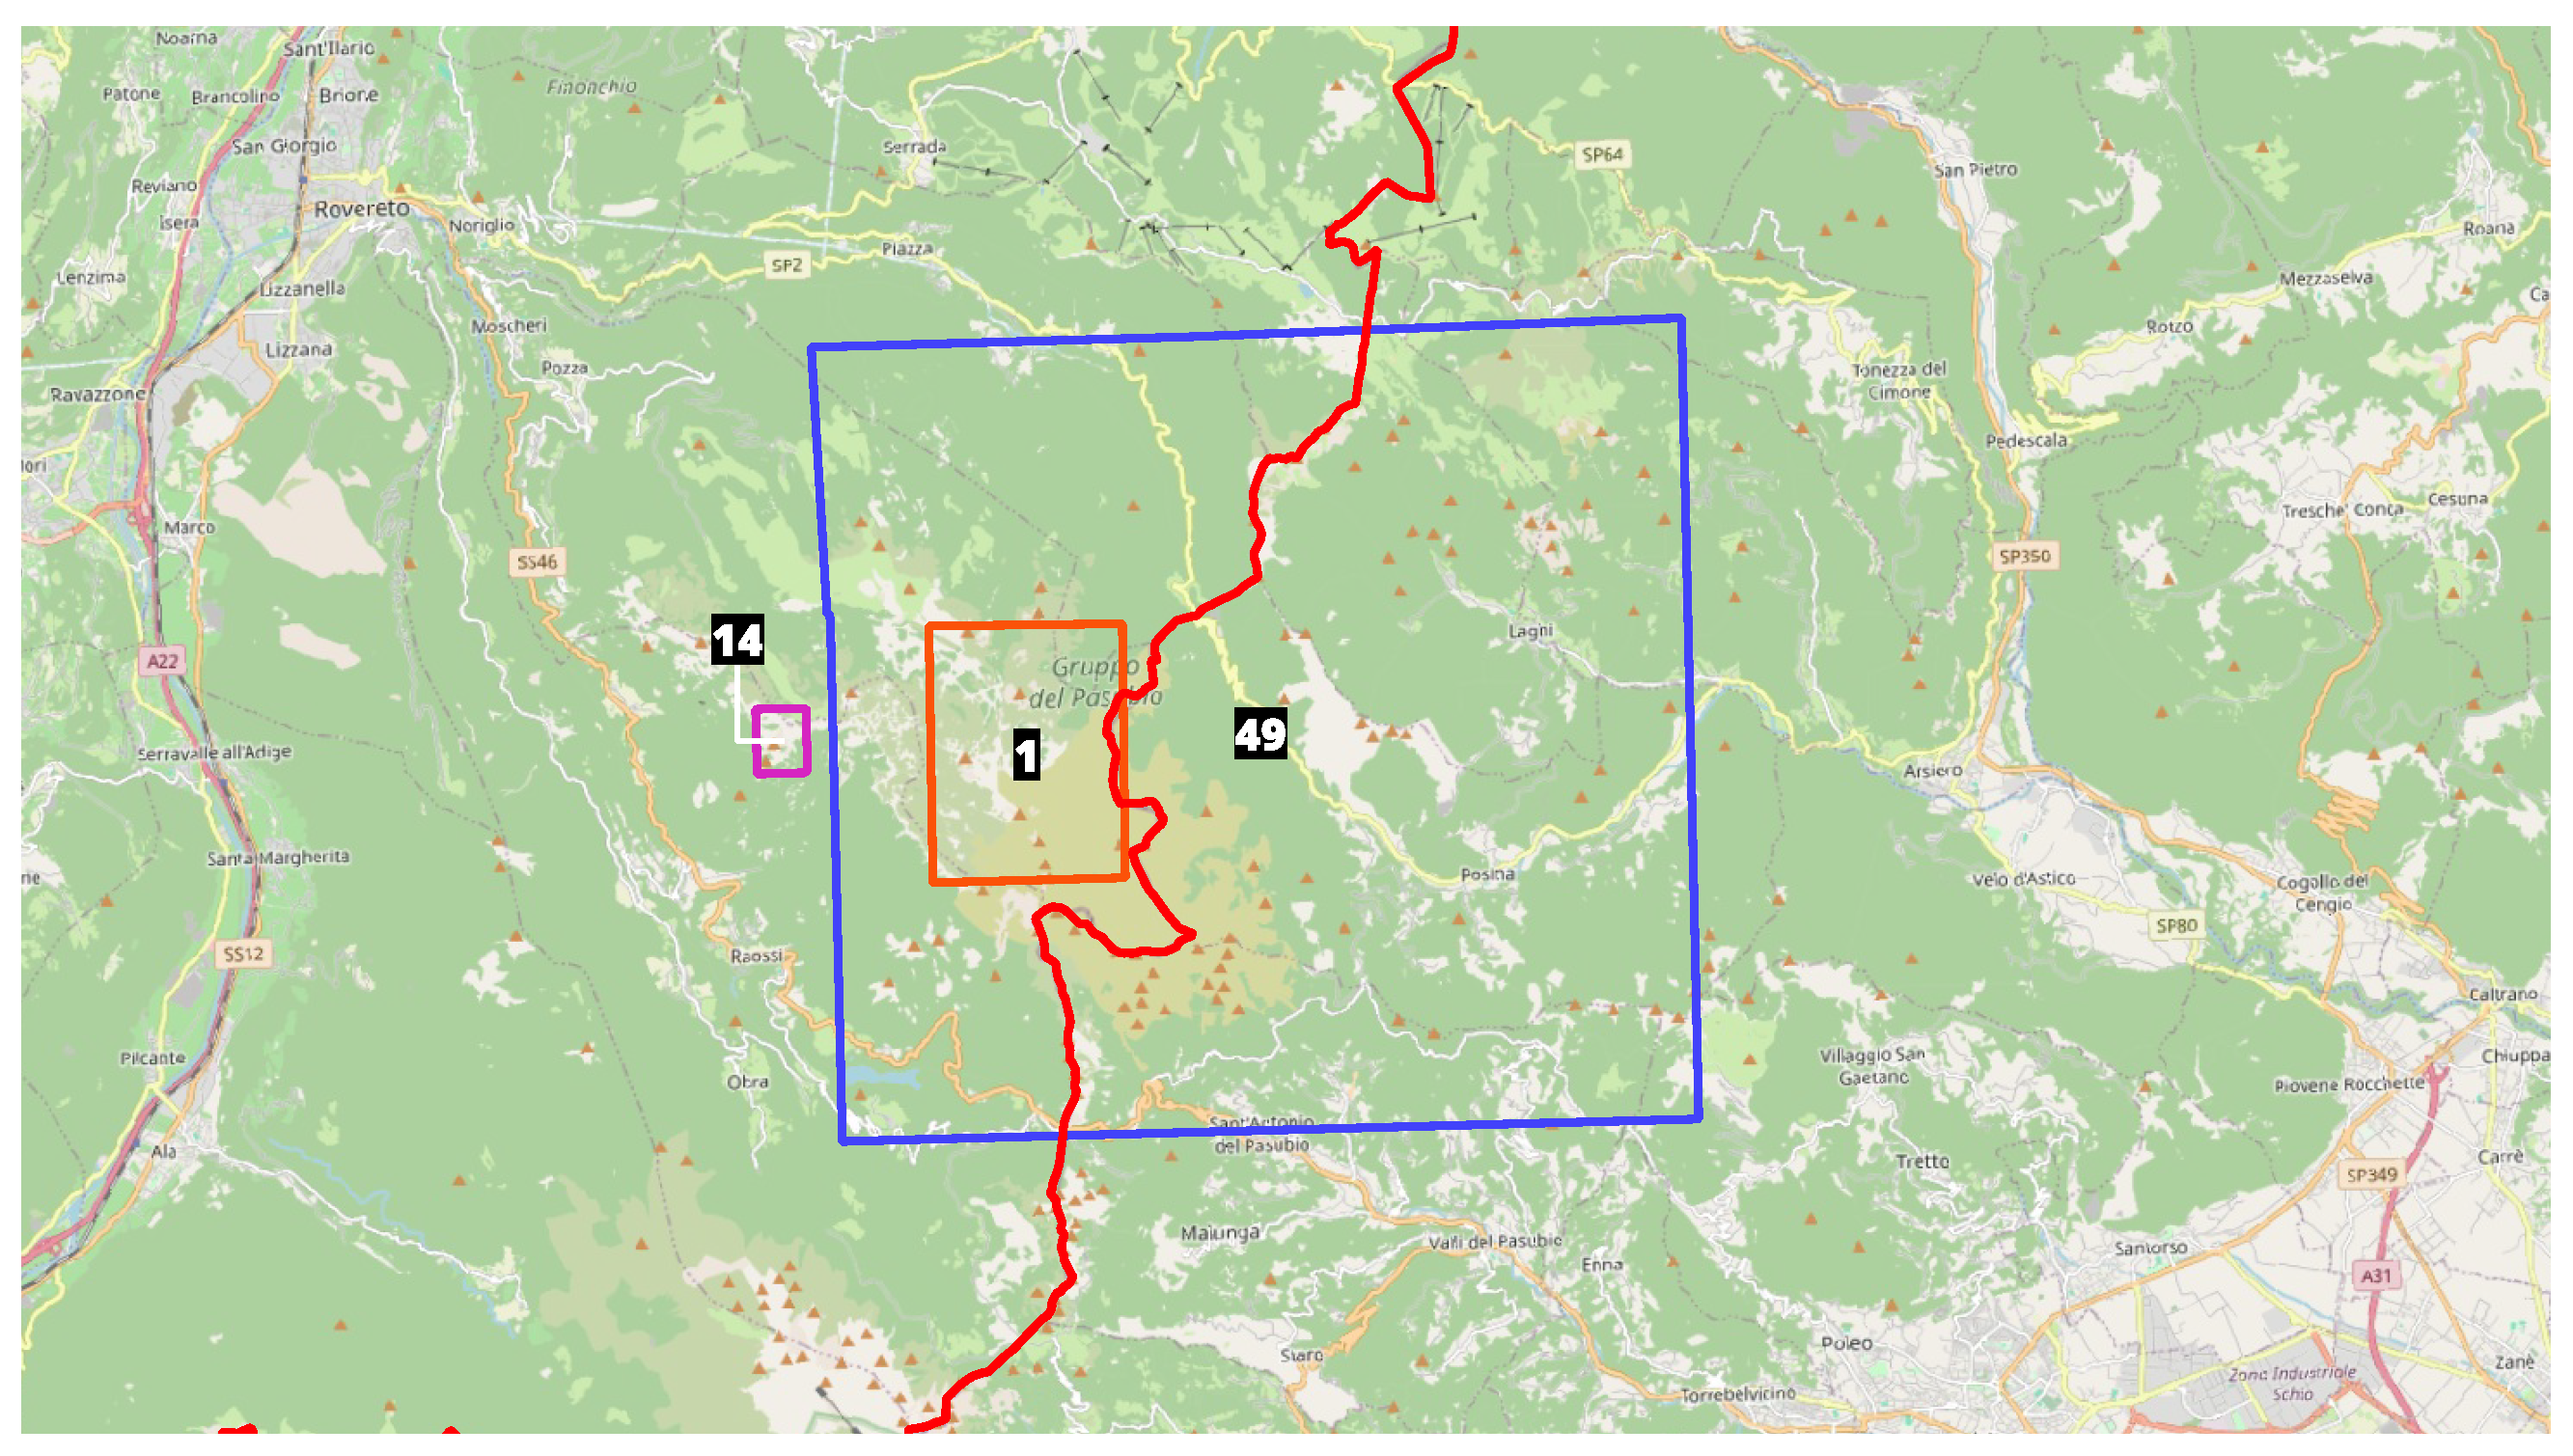
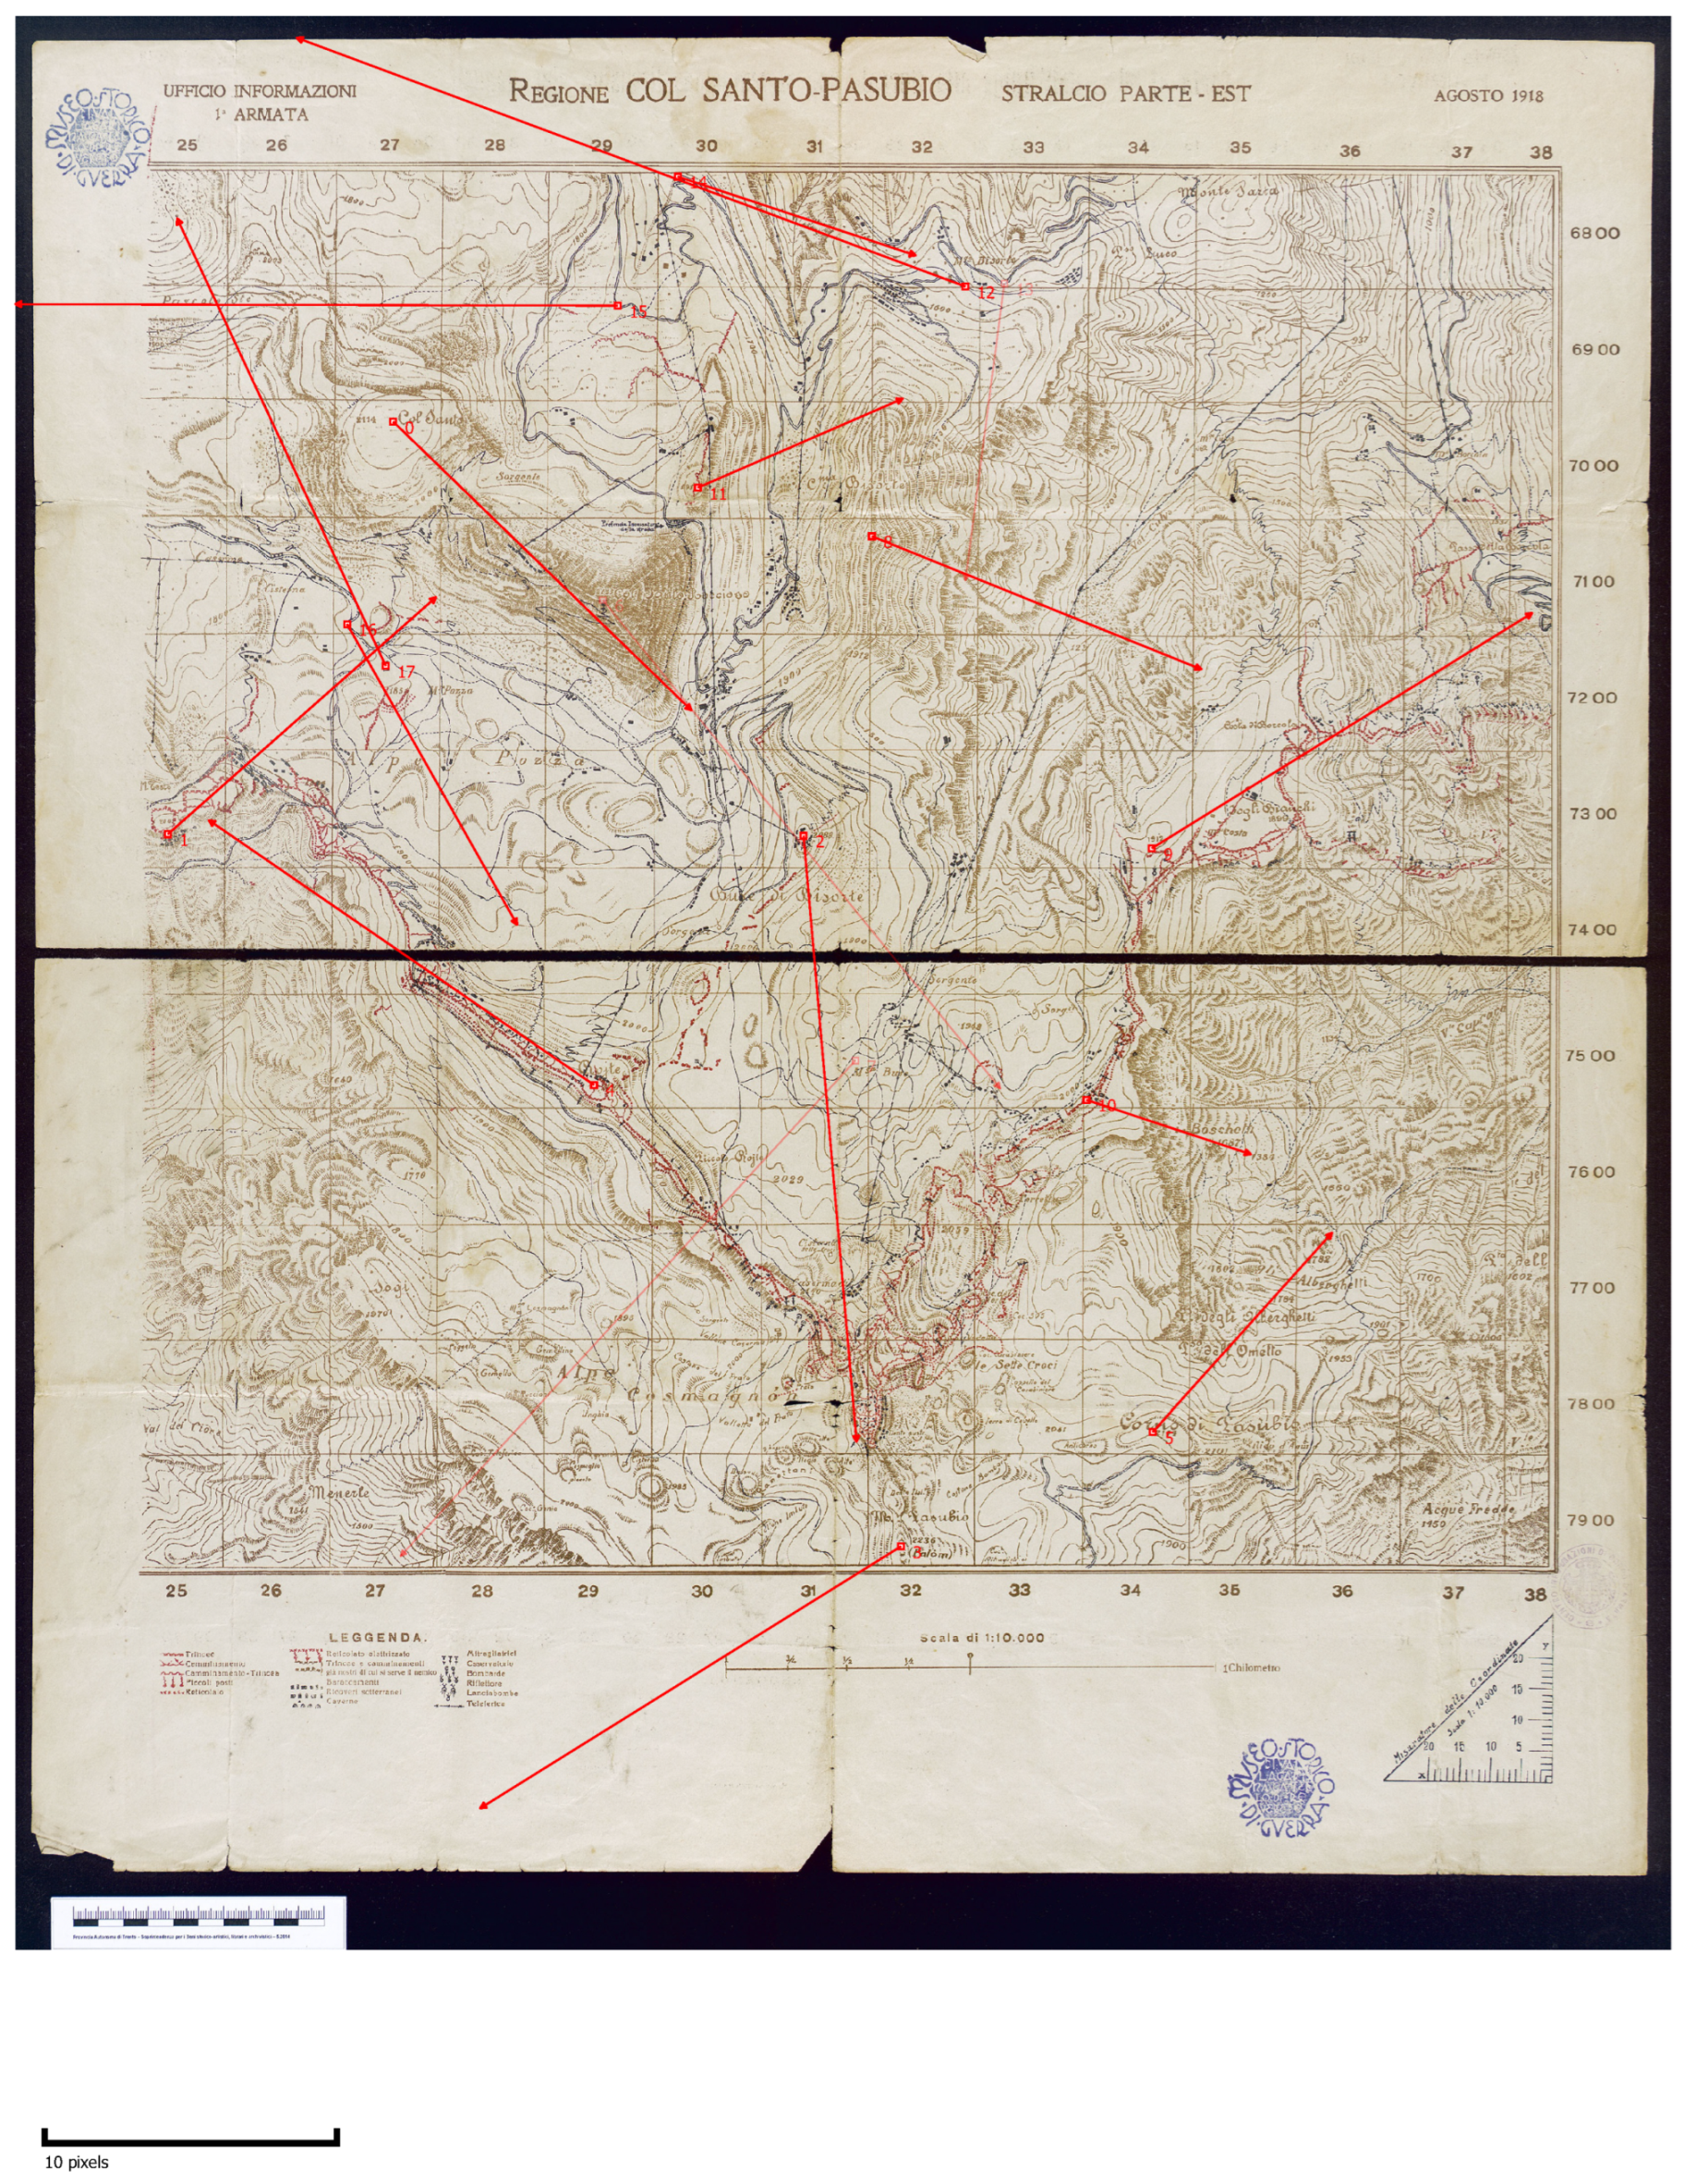
The current paper focuses on the latter objective, describing the georeferencing process of the historical maps, the quality of the results and its congruity with the plan-reliefs models.
The creation of digital models for artifacts is nowadays extensively used and documented [7,8]. Photogrammetric techniques have been used to digitize archaeological finds, often with the goal of exhibiting the final outcome [9,10,11]. However, the literature about the survey and reconstruction of plain-reliefs and their combination with contemporary maps is scarce. Niederöst used digital photogrammetry employing stereo images to reconstruct the surface of Central Switzerland created by the lieutenant general Franz Ludwig Pfyffer between 1750 and 1786 [12,13]. The relief measures (6.6 × 3.9) m at a scale of about 1:11,500.
Macher et al. created a digital model of the plain-reliefs of the city of Strasbourg using digital photogrammetry [14]. The model, built from 1725 to 1728, measures (12 × 6) m at a scale of about 1:600. Inverse application, i.e., the creation of plan-reliefs to reconstruct parts of buildings [15] and cities [16] from historical documents is more common.
Structure from Motion (SfM) is used for several application focusing on surface reconstruction, with objects at very different scales, such as part of a territory, buildings or single objects. More recent authors introduced the use of SfM for archaeological surveys and objects reconstruction [17,18,19]. Green et al. [17] investigated the use of Structure from Motion methods for archaeological research focusing on the reconstruction of buildings and archaeological sites, in particular for surface reconstruction.
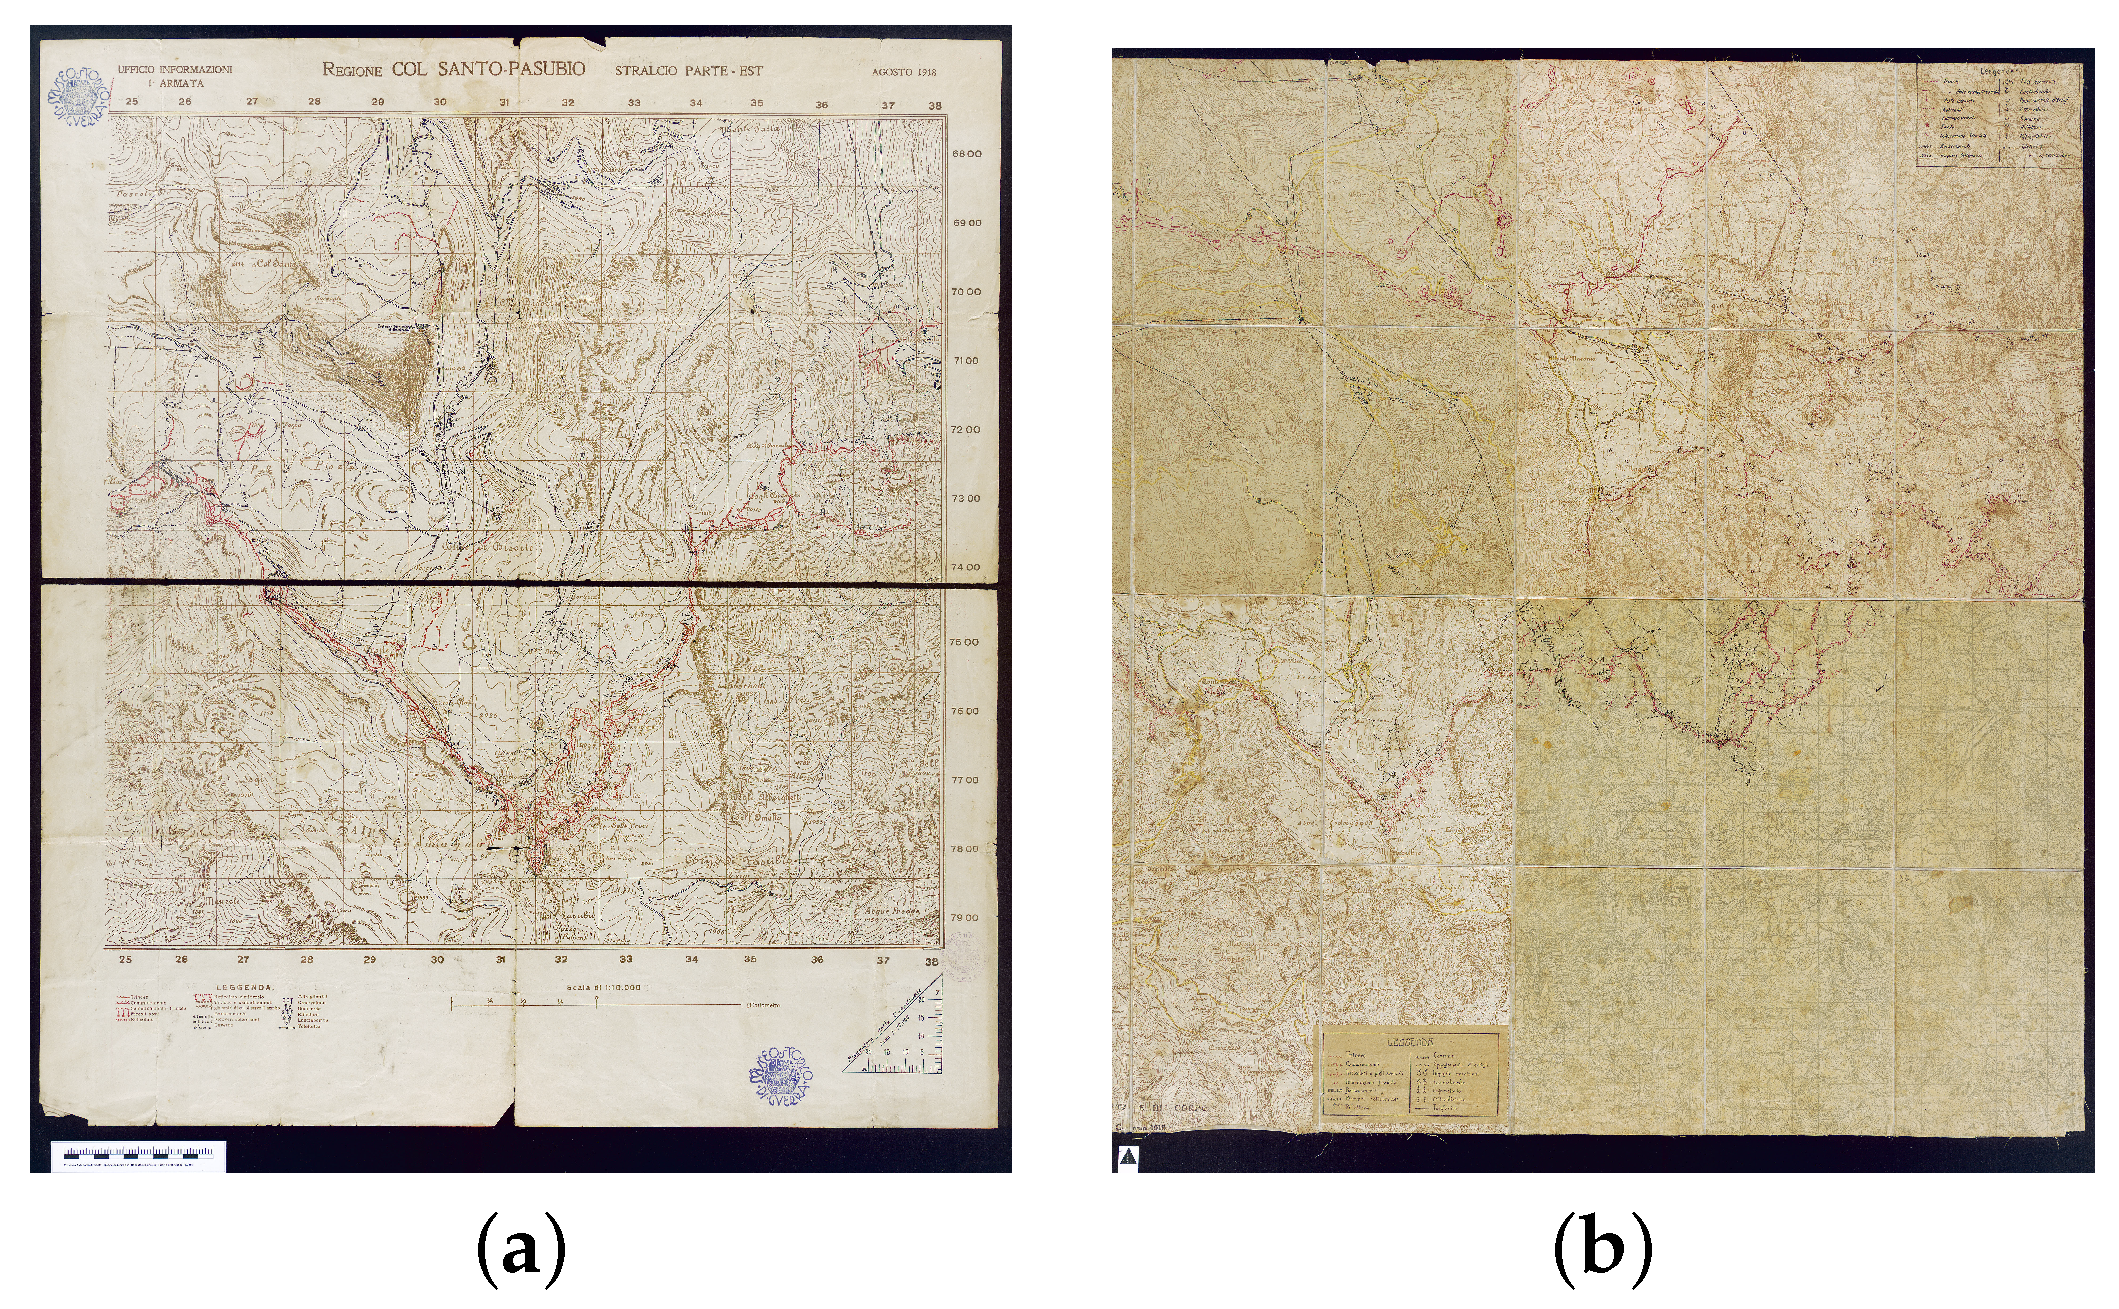
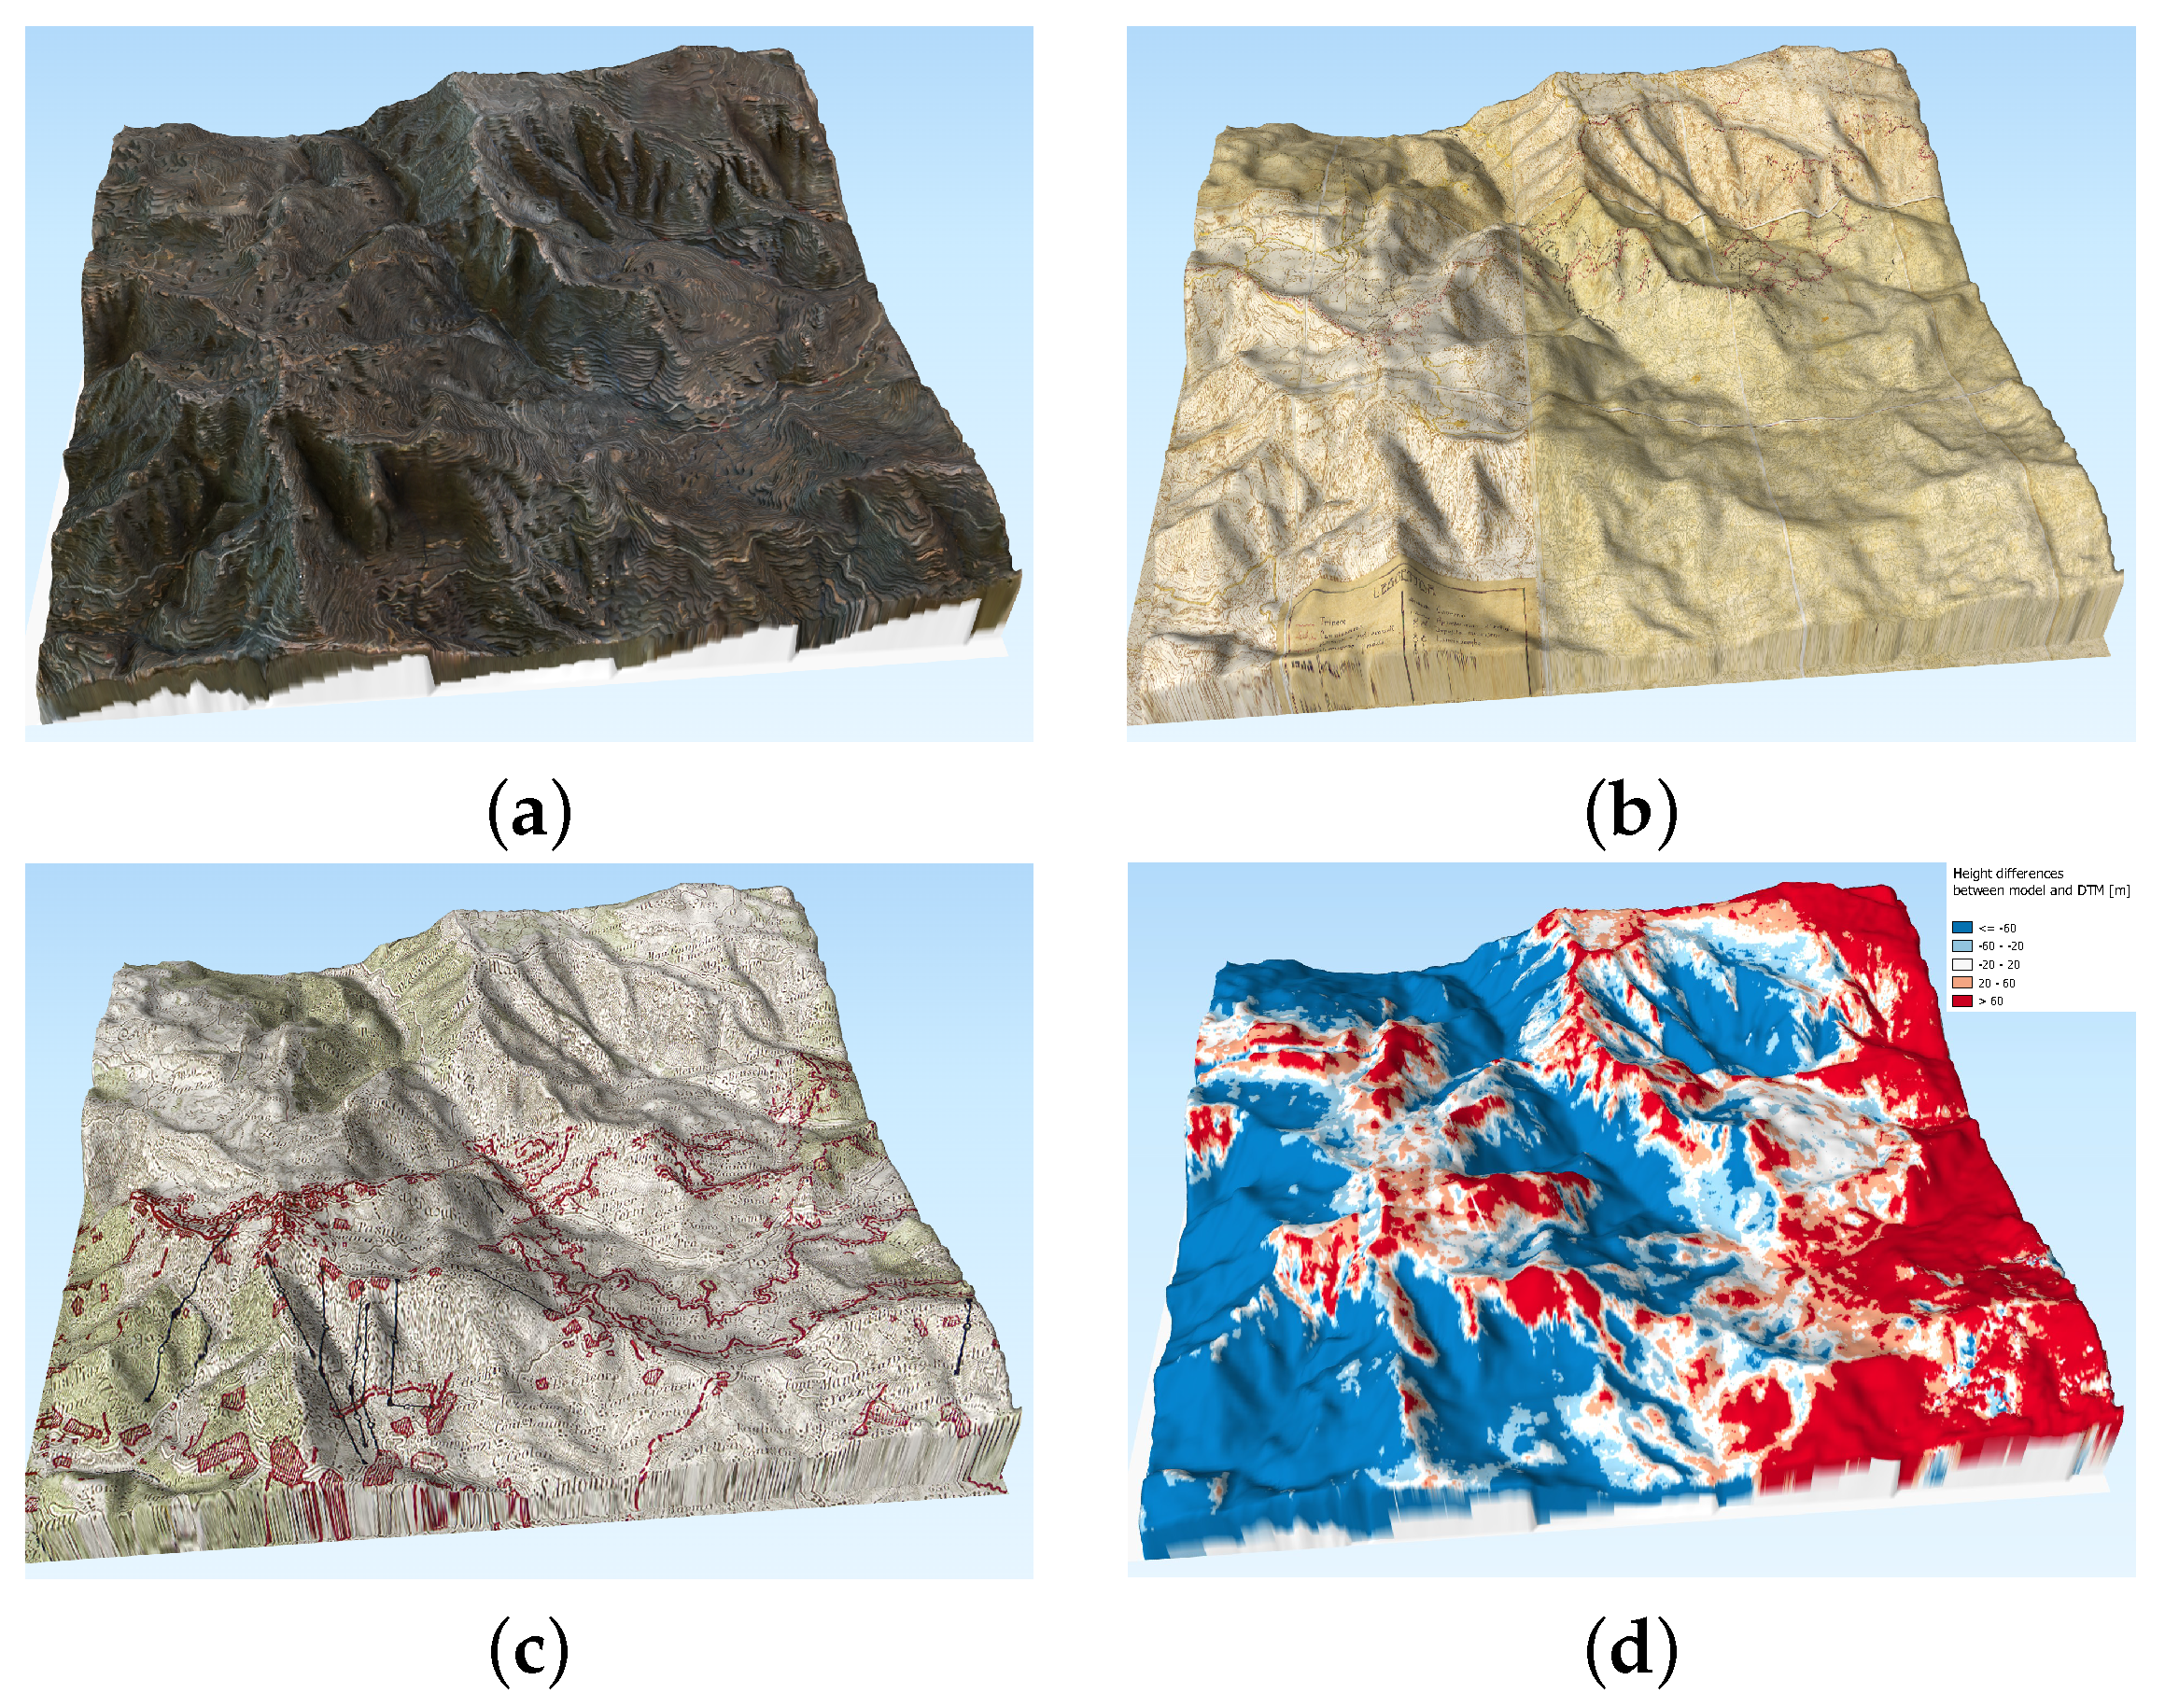
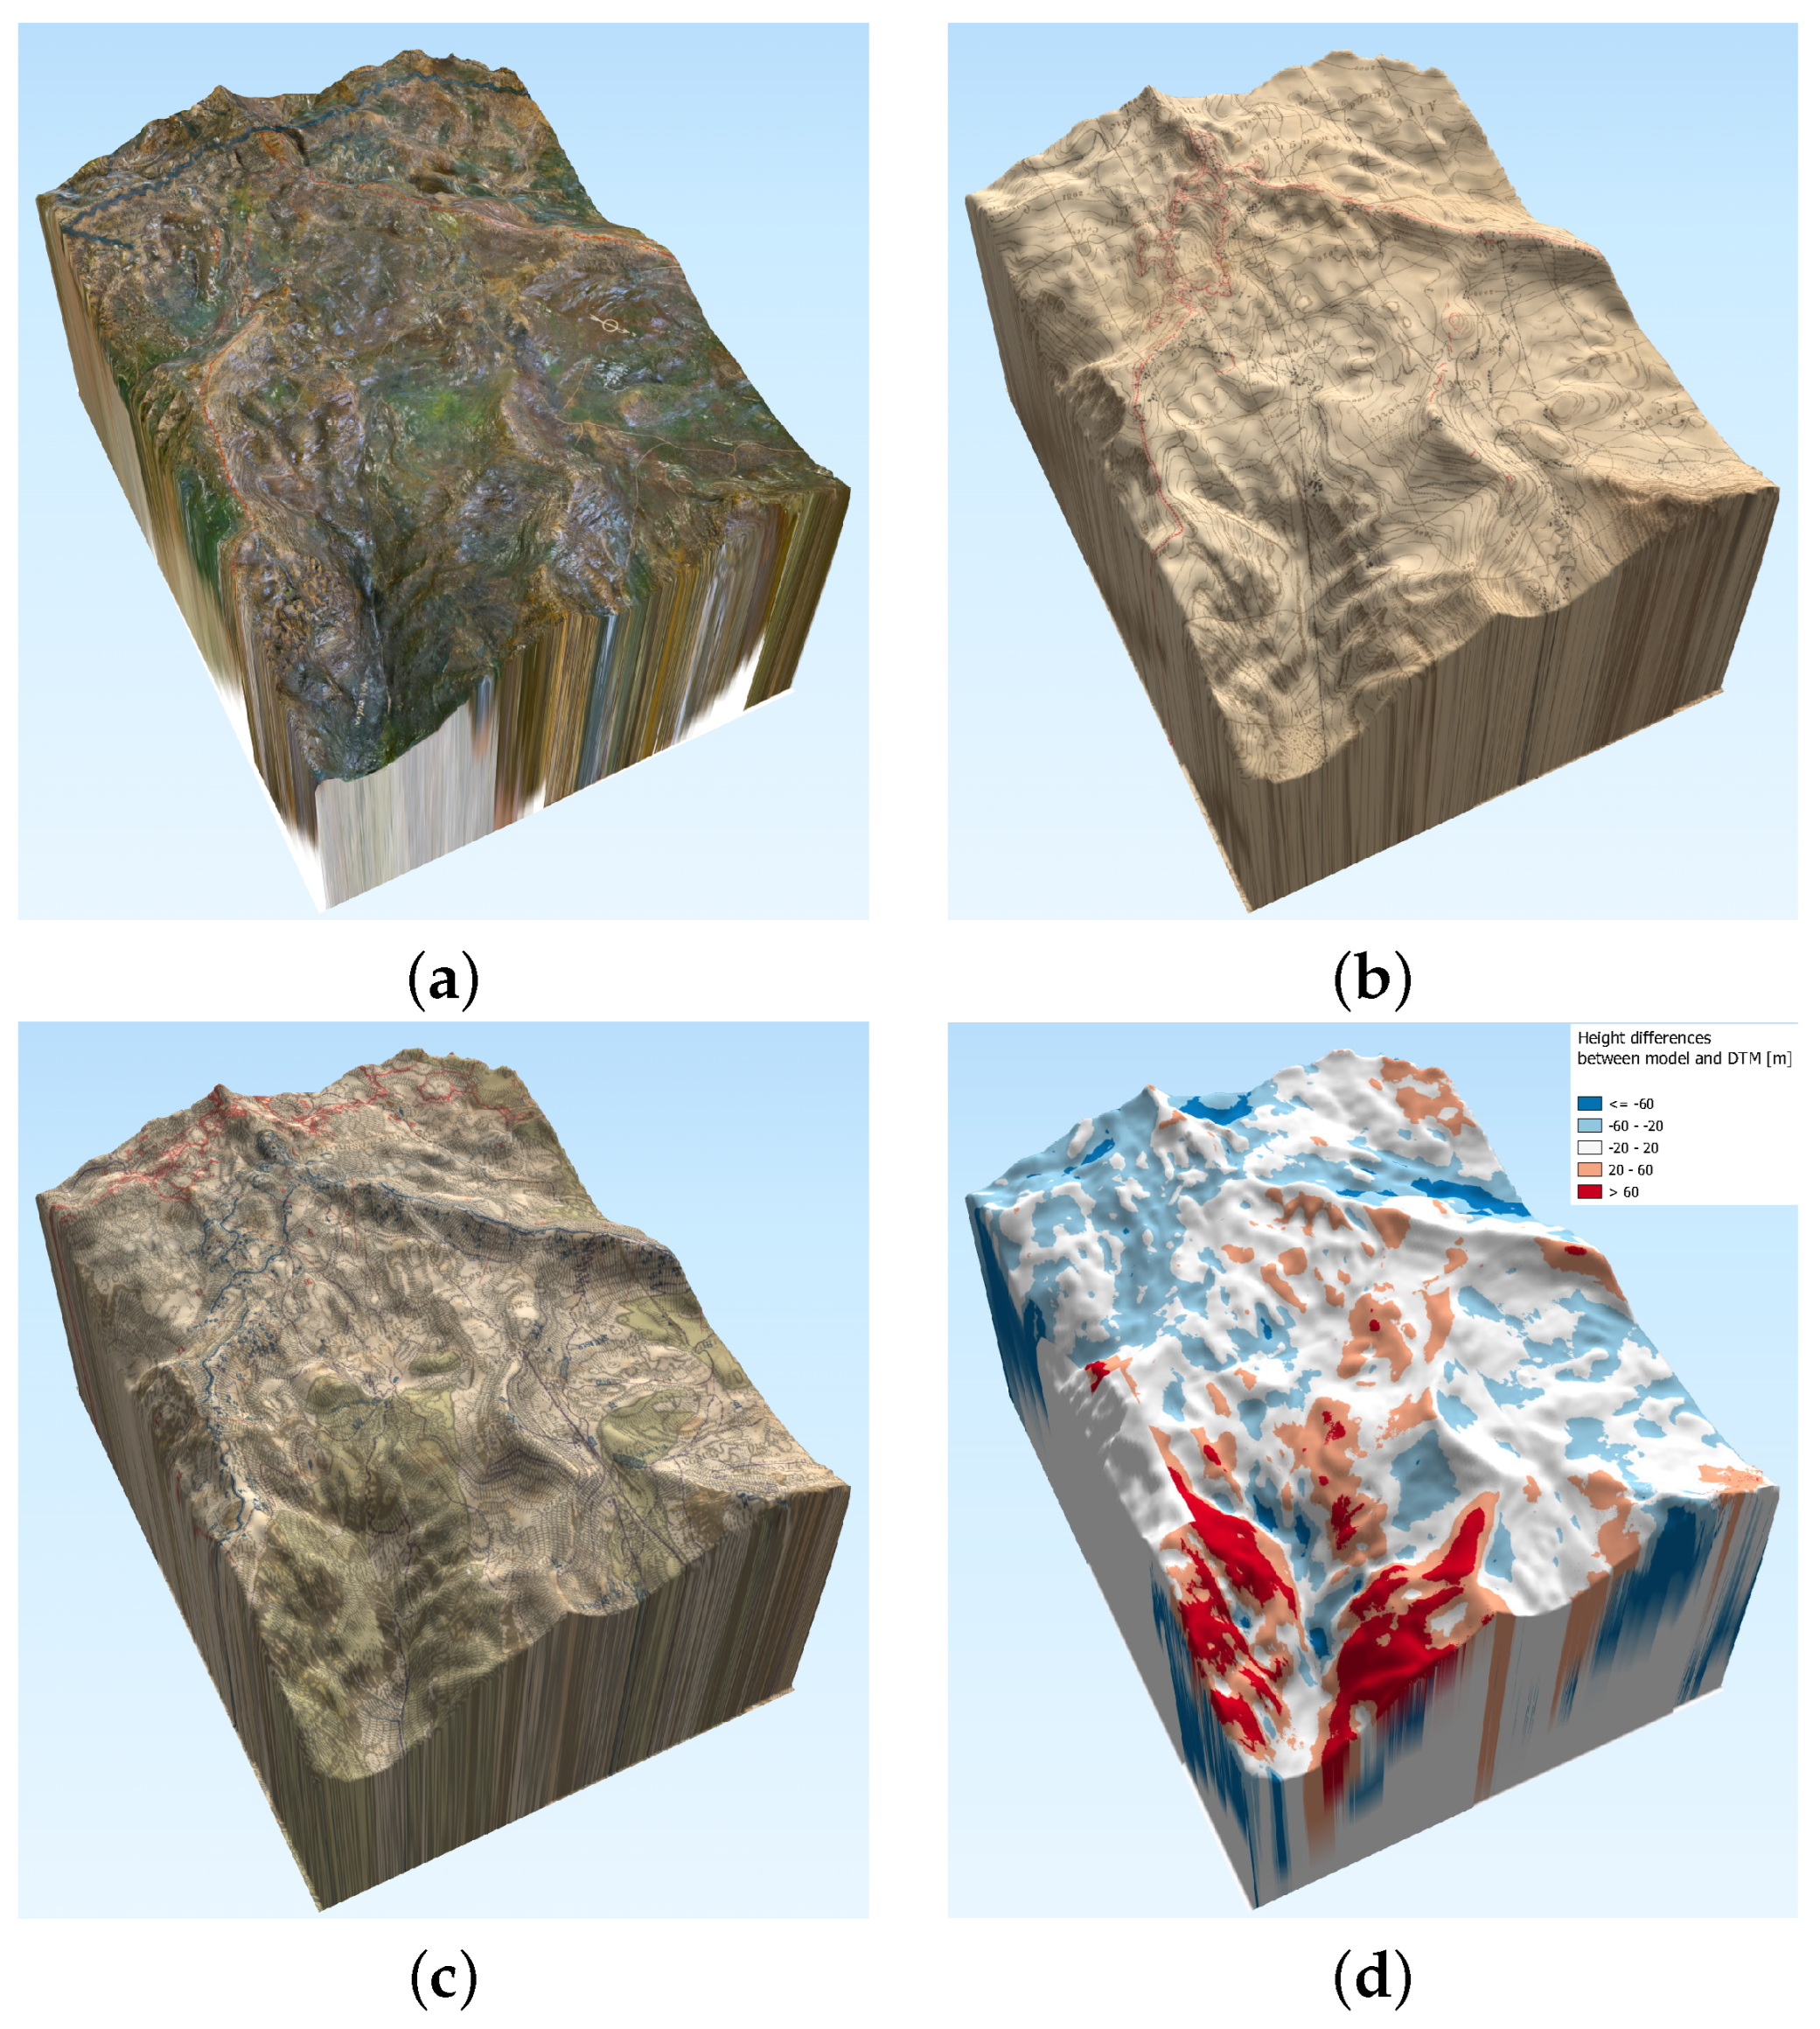
This paper applies the Structure from Motion approach to the surface reconstruction of plain-reliefs. Moreover, the simultaneous georeferencing of historical cartography is carried out. The availability of maps contemporary to the plain-reliefs allows not only the study of the process used in the model creation, but also the comparison with the current maps and the creation of thematic maps by digitizing the original raster maps [20,21,22].
The application of digital editing of cartographic sources for historical map analysis is helpful not only qualitatively but quantitatively as well, since it allows for the comparison of older maps with more recent ones by assigning them a geometrical content. This allows for the quantitative assessment of changes in landscape features with the application of change detection methods [23,24].
The paper is organized as follows: Section 2 describes the plain-relief models, the maps used in the tests and the georeferencing process; Section 3 outlines the results of the geo-processing procedure, with focus on the choice of the correct transformation; Section 4 discusess the results and their significance. Conclusions and future developments are presented in Section 5.

2. Materials and Methods

2.1. Materials

Four plain-reliefs models are chosen for testing the procedure. They are selected to be representative of the whole collection in terms of materials, colors, sizes and configuration.
Materials are either gypsum and wood, gypsum and synthetic resin or cardboard. Some plain-reliefs are painted with color coats with variable degrees of color brightness; one has dark matte gray and green colors. Sizes vary from less than 0.4 m to 1.5 m. Some models consist of a single piece, others of 9 parts that must be assembled. The latter configuration has the additional problem of dealing with edges not perfectly matching between pieces. The four models represent World War I battlefield areas between the Italian provinces of Trento and Vicenza. Their production date is set between 1917 and 1918.
The first one is a plain-relief depicting the “Monte Corno” peak in the mountain group known as the “Pasubio group” (Figure 1a). It is a model representing the entrenchments within the aforementioned Italian Dolomiti plateau. Its scale factor is 1:2000 and it is made of gypsum and wood with a paint coating. It was produced by Italian army in 1918 and it is 2 m long and 1.5 m wide. It is divided into nine blocks composing the complete object.
The second model makes a scaled duplicate of the upland near Asiago, centered around the “Col del Rosso” or “Sibemol” peak, in the Vicenza province (Figure 1b). Its scale factor is around 1:5000 and it is made of gypsum and synthetic resin with a paint coating. It was produced by Austro-Hungarian army in 1918. It is 1.5 m long and 1 m wide.
The third plan-relief portrays the mountain known as “Monte Corno” (Figure 1c), where two Italian irredentist patriots, Cesare Battisti and Fabio Filzi, were captured by the Austro-Hungarian Army on the 10th of July 1916. Its scale factor is 1:2000 and it is made of gypsum and wood with a paint coating. It was produced by Italian army and it is smaller than the others: 50 cm long and 39 cm wide.
The last model reproduces the Pasubio group near Venetian Dolomiti (Figure 1d). Its scale factor is 1:12,000 and it is made of cardboard layers each corresponding to a contour line. It was produced by Austro-Hungarian army. It is an assembly of nine pieces, composing a square of approximately (1 × 1) m.
The historical maps were provided by the archive of the Museo della Guerra di Rovereto as simple, non-georeferenced, digital images [25]. Ten maps were selected from the archive; they cover the area around the Pasubio group, a mountain massif in the upper parts of the Vicenza Pre-alps, located on the border between the provinces of Vicenza and Trento, in the Italian Alps. They represent a larger land portion than the area covered by the two plan-reliefs of the Pasubio group. While some of these maps are Italian in origin, others are Austro-Hungarian. Their creation date falls within the period that runs from August 1917 to October 1918. Just one map is dated 1923. Overall, the original paper documents look to be in good conditions, providing a decent amount of information. Their scale factor ranges from 1:10,000 to 1:75,000 (Table 1). Figure 2 shows two of these maps.
The Italian maps are in the pre-Rome40 datum, using a Bessel ellipsoid with orientation near Genoa and the Sanson-Flamsteed equal-area map projection [26,27]. This datum was the standard Italian datum for the official Italian maps of the time and all the derivative maps, see, e.g., the “The 1936 Italian Kingdom Forest Map” [28], until 1940.
The Austro-Hungarian maps are in the Militärgeographisches Institut (Military Geographic Institute or MGI) Hermannskogel, Habsburgwarte 1871 datum [29] with Cassini-Soldner projection. Table 1 lists the maps and their main features.
Current cartographic information was used as a reference, both to obtain Ground Control Points (GCPs) for the georeferencing process and to be able to compare the plain-reliefs surface with a modern Digital Terrain Model (DTM). In Italy, large-scale cartography is provided by the Regions or the autonomous provinces [30]. The area falls between the Regione Veneto and the Autonomous Province of Trento (Provincia Autonoma di Trento, PAT) (Figure 3); therefore, maps were obtained from both sources and patched.
For the western part of some models and maps, the PAT DTM was used. It is the product of a lidar survey carried out in 2014 and subsequently integrated in 2018. The DTM resolution was (0.5 × 0.5) m. The 1:10,000 technical map was used to derive the coordinates of GCPs used in the georeferencing procedure. All maps are available under the Creative Commons Attribution (CC-BY (https://creativecommons.org/licenses/by/4.0/ accessed on 28 December 2023)) license in digital format, in the ETRS89 datum/UTM zone 32N cartographic projection (EPSG: 25832).
Since the eastern part of maps and plan-reliefs often lies in the Veneto region, another DTM was obtained from there. This is specifically the DTM from the Forest Organizational Unit of the Veneto Region (Unità Organizzativa Foreste e Selvicoltura). The DTM resolution was (10 × 10) m. The technical 1:5000 cartography is also available in the ETRS89 datum/UTM zone 32N cartographic projection (EPSG: 25832). The license used by the Veneto Region is the “Italian Open Data License 2.0” (IODL 2.0 (http://www.dati.gov.it/iodl/2.0/ accessed on 28 December 2023)).

2.2. Methods

A photogrammetric survey was performed to create a digital model of each plan-relief, using a DSLR camera (Nikon D3500, 24 MP, 18 mm focal length) and a telescopic pole equipped with a 3-axis gimbal stabilizer (3D EYE patented by Microgeo srl (Campi Bisenzio (FI), Italy), mounting a mirrorless camera (Sony α 6000, 24 MP, 16 mm focal length). Typically, 200 images were acquired for each model. The entire processing was performed relying on the commercial software Agisoft Metashape Pro 1.7.2 and the open-source software Cloud-Compare version 2.12.4. All required Ground Control Point (GCP) and Check Point (CP) coordinates were derived from the aforementioned provincial/regional technical map.
The plan-relief three-dimensional models were georeferenced within Metashape. For each model, a set of points was created by identifying their respective coordinates. Points were chosen so that each point was uniquely identifiable on the model. The ground coordinates of these points were determined by finding the corresponding points on the technical map, which provides coordinates in the target datum. For instance, mountain peaks, roads and tracks junctions and building edges were ideal to serve this purpose. Once the models were completed, an accuracy check was performed by taking multiple points and comparing their distances on the model with the distances between the corresponding points on the technical map, representing the ground truth.
Given the types of maps involved, there was no need to use exact georeferencing algorithms, such as thin plate spline, finite element transformation and warping and morphing [31]. The non-exact approaches provided by the Helmert transformation, first- and second-order polynomial models are simple to apply and the evaluation of the goodness of fit of the model to the set of GCPs is straightforward. Moreover, it was possible to determine the optimal transformation for georeferencing each map by applying the Fisher test to GCPs residuals [31].
The historical maps were georeferenced making use of the FOSS (Free and Open Source Software) QGIS 3.28.15 (“Firenze”) plug-in “Georeferencer”, which provides Helmert, first- and second-order polynomial transformations. After the procedure is completed, a report is generated as output by the Georeferencer. Errors along X and Y coordinates and each GCP’s Root Mean Square Error (RMSE) are included.
The surface obtained for each model can be validated using the current DTM. Using QGIS’ “Layer Calculator”, it is possible to overlap one surface onto the other and determine their difference, obtaining a raster layer containing the difference between the terrain height from the plain-relief and the actual one from the DTM.

3. Results

3.1. Plain-Relief Georeferencing

The plan-relief three-dimensional models were georeferenced in Metashape using the Helmert transformation. The RMSE values derived by this procedure are displayed in Table 2. Figure 4 shows the 3D model for Monte Corno.

3.2. Historical Map Georeferencing

The Helmert transformation and polynomial transformations using first- or second-degree polynomials are tested on each map. The precision of the resulting maps is assessed by evaluating the RMSE of each transformation, while the accuracy is investigated using an independent set of CPs.
Cartographic grid or measured grid should be used first to register topographic maps in their nominal coordinate system whenever possible; however, for the maps under investigation, even when the grid is visible, its association with coordinates is not straightforward. Thus, the main problem is to find a sufficient number of GCPs on the historical maps which are clearly identified on the current map. In fact, most of the areas under investigation are sparsely inhabited, with few buildings and roads. Moreover, some of the historical maps have blurred lines and points. For this reason, the number of CPs is small. The graphical error is assumed to be 0.2 mm, in line with international [32] and Italian national [33] values. The results are shown in Table 3.
The accuracy of the results for each map and transformation was evaluated by measuring the distance of a set of Check Points (CPs) on the georeferenced map and on the current map. Due to the difficulty of identifying points on the historical map, only three CPs for each map were used. The results are given in Table 4.
Entities and directions of residuals on GCPs for Italian map 36-93-01 F, with scale 1:10,000 from August 1918 (Figure 2a) are shown in Figure 5.
Number, density and distribution of GCPs always affect the georeferencing outcomes and it is impossible to predict the best choice for the transformation [34]. Therefore, a rigorous procedure was deployed to select the best transformation between those available. However, for maps already in a cartographic projection, such as those involved in the procedure, as a general rule, the simplest transformation should be used to avoid over-parametrization. For this reason, the Helmert transformation was chosen whenever residuals on the CPs were small. If the accuracy of the Helmert transformation was not acceptable, a choice was made between first- and second-order polynomials.
The assessment criterion has to take into account the generic m-order polynomial performances in terms of accuracy (i.e., CP residual analysis) and precision (i.e., GCP residual analysis). The accuracy behavior solely depends on CPs, not on the polynomial order m, because CPs are only utilized for validation rather than model training. It is impossible to predict the optimal polynomial order in terms of accuracy. On the other hand, the sum of the residual squares progressively reduces as the polynomial order m increases when the least squares approach is applied on the same set of GCPs for different polynomial orders; thus, when moving to higher-order polynomials, the precision always increases.
Therefore, in order to determine whether the precision gain of the higher-order polynomial model was statistically significant, the Fisher test on GCPs’ total residuals evaluated the performances on GCPs for first- and second-order polynomial models.
If the higher polynomial order between the two produced a statistically significant increase in precision, then that order was to be used. On the contrary, the lower polynomial order was regarded as the best choice if the test demonstrated a non-significant increase in precision. This follows the principle that it is preferable to make as few alterations as possible to the original image, so that the georeferenced image resembles the original as much as possible.
The results of this process are reported in Table 5.
Assuming a significance threshold of 0.05 (or 5%), results in Table 5 indicate that there is no significant difference between residual distribution for first- and second-order polynomials, except for map 60-03-01 F. Therefore, first-order polynomials are preferred but for map 60-03-01 F, which was georeferenced using a second-order polynomial.

3.3. Surface Comparison

A comparison between the digital models derived from the models and the actual DTM obtained from the technical regional service was carried out by computing the difference between the two surfaces. Surface discrepancy was evaluated after resampling the current DTM to the model surface resolution. General statistics about the differences are shown in Table 6, while the distribution in quantile of the surfaces differences is reported in Table 7.
Surface differences are shown in Figure 6 and Figure 7, respectively, for Austrian and Italian plan-relief for Mont Pasubio; in particular, the comparisons with the reference DTM are shown in Figure 6d and Figure 7d.

4. Discussion

4.1. Historical Map Georeferencing

The outcome of the georeferencing process yields satisfactory results. RMSE on GCPs and CPs can be explained by graphical error on the original map only in part (Table 3), while the major contribution is granted by the uncertainties in the materialization of the reference system [27]. In the georeferencing process, in principle, higher-order transformations should result in lower RMSE because of the higher number of degrees of freedom. However, this does not correspond to lower RMSE on CPs; see, for example, the results for map 5_64 in Table 4. The application of Fisher test allows for us to decide whether the use of higher-order polynomials provides more precise results.
The choice of the georeferencing transformation was made using the following rules:
  • Helmert is used if the RMSE on the CPs for the Helmert transformation is lower than the precision given by the combination of scale and graphical error (supposed to be 0.2 mm);
  • otherwise, first-order polynomial transformation is used unless Fisher test indicates a significant gain in precision using a second-order polynomial.
Table 8 shows the results of the application of the criteria above. The fist-order polynomial transformation performs best for all the maps but for maps 60-03-01 F and 5-58 B. Map 60-03-01 F is a small-scale (1:75,000) Austrian map. The map is in good condition, but a large black line in the middle of the map leaves the central area without GCPs. This is the most probable reason for the better performance of the second-order polynomial transformation indicated by Fisher test (Table 5). Map 5-58 B is a small-scale (1:75,000) Austrian map with good detail and in good conditions: in this case, the Helmert transformation already provides good results in terms of RMSE on the CPs (Table 4).

4.2. Surface Comparison

The results of the evaluation of the difference between the surface from the plain-reliefs and the current DTM are reported in Table 6 and Table 7 and shown in Figure 6d and Figure 7d.
Table 6 reports large values for the differences, especially for negative values, where the surface of the model is lower than the DTM. However, quantile distribution in Table 7 shows that most of the surface has smaller variation.
These differences have several causes: approximations in the creation of the plain-reliefs, errors in relief georeferencing which can lead to surfaces shifted with respect to the current DTM, errors in the creation of plain-relief models and uncertainties in the current DTM. There is no way to assess a priori the effect of errors in the creation procedure of the plain-reliefs; indeed, one of the reasons for this research is to estimate the accuracy of the process. The effect of georeferencing errors (Table 2) can lead to a significant difference on steep slopes for high-resolution (0.5 m) DTM in the PAT part of the region, while for the lower resolution (10 m), the DTM in the Veneto part is probably negligible. A thorough investigation of the accuracy of the digital surface model of the plain-reliefs is underway, but first results indicate a good accuracy except for very steep areas representing narrow valleys, where occlusions often occur and the Structure from Motion approach shows its weakness. Finally, uncertainties in the reference current DTM are negligible with respect to all the previous error sources. Height differences are expected to be more significant for large scale plain-reliefs, because for small-scale (less detailed) models, the surface tends to be smoother, evening out discrepancies.
The model of the Italian plan-relief of mount Pasubio (Figure 7d) shows an elevation difference with respect to the reference DTM mostly below 50 m and many areas do have a height value matching the real one. Considering the scale factor, a 50 m error on the ground corresponds (with scale 1:2000) to a 25 mm on the physical objects. The only part showing a larger deviation is the valley in the front, which is a complex zone to model for the Structure from Motion processing due to the occlusions given by the morphology of this plan-relief area. This seems likely to be a good result: the digital surface derived from the scale model survey generally matches the actual one. It is important to note that in the model, the elevation is the weaker coordinate, since no external reference for this coordinate was used during the survey.
A larger error is observed for the Sibemol Val Bella (Col del Rosso) plan-relief (Figure 1b). Most of the surface is characterized by a deviation in elevation larger than 50 m, meaning the error is larger than 1 cm at the scale of the model. This could be caused by the shiny coating affecting the photogrammetric reconstruction, together with greater difficulty in identifying GCPs on the scale model, resulting in a less accurate surface reconstruction and georeferentiation.
For the plain-relief model for Monte Corno (Figure 4), the large scale leads to smaller errors. Most of the area has an elevation error below 50 m, and many parts match the real elevation value.
Finally, for the Austrian relief of mount Pasubio (Figure 6d), the area with difference higher than 50 m is larger. This is probably due to the complex morphology and to the 1:12,000 scale. A 50 m error corresponds to 4 mm error on the physical model. Therefore, the large differences in height can be explained only partially by the scale.
On the whole, the outcomes thus far indicate the potential of the method. Some errors derive from intrinsic characteristics of certain plan-reliefs, other uncertainties are introduced by every processing step in surface modeling, such as photogrammetric reconstruction and digital model georeferencing.

5. Conclusions

Digital surface models describing plan-reliefs from World War I time were created with the application of Structure from Motion techniques. In addition, maps of the same period were georeferenced and then superimposed on the models. A comparison was made between the digital models and the actual DTM surface to evaluate their accuracy/precision and dependability.
The surface accuracy for the Austrian Pasubio is better than the accuracy obtained by Niederöst for Pfyffer’s relief which has a similar scale [35] once the outliers are omitted. The procedure yields satisfactory results for map georeferencing (Table 3 and Table 4), especially taking into account the uncertainties due to the technical limitations in both plain-relief production and cartography creation at the time. Results are consistent with those of Brovelli et al. [31] when the different scale is taken into account.
It was demonstrated that it is possible to set up a rigorous procedure for the choice of the best translation for georeferencing historical maps. In fact, it is impossible to choose the best transformation a priori due to the large number of factors involved, such as the datum of the original map, scale, conservation status, possible deformation of the paper and number and configuration of GCPs identifiable on the map.
Overall, the good results obtained in this experiment demonstrate that it is possible to create a high-quality plain-relief models and to match them with their contemporary maps. This research represents a pilot project which in the future will lead to the digitalization of a large number of plain-relief models.
Future developments include testing the use of laser scanner techniques and their integration with photogrammetric methods for a mutual completion and control. This could enhance the results, especially in the case of plain-reliefs with shiny coatings. Additionally, the analysis of the correspondence between maps and plain-reliefs will be carried out to formulate hypotheses about their construction techniques. Furthermore, the study of the correspondence between terrain features (ridges, ditches, pits) with military works, such as trenches, machine gun nests, roads and so on is envisioned.

Author Contributions

Conceptualization, Angelo Besana, Domenico Sguerso and Paolo Zatelli; methodology, Matteo Bozzano, Domenico Sguerso and Paolo Zatelli; validation, Matteo Bozzano, Domenico Sguerso and Paolo Zatelli; formal analysis, Matteo Bozzano, Domenico Sguerso and Paolo Zatelli; investigation, Matteo Bozzano; resources, Angelo Besana, Domenico Sguerso and Paolo Zatelli; data curation, Matteo Bozzano; writing—original draft preparation, Angelo Besana, Matteo Bozzano, Domenico Sguerso, Davide Zendri and Paolo Zatelli; writing—review and editing, Paolo Zatelli; visualization, Matteo Bozzano and Paolo Zatelli; supervision, Domenico Sguerso and Paolo Zatelli; project administration, Angelo Besana; funding acquisition, Angelo Besana. All authors have read and agreed to the published version of the manuscript.

Funding

The research benefited from a postgraduate research scholarship for 6 months of the Department of Humanities of the Trento University and financed by the Cassa Rurale Alto Garda e Rovereto. Research scholarship won by Matteo Bozzano.

Data Availability Statement

The datasets presented in this article are not readily available because they are part of an archive which is not public. Requests to access the datasets should be directed to the Italian War History Museum, via Castelbarco 7, 38068 Rovereto (TN), Italy. https://museodellaguerra.it/en/, [email protected], accessed on 14 March 2024.

Acknowledgments

The authors thank Giovanna Massariof the Department of Civil, Environmental and Mechanical Engineering of the University of Trento, Italy and her team for technical support.

Conflicts of Interest

The authors declare no conflicts of interest.

Abbreviations

CPCheck Point
DTMDigital Terrain model
EPSGEuropean Petroleum Survey Group
FOSSFree Software and Open Source
GCPGround Control Point
PATProvincia Autonoma di Trento
RMSERoot Mean Square Error
SfMStructure from Motion
UTMUniversal Transverse Mercator
WWIWorld War I

References

  1. De Santi, V.; Zendri, D. The model collections of the Italian Historical War Museum of Rovereto. Reflections on study, filing and valorisation starting from the Monte Pasubio model (1918); [Le collezioni di plastici del Museo Storico Italiano della Guerra di Rovereto. Riflessioni su studio, schedatura e valorizzazione partendo dal modello del Monte Pasubio (1918)]. Capitale Cult. 2023, 2023, 241–259. [Google Scholar] [CrossRef]
  2. Falcucci, B. Le sale coloniali del Museo della Guerra di Rovereto: Censimento e storia delle collezioni. Ann. Mus. Stor. Ital. Guerra 2020, 2020, 255–273. [Google Scholar]
  3. Fontana, N.; Frizzera, F.; Pisetti, A. Un Secolo di Storia Cent’Anni di Storie. Museo Storico Italiano della Guerra 1921–2021; Museo Storico Italiano della Guerra: Rovereto, Italy, 2021. [Google Scholar]
  4. Frizzera, F.; Pisetti, A.; Zendri, D. Museo Storico Italiano della Guerra. Guida alla Visita; Museo Storico Italiano della Guerra: Rovereto, Italy, 2020. [Google Scholar]
  5. Cantile, A. Il contributo dell’IGM alla Grande Guerra. In Cesare Battisti, la Geografia e la Grande Guerra; Dai Prà, E., Ed.; CISGE: Roma, Italy, 2019; pp. 35–46. [Google Scholar]
  6. Frizzera, F.; Zendri, D. L’Esercito Italiano nella Prima Guerra Mondiale. L’Uniforme Grigio-Verde (1909–1919); Verlag Militaria: Vienna, Austria, 2022. [Google Scholar]
  7. Visnovcova, J.; Gruen, A.; Zhang, L. Image-Based Object Reconstruction and Visualization for inventory of cultural heritage. In Digital Applications for Cultural and Heritage Institutions; Routledge: Abingdon, UK, 2017; pp. 117–124. [Google Scholar]
  8. Gagliolo, S.; Fagandini, R.; Passoni, D.; Federici, B.; Ferrando, I.; Pagliari, D.; Pinto, L.; Sguerso, D. Parameter optimization for creating reliable photogrammetric models in emergency scenarios. Appl. Geomat. 2018, 10, 501–514. [Google Scholar] [CrossRef]
  9. Tucci, G.; Cini, D.; Nobile, A. Effective 3D digitization of archaeological artifacts for interactive virtual museum. Int. Arch. Photogramm. Remote Sens. Spat. Inf. Sci. 2011, XXXVIII-5/W16, 413–420. [Google Scholar] [CrossRef]
  10. Zeybek, M.; Şanlıoğlu, I.; Karauğuz, G. Photogrammetric survey and 3D modeling of Ivriz Rock relief in late hittite era. Mediterr. Archaeol. Archaeom. 2013, 13, 147–157. [Google Scholar]
  11. Balletti, C.; Guerra, F.; Scocca, V.; Gottardi, C. 3D integrated methodologies for the documentation and the virtual reconstruction of an archaeological site. Int. Arch. Photogramm. Remote Sens. Spat. Inf. Sci. 2015, XL-5/W4, 215–222. [Google Scholar] [CrossRef]
  12. Niederöst, J. Image analysis for the history of cartography: Drawing conclusions from the evaluation of Pfyffer’s relief. Remote Sens. Spat. Inf. Sci. 2004, 35, 389–394. [Google Scholar]
  13. Niederöst, J. 3D reconstruction and accuracy analysis of historical relief models. In Proceedings of the 3rd International Seminar on Development in Digital Photogrammetry, Gifu, Japan, 24–27 September 2001. [Google Scholar] [CrossRef]
  14. Macher, H.; Grussenmeyer, P.; Landes, T.; Chevrier, C.; Halin, G.; Huyghe, O. Photogrammetric recording and reconstruction of town scale models–The case of the plan-relief of Strasbourg. In Proceedings of the 26th International CIPA Symposium–Digital Workflows for Heritage Conservation, Ottawa, ON, Canada, 28 August–1 September 2017; ISPRS: Göttingen, Germany, 2017; Volume 42, pp. 489–495. [Google Scholar]
  15. Balletti, C.; Guerra, F.; Meneghello, C.; Romanato, G. The digital ephemer: Henry iii of france in venice (1574). Isprs Ann. Photogramm. Remote Sens. Spat. Inf. Sci. 2021, VIII-M-1-2021, 33–40. [Google Scholar] [CrossRef]
  16. Chevrier, C.; Jacquot, K.; Humbert, P.; Bouheni, S.B.; Halin, G. Virtual 3d reconstruction of plan-relief from historical document analysis for valorisation applications. In Proceedings of the 2015 Digital Heritage, Granada, Spain, 28 September–2 October 2015; Voluume 1, pp. 87–90. [Google Scholar]
  17. Green, S.; Bevan, A.; Shapland, M. A comparative assessment of structure from motion methods for archaeological research. J. Archaeol. Sci. 2014, 46, 173–181. [Google Scholar] [CrossRef]
  18. Galantucci, L.M.; Guerra, M.G.; Lavecchia, F. Photogrammetry Applied to Small and Micro Scaled Objects: A Review. In Proceedings of the 3rd International Conference on the Industry 4.0 Model for Advanced Manufacturing, Belgrade, Serbia, 5–7 June 2018; Ni, J., Majstorovic, V.D., Djurdjanovic, D., Eds.; Springer: Cham, Switzerland, 2018; pp. 57–77. [Google Scholar] [CrossRef]
  19. Howland, M.; Kuester, F.; Levy, T. Photogrammetry in the field: Documenting, recording, and presenting archaeology. Mediterr. Archaeol. Archaeom. 2014, 14, 101–108. [Google Scholar]
  20. Zatelli, P.; Gobbi, S.; Tattoni, C.; La Porta, N.; Ciolli, M. Object-based image analysis for historic maps classification. Int. Arch. Photogramm. Remote Sens. Spat. Inf. Sci. 2019, XLII-4/W14, 247–254. [Google Scholar] [CrossRef]
  21. Gobbi, S.; Ciolli, M.; La Porta, N.; Rocchini, D.; Tattoni, C.; Zatelli, P. New Tools for the Classification and Filtering of Historical Maps. ISPRS Int. J. Geo-Inf. 2019, 8, 455. [Google Scholar] [CrossRef]
  22. Zatelli, P.; Gabellieri, N.; Besana, A. Digitalization and Classification of Cesare Battisti’s Atlas of 1915. ISPRS Int. J. Geo-Inf. 2022, 11, 238. [Google Scholar] [CrossRef]
  23. Mastronunzio, M. Editing historical maps: Comparative cartography using maps as tools. 2016. e-Perimetron 2016, 4, 183–195. Available online: https://www.e-perimetron.org/Vol_11_4/Mastronunzio_DaiPra.pdf (accessed on 28 December 2023).
  24. Justová, P.; Cajthaml, J. Cartographic Design and Processing of Originally Printed Historical Maps for Their Presentation on the Web. ISPRS Int. J. Geo-Inf. 2023, 12, 230. [Google Scholar] [CrossRef]
  25. Dai Pra, E.; Fornasari, C. Tutelare e valorizzare la cartografia storica militare della Grande Guerra: Il fondo cartografico del Museo Storico Italiano della Guerra di Rovereto (TN). Boll. dell’Associazione Ital. Cartogr. 2022, 174, 36–48. [Google Scholar] [CrossRef]
  26. Inghilleri, G. Topografia Generale; UTET: Torino, Italy, 1974. [Google Scholar]
  27. Timár, G.; Baiocchi, V.; Lelo, K. A new methodology to manage Italian geodetic datums of the cadastral systems and of the historic maps. Appl. Geomat. 2013, 5, 147–153. [Google Scholar] [CrossRef]
  28. Ferretti, F.; Sboarina, C.; Tattoni, C.; Vitti, A.; Zatelli, P.; Geri, F.; Pompei, E.; Ciolli, M. The 1936 Italian Kingdom Forest Map reviewed: A dataset for landscape and ecological research. Ann. Silvic. Res. 2018, 42, 3–19. [Google Scholar] [CrossRef]
  29. Mugnier, C. Republic of Austria. Photogramm. Eng. Remote Sens. 2004, 70, 265–268. [Google Scholar]
  30. Vandenbroucke, D.; Biliouris, D. Spatial Data Infrastructures in Italy: State of Play Spring 2011; K.U. Leuven: Leuven, Belgium, 2011. Available online: https://www.mase.gov.it/sites/default/files/archivio/allegati/INSPIRE_state_of_play_2011_ITALY.pdf (accessed on 28 December 2023).
  31. Brovelli, M.; Minghini, M. Georeferencing old maps: A polynomial-based approach for Como historical cadastres. e-Perimetron 2012, 7, 97–110. [Google Scholar]
  32. USGS. Map Accuracy Standards; Technical Report; U.S. Geological Survey (USGS): Reston, VA, USA, 1999. [Google Scholar]
  33. Mangione, G. Lettura delle misure dalla carta al numerico. Boll. dell’Associazione Ital. Cartogr. 2010, 138, 189–194. [Google Scholar]
  34. Boutoura, C.; Livieratos, E. Some fundamentals for the study of the geometry of early maps by comparative methods. e-Perimetron 2006, 1, 60–70. [Google Scholar]
  35. Niederoest, J. Landscape as a Historical Object: 3D Reconstruction and Evaluation of a Relief Model from 18th Century. ISPRS Ann. Photogramm. Remote Sens. Spat. Inf. Sci. 2002, XXXIV-5/W3-2002, 1–7. [Google Scholar] [CrossRef]
Figure 1. Plan-relief models used in this research: Italian relief of mount Pasubio (a), Italian relief of Sibemol Val Bella (Col del Rosso) (b), Italian relief of Monte Corno (c) and Austrian relief of mount Pasubio (d).
Ijgi 13 00101 g001
Figure 2. Examples of the historical maps used in the tests: Italian map 36-93-01 F, with scale 1:10,000 from August 1918 (a) and Austrian map 37-07-02, with scale 1:25,000 from January 1918 (b). See Table 1 for details.
Ijgi 13 00101 g002
Figure 3. Areas covered by the plain-reliefs with respect to the border between Trentino on the eastern side and Veneto on the western side. On the map: 1 Italian Pasubio, 14 Sibemol, 49 Austrian Pasubio.
Ijgi 13 00101 g003
Figure 4. 3D model of Monte Corno: digital surface model (a) and digital surface model with original colors (b).
Ijgi 13 00101 g004
Figure 5. Residuals on GCPs for Italian map 36-93-01 F (Figure 2a), red vectors (arrows) indicate residual values and displacements directions, lengths are in pixels; pixel size is 1.8 m on the ground.
Ijgi 13 00101 g005
Figure 6. Model of the Austrian plan-relief of mount Pasubio: original colors (a), overlay with the January 1918 Italian 1:25,000 map (Map ID 37-07-02) (b), overlay with the October 1918 Austrian 1:75,000 map (Map ID 60-03-01 F) (c) and height differences between the model and the current DTM (d).
Ijgi 13 00101 g006
Figure 7. Model of the Italian plan-relief of mount Pasubio: original colors (a), overlay with the June 1918 Italian 1:10,000 map (Map ID 8_9) (b), overlay with the August 1917 Austrian 1:10,000 map (Map ID 5_64) (c) and height differences between the model and the current DTM (d).
Ijgi 13 00101 g007
Table 1. Historical maps and their main features.
Map IDScaleCountryYearNotes
05-57-02 F1:75,000AT1918damaged, especially in the central part
60-03-01 F1:75,000AT1918 Octobergood condition, divided in half by a black line
36-93-01 F1:10,000IT1918 Augustgood condition, divided in half by a staggered black line
36-93-01 R1:25,000IT1918 Septembergood condition
5-58 B1:75,000AT1918 Maygood detail
5_641:10,000AT1917 Augustgood detail
8_91:10,000IT1918 Junegood detail
37-07-021:25,000IT1918 Januarygood detail, many overlapping features
10_521:75,000AT1923very large area but GCPs/CPs are easy to find
Table 2. Precision of the plain-relief georeferencing procedure. Errors are reported as RMSE for each plain-relief, both for coordinates after the georeferencing and at the original scale of the relief.
Plain-ReliefsScaleOn-Ground [m]On-Relief Model Errors [mm]
Italian Pasubio1:200013.26.6
Sibemol1:500044.89.0
Monte Corno1:200013.26.6
Austrian Pasubio1:12,00044.33.7
Table 3. Evaluation of the precision of the historical maps georeferencing procedure using GCPs’ RMSE. “Expected prec.”(Expected precision) indicates the expected precision of coordinates on the map given by the scale, assuming a graphical error of 0.2 mm. Values on ground [m] and on map [mm] in brackets.
Root Mean Square Error (RMSE)
on Ground [m] and (on Map [mm])
Map ID Scale Expected Prec. [m] N. of GCPs Helmert Polynomial Order 1 Polynomial Order 2
05-57-02 F1:75,000151058.1 (0.78)33.1 (0.44)28.5 (0.38)
60-03-01 F1:75,000151095.3 (1.27)50.0 (0.67)29.8 (0.40)
36-93-01 F1:10,00021530.8 (3.09)20.4 (2.04)17.7 (1.78)
36-93-01 R1:25,00051244.8 (1.79)24.9 (1.00)17.2 (0.69)
5-58 B1:75,000151020.0 (0.27)13.4 (0.18)12.0 (0.16)
5_641:10,00021134.0 (3.40)20.9 (2.09)17.7 (1.77)
8_91:10,00021126.6 (2.66)17.0 (1.70)14.7 (1.47)
37-07-021:25,00051392.0 (3.68)53.0 (2.12)49.6 (1.98)
10_521:75,000151246.6 (0.62)28.8 (0.38)25.4 (0.34)
Average49.8 (1.95)29.1 (1.18)23.6 (1.00)
Std. Dev.25.8 (1.22)13.2 (0.76)10.9 (0.70)
Table 4. Evaluation of the accuracy of the historical map georeferencing procedure using CPs’ RMSE. Values on ground [m] and on map [mm] in brackets.
Root Mean Square Error (RMSE)
on Ground [m] and (on Map [mm])
Map ID Scale N. of CPs Helmert Polynomial Order 1 Polynomial Order 2
05-57-02 F1:75,000362.0 (0.83)60.5 (0.81)29.8 (0.40)
60-03-01 F1:75,000327.0 (0.36)57.8 (0.77)66.5 (0.89)
36-93-01 F1:10,000334.8 (3.48)34.3 (3.43)35.0 (3.50)
36-93-01 R1:25,000322.8 (0.91)25.4 (1.02)24.4 (0.98)
5-58 B1:75,000310.8 (0.14)8.5 (0.11)7.8 (0.10)
5_641:10,000335.9 (3.59)38.1 (3.81)43.1 (4.31)
8_91:10,000329.6 (2.96)31.0 (3.10)27.8 (2.78)
37-07-021:25,000378.7 (3.15)46.7 (1.87)41.7 (1.67)
10_521:75,000331.1 (0.41)33.9 (0.45)20.3 (0.27)
Average37.0 (1.76)37.4 (1.71)32.9 (1.65)
Std. Dev.19.6 (1.40)15.2 (1.32)15.7 (1.44)
Table 5. Fisher test applied to residuals on GCPs for first- and second-order polynomials. The first-order polynomial is chosen if Fisher test is passed at a 0.05 significance level.
Map IDN. of GCPsp-ValueOrder of the Polynomial
05-57-02 F100.225first
60-03-01 F100.001second
36-93-01 F150.491first
36-93-01 R120.102first
5-58 B100.429first
5_64110.365first
8_9110.359first
37-07-02130.061first
10_52120.493first
Table 6. Statistics for surface differences between plain-relief models and current DTM for Austrian and Italian models of mount Pasubio, Sibemol Val Bella (Col del Rosso) and Monte Corno. Values on ground [m] and on map [mm].
ModelMinMaxMeanStd. Dev.Median
On Ground [m] On Model [mm] On Ground [m] On Model [mm] On Ground [m] On Model [mm] On Ground [m] On Model [mm] On Ground [m] On Model [mm]
Austrian Pas.−997.9−83.2503.642.0−25.9−2.2112.89.4−17.8−1.5
Italian Pas.−730.4−365.2182.891.4−3.6−1.834.717.4−6.3−3.2
Sibemol−1153.8−230.8321.864.4−104.5−20.9152.430.5−87−17.4
Monte Corno−249.7−124.9142.771.412.56.322.911.510.95.5
Table 7. Quantile distribution of differences between plain-relief models and current DTM of mount Pasubio for Austrian and Italian models (Figure 6 and Figure 7). Values on ground [m] and on map [mm] in brackets.
QuantileAustrian Pasubio [m]Italian Pasubio [m]Sibemol Val Bella [m]Monte Corno [m]
10−179.5 (−15.0)−40.0 (−20.0)−295.2 (−59.0)−12.6 (−6.3)
20−124.3 (−10.4)−27.7 (−13.9)−206.9 (−41.4)−5.2 (−2.6)
30−84.8 (−7.1)−20.1 (−10.0)−149.8 (−30.0)−0.2 (−0.1)
40−50.8 (−4.2)−13.1 (−6.5)−112.4 (−22.5)5.2 (2.6)
50−21.0 (−1.8)−6.3 (−3.2)−87.0 (−17.4)10.9 (5.5)
604.2 (0.3)0.4 (0.2)−60.6 (−12.1)17.1 (8.6)
7030.3 (2.5)8.4 (4.2)−30.9 (−6.2)22.8 (11.4)
8062.6 (5.2)18.4 (9.2)9.9 (2.0)29.4 (14.7)
90117.4 (9.8)36.8 (18.4)66.9 (13.4)39.3 (19.7)
Table 8. Transformation choice for the georeferencing of the historical maps.
Map IDTransformation
05-57-02 Ffirst-order polynomial
60-03-01 Fsecond-order polynomial
36-93-01 Ffirst-order polynomial
36-93-01 Rfirst-order polynomial
5-58 BHelmert
5_64first-order polynomial
8_9first-order polynomial
37-07-02first-order polynomial
10_52first-order polynomial
Disclaimer/Publisher’s Note: The statements, opinions and data contained in all publications are solely those of the individual author(s) and contributor(s) and not of MDPI and/or the editor(s). MDPI and/or the editor(s) disclaim responsibility for any injury to people or property resulting from any ideas, methods, instructions or products referred to in the content.

