

Recognition and Classification of Typical Building Shapes Based on YOLO Object Detection Models

Abstract
1. Introduction
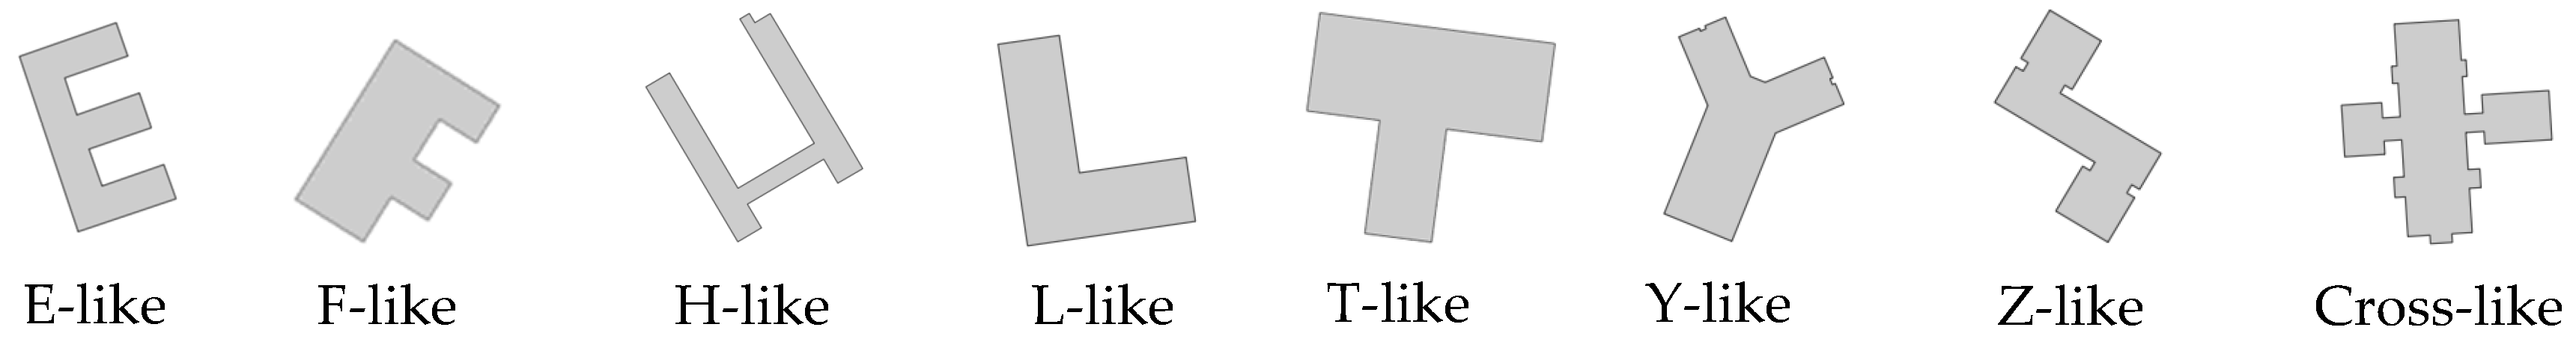
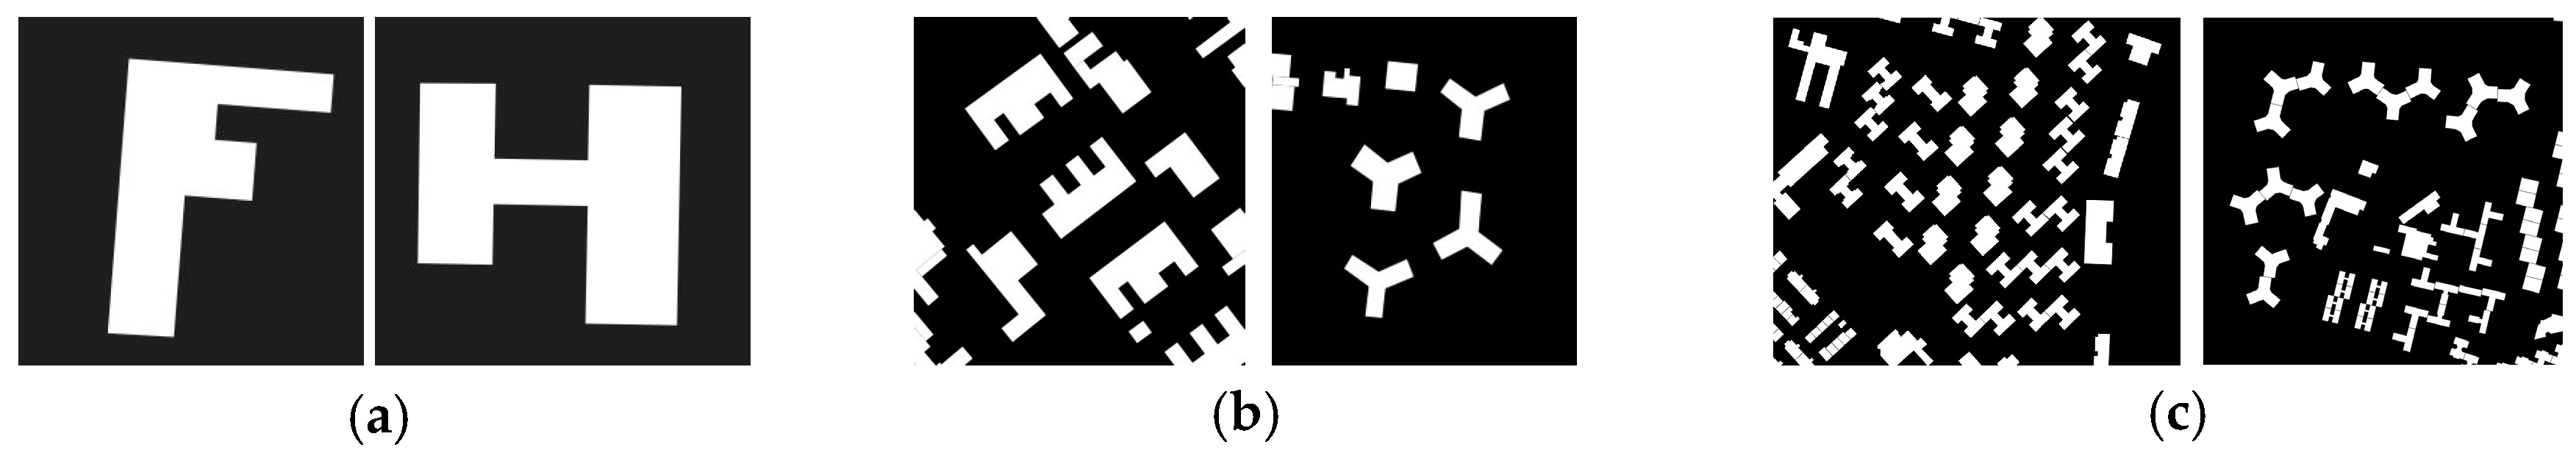
2. Typical Building Shape
3. YOLOv9 Integrating Attention Mechanism
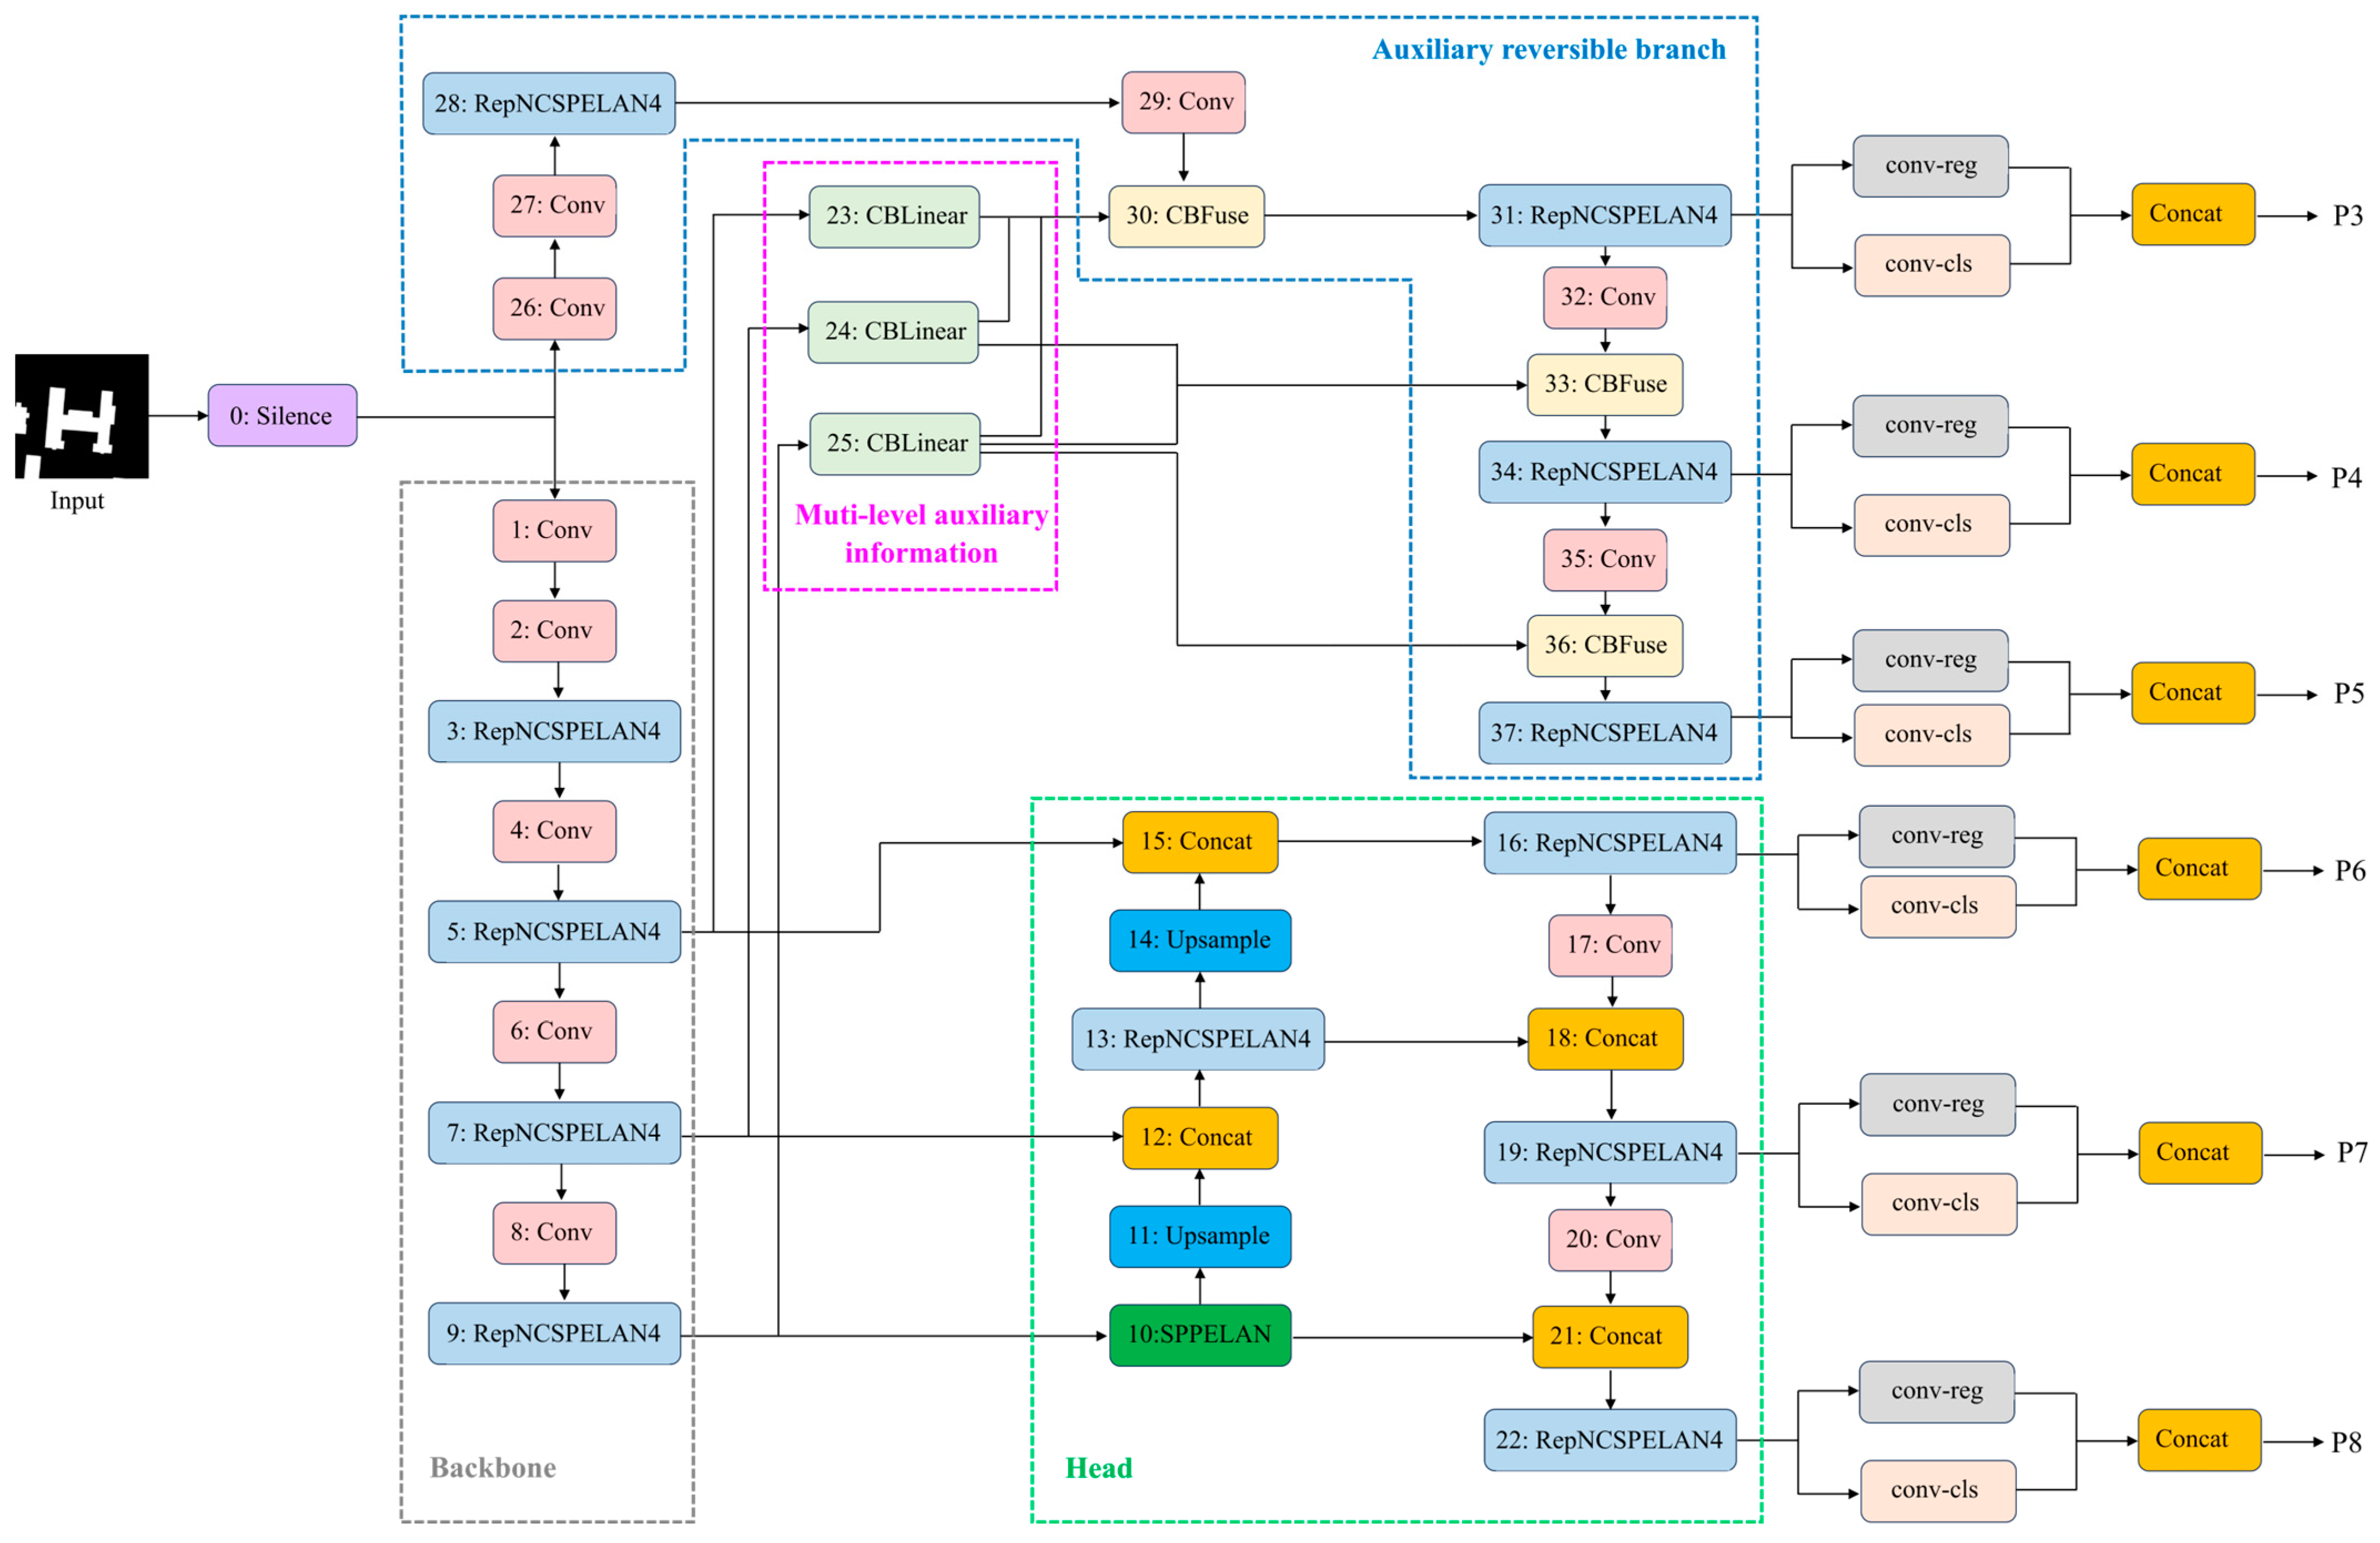
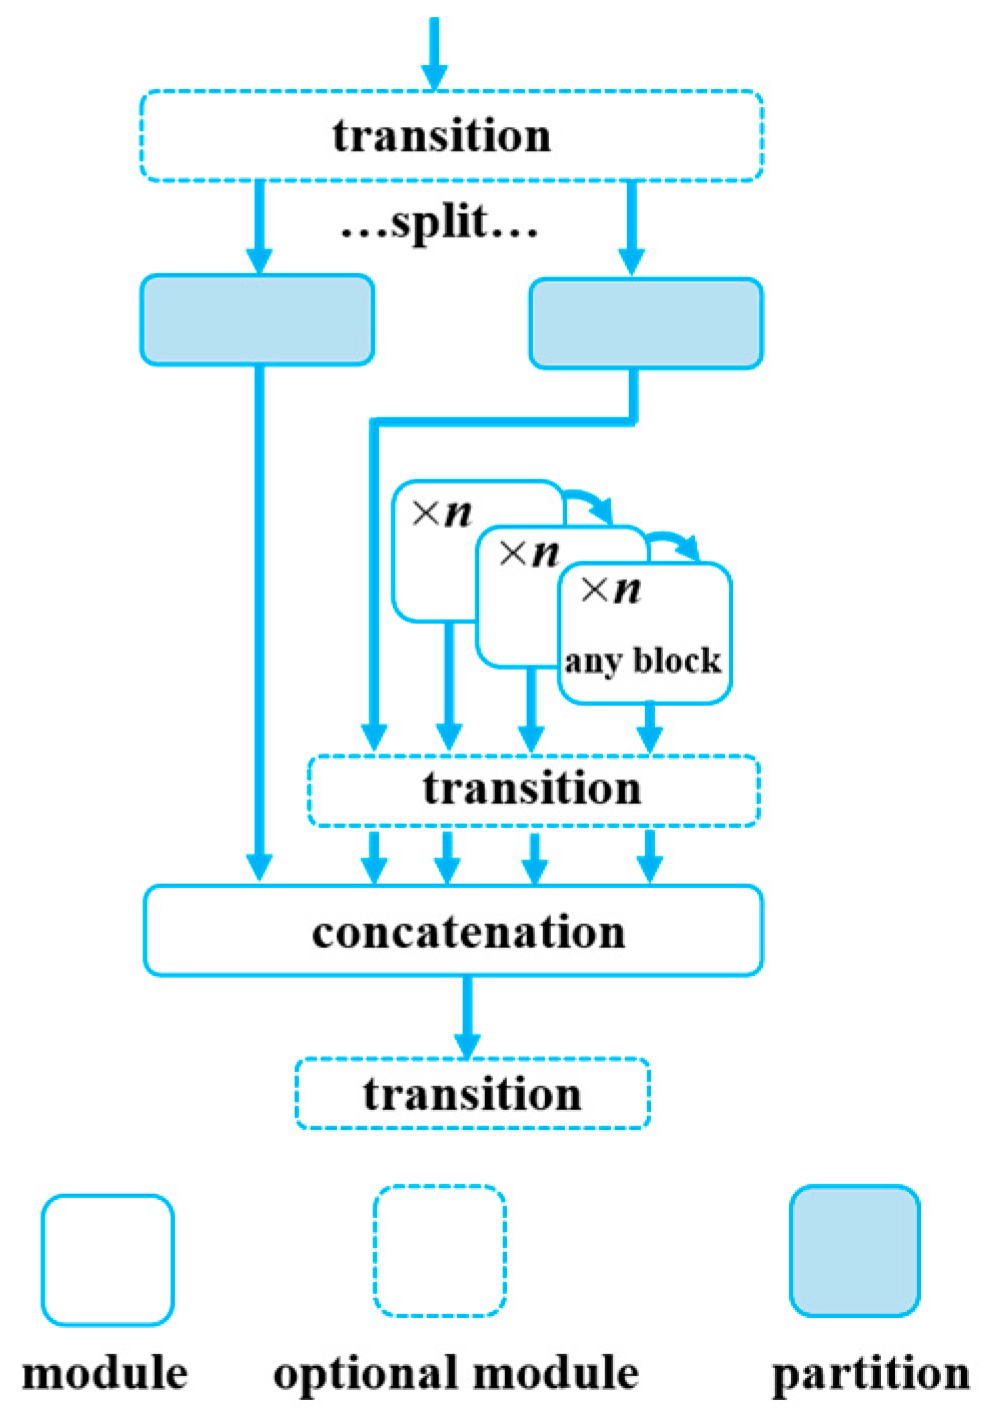
3.1. YOLOv9 Network Structure
3.2. Attention Mechanism
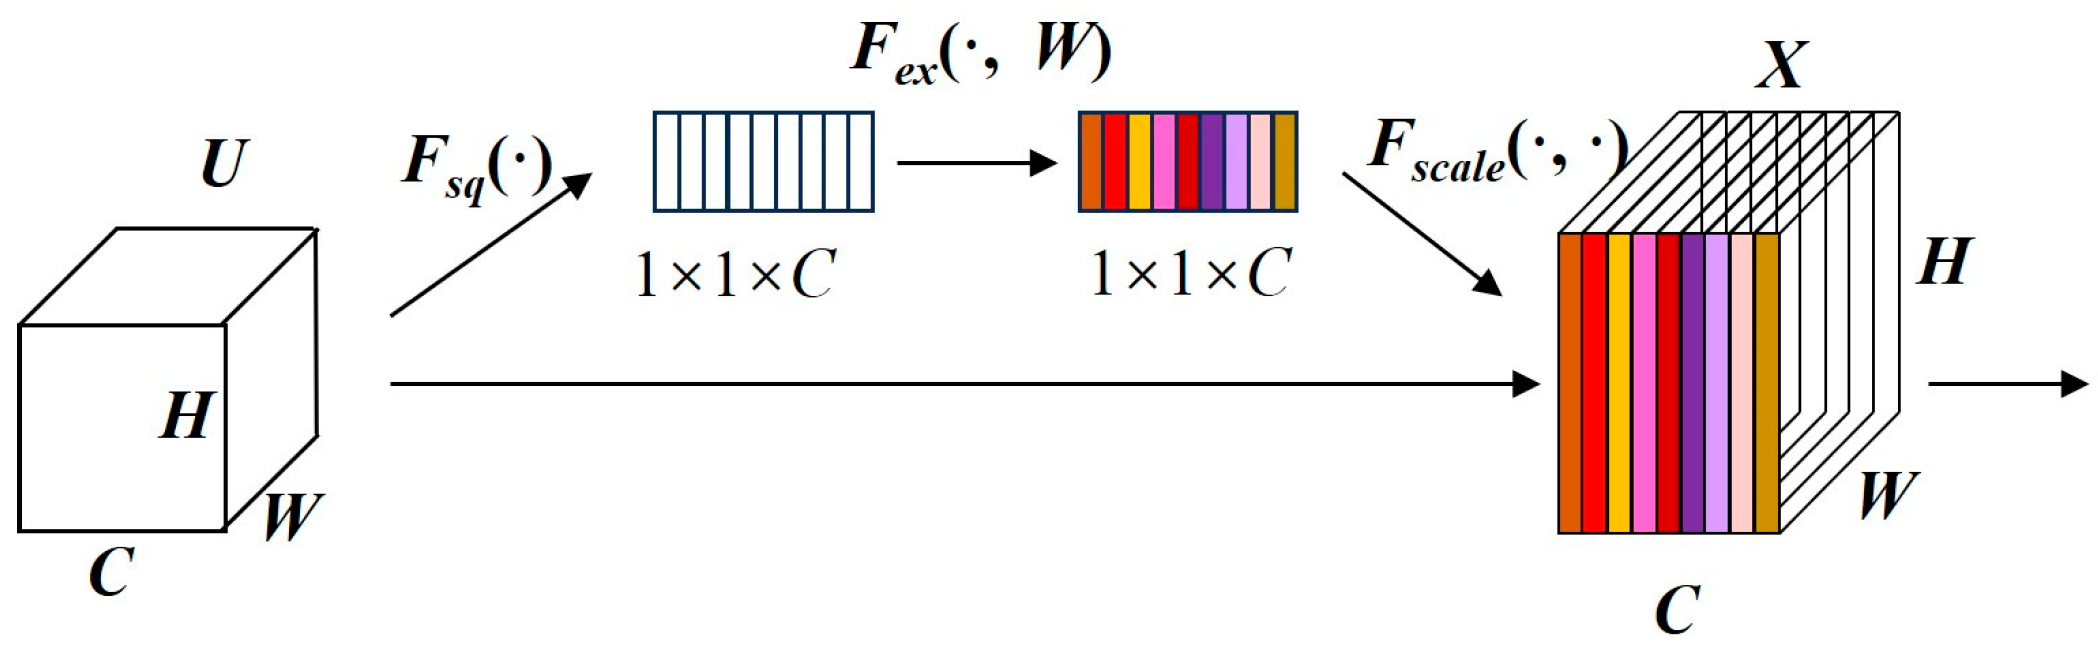
3.2.1. SE
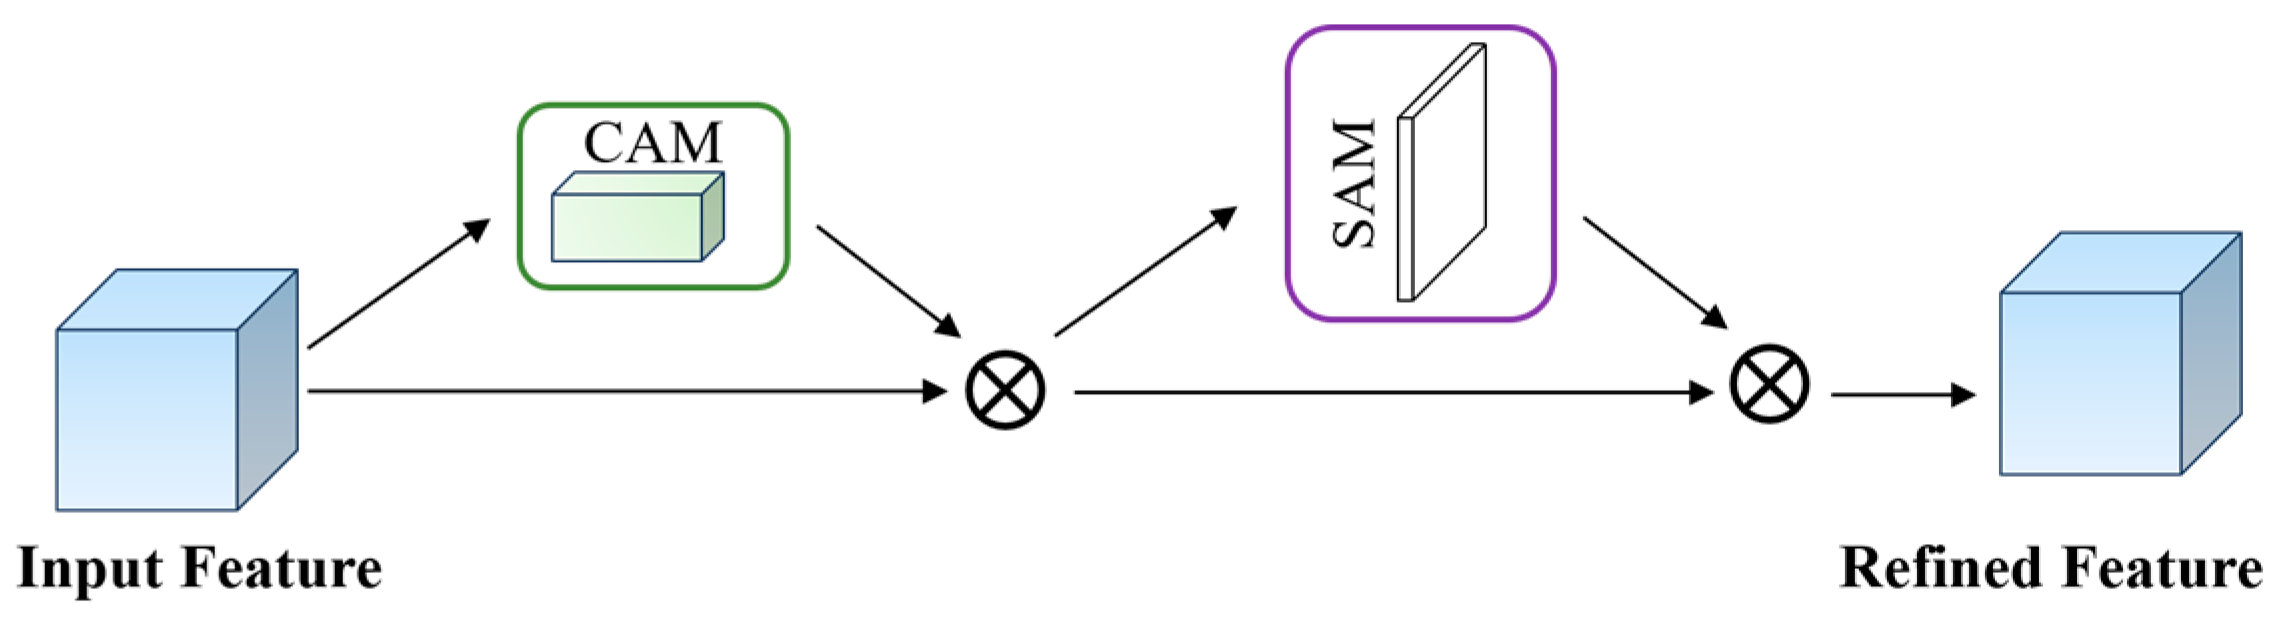
3.2.2. CBAM
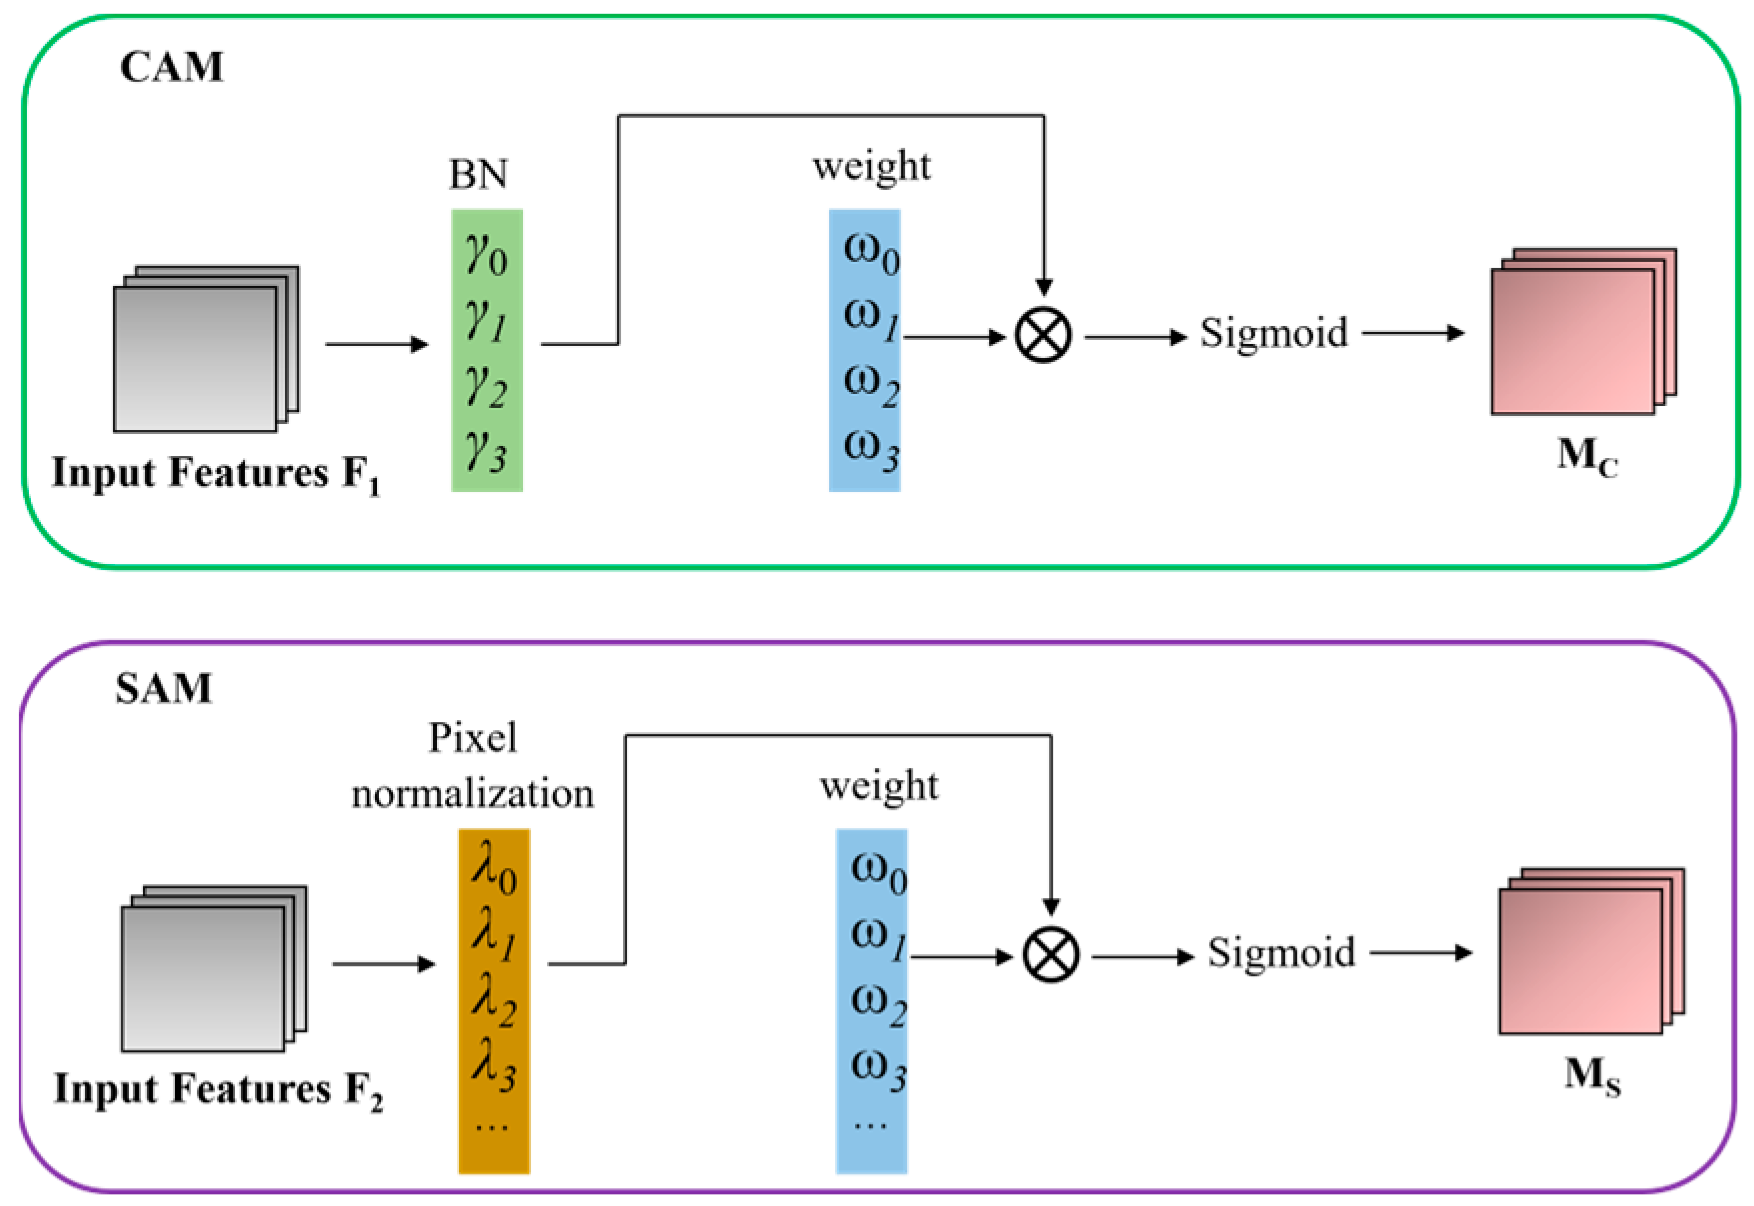
3.2.3. NAM
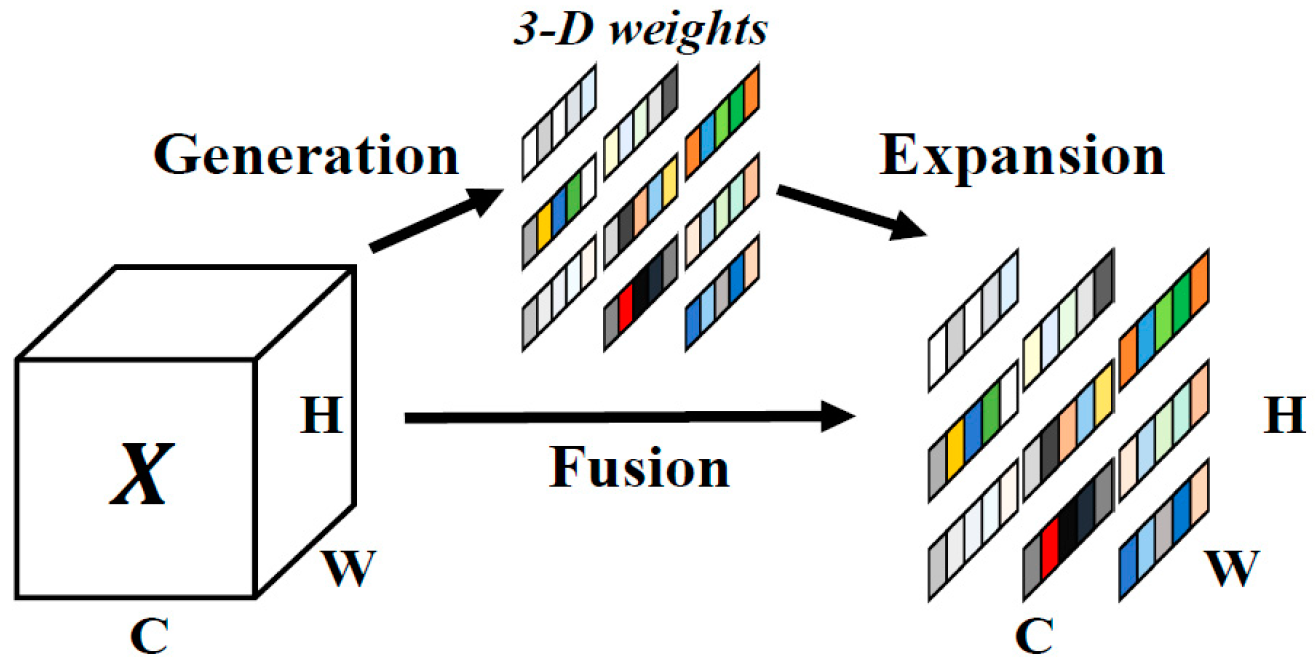
3.2.4. SimAM
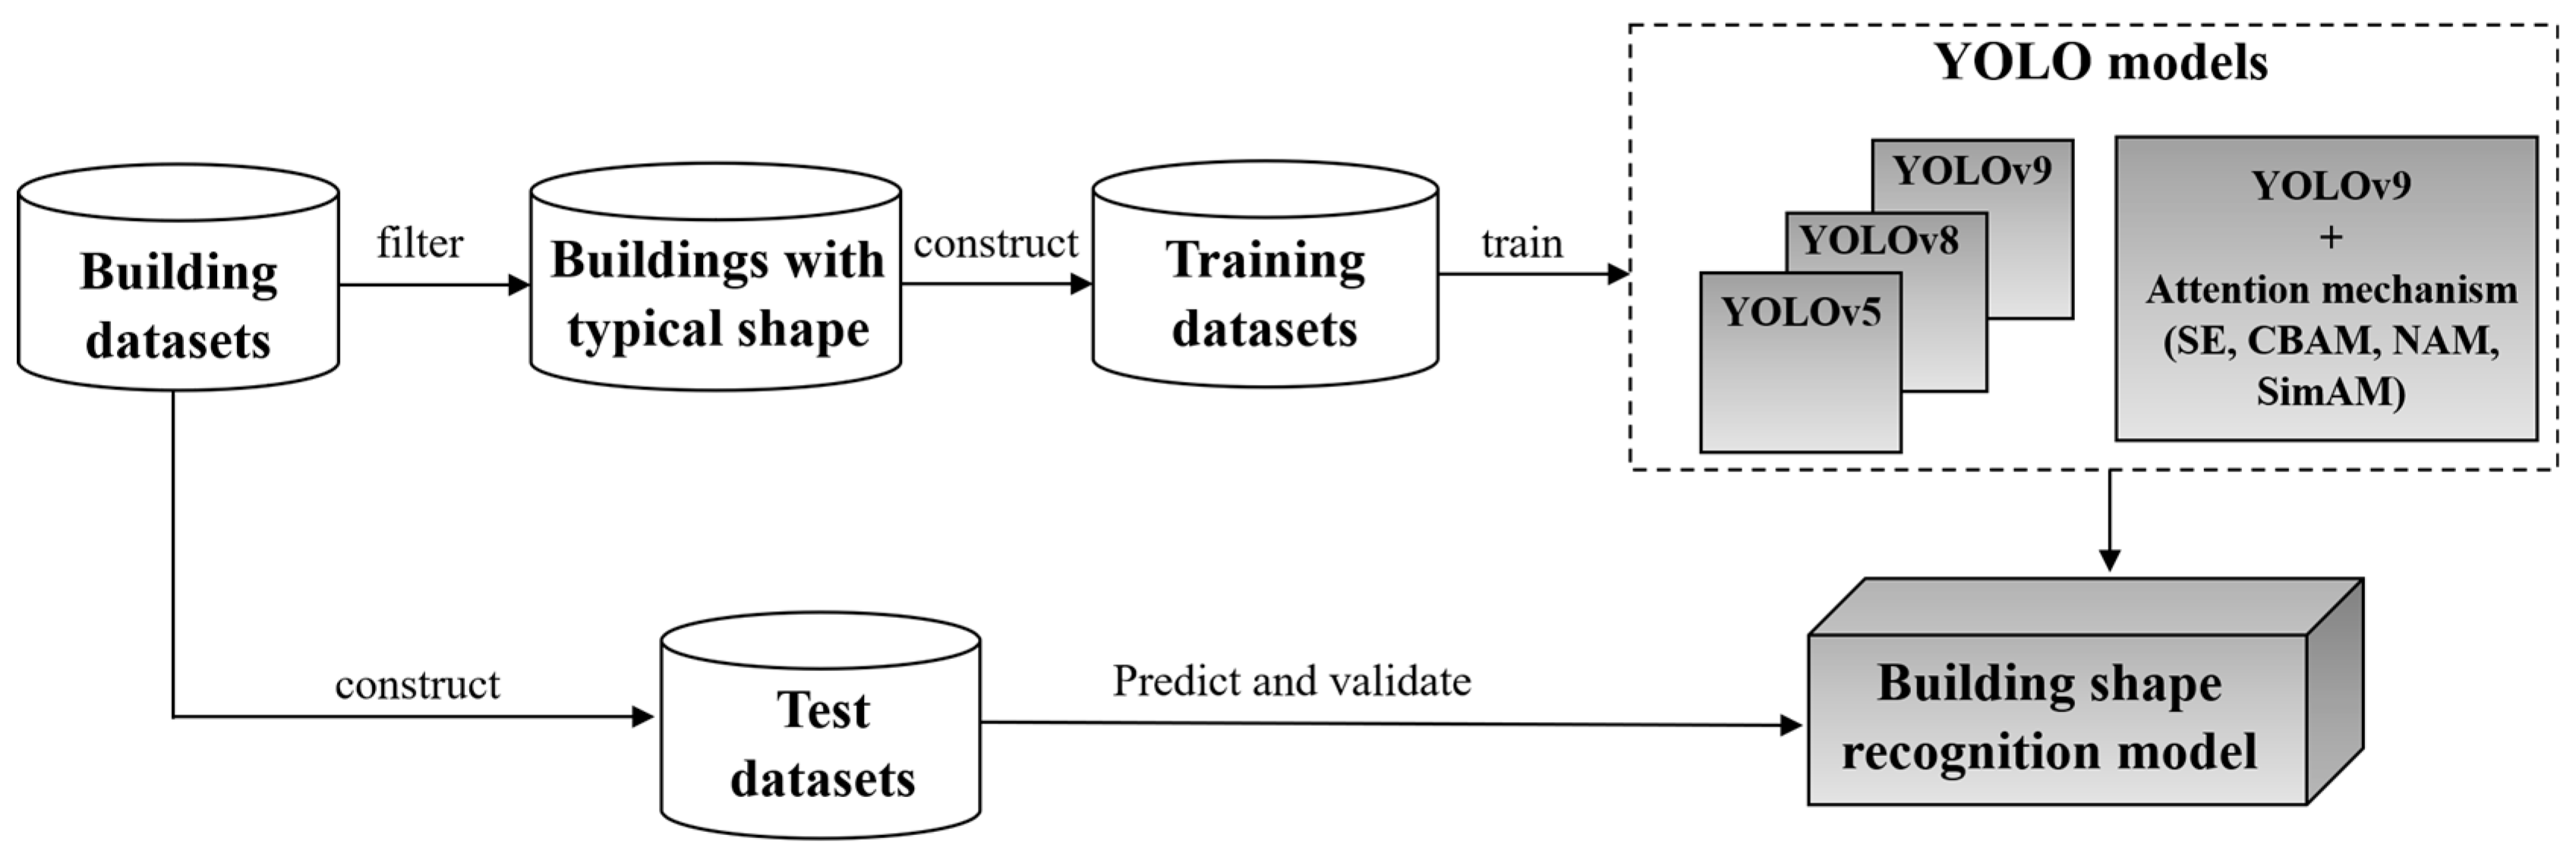
4. Building Shape Recognition Based on YOLO Models
4.1. Training Datasets Creation
- Principle 1: The selected buildings should have the standard shape of a certain type. This ensures that the samples can provide the model with a clear basic style for different shape types;
- Principle 2: The selected buildings generally have a standard shape but with complex convex and concave parts in the building contours. This principle aims to improve the model’s ability to distinguish different shape types in complex conditions;
- Principle 3: The selected buildings are approximate to a certain standard shape but with some partial or global shape deformations such as stretching or distortion. This is intended to further enhance the capabilities of the model to recognize building shapes under various conditions;
- Principle 4: The selected buildings have both the complex contours of Principle 2 and the shape deformations of Principle 3, which aim at further increasing the complexity of the training data.
4.2. Training of YOLO Models
4.3. Prediction and Evaluation
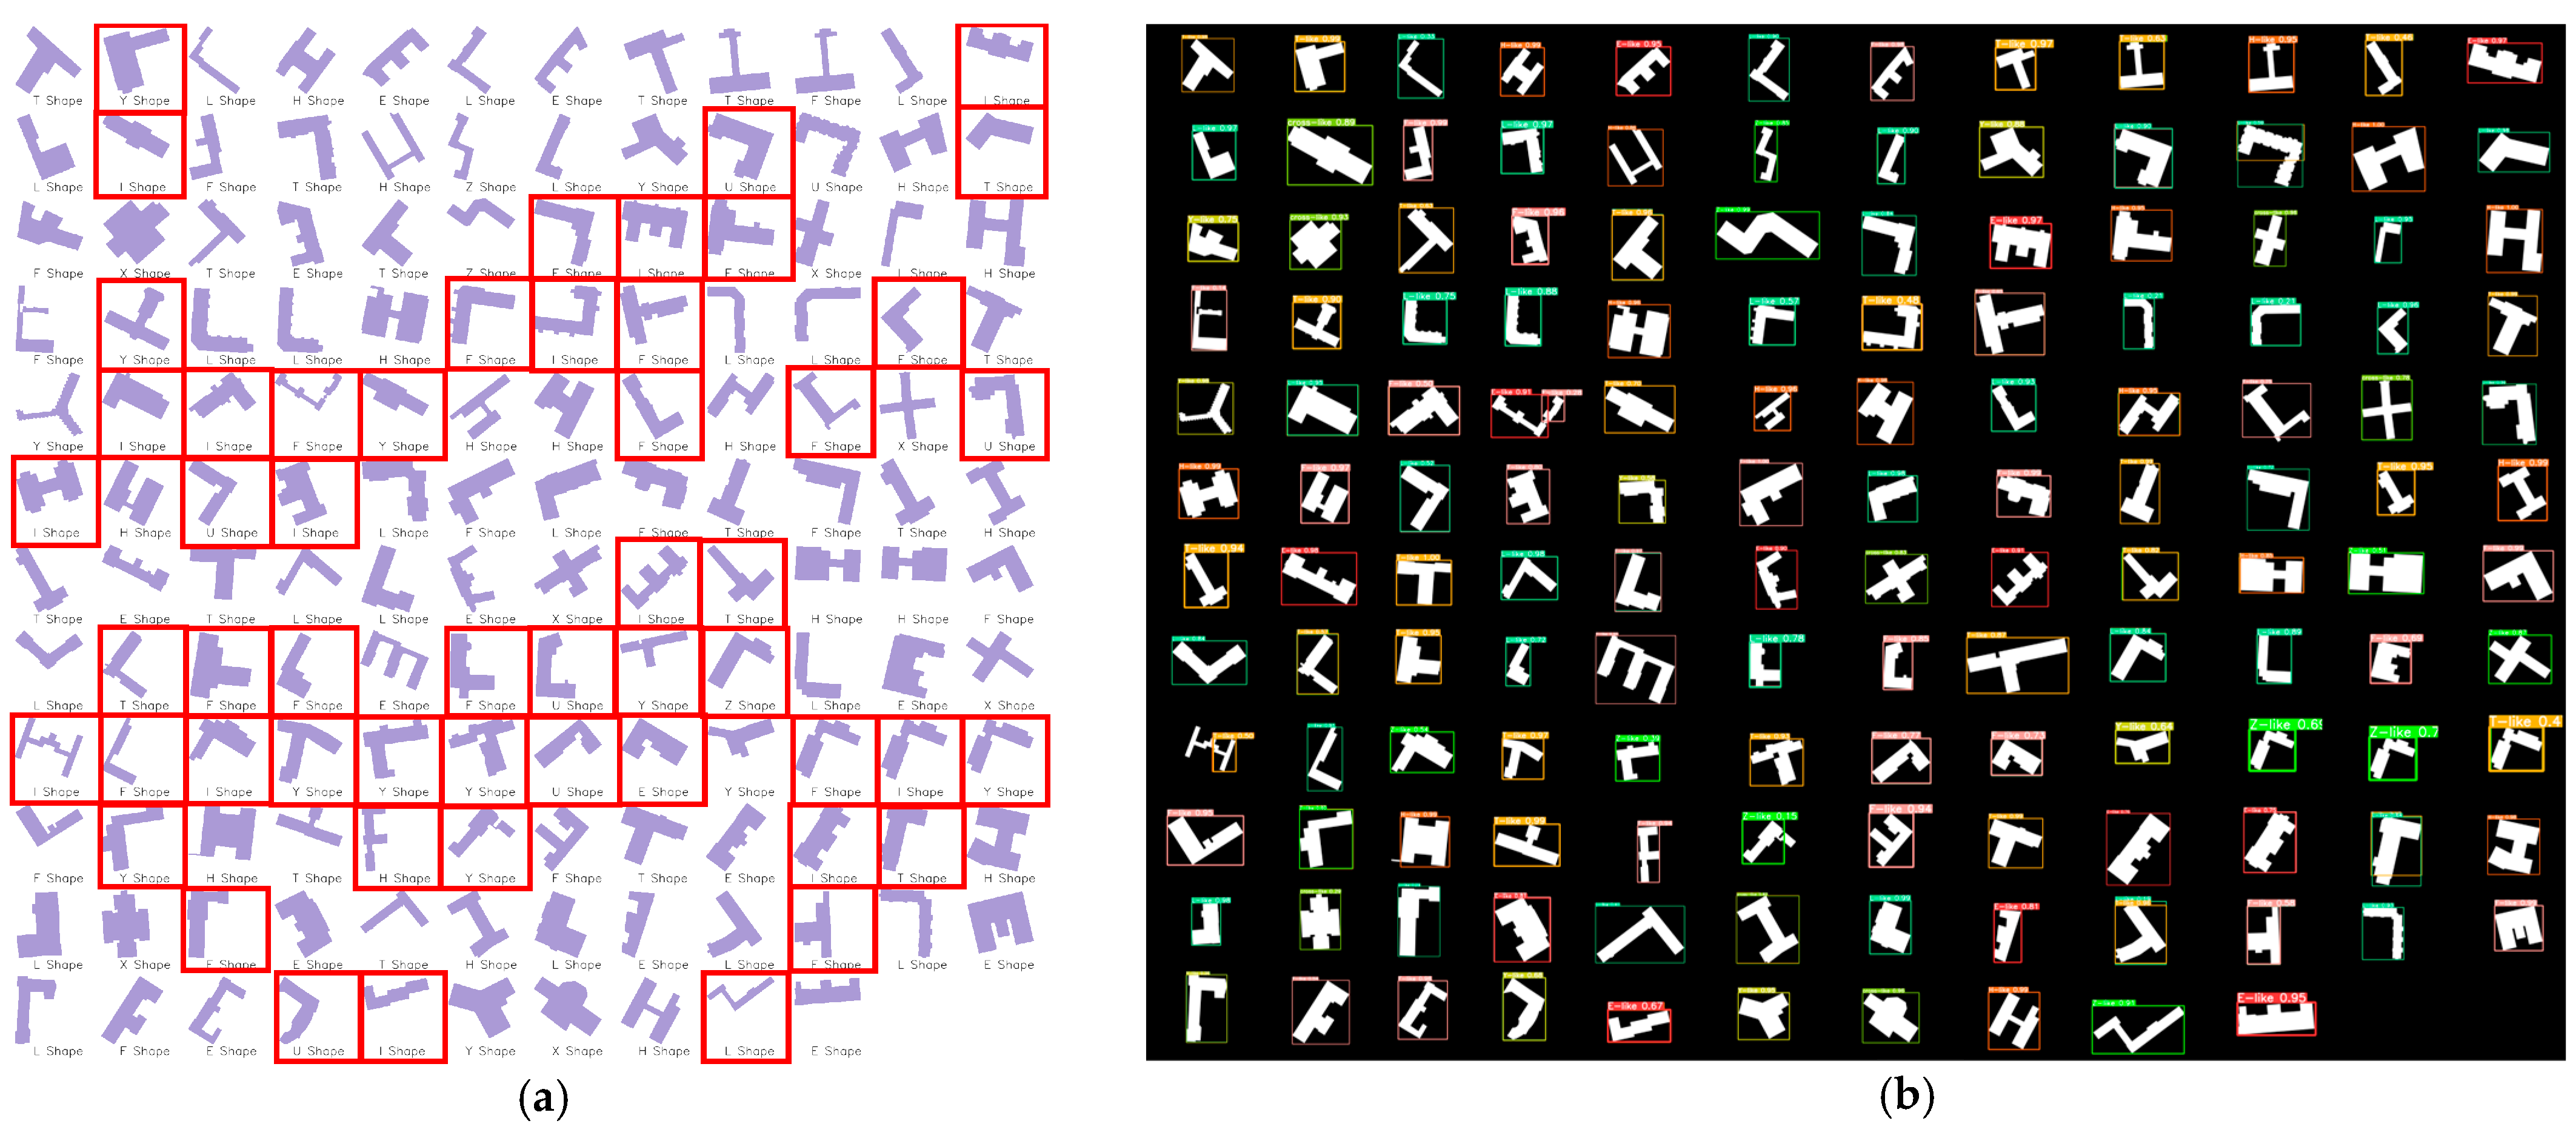
4.3.1. Test Dataset Description and Model Prediction
4.3.2. Detecting Results Evaluation
4.3.3. Results Analysis
- (1)
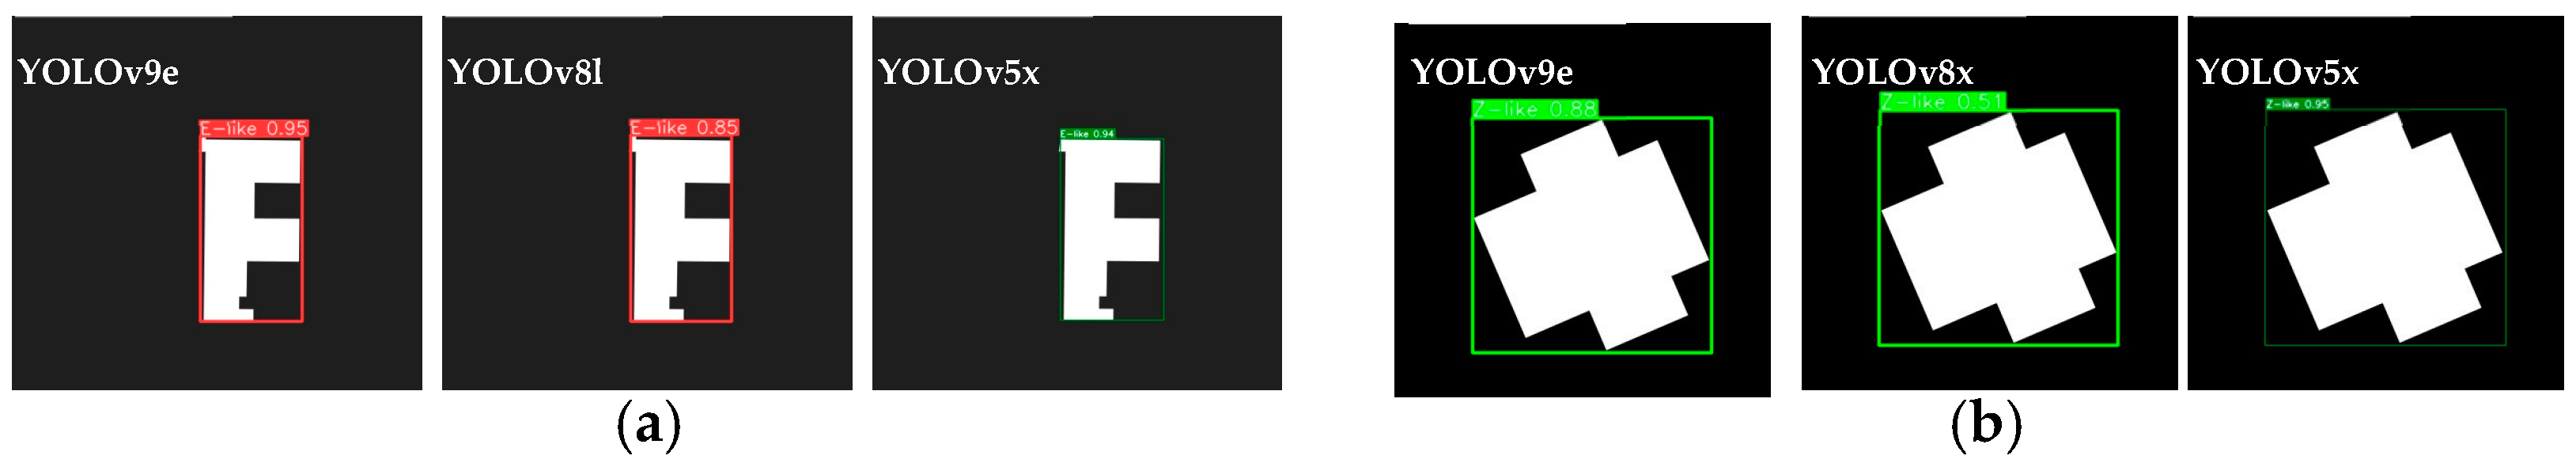
- Analysis of basic YOLO models
- (2)
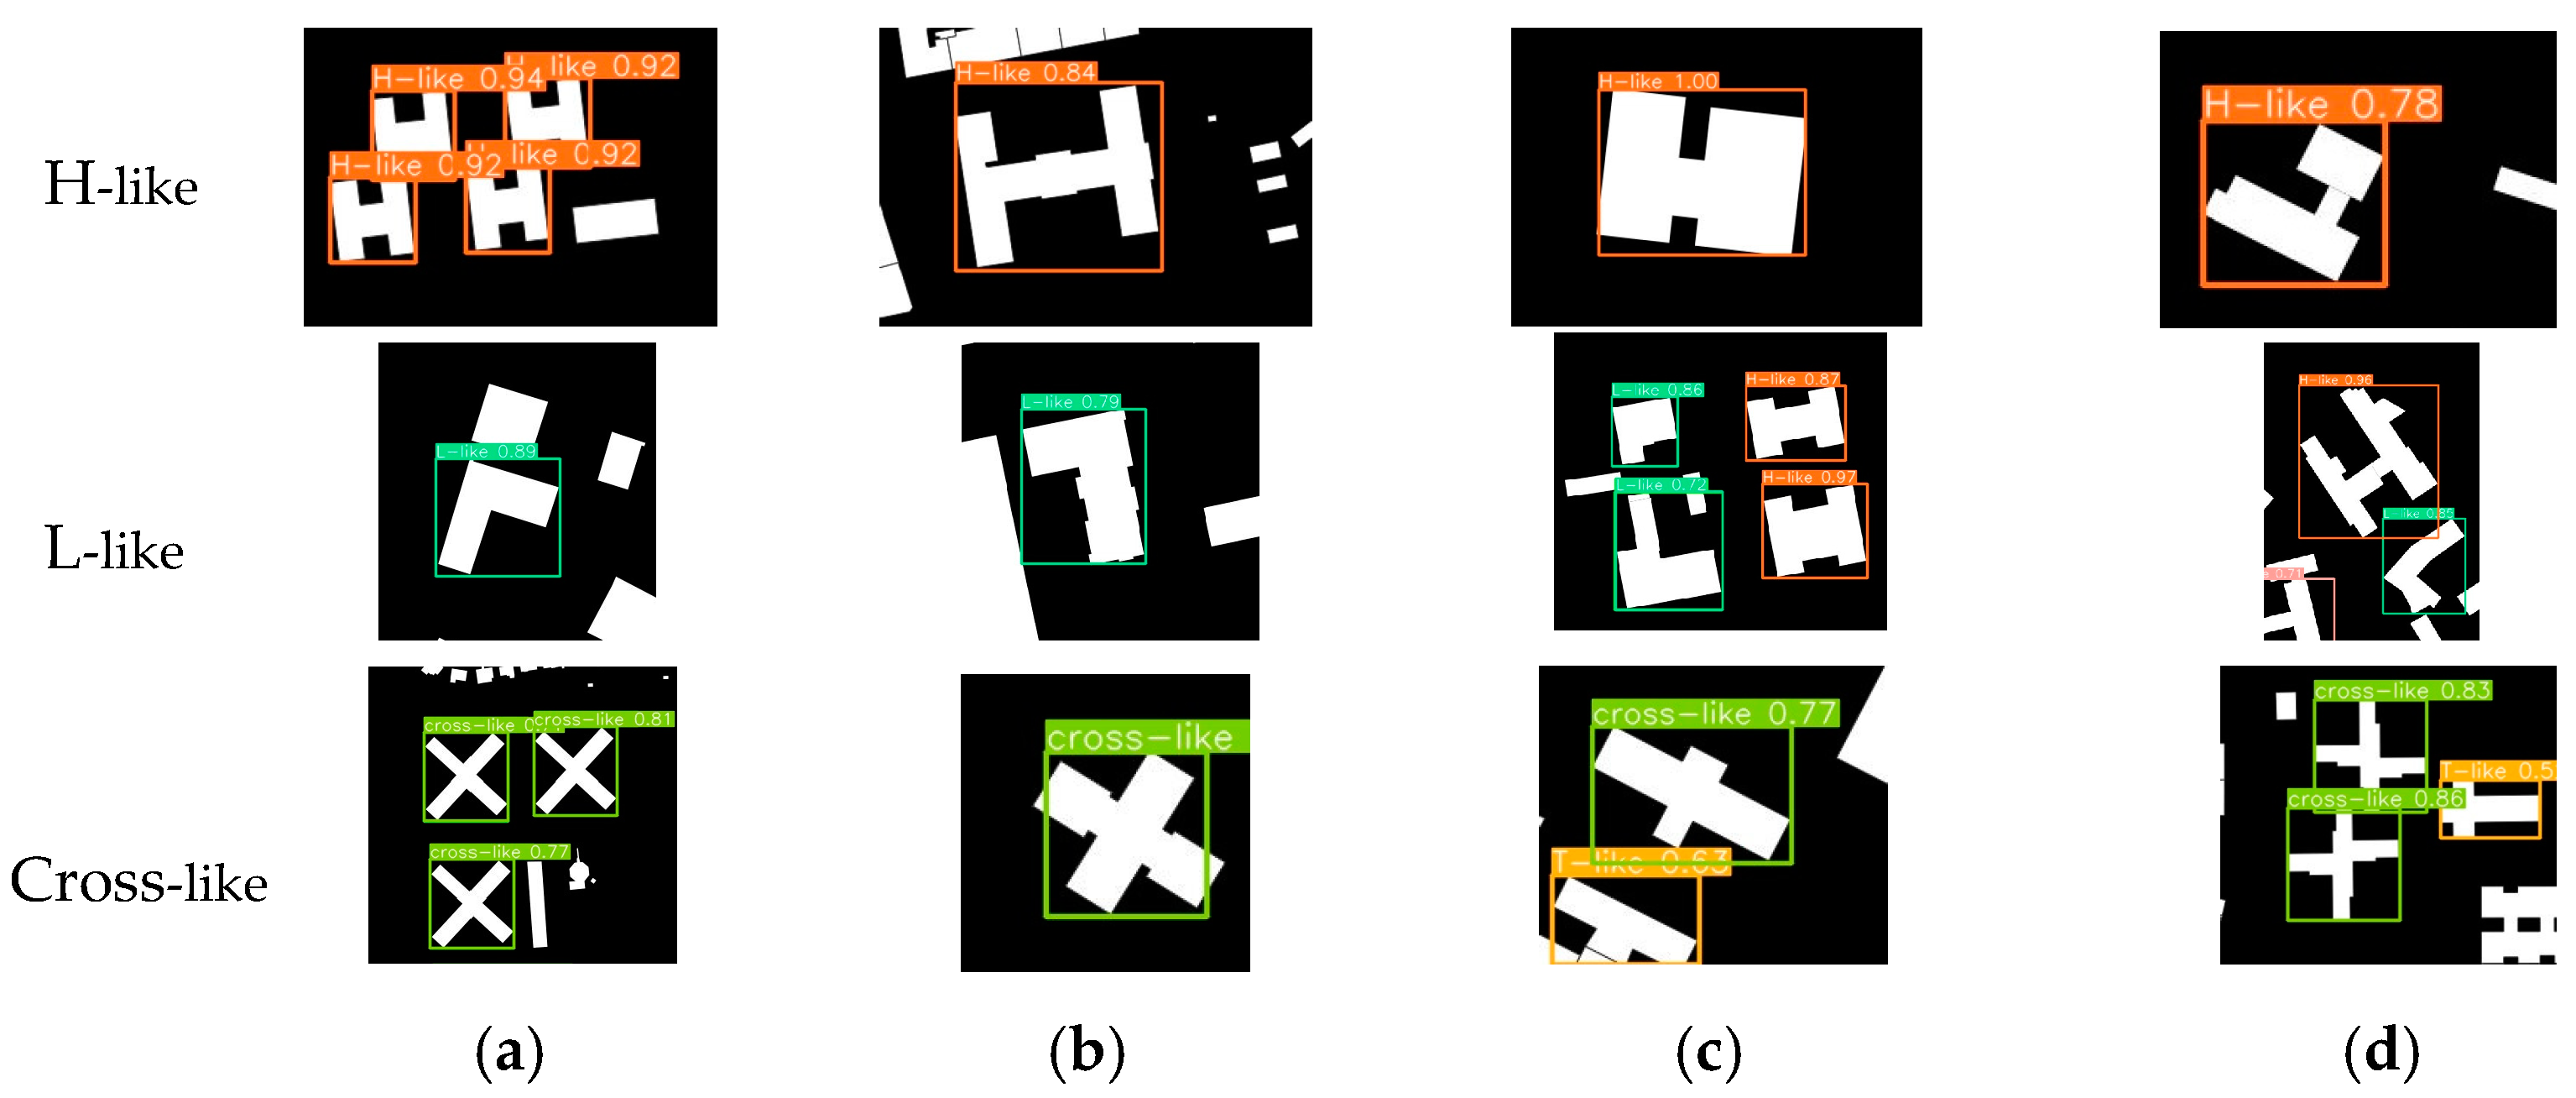
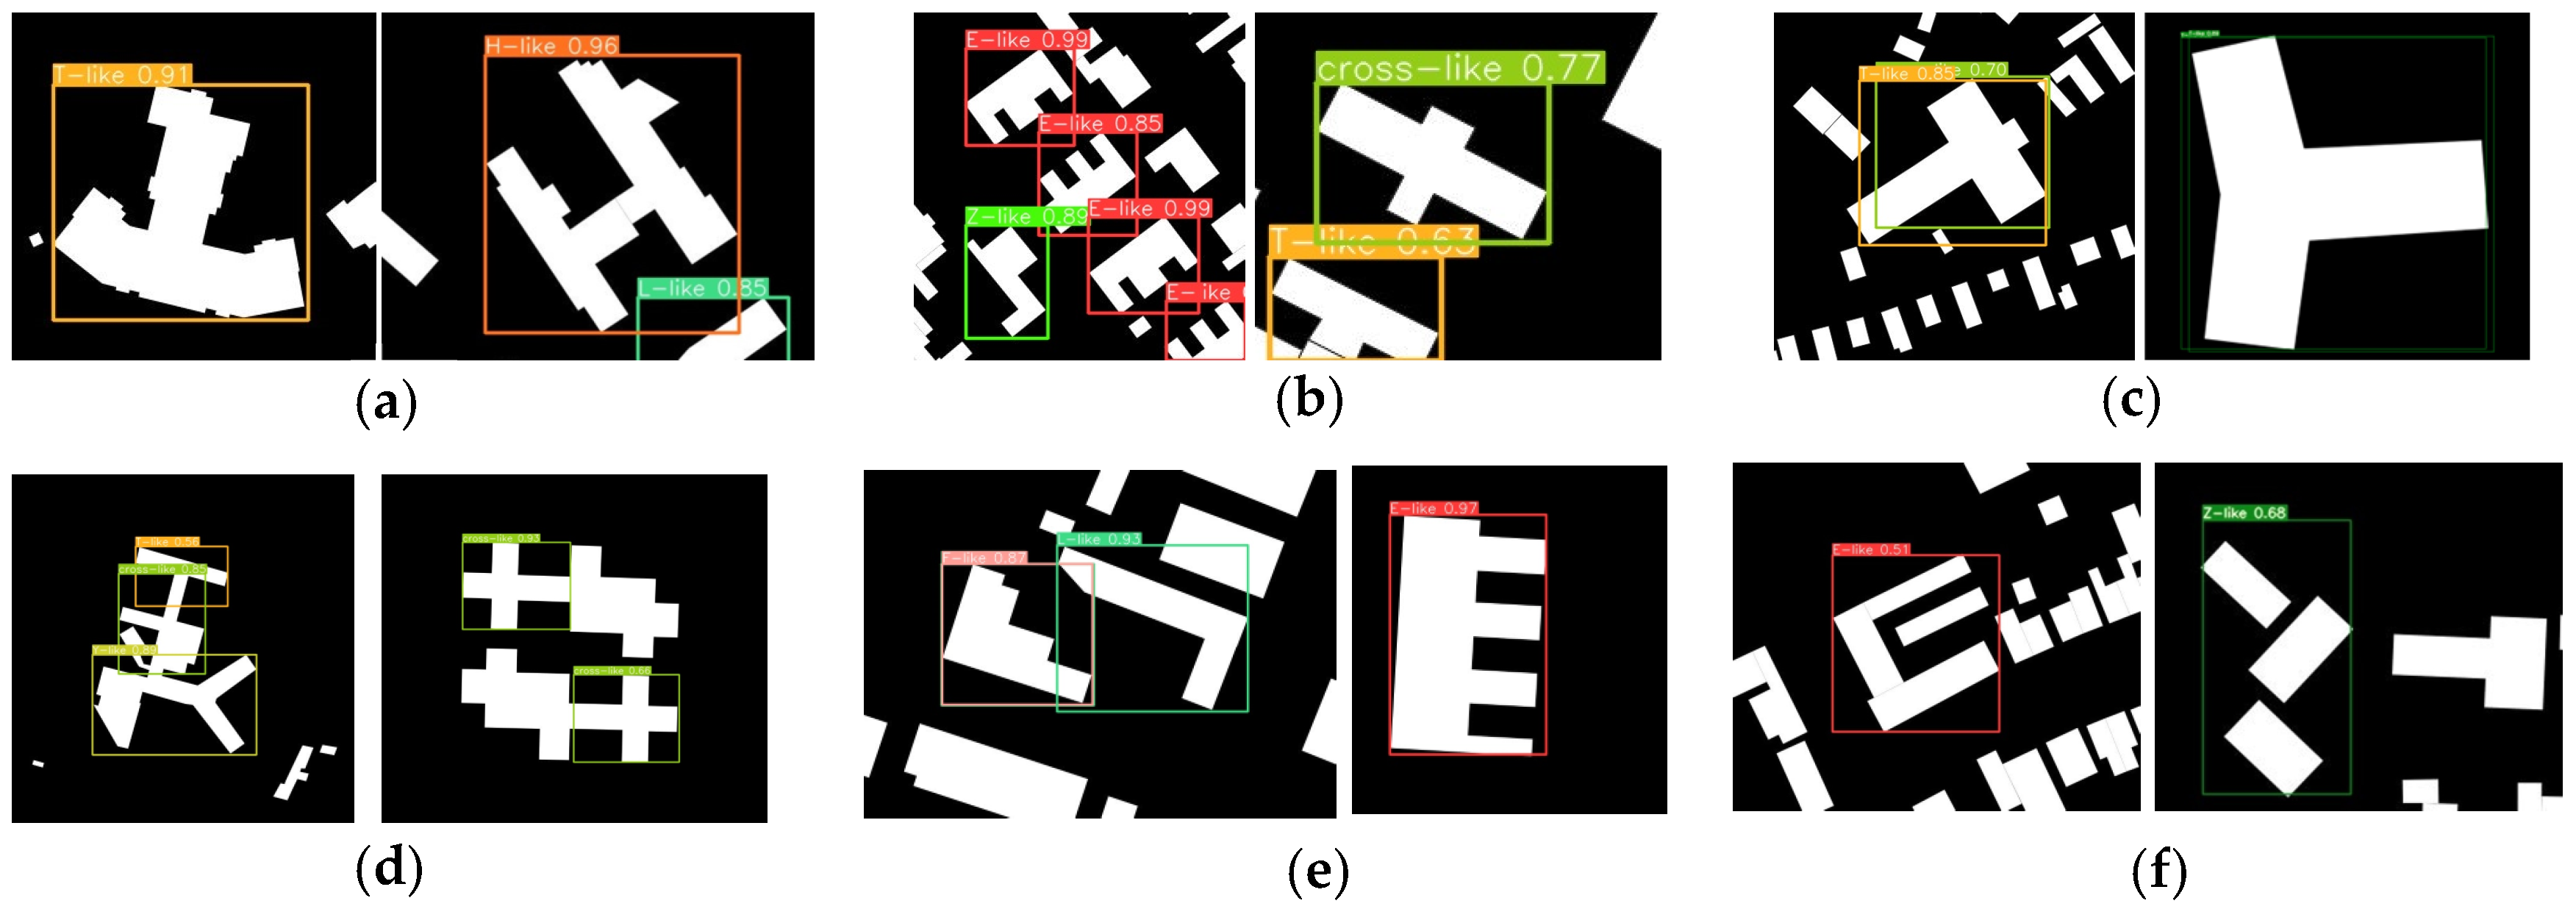
- Analysis of YOLOv9 with attention modules
4.3.4. Test on Different Zoom Levels
5. Discussion
5.1. Analysis of Different Building Shape Types
5.2. Analysis of Different YOLO Models
5.3. Analysis of Simulating Human Visual Cognition
5.4. Comparison with Other Methods
5.5. Further Improvements
6. Conclusions
Author Contributions
Funding
Data Availability Statement
Conflicts of Interest
References
- Zhu, G. Cartography; Wuhan University Press: Wuhan, China, 2004. [Google Scholar]
- Robinson, A.H.; Morrison, J.L.; Muehrcke, P.C.; Kimerling, A.J.; Guptill, S.C. Elements of Cartography, 6th ed.; Wiley: New York, NY, USA, 1995. [Google Scholar]
- Shea, K.S.; McMaster, R.B. Cartographic generalization in a digital environment: When and how to generalize. Scanning Electron Microsc. Meet 1989, 56–67. [Google Scholar]
- Roth, R.E.; Brewer, C.A.; Stryker, M.S. A typology of operators for maintaining legible map designs at multiple scales. Cartogr. Perspect. 2011, 68, 29–64. [Google Scholar] [CrossRef]
- Foerster, T.; Stoter, J.E.; Köbben, B. Towards a formal classification of generalization operators. In Proceedings of the 23rd International Cartographic Conference, Moscow, Russia, 4–10 August 2007. [Google Scholar]
- Du, S.; Zhang, F.; Zhang, X. Semantic classification of urban buildings combining VHR image and GIS data: An improved random forest approach. ISPRS J. Photogramm. Remote Sens. 2015, 105, 107–119. [Google Scholar] [CrossRef]
- Steiniger, S.; Lange, T.; Burghardt, D.; Weibel, R. An approach for the classification of urban buildings structures based on discriminant analysis techniques. Trans. GIS 2008, 12, 31–59. [Google Scholar] [CrossRef]
- Xu, Y.; He, Z.; Xie, X.; Xie, Z.; Luo, J.; Xie, H. Building function classification in Nanjing, China, using deep learning. Trans. GIS 2022, 26, 2145–2165. [Google Scholar] [CrossRef]
- Bandam, A.; Busari, E.; Syranidou, C.; Linssen, J.; Stolten, D. Classification of Building Types in Germany: A Data-Driven ModelingApproach. Data 2022, 7, 45. [Google Scholar] [CrossRef]
- Wurm, M.; Schmitt, A.; Taubenböck, H. Building Types’ Classification Using Shape-Based Features and Linear Discriminant Functions. IEEE J. Sel. Top. Appl. Earth Obs. Remote Sens. 2016, 9, 1901–1912. [Google Scholar] [CrossRef]
- Fan, H.; Zhao, Z.; Li, W. Towards Measuring Shape Similarity of Polygons Based on Multiscale Features and Grid Context Descriptors. ISPRS Int. J. Geo-Inf. 2021, 10, 279. [Google Scholar] [CrossRef]
- Fu, J.; Fan, L.; Yu, Z.; Zhou, K. A Moment-Based Shape Similarity Measurement for Areal Entities in Geographical Vector Data. ISPRS Int. J. Geo-Inf. 2018, 7, 208. [Google Scholar] [CrossRef]
- Basaraner, M.; Cetinkaya, S. Performance of shape indices and classification schemes for characterising perceptual shape complexity of building footprints in GIS. Int. J. Geogr. Inf. Sci. 2017, 31, 1952–1977. [Google Scholar] [CrossRef]
- Li, W.; Goodchild, M.F.; Church, R. An efficient measure of compactness for two-dimensional shapes and its application in regionalization problems. Int. J. Geogr. Inf. Sci. 2013, 27, 1227–1250. [Google Scholar] [CrossRef]
- Yan, X.; Ai, T.; Yang, M.; Yin, H. A graph convolutional neural network for classification of building patterns using spatial vector data. ISPRS J. Photogramm. Remote Sens. 2019, 150, 259–273. [Google Scholar] [CrossRef]
- Zhang, Q.; Li, D.; Gong, J. Areal feature matching among urban geographic databases. J. Remote Sens. 2004, 8, 107–112. [Google Scholar]
- Ai, T.; Shuai, Y.; Li, J. A spatial query based on shape similarity cognition. Acta Geod. Cartogr. Sin. 2009, 38, 356–362. [Google Scholar]
- Ai, T.; Cheng, X.; Liu, P.; Yang, M. A shape analysis and template matching of building features by the Fourier transform method. Comput. Environ. Urban Syst. 2013, 41, 219–233. [Google Scholar] [CrossRef]
- Wei, Z.; Guo, Q.; Cheng, L.; Liu, Y.; Tong, Y. Shape similarity measurement based on DNA alignment for buildings with multiple orthogonal features. Acta Geod. Cartogr. Sin. 2021, 50, 1683–1693. [Google Scholar]
- Rainsford, D.; Mackaness, W. Template Matching in Support of Generalisation of Rural Buildings. In Advances in Spatial Data Handling; Richardson, D.E., van Oosterom, P., Eds.; Springer: Berlin/Heidelberg, Germany, 2002. [Google Scholar]
- Yan, X.; Ai, T.; Zhang, X. Template Matching and Simplification Method for Building Features Based on Shape Cognition. ISPRS Int. J. Geo-Inf. 2017, 6, 250. [Google Scholar] [CrossRef]
- Yan, X.; Ai, T.; Yang, M. A simplification of residential feature by the shape cognition and template matching method. Acta Geod. Cartogr. Sin. 2016, 45, 874–882. [Google Scholar]
- Liu, P.; Ai, T.; Hu, J.; Cheng, X. Building-polygon simplification based on shape matching of prototype template. Geomat. Inf. Sci. Wuhan Univ. 2010, 35, 1369–1372. [Google Scholar]
- Liu, P. Application of shape recognition in map generalization. Acta Geod. Cartogr. Sin. 2012, 41, 316. [Google Scholar]
- Ma, L.; Yan, H.; Wang, Z.; Liu, B.; Lv, W. Geometry shape measurement of building surface elements based on self-supervised machine learning. Sci. Surv. Mapp. 2017, 42, 171–177. [Google Scholar]
- Liu, P.; Huang, X.; Ma, H.; Yang, M. Fourier descriptor-based neural network method for high-precision shape recognition of building polygon. Acta Geod. Cartogr. Sin. 2022, 51, 1969–1976. [Google Scholar]
- Jiao, Y.; Liu, P.; Liu, A.; Liu, S. Map building shape classification method based on AlexNet. J. Geo-Inf. Sci. 2022, 24, 2333–2341. [Google Scholar]
- Yan, X.; Ai, T.; Yang, M.; Zheng, J. Shape cognition in map space using deep auto-encoder learning. Acta Geod. Cartogr. Sin. 2021, 50, 757–765. [Google Scholar]
- Yu, Y.; He, K.; Wu, F.; Xu, J. Graph convolution neural network method for shape classification of areal settlements. Acta Geod. Cartogr. Sin. 2022, 51, 2390–2402. [Google Scholar]
- Yan, X.; Yuan, T.; Yang, M.; Kong, B.; Liu, P. An adaptive building simplification approach based on shape analysis and representation. Acta Geod. Cartogr. Sin. 2022, 51, 269–278. [Google Scholar]
- Liu, C.; Hu, Y.; Li, Z.; Xu, J.; Han, Z.; Guo, J. TriangleConv: A Deep Point Convolutional Network for Recognizing Building Shapes in the Map Space. ISPRS Int. J. Geo-Inf. 2021, 10, 687. [Google Scholar] [CrossRef]
- Hu, Y.; Liu, C.; Li, Z.; Xu, J.; Han, Z.; Guo, J. Few-Shot Building Footprint Shape Classification with Relation Network. ISPRS Int. J. Geo-Inf. 2022, 11, 311. [Google Scholar] [CrossRef]
- Guo, Q.; Liu, N.; Wang, Z.; Sun, Y. Review of deep learning based object detection algorithms. J. Detect. Control 2023, 45, 10–20+26. [Google Scholar]
- Gupta, A.; Anpalagan, A.; Guan, L.; Khwaja, A.S. Deep learning for object detection and scene perception in self-driving cars: Survey, challenges, and open issues. Array 2021, 10, 100057. [Google Scholar] [CrossRef]
- Jha, S.; Seo, C.; Yang, E.; Joshi, G.P. Real time object detection and trackingsystem for video surveillance system. Multimed Tools Appl. 2021, 80, 3981–3996. [Google Scholar] [CrossRef]
- Li, K.; Wan, G.; Cheng, G.; Meng, L.; Han, J. Object detection in optical remote sensing images: A survey and a new benchmark. ISPRS J. Photogramm. Remote Sens. 2020, 159, 296–307. [Google Scholar] [CrossRef]
- Baumgartner, M.; Jaeger, P.F.; Isensee, F.; Maier-Hein, K.H. nnDetection: A Self-configuring Method for Medical Object Detection. In Proceedings of the MICCAI 2021, Strasbourg, France, 27 September–1 October 2021; pp. 530–539. [Google Scholar]
- Ma, Y.; Yin, J.; Huang, F.; Li, Q. Surface defect inspection of industrial products with object detection deep networks: A systematic review. Artif. Intell. Rev. 2024, 57, 333. [Google Scholar] [CrossRef]
- Jiang, P.; Ergu, D.; Liu, F.; Cai, Y.; Ma, B. A Review of Yolo Algorithm Developments. Procedia Comput. Sci. 2022, 199, 1066–1073. [Google Scholar] [CrossRef]
- Terven, J.; Córdova-Esparza, D.-M.; Romero-González, J.-A. A Comprehensive Review of YOLO Architectures in Computer Vision: From YOLOv1 to YOLOv8 and YOLO-NAS. Mach. Learn. Knowl. Extr. 2023, 5, 1680–1716. [Google Scholar] [CrossRef]
- Redmon, J.; Divvala, S.; Girshick, R.; Farhadi, A. You only look once: Unified, real-time object detection. In Proceedings of the IEEE Conference on Computer Vision and Pattern Recognition, Las Vegas, NV, USA, 27–30 June 2016; pp. 779–788. [Google Scholar]
- Redmon, J.; Farhadi, A. YOLO9000: Better, faster, stronger. In Proceedings of the IEEE Conference on Computer Vision and Pattern Recognition, Honolulu, HI, USA, 21–26 July 2017; pp. 7263–7271. [Google Scholar]
- Redmon, J.; Farhadi, A. Yolov3: An incremental improvement. arXiv 2018, arXiv:1804.02767. [Google Scholar]
- Bochkovskiy, A.; Wang, C.Y.; Liao, H.M. YOLOv4: Optimal Speed and Accuracy of Object Detection. arXiv 2020, arXiv:2004.10934. [Google Scholar]
- Wang, C.Y.; Bochkovskiy, A.; Liao, H.M. YOLOv7: Trainable bag-of-freebies sets new state-of-the-art for real-time object detectors. In Proceedings of the IEEE/CVF Conference on Computer Vision and Pattern Recognition (CVPR), Vancouver, BC, Canada, 18–22 June 2023; pp. 7464–7475. [Google Scholar]
- Wang, C.Y.; Yeh, I.H.; Liao, H.M. YOLOv9: Learning What You Want to Learn Using Programmable Gradient Information. arXiv 2024, arXiv:2402.13616. [Google Scholar]
- Mnih, V.; Heess, N.; Graves, A.; Kavukcuoglu, K. Recurrent models of visual attention. In 27th Annual Conference on Neural Information Processing Systems (NIPS 2014); Curran Associates, Inc.: Red Hook, NY, USA, 2014; pp. 2204–2212. [Google Scholar]
- Brauwers, G.; Frasincar, F. A General Survey on Attention Mechanisms in Deep Learning. IEEE Trans. Knowl. Data Eng. 2023, 35, 3279–3298. [Google Scholar] [CrossRef]
- Hu, J.; Shen, L.; Albanie, S.; Sun, G.; Wu, E. Squeeze-and-excitation networks. In Proceedings of the IEEE/CVF Conference on Computer Vision and Pattern Recognition, Salt Lake City, UT, USA, 18–23 June 2018; IEEE Press: New York, NY, USA, 2018; pp. 7132–7141. [Google Scholar]
- Woo, S.; Park, J.; Lee, J.Y.; Kweon, I.S. CBAM: Convolutional block attention module. In Proceedings of the Computer Vision—ECCV 2018, Munich, Germany, 8–14 September 2018; Springer International Publishing: Cham, Switzerland, 2018; pp. 3–19. [Google Scholar]
- Yang, L.; Zhang, R.; Li, L.; Xie, X. SimAM: A Simple, Parameter-Free Attention Module for Convolutional Neural Networks. In Proceedings of the 38th International Conference on Machine Learning, Virtual, 18–24 July 2021; Volume 139, pp. 11863–11874. [Google Scholar]
- Liu, Y.; Shao, Z.; Teng, Y.; Hoffmann, N. NAM: Normalization-Based Attention Module. NeurIPS Workshop ImageNet_PPF. 2021. Available online: https://arxiv.org/abs/2111.12419 (accessed on 24 November 2021).
- Yan, X.; Ai, T.; Yang, M.; Tong, X. Graph convolutional autoencoder model for the shape coding and cognition of buildings in maps. Int. J. Geogr. Inf. Sci. 2021, 35, 490–512. [Google Scholar] [CrossRef]


| Shape Type | Principle 1 Standard Shape | Principle 2 Complex Shape | Principle 3 Shape Deformation | Principle 4 with Prin.2 and Prin.3 |
|---|---|---|---|---|
| E-like |  |  |  |  |
| F-like |  |  |  |  |
| H-like |  |  |  |  |
| L-like |  |  |  |  |
| T-like |  |  |  |  |
| Y-like |  |  |  |  |
| Z-like |  |  |  |  |
| Cross-like |  |  |  |  |
| Model | Weights | Size |
|---|---|---|
| yolov5s | yolov5s.pt | 14.1 MB |
| yolov5m | yolov5m.pt | 41.1 MB |
| yolov5l | yolov5l.pt | 90.1 MB |
| yolov5x | yolov5x.pt | 166.0 MB |
| yolov8s | yolov8s.pt | 21.5 MB |
| yolov8m | yolov8m.pt | 49.7 MB |
| yolov8l | yolov8l.pt | 83.7 MB |
| yolov8x | yolov8x.pt | 130 MB |
| yolov9c | yolov9c.pt | 98.3 MB |
| yolov9e | yolov9e.pt | 133 MB |
| Shape Type | YOLOv5x | YOLOv8x | YOLOv9e | YOLOv9e + SE | YOLOv9e + CBAM | YOLOv9e + NAM | YOLOv9e + SimAM |
|---|---|---|---|---|---|---|---|
| E-like |  | ||||||
| F-like |  | ||||||
| H-like |  | ||||||
| L-like |  | ||||||
| T-like |  | ||||||
| Y-like |  | ||||||
| Z-like |  | ||||||
| Cross-like |  | ||||||
| Shape Type | YOLOv5x | YOLOv8x | YOLOv9e | YOLOv9e + SE | YOLOv9e + CBAM | YOLOv9e + NAM | YOLOv9e + SimAM |
|---|---|---|---|---|---|---|---|
| E-like | 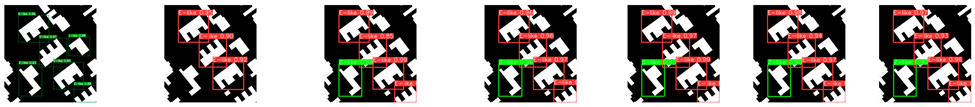 | ||||||
| F-like |  | ||||||
| H-like |  | ||||||
| L-like |  | ||||||
| T-like |  | ||||||
| Y-like | 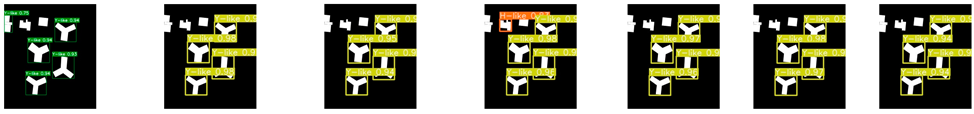 | ||||||
| Z-like |  | ||||||
| Cross-like |  | ||||||
| Scene | YOLOv5x | YOLOv8x | YOLOv9e | YOLOv9e + SE | YOLOv9e + CBAM | YOLOv9e + NAM | YOLOv9e + SimAM |
|---|---|---|---|---|---|---|---|
| 1 | 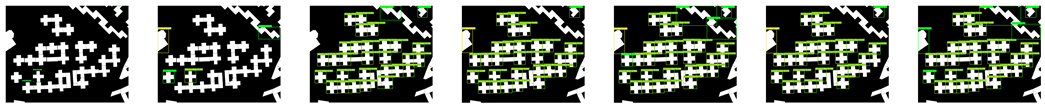 | ||||||
| 2 |  | ||||||
| 3 | 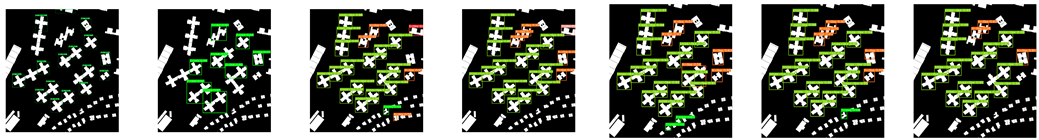 | ||||||
| 4 |  | ||||||
| 5 | 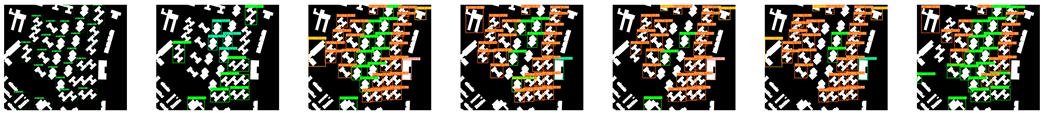 | ||||||
| Yolo Models | P (%) | R (%) | F1 Score | ||||||
|---|---|---|---|---|---|---|---|---|---|
| TestData1 | TestData2 | TestData3 | TestData1 | TestData2 | TestData3 | TestData1 | TestData2 | TestData3 | |
| YOLOv5s | 95.1 | 74.8 | 35.4 | 88.2 | 89.9 | 19.7 | 0.915 | 0.817 | 0.253 |
| YOLOv5m | 90.1 | 77.5 | 49.0 | 94.1 | 91.1 | 38.6 | 0.921 | 0.838 | 0.432 |
| YOLOv5l | 87.0 | 76.2 | 31.2 | 90.1 | 82.2 | 33.9 | 0.885 | 0.791 | 0.325 |
| YOLOv5x | 87.3 | 76.4 | 45.0 | 87.3 | 83.2 | 33.1 | 0.873 | 0.797 | 0.381 |
| YOLOv8s | 96.6 | 87.2 | 46.2 | 92.9 | 79.8 | 7.3 | 0.947 | 0.833 | 0.126 |
| YOLOv8m | 93.9 | 87.2 | 37.9 | 91.4 | 79.8 | 6.8 | 0.926 | 0.833 | 0.115 |
| YOLOv8l | 91.9 | 82.4 | 40.0 | 79.2 | 81.5 | 8.1 | 0.851 | 0.819 | 0.135 |
| YOLOv8x | 96.5 | 83.3 | 28.6 | 89.6 | 68.4 | 8.6 | 0.929 | 0.751 | 0.132 |
| YOLOv9c | 90.2 | 77.8 | 86.6 | 95.2 | 92.6 | 87.0 | 0.926 | 0.846 | 0.868 |
| YOLOv9e | 93.3 | 84.3 | 90.7 | 92.1 | 93.9 | 92.8 | 0.927 | 0.888 | 0.917 |
| YOLOv9e + SE | 96.1 | 83.6 | 90.9 | 95.0 | 95.9 | 89.0 | 0.955 | 0.893 | 0.899 |
| YOLOv9e + CBAM | 97.3 | 90.4 | 95.2 | 93.1 | 93.5 | 90.3 | 0.952 | 0.919 | 0.927 |
| YOLOv9e + NAM | 95.1 | 88.8 | 91.8 | 88.8 | 90.0 | 90.2 | 0.918 | 0.894 | 0.910 |
| YOLOv9e + SimAM | 98.6 | 88.8 | 83.9 | 91.9 | 93.8 | 82.9 | 0.951 | 0.894 | 0.834 |
| Shape Type | Level 21 | Level 20 | Level 19 | Level 18 |
|---|---|---|---|---|
| E-like |  Conf = 0.5/0.01 |  Conf = 0.5/0.01 |  Conf = 0.5/0.01 |  Conf = 0.5/0.01 |
| F-like |  Conf = 0.5/0.01 |  Conf = 0.5/0.01 |   Conf = 0.5 Conf = 0.01 |  Conf = 0.5/0.01 |
| F-like |  Conf = 0.5/0.01 |  Conf = 0.5/0.01 |   Conf = 0.5 Conf = 0.01 |  Conf = 0.5/0.01 |
| L-like | 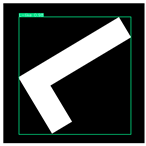 Conf = 0.5/0.01 |  Conf = 0.5/0.01 |  Conf = 0.5/0.01 |   Conf = 0.5 Conf = 0.01 |
| T-like |  Conf = 0.5/0.01 |  Conf = 0.5/0.01 |  Conf = 0.5/0.01 |   Conf = 0.5 Conf = 0.01 |
| Y-like |  Conf = 0.5/0.01 |  Conf = 0.5/0.01 |   Conf = 0.5 Conf = 0.01 |  Conf = 0.5/0.01 |
| Z-like |  Conf = 0.5/0.01 |  Conf = 0.5/0.01 |  Conf = 0.5/0.01 |  Conf = 0.5/0.01 |
| Cross-like | 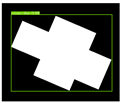 Conf = 0.5/0.01 |  Conf = 0.5/0.01 |  Conf = 0.5/0.01 |   Conf = 0.5 Conf = 0.01 |
| Yolo Models | P (%) Conf = 0.5/0.01 | R (%) Conf = 0.5/0.01 | ||||||
|---|---|---|---|---|---|---|---|---|
| L18 | L19 | L20 | L21 | L18 | L19 | L20 | L21 | |
| YOLOv5s | 0.0/0.0 | 11.8/15.6 | 65.1/66.0 | 78.7/80.0 | 0.0/0.0 | 5.7/21.7 | 80.0/91.2 | 92.5/100.0 |
| YOLOv5m | 0.0/0.0 | 18.2/25.7 | 69.0/68.8 | 82.0/82.0 | 0.0/0.0 | 12.5/37.5 | 78.4/94.3 | 100.0/100.0 |
| YOLOv5l | 0.0/0.0 | 40.0/34.3 | 78.0/75.6 | 85.7/86.0 | 0.0/0.0 | 28.6/44.4 | 78.0/87.2 | 97.7/100.0 |
| YOLOv5x | 0.0/0.0 | 29.4/24.1 | 76.3/66.7 | 87.0/85.7 | 0.0/0.0 | 13.2/25.0 | 70.7/85.7 | 90.9/97.7 |
| YOLOv8s | 0.0/0.0 | 50.0/18.4 | 68.6/63.8 | 88.1/81.6 | 0.0/0.0 | 6.4/36.8 | 61.5/90.9 | 82.2/97.6 |
| YOLOv8m | 0.0/0.0 | 12.5/17.1 | 82.1/68.8 | 91.5/92 | 0.0/0.0 | 2.3/28.6 | 74.4/94.3 | 93.5/100.0 |
| YOLOv8l | 0.0/14.3 | 26.7/18.9 | 78.9/72.3 | 95.5/93.8 | 0.0/2.3 | 10.3/35.0 | 71.4/91.9 | 87.5/95.7 |
| YOLOv8x | 0.0/0.0 | 33.3/23.5 | 80.0/70.8 | 89.1/88.0 | 0.0/0.0 | 9.5/33.3 | 65.1/94.4 | 91.1/100.0 |
| YOLOv9c | 100.0/100.0 | 90.3/90.3 | 93.2/93.2 | 98.0/96.0 | 2.0/2.0 | 59.6/59.6 | 87.2/87.2 | 100.0/100.0 |
| YOLOv9e | 100.0/66.7 | 96.4/81.4 | 93.2/96.0 | 97.9/98.0 | 8.0/43.9 | 55.1/83.3 | 87.2/100.0 | 93.9/100.0 |
| YOLOv9e + SE | 100.0/74.4 | 97.2/93.75 | 97.9/94.0 | 89.8/88.0 | 24.0/78.0 | 72.0/96.0 | 94.0/100.0 | 98.0/100.0 |
| YOLOv9e + CBAM | 100.0/81.1 | 100.0/97.8 | 100.0/98.0 | 100.0/100 | 18.0/74.0 | 72.0/92.0 | 94.0/98.0 | 94.0/98.0 |
| YOLOv9e + NAM | 94.4/76.9 | 94.3/85.7 | 91.8/90.0 | 95.7/89.8 | 36.0/78.0 | 70.0/98.0 | 98.0/100.0 | 94.0/98.0 |
| YOLOv9e + SimAM | 80.0/60.5 | 87.0/83.7 | 95.9/92.0 | 95.8/88.0 | 30.0/86.0 | 92.0/98.0 | 98.0/100.0 | 96.0/100.0 |
| YOLO Models | E-Like (%) | F-Like (%) | H-Like (%) | L-Like (%) | T-Like (%) | Y-Like (%) | Z-Like (%) | Cross-Like (%) | ||||||||
|---|---|---|---|---|---|---|---|---|---|---|---|---|---|---|---|---|
| P | R | P | R | P | R | P | R | P | R | P | R | P | R | P | R | |
| YOLOv5s | 78.9 | 93.8 | 100 | 90 | 100 | 95 | 100 | 60 | 100 | 75 | 100 | 100 | 89.5 | 94.4 | 95 | 100 |
| YOLOv5m | 94.7 | 94.7 | 52.9 | 75 | 100 | 100 | 100 | 65 | 87.5 | 77.8 | 100 | 100 | 94.1 | 84.2 | 90 | 100 |
| YOLOv5l | 95 | 100 | 60 | 64.3 | 100 | 75 | 100 | 95 | 94.1 | 84.2 | 100 | 100 | 90 | 100 | 100 | 100 |
| YOLOv5x | 95 | 100 | 47.1 | 72.7 | 100 | 95 | 81.8 | 50 | 100 | 80 | 100 | 100 | 95 | 100 | 65 | 100 |
| YOLOv8s | 100 | 100 | 84.2 | 94.1 | 100 | 85 | 100 | 85 | 100 | 80 | 100 | 100 | 100 | 100 | 85 | 100 |
| YOLOv8m | 100 | 95 | 66.7 | 66.7 | 100 | 95 | 100 | 80 | 100 | 90 | 100 | 100 | 100 | 100 | 80 | 100 |
| YOLOv8l | 94.7 | 94.7 | 50 | 81.8 | 100 | 85 | 100 | 20 | 100 | 80 | 100 | 100 | 100 | 80 | 94.7 | 94.7 |
| YOLOv8x | 95 | 100 | 84.2 | 94.1 | 100 | 85 | 100 | 55 | 100 | 95 | 100 | 100 | 100 | 95 | 89.5 | 94.4 |
| YOLOv9c | 85 | 100 | 52.9 | 75 | 100 | 100 | 100 | 80 | 90 | 100 | 100 | 100 | 100 | 100 | 90 | 100 |
| YOLOv9e | 95 | 100 | 85 | 100 | 100 | 90 | 100 | 65 | 88.9 | 80 | 100 | 100 | 100 | 95 | 90 | 100 |
| YOLOv9e + SE | 84.2 | 95 | 95 | 100 | 100 | 100 | 100 | 85 | 100 | 95 | 100 | 100 | 100 | 95 | 94.4 | 90 |
| YOLOv9e + CBAM | 100 | 100 | 73.3 | 75 | 100 | 100 | 100 | 80 | 100 | 95 | 100 | 100 | 100 | 95 | 100 | 100 |
| YOLOv9e + NAM | 100 | 100 | 62.5 | 80 | 100 | 100 | 100 | 60 | 94.4 | 90 | 95 | 100 | 100 | 80 | 100 | 100 |
| YOLOv9e + SimAM | 94.4 | 90 | 100 | 80 | 100 | 95 | 100 | 85 | 85 | 100 | 100 | 100 | 100 | 85 | 100 | 100 |
| Average | 93.33 | 97.82 | 68.3 | 81.37 | 100 | 90.5 | 98.18 | 65.5 | 96.05 | 84.2 | 100 | 100 | 96.86 | 94.86 | 87.92 | 98.91 |
| Models | P (%) | R (%) |
|---|---|---|
| GNN | 62.7 | 100 |
| YOLOv9e + SE | 76.1 | 100 |
| YOLOv9e + CBAM | 78.2 | 100 |
| YOLOv9e + NAM | 77.5 | 97.9 |
| YOLOv9e + SimAM | 69.7 | 100 |
Disclaimer/Publisher’s Note: The statements, opinions and data contained in all publications are solely those of the individual author(s) and contributor(s) and not of MDPI and/or the editor(s). MDPI and/or the editor(s) disclaim responsibility for any injury to people or property resulting from any ideas, methods, instructions or products referred to in the content. |
© 2024 by the authors. Published by MDPI on behalf of the International Society for Photogrammetry and Remote Sensing. Licensee MDPI, Basel, Switzerland. This article is an open access article distributed under the terms and conditions of the Creative Commons Attribution (CC BY) license (https://creativecommons.org/licenses/by/4.0/).
Share and Cite
Wang, X.; Qian, H.; Xie, L.; Wang, X.; Li, B. Recognition and Classification of Typical Building Shapes Based on YOLO Object Detection Models. ISPRS Int. J. Geo-Inf. 2024, 13, 433. https://doi.org/10.3390/ijgi13120433
Wang X, Qian H, Xie L, Wang X, Li B. Recognition and Classification of Typical Building Shapes Based on YOLO Object Detection Models. ISPRS International Journal of Geo-Information. 2024; 13(12):433. https://doi.org/10.3390/ijgi13120433
Chicago/Turabian StyleWang, Xiao, Haizhong Qian, Limin Xie, Xu Wang, and Bohao Li. 2024. "Recognition and Classification of Typical Building Shapes Based on YOLO Object Detection Models" ISPRS International Journal of Geo-Information 13, no. 12: 433. https://doi.org/10.3390/ijgi13120433
APA StyleWang, X., Qian, H., Xie, L., Wang, X., & Li, B. (2024). Recognition and Classification of Typical Building Shapes Based on YOLO Object Detection Models. ISPRS International Journal of Geo-Information, 13(12), 433. https://doi.org/10.3390/ijgi13120433